Analysis of Land-Use Change between 2012–2018 in Europe in Terms of Sustainable Development


Department of Spatial and Environmental Economics, University of Economics in Katowice, 40-287 Katowice, Poland
*
Author to whom correspondence should be addressed.
Land 2020, 9(2), 46; https://0-doi-org.brum.beds.ac.uk/10.3390/land9020046
Submission received: 18 December 2019
/
Revised: 4 February 2020
/
Accepted: 6 February 2020
/
Published: 8 February 2020
(This article belongs to the Special Issue Monitoring Land Cover Change: Towards Sustainability)
Abstract
:This article presents methodology of land use change assessment in the context of sustainable development and the results of its application based on the transformations that occurred in individual areas of Europe in the years 2012–2018. This method is based on data from the CORINE (CO-oRdination of INformation on Environment) Land Cover program) and local government units presenting the degree of urbanization (DEGURBA). The transformations taking place in space were evaluated and reduced to economic, social, and environmental dimensions. We then analyzed the results in terms of space (covering almost all of Europe) and in terms of division (large cities, small towns, suburbs, and rural areas). Results indicate that development of the economic dimension most often takes place at the expense of natural resources. It was also determined that the higher the population density, the greater the sustainable development differentiation level in the analyzed dimensions, of which the social dimension was characterized by the lowest differentiation and the economic dimension was highest. The development of rural areas was found to be less sustainable than large urban centers. Interpretation of the results also leads to the conclusion that areas of Europe are very diverse in terms of sustainable development. However, the method itself, despite the imperfections observed by the authors, may be used in further or similar studies.
1. Introduction
The concept of sustainable development is one of the doctrines of economics and assumes that, “it meets the needs of the present without compromising the ability of future generations to meet their own needs” [1]. This term was originally used to describe forest management (i.e., rational logging) so that forests could always be restored. Today, the term sustainable development is well known, much more widely understood, and constitutes an important element of international law (e.g., Action Programme—Agenda 21, Leipzig Charter on Sustainable European Cities). It refers to the balance between economic growth (economic aspect), care for nature (environmental aspect), and quality of life (social aspect).
Initially a narrow term related only to spatial development (issues of logging and forest restoration), sustainable development now covers a much wider spectrum of activities (e.g., reduction of social stratification, reduction of pollutant emissions, and shaping of spatial order). The concept of sustainable development has led to the creation of a number of development models (mainly cities), including ecocity [2,3,4], green city [5,6,7], compact city [8,9,10], redesigning a city [11,12], and smart city [13,14,15] or MILU (multi-functional and intensive land use) [16,17]. Although these models apply only to cities, it should be remembered that according to the European Commission’s estimates, approximately 85% of Europeans live in urban areas [18].
In Europe, as well as in other parts of the world, climate change and accelerating urbanization contribute to the introduction of rational management of space, whose finite character is more and more visible. That is why emphasis was placed on the aspect of organizing spatial structures. This study presents the methodology of assessment of land-use changes in terms of sustainable development using the example of most European countries. Analysis of the cited model development concepts allows the authors to better understand the effects of specific spatial transformations and, consequently, to assess them. A sustainable city has an orderly functional and spatial structure and aims to make the most efficient use of its resources, including [19,20]:
- Housing compaction (urban sprawl prevention) in mixed land use;
- Revitalization of contaminated and dysfunctional areas;
- Development of urban green areas and upgrading the quality of natural areas;
- Minimizing negative impacts on the environment by respecting the local community and taking economics into account.
Given the importance of functional and spatial issues in the definition of sustainable development, it is considered appropriate to develop assessment methods based precisely on a spatial factor. Land use changes tangibly indicate development directions and space management. By interpreting transformations in the time horizon, information about trends of change can be obtained, which is a valuable guideline for further policy development. The aim of this article is to present a new view on land use change analysis. Tracking changes taking place in space is a collection of certain guidelines referring to the directions of development of regions in the long term. This paper classifies all specific transformations into frameworks related to sustainable development.
2. Materials and Methods
2.1. Land Use Reference Data
Data from CORINE Land Cover program was used for the analysis of land use changes. The program, established in 1985 by the European Community, aimed at collecting harmonized information on the condition of the geographical environment and at coordinating work at an international level, thereby ensuring the consistency of the information and the compatibility of data collected. Data are now available for all of Europe for the years 1990, 2000, 2006, 2012, and 2018. For some countries (including Poland), CORINE land cover data is the only database on land use that covers the whole country, is regularly updated, and is prepared in line with uniform principles [21].
To present a method of assessing transformations in terms of sustainable development, we used the land cover/use map in 2012 and 2018. These were based on satellite images of a certain resolution. Therefore, these data, although generalized to objects with a minimum area of 25 ha (minimum width of 100 m), are a reliable source of information, used in academia for many analyses [22,23,24].
The CORINE land cover classes (CLC) are hierarchically organized in three levels. The first one covers five main types of land use and land cover of the globe: Artificial surfaces (1), agricultural areas (2), forest and semi natural areas (3), wetlands (4), and water bodies (5). The second level is fifteen divisions (for example: 11 urban fabric or 21 Arable land). The third level covers 44 classes (e.g., 111 continuous urban fabric, 112 discontinuous urban fabric or 242 complex cultivation patterns). It should be noted that the methodological scope of individual Level 3 classes is strictly defined [25], and so, for example, the class 242 includes both small, adjacent plots of land used to cultivate various crops (both annual and perennial), as well as small meadows and pastures. It also covers the areas of scattered housing development, including house clusters and entire villages) with homestead adjacent lands and home orchards and gardens. [26].
CLC data are used in many analyses, including urban growth monitoring and urban sprawl comparisons between different countries, regions, and cities [27,28], land use forecasts [29] or modelling of road travel speeds [30]. The land recycling report is also an interesting example [31]. The analysis classifies each land use change, which is then combined into the following indicators: Densification; green land recycling; and grey land recycling. This publication report became an inspiration for the research described above.
2.2. Method—Assessment Matrices, DEGURBA Classification and Methodology for Obtaining Results
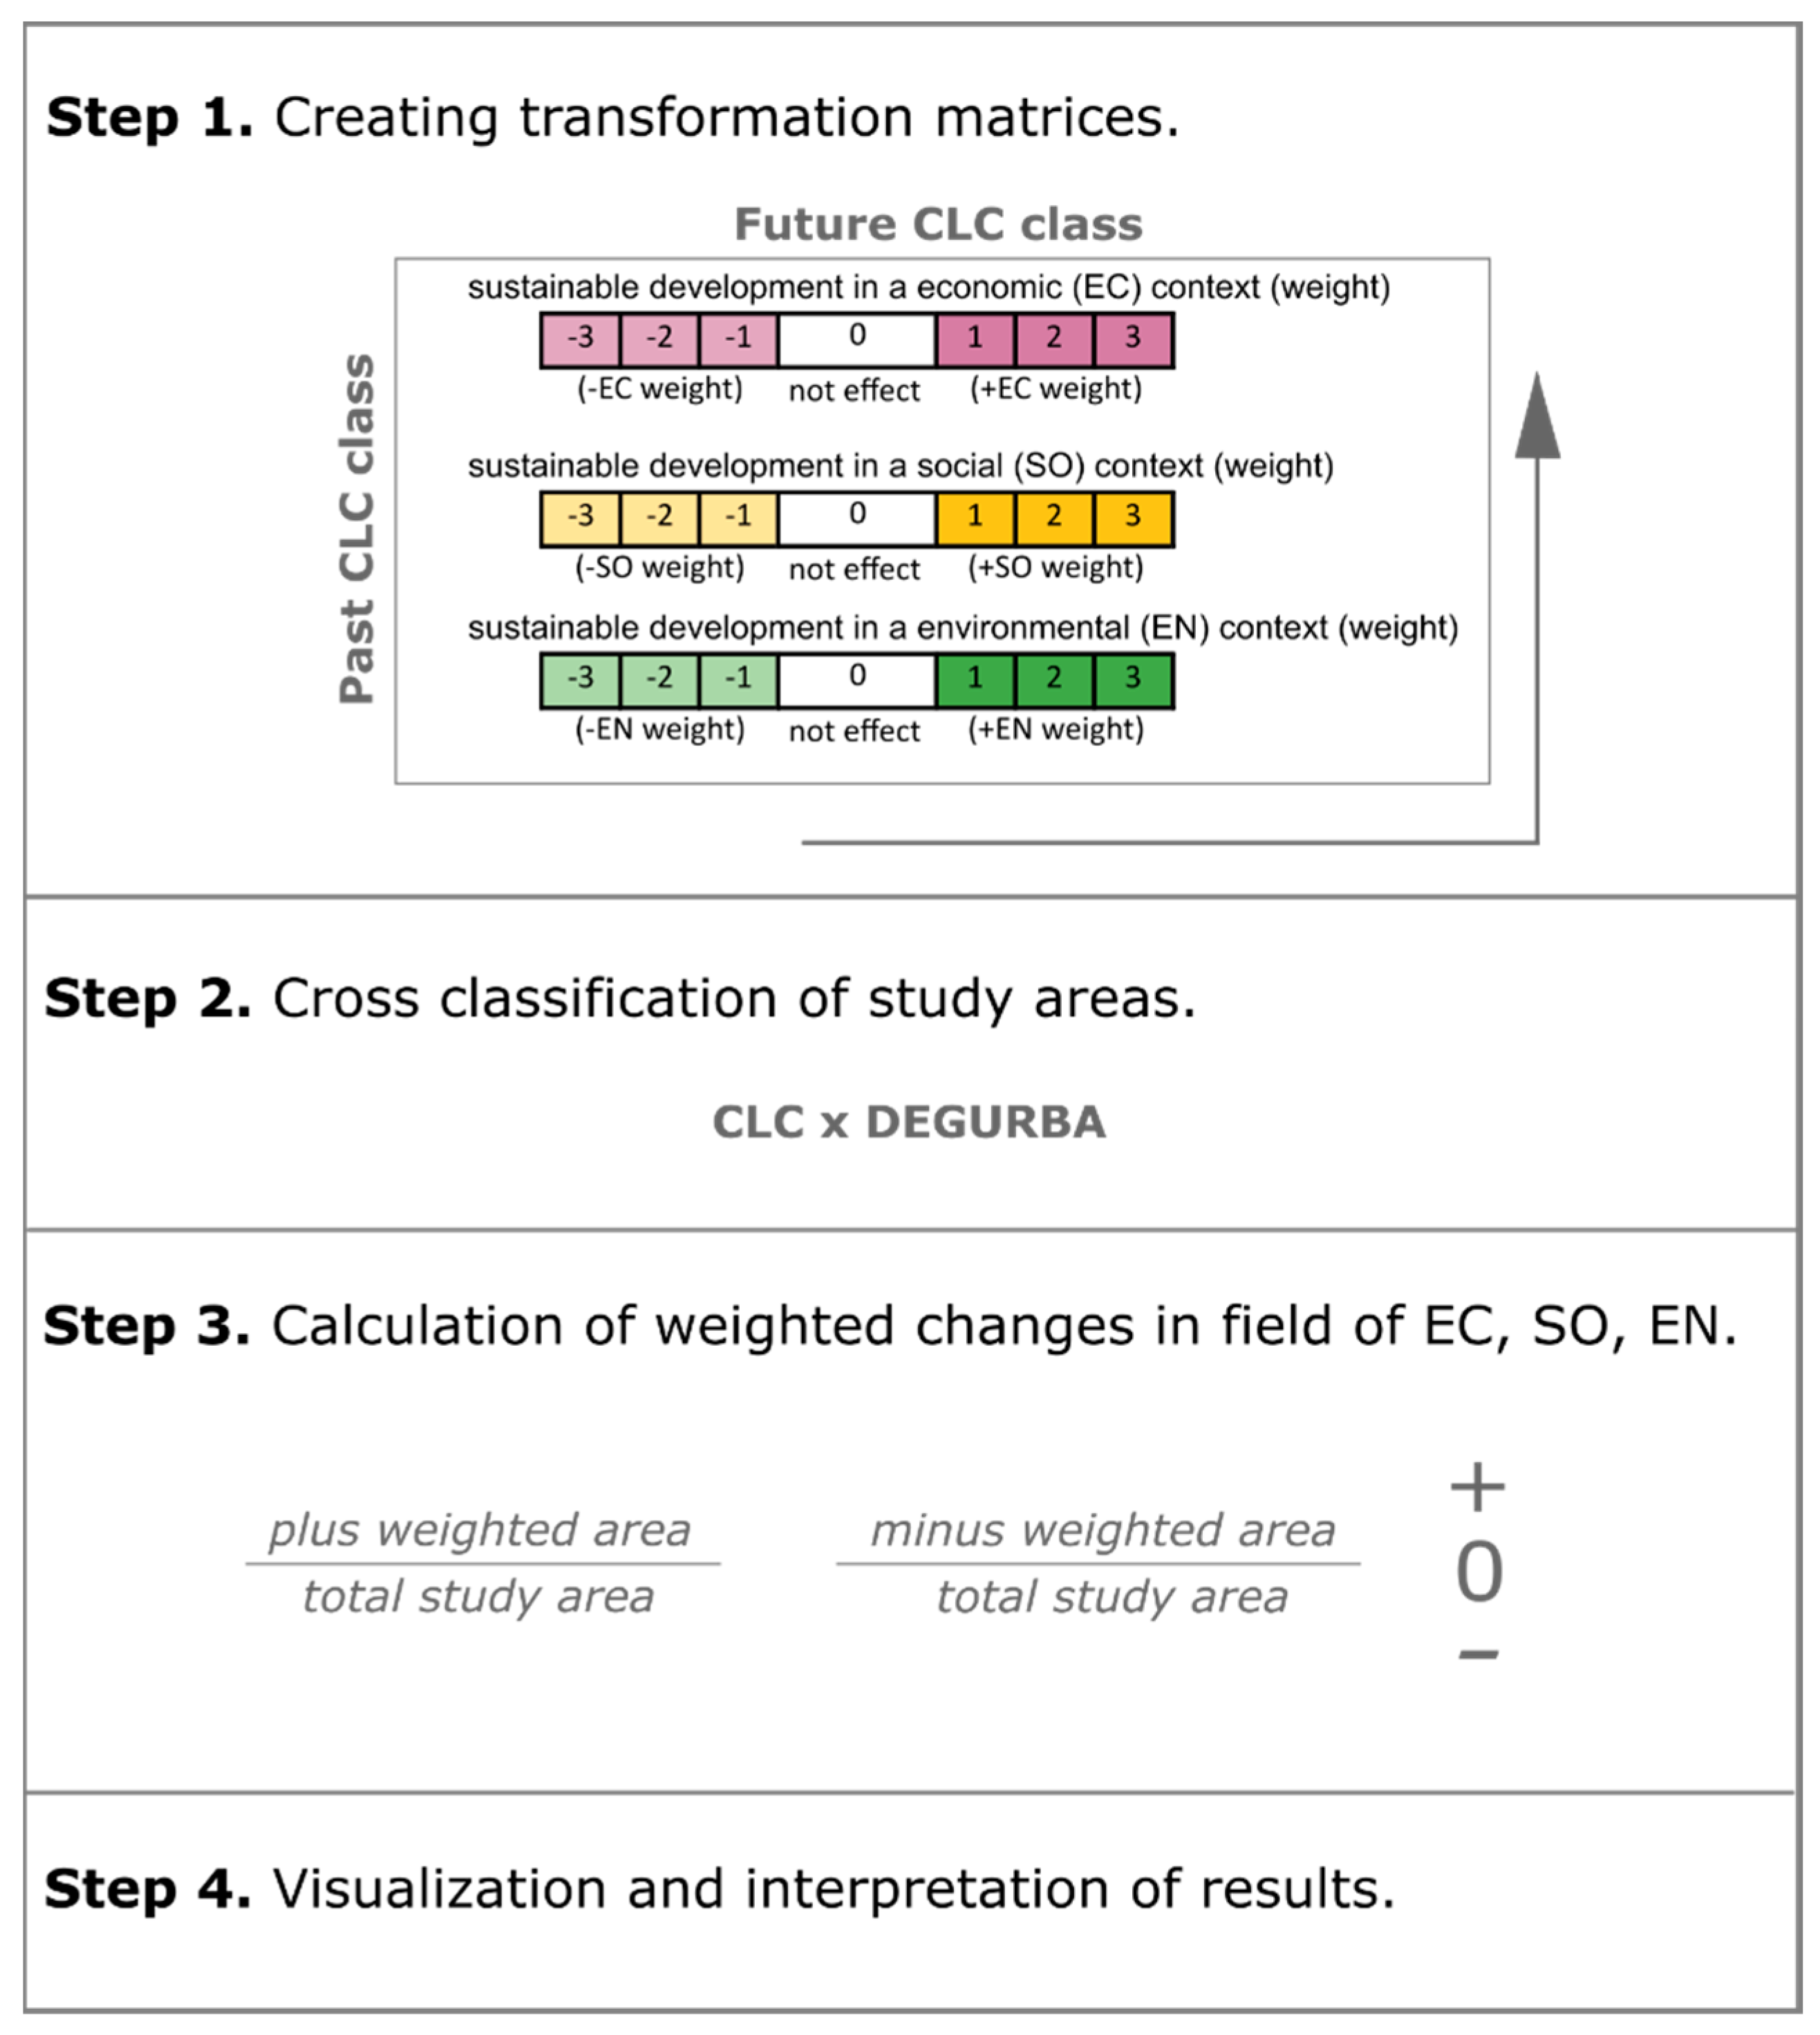
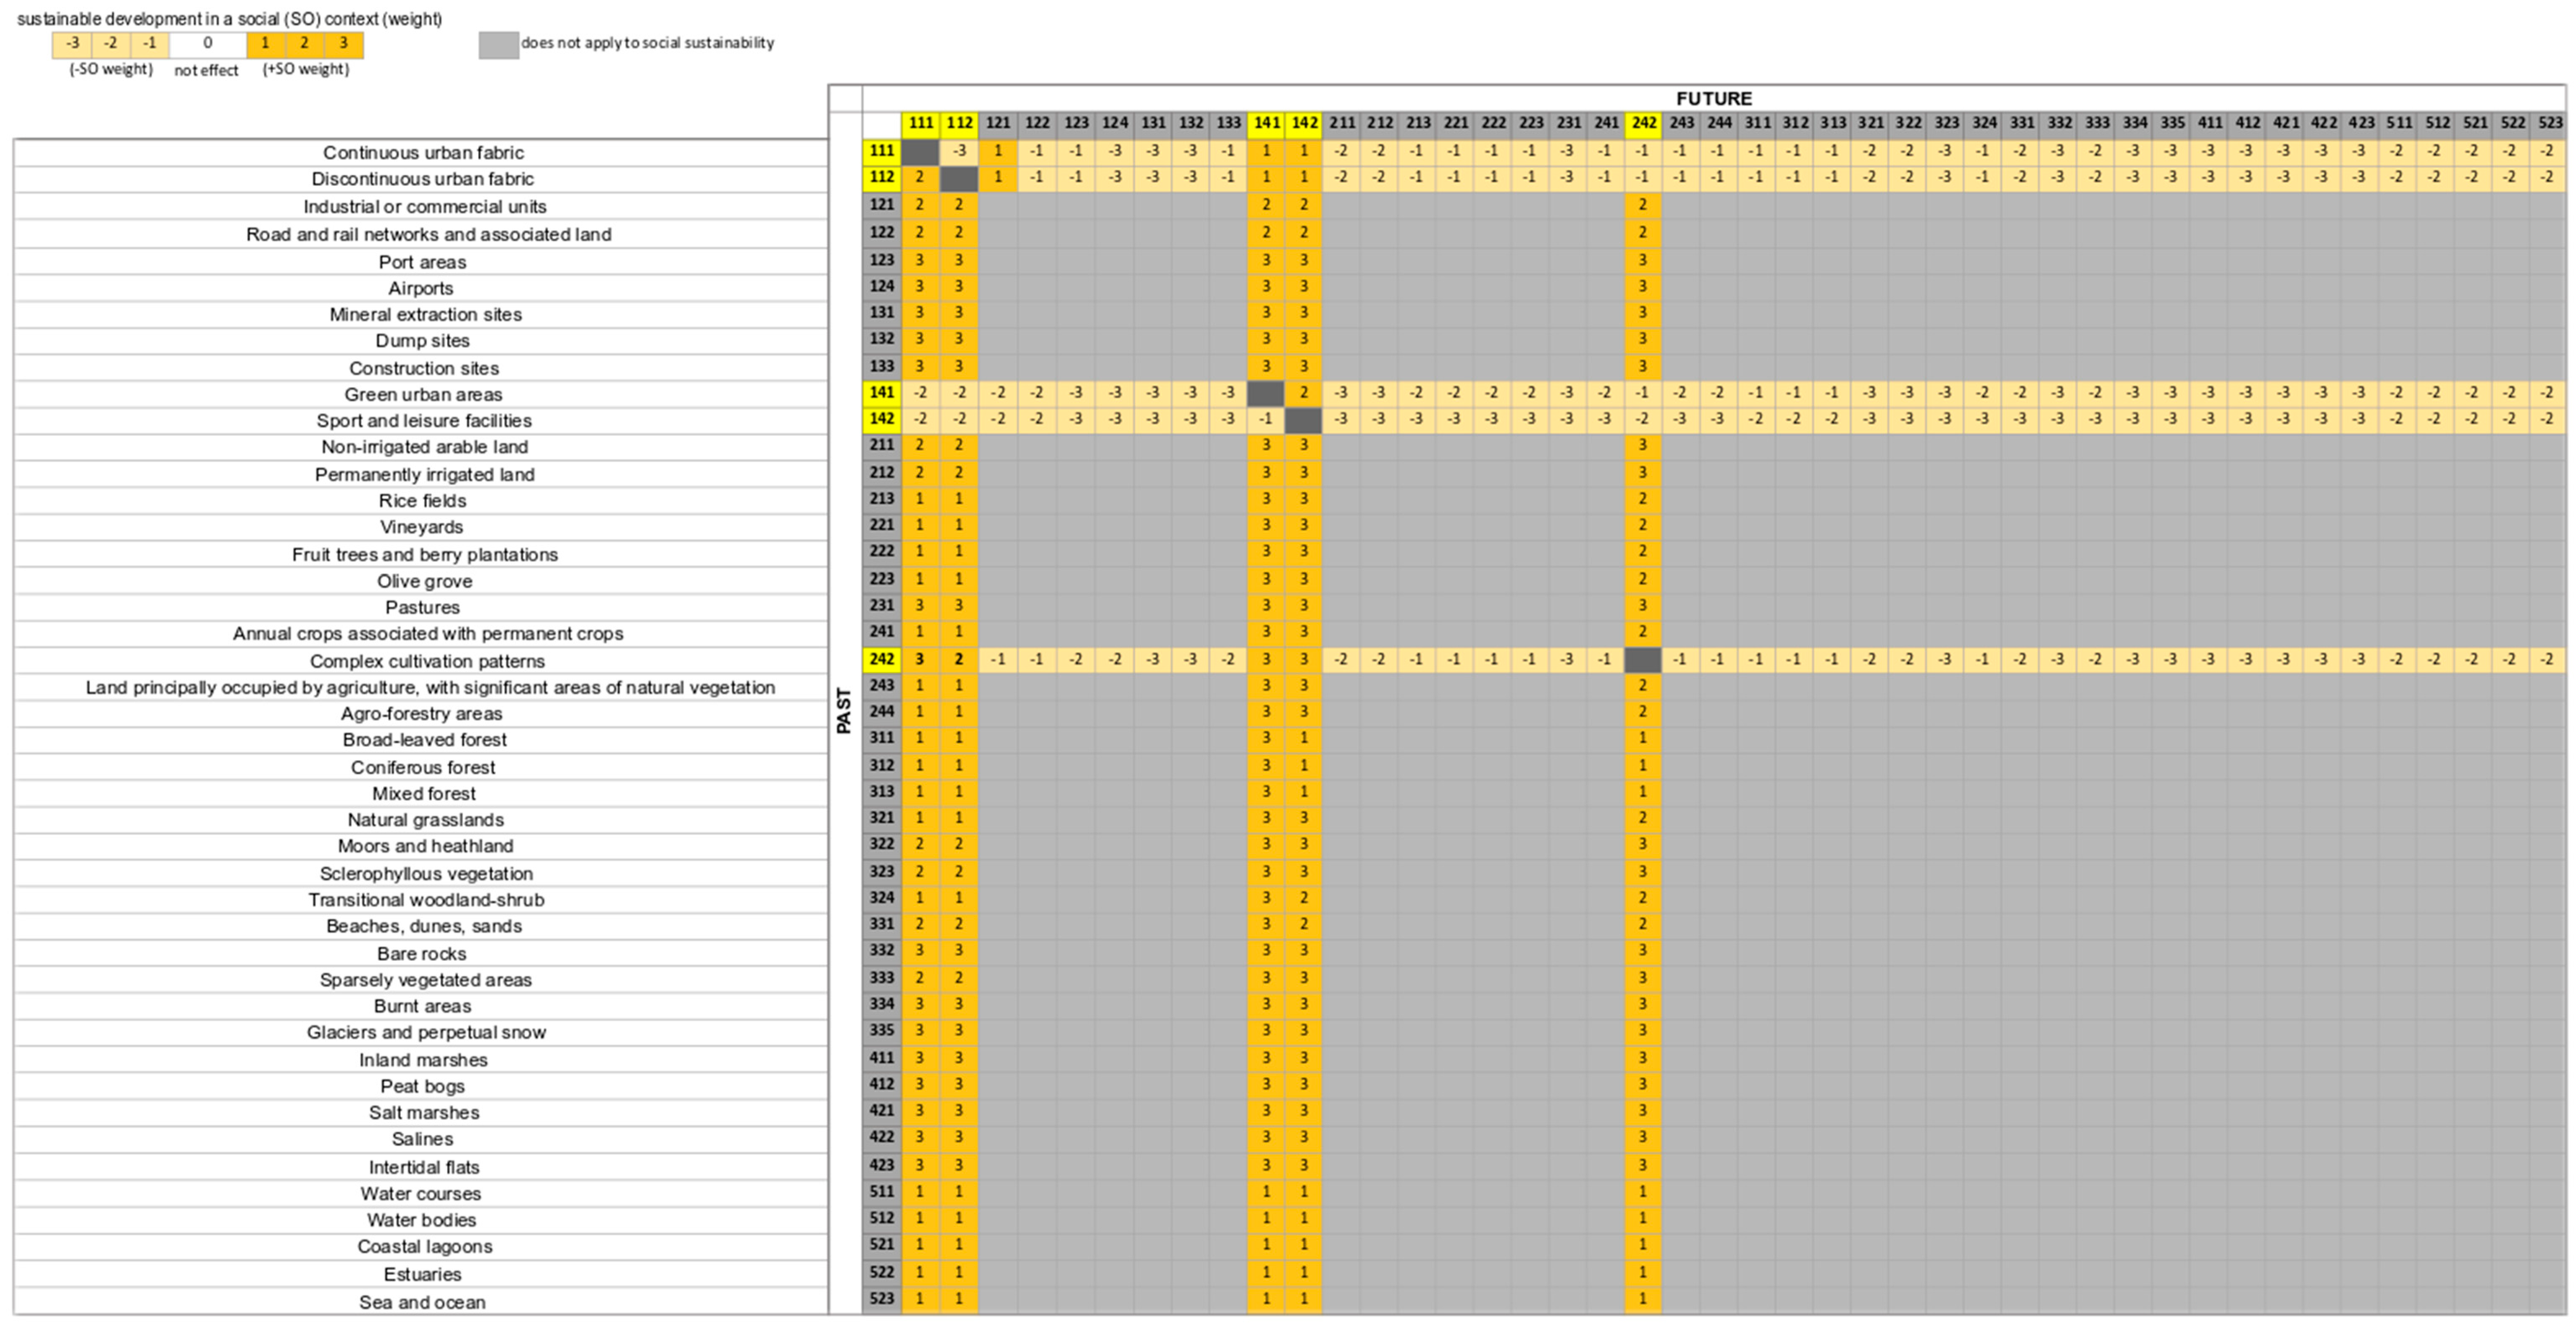
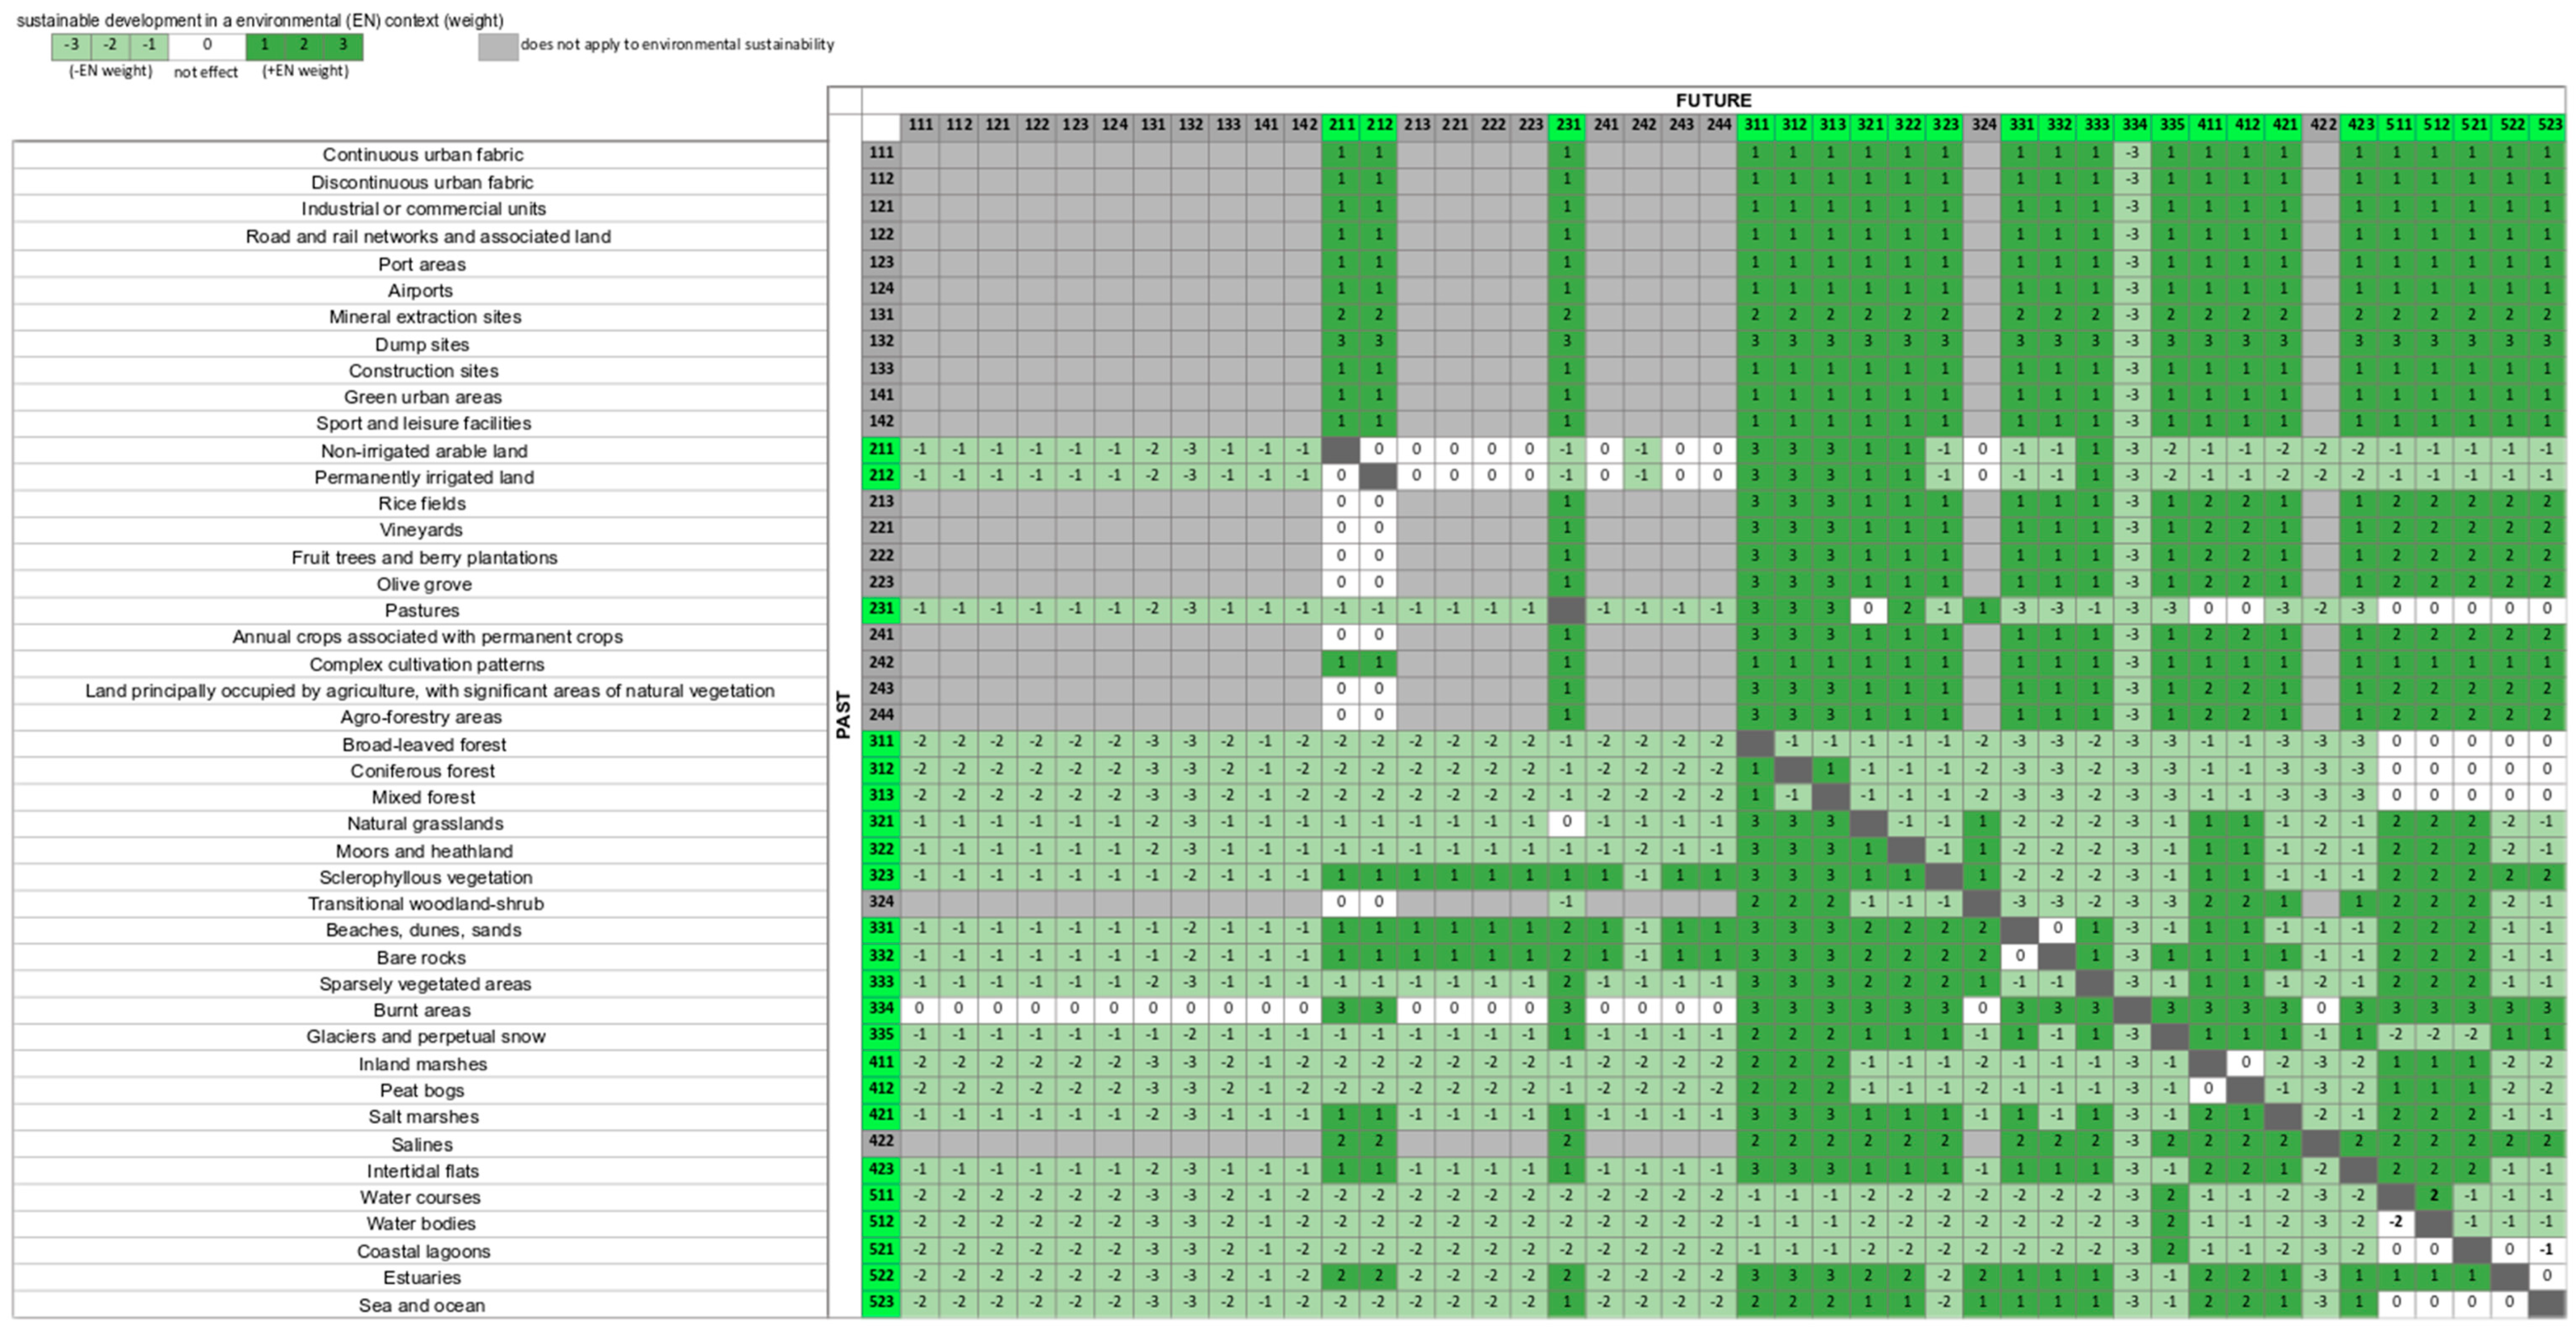
To develop the assessment matrices of land use transformation, each of the possible transformations (44 classes) in three dimensions, namely economic (Ec), social (So), and environmental (En) were analyzed. When evaluating a given class change, values from −3 (very negative impact on sustainable development) to +3 (very positive impact) were assigned. The value 0 was introduced for the transformations in which no impact on sustainable development in a given aspect was found. The assessment of the transformations is presented on the matrices at the end of the article (Appendix A. Figure A1, Figure A2 and Figure A3).
When analyzing the economic aspect (Ec) both the classes related to industry and transport (anthropogenic areas, classes 121–133), as well as agriculture, forestry, and salt-works were taken into account. Transformation into more specialized areas was rated higher, while losses in expensive classes (e.g. ports, airports) were rated much lower. The social aspect (So) was interpreted as transformations related to housing (classes 111 and 112), urban greenery, recreation areas (classes 141 and 142), and complex farming and land parcel systems (class 242). The following factors were taken into account: Striving for compact urban structures (concentration) and/or increasing recreational areas were taken into account in a positive way. On the other hand, changes related to the loss of heavily invested areas (e.g., scattered housing) were assessed negatively. The environmental aspect (En) includes transformations of classes dominated by nature, on which man (compared to others) has a low impact (e.g. meadows, forests, semi-natural ecosystems, wetlands and water bodies). Transformations into areas of higher biodiversity were assessed positively, while the loss of valuable natural areas into desolated and homogeneous areas was assessed negatively.
The matrices developed this way were then used to assess the changes that occurred in Europe in the years 2012–2018 (373,000 study areas). Additionally, the analysis area was trimmed (intersection option in QGIS version 2.14, which gave 412,600 study areas) to the EU classification presenting the degree of urbanization (DEGURBA), (i.e., the division of areas into basic units of national administrative systems according to population density and their function, where class 1 is key cities, class 2 is small towns and suburbs, and class 3 is rural areas) [32,33]. The change test areas trimmed this way (ETRS89/ETRS-LAEA, EPSG: 3035 in the reference system) were subjected to the process of determining the surface area, and the result of this operation was used to determine the percentage of the surface area of the basic unit DEGURBA with changed CLC. This percentage was then multiplied by change weights standardized to the [–1.1] range. As a result of these transformations, weighted percentages of surface area changes were obtained for 2839 major cities, 8022 small towns and suburbs, and 39,076 rural areas in three economic (Ec), social (So), and environmental (En) dimensions.
The obtained results are described and presented in the form of a figure for 50,000 basic units presenting beneficial changes in positive (+Ec, +So, +En) and in negative (−Ec, −So, −En) together with all intermediate options. This article also presents a commentary to the network graphs showing the average results in 35 European countries (NUTS - Nomenclature of Territorial Units for Statistics level 0), also divided into three basic DEGURBA classes. The country abbreviations are in line with NUTS (a slightly different set of results visualizations are presented in Appendix B. Figure A4, Figure A5, Figure A6 and Figure A7).
The analysis consisted of four stages: (1) creating transformation matrices, (2) cross classification of areas, (3) calculation of weighted changes in the field of economy, society and the environment, and (4) visualization and interpretation of results. This is schematically shown in Figure 1.
3. Results
3.1. Land Use Transformation Change Assessment on a Local Scale
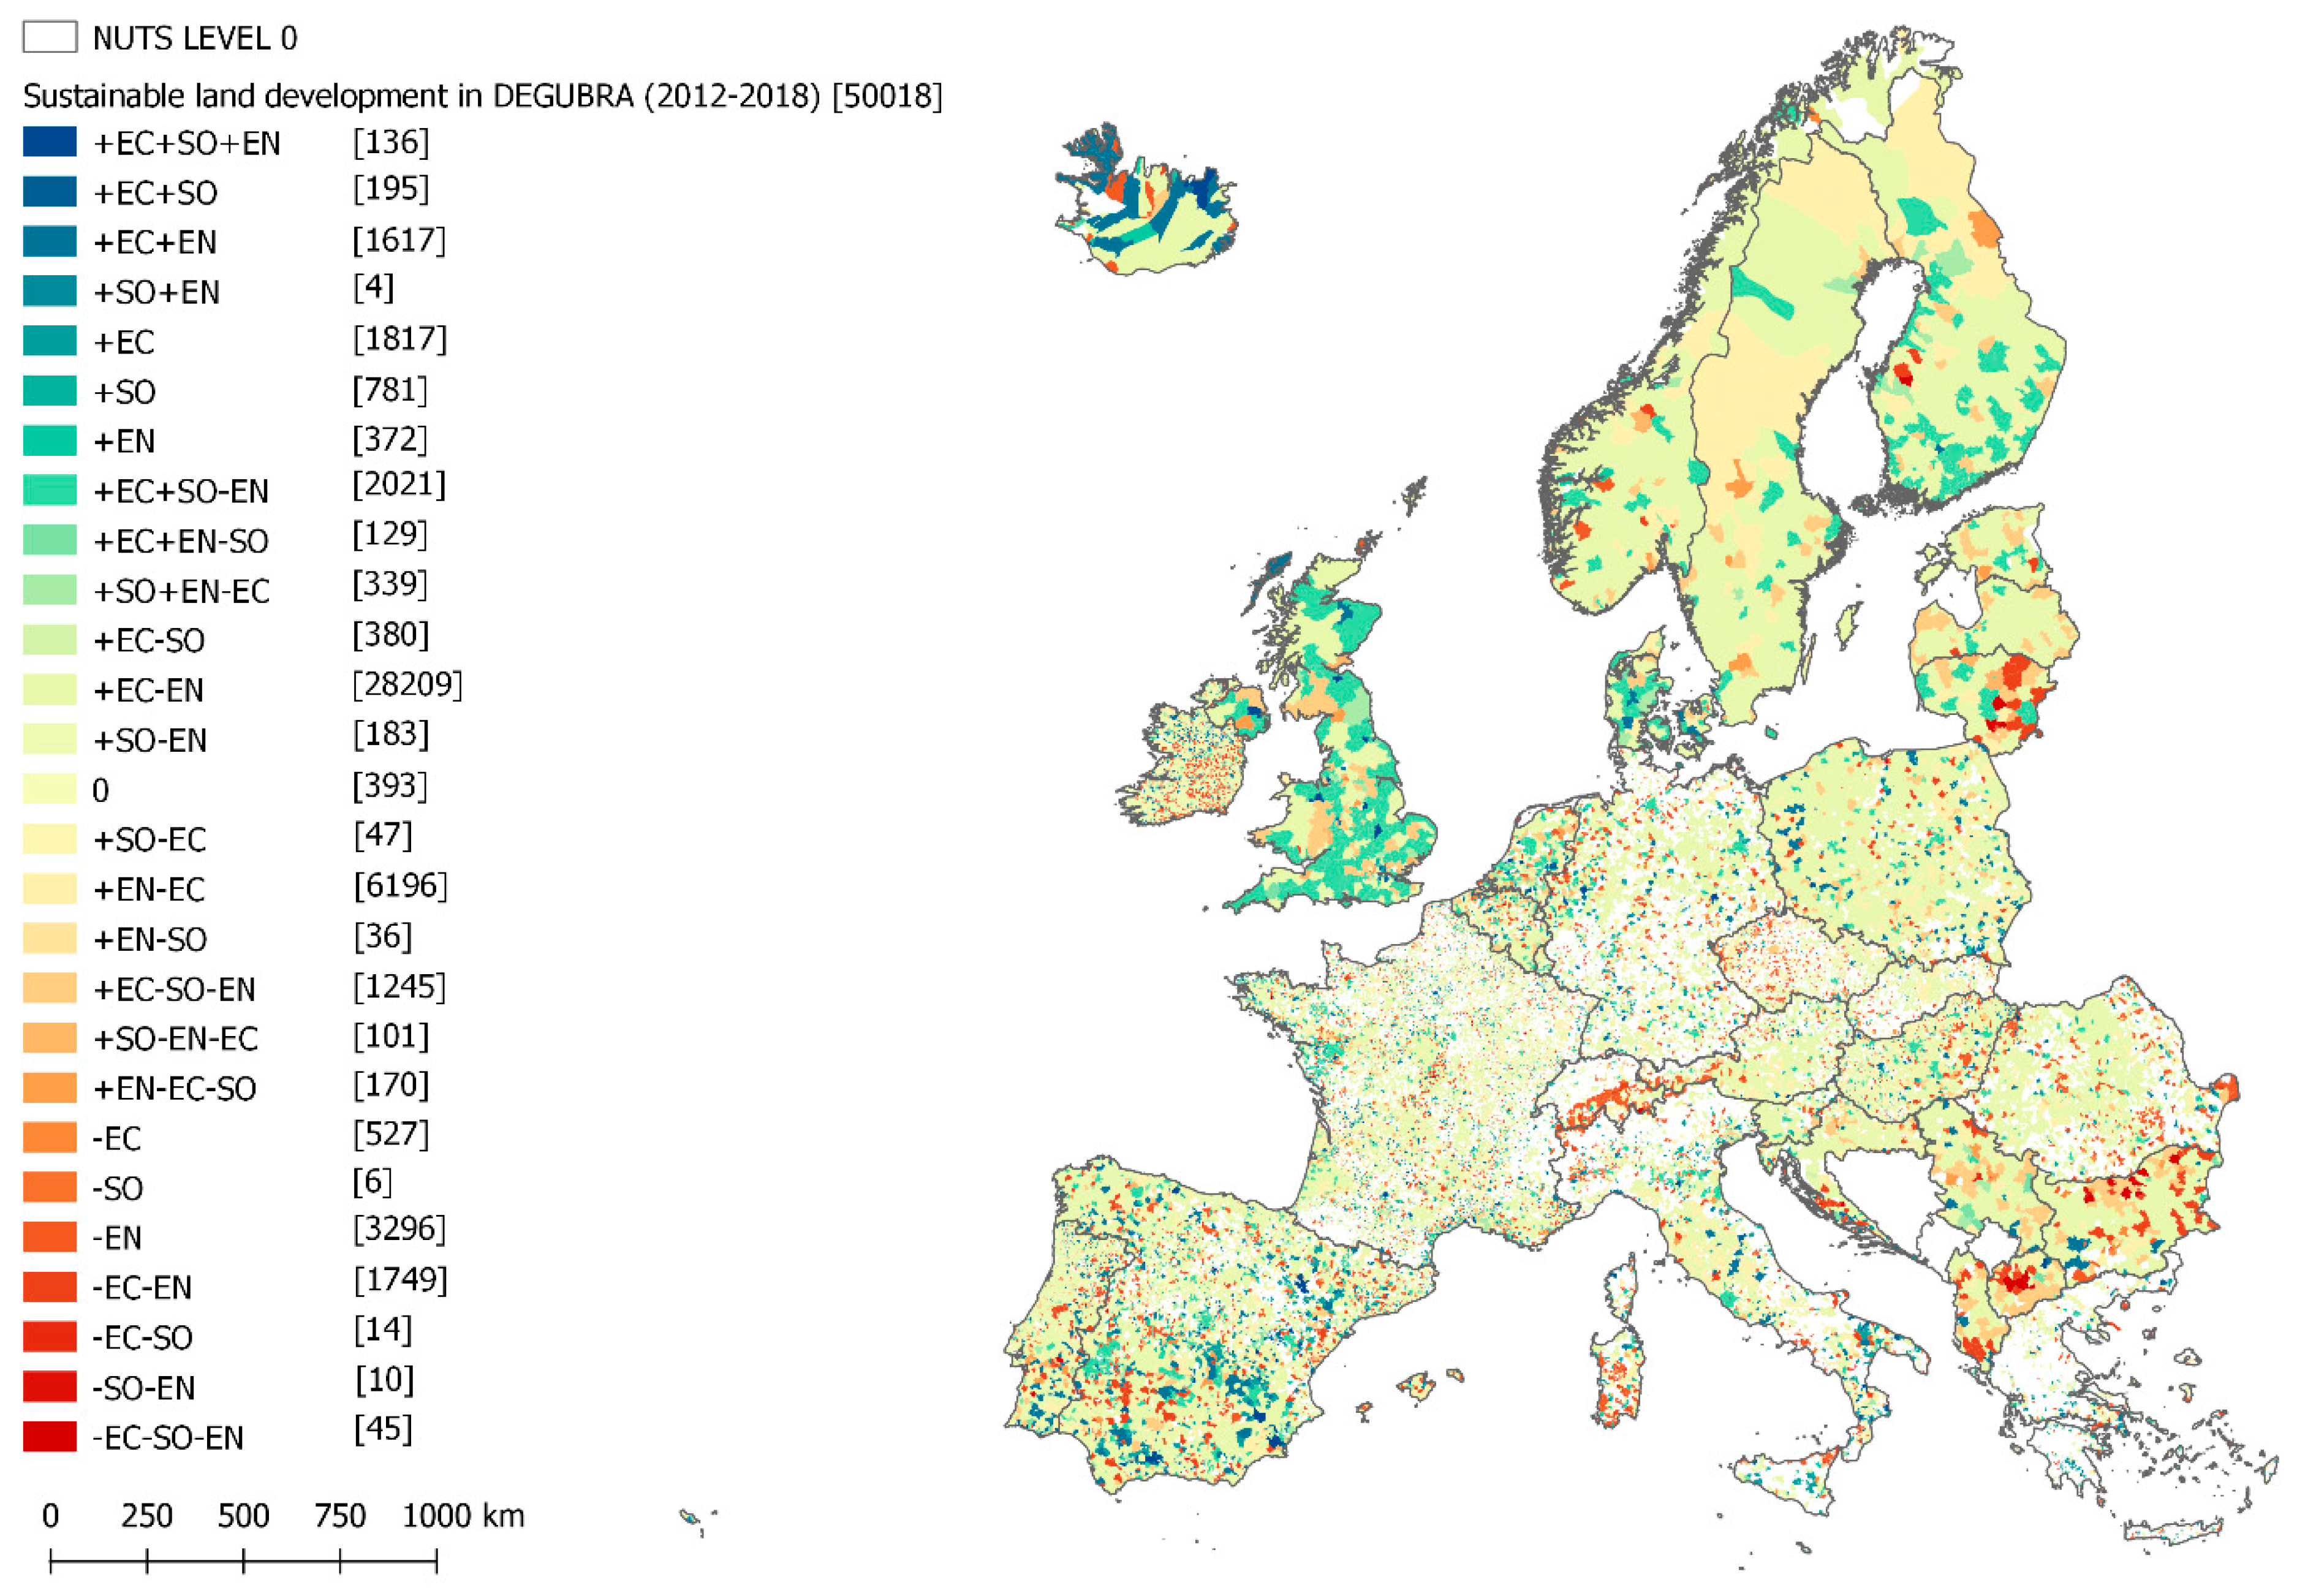
The analyses performed show that European local and regional government units have a rather poor record of sustainability. Only 136 units scored positively in all three dimensions. Units of this type are scattered throughout Europe and do not form larger clusters. There are also relatively few basic units with a positive change in two dimensions and with no change in the third. There are 195 (+Ec and +So), 1617 (+Ec and +En), and 4 (+So and +En) respectively, while in this group a certain geographical concentration can be observed (especially in the UK, The Netherlands, and Spain). There are also visible areas that are developing in relation to one dimension while the other two remain unchanged. Such a tendency was identified in 1817 units in the scope of economic dimension, 781 in the scope of social dimension, and 372 in the scope of environmental dimension (Figure 2).
The worst score was given to 45 areas, which had negative changes in all three aspects. They are particularly visible in the northern part of Bulgaria, Northern Macedonia, and Lithuania, but such units are also found in France, Spain, and Portugal. A negative assessment for the two dimensions (the third unchanged) was given for the social and environmental dimension in 10 cases, for the economic and environmental dimension in 1749 cases, and for the social and economic dimension in 14 cases. A negative assessment in only one dimension was given to 3296 units for the environmental dimension, 6 units for the social dimension, and 527 units for the economic dimension.
However, the European space is dominated by changes that have been positively evaluated in economic terms, negatively evaluated in environmental terms, and unchanged in social terms. Such change was observed in over 28,000 DEGURBA units. Figure 2 shows a significant concentration of units with positive environmental dimensional changes (central and northern parts of Sweden and the northern part of Finland). This change takes place mainly on a European scale in 1749 units due to the shrinking of divisions assigned to the economic dimension. What can be seen in the Scandinavian space is illusory and is in fact related to the size of basic spatial units and not to the statistical significance of the changes described.
3.2. Land Use Transformation Change Assessment—Cross-Sectional Results
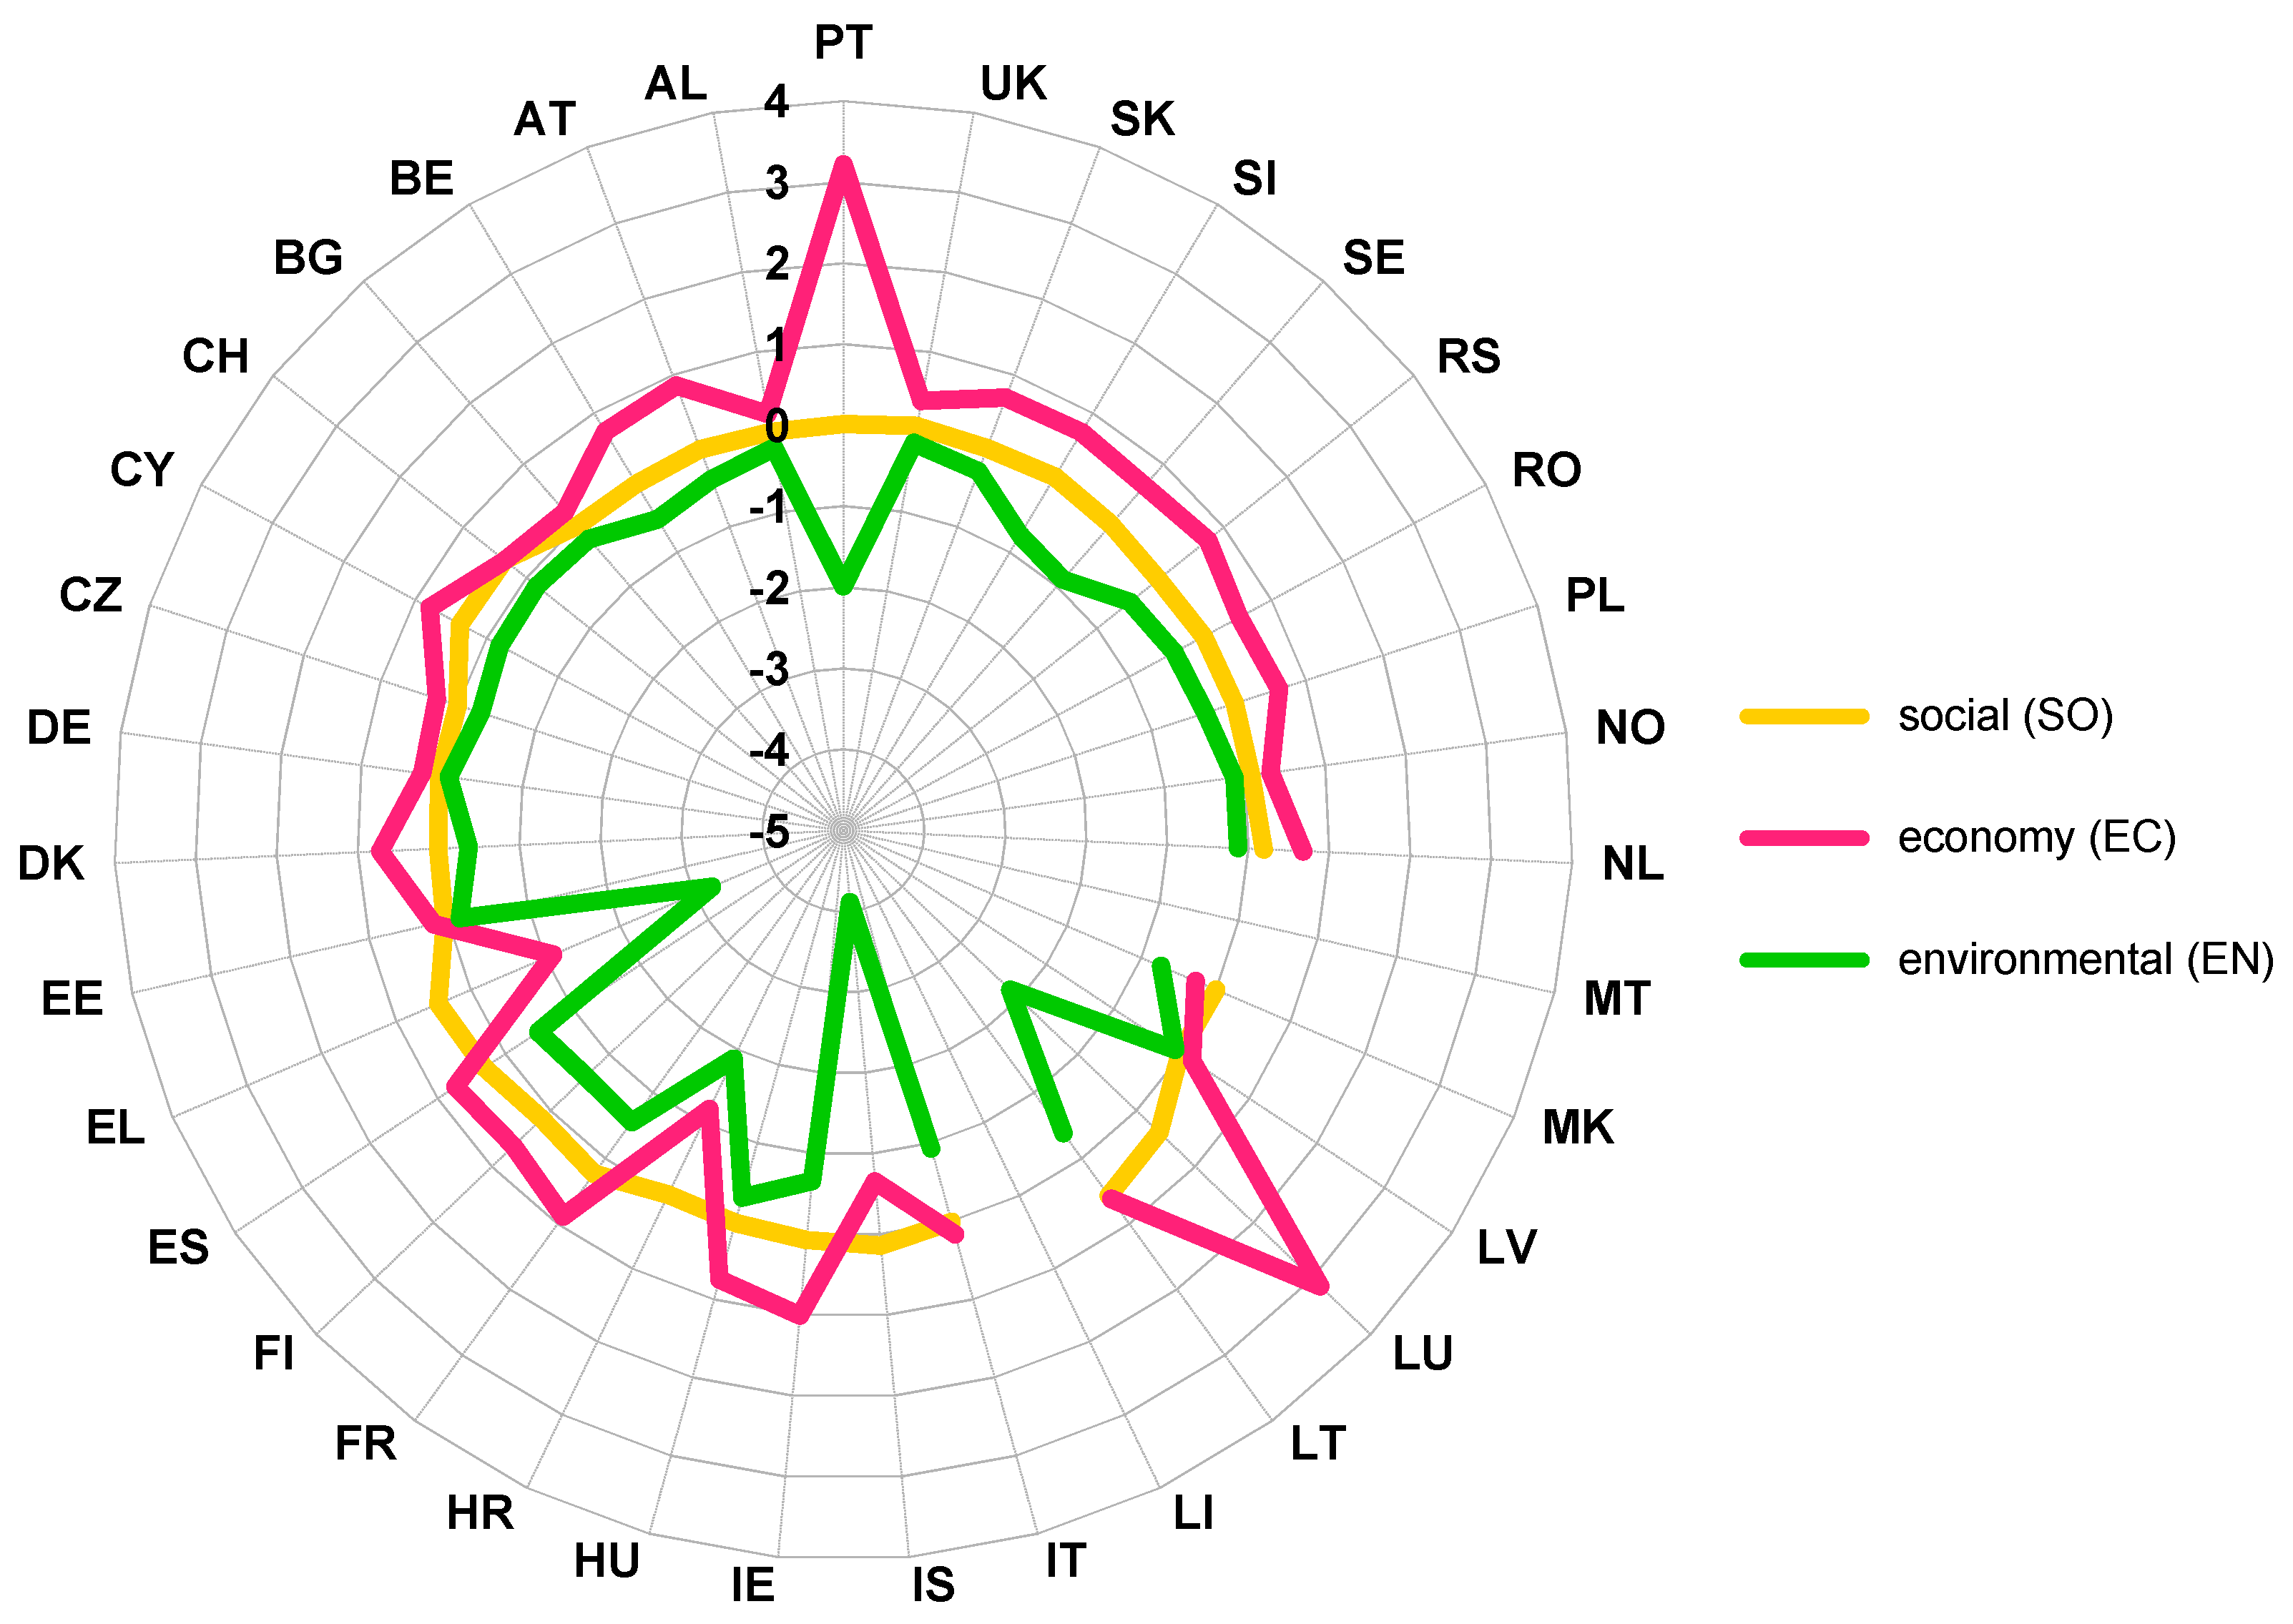
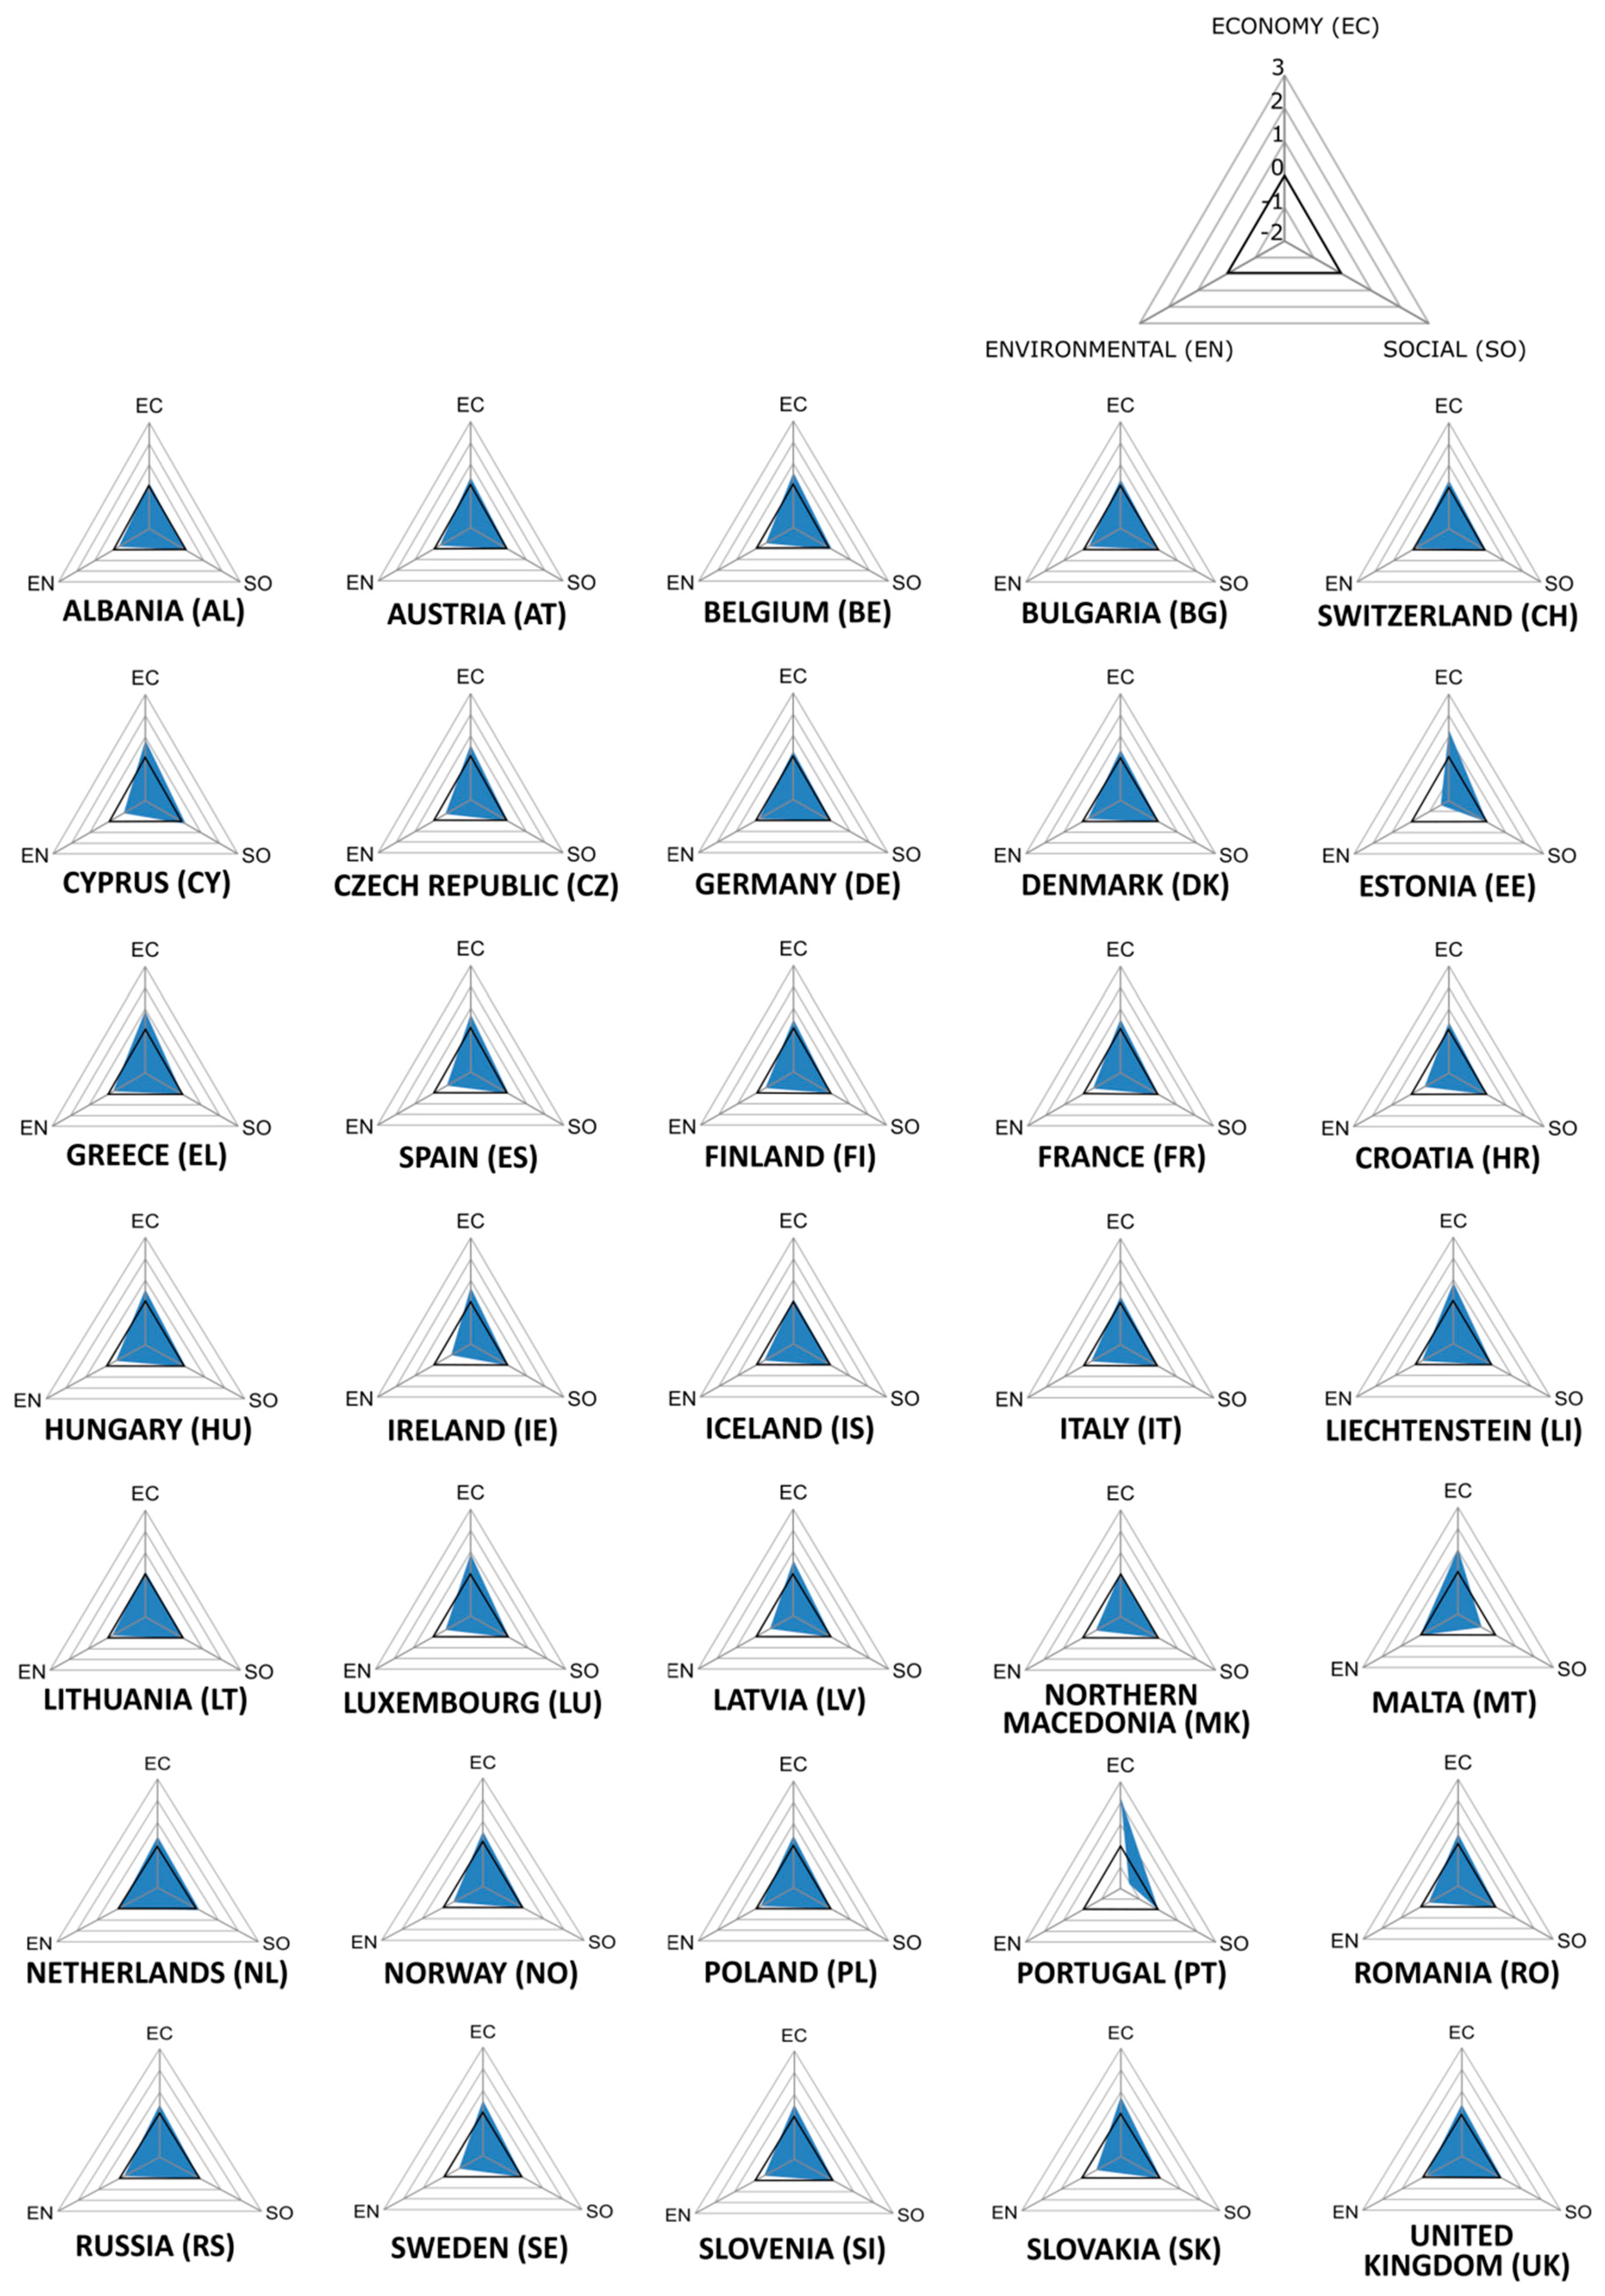
Weighing the percentage of an area that has changed within large cities makes it possible to conclude that the most stable situation occurs within the changes classified in the social dimension (e.g., a relative increase in green urban areas, classes 141). The yellow line (Figure 3, Figure 4 and Figure 5) is generally close to zero and deviates slightly for CY (Cyprus), EL (Greece), and LT (Lithuania). However, the biggest changes mainly concern economic dimension (e.g. a relative increase of fruit trees and berry plantations, class 222). The highest weighted increment in this area (by approx. 3.5) was observed in PT (Portugal) and LU (Luxembourg). Large cities in these countries are also characterized by a significant decrease in the weighted area in the environmental dimension (e.g., natural grasslands, class 321, by about 2.0) as shown in Figure 3.
However, the largest decreases in the weighted area classified in the environmental dimension were recorded in the large cities of IS (Iceland, a decrease of 5.0), EL (Greece, a decrease of 4.5), and HR (Croatia, a decrease of about 2.0). In addition, all the big cities in these countries were characterized by a negative assessment of economic changes (at the level of approximately1.0). The smallest average changes were observed in large cities in several countries including AL (Albania), BG (Bulgaria), CZ (Czech Republic), DE (Germany), LV (Latvia), NO (Norway), and the UK (United Kingdom). Large cities (according to the DEGURBA classification) do not exist in some countries such as LI (Lichtenstein) and MT (Northern Macedonia).
As was the case in large cities, the least weighted change values also concerned the social dimension in small and urban areas. Generally, the change was around 0. However, small towns located in MT (Northern Macedonia), for which the weighted percentage of land has fallen to almost −1.0, stand out from this standard. There are more separated areas in these locations, which proves that positive economic changes are occurring. The most visible is in the case of PT (Portugal), which had an increase of almost 3.0 and EE (Estonia), with an increase of almost 2.5. These changes take place mainly at the expense of space predisposed to development in the environmental dimension. Small towns in these countries recorded a decrease in the weighted mean of these areas by about 2.5 (Figure 4).
The situation was slightly different for small towns and suburbs in EL (Greece), IS (Iceland), and MT (Northern Macedonia), which recorded an average economic growth of about 1.5 (EL) and 1.0 (the latter two) respectively, with an almost unchanged weighted percentage for the environmental dimension of 0. This may mean that new economic activities are developing mainly in areas where environmental significance in the survey was assessed as relatively low. The average spreads by country are slightly higher in this cross-section than in the case of large cities, with AL (Albania), DE (Germany), DK (Denmark), and LT (Lithuania) being the most stable.
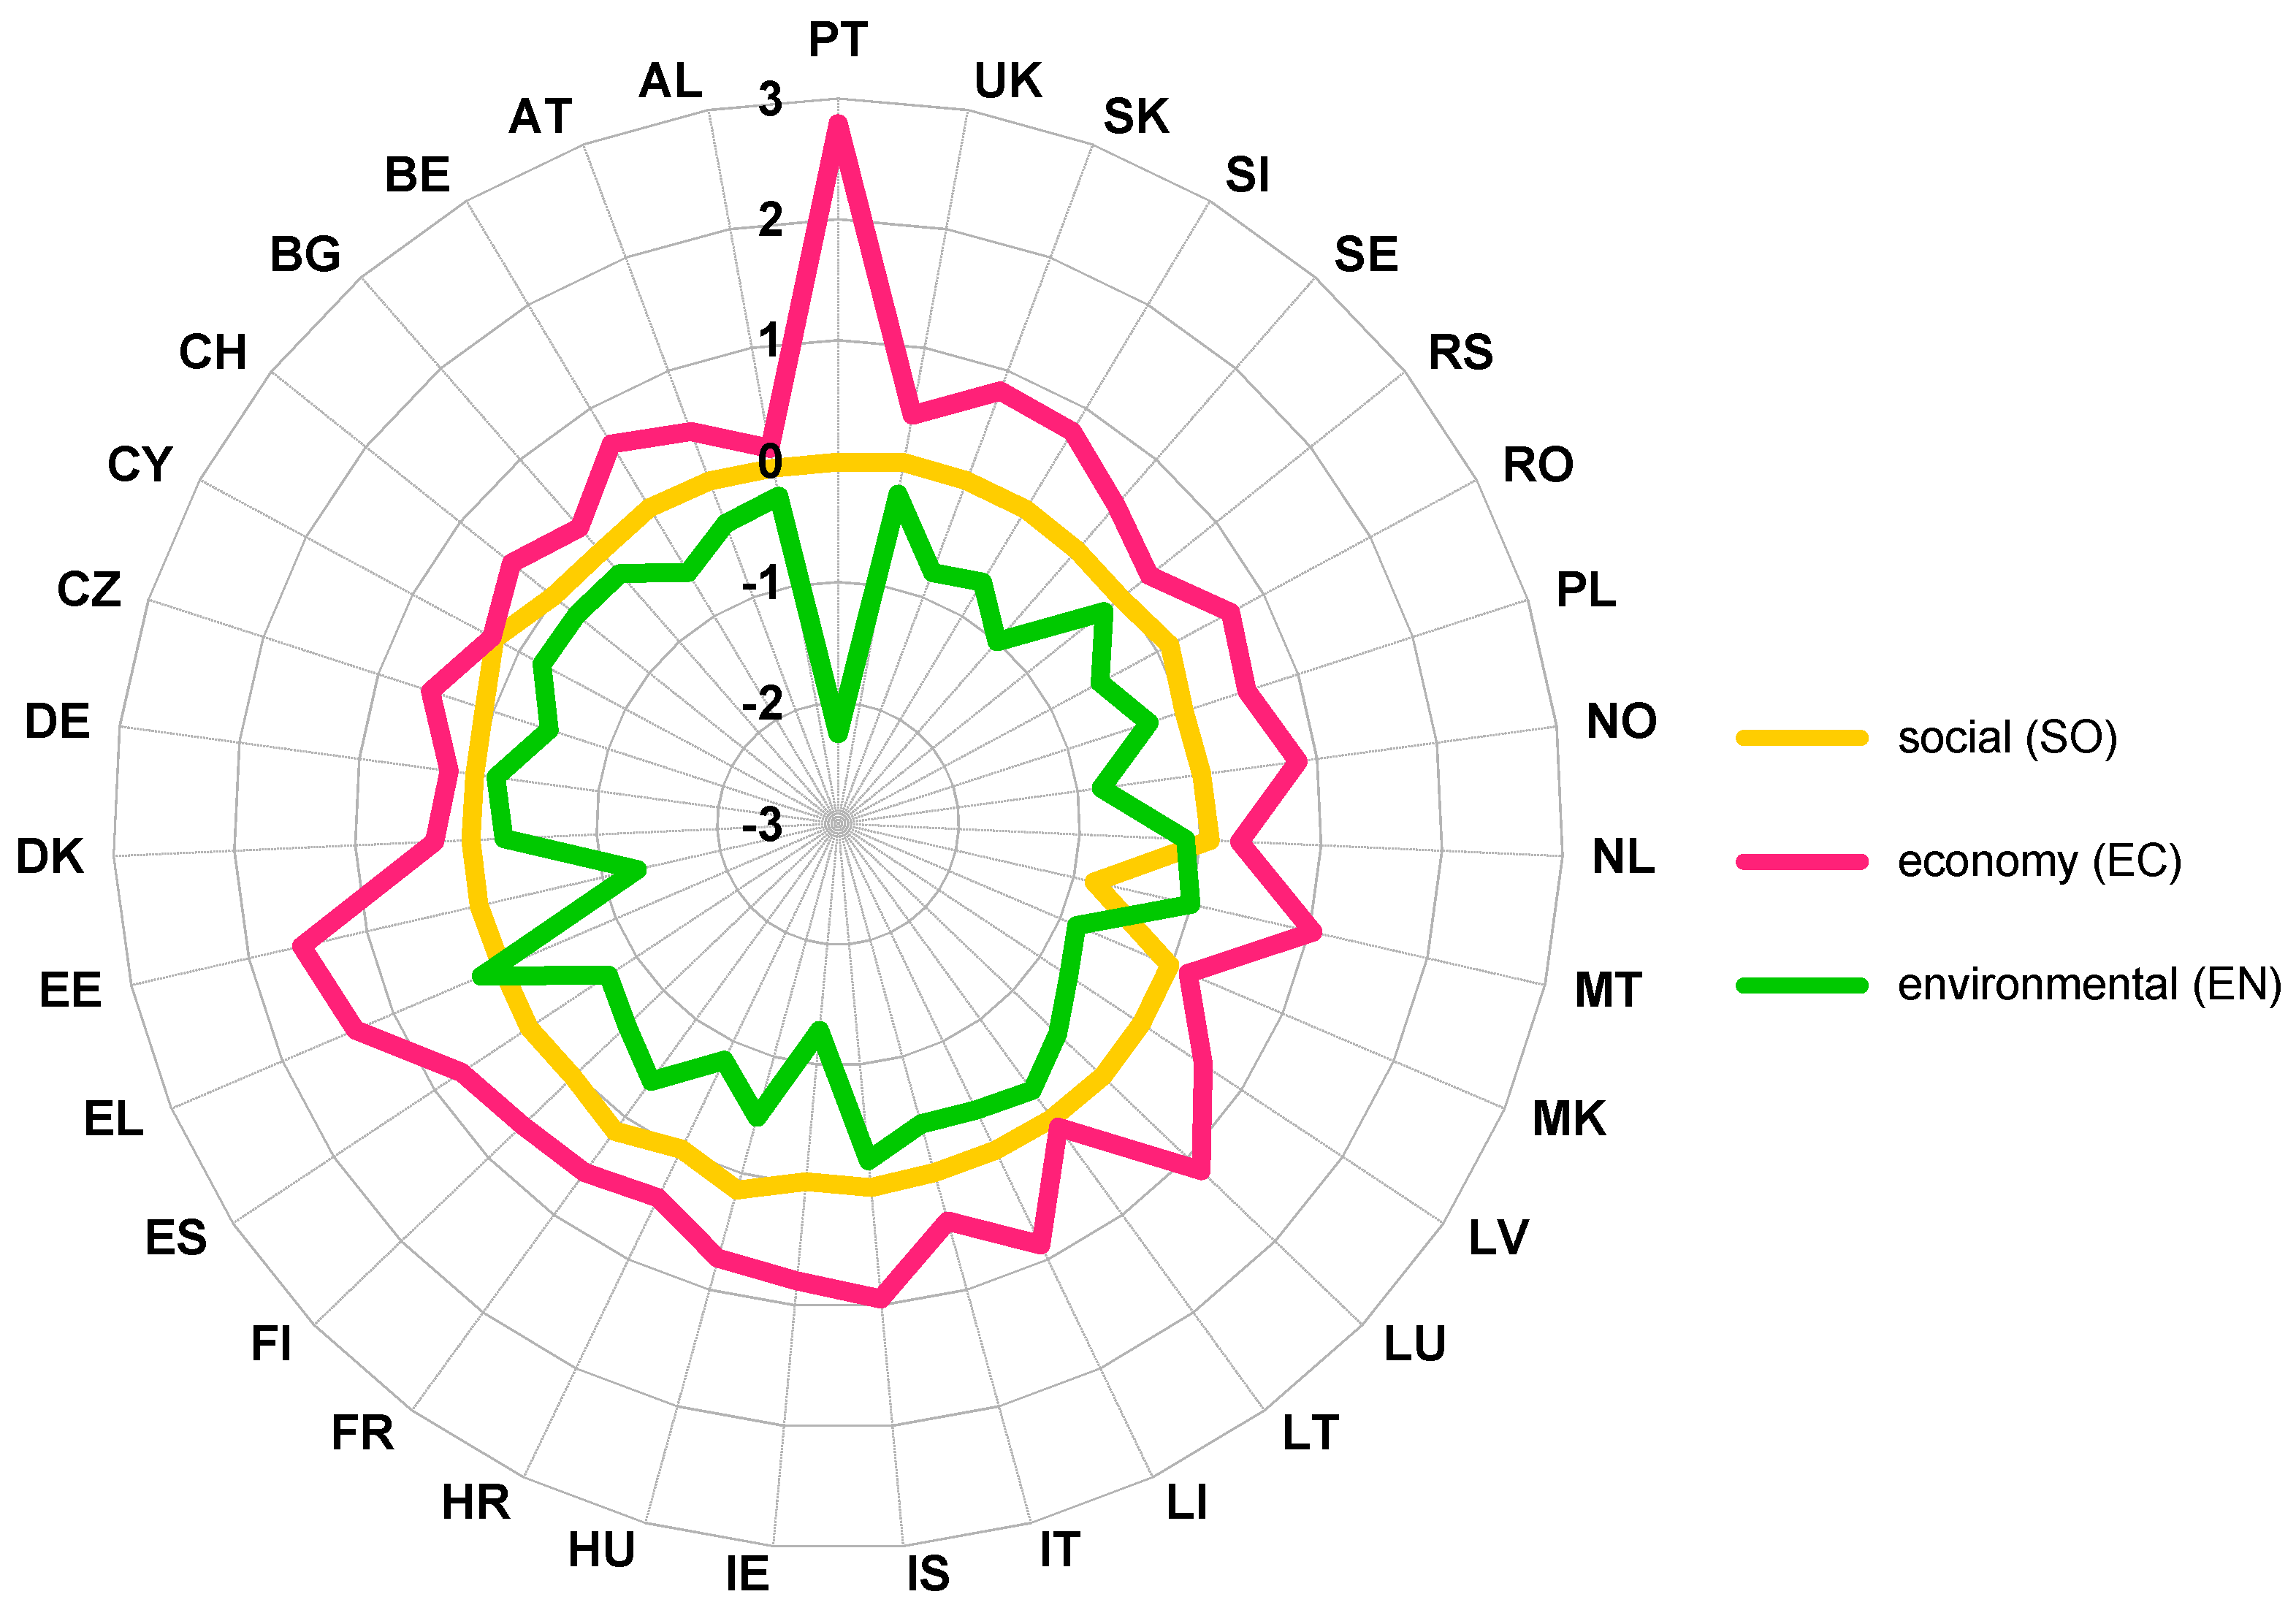
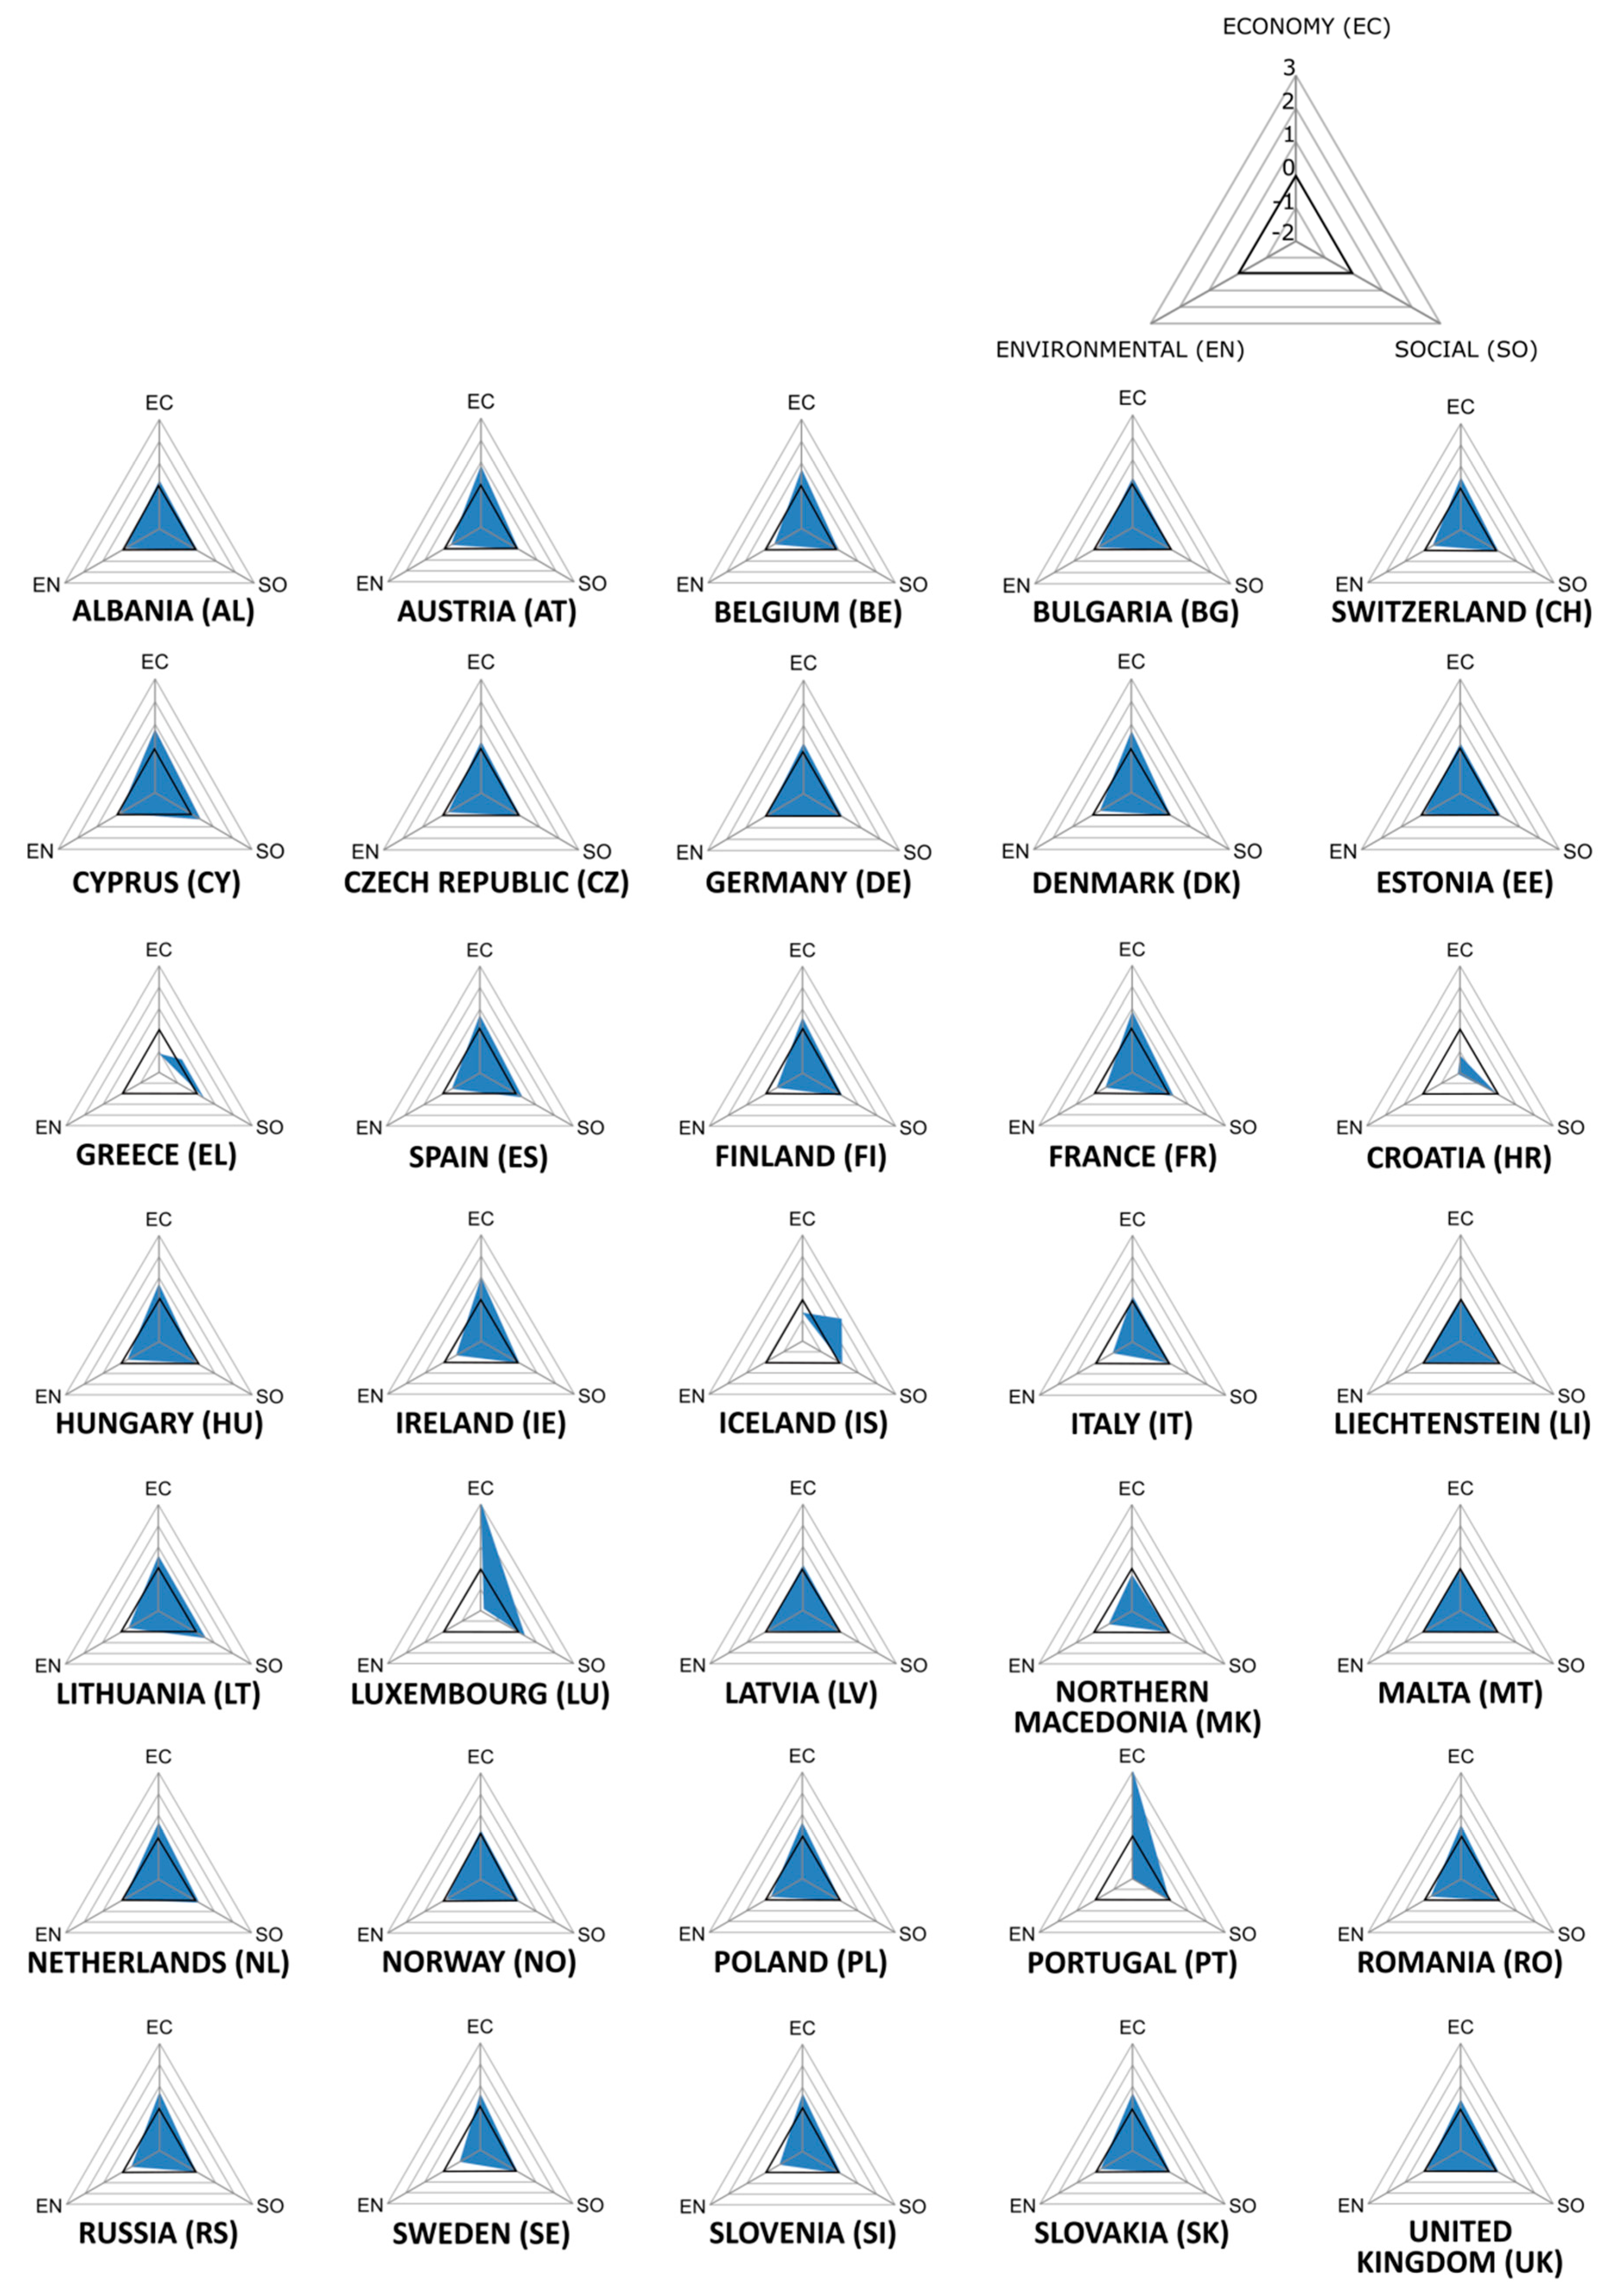
The changes in rural areas on a pan-European scale in the weighted mean of assessment for the social dimension were very stable (at around 0). However, this does not apply to the changes in the economic and social dimension. The biggest discrepancies in this respect were found in PT where there was an economic dimension increase slightly above 2.0 with a simultaneous decrease in environmental dimension at the level of nearly 3.0. In EE, there was an economic dimension increase of almost 1.5 with a decrease in the weighted mean percentage of the area for environmental dimension by approximately 1.75. A slightly smaller discrepancy can be observed for CY, IE, LU, and LV (Figure 5).
The highest average stability was found in rural areas of countries, such as CH (Switzerland), DE, DK, IS, LT, and NL (Netherlands). The countries of Central and Eastern Europe and the Balkan countries including BG, CZ, HR, HU (Hungary), PL, RO, SI (Slovenia), and SK (Slovakia) compensate for economic growth with an almost proportional decline in the areas considered important for environmental sustainability.
4. Discussion
Research on sustainable development focuses on defining the scope of this concept and on identifying measures used to assess it. In all works, it is emphasized that sustainable development is multidimensional, and the proposed indicators are an attempt to combine them into a measurable set of assessments [34,35,36,37]. Publications usually focus on a certain aspect of sustainable development (e.g., economic and industry [38,39,40], social and environmental [41,42,43], or culture [44,45]). Research aimed at assessing sustainable development is carried out on a different scale, from local [46,47], to regional, tonational [48,49], and to studies covering international comparisons [50,51,52].
In the context of rational land development, our research emphasized arranged functional and spatial structure, which effectively uses the existing resources. [53,54]. However, this is impossible without a number of actions aimed at concentration of housing development (preventing urban sprawl) and mixed land use, as well as using rehabilitated and revitalized areas [55,56,57]. Managing changes with respect to economics should minimize the negative impact on the environment by acting with respect for the local community while taking the economy into account. However, this is not a simple task [58,59]. It’s also worth noting that development is not complete without blue–green infrastructure that lays the foundation for biological life in a specific area [60,61,62]. The development of urban greenery and the improvement of the quality of natural areas contributes to the preservation of biodiversity and can significantly reduce climate change [63,64]. Observing the direction and intensity of changes in this respect [65,66] can be considered not as an intellectual adventure, but rather as a duty of all actors shaping the future of spatial units, including local communities and other groups inhabiting them.
Research on sustainable development using digital maps (including CLC) is relatively rare e.g. [67,68,69,70]. They focus mainly on specific issues such as deforestation [53], assessment of the state of the environment [71,72], or assessment of the dynamics of spatial transformations [73,74]. Our approach is different. It is not based on showing the changes themselves or on the search for a quantitative relationship between changes in land use and statistical data, as is the case in the cited works. Our research is based on the methodology developed for land recycling in Europe [31]. Although this approach affects a different research area, it is not without flaws. There were two main flaws, which were the author’s assignment of weights to the observed changes and taking the elements connecting land use and land cover as a basis for analysis, as well as using relatively generalized objects with a minimum area of 25 ha (minimum width of 100 m) [25]. Weighing can be objectified by using an expert method. However, it is more difficult to limit the impact of CLC methodological assumptions on the results achieved - it would require using Urban Atlas data or reference data at the national level, and standardizing methodology across the continent. This is currently not possible. Slightly less important is the possible spatial errors related to the CLC database (especially the uncertainties related to the accuracy of the interpretation of the satellite images) which can also affect the results obtained. On the other hand, the presented method allows research to be conducted on the basis of public statistics that have been generalized to quasi-natural units or are difficult to compare during panel research. An unquestionable advantage of this method is the ability to generate results for a large area in quasi-natural units or in an analytical grid with a selected resolution, as well as the ability to generate time lists (for individual CLC editions) with a relatively uniform methodological basis, which encourages further analysis following this route.
The research presented in this article fills the research gap regarding finding a relationship between spatial transformations and the assessment of sustainable development. A minimum necessary condition for sustainability is the maintenance of the total natural capital stock at or above the current level, which also includes land resource. Basic sustainable development strategies are based on sufficiency and efficiency, guided by transformations calculated in this article on the basis of CORINE data.
5. Conclusions
This article presents the results of the application of the author’s assessment method of land-use change that occurred in the European space in terms of sustainable development. This method is an integrated approach to studying the direction and intensity of changes taking place in the economic, social, and environmental dimensions of this process. Basing the method on assessment matrices (used to construct weighs) and territorial units presenting the degree of urbanization (DEGURBA) allowed for observation of the following trends in the 2012–2018 time horizon:
- Development that can be considered sustainable (in terms of land use change) was observed in a relatively small number of basic territorial units of the countries concerned. Territorial units perceive development in terms of economic rather than social change, despite declarative intentions to focus on the latter aspect. In addition, this development often comes at the expense of sound management of spatial and environmental resources, such as blue–green infrastructure. The higher the population density and the more important the function in the functional system of a given country, the greater the differentiation of the weighted mean of the area determined within the described dimensions. The lowest diversity was in the social dimension and the highest was in the economic dimension. The economic dimension is often shaped at the expense of the environmental dimension. The smaller the population density and the lower the importance of the unit, the more often this type of situation was observed. It can therefore be concluded that large cities are growing faster, and that rural development is less sustainable.
- In Europe, significant concentration of areas with similar statistical characteristics of the weighted percentage of area in the described dimensions of sustainable development was relatively rare. However, there are indications that Portugal (PT), Luxembourg (LU), and Estonia (EE) are the countries with the recent greatest asymmetries in sustainable development. The countries with the least asymmetry are Albania (AL) and Germany (DE). The countries of Central and Eastern Europe and the Balkans compensate for economic growth at the expense of the areas considered important in social terms.
It is important to repeat the survey in the remaining time frames (at least for the 2000–2006 and 2006–2012 periods) in order to validate these results. This would allow the method to be tested against a slightly different spatial range (during these periods the DEGURBA classification, among others, was changed) and to generate and interpret information on the stability of the observed change trends. It is possible that these changes could be both cognitively valuable and empirically beneficial for further development policy at the local, regional, national and international level.
Author Contributions
Conceptualization, P.G. and A.M.; methodology, P.G. and A.M.; software, P.G.; validation, P.G.; formal analysis, P.G. and A.M.; investigation, P.G. and A.M.; resources, P.G. and A.M.; data curation, P.G. and A.M.; writing—original draft preparation, P.G. and A.M; writing—review and editing, P.G. and A.M.; visualization, P.G.; supervision, P.G.; project administration, P.G. and A.M.; funding acquisition, P.G. and A.M. All authors have read and agreed to the published version of the manuscript.
Funding
This research received no external funding.
Conflicts of Interest
The authors declare no conflict of interest.
Appendix A
Figure A1.
Land use change assessment matrix in the economic aspect.

Figure A2.
Land use change assessment matrix in the social aspect.

Figure A3.
Land use change assessment matrix in the environmental aspect.

Appendix B
Figure A4.
Sustainability assessment of local change directions in country.

Figure A5.
Sustainability assessment of local change directions in country - DEGURBA level 1.

Figure A6.
Sustainability assessment of local change directions in country - DEGURBA level 2.

Figure A7.
Sustainability assessment of local change directions in country - DEGURBA level 3.

References
- The World Commission on Environment and Development. Report of the World Commission on Environment and Development: Our Common Future; Oxford University Press: Oxford, UK, 1987; p. 16. [Google Scholar]
- Yu, C.; Dijkema, G.P.K.; De Jong, M.; Shi, H. From an eco-industrial park towards an eco-city: A case study in Suzhou, China. J. Clean. Prod. 2015, 102, 264–274. [Google Scholar] [CrossRef]
- Roseland, M. Dimensions of the eco-city. Cities 1997, 14, 198–202. [Google Scholar] [CrossRef]
- Kenworthy, J.R. The eco-city: Ten key transport and planning dimensions for sustainable city development. Environ. Urban. 2006, 18, 67–85. [Google Scholar] [CrossRef]
- Melosi, M.V. The Emerald City Was Not a Green City. In RCC Perspectives, No. 1, GREEN CITY: Explorations and Visions of Urban Sustainability; Munich, Germany, 2018; pp. 65–72. [Google Scholar] [CrossRef]
- Hulicka, A. Green City—Sustainable City. Prof. Geogr. 2015, 141, 73–85. [Google Scholar]
- Beatley, T. Green Cities of Europe. Global Lessons on Green Urbanism; Island Press: London, UK, 2012. [Google Scholar]
- Abdullahi, S.; Pradhan, B.; Mansor, S.; Shariff, A.R.M. GIS-based modeling for the spatial measurement and evaluation of mixed land use development for compact city. J. Gisci. Remote Sens. 2014, 52, 18–39. [Google Scholar] [CrossRef]
- Majorek, A. Urbanizacja a proces rozlewania się miast. In Analiza Zmian i Prognoza Przyrostu Zabudowy Mieszkaniowej Na Obszarze Polski do 2020 Roku; Gibas, P., Ed.; Bogucki Wydawnictwo Naukowe: Poznań, Poland, 2017; pp. 10–17. [Google Scholar]
- Dieleman, F.; Wegener, M. Compact City and Urban Sprawl. Built Environ. 2004, 30, 308–323. [Google Scholar] [CrossRef] [Green Version]
- Hanzeieha, S.; Tabibian, M. Redesigning Urban Spaces with an Emphasis on the Relationship Between the Physical Environment of the City and the Behavior of Citizens (Case Study: Adl Street in Qazvin). Space Ontol. Int. J. 2018, 7, 1–14. [Google Scholar]
- Barnett, J. Redesigning Cities. Principles, Practice, Implementation; Routledge Taylor & Francis Group: London, UK; New York, NY, USA, 2017. [Google Scholar]
- Höjer, M.; Wangel, J. Smart Sustainable Cities: Definition and Challenges. In ICT Innovations for Sustainability; Part of the Advances in Intelligent Systems and Computing Book Series (310); Hilty, L.M., Aebischer, B., Eds.; Springer: Warsaw, Poland, 2014; pp. 333–349. [Google Scholar]
- Su, K.; Li, J.; Fu, H. Smart city and the applications. In Proceedings of the IEEE International Conference on Electronics, Communications and Control (IECC), Ningbo, China, 9–11 September 2011; pp. 1028–1031. [Google Scholar]
- Lombardi, P.; Giordano, S.; Farouh, H.; Yousef, W. Modelling the smart city performance. Innov. Eur. J. Soc. Sci. Res. 2012, 25, 137–149. [Google Scholar] [CrossRef]
- Mierzejewska, L. Sustainable Development of a City: Systemic Approach. Probl. Ekorozw. —Probl. Sustain. Dev. 2017, 12, 71–78. [Google Scholar]
- Taleai, M.; Sharifi, A.; Sliuzas, R.; Mesgari, M. Evaluating the compatibility of multi-functional and intensive urban land uses. Int. J. Appl. Earth Obs. Geoinf. 2007, 9, 375–391. [Google Scholar] [CrossRef]
- Pesaresi, M.; Melchiorri, M.; Siragusa, A.; Kemper, T. Atlas of the Human Planet—Mapping Human Presence on Earth with the Global Human Settlement Layer. JRC103150; Publications Office of the European Union, European Commission, Publications Office of the European Union: Luxembourg, 2016; DG JRC. [Google Scholar]
- Mierzejewska, L. Sustainable development of a city: Selected theoretical frameworks, concepts and models. Probl. Rozw. Miast 2015, XII, 5–11. [Google Scholar]
- Broniewicz, E. Gospodarowanie Przestrzenią w Warunkach Rozwoju Zrównoważonego; Oficyna Wydawnicza Politechniki Białostockiej: Białystok, Poland, 2017; pp. 67–83. [Google Scholar]
- CORINE Land Cover—CLC. Available online: http://clc.gios.gov.pl/index.php/o-clc/program-clc (accessed on 15 November 2019).
- Feranec, J.; Jaffrain, G.; Soukup, T.; Hazeu, G. Determinig changes and flows in European landscapes 1990–2000 using CORINE land cover data. Appl. Geogr. 2010, 30, 19–35. [Google Scholar] [CrossRef]
- Martínez-Fernández, J.; Ruiz-Benito, P.; Bonet, A.; Gómez, C. Methodological variations in the production of CORINE land cover and consequences for long-term land cover change studies. The case of Spain. Int. J. Remote Sens. 2019, 40, 8914–8932. [Google Scholar] [CrossRef] [Green Version]
- Kucsicsa, G.; Popovici, E.A.; Bălteanu, D.; Grigorescu, I.; Dumitraşcu, M.; Mitrică, B. Future land use/cover changes in Romania: Regional simulatons based on CLUE-S model and CORINE land cover database. Landsc. Ecol. Eng. 2019, 15, 75–90. [Google Scholar] [CrossRef]
- CORINE Land Cover Technical Guide—Addendum 2000, Technical Report No 40/2000. Available online: https://www.eea.europa.eu/publications/tech40add (accessed on 3 December 2019).
- Rysz, K. Zakres pojęciowy kategorii pokrycia i użytkowania ziemi stosowany w programie CORINE. In Analiza Zmian I Prognoza Przyrostu Zabudowy Mieszkaniowej Na Obszarze Polski Do 2020 Roku; Gibas, P., Ed.; Bogucki Wydawnictwo Naukowe: Poznań, Poland, 2017; pp. 31–35. [Google Scholar]
- Urban Sprawl in Europe—The Ignored Challenge. In EEE Report, No 10/2006; Publications Office of the European Union: Luxembourg, 2006.
- Urban Sprawl in Europe—Join EEA-FOEN Report. In EEA Report, No 11/2016; Publications Office of the European Union: Luxembourg, 2016.
- Gibas, P. Analiza Zmian I Prognoza Przyrostu Zabudowy Mieszkaniowej Na Obszarze Polski do 2020 Roku; Bogucki Wydawnictwo Naukowe: Poznań, Poland, 2017. [Google Scholar]
- Śleszyński, P. Expected traffic speed in Poland using Corine land cover, SRTM-3 and detailed population places data. J. Maps 2015, 11, 245–254. [Google Scholar] [CrossRef]
- Land Recycling in Europe. Approaches to Measuring Extent and Impacts. In EEA Report, No 31/2016; Publications Office of the European Union: Luxembourg, 2016.
- Degree of Urbanization (DEGURBA). Available online: https://ec.europa.eu/eurostat/web/degree-of-urbanisation/background (accessed on 3 December 2019).
- RAMON—Reference and Management of Nomenclatures. Available online: https://ec.europa.eu/eurostat/ramon/miscellaneous/index.cfm?TargetUrl=DSP_DEGURBA (accessed on 3 December 2019).
- Rennings, K.; Wiggering, H. Steps towards indicators of sustainable development: Linking economic and ecological concepts. Ecol. Econ. 1997, 20, 25–36. [Google Scholar] [CrossRef]
- Kuik, O.; Verbruggen, H. In Search of Indicators of Sustainable Development; Media, B.V., Ed.; Sprigner—Science + Business: Dordrecht, The Netherlands, 2012. [Google Scholar]
- Hák, T.; Moldan, B.; Dahl, A.L. Sustainability Indicators: A Scientific Assessment; Scientific Committee on Problems of the Environment (SCOPE): Washington, DC, USA, 2007. [Google Scholar]
- Steurer, R.; Hametner, M. Objectives and Indicators in Sustainable Development Strategies: Similarities and Variances across Europe. Sustain. Dev. 2013, 21, 224–241. [Google Scholar] [CrossRef]
- Archibugi, F.; Nijkamp, P. Economy and Ecology: Towards Sustainable Development; Springer: Berlin/Heidelberg, Germany, 1989. [Google Scholar]
- Azapagic, A.; Perdan, S. Indicators of Sustainable Development for Industry: A General Framework. Process Saf. Environ. Prot. 2000, 78, 243–261. [Google Scholar] [CrossRef]
- Wallner, H.P. Towards sustainable development of industry: Networking, complexity and eco-clusters. J. Clean. Prod. 1999, 7, 49–58. [Google Scholar] [CrossRef]
- Dempsey, N.; Bramley, G.; Power, S.; Brown, C. The social dimension of sustainable development: Defining urban social sustainability. Sustain. Dev. 2011, 19, 289–300. [Google Scholar] [CrossRef]
- Clini, C.; Musu, I.; Gullina, M.L. Sustainable Development and Environmental Management; Springer: Berlin/Heidelberg, Germany, 2008. [Google Scholar]
- Huber, J. Towards industrial ecology: Sustainable development as a concept of ecological modernization. J. Environ. Policy Plan. 2000, 2, 269–285. [Google Scholar] [CrossRef]
- Dessein, J.; Soini, K.; Fairclough, G.; Horlings, L. Culture in, for and as Sustainable Development. Conclusions from COST Action IS1007 Investigating Cultural Sustainability; University of Jyväskylä: Jyväskylä, Finalnd, 2015. [Google Scholar]
- Tweed, C.; Sutherland, M. Built cultural heritage and sustainable urban development. Landsc. Urban Plan. 2007, 83, 62–69. [Google Scholar] [CrossRef]
- Oduwaye, L. Challenges of Sustainable Physical Planning and Development in Metropolitan Lagos. J. Sustain. Dev. 2009, 2, 159–171. [Google Scholar] [CrossRef] [Green Version]
- Ianoş, I.; Peptenatu, D.; Pintilii, R.D.; Drăghici, C. About sustainable development of the territorial emergent structures from the metropolitan area of Bucharest. Environ. Eng. Manag. J. 2012, 11, 1535–1545. [Google Scholar] [CrossRef]
- Xie, K.; Li, W.; Zhao, W. Coal chemical industry and its sustainable development in China. Energy 2010, 35, 4349–4355. [Google Scholar] [CrossRef]
- Nourry, M. Measuring sustainable development: Some empirical evidence for France from eight alternative indicators. Ecol. Econ. 2008, 67, 441–456. [Google Scholar] [CrossRef]
- Krueger, R.; Gibbs, D. The Sustainable Development Paradox. Urban Political Economy in the United States and Europe; The Guilford Press: New York, NY, USA; London, UK, 2007. [Google Scholar]
- Bertram, G. “Sustainable development” in Pacific micro-economies. World Dev. 1986, 14, 809–822. [Google Scholar] [CrossRef]
- Pearce, D.; Barbier, E.; Markandya, A. Sustainable Development. Economisc and Environment in the Third World; Edward Elgar Publishing Limited: London, UK; Washington, DC, USA, 1990. [Google Scholar]
- Pen, J.; Ma, J.; Du, Y.; Zhang, L.; Hu, X. Ecological suitability evaluation for mountainous area development based on conceptual model of landscape structure, function, and dynamics. Ecol. Indic. 2016, 61, 500–511. [Google Scholar]
- Yang, J.; Li, S.; Lu, H. Quantitative influence of land-use changes and urban expansion intensity on landscape pattern in Qingdao, China: Implications for urban sustainability. Sustainability 2019, 11, 6174. [Google Scholar] [CrossRef] [Green Version]
- Analysing and Managing Urban Growth—European Environment Agency. EEA. 2011. Available online: http://www.eea.europa.eu/articles/analysing-and-managing-urban-growth (accessed on 3 December 2019).
- Amer, M.; Reiter, S.; Attia, S. Urban densification through roof stacking: Case study. Eur. Netw. Hous. Res. 2018, 97. [Google Scholar]
- Brandon, E.J. The Rehabilitation of Contaminated Land to Enhance Future Options for Cities. In International Yearbook of Soil Law and Policy 2018. International Yearbook of Soil Law and Policy; Ginzky, H., Dooley, E., Heuser, I., Kasimbazi, E., Markus, T., Qin, T., Eds.; Springer: Berlin/Heidelberg, Germany, 2018. [Google Scholar] [CrossRef]
- Harvanová, J. Selected aspects of integrated environmental management. Ann. Agric. Environ. Med. 2018, 25, 403–408. [Google Scholar]
- Friedl, C.; Reichl, J. Realizing energy infrastructure projects–A qualitative empirical analysis of local practices to address social acceptance. Energy Policy 2016, 89, 184–193. [Google Scholar] [CrossRef]
- Pelorosso, R.; Gobattoni, F.; La Rosa, D.; Leone, A. Ecosystem Services Based Planning and Design of Urban Green Infrastructure for Sustainable Cities. In XVIII Conferenza Nazionale SIU–Società italiana degli Urbanisti. 2016. Available online: https://www.researchgate.net/profile/R_Pelorosso/publication/299411561_Ecosystem_Services_based_planning_and_design_of_Urban_Green_Infrastructure_for_sustainable_cities/links/56f5090d08ae81582bf14c33/Ecosystem-Services-based-planning-and-design-of-Urban-Green-Infrastructure-for-sustainable-cities.pdf (accessed on 3 December 2019).
- Jerome, G. Defining community-scale green infrastructure. Landsc. Res. 2017, 42, 223–229. [Google Scholar] [CrossRef]
- Nilsson, K.; Slätmo, E.; Turunen, E. GREEN INFRASTRUCTURE-strategic land use for well-being, business and biodiversity. In Report of Nordic Council of Ministers; Nordregio: Stockholm, Sweden, 2019. [Google Scholar] [CrossRef]
- Liu, J.; Li, J.; Qin, K.; Zhou, Z.; Yang, X.; Li, T. Changes in land-uses and ecosystem services under multi-scenarios simulation. Sci. Total Environ. 2017, 586, 522–526. [Google Scholar] [CrossRef]
- Stache, E.; Jonkers, H.; Ottelé, M. Integration of Ecosystem Services in the Structure of the City is Essential for Urban Sustainability. In Ecological Wisdom Inspired Restoration Engineering; Achal, V., Mukherjee, A., Eds.; EcoWISE (Innovative Approaches to Socio-Ecological Sustainability); Springer: Singapore, 2019; pp. 131–150. [Google Scholar] [CrossRef]
- Du, H.; Liu, D.; Lu, Z.; Crittenden, J.; Mao, G.; Wang, S.; Zou, H. Research Development on Sustainable Urban Infrastructure From 1991 to 2017: A Bibliometric Analysis to Inform Future Innovations. Earth’s Future 2019, 7, 718–733. [Google Scholar] [CrossRef] [Green Version]
- Wu, Q.; Hao, J.; Yu, Y.; Liu, J.; Li, P.; Shi, Z.; Zheng, T. The way forward confronting eco-environmental challenges during land-use practices: A bibliometric analysis. Environ. Sci. Pollut. Res. 2018, 25, 28296–28311. [Google Scholar] [CrossRef]
- Castanho, R.A.; Naranjo Gómez, J.M.; Kurowska-Pysz, J. Assessing Land Use Changes in Polish Territories: Patterns, Directions and Socioeconomic Impacts on Territorial Management. Sustainability 2019, 11, 1354. [Google Scholar] [CrossRef] [Green Version]
- Mezősi, G.; Meyer, B.C.; Bata, T.; Kovács, F.; Czúcz, B.; Ladányi, Z.; Blanka, V. Integrated Approach to Estimate Land Use Intensity for Hungary. J. Environ. Geogr. 2019, 12, 45–52. [Google Scholar] [CrossRef] [Green Version]
- Salata, S. Land use change analysis in the urban region of Milan. Manag. Environ. Qual. Int. J. 2017, 28, 879–901. [Google Scholar] [CrossRef]
- Sandru, M.I.V.; Iatu, C.; Sandru, D.C.; Cimbru, D.G. Approaching Land Cover-Land Use Changes Using Statistical Data Validation for Urban Policies Improvement. J. Settl. Spat. Plan. 2017, 8, 119–129. [Google Scholar]
- Petrişor, A.I. Using CORINE data to look at deforestation in Romania: Distribution & possible consequences. INCD URBAN-INCERC Urbanism. Arhitectură. Construcţii 2015, 2015, 83–90. [Google Scholar]
- Gardi, C.; Bosco, C.; Rusco, E.; Montanerella, L. An analysis of the Land Use Sustainability Index (LUSI) at territorial scale based on Corine Land Cover. Manag. Environ. Qual. 2010, 21, 680–694. [Google Scholar] [CrossRef]
- Radović, A.; Bukovec, D.; Tvrtković, N.; Tepić, N. Corine land cover changes during the period 1990-2000 in the most important areas for birds in Croatia. Int. J. Sustain. Dev. World Ecol. 2011, 18, 341–348. [Google Scholar] [CrossRef]
- Feranec, J.; Soukup, T.; Hazeu, G.; Jaffrain, G. European Landscape Dynamics: CORINE Land Cover Data; CRC Press, Taylor & Francis Group: Boca Raton, FL, USA; London, UK; New York, NY, USA, 2016. [Google Scholar]
Figure 1.
Methodology flow chart research.

Figure 2.
Sustainability assessment of local change directions.

Figure 3.
Sustainability assessment of local change directions in big cities.

Figure 4.
Sustainability assessment of local change directions in small towns and suburbs.

Figure 5.
Sustainability assessment of local change directions in rural areas.

© 2020 by the authors. Licensee MDPI, Basel, Switzerland. This article is an open access article distributed under the terms and conditions of the Creative Commons Attribution (CC BY) license (http://creativecommons.org/licenses/by/4.0/).
Share and Cite
MDPI and ACS Style
Gibas, P.; Majorek, A. Analysis of Land-Use Change between 2012–2018 in Europe in Terms of Sustainable Development. Land 2020, 9, 46. https://0-doi-org.brum.beds.ac.uk/10.3390/land9020046
AMA Style
Gibas P, Majorek A. Analysis of Land-Use Change between 2012–2018 in Europe in Terms of Sustainable Development. Land. 2020; 9(2):46. https://0-doi-org.brum.beds.ac.uk/10.3390/land9020046
Chicago/Turabian StyleGibas, Piotr, and Agnieszka Majorek. 2020. "Analysis of Land-Use Change between 2012–2018 in Europe in Terms of Sustainable Development" Land 9, no. 2: 46. https://0-doi-org.brum.beds.ac.uk/10.3390/land9020046
Note that from the first issue of 2016, this journal uses article numbers instead of page numbers. See further details here.