1. Introduction
Nowadays, metallic biomaterials, such as titanium [
1,
2], niobium [
3], zirconium [
4], tantalum [
5], as well as their alloys [
6,
7,
8], are very often used because of their good characteristics, including immunity to corrosion and excellent biocompatibility. In order to improve the biological performance of the material, it is appropriate to use specific surface processing methods. Additional surface electrochemical treatments, such as electropolishing [
2,
3,
9,
10,
11,
12,
13,
14,
15,
16] and plasma electrolytic oxidation [
1,
4,
5,
6] for the metallic surface layer modification, are used in order to improve the tissue implant connection. In addition, it should be noted that, in order to protect the tissue against infection, the silver [
17,
18,
19,
20] or copper [
21,
22,
23] ions are implemented into the surface layer.
Many of the previous studies of PEO have been carried out on titanium under a relatively wide range of conditions for the preparation of the coatings. They are: different electrical regimes, treatment times and electrolyte compositions. The most common electrolytes used for plasma electrolytic oxidation of titanium are: phosphoric and sulfuric acids [
24], sodium metasilicate pentahydrate [
25], silicon acetate within Ca-β-glycerophosphate and NaOH [
26], Ca-β-glycerophosphate and calcium acetate [
27], potassium phosphate with potassium hydroxide [
28], potassium pyrophosphate and potassium hydroxide [
28], calcium glycerophosphate with calcium acetate [
29], tripotassium phosphate and potassium hydroxide with and without monoclinic zirconia powder [
30], sodium silicate with phosphoric acid and potassium hydroxide [
31], tungstosilicic acid [
32], ethylene diamine tetraacetic acid disodium with calcium oxide and calcium dihydrogen phosphate and sodium metasilicate nonahydrate [
33], sodium phosphate with hydrated sodium borate and sodium tungstate dihydrate and iron(III) oxalate [
34], sodium hydroxide with monosodium dihydrogen orthophosphate with and without Cu nanoparticles [
35], β-glycerophosphate disodium salt pentahydrate with calcium acetate hydrate [
36], calcium acetate hydrate with disodium hydrogen phosphate anhydrous [
37]. On the other hand, it must be pointed out that the current used for that treatment may be direct [
24,
25,
26,
27,
28,
29,
32,
34,
35,
36] or alternating [
30,
31], as well as pulsed [
33,
37,
38] current.
This work has been performed to reveal a new method of electrochemical surface treatment allowing for an improved biocompatibility of the treated biomaterial. For the studies, a plasma electrolytic oxidation (PEO) technology was used to treat titanium of a commercial purity. Such an obtained surface layer was investigated by means of Scanning Electron Microscopy (SEM), Energy Dispersive X-ray Spectroscopy (EDS), and X-ray Photoelectron Spectroscopy (XPS) methods.
3. Results
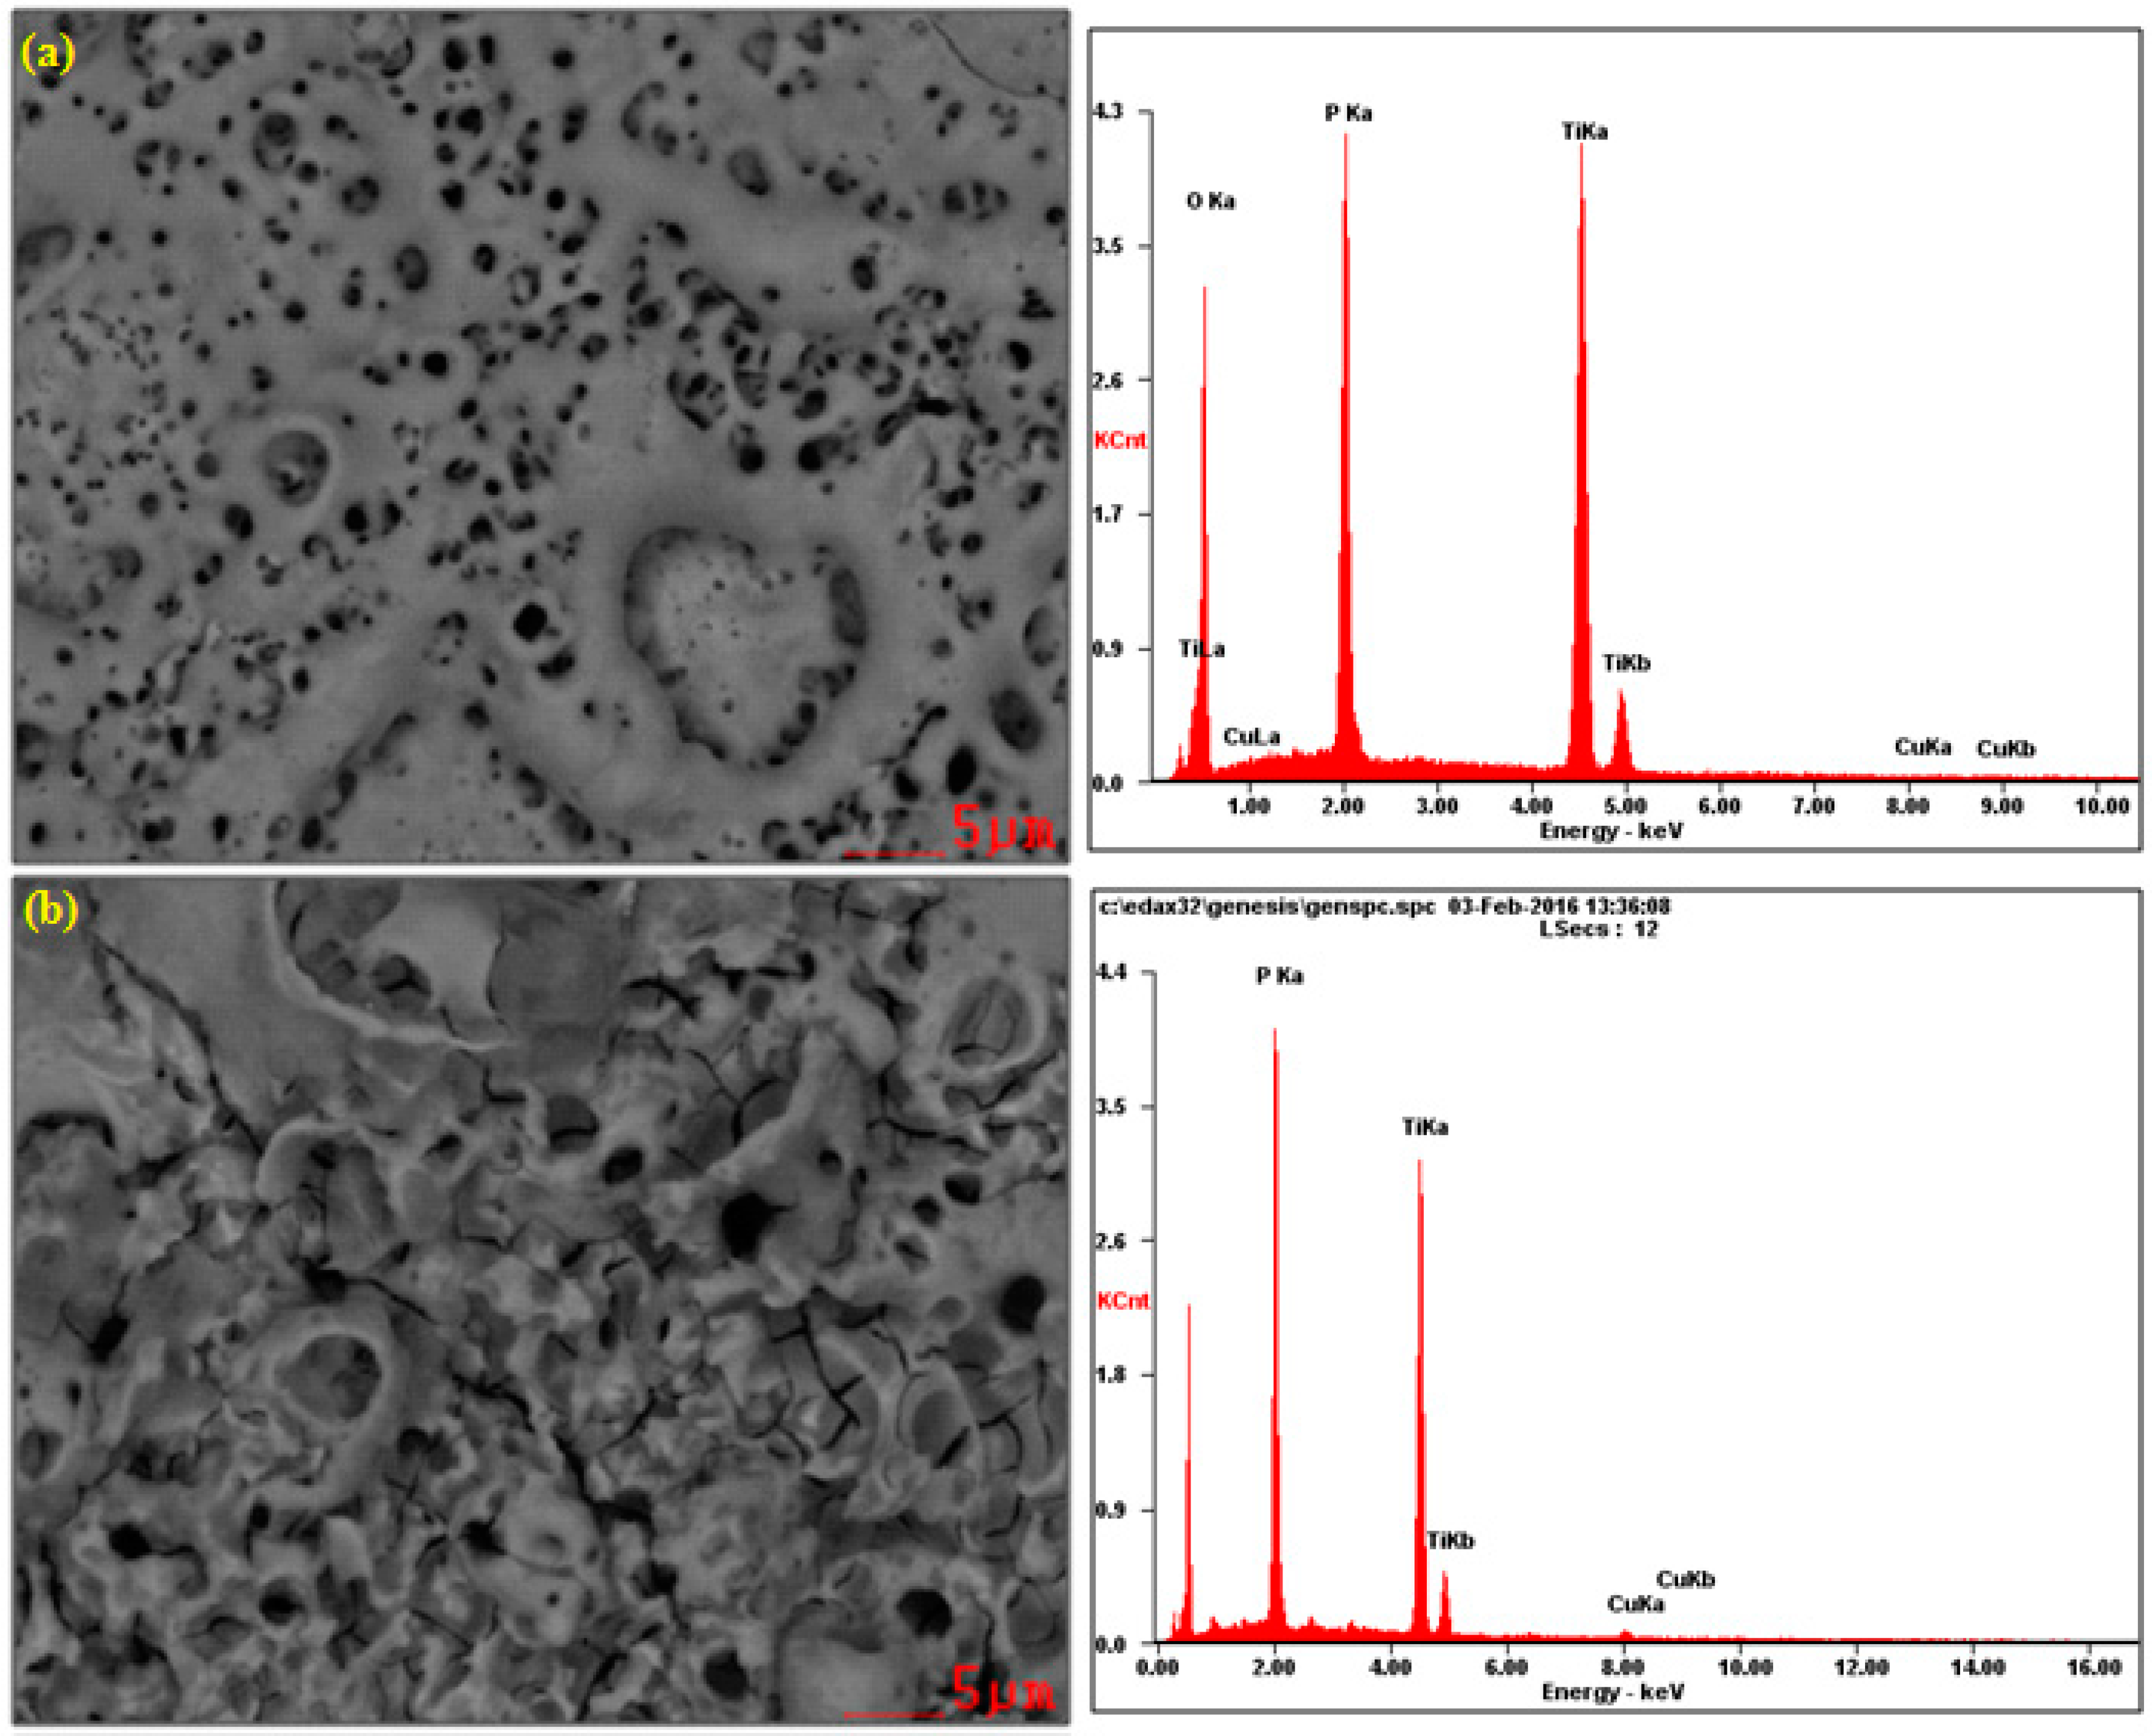
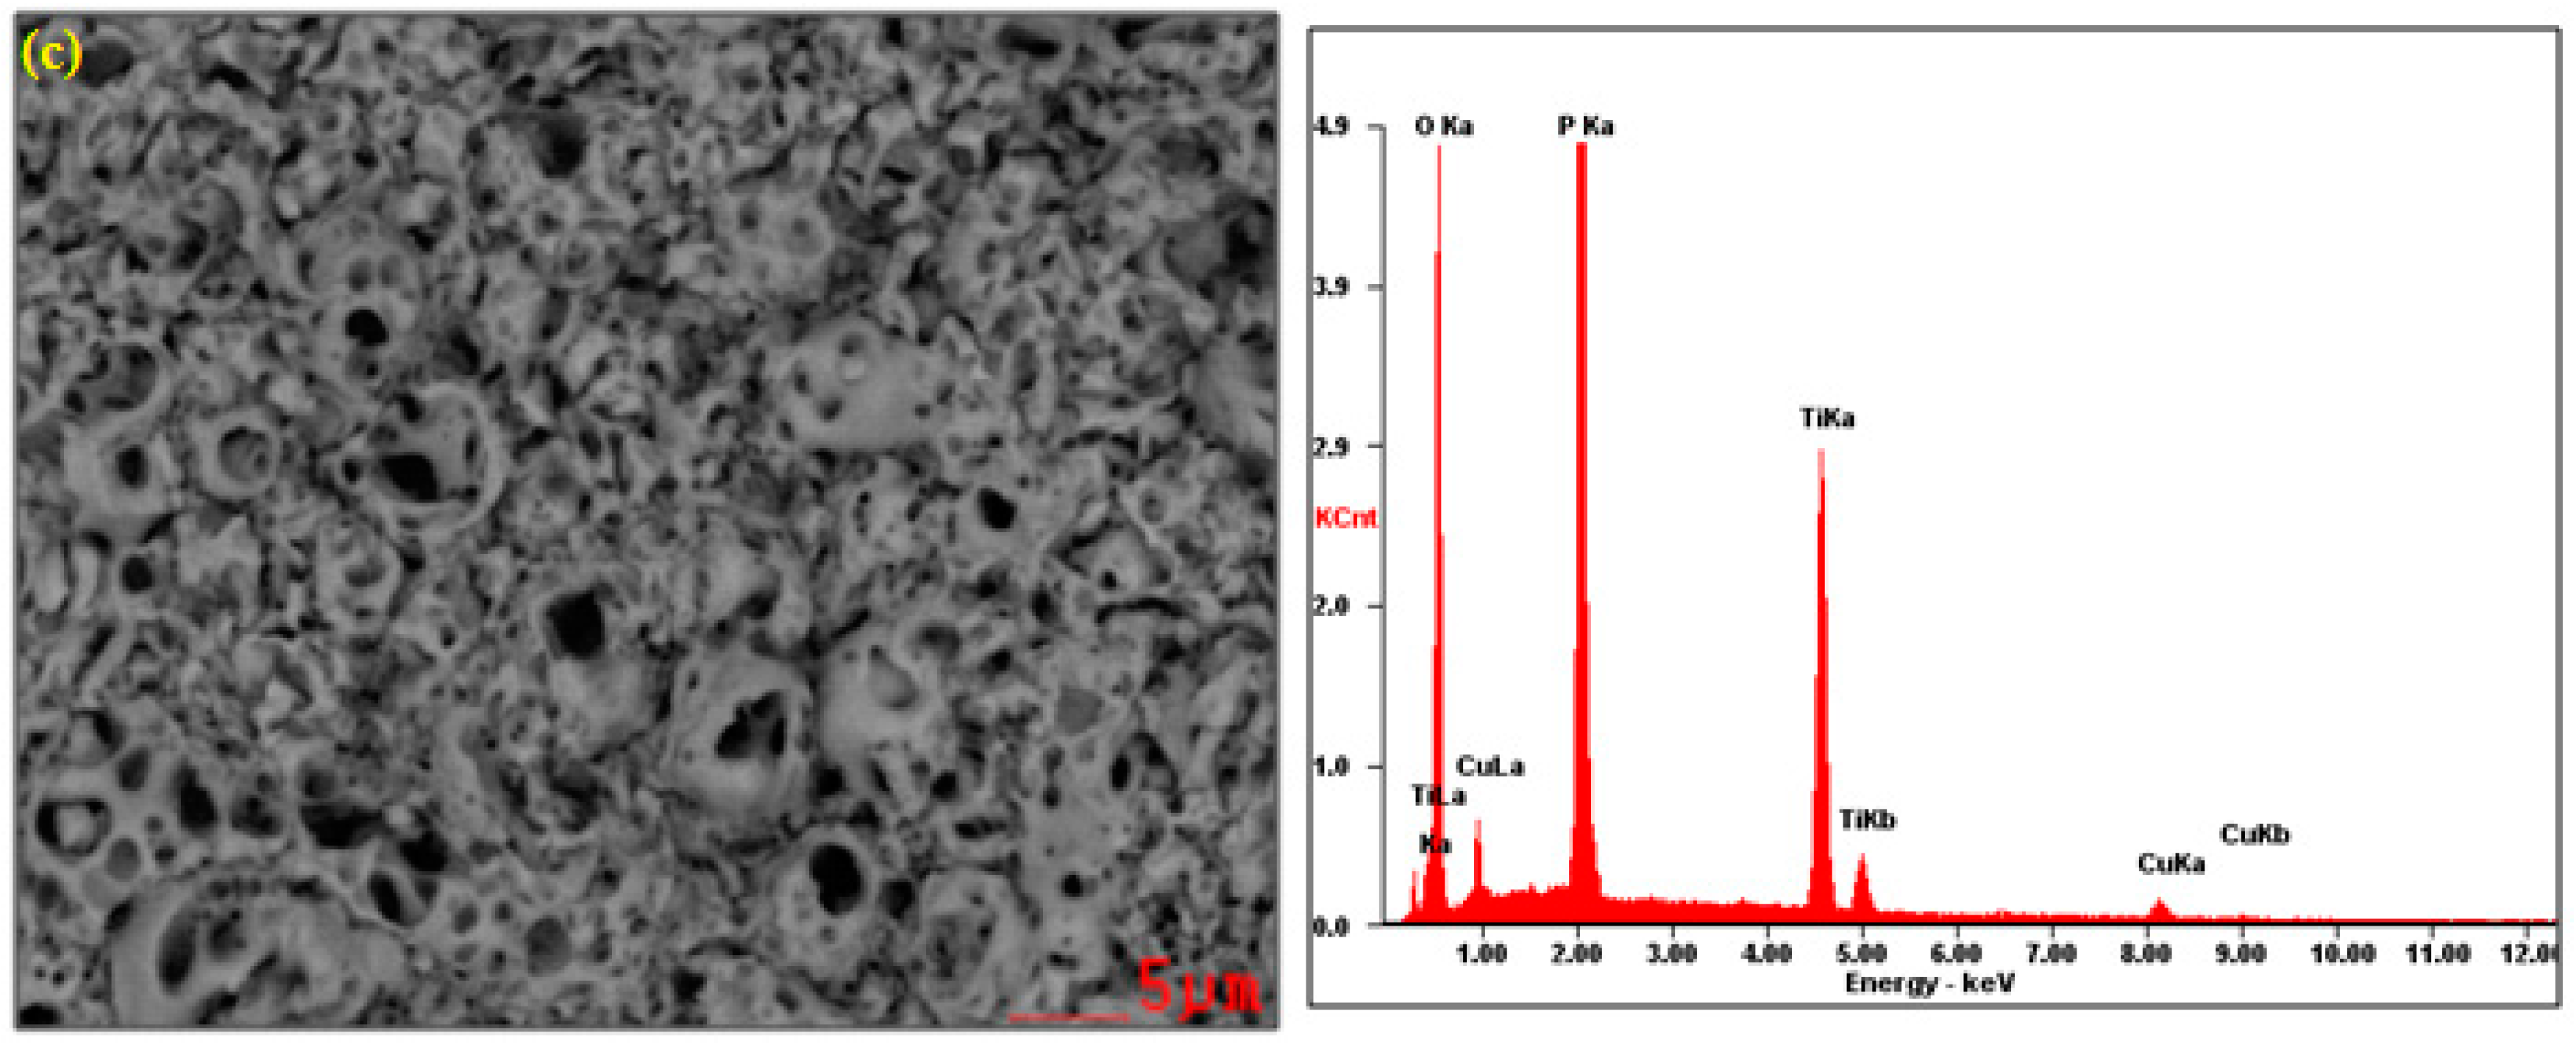
In
Figure 1, the SEM and EDS results of the surface layer formed on titanium after PEO at the voltage of 450 V in electrolyte consisting of 1 L H
3PO
4 with the addition of (1) 10 g/L; (2) 300 g/L and (3) 600 g/L of Cu(NO
3)
2 are presented. All SEM photos show that the obtained surfaces are porous. Additionally, on the surface treated in the electrolyte consisting of 300 g/L of copper nitrate, the cracks in the surface layer are visible beyond the pores, which may be indicative of too rapid growth in volume of the layer. Interestingly, the increasing of the copper nitrate up to 600 g/L does not result in such cracks. Most likely, the copper ions inserted in the porous phosphorus-oxygen-titanium structure create the original modified surface layer. On the basis of EDS peaks, it can be concluded that, with the increase of copper nitrate in concentrated phosphoric acid, the amount of titanium in the surface layer decreases, whereas the increase of phosphorus and copper amounts is observed.
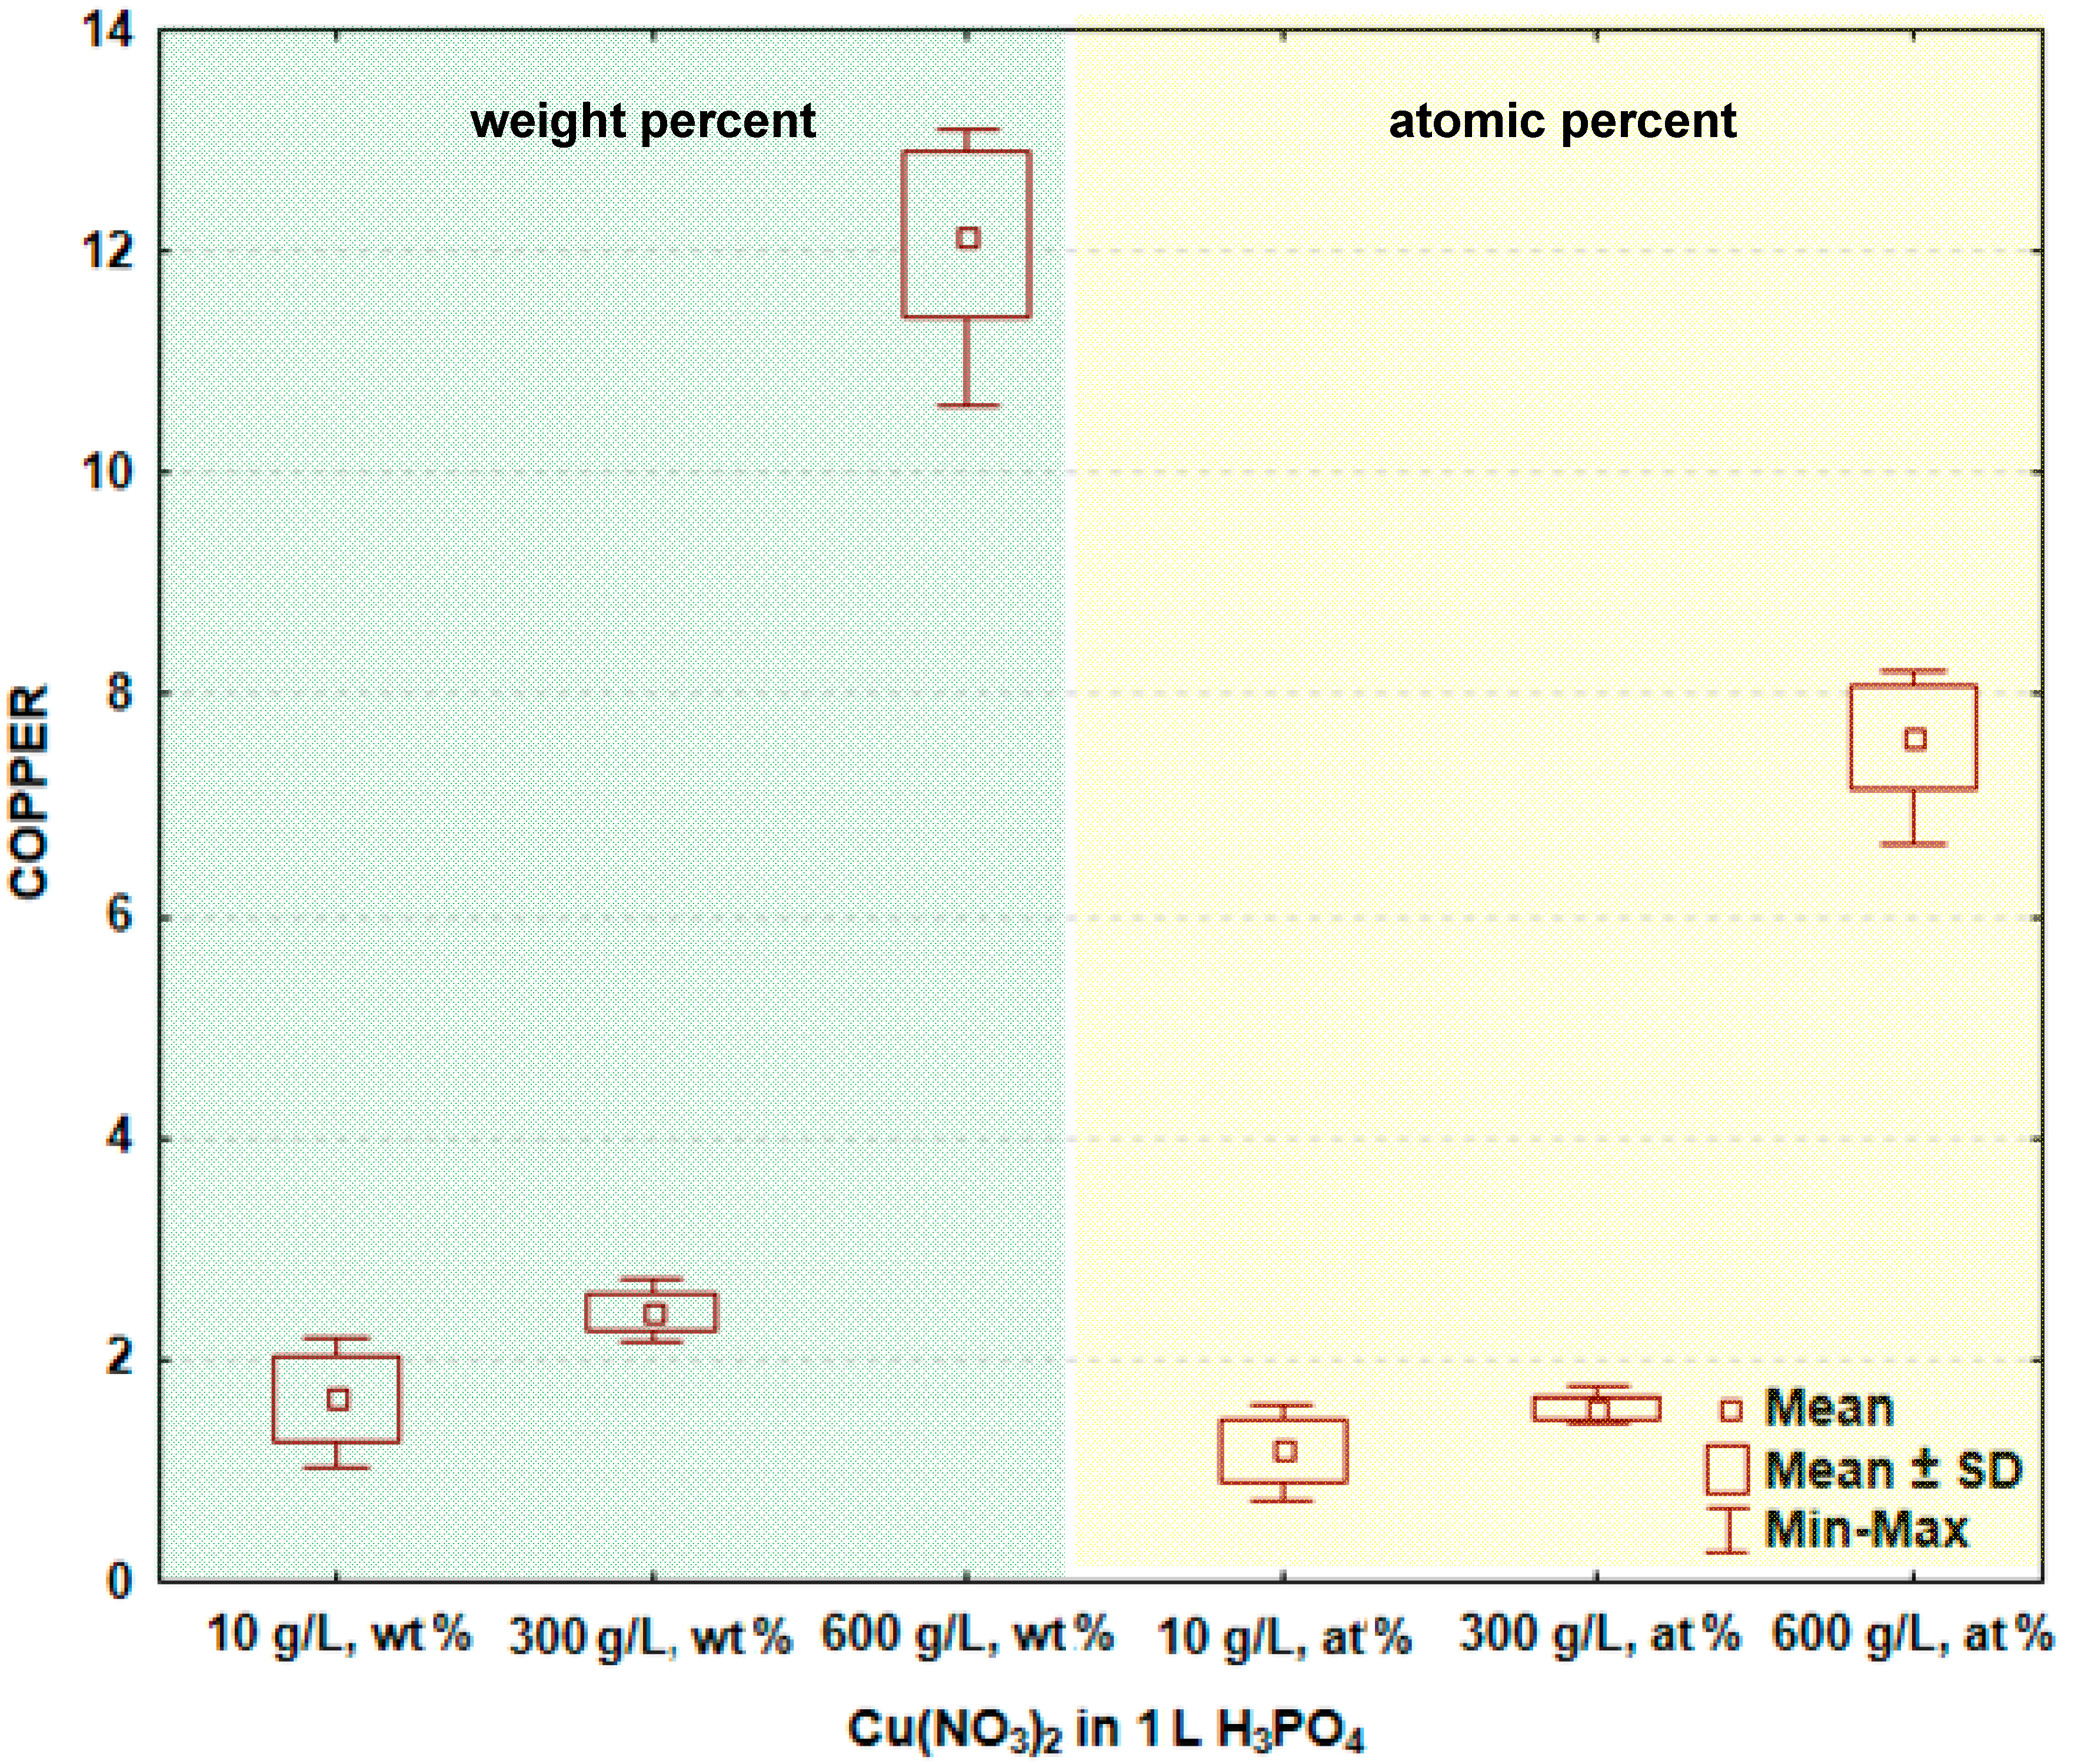
In
Figure 2 and
Table 1, the box and whisker plots with the descriptive statistics of the amount of copper in the surface layer formed on titanium after PEO are presented, respectively. One may notice that the copper amount in the surface layer increases with increasing the content of copper nitrate in the electrolyte. The minimum amount of copper in the surface layer was detected after the PEO performed in the electrolyte containing 10 g/L Cu(NO
3)
2 and was equal to 1.7 ± 0.4 wt % (1.2 ± 0.3 at %), and the maximum was found in the electrolyte containing 600 g/L Cu(NO
3)
2 in H
3PO
4, and equaling 12.2 ± 0.7 wt % (7.6 ± 0.5 at %). The significance tests in Statistica software (Version 10) [
39] for all data were performed and show that the amounts of copper in the surface layer formed on titanium after PEO in the electrolytes containing various amounts of copper nitrate belong to different data populations. Therefore, it is possible to conclude that there are significant differences in the copper amount in the passive layer between the treated samples.
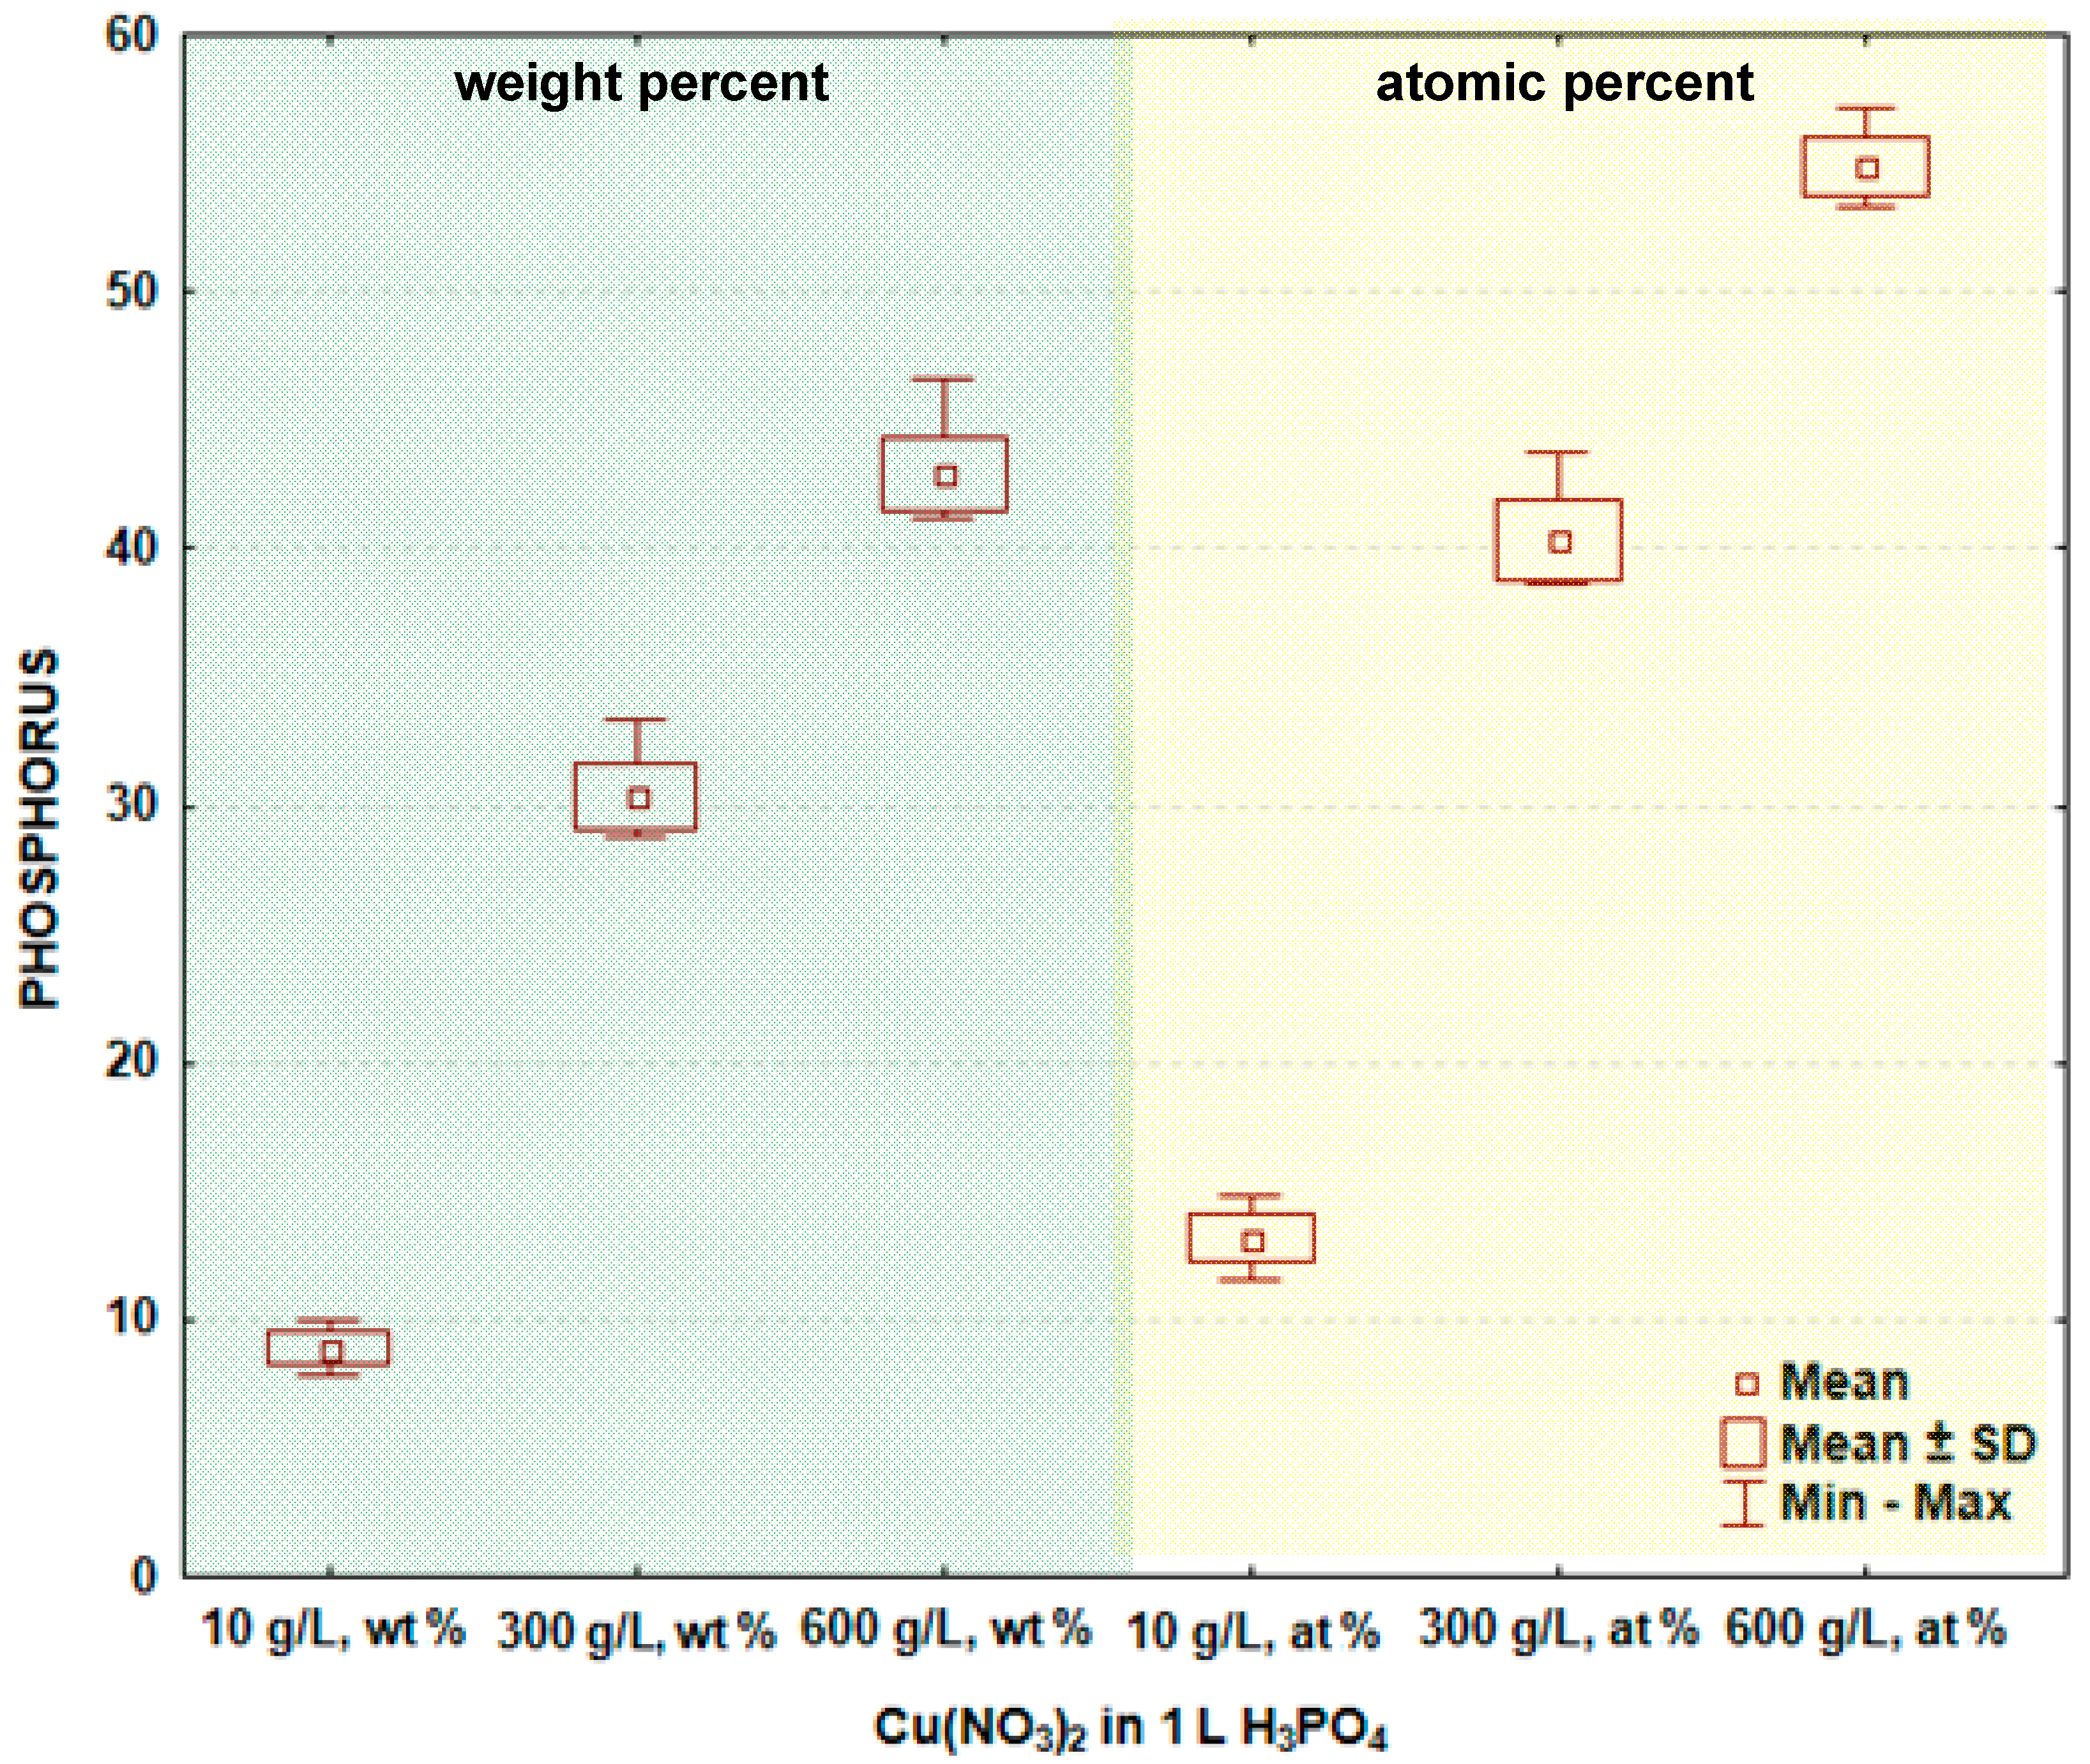
In
Figure 3 and
Table 2, the box and whisker plots with the descriptive statistics of the amount of phosphorus in the surface layer formed on titanium after PEO are shown, respectively. It is visible that the phosphorus amount (similar as copper) increases with the increase of the copper nitrate in the electrolyte. The minimum amount of phosphorus in the surface layer was detected after the PEO performed in the electrolyte containing 10 g/L Cu(NO
3)
2 and was equal to 8.9 ± 0.6 wt % (13.2 ± 0.9 at %), and the maximum was found for 600 g Cu(NO
3)
2 in 1000 mL H
3PO
4, equaling 42.9 ± 1.4 wt % (54.9 ± 1.1 at %). The significance tests presented in
Table 2 show that the amounts of phosphorus in the surface layer formed on titanium after PEO in the electrolytes containing various amounts of copper nitrate belong to different data populations. Following that, it is possible to conclude that there are significant differences in the phosphorus amount in the passive layer between the treated samples. The study shows that the increasing concentration of copper nitrate in the phosphoric acid results in the increase of both copper, as well as phosphorus in the surface layer. These phenomena can be explained by the formation of chemical compounds between titanium, phosphorus, copper and oxygen, which are insoluble in the concentrated phosphoric acid.
In
Figure 4 and
Table 3, the box and whisker plots with the descriptive statistics of the amount of titanium in the surface layer formed on titanium after PEO are given, respectively. The maximum amount of titanium in the surface layer was detected after the PEO done in the electrolyte containing 10 g/L Cu(NO
3)
2 and was equal to 89.4 ± 0.9 wt % (85.6 ± 1.1 at %), whereas the minimum was found at 600 g/L Cu(NO
3)
2, equaling to 42.2 ± 1.5 wt % (37.5 ± 1.4 at %). This may suggest that for 10 g/L Cu(NO
3)
2 in one liter of phosphoric acid, the coating is much thinner than the one formed in the electrolyte within 600 g/L of copper nitrate. The significance tests presented in
Table 3 show that the amounts of oxygen in the surface layer formed on titanium after PEO in the electrolytes containing various amounts of copper nitrate mostly do not belong to different data populations. That finding allows for the conclusion that generally, there are no significant differences in the oxygen amounts in the passive layer between the treated samples.
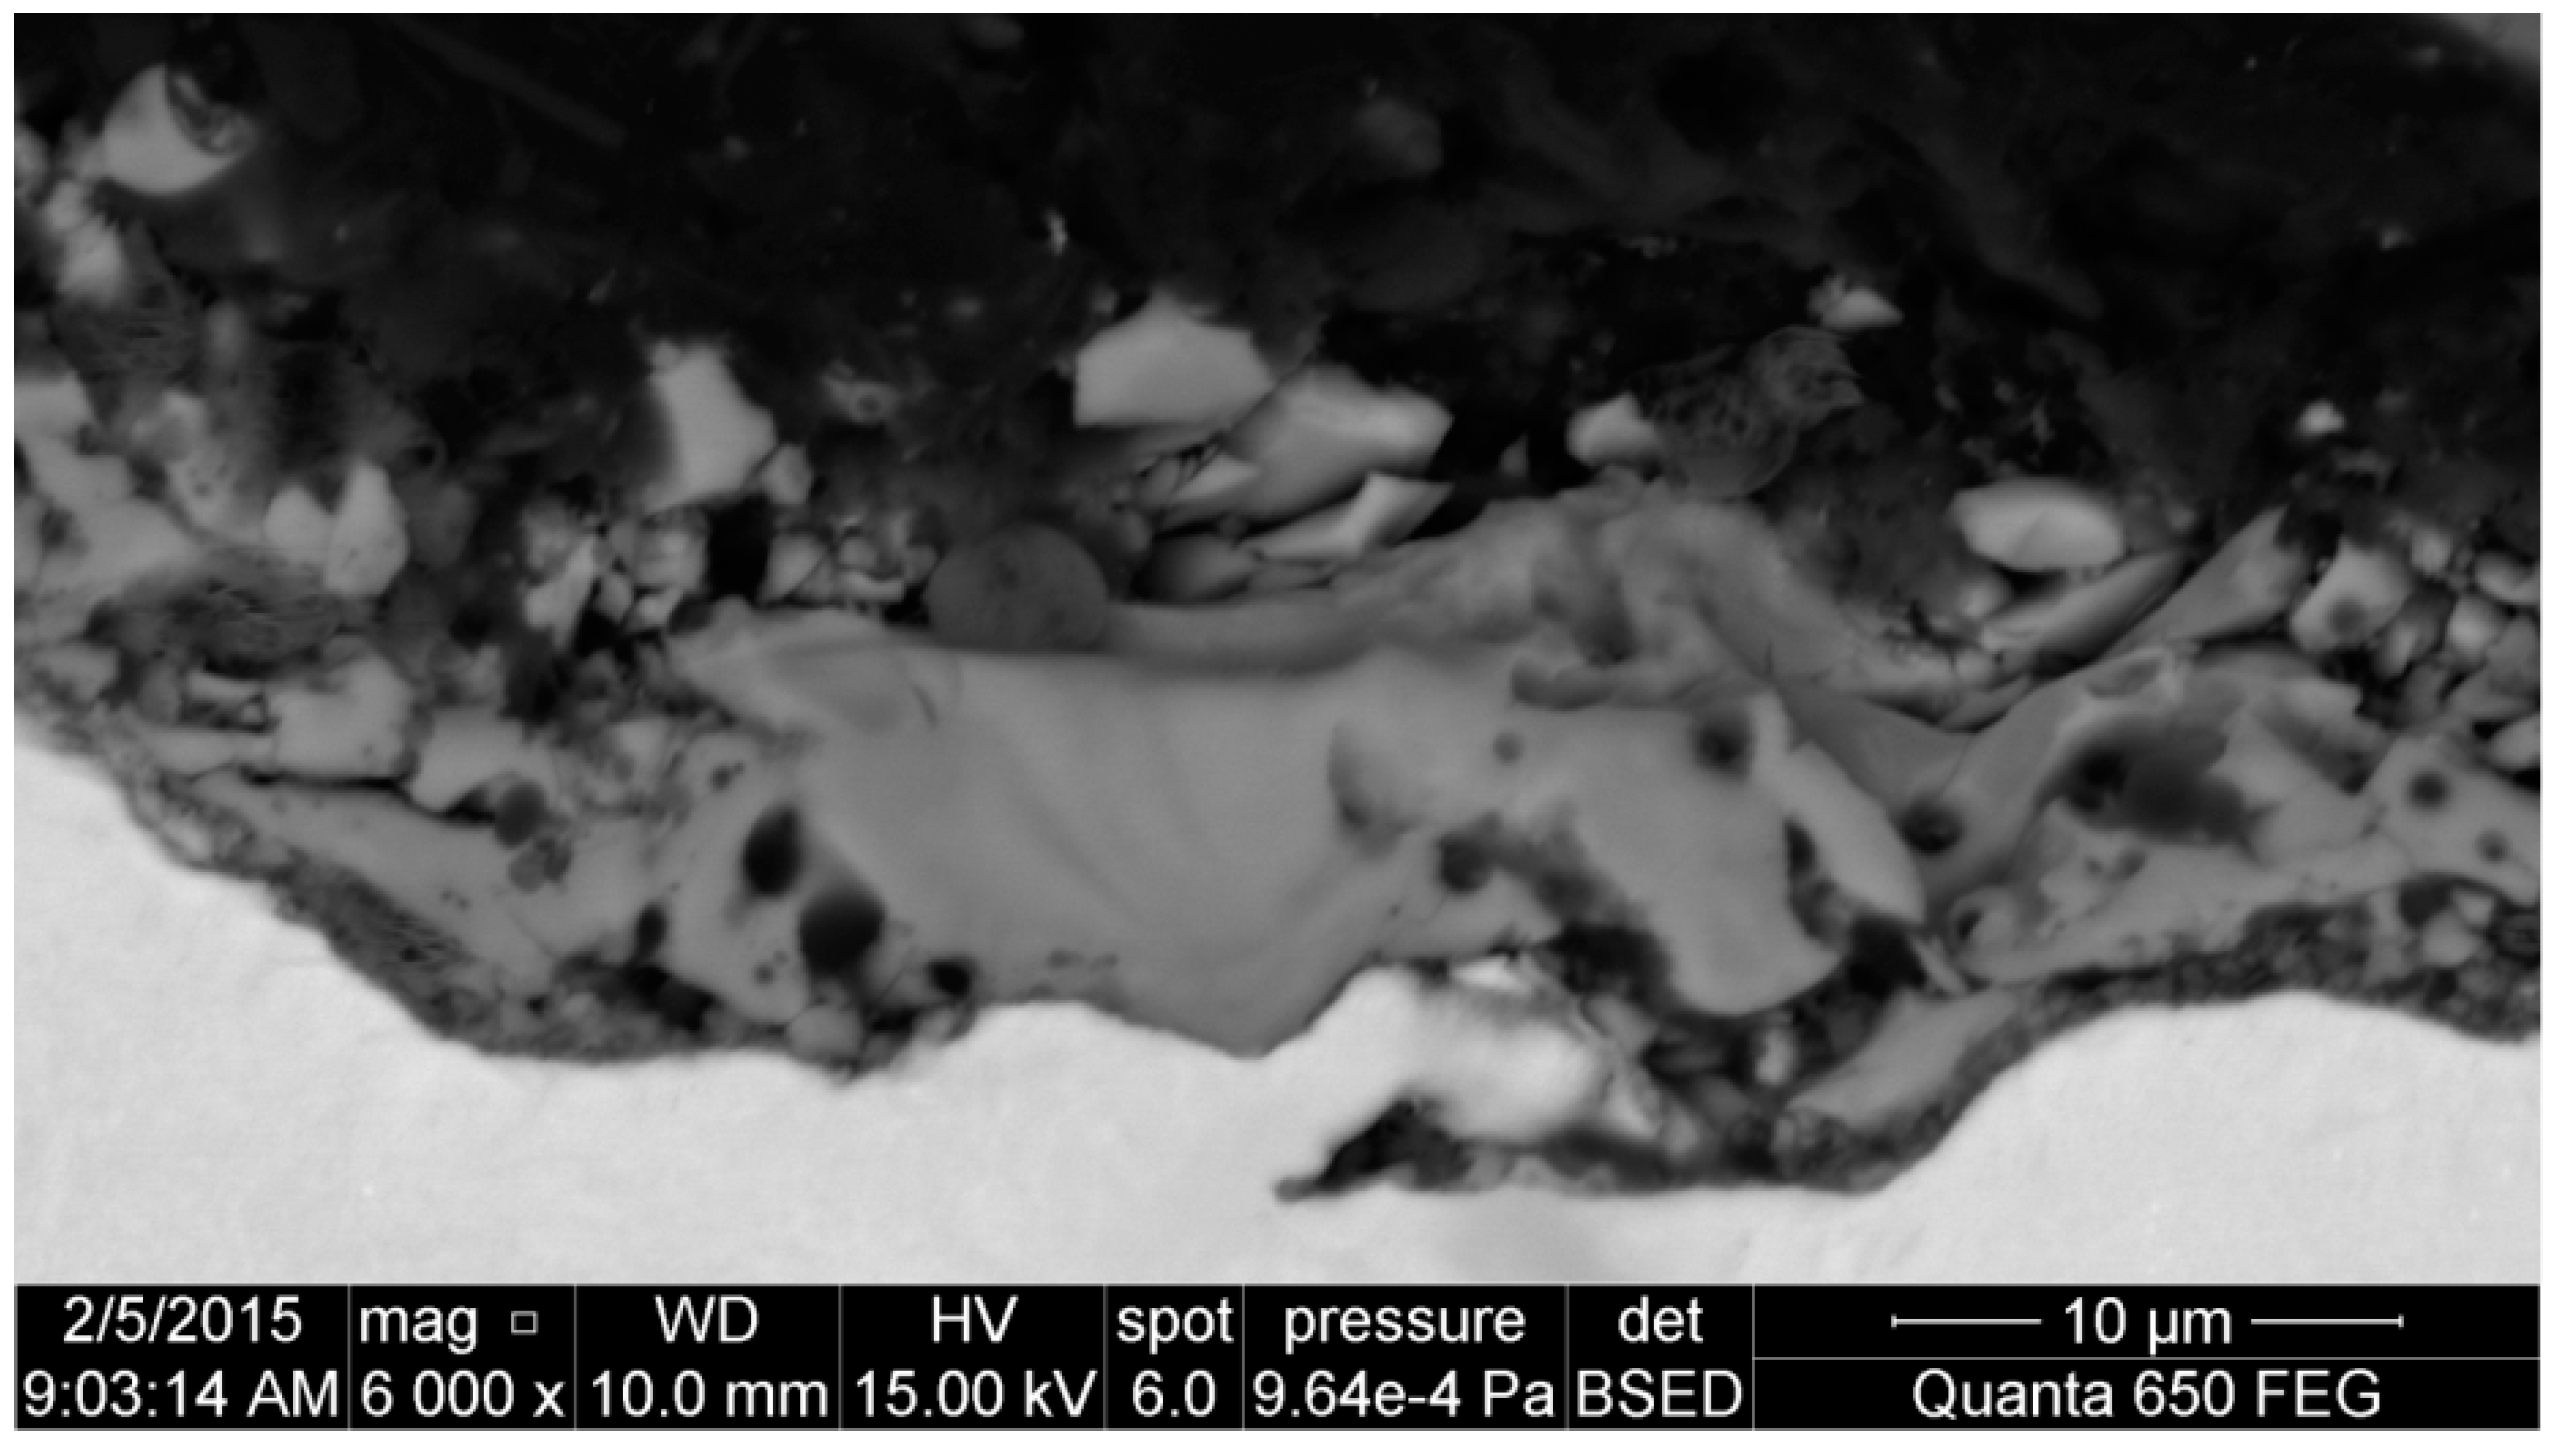
For example,
Figure 5 presents a cross-section of the surface layer obtained on pure titanium after PEO at the potential of 450 V in the electrolyte consisting of 300 g of copper nitrate dissolved in 1000 mL of concentrated phosphoric acid (98 g/mol). One may easily notice that the obtained surface layer is heterogeneous and porous, and its thickness is equal to about 10 μm. Additionally, one may presume that it is more biocompatible than a pure titanium surface and can be used as a transition layer between the titanium biomaterial and tissue.
To find out the chemical composition of coatings formed during the PEO process, the XPS measurements were performed. With the help of that method, the oxidation stages of inter alia titanium, phosphorus and copper were possible to find.
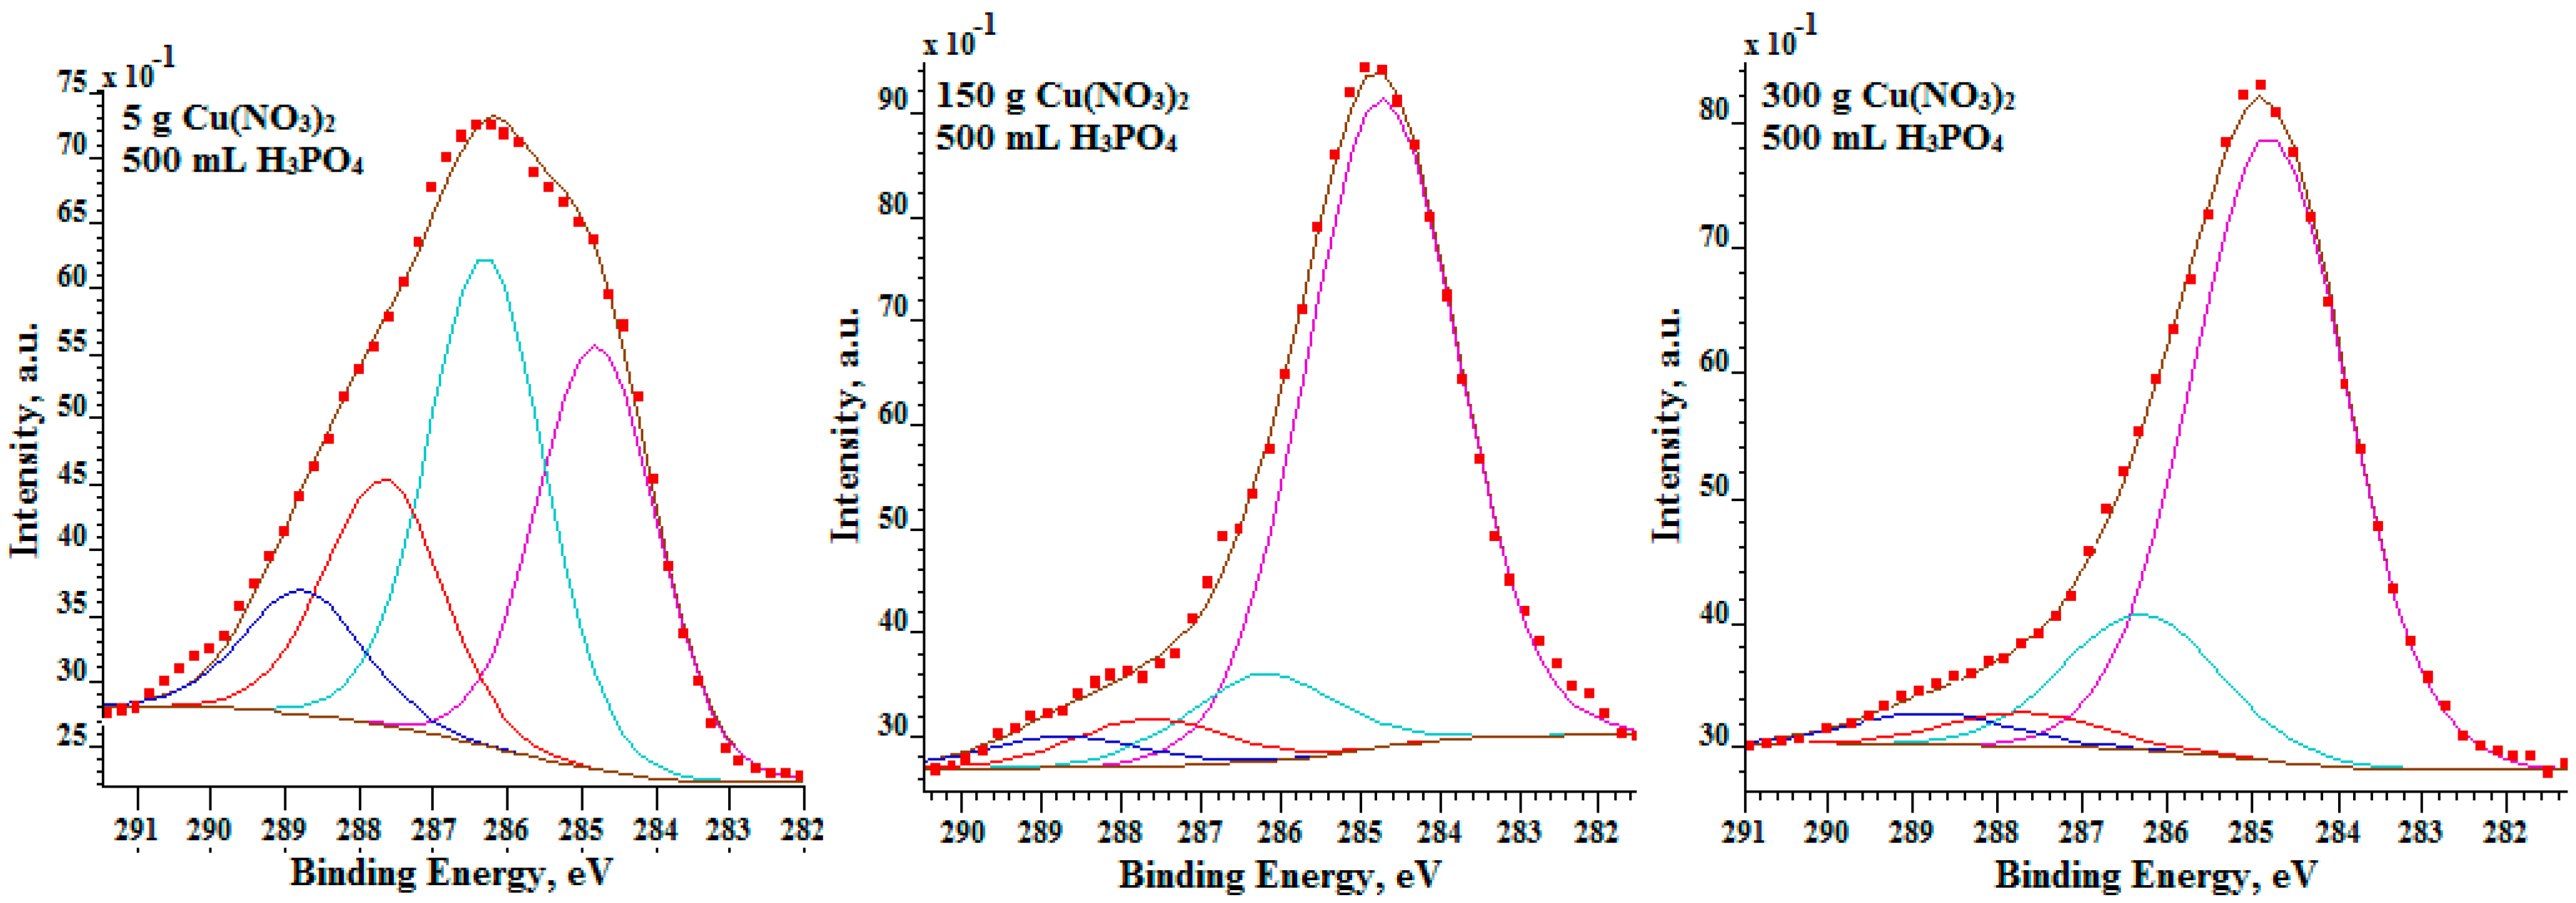
In
Figure 6, the fittings of C 1s spectra are shown. With this analysis, it is possible to determine how much oxygen is bound to the carbon contamination nano-layer and how much of this is bound with other chemical elements of the passive surface layer. All C 1s spectra were deconvoluted by four peaks: C–C/C–H (284.8 eV), C–O–H/C–O–C (286.3 eV), C=O (287.7 eV), O–C=O (288.8 eV). On the basis of the obtained results, it was possible to separate oxygen bonded with carbon (contamination carbon layer) and with the chemical elements contained in the passive layer.
In
Table 4, there are enlisted results of the passive PEO layer obtained on pure CP titanium after the electrochemical plasma oxidation (PEO) in the electrolyte consisting of Cu(NO
3)
2 and H
3PO
4. It was found that in the PEO layer (of about 10-µm thick), mainly the titanium-copper phosphate compounds are visible. Assuming that all of the oxygen in the passive layer is bonded with phosphorus to form phosphates, then one may presume that not all of the phosphorus was used. In all of the PEO layers, a minimum of 7 at % of the phosphorus, which was not bonded with the oxygen, was found. Hence, the phosphorus must form anaerobic compounds with the titanium or copper. Based on
Table 4, it can be noticed that the amount of copper in the PEO layer increases very slowly, but regarding the bactericidal properties, its amount is quite satisfactory. It should be noted that the XPS measurements allow one to study only the first 10 nm of the PEO layer; however, in accordance with the recent results revealed in [
1], its thickness may be of a few micrometers.
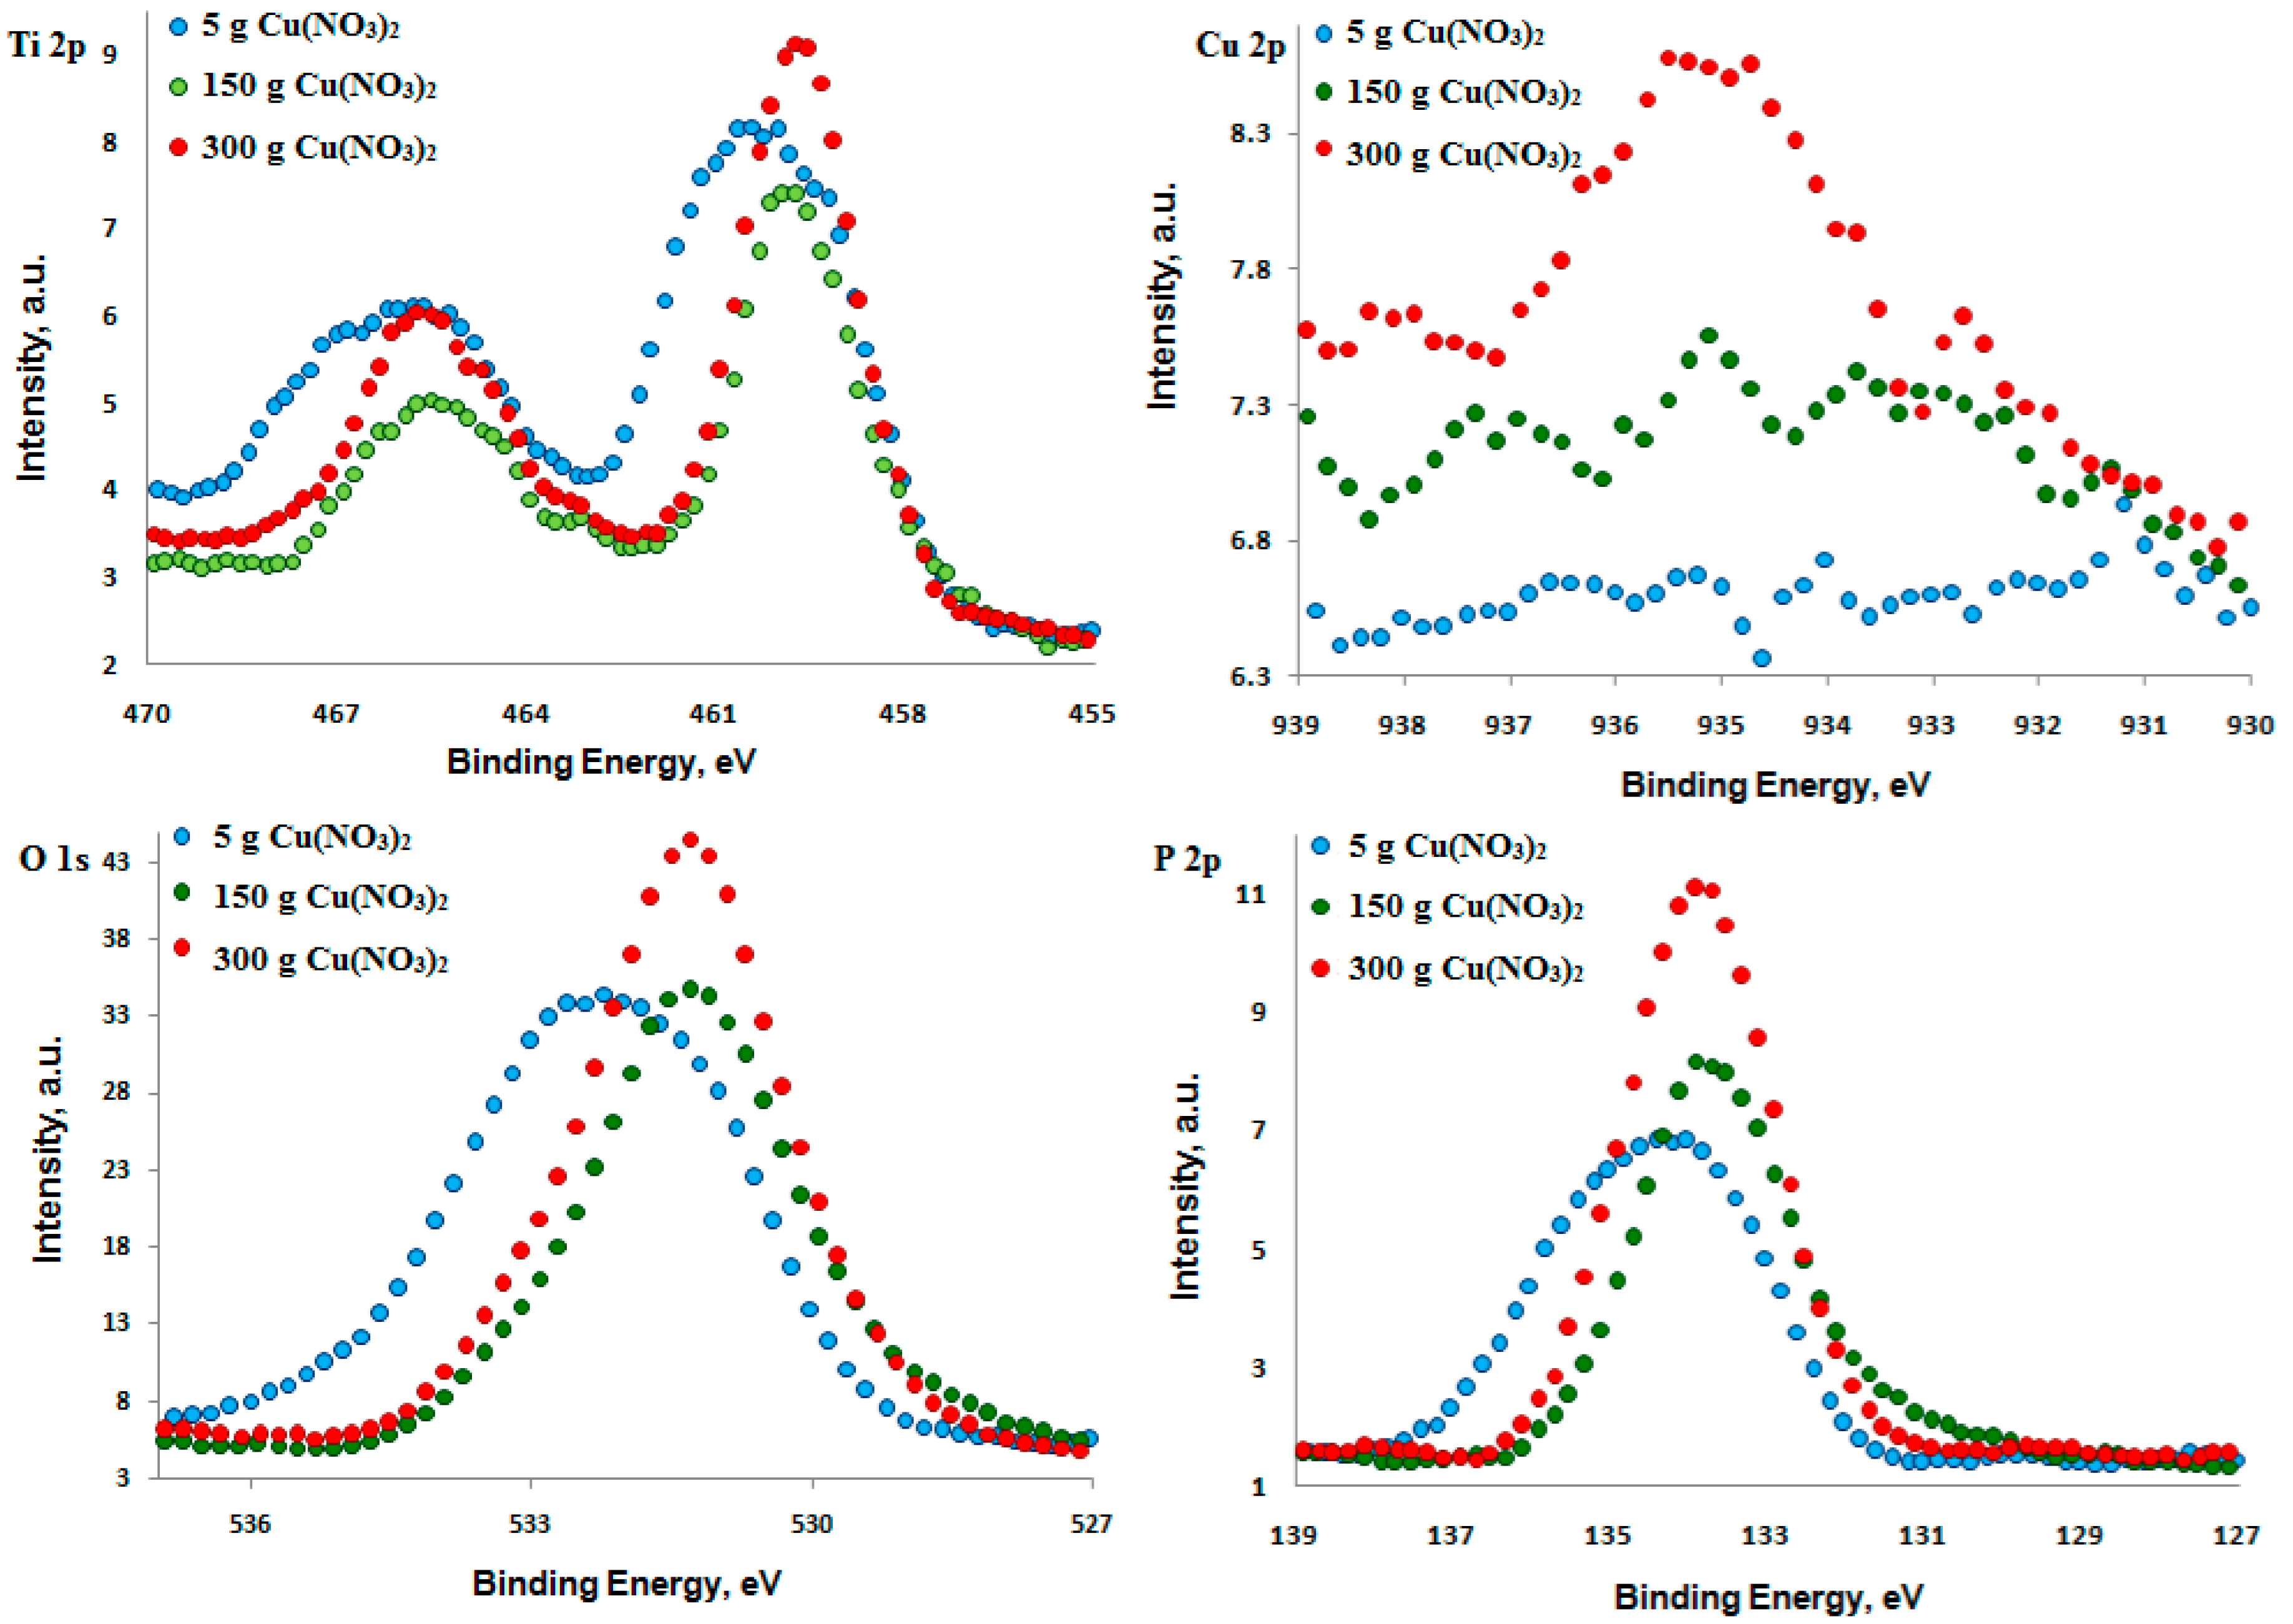
In
Figure 7, the XPS high resolution spectra of titanium (Ti 2p), copper (Cu 2p), oxygen (O 1s) and phosphorus (P 2p) are presented. Concerning these results, it is possible to predict, with a high probability, what chemical compounds of titanium were formed after the PEO treatment. The P 2p spectra indicate that in the surface layer formed after the electrochemical PEO treatment with the addition of 300 g/L and 600 g/L Cu(NO
3)
2 to 1 L H
3PO
4, the highest/main peak has binding energy equal to about 133.9 eV, suggesting the presence of phosphates (PO
43−) in the studied surface layer. In the case of oxidation in the electrolyte containing 10 g/L Cu(NO
3)
2 in 500 mL H
3PO
4, apart from PO
43−, an additional peak is visible, whose binding energy is about 135.2 eV. That can suggest the presence of H
3PO
4 acid molecules in the surface layer. In the case of Ti 2p
3/2 spectra, the maximum binding energies are noted in the points 460.4 eV, 459.9 eV, 459.6 eV referred to 10 g/L, 300 g/L, 600 g/L Cu(NO
3)
2 in 1000 mL H
3PO
4, respectively. The Ti 2p
3/2 spectrum combined with P 2p spectrum can suggest that the titanium detected in the surface layer is on the fourth oxidation stage and most likely appears as the Ti
3(PO
4)
4∙nH
3PO
4 compound. After the PEO oxidation in the electrolyte containing lower contents of the copper nitrate (10–300 g/L) in the phosphoric acid (1000 mL), the XPS signal of Cu 2p from the surface layer is on the noise level. Only by increasing the amount of the copper nitrate up to 600 g per 1000 mL of phosphoric acid, a distinct spectrum of Cu 2p was recorded.
In the case of a low signal-to-noise ratio,
i.e., three for nine sweeps (
Figure 8), the authors decided to repeat XPS high resolution scans for the Cu 2p
3/2 region with 36 sweeps (signal-to-noise ratio equals six). Based on the obtained results, which are depicted in
Figure 8, it should be noted that for the lowest amount of copper nitrate (10 g/L) in phosphoric acid, the signal is still very noisy; hence, it was not possible to perform the correct fitting.
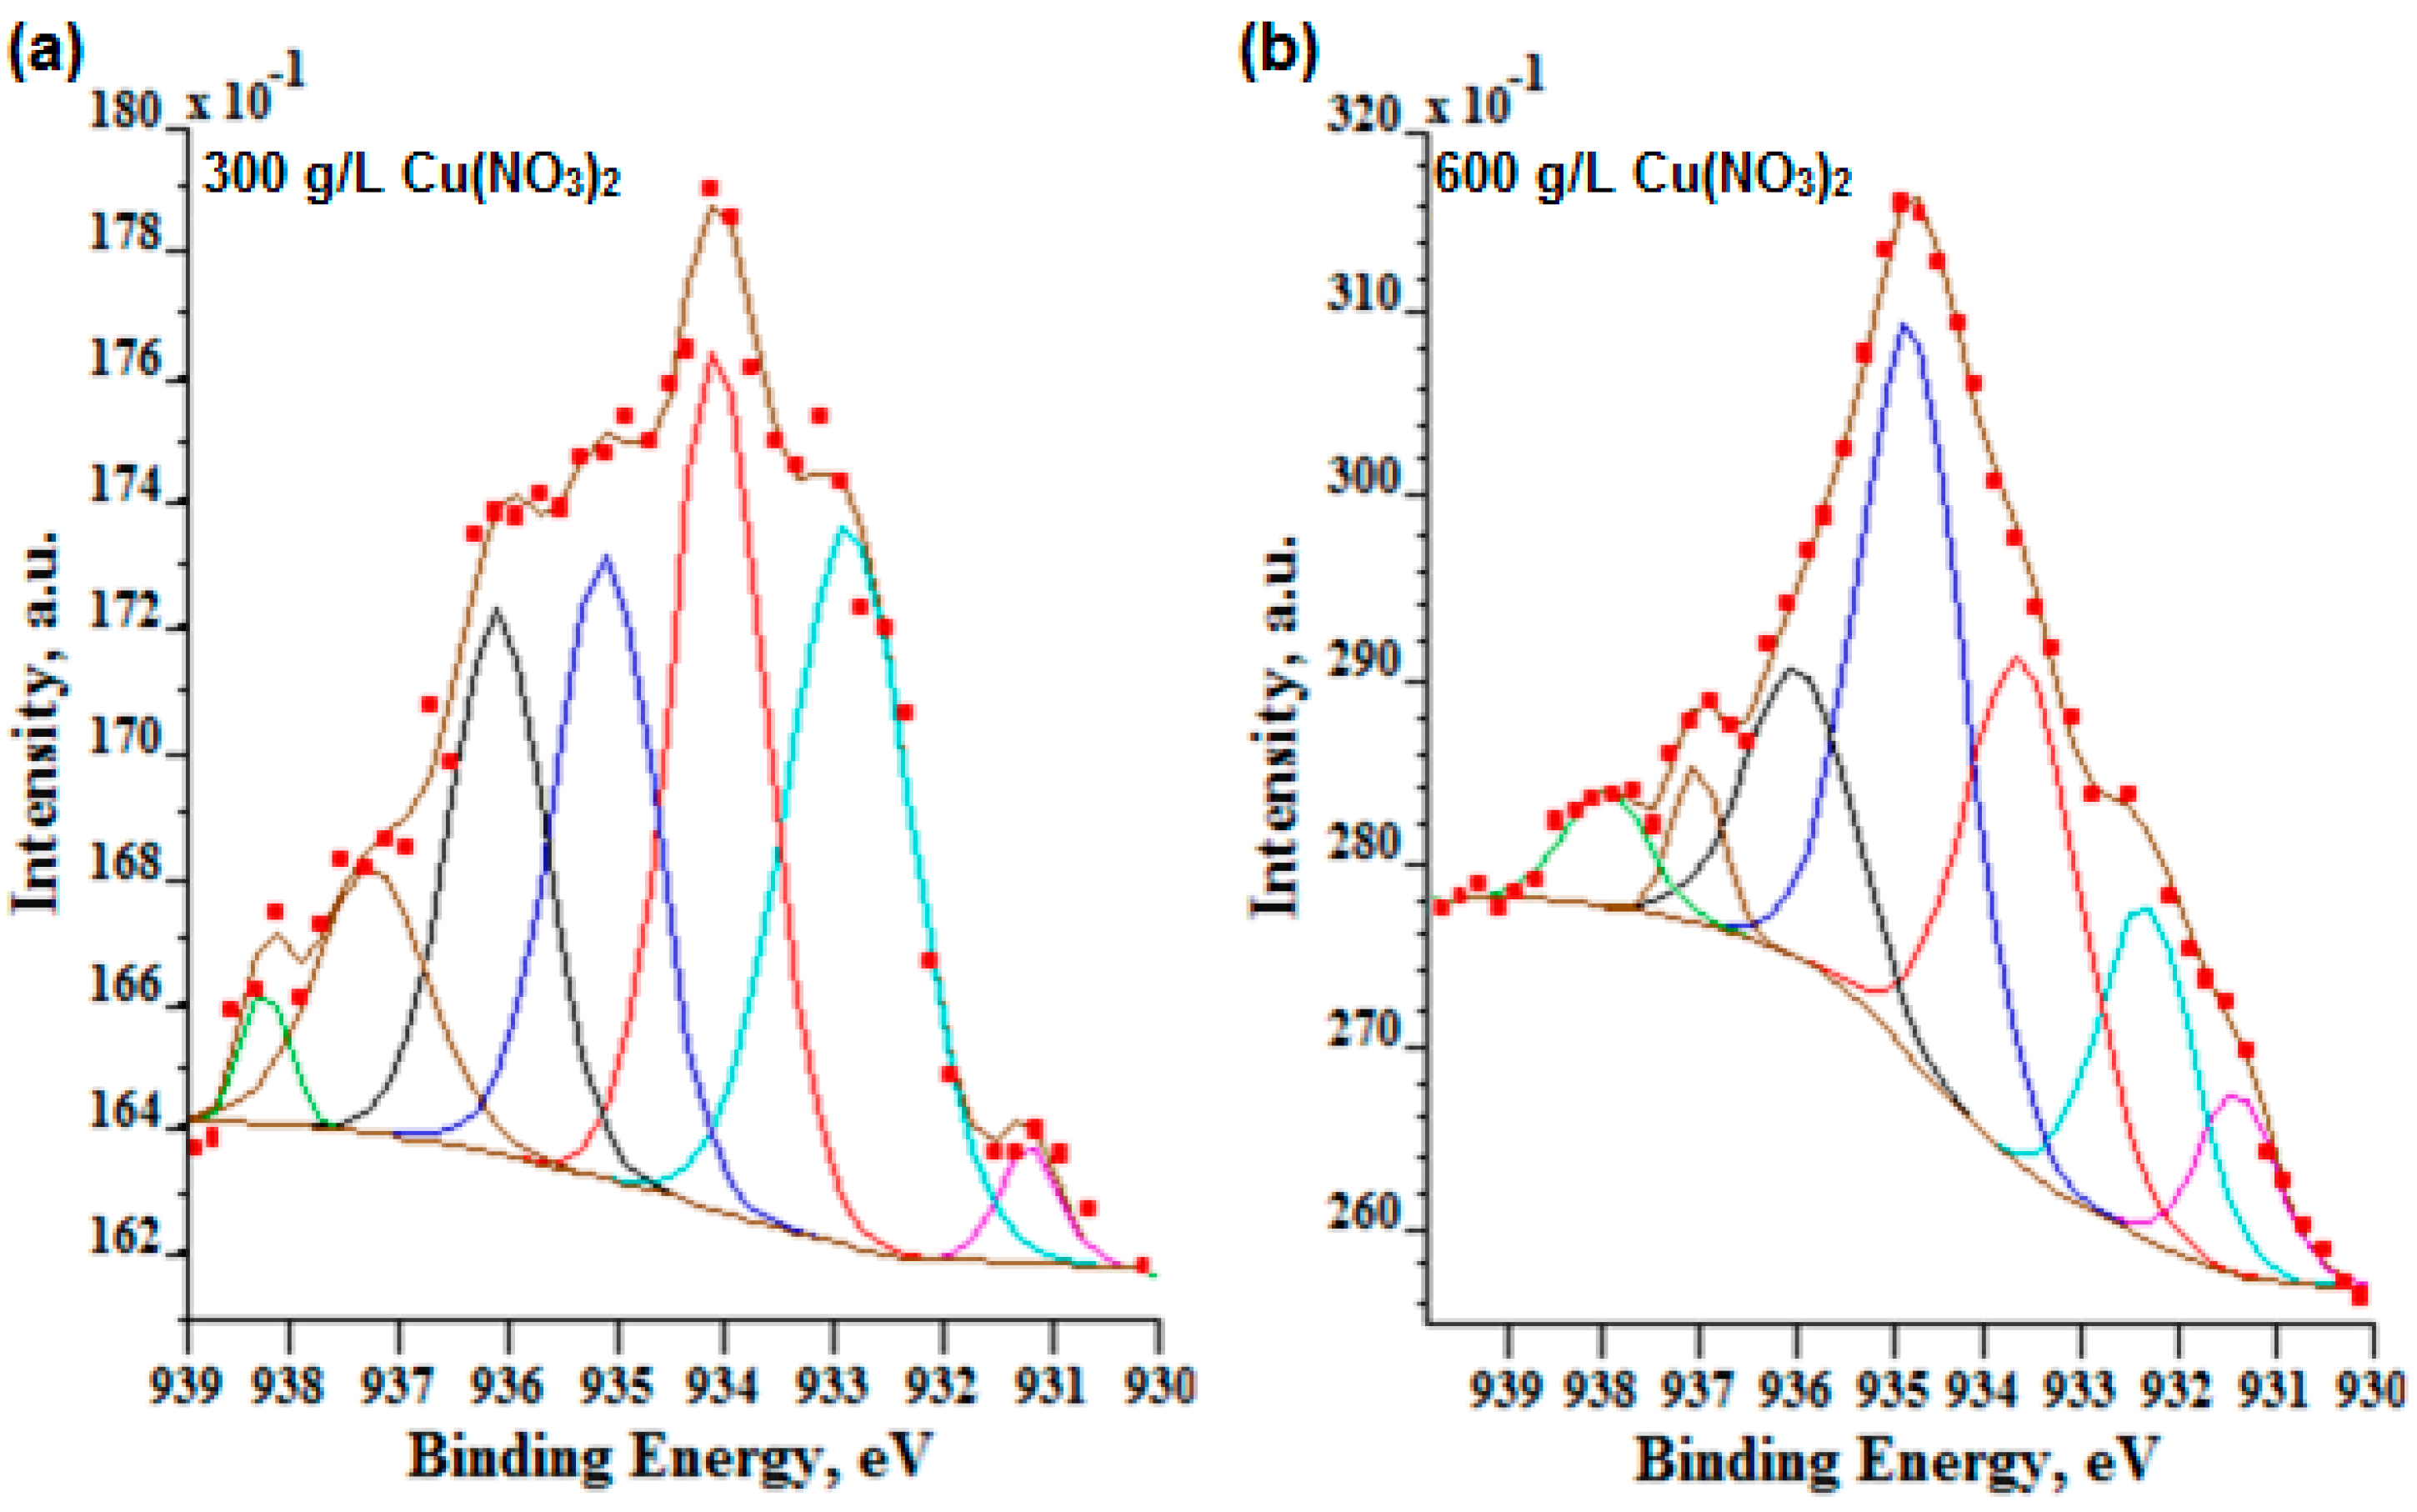
In
Figure 8 and
Table 5, the high resolution Cu 2p
3/2 spectra for two high signals (300 g and 600 g of Cu(NO
3)
2 per 1000 mL H
3PO
4) are presented. The two first peaks at 932.3 eV and 932.9 eV (
Figure 8a) and 932.4 eV (
Figure 8b) and for both analyzed electrolytes can be interpreted most likely as CuP
2 and Cu
2O, respectively. Other peaks of the ingrown energies are also responsible for the presence of Cu
2+,
i.e., 933.6, 934.1 eV are responsible mostly for CuO; 934.8, 935.1, 936.1, 937.2, 938.1 eV peaks may be responsible for the presence of Cu
2+, most likely as the CuO∙Cu
3(PO
4)
2∙nH
3PO
4 compound in the PEO layer. Following that path, it should be noted that the more copper nitrate in electrolyte, the more anaerobic (CuP
2) and aerobic phosphorus-copper compounds (Cu
3(PO
4)
2∙nH
3PO
4) are in the PEO surface layer.
The authors have also calculated the Cu/P, Cu/Ti and P/Ti ratios, and they are presented in
Table 6. The PEO layer has been characterized by the dimensionless numbers. This is important because they can be used for the comparison of other surface layers containing phosphorus and copper incorporated.


 ,
, 


