The Automatic Assessment of Strength and Mobility in Older Adults: A Test-Retest Reliability Study

 ,
,
Abstract
:1. Introduction
2. Materials and Methods
2.1. Participants
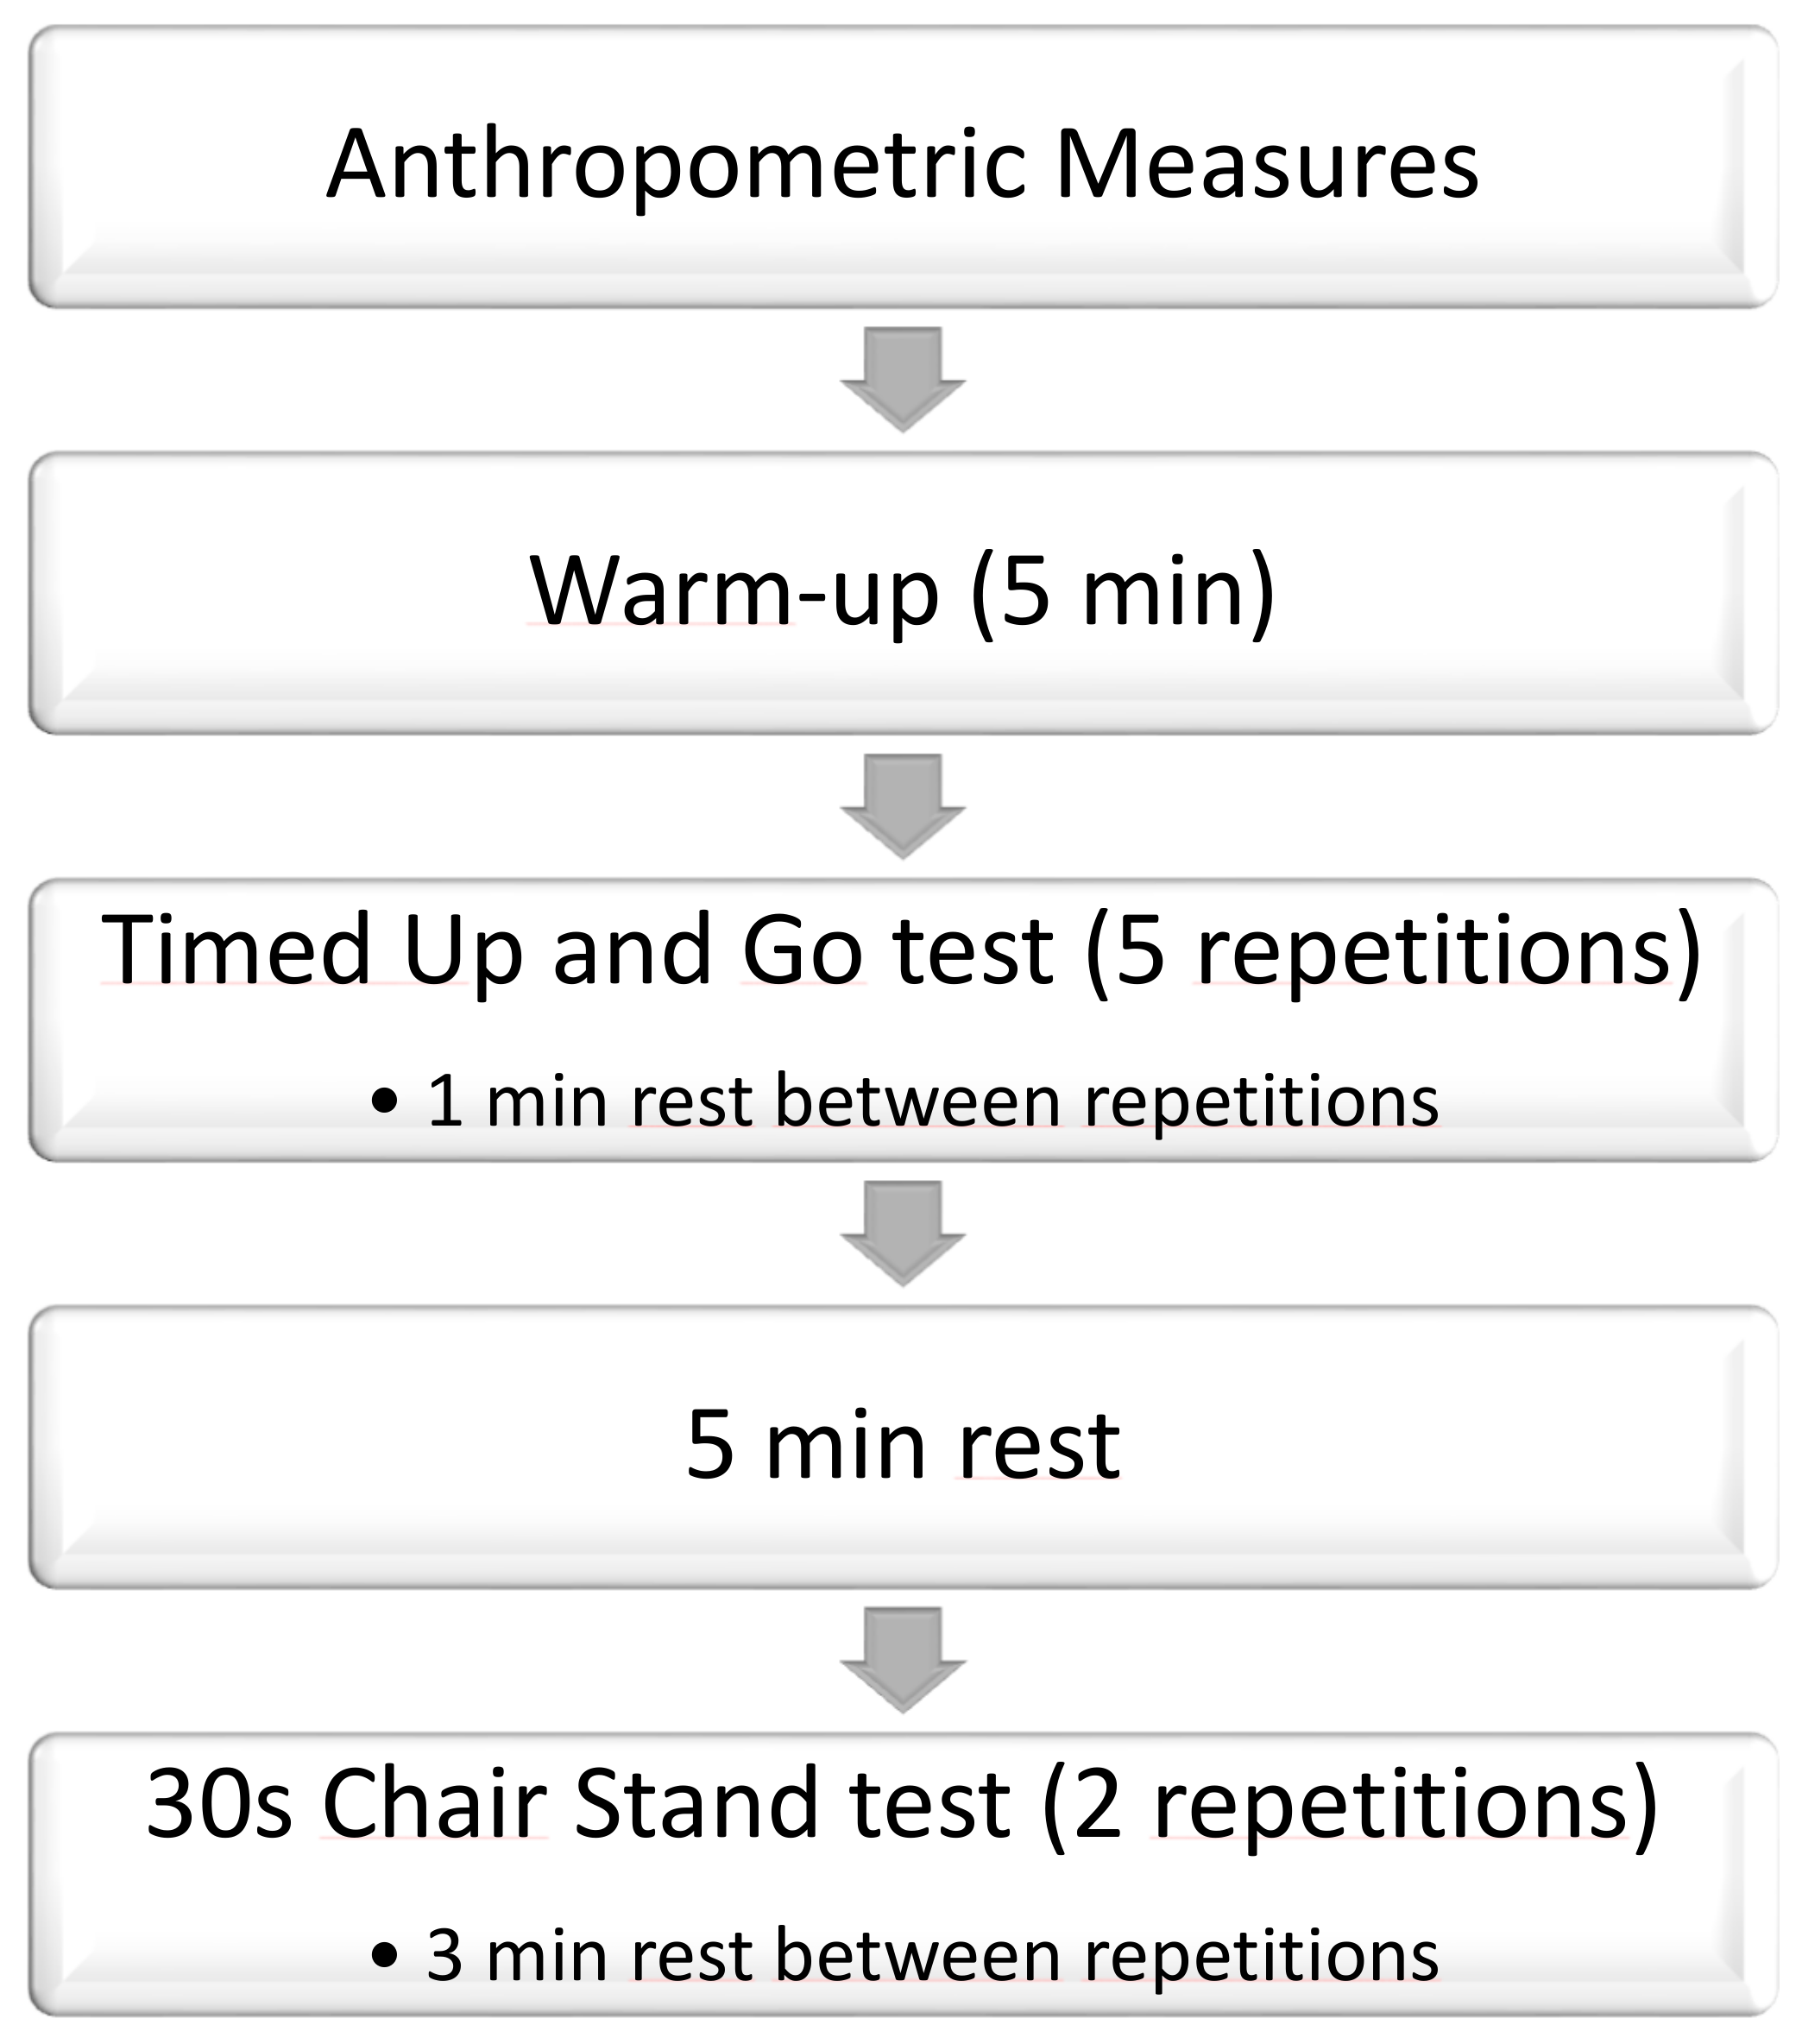
2.2. Procedure
2.3. Statistical Analysis
3. Results
4. Discussion
5. Conclusions
Author Contributions
Funding
Acknowledgments
Conflicts of Interest
References
- Paterson, D.H.; Jones, G.R.; Rice, C.L. Ageing and physical activity: Evidence to develop exercise recommendations for older adults. Appl. Physiol. Nutr. Metab. 2007, 32, S69–S108. [Google Scholar] [CrossRef]
- Paterson, D.H.; Warburton, D.E. Review Physical activity and functional limitations in older adults: A systematic review related to Canada’s Physical Activity Guidelines. Int. J. Behav. Nutr. Phys. Act. 2010, 7, 1–22. [Google Scholar] [CrossRef] [PubMed]
- Den Ouden, M.E.; Schuurmans, M.J.; Brand, J.S.; Arts, I.E.; Mueller-Schotte, S.; van der Schouw, Y.T. Physical functioning is related to both an impaired physical ability and ADL disability: A ten year follow-up study in middle-aged and older persons. Maturitas 2013, 74, 89–94. [Google Scholar] [CrossRef] [PubMed]
- Junius-Walker, U.; Onder, G.; Soleymani, D.; Wiese, B.; Albaina, O.; Bernabei, R.; Marzetti, E. The essence of frailty: A systematic review and qualitative synthesis on frailty concepts and definitions. Eur. J. Intern. Med. 2018, 56, 3–10. [Google Scholar] [CrossRef] [PubMed]
- Rockwood, K.; Awalt, E.; Carver, D.; MacKnight, C. Feasibility and measurement properties of the functional reach and the timed up and go tests in the Canadian study of health and aging. J. Gerontol. Ser. A Biol. Sci. Med. Sci. 2000, 55, M70–M73. [Google Scholar]
- Ding, L.; Yang, F. Muscle weakness is related to slip-initiated falls among community-dwelling older adults. J. Biomech. 2016, 49, 238–243. [Google Scholar] [CrossRef] [PubMed]
- Zasadzka, E.; Borowicz, A.M.; Roszak, M.; Pawlaczyk, M. Assessment of the risk of falling with the use of timed up and go test in the elderly with lower extremity osteoarthritis. Clin. Interv. Aging 2015, 10, 1289–1298. [Google Scholar] [CrossRef]
- Deandrea, S.; Lucenteforte, E.; Bravi, F.; Foschi, R.; La Vecchia, C.; Negri, E. Risk factors for falls in community-dwelling older people: A systematic review and meta-analysis. Epidemiology 2010, 21, 658–668. [Google Scholar] [CrossRef]
- Podsiadlo, D.; Richardson, S. The timed “Up & Go”: A test of basic functional mobility for frail elderly persons. J. Am. Geriatr. Soc. 1991, 39, 142–148. [Google Scholar]
- Csuka, M.; McCarty, D.J. Simple method for measurement of lower extremity muscle strength. Am. J. Med. 1985, 78, 77–81. [Google Scholar] [CrossRef]
- Guralnik, J.M.; Ferrucci, L.; Pieper, C.F.; Leveille, S.G.; Markides, K.S.; Ostir, G.V.; Studenski, S.; Berkman, L.F.; Wallace, R.B. Lower extremity function and subsequent disability: Consistency across studies, predictive models, and value of gait speed alone compared with the short physical performance battery. J. Gerontol. Ser. A Biol. Sci. Med. Sci. 2000, 55, M221–M231. [Google Scholar] [CrossRef] [PubMed]
- Collado Mateo, D.; Dominguez Munoz, F.J.; Adsuar, J.C.; Merellano-Navarro, E.; Olivares, P.R.; Gusi, N. Reliability of the timed-up and go test in women with fibromyalgia. Rehabilit. Nurs. J. 2016. [Google Scholar] [CrossRef]
- Regterschot, G.R.; Zhang, W.; Baldus, H.; Stevens, M.; Zijlstra, W. Test-retest reliability of sensor-based sit-to-stand measures in young and older adults. Gait Posture 2014, 40, 220–224. [Google Scholar] [CrossRef] [PubMed]
- Millor, N.; Lecumberri, P.; Gomez, M.; Martinez-Ramirez, A.; Izquierdo, M. An evaluation of the 30-s chair stand test in older adults: Frailty detection based on kinematic parameters from a single inertial unit. J. Neuroeng. Rehabilit. 2013, 10, 86. [Google Scholar] [CrossRef] [PubMed]
- Cheng, Y.Y.; Wei, S.H.; Chen, P.Y.; Tsai, M.W.; Cheng, I.C.; Liu, D.H.; Kao, C.L. Can sit-to-stand lower limb muscle power predict fall status? Gait Posture 2014, 40, 403–407. [Google Scholar] [CrossRef] [PubMed]
- Collado-Mateo, D.; Adsuar, J.C.; Dominguez-Munoz, F.J.; Olivares, P.R.; Gusi, N. Impact of Fibromyalgia in the Sit-to-Stand-to-Sit Performance Compared With Healthy Controls. PM R J. Inj. Funct. Rehabilit. 2016. [Google Scholar] [CrossRef] [PubMed]
- Janssens, L.; Brumagne, S.; McConnell, A.K.; Claeys, K.; Pijnenburg, M.; Goossens, N.; Burtin, C.; Janssens, W.; Decramer, M.; Troosters, T. Impaired postural control reduces sit-to-stand-to-sit performance in individuals with chronic obstructive pulmonary disease. PLoS ONE 2014, 9, e88247. [Google Scholar] [CrossRef]
- Busca, B.; Font, A. A low-cost contact system to assess load displacement velocity in a resistance training machine. J. Sports Sci. Med. 2011, 10, 472–477. [Google Scholar]
- Weir, J.P. Quantifying test-retest reliability using the intraclass correlation coefficient and the SEM. J. Strength Cond. Res. Natl. Strength Cond. Assoc. 2005, 19, 231–240. [Google Scholar] [CrossRef]
- Munro, B.; Visintainer, M.; Page, E. Statistical Methods for Health Care Research; Lippincott Williams & Wilkins: Philadelphia, PA, USA, 1986. [Google Scholar]
- Olivares, P.R.; Gusi, N.; Prieto, J.; Hernandez-Mocholi, M.A. Fitness and health-related quality of life dimensions in community-dwelling middle aged and older adults. Health Qual. Life Outcomes 2011, 9, 117. [Google Scholar] [CrossRef]
- Petrella, J.K.; Kim, J.S.; Tuggle, S.C.; Hall, S.R.; Bamman, M.M. Age differences in knee extension power, contractile velocity, and fatigability. J. Appl. Physiol. 2005, 98, 211–220. [Google Scholar] [CrossRef] [PubMed] [Green Version]
- Lindemann, U.; Klenk, J.; Becker, C. Assessment of fatigability of older women during sit-to-stand performance. Aging Clin. Exp. Res. 2016, 28, 889–893. [Google Scholar] [CrossRef] [PubMed]
- Kawagoe, S.; Tajima, N.; Chosa, E. Biomechanical analysis of effects of foot placement with varying chair height on the motion of standing up. J. Orthop. Sci. Off. J. Jpn. Orthop. Assoc. 2000, 5, 124–133. [Google Scholar] [CrossRef]


| All (n = 99) | Men (n = 66) | Women (n = 33) | |
|---|---|---|---|
| Age (years) | 71.10 ± 6.02 | 70.63 ± 5.57 | 72.03 ± 6.83 |
| Height (cm) | 169.04 ± 8.66 | 172.55 ± 6.85 | 162.03 ± 7.66 |
| BMI (kg/cm2) | 27.00 ± 2.51 | 26.98 ± 2.54 | 27.05 ± 2.48 |
| Weight (kg) | 77.24 ± 10.09 | 80.38 ± 9.23 | 70.97 ± 8.83 |
| Mean ± SD Test | Mean ± SD Retest | p-Value | Distribution Value | ICC (95% CI) | SEM | SEM (%) | SRD | SRD (%) | |
|---|---|---|---|---|---|---|---|---|---|
| Number of repetitions | 9.99 ± 1.84 | 9.78 ± 1.96 | 0.047 | <0.001 | 0.874 (0.817–0.913) | 0.67 | 6.82 | 1.87 | 18.91 |
| Mean duration of sit-to-stand-to-sit cycle (s) | 3.21 ± 0.63 | 3.28 ± 0.70 | 0.164 | <0.001 | 0.889 (0.838–0.924) | 0.67 | 20.5 | 1.84 | 56.8 |
| Mean duration of initial sit-to-stand-to-sit cycle (s) | 3.03 ± 0.65 | 3.13 ± 0.64 | 0.015 | <0.001 | 0.675 (0.551–0.769) | 0.21 | 7.0 | 0.60 | 19.3 |
| Mean duration of last sit-to-stand-to-sit cycle (s) | 3.36 ± 0.84 | 3.41 ± 0.83 | 0.411 | 0.135 | 0.771 (0.676–0.840) | 0.48 | 4.7 | 1.32 | 13.1 |
| Mean duration of impulse phase (s) | 1.22 ± 0.22 | 1.27 ± 0.26 | <0.001 | 0.892 | 0.821 (0.745–0.876) | 0.10 | 8.16 | 0.28 | 22.61 |
| Mean duration of the initial impulse phase (s) | 1.09 ± 0.25 | 1.16 ± 0.26 | 0.003 | 0.036 | 0.354 (0.169–0.515) | 0.20 | 18.22 | 0.57 | 50.50 |
| Mean duration of the last impulse phase (s) | 1.33 ± 0.32 | 1.38 ± 0.30 | 0.019 | 0.010 | 0.676 (0.553–0.771) | 0.18 | 13.02 | 0.49 | 36.10 |
| Mean duration of the no-contact phase(s) | 1.99 ± 0.49 | 2.00 ± 0.55 | 0.822 | 0.005 | 0.884 (0.833–0.921) | 0.18 | 8.88 | 0.49 | 24.61 |
| Mean duration of the initial no-contact phase (s) | 1.94 ± 0.46 | 1.97 ± 0.51 | 0.752 | <0.001 | 0.699 (0.582–0.787) | 0.27 | 13.61 | 0.74 | 37.73 |
| Mean duration of the last no-contact phase | 2.02 ± 0.67 | 2.03 ± 0.69 | 0.985 | 0.008 | 0.715 (0.603–0.799) | 0.36 | 17.93 | 1.01 | 49.69 |
| Repetition 1 | Repetition 2 | Repetition 3 | Repetition 4 | Repetition 5 | |
|---|---|---|---|---|---|
| TUG manual stopwatch (s) | 9.92 ± 1.69 | 9.67 ± 1.59 | 9.57 ± 1.59 | 9.62 ± 1.67 | 9.78 ± 1.72 |
| TUG automatic chronometer (s) | 10.09 ± 1.68 | 9.65 ± 1.64 | 9.62 ± 1.65 | 9.69 ± 1.73 | 9.72 ± 1.79 |
| Distribution p-value | 0.198 | 0.015 | 0.120 | 0.722 | 0.113 |
| Paired sample comparisons p-value | <0.001 * | 0.662 | 0.085 | 0.020 | 0.122 |
| Correlation coefficient | 0.979 * | 0.966 * | 0.987 * | 0.984 * | 0.982 * |
| Repetitions | Distribution p-Value | p-Value | ICC (95% CI) | SEM (Nm) | SEM (%) | SRD (Nm) | SRD (%) |
|---|---|---|---|---|---|---|---|
| Manual Stopwatch | |||||||
| 1 vs. 2 | 0.440 | <0.001 | 0.878 (0.825–0.916) | 0.57 | 5.85 | 1.59 | 16.21 |
| 2 vs. 3 | 0.231 | 0.619 | 0.929 (0.896–0.952) | 0.42 | 4.40 | 1.17 | 12.21 |
| 2 vs. 4 | 0.003 | 0.893 | 0.879 (0.825–0.917) | 0.57 | 5.88 | 1.57 | 16.29 |
| 2 vs. 5 | 0.016 | 0.242 | 0.875 (0.819–0.914) | 0.59 | 6.02 | 1.62 | 16.68 |
| 3 vs. 4 | 0.154 | 0.353 | 0.894 (0.846–0.928) | 0.53 | 5.53 | 1.47 | 15.33 |
| 3 vs. 5 | 0.014 | 0.227 | 0.866 (0.807–0.908) | 0.51 | 5.22 | 1.40 | 14.47 |
| 4 vs. 5 | 0.018 | 0.787 | 0.892 (0.843–0.926) | 0.47 | 4.81 | 1.29 | 13.34 |
| Automatic Chronometer | |||||||
| 1 vs. 2 | 0.249 | 0.001 | 0.892 (0.843–0.926) | 0.55 | 5.53 | 1.51 | 15.32 |
| 2 vs. 3 | 0.139 | 0.075 | 0.941 (0.913–0.960) | 0.40 | 4.15 | 1.11 | 11.50 |
| 2 vs. 4 | 0.008 | 0.392 | 0.908 (0.866–0.937) | 0.51 | 5.29 | 1.42 | 14.65 |
| 2 vs. 5 | <0.001 | 0.122 | 0.896 (0.848–0.929) | 0.55 | 5.71 | 1.53 | 15.83 |
| 3 vs. 4 | 0.033 | 0.999 | 0.908 (0.867–0.938) | 0.51 | 5.31 | 1.42 | 14.72 |
| 3 vs. 5 | 0.002 | 0.016 | 0.884 (0.833–0.921) | 0.59 | 6.06 | 1.62 | 16.79 |
| 4 vs. 5 | 0.001 | 0.038 | 0.894 (0.846–0.927) | 0.57 | 5.90 | 1.59 | 16.37 |
© 2019 by the authors. Licensee MDPI, Basel, Switzerland. This article is an open access article distributed under the terms and conditions of the Creative Commons Attribution (CC BY) license (http://creativecommons.org/licenses/by/4.0/).
Share and Cite
Collado-Mateo, D.; Madeira, P.; Dominguez-Muñoz, F.J.; Villafaina, S.; Tomas-Carus, P.; Parraca, J.A. The Automatic Assessment of Strength and Mobility in Older Adults: A Test-Retest Reliability Study. Medicina 2019, 55, 270. https://0-doi-org.brum.beds.ac.uk/10.3390/medicina55060270
Collado-Mateo D, Madeira P, Dominguez-Muñoz FJ, Villafaina S, Tomas-Carus P, Parraca JA. The Automatic Assessment of Strength and Mobility in Older Adults: A Test-Retest Reliability Study. Medicina. 2019; 55(6):270. https://0-doi-org.brum.beds.ac.uk/10.3390/medicina55060270
Chicago/Turabian StyleCollado-Mateo, Daniel, Pedro Madeira, Francisco J. Dominguez-Muñoz, Santos Villafaina, Pablo Tomas-Carus, and José A. Parraca. 2019. "The Automatic Assessment of Strength and Mobility in Older Adults: A Test-Retest Reliability Study" Medicina 55, no. 6: 270. https://0-doi-org.brum.beds.ac.uk/10.3390/medicina55060270