Melatonin and Expression of Tryptophan Decarboxylase Gene (TDC) in Herbaceous Peony (Paeonia lactiflora Pall.) Flowers

Abstract
:1. Introduction
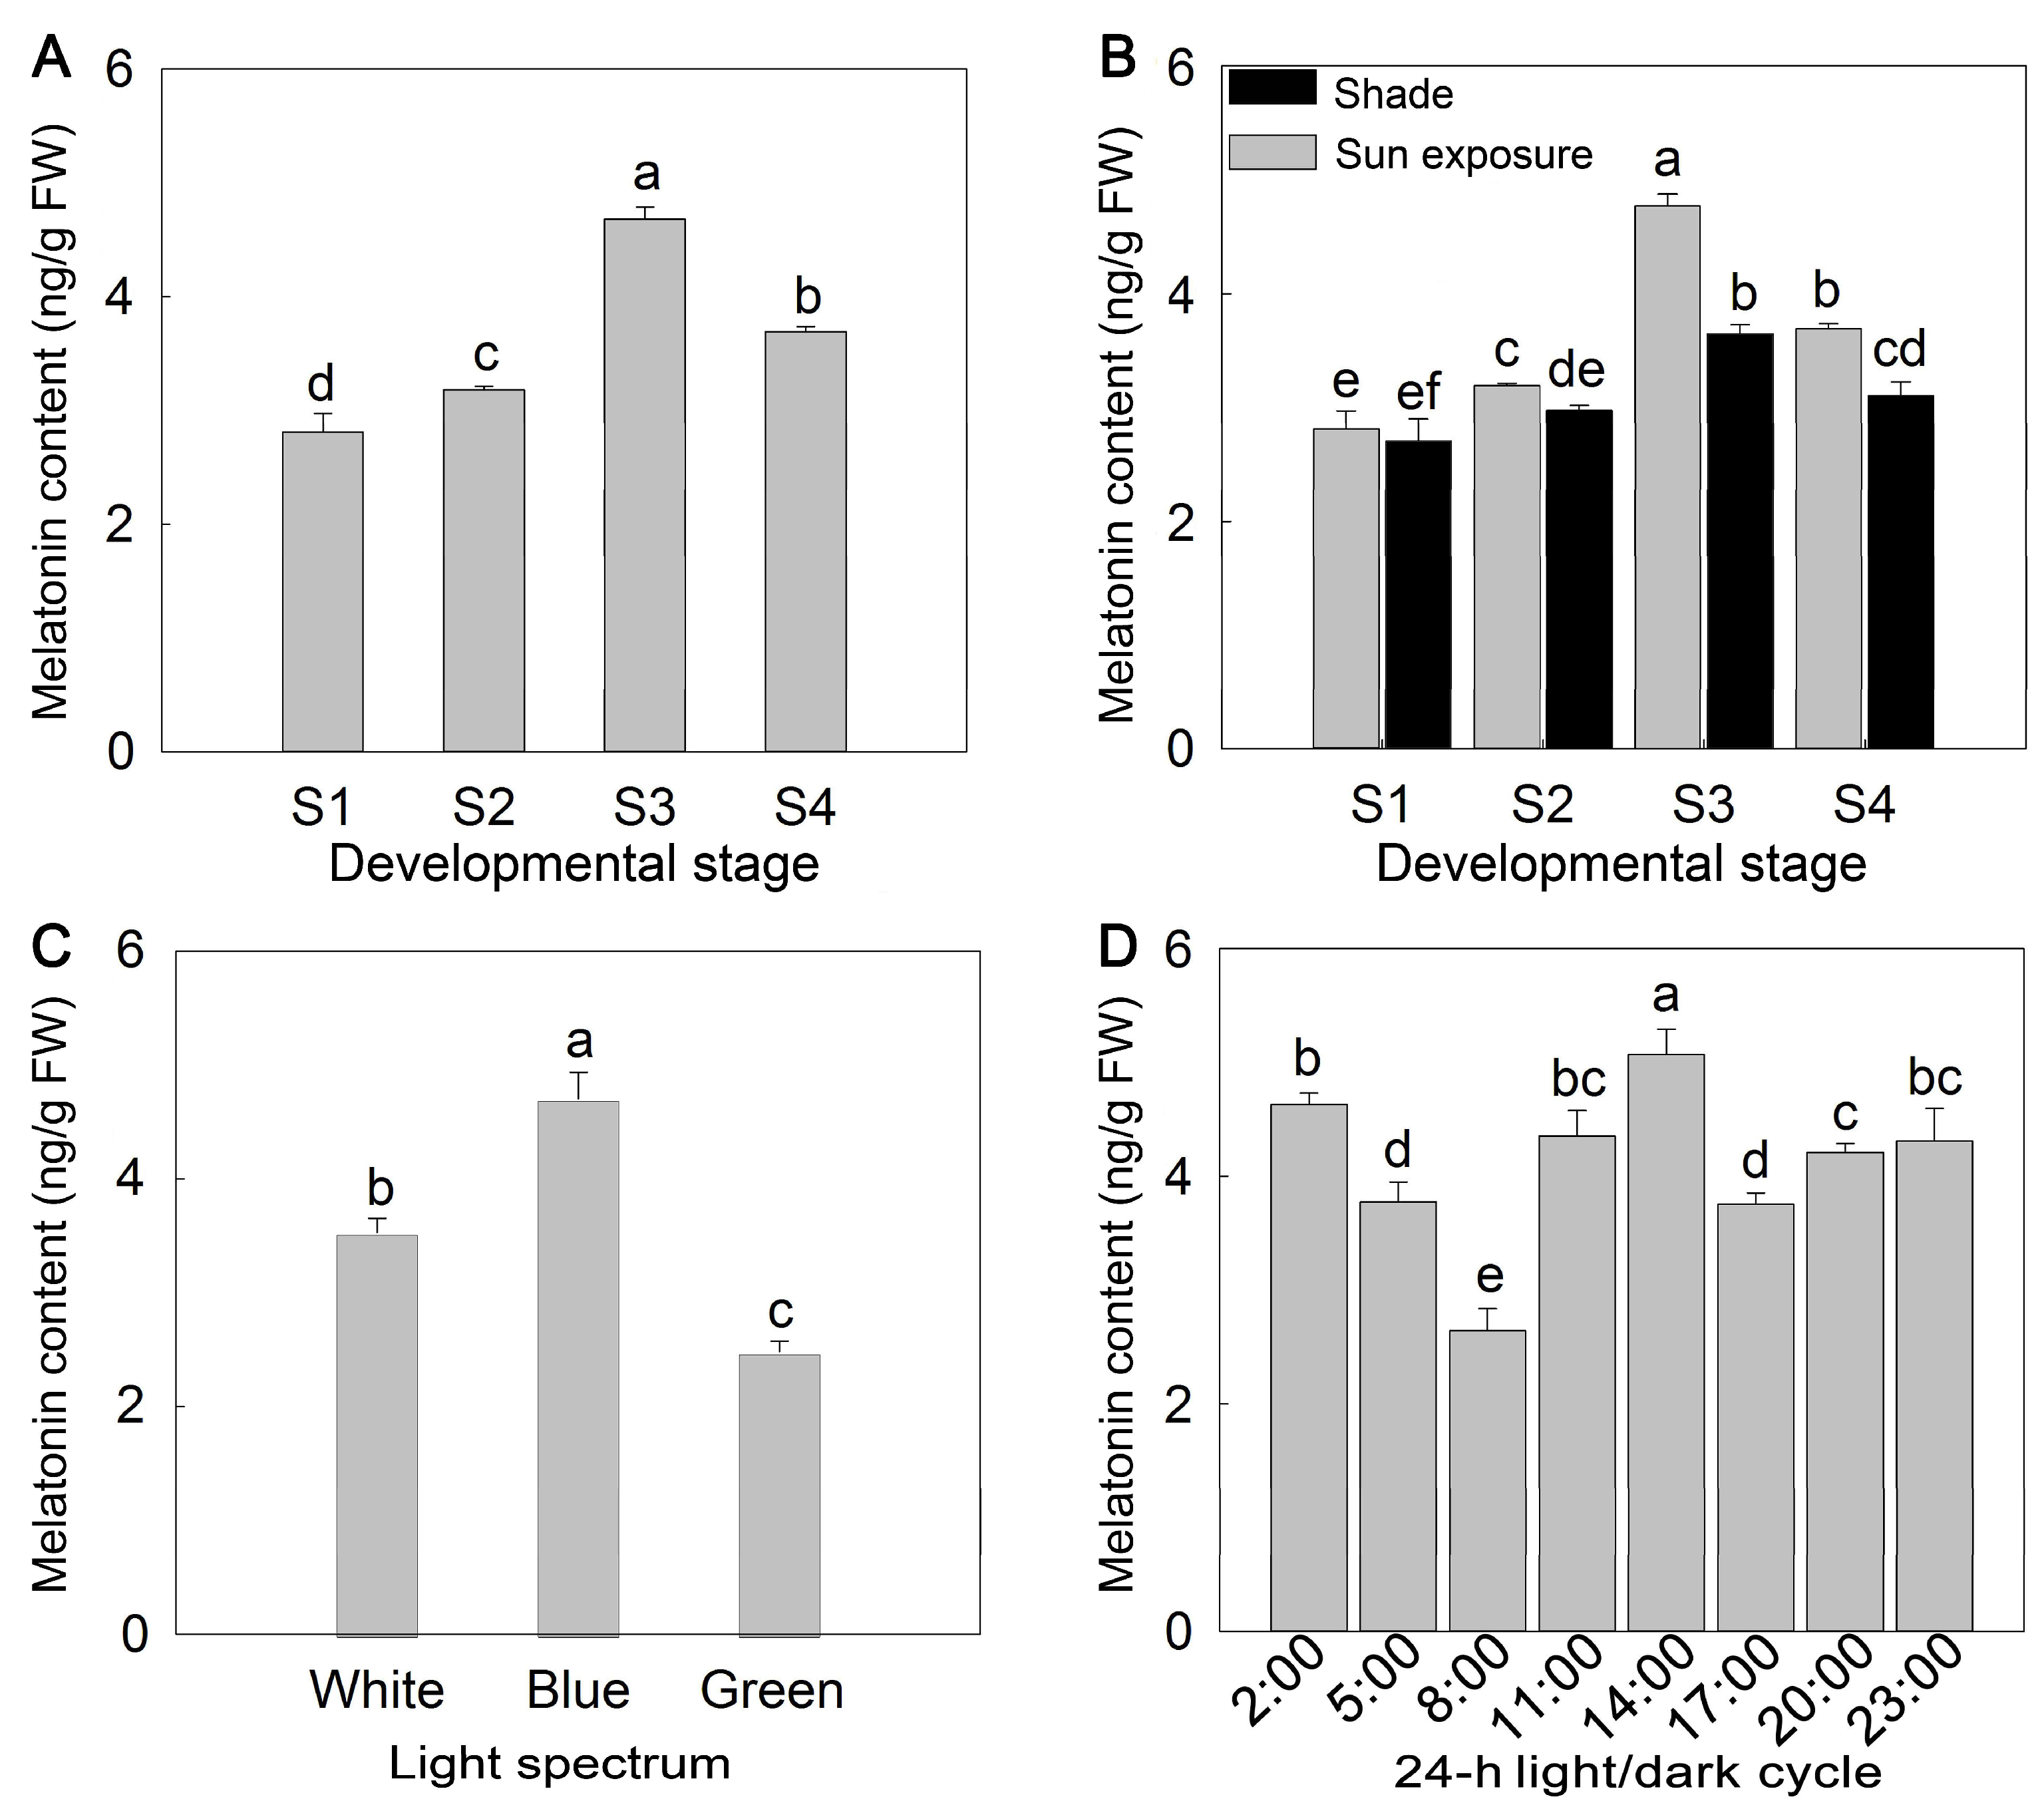
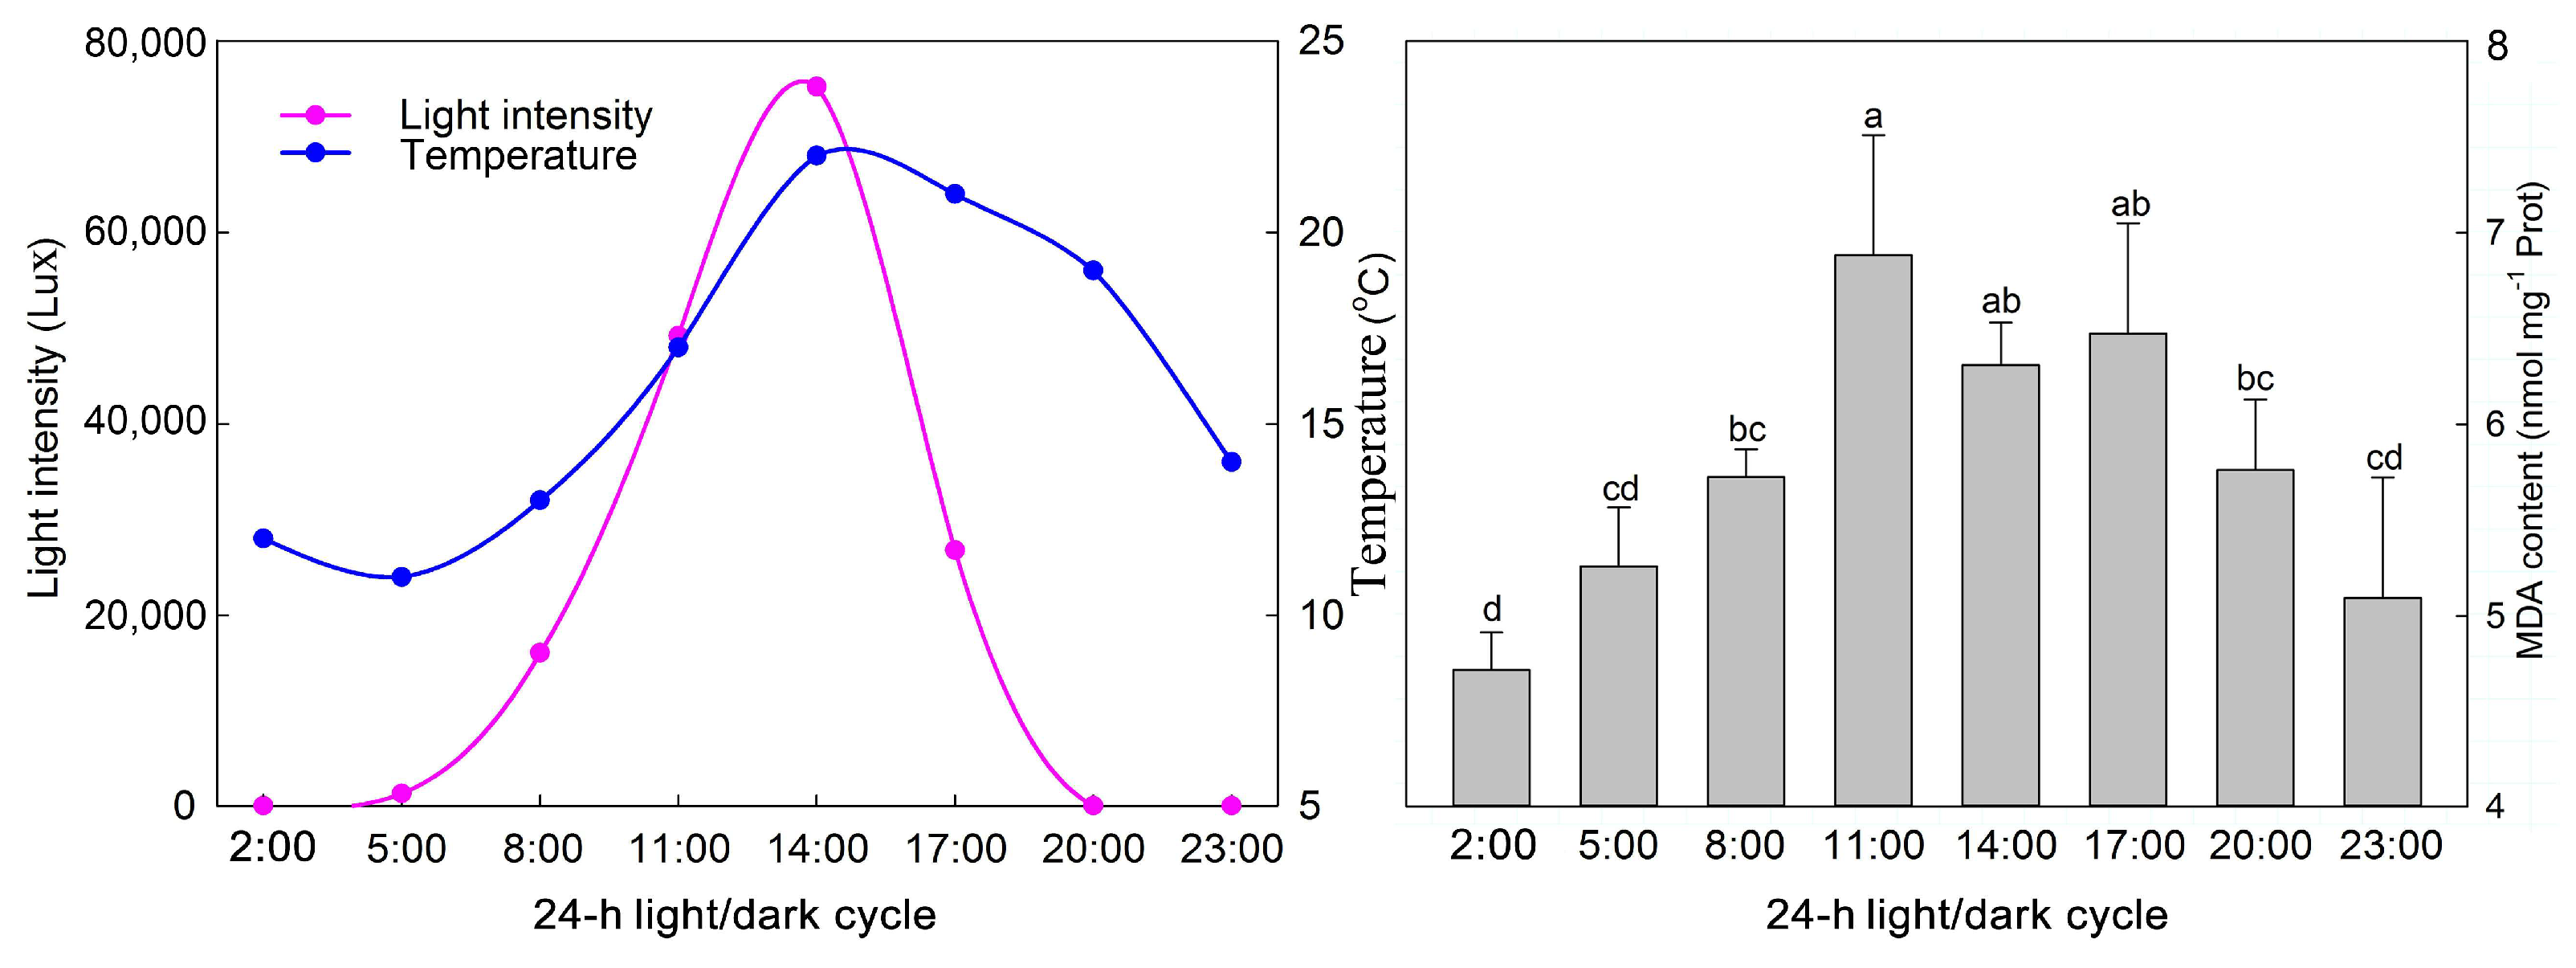
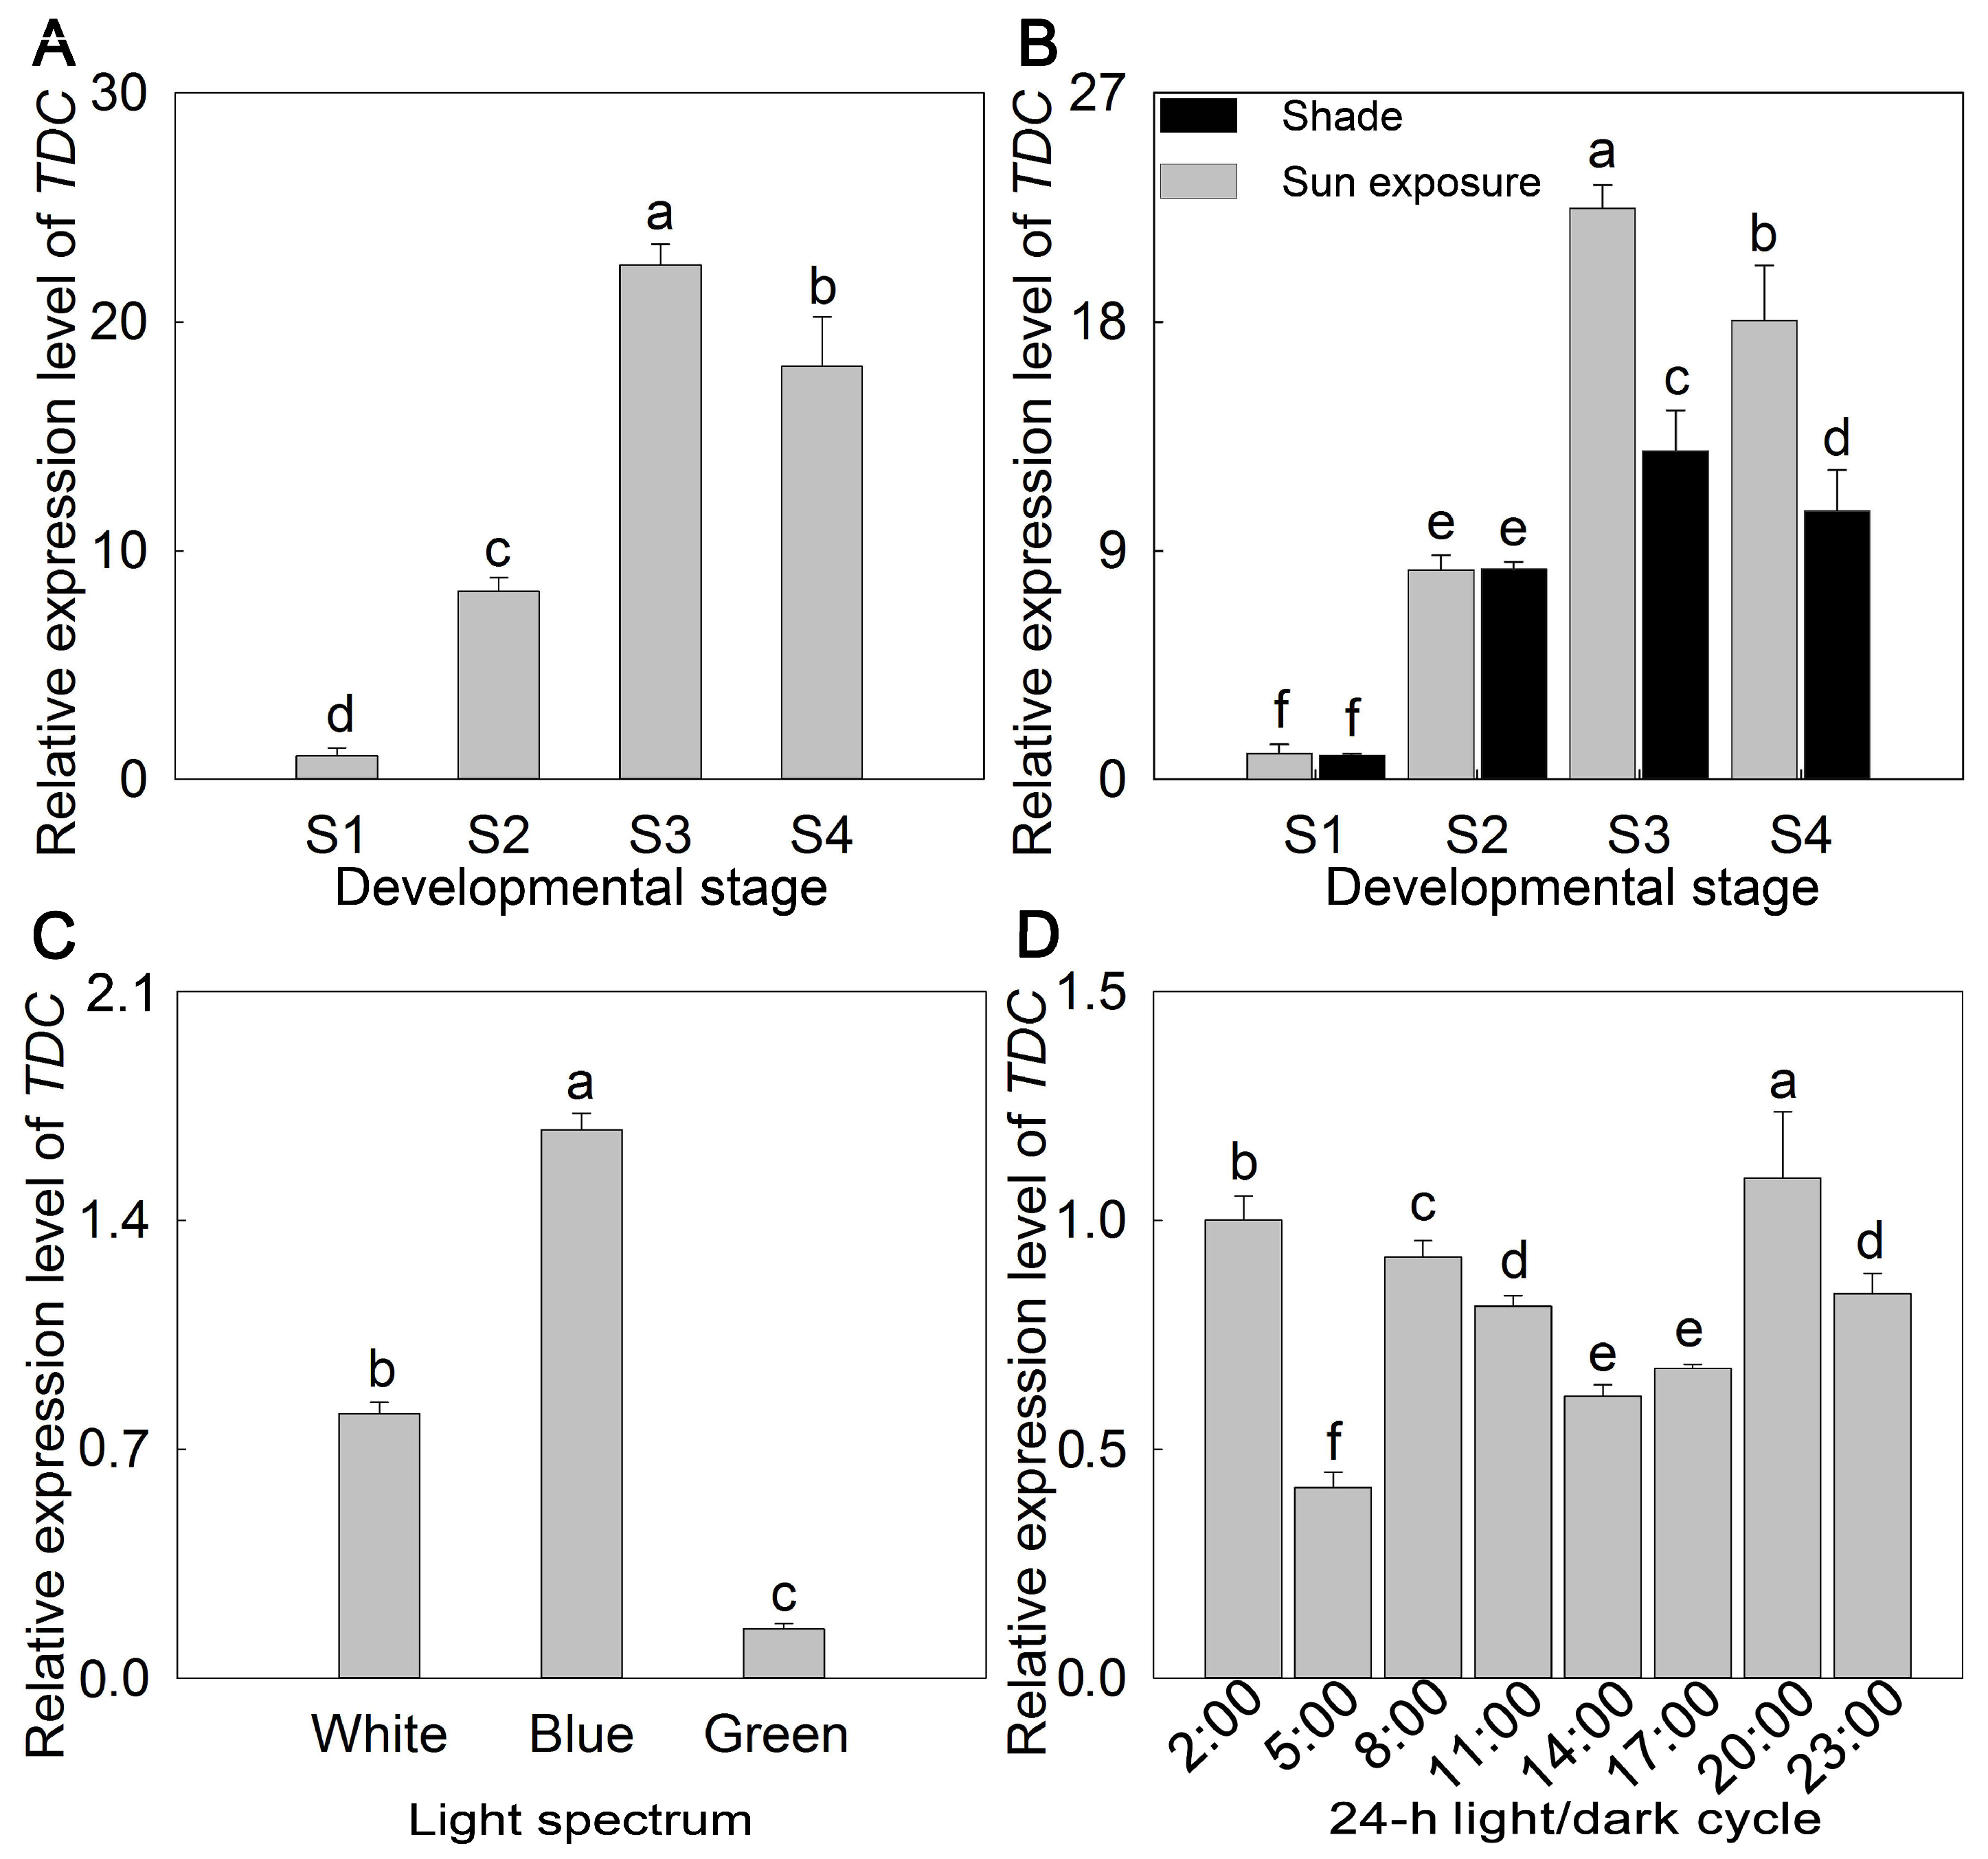
2. Results
3. Discussion
4. Materials and Methods
4.1. Plant Materials and Treatments
4.2. Color Indices Measurement
4.3. Melatonin and MDA Content Measurement
4.4. Gene Expression Analysis
4.5. Statistical Analysis
Author Contributions
Acknowledgments
Conflicts of Interest
References
- Hardeland, R.; Cardinali, D.P.; Srinivasan, V.; Spence, D.W.; Brown, G.M.; Pandi-Perumal, S.R. Melatonin-a pleiotropic, orchestrating regulator molecule. Prog. Neurobiol. 2011, 93, 350–384. [Google Scholar] [CrossRef] [PubMed]
- Reiter, R.J. Circannual reproductive rhythms in mammals related to photoperiod and pineal function: A review. Chronobiologia 1974, 1, 365–395. [Google Scholar] [PubMed]
- Galano, A.; Tan, D.X.; Reiter, R.J. Melatonin as a natural ally against oxidative stress: A physicochemical examination. J. Pineal Res. 2011, 51, 1–16. [Google Scholar] [CrossRef] [PubMed]
- Reiter, R.J.; Mayo, J.C.; Tan, D.; Sainz, R.M.; Alatorre-Jimenez, M.; Qin, L. Melatonin as an antioxidant: Under promises but over delivers. J. Pineal Res. 2016, 61, 253–278. [Google Scholar] [CrossRef] [PubMed]
- Braam, W.; Smits, M.G.; Didden, R.; Korzilius, H.; Van Geijlswijk, I.M.; Curfs, L.M. Exogenous melatonin for sleep problems in individuals with intellectual disability: A meta-analysis. Dev. Med. Child Neurol. 2009, 51, 340–349. [Google Scholar] [CrossRef] [PubMed]
- Hattori, A.; Migitaka, H.; Iigo, M.; Itoh, M.; Yamamoto, K.; Ohtani-Kaneko, R.; Hara, M.; Suziki, T.; Reiter, R.J. Identification of melatonin in plants and its effects on plasma melatonin levels and binding to melatonin receptors in vertebrates. Biochem. Mol. Biol. Int. 1995, 35, 627–634. [Google Scholar] [PubMed]
- Tan, D.X; Hardeland, R.; Manchester, L.C; Poeggeler, B.; Lopez-Burillo, S.; Mayo, J.C.; Sainz, R.M.; Reiter, R.J. Mechanistic and comparative studies of melatonin and classic antioxidants in terms of their interactions with the ABTS cation radical. J. Pineal Res. 2003, 34, 249–259. [Google Scholar] [CrossRef] [PubMed]
- Tan, D.X.; Reiter, R.J.; Manchester, L.C.; Yan, M.T.; El-Sawi, M.; Sainz, R.M.; Mayo, J.C.; Kohen, R.; Allegra, M.; Hardeland, R. Chemical and physical properties and potential mechanisms: Melatonin as a broad spectrum antioxidant and free radical scavenger. Curr. Top. Med. Chem. 2002, 2, 181–197. [Google Scholar] [CrossRef] [PubMed]
- Reiter, R.J.; Manchester, L.C.; Tan, D.X. Melatonin in walnuts: Influence on levels of melatonin and total antioxidant capacity of blood. Nutrition 2005, 21, 920–924. [Google Scholar] [CrossRef] [PubMed]
- Garrido, M.; Paredes, S.D.; Cubero, J.; Lozano, M.; Toribiodelgado, A.F.; Muñoz, J.L.; Reiter, R.; Barriga, C.; Rodriguez, A.B. Jerte valley cherry-enriched diets improve nocturnal rest and increase 6-sulfatoxymelatonin and total antioxidant capacity in the urine of middle-aged and elderly humans. J. Gerontol. 2010, 65, 909–914. [Google Scholar] [CrossRef] [PubMed]
- Gong, B.; Shi, Q.H. Review of melatonin in horticultural crops. Sci. Agric. Sin. 2017, 50, 2326–2337. (In Chinese) [Google Scholar]
- Chen, G.; Huo, Y.; Tan, D.X.; Liang, Z.; Zhang, W.; Zhang, Y. Melatonin in Chinese medicinal herbs. Life Sci. 2003, 73, 19–26. [Google Scholar] [CrossRef]
- De Luca, V.; Marineau, C.; Brisson, N. Molecular cloning and analysis of cDNA encoding a plant tryptophan decarboxylase: Comparison with animal dopa decarboxylase. Proc. Natl. Acad. Sci. USA 1989, 86, 2582–2586. [Google Scholar] [CrossRef] [PubMed]
- Kang, S.; Kang, K.; Lee, K.; Back, K. Characterization of rice tryptophan decarboxylases and their direct involvement in serotonin biosynthesis in transgenic rice. Planta 2007, 227, 263–272. [Google Scholar] [CrossRef] [PubMed]
- Fujiwara, T.; Maisonneuve, S.; Isshiki, M.; Mizutani, M.; Chen, L.; Wong, H.L.; Kawasaki, T.; Shimamoto, K. Sekiguchi lesion gene encodes a cytochrome P450 monooxygenase that catalyzes conversion of tryptamine to serotonin in rice. J. Biol. Chem. 2010, 285, 11308–11313. [Google Scholar] [CrossRef] [PubMed]
- Park, S.; Kang, K.; Lee, S.W.; Ahn, M.J.; Bae, J.M.; Back, K. Production of serotonin by dual expression of tryptophan decarboxylase and tryptamine 5-hydroxylase in Escherichia coli. Appl. Microbiol. Biotechnol. 2011, 89, 1387–1394. [Google Scholar] [CrossRef] [PubMed]
- Kang, K.; Lee, K.; Park, S.; Byeon, Y.; Back, K. Molecular cloning of rice serotonin N-acetyltransferase, the penultimate gene in plant melatonin biosynthesis. J. Pineal Res. 2013, 55, 7–13. [Google Scholar] [CrossRef] [PubMed]
- Kang, K.; Kong, K.; Park, S.; Natsagdorj, U.; Kim, Y.S.; Back, K. Molecular cloning of a plant N-acetylserotonin methyltransferase and its expression characteristics in rice. J. Pineal Res. 2011, 50, 304–309. [Google Scholar] [CrossRef] [PubMed]
- Park, S.; Byeon, Y.; Kim, Y.S.; Back, K. Kinetic analysis of purified recombinant rice N-acetylserotonin methyltransferase and peak melatonin production in etiolated rice shoots. J. Pineal Res. 2013, 54, 139–144. [Google Scholar] [CrossRef] [PubMed]
- Arnao, M.B.; Hernández-Ruiz, J. Functions of melatonin in plants: A review. J. Pineal Res. 2015, 59, 133–150. [Google Scholar] [CrossRef] [PubMed]
- Pothinuch, P.; Tongchitpakdee, S. Melatonin contents in mulberry (Morus spp.) leaves: Effects of sample preparation, cultivar, leaf age and tea processing. Food Chem. 2011, 128, 415–419. [Google Scholar] [CrossRef] [PubMed]
- Chen, Y.H.; Ling-Ling, S.; Su-Er, L.; Chen, C.C. Analysis of dabsyl-Cl derivated amino acids by high performance liquid chromatography and tandem mass spectrometry. Food Sci. Technol. Res. 2007, 9, 276–282. [Google Scholar] [CrossRef]
- Hu, S.; Ma, Y.; Jiang, H.; Feng, D.; Yu, W.; Dai, D.; Mei, L. Production of paeoniflorin and albiflorin by callus tissue culture of Paeonia lactiflora Pall. Chin. J. Chem. Eng. 2015, 23, 451–455. [Google Scholar] [CrossRef]
- Shang, P.P.; Jia, M.X.; Liu, A.Q.; Jiang, X.R.; Liu, Y. Reaserch on the bioactive compounds and antioxidant activity of petals from different cultivars of Paeonia lactiflora. Plant Physiol. J. 2016, 52, 234–240. [Google Scholar]
- Jin, Y.S.; Chen, M.L.; Jin, Y.Z.; Tao, J. In vitro free radical scavenging activities and active constituents from Paeonia lactiflora flowers. J. Yangzhou Univ. 2012, 33, 86–90. [Google Scholar]
- Liu, D.; Zhao, D.; Lu, C.; Li, Z.; Tao, J. Analysis of melatonin in herbaceous peony (Paeonia lactiflora Pall.) by high performance liquid chromatography-tandem mass spectrometry. Mol. Plant Breed. 2017, 15, 1527–1534. [Google Scholar]
- Zhang, N.; Zhao, B.; Zhang, H.J.; Weeda, S.; Yang, C.; Yang, Z.C.; Ren, S.; Guo, Y.D. Melatonin promotes water-stress tolerance, lateral root formation, and seed germination in cucumber (Cucumis sativus L.). J. Pineal Res. 2013, 54, 15–23. [Google Scholar] [CrossRef] [PubMed]
- Li, C.; Wang, P.; Wei, Z.; Liang, D.; Liu, C.; Yin, L.; Jia, D.; Fu, M.; Ma, F. The mitigation effects of exogenous melatonin on salinity-induced stress in Malus hupehensis. J. Pineal Res. 2012, 53, 298–306. [Google Scholar] [CrossRef] [PubMed]
- Szafrańska, K.; Glińska, S.; Janas, K.M. Ameliorative effect of melatonin on meristematic cells of chilled and re-warmed Vigna radiata, roots. Biol. Plant. 2013, 57, 91–96. [Google Scholar] [CrossRef]
- Back, K.; Tan, D.; Reiter, R.J. Melatonin biosynthesis in plants: Multiple pathways catalyze tryptophan to melatonin in the cytoplasm or chloroplasts. J. Pineal Res. 2016, 61, 426–437. [Google Scholar] [CrossRef] [PubMed]
- González-Gómez, D.; Lozano, M.; Fernándezleón, M.F.; Ayuso, M.C.; Bernalte, M.J.; Rodríguez, A.B. Detection and quantification of melatonin and serotonin in eight sweet cherry cultivars (Prunus avium L.). Eur. Food Res. Technol. 2009, 229, 223–229. [Google Scholar] [CrossRef]
- Stürtz, M.; Cerezo, A.B.; Cantos-Villar, E.; Garcia-Parrilla, M.C. Determination of the melatonin content of different varieties of tomatoes (Lycopersicon esculentum) and strawberries (Fragaria ananassa). Food Chem. 2011, 127, 1329–1334. [Google Scholar] [CrossRef] [PubMed]
- Zhao, D.; Tao, J.; Han, C.; Ge, J. Flower color diversity revealed by differential expression of flavonoid biosynthetic genes and flavonoid accumulation in herbaceous peony (Paeonia lactiflora Pall.). Mol. Biol. Rep. 2012, 39, 11263–11275. [Google Scholar] [CrossRef] [PubMed]
- Wang, Y.; Gao, Y.; Ding, H.; Liu, S.; Han, X.; Gui, J.; Liu, D. Subcritical ethanol extraction of flavonoids from Moringa oleifera leaf and evaluation of antioxidant activity. Food Chem. 2017, 218, 152–158. [Google Scholar] [CrossRef] [PubMed]
- Sarrou, E.; Chatzopoulou, P.; Dimassi-Theriou, K.; Therios, I.; Koularmani, A. Effect of melatonin, salicylic acid and gibberellic acid on leaf essential oil and other secondary metabolites of bitter orange young seedlings. J. Essent. Oil Res. 2015, 27, 487–496. [Google Scholar] [CrossRef]
- Murch, S.J.; Alan, A.R.; Cao, J.; Saxena, P.K. Melatonin and serotonin in flowers and fruits of Datura metel L. J. Pineal Res. 2009, 47, 277–283. [Google Scholar] [CrossRef] [PubMed]
- Arnao, M.B.; Hernández-Ruiz, J. Growth conditions influence the melatonin content of tomato plants. Food Chem. 2013, 138, 1212–1214. [Google Scholar] [CrossRef] [PubMed]
- Byeon, Y.; Park, S.; Kim, Y.S.; Park, D.H.; Lee, S.; Back, K. Light-regulated melatonin biosynthesis in rice during the senescence process in detached leaves. J. Pineal Res. 2012, 53, 107–111. [Google Scholar] [CrossRef] [PubMed]
- Afreen, F.; Zobayed, S.M.; Kozai, T. Melatonin in Glycyrrhiza uralensis: Response of plant roots to spectral quality of light and UV-B radiation. J. Pineal Res. 2006, 41, 108–115. [Google Scholar] [CrossRef] [PubMed]
- Riga, P.; Medina, S.; García-Flores, L.A.; Gil-Izquierdo, Á. Melatonin content of pepper and tomato fruits: Effects of cultivar and solar radiation. Food Chem. 2014, 156, 347–352. [Google Scholar] [CrossRef] [PubMed]
- Zhang, W.; Zhao, G.; Zhang, X.; Fang, M.O. Technology for production of cow’s milk rich in naturally expressed melatonin. Acta Zoonutr. Sin. 2016, 28, 635–640. [Google Scholar]
- Zuo, B.; Zheng, X.; He, P.; Wang, L.; Lei, Q.; Feng, C.; Zhou, J.; Li, Q.; Han, Z.; Kong, J. Overexpression of MzASMT improves melatonin production and enhances drought tolerance in transgenic Arabidopsis thaliana plants. J. Pineal Res. 2014, 57, 408–417. [Google Scholar] [CrossRef] [PubMed]
- Boccalandro, H.E.; González, C.V.; Wunderlin, D.A.; Silva, M.F. Melatonin levels, determined by LC-ESI-MS/MS, fluctuate during the day/night cycle in Vitis vinifera cv Malbec: Evidence of its antioxidant role in fruits. J. Pineal Res. 2011, 51, 226–232. [Google Scholar] [CrossRef] [PubMed]
- Liang, C.; Zheng, G.; Li, W.; Wang, Y.; Hu, B.; Wang, H.; Wu, H.; Qian, Y.; Zhu, X.; Tan, D.; Chen, S.; Chu, C. Melatonin delays leaf senescence and enhances salt stress tolerance in rice. J. Pineal Res. 2015, 59, 91–101. [Google Scholar] [CrossRef] [PubMed]
- Zhao, Y.; Tan, D.X.; Lei, Q.; Chen, H.; Wang, L.; Li, Q.; Gao, Y.; Kong, J. Melatonin and its potential biological functions in the fruits of sweet cherry. J. Pineal Res. 2013, 55, 79–88. [Google Scholar] [CrossRef] [PubMed]
- Zhu, C.; Sanahuja, G.; Yuan, D.; Farré, G.; Arjó, G.; Berman, J.; Zorrilla-López, U.; Banakar, R.; Bai, C.; Pérez-Massot, U.; et al. Biofortification of plants with altered antioxidant content and composition: Genetic engineering strategies. Plant Biotechnol. J. 2013, 11, 129–141. [Google Scholar] [CrossRef] [PubMed]
- De Masi, L.; Castaldo, D.; Pignone, D.; Servillo, L.; Facchiano, A. Experimental evidence and in silico identification of tryptophan decarboxylase in Citrus genus. Molecules 2017, 22, 272. [Google Scholar] [CrossRef] [PubMed]
- Byeon, Y.; Park, S.; Lee, H.Y.; Kim, Y.S.; Back, K. Elevated production of melatonin in transgenic rice seeds expressing rice tryptophan decarboxylase. J. Pineal Res. 2014, 56, 275–282. [Google Scholar] [CrossRef] [PubMed]
- Liu, Y.; Song, L.; Yu, W.; Hu, Y.; Ma, X.; Wu, J.; Ying, Y. Light quality modifies camptothecin production and gene expression of biosynthesis in Camptotheca acuminata Decne seedlings. Ind. Crop. Prod. 2015, 66, 137–143. [Google Scholar] [CrossRef]
- Hu, S.Y. The tour of a botanist in China. Arnoldia 1976, 35, 264–295. [Google Scholar]
- Zhao, D.; Zhou, C.; Kong, F.; Tao, J. Cloning of phytoene desaturase and expression analysis of carotenogenic genes in persimmon (Diospyros kaki L.) fruits. Mol. Biol. Rep. 2011, 38, 3935–3943. [Google Scholar] [CrossRef] [PubMed]
- Schmittgen, T.D.; Livak, K.J. Analyzing real-time PCR data by the comparative CT method. Nat. Protoc. 2008, 36, 1101–1108. [Google Scholar] [CrossRef]
Sample Availability: Samples of the compounds are not available from the authors. |


| Color | Cultivars | Flower | RHSCC | H° | Melatonin (ng/g FW) |
|---|---|---|---|---|---|
| Pink Series | ‘Zhongsheng Fen’ |  | 69 A | 20.4 | 4.31 ± 0.36 f |
| ‘Zhusha Pan’ |  | 69 B | 56.5 | 4.35 ± 0.13 f | |
| ‘Fenchi Dizhi’ |  | 69 B | 19.5 | 3.94 ± 0.11 g | |
| ‘Fen Zhupan’ |  | 69 B | 38.5 | 4.34 ± 0.07 f | |
| Red Series | ‘Dadi Lushuang’ |  | 72 A | 348.7 | 4.81 ± 0.22 d,e |
| ‘Da Fugui’ |  | 72 A | 348.1 | 4.74 ± 0.16 e | |
| ‘Zi Fengyu’ |  | 71 A | 357.9 | 4.82 ± 0.10 d,e | |
| ‘Hong Feng’ |  | 71 C | 349.7 | 4.73 ± 0.08 e | |
| Black ink Series | ‘Heihai Botao’ |  | 59 A | 1.7 | 5.25 ± 0.13 c |
| ‘Moyun Hanjin’ |  | N77 A | 3.7 | 4.97 ± 0.05d e | |
| ‘Molou Jinhui’ |  | 59 A | 0.8 | 5.26 ± 0.13 c | |
| ‘Yanzi Xiangyang’ |  | 59 B | 6.5 | 5.05 ± 0.08 c,d | |
| White Series | ‘Xueshan Hongxing’ |  | 155 B | 117.6 | 5.59 ± 0.29 b |
| ‘Xueshan Hongmei’ |  | 155 B | 120.2 | 5.75 ± 0.14 a,b | |
| ‘Yangfei Chuyu’ |  | NN155 B | 110.5 | 5.80 ± 0.21 b | |
| ‘Xue Feng’ |  | NN155 B | 106.7 | 5.97 ± 0.19 a |
© 2018 by the authors. Licensee MDPI, Basel, Switzerland. This article is an open access article distributed under the terms and conditions of the Creative Commons Attribution (CC BY) license (http://creativecommons.org/licenses/by/4.0/).
Share and Cite
Zhao, D.; Wang, R.; Liu, D.; Wu, Y.; Sun, J.; Tao, J. Melatonin and Expression of Tryptophan Decarboxylase Gene (TDC) in Herbaceous Peony (Paeonia lactiflora Pall.) Flowers. Molecules 2018, 23, 1164. https://0-doi-org.brum.beds.ac.uk/10.3390/molecules23051164
Zhao D, Wang R, Liu D, Wu Y, Sun J, Tao J. Melatonin and Expression of Tryptophan Decarboxylase Gene (TDC) in Herbaceous Peony (Paeonia lactiflora Pall.) Flowers. Molecules. 2018; 23(5):1164. https://0-doi-org.brum.beds.ac.uk/10.3390/molecules23051164
Chicago/Turabian StyleZhao, Daqiu, Rong Wang, Ding Liu, Yanqing Wu, Jing Sun, and Jun Tao. 2018. "Melatonin and Expression of Tryptophan Decarboxylase Gene (TDC) in Herbaceous Peony (Paeonia lactiflora Pall.) Flowers" Molecules 23, no. 5: 1164. https://0-doi-org.brum.beds.ac.uk/10.3390/molecules23051164