Dietary Patterns of Children and Adolescents from High, Medium and Low Human Development Countries and Associated Socioeconomic Factors: A Systematic Review

 , , , , ,
Abstract
:1. Introduction
2. Materials and Methods
2.1. Protocol and Registration
2.2. Eligibility
2.2.1. Inclusion Criteria
2.2.2. Exclusion Criteria
2.3. Information Sources
2.4. Search
2.5. Study Selection
2.6. Data Collection Process
2.7. Data Items
2.8. Risk of Bias within Individual Studies
3. Results
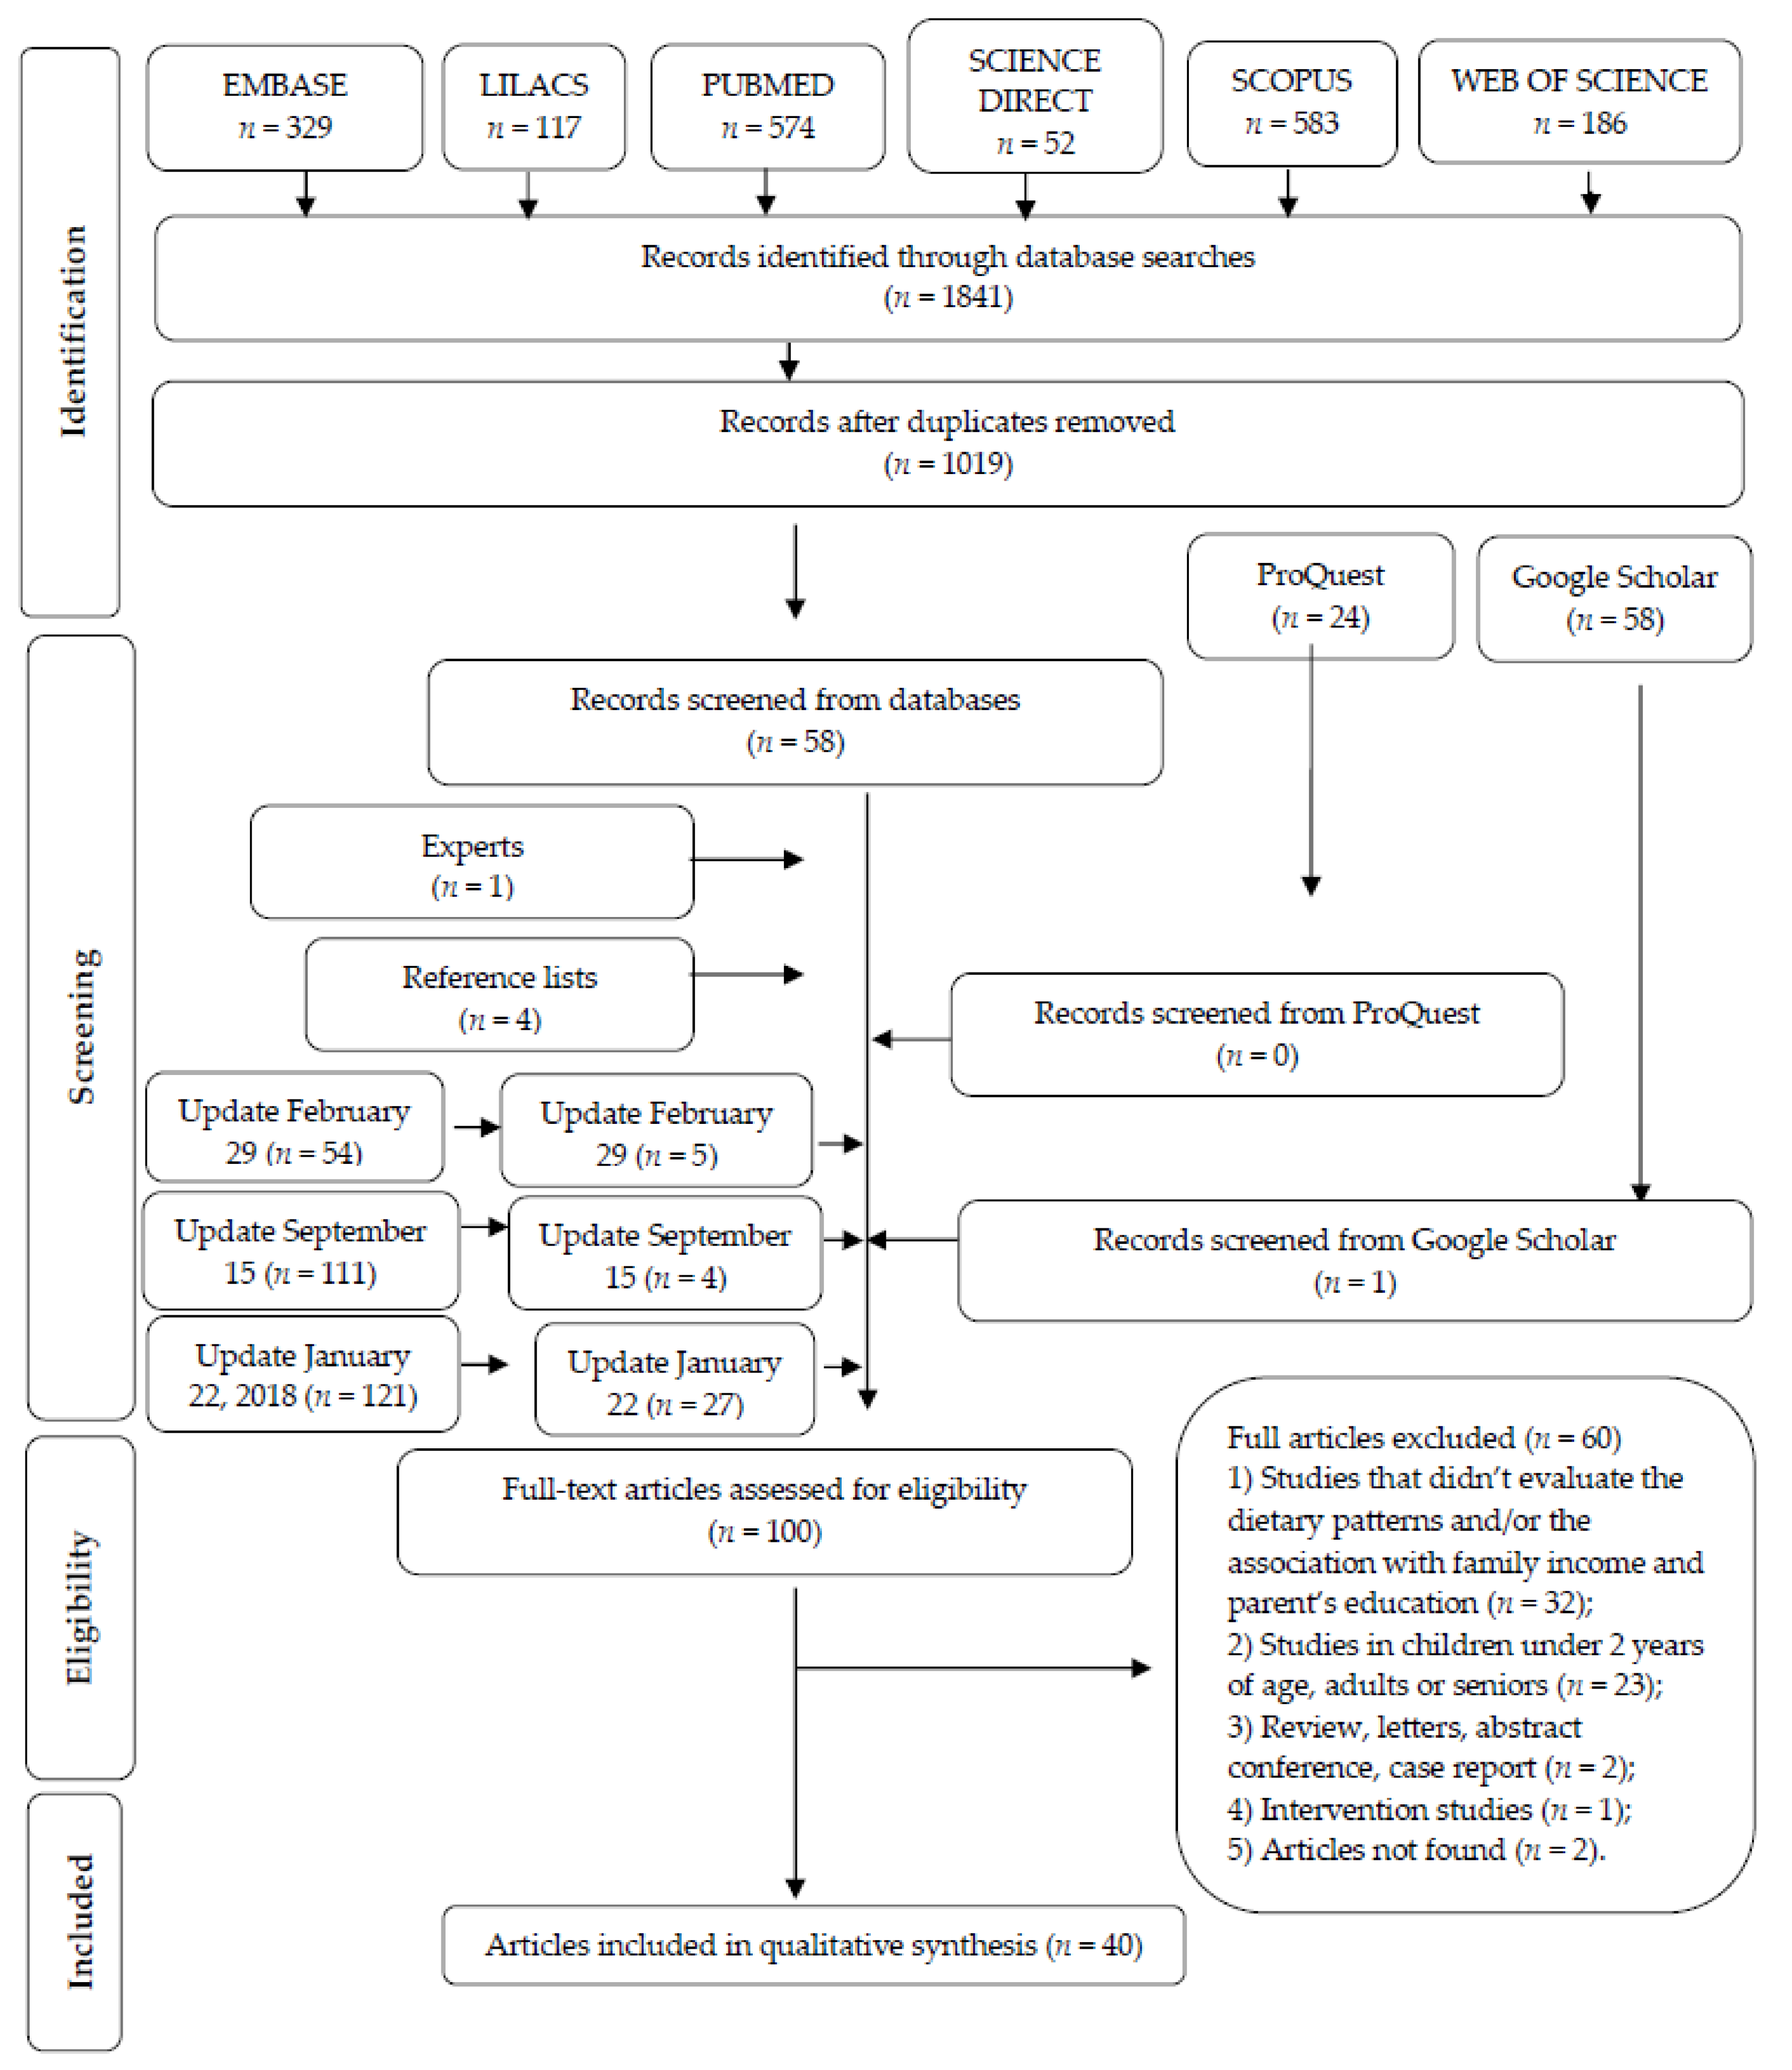
3.1. Study Selection
3.2. Study Characteristics
3.3. Risk of Bias within Individual Studies
3.4. Synthesis of Results
3.4.1. Cohort Studies from High and Medium Human Development Countries (HHDC and MHDC, Respectively)
3.4.2. Cross-Sectional Studies from High Human Development Countries (HHDC)
3.4.3. Cross-Sectional Studies from Medium and Low Human Development Countries (MHDC and LHDC)
4. Discussion
5. Conclusions
Supplementary Materials
Acknowledgments
Author Contributions
Conflicts of Interest
References
- Monteiro, C.A.; Moura, E.C.; Conde, W.L.; Popkin, B.M. Socioeconomic status and obesity in adult populations of developing countries: A review. Bull. World Health Organ. 2004, 82, 940–946. [Google Scholar]
- Turrell, G.; Hewitt, B.; Patterson, C.; Oldenburg, B. Measuring socio-economic position in dietary research: Is choice of socio-economic indicator important? Public Health Nutr. 2002, 6, 191–200. [Google Scholar] [CrossRef] [PubMed]
- Barros, F.C.; Victora, C.G.; Scherpbier, R.; Gwatkin, D. Socioeconomic inequities in the health and nutrition o of children in low/middle income countries. Rev. Saude Publ. 2010, 44, 1–16. [Google Scholar] [CrossRef]
- Wagner, K.H.; Brath, H. A global view on the development of non communicable diseases. Prev. Med. 2012, 54, S38–S41. [Google Scholar] [CrossRef] [PubMed]
- Mayen, A.L.; Paccaud, F.; Bovet, P.; Stringhini, S. Socioeconomic determinants of dietary patterns in low- and middle-income countries: A systematic review. Am. J. Clin. Nutr. 2014, 100, 1520–1531. [Google Scholar] [CrossRef] [PubMed]
- Hanson, M.D.; Chen, E. Socioeconomic status and health behaviors in adolescence: A review of the literature. J. Behav. Med. 2007, 30, 263–285. [Google Scholar] [CrossRef] [PubMed]
- Novaković, R.; Cavelaars, A.; Geelen, A.; Nikolić, M.; Altaba, I.I.; Viñas, B.R.; Ngo, J.; Golsorkhi, M.; Medina, M.W.; Brzozowska, A.; et al. Socio-economic determinants of micronutrient intake and status in Europe: A systematic review. Public Health Nutr. 2014, 17, 1031–1045. [Google Scholar] [CrossRef] [PubMed]
- Drewnowski, A.; Popkin, B.M. The nutrition transition: New trends in the global diet. Nutr. Rev. 1997, 55, 31–43. [Google Scholar] [CrossRef] [PubMed]
- Popkin, B.M. Global nutrition dynamics: The world is shifting rapidly toward a diet linked with noncommunicable diseases. Am. J. Clin. Nutr. 2006, 84, 289–298. [Google Scholar] [CrossRef] [PubMed]
- Popkin, B.M. The Nutrition Transition in the Developing World. Dev. Policy Rev. 2003, 21, 581–597. [Google Scholar] [CrossRef]
- Popkin, B.M.; Gordon-Larsen, P. The nutrition transition: An overview of world patterns of change. Nutr. Rev. 2004, 62, S140–S143. [Google Scholar] [CrossRef] [PubMed]
- Hawkes, C.; Chopra, M.; Friel, S. Globalization, Trade, and the Nutrition Transition. In Globalization and Health: Pathways, Evidence and Policy; Labonté, R., Schrecker, C., Eds.; Routledge: New York, NY, USA, 2009; Volume 1, pp. 235–262. [Google Scholar]
- Popkin, B.; Horton, S.; Kim, S.; Mahal, A.; Shuigao, J. Trends in diet, nutritional status, and diet-related noncommunicable diseases in China and India: The economic costs of the nutrition transition. Nutr. Rev. 2001, 59, 379–390. [Google Scholar] [CrossRef] [PubMed]
- Lallukka, T.; Laaksonen, M.; Rahkonen, O.; Roos, E.; Lahelma, E. Multiple socio-economic circumstances and healthy food habits. Eur. J. Clin. Nutr. 2007, 61, 701–710. [Google Scholar] [CrossRef] [PubMed]
- Galobardes, B.; Lynch, J.; Smith, G.D. Measuring socioeconomic position in health research. Br. Med. Bull. 2007, 81, 21–37. [Google Scholar] [CrossRef] [PubMed]
- Currie, C.; Molcho, M.; Boyce, W.; Holstein, B.; Torsheim, T.; Richter, M. Researching health inequalities in adolescents: The development of the Health Behaviour in School-Aged Children (HBSC) family affluence scale. Soc. Sci. Med. 2008, 66, 1429–1436. [Google Scholar] [CrossRef] [PubMed]
- Lynch, J.; Kaplan, G. Socioeconomic position. In Social Epidemiology; Berkman, L.F., Kawachi, I., Eds.; Oxford University Press: New York, NY, USA, 2003; Volume 1, pp. 13–35. [Google Scholar]
- Kant, A.K.; Graubard, B.I. Family income and education were related with 30 year time trends in dietary and meal behaviors of American children and adolescents. J. Nutr. 2013, 143, 690–700. [Google Scholar] [CrossRef] [PubMed]
- Galobardes, B.; Shaw, M.; Lawlor, D.A.; Lynch, J.W.; Smith, G.D. Indicators of socioeconomic position (part 1). J. Epidemiol. Community Health 2006, 60, 7–12. [Google Scholar] [CrossRef] [PubMed]
- Smith, A.D.A.C.; Emmett, P.M.; Newby, P.K.; Northstone, K. A comparison of dietary patterns derived by cluster and principal components analysis in a UK cohort of children. Eur. J. Clin. Nutr. 2011, 65, 1102–1109. [Google Scholar] [CrossRef] [PubMed]
- Ambrosini, G.L.; Emmett, P.M.; Northstone, K.; Jebb, S.A. Tracking a Dietary Pattern Associated with Increased Adiposity in Childhood and Adolescence. Obesity 2014, 22, 458–465. [Google Scholar] [CrossRef] [PubMed]
- North, K.; Emmett, P. Multivariate analysis of diet among three-year-old children and associations with socio-demographic characteristics. The Avon Longitudinal Study of Pregnancy and Childhood (ALSPAC) Study Team. Eur. J. Clin. Nutr. 2000, 54, 73–80. [Google Scholar] [CrossRef] [PubMed]
- McNaughton, S.A.; Ball, K.; Mishra, G.D.; Crawford, D.A. Dietary Patterns of Adolescents and Risk of Obesity and Hypertension. J. Nutr. 2008, 138, 364–370. [Google Scholar] [CrossRef] [PubMed]
- Northstone, K.; Smith, A.D.A.C.; Newby, P.K.; Emmett, P.M. Longitudinal comparisons of dietary patterns derived by cluster analysis in 7- to 13-year-old children. Br. J. Nutr. 2013, 109, 2050–2058. [Google Scholar] [CrossRef]
- Northstone, K.; Emmett, P. The associations between feeding difficulties and behaviours and dietary patterns at 2 years of age: The ALSPAC cohort. Matern. Child Nutr. 2013, 9, 533–542. [Google Scholar] [CrossRef] [PubMed]
- Lioret, S.; Betoko, A.; Forhan, A.; Charles, M.A.; Heude, B.; de Lauzon-Guillain, B.; EDEN Mother-Child Cohort Study Group. Dietary Patterns Track from Infancy to Preschool Age: Cross-Sectional and Longitudinal Perspectives. J. Nutr. 2015, 145, 775–782. [Google Scholar] [CrossRef] [PubMed]
- Ambrosini, G.L.; Oddy, W.H.; Robinson, M.; O’Sullivan, T.A.; Hands, B.P.; de Klerk, N.H.; Silburn, S.; Zubrick, S.R.; Kendall, G.E.; Stanley, F.; et al. Adolescent dietary patterns are associated with lifestyle and family psycho-social factors. Public Heath Nutr. 2009, 12, 1807–1815. [Google Scholar] [CrossRef] [PubMed]
- Fernández-Alvira, J.M.; Börnhorst, C.; Bammann, K.; Gwozdz, W.; Krogh, V.; Hebestreit, A.; Barba, G.; Reisch, L.; Eiben, G.; Iglesia, I.; et al. Prospective associations between socio-economic status and dietary patterns in European children: The identification and Prevention of Dietary and Lifestyle-induced Health Effects in Children and Infants (IDEFICS). Br. J. Nutr. 2015, 113, 517–525. [Google Scholar] [CrossRef] [PubMed]
- Gatica, G.; Barros, A.J.D.; Madruga, S.; Matijasevich, A.; Santos, I.S. Food intake profiles of children aged 12, 24 and 48 months from the 2004 Pelotas (Brazil) birth cohort: An exploratory analysis using principal components. Int. J. Behav. Nutr. Phys. Act. 2012, 9, 43. [Google Scholar] [CrossRef] [PubMed]
- Nobre, L.N.; Lamounier, J.A.; Franceschini, S.C.C. Preschool children dietary patterns and associated factors. J. Pediatr. 2012, 88, 129–136. [Google Scholar] [CrossRef]
- Silva, R.d.C.R.; Assis, A.M.O.; Szarfarc, S.C.; Pinto, E.D.J.; Costa, L.C.C.D.; Rodrigues, L.C. Socioeconomic inequality shaping the dietary patterns of children and teens. Rev. Nutr. 2012, 25, 451–461. [Google Scholar] [CrossRef]
- Garba, J.A.; Rampal, L.; Hejar, A.R.; Abdul Rahman, H. Major Dietary Patterns and their Associations with Socio-demographic Characteristics and Obesity among Adolescents in Petaling District, Malaysia. Malays. J. Med. Health Sci. 2014, 10, 13–21. [Google Scholar]
- De Pinho, L.; Silveira, M.F.; Botelho, A.; Cde, C.; Caldeira, A.P. Identification of dietary patterns of adolescents attending public schools. J. Pediatr. 2014, 90, 267–272. [Google Scholar] [CrossRef] [PubMed]
- Dinsa, G.D.; Goryakin, Y.; Fumagalli, E.; Suhrcke, M. Obesity and socioeconomic status in developing countries: A systematic review. Obes. Rev. 2012, 13, 1067–1079. [Google Scholar] [CrossRef] [PubMed]
- Ambrosini, G.L. Childhood dietary patterns and later obesity: A review of the evidence. Proc. Nutr. Soc. 2014, 73, 137–146. [Google Scholar] [CrossRef] [PubMed]
- Moher, D.; Liberati, A.; Tetzlaff, J.; Altman, D.G.; The PRISMA Group. Preferred Reporting Items for Systematic Reviews and Meta-Analyses: The PRISMA Statement. BMJ 2009, 339, b2535. [Google Scholar] [CrossRef] [PubMed]
- Kevin, W. Human Development Report 2007/2008: Fighting Climate Change: Human Solidarity in a Divided World; United Nations, Oxford University Press: New York, NY, USA, 2007; Volume 1, ISBN 978-0-230-54704-9. [Google Scholar]
- Araujo, J.; Teixeira, J.; Gaio, A.R.; Lopes, C.; Ramos, E. Dietary patterns among 13-y-old Portuguese adolescents. Nutrition 2015, 31, 148–154. [Google Scholar] [CrossRef] [PubMed]
- Borges, C.A.; Rinaldi, A.E.; Conde, W.L.; Mainardi, G.M.; Behar, D.; Slater, B. Dietary patterns: A literature review of the methodological characteristics of the main step of the multivariate analyzes. Rev. Bras. Epidemiol. 2015, 18, 837–857. [Google Scholar] [CrossRef] [PubMed]
- Oellingrath, I.M.; Svendsen, M.V.; Brantsaeter, A.L. Eating patterns and overweight in 9- to 10-year-old children in Telemark County, Norway: A cross-sectional study. Eur. J. Clin. Nutr. 2010, 64, 1272–1279. [Google Scholar] [CrossRef] [PubMed]
- Abdullah, N.F.; Teo, P.S.; Foo, L.H. Ethnic Differences in the Food Intake Patterns and Its Associated Factors of Adolescents in Kelantan, Malaysia. Nutrients 2016, 8, 551. [Google Scholar] [CrossRef] [PubMed]
- Lee, H.A.; Hwang, H.J.; Oh, S.Y.; Park, E.; Cho, S.J.; Kim, H.S.; Park, H. Which Diet-Related Behaviors in Childhood Influence a Healthier Dietary Pattern? From the Ewha Birth and Growth Cohort. Nutrients 2016, 9, 4. [Google Scholar] [CrossRef] [PubMed]
- Grieger, J.A.; Scott, J.; Cabiac, L. Dietary patterns and breast-feeding in Australian children. Public Health Nutr. 2011, 14, 1939–1947. [Google Scholar] [CrossRef] [PubMed]
- Craig, L.C.A.; McNeill, G.; Macdiarmid, J.I.; Masson, L.F.; Holmes, B.A. Dietary patterns of school-age children in Scotland: Association with socio-economic indicators, physical activity and obesity. Br. J. Nutr. 2010, 103, 319–334. [Google Scholar] [CrossRef] [PubMed]
- Bibiloni, M.L.M.; Martínez, E.; Llull, R.; Pons, A.; Tur, J.A. Western and Mediterranean dietary patterns among Balearic Islands’ adolescents: Socio-economic and lifestyle determinants. Public Heath Nutr. 2011, 15, 683–692. [Google Scholar] [CrossRef] [PubMed]
- Northstone, K.; Smith, A.D.A.C.; Cribb, V.L.; Emmett, P.M. Dietary Patterns in UK adolescents obtained from a dual-source FFQ and their associations with socio-economic position, nutrient intake and modes of eating. Public Heath Nutr. 2014, 17, 1476–1485. [Google Scholar] [CrossRef] [PubMed]
- Borges, C.A.; Slater, B.; Santaliestra-Pasías, A.M.; Mouratidou, T.; Huybrechts, I.; Widhalm, K.; Gottrand, F.; Manios, Y.; Jimenez-Pavón, D.; Valtueña, J.; et al. Dietary Patterns in European and Brazilian Adolescents: Comparisons and Associations with Socioeconomic Factors. Nutrients 2018, 10, 57. [Google Scholar] [CrossRef] [PubMed]
- Krusinska, B.; Kowalkowska, J.; Wadolowska, L.; Wuenstel, J.W.; Slowinska, M.A.; Niedzwiedzka, E. Fibre-Related Dietary Patterns: Socioeconomic Barriers to Adequate Fibre Intake in Polish Adolescents. A Short Report. Nutrients 2017, 9, 590. [Google Scholar] [CrossRef] [PubMed]
- Moreira, P.; Santos, S.; Padrão, P.; Cordeiro, T.; Bessa, M.; Valente, H.; Barros, R.; Teixeira, V.; Mitchell, V.; Lopes, C.; et al. Food Pattens According to Sociodemographics, Physical Activity, Sleeping and Obesity in Portuguese Children. Int. J. Environ. Res. Public Health 2010, 7, 1121–1138. [Google Scholar] [CrossRef] [PubMed]
- Kehoe, S.H.; Krishnaveni, G.V.; Veena, S.R.; Guntupalli, A.M.; Margetts, B.M.; Fall, C.H.; Robinson, S.M. Diet patterns are associated with demographic factors and nutritional status in South Indian children. Matern. Child Nutr. 2014, 10, 145–158. [Google Scholar] [CrossRef] [PubMed]
- Shang, X.; Li, Y.; Liu, A.; Zhang, Q.; Hu, X.; Du, S.; Ma, J.; Xu, G.; Li, Y.; Guo, H.; et al. Dietary pattern and its association with the prevalence of obesity and related cardiometabolic risk factors among Chinese children. PLoS ONE 2012, 7, e43183. [Google Scholar] [CrossRef] [PubMed]
- Villa, J.K.D.; Silva, A.R.; Santos, T.S.S.; Ribeiro, A.Q.; Pessoa, M.C.; Sant’Ana, L.F.D.R. Dietary patterns of children and socioeconomical, behavioral and maternal determinants. Rev. Paul. Pediatr. 2015, 33, 302–309. [Google Scholar] [CrossRef] [PubMed]
- Danyliw, A.D.; Vatanparast, H.; Nikpartow, N.; Whiting, S.J. Beverage intake patterns of Canadian children and adolescents. Public Heath Nutr. 2011, 14, 1961–1969. [Google Scholar] [CrossRef] [PubMed]
- The Joanna Briggs Institute. Joanna Briggs Institute Reviewers’ Manual, 2014th ed.; The Joanna Briggs Institute: Adelaide, Australia, 2014; ISBN 978-1-920684-11-2. [Google Scholar]
- Livingstone, M.B.; Robson, P.J. Measurement of dietary intake in children. Proc. Nutr. Soc. 2000, 59, 279–293. [Google Scholar] [CrossRef] [PubMed]
- Livingstone, M.B.; Robson, P.J.; Wallace, M.W. Issues in dietary intake assessment of children and adolescents. Br. J. Nutr. 2004, 92 (Suppl. 2), S213–S222. [Google Scholar] [CrossRef] [PubMed]
- Ochola, S.; Masibo, P.K. Dietary intake of schoolchildren and adolescents in developing countries. Ann. Nutr. Metab. 2014, 64 (Suppl. 2), 24–40. [Google Scholar] [CrossRef] [PubMed]
- Thompson, F.E.; Subar, A.F. Dietary Assessment Methodology. In Nutrition in the Prevention and Treatment of Disease; Coulston, A.M., Boushey, C.J., Ferruzzi, M.G., Eds.; Elsevier: Amsterdam, The Netherlands, 2013; pp. 5–46. [Google Scholar]
- Kupek, E.; Lobo, A.S.; Leal, D.B.; Bellisle, F.; de Assis, M.A. Dietary patterns associated with overweight and obesity among Brazilian schoolchildren: An approach based on the time-of-day of eating events. Br. J. Nutr. 2016, 116, 1954–1965. [Google Scholar] [CrossRef] [PubMed]
- Wu, J.C.L. Parental work characteristics and diet quality among pre-school children in dual-parent households: Results from a population-based cohort in Taiwan. Public Health Nutr. 2017, 1–9. [Google Scholar] [CrossRef] [PubMed]
- Bauce, G.; Córdova, M.; Mata, M.E. Socieconomic stratification and consumption of dietetics university students: 1991 cohort. An Venez Nutr. 1997, 10, 112–119. [Google Scholar]
- Cairella, G.; Napoletano, A.; Coclite, D.; Rossi, L.; Hofwannshian, A.; Saribekian, K.; Branca, F. A methodological approach for a nutritional surveillance system in a transition country: The case of Armenia. Ann. Ig. 1999, 11, 199–208. [Google Scholar] [PubMed]
- Camara, S.; de Lauzon-Guillain, B.; Heude, B.; Charles, M.A.; Botton, J.; Plancoulaine, S.; Forhan, A.D.; Saurel-Cubizolles, M.J.; Dargent-Molina, P.; Lioret, S. Multidimensionality of the relationship between social status and dietary patterns in early childhood: Longitudinal results from the French EDEN mother-child cohort. Int. J. Behav. Nutr. Phys. Act. 2015, 24, 12–122. [Google Scholar] [CrossRef] [PubMed]
- Aranceta, J.; Pérez-Rodrigo, C.; Ribas, L.; Serra-Majem, L. Sociodemographic and lifestyle determinants of food patterns in Spanish children and adolescentes: The enKid study. Eur. J. Clin. Nutr. 2003, 57 (Suppl. 1), S40–S44. [Google Scholar] [CrossRef] [PubMed]
- Northstone, K.; Emmett, P. Multivariate analysis of diet in children at four and seven years of age and associations with socio-demographic characteristics. Eur. J. Clin. Nutr. 2005, 59, 751–760. [Google Scholar] [CrossRef] [PubMed]
- Leventakou, V.; Sarri, K.; Georgiou, V.; Chatzea, V.; Frouzi, E.; Kastelianou, A.; Kogevinas, M.; Chatzi, L. Early life determinants of dietary patterns in preschool children: Rhea mother-child cohort, Crete, Greece. Eur. J. Clin. Nutr. 2016, 70, 60–65. [Google Scholar] [CrossRef] [PubMed]
- Wall, C.R.; Thompson, J.M.D.; Robinson, E.; Mitchell, E.A. Dietary patterns of children at 3.5 and 7 years of age: New Zealand birth cohort study. Acta Peadiatr. 2013, 102, 137–142. [Google Scholar] [CrossRef] [PubMed]
- Ovaskainen, M.L.; Nevalainen, J.; Uusitalo, L.; Tuokkola, J.J.; Arkkola, T.; Kronberg-Kippila, C.; Veijola, R.; Knip, M.; Virtanen, S.M. Some similarities in dietary clusters of pre-school children and their mothers. Br. J. Nutr. 2009, 102, 443–452. [Google Scholar] [CrossRef] [PubMed]
- Durão, C.; Severo, M.; Oliveira, A.; Moreira, P.; Guerra, A.; Barros, H.; Lopes, C. Association of maternal characteristics and behaviours with 4-year-old children’s dietary patterns. Matern. Child Nutr. 2016. [Google Scholar] [CrossRef] [PubMed]
- Manyanga, T.; Tremblay, M.S.; Chaput, J.P.; Katzmarzyk, P.T.; Fogelholm, M.; Hu, G.; Kuriyan, R.; Kurpad, A.; Lambert, E.V.; Maher, C.; et al. Socioeconomic status and dietary patterns in children from around the world: Different associations by levels of country human development? BMC Public Health 2017, 17, 457. [Google Scholar] [CrossRef] [PubMed]
- Mais, L.A.; Warkentin, S.; Vega, J.B.; de Oliveira, M.D.R.D.; Carnell, S.; Taddei, J.A.A.C. Sociodemographic, anthropometric and behavioural risk factors for ultra-processed food consumption in a sample of 2–9-year-olds in Brazil. Public Health Nutr. 2018, 21, 7–86. [Google Scholar] [CrossRef] [PubMed]
- Nasreddine, L.; Shatila, H.; Itani, L.; Hwalla, N.; Jomaa, L.; Naja, F. A traditional dietary pattern is associated with lower odds of overweight and obesity among preschool children in Lebanon: A cross-sectional study. Eur. J. Nutr. 2017, 1–12. [Google Scholar] [CrossRef] [PubMed]
- Silva, A.C.F.; Bortolini, G.A.; Jaime, P.C. Brazil’s national programs targeting childhood obesity prevention. Int. J. Obes. Suppl. 2013, 3 (Suppl. 1), S9–S11. [Google Scholar] [CrossRef] [PubMed]
- Ng, M.; Fleming, T.; Robinson, M.; Thomson, B.; Graetz, N.; Margono, C.; Mullany, E.C.; Biryukov, S.; Abbafati, C.; Abera, S.F.; et al. Global, regional, and national prevalence of overweight and obesity in children and adults during 1980–2013: A systematic analysis for the Global Burden of Disease Study 2013. Lancet 2014, 384, 766–781. [Google Scholar] [CrossRef]
- Lobstein, T.; Jackson-Leach, R.; Moodie, M.L.; Hall, K.D.; Gortmaker, S.L.; Swinburn, B.A.; James, W.P.T.; Wang, Y.; McPherson, K. Child and adolescent obesity: Part of a bigger picture. Lancet 2015, 385, 2510–2520. [Google Scholar] [CrossRef]
- Harish Ranjani, T.S.; Pradeepa, M.R.; Anjana, R.M.; Garg, R.; Anand, K.; Mohan, V. Epidemiology of childhood overweight & obesity in India: A systematic review. Indian J. Med. Res. 2016, 143, 160–174. [Google Scholar] [CrossRef]
- NCD Risk Factor Collaboration (NCD-RisC). Worldwide trends in body-mass index, underweight, overweight, and obesity from 1975 to 2016: A pooled analysis of 2416 population-based measurement studies in 128·9 million children, adolescents, and adults. Lancet 2017, 390, 2627–2642. [Google Scholar] [CrossRef]
- Darmon, N.; Drewnowski, A. Does social class predict diet quality? Am. J. Clin. Nutr. 2008, 87, 1107–1117. [Google Scholar] [CrossRef] [PubMed]
- Popkin, B.M.; Adair, L.S.; Ng, S.W. Global nutrition transition and the pandemic of obesity in developing countries. Nutr. Rev. 2012, 70, 3–21. [Google Scholar] [CrossRef] [PubMed]
- Bermudez, O.I.; Tucker, K.L. Trends in dietary patterns of Latin American populations. Cad Saude Publ. 2003, 19, S87–S99. [Google Scholar] [CrossRef]
- Bezerra, I.N.; Souza, A.M.; Pereira, R.A.; Sichieri, R. Consumption of foods away from home in Brazil. Rev Saúde Públ. 2013, 47, 200s–211s. [Google Scholar] [CrossRef]
- Andrade, G.C.; da Louzada, M.L.C.; Azeredo, C.M.; Ricardo, C.Z.; Martins, A.P.B.; Levy, R.B. Out-of-Home Food Consumers in Brazil: What do They Eat? Nutrients 2018, 10, 218. [Google Scholar] [CrossRef] [PubMed]
- Food and Agriculture Organization. Globalization of Food Systems in Developing Countries: Impact on Food Security and Nutrition; FAO: Rome, Italy, 2004; ISBN 92-5-105228-X. [Google Scholar]
- World Health Organization. Diet, Nutrition and the Prevention of Chronic Diseases; Joint WHO/FAO Expert Consultation, WHO Technical Report Series No. 916; WHO: Geneva, Switzerland, 2003. [Google Scholar]
- Smithers, L.G.; Golley, R.K.; Brazionis, L.; Lynch, J.W. Characterizing whole diets of young children from developed countries and the association between diet and health: A systematic review. Nutr. Rev. 2011, 69, 449–467. [Google Scholar] [CrossRef] [PubMed]
- Irala-Estevez, J.D.; Groth, M.; Johansson, L.; Oltersdorf, U. A systematic review of socio-economic differences in food habits in Europe: Consumption of fruit and vegetables. Eur. J. Clin. Nutr. 2000, 54, 706–714. [Google Scholar] [CrossRef] [PubMed]
- Galobardes, B.; Morabia, A.; Bernstein, M. Diet and socio-economic position: Does the use of different indicators matter? Int. J. Epidemiol. 2001, 30, 334–340. [Google Scholar] [CrossRef] [PubMed]
- Aggarwal, A.; Monsivais, P.; Cook, A.J.; Drewnowski, A. Does diet cost mediate the relation between socioeconomic position and diet quality? Eur. J. Clin. Nutr. 2011, 65, 1059–1066. [Google Scholar] [CrossRef] [PubMed]
- Lopez, C.N.; Martinez-Gonzalez, M.A.; Sanchez-Villegas, A.; Alonso, A.; Pimenta, A.M.; Bes-Rastrollo, M. Costs of Mediterranean and Western dietary patterns in a Spanish cohort and their relationship with prospective weight change. J. Epidemiol. Community Health 2009, 63, 920–927. [Google Scholar] [CrossRef] [PubMed]
- Sobal, J.; Stunkard, A.J. Socioeconomic status and obesity: A review of the literature. Psychol. Bull. 1989, 105, 260–275. [Google Scholar] [CrossRef] [PubMed]
- World Health Organization. Obesity: Preventing and Managing the Global Epidemic; WHO Technical Report Series No. 894; WHO: Geneva, Switzerland, 2000. [Google Scholar]
- Monsivais, P.; Drewnowski, A. Lower-energy-density diets are associated with higher monetary costs per kilocalorie and are consumed by women of higher socioeconomic status. J. Am. Diet. Assoc. 2009, 109, 814–822. [Google Scholar] [CrossRef] [PubMed]
- McHale, J.P. Coparenting and triadic interactions during infancy: The roles of marital distress and child gender. Dev. Psychol. 1995, 31, 985–996. [Google Scholar] [CrossRef]
- Howe, L.D.; Galobardes, B.; Matijasevich, A.; Gordon, D.; Johnston, D.; Onwujekwe, O.; Patel, R.; Webb, E.A.; Lawlor, D.A.; Hargreaves, J.R. Measuring socio-economic position for epidemiological studies in low- and middle-income countries: A methods of measurement in epidemiologic paper. Int. J. Epidemiol. 2012, 41, 871–886. [Google Scholar] [CrossRef] [PubMed]
- Lahelma, E.; Martikainen, P.; Laaksonen, M.; Aittomäki, A. Pathways between socioeconomic determinants of health. J. Epidemiol. Community Health 2004, 58, 327–332. [Google Scholar] [CrossRef] [PubMed]
- Turrell, G.; Western, J.S.; Najman, J.M. Themeasurement of social class in health research: Problems and prospects. In Just Health: Inequality in Illness, Care and Prevention; Waddell, C., Petersen, A.R., Eds.; Churchill Livingstone: Melbourne, Australia, 1994; Volume 1, pp. 87–103. [Google Scholar]
- Smith, A.F.; Baxter, S.D.; Hitchcock, D.B.; Finney, C.J.; Royer, J.A.; Guinn, C.H. Cognitive ability, social desirability, body mass index and socioeconomic status as correlates of fourth-grade children's dietary-reporting accuracy. Eur. J. Clin. Nutr. 2016, 70, 1028–1033. [Google Scholar] [CrossRef] [PubMed]
- Walker, J.L.; Ardouin, S.; Burrows, T. The validity of dietary assessment methods to accurately measure energy intake in children and adolescents who are overweight or obese: A systematic review. Eur. J. Clin. Nutr. 2018, 72, 185–197. [Google Scholar] [CrossRef] [PubMed]
- Dodd, K.W.; Guenther, P.M.; Freedman, L.S.; Subar, A.F.; Kipnis, V.; Midthune, D.; Tooze, J.A.; Krebs-Smith, S.M. Statistical methods for estimating usual intake of nutrients and foods: A review of the theory. J. Am. Diet. Assoc. 2006, 106, 1640–1650. [Google Scholar] [CrossRef] [PubMed]
- Hu, F.B. Dietary pattern analysis: A new direction in nutritional epidemiology. Curr. Opin. Lipidol. 2002, 13, 3–9. [Google Scholar] [CrossRef] [PubMed]
- Mozaffarian, D.; Ludwig, D.S. Dietary guidelines in the 21st century—A time for food. JAMA 2010, 304, 681–682. [Google Scholar] [CrossRef] [PubMed]
- Kearney, J.M.; Hulshof, K.F.; Gibney, M.J. Eating patterns-temporal distribution, converging and diverging foods, meals eaten inside and outside of the home-implications for developing FBDG. Public Health Nutr. 2001, 4, 693–698. [Google Scholar] [CrossRef] [PubMed]
- Story, M.; Kaphingst, K.M.; Robinson-O’Brien, R.; Glanz, K. Creating healthy food and eating environments: Policy and environmental approaches. Annu. Rev. Public Health 2008, 29, 253–272. [Google Scholar] [CrossRef] [PubMed]
- Jomaa, L.H.; McDonnell, E.; Probart, C. School feeding programs in developing countries: Impacts on children’s health and educational outcomes. Nutr. Rev. 2011, 69, 83–98. [Google Scholar] [CrossRef]
- Vieira, D.A.; Castro, M.A.; Fisberg, M.; Fisberg, R.M. Nutritional quality of dietary patterns of children: Are there differences inside and outside school? J. Pediatr. 2017, 93, 47–57. [Google Scholar] [CrossRef] [PubMed]
- Azeredo, C.M.; de Rezende, L.F.; Canella, D.S.; Claro, R.M.; Peres, M.F.; Luiz Odo, C.; França-Junior, I.; Kinra, S.; Hawkesworth, S.; Levy, R.B. Food environments in schools and in the immediate vicinity areassociated with unhealthy food consumption among Brazilian adolescents. Prev. Med. 2016, 88, 73–79. [Google Scholar] [CrossRef] [PubMed]


| Country | Survey Year/Follow up Time Points | Study Location | HDI | Age Range | Sample Size | DAM/DPM | SES Indicator | DP Identified | Association of SES with DP | Reference |
|---|---|---|---|---|---|---|---|---|---|---|
| High Human Development Countries | ||||||||||
| England | 1991–1992/2004–2005 7, 10 and 13 years | Avon | 0.87 (2000) | 7–13 | 6202 (7 years) 5949 (10 years) 4986 (13 years) | 3-day UFD/RRR | Maternal education | (a) “Energy dense, high fat, low fiber” | (a) Inverse (boys) (a) Data not shown (girls) | [21] |
| England | 1991–1992/2004–2005 7, 10 and 13 years | Avon | 0.87 (2000) | 7–13 | 6837 (7 years) 6972 (10 years) 5661 (13 years) | 3-day FD and 24-h DR/CA | Maternal education | (a) “Processed” cluster at all 3 time points (n = 240) (b) “Processed” cluster at any 2 time points (n = 692) | (a) Inverse (b) Inverse | [24] |
| (c) “Healthy” cluster at all 3 time points (n = 714) (d) “Healthy”” cluster at any 2 time points (n = 353) | (c) Positive (d) Positive | |||||||||
| Belgium, Cyprus Estonia GermanyHungary, Italy Spain Sweden | 2007–2008/2009–2010 2–9 years 4–11 years | Multi-center | 0.87 * (2010) | 2–9 to 4–11 | 9301 4678 B 4623 G | FFQ/CA | Maternal education Paternal education Family income | (a) “Processed” cluster at 2 time points (n = 2046) (b) “Sweet” cluster at 2 time points (n = 1300) (c) “Healthy” cluster at 2 time points (n = 1300) (d) “Processed/sweet” cluster at baseline, “healthy” cluster at follow-up (n = 2289) (e) “Healthy” cluster at baseline, “processed/sweet” cluster at follow-up (n = 445) | (a) None (maternal education and income) (a) Inverse (paternal education) (b) Inverse (maternal and paternal education and income) (c) Positive (maternal and paternal education, income) (d) None (maternal education and income) (d) positive (paternal education) (e) None (maternal and paternal education) (e) Inverse (income) | [28] |
| France | 2002–2007 2,3 and 5 years | National | 0.85 (2000) | 2–5 | 989 527 B 462 G | 3-day FFQ/PCA | Maternal education and family income | Multi–time point dietary patterns spanning 2–5 years: | [26] | |
| (a) “Processed and fast foods” | (a) Inverse (maternal education) | |||||||||
| (a) None (income) | ||||||||||
| (b) “Guidelines adherence” | (b) Positive (maternal education) | |||||||||
| (b) None (income) | ||||||||||
| France | 2002–2007 2,3 and 5 years | National | 0.85 (2000) | 2–5 | 974 520 B 454 G | 3-day FFQ/PCA | Paternal education | Multi–time point dietary patterns spanning 2–5 years: | [63] | |
| (a) “Processed and fast foods” | (a) None | |||||||||
| (b) “Guidelines adherence” | (b) Positive | |||||||||
| Korea | 2009–2015/7 and 9 years | Seoul | 0.88 (2010) | 7–9 | 279 (7 years) 360 (9 years) | FFQ/PCA | household income | (a) “Healthy intake” | (a) None | [42] |
| (b) “Animal food intake” | (b) None | |||||||||
| (c) “Snack intake” | (c) None | |||||||||
| Medium Human Development Countries | ||||||||||
| Brazil | 2004–2008 2 and 4 years | Pelotas | 0.70 (2010) | 24 to 48 months | 3790 (24 months) 3714 (48 months) | A list of food items consumed in the 24 h of the last day previous to the interview that the child at as usual/PCA | Maternal education | 24 months | [29] | |
| (a) “Staple” | (a) Inverse | |||||||||
| (b) “Milks” | (b) None | |||||||||
| (c) “Snack” | (c) Inverse | |||||||||
| (d) “Beverage” | (d) None | |||||||||
| (e) “Meat and vegetables” | (e) Positive | |||||||||
| 48 months | ||||||||||
| (f) “Milks” | (f) Positive | |||||||||
| (g) “Staple” | (g) Inverse | |||||||||
| (h) “Beverages” | (h) Positive | |||||||||
| (i) “Snack” | (i) Inverse | |||||||||
| (j) “Treats” | (j) Inverse | |||||||||
| Country | Survey Year | Study Location | HDI | Age Range | Sample Size | DAM/DPM | SES Indicator | DP Identified | Association of SES with DP | Reference | |
|---|---|---|---|---|---|---|---|---|---|---|---|
| Norway | 2007 | County | 0.94 (2010) | 9–10 | 924 461 B 463 G | FFQ/PCA | Parent’s education | (a) “Snacking” (b) Junk/convenient” (c) Varied Norwegian” (d) “Dieting” | (a) Inverse (b) U shaped (c) None (d) None | [40] | |
| Australia | 2007 | National | 0.93 (2010) | 2–8 | 2287 1166 B 1121 G | 2-day, 24-h DR/PCA | Parent’s education | (a) “Healthy, meat and vegetable” | (a) Positive | [43] | |
| (b) “Combination” | (b) Positive | ||||||||||
| Australia | 2008 | National | 0.93 (2010) | 12–18 | 764 397 B 367 G | FFQ/PCA | Family income | (a) “Fruit, salad, cereals, and fish” | (a) None | [23] | |
| (b) “High fat and sugar” | (b) None | ||||||||||
| (c) “Vegetables” | (c) None | ||||||||||
| Australia | 2003–2004 | Perth | 0.90 (2000) | 14 | 1613 826 B 787 G | FFQ/FA | Maternal education and family income | (a) “Healthy” | (a) Positive (maternal education) | [27] | |
| (a) None (income) | |||||||||||
| (b) “Western” | (b) None (maternal education) | ||||||||||
| (b) Inverse (income) | |||||||||||
| Scotland | 2006 | National | 0.91 (2010) | 5–17 | 1233 | FFQ/PCA | Main food provider education and family income | 5–11-year-old | [44] | ||
| Boys | Girls | ||||||||||
| 5–11 years old (381 B, 340 G) 12–17 years old (250 B, 262 G) | (a) “Fruit and vegetables” | (a) None (education) | (a) Positive (education, income) | ||||||||
| (a) Positive (income) | |||||||||||
| (b) “Snacks” | (b) Inverse (education, income) | (b) None (education) | |||||||||
| (b) Inverse (income) | |||||||||||
| (c) “Fish and sauce” | (c) None (education, income) | (c) NA | |||||||||
| (d) “Puddings” | (d) NA | (d) Positive (education, income) | |||||||||
| 12–17 years old (250 B, 262 G) | 12–17 years old | ||||||||||
| Boys | Girls | ||||||||||
| (e) “Vegetables” | (e) positive (education, income) | (e) Positive (education, income) | |||||||||
| (f) “Fruits” | (f) NA | (f) None (education, income) | |||||||||
| (g) “Puddings” | (g) None (education) | (g) Inverse (education, income) | |||||||||
| (g) Inverse (income) | |||||||||||
| (h) “Starchy food and drinks” | (h) None (education, income) | (h) NA | |||||||||
| Spain | 2007–2008 | Balearic Islands | 0.87 | 12–17 | 1231 574 B 657 G | FFQ and 24-h DR/PCA | Parent’s education | (a) “Western” (b) “Mediterranean” (c) “Dairy products” (d) “Fast food and sweets” | (a) None (b) None (c) Positive (d) Inverse | [45] | |
| Spain | 1998–2000 | National | 0.83 (2000) | 2–24 | 3534 1629 B 1905 G | FFQ and 24-h DR/PCA | Maternal or parental education | (a) “Snacky” | (a) Positive | [64] | |
| (b) “Healthy” | (b) Positive | ||||||||||
| Canada | 2004 | National | 0.87 (2000) | 2–18 | 10,038 5119 B 4919 G | 1-day, 24-h DR/CA | Household education and family income | 2–5 years old | [53] | ||
| Boys | Girls | ||||||||||
| (a) “Fruit drink” (n = 315) | None (education and income) | ||||||||||
| (b) “Fruit juice” (n = 320) | |||||||||||
| (c) “Milk” (n = 422) | |||||||||||
| (d) “High fat milk” (n = 268) | |||||||||||
| (e) “Moderate” (n = 825) | |||||||||||
| 6–11 years old | |||||||||||
| Boys | Girls | ||||||||||
| (f) “Soft drink” (n = 412) | High fat milk “was more frequent in lower income None (education) | None (education, income) | |||||||||
| (g) “Fruit drink” (n = 601) | |||||||||||
| (h) “Fruit juice” (n = 398) | |||||||||||
| (i) “Milk” (n = 670) | |||||||||||
| (j) “High fat milk” (n = 283) | |||||||||||
| (l) “Moderate” (n = 1249) | |||||||||||
| 12–18 years old | |||||||||||
| Boys | Girls | ||||||||||
| (m) “Soft drink” (n = 648) | None (education, income) | None (education, income) | |||||||||
| (n) “Fruit drink” (n = 701) | |||||||||||
| (o) “Milk” (n = 783) | |||||||||||
| (p) “Moderate” (n = 2143) | |||||||||||
| England | 1991–1992/1998–1999 | Avon | 0.87 (2000) | 7 | 6056 3131 B 2925 G | FFQ/CA | Maternal education | (a) “Processed” (n = 4177) | (a) Inverse | [20] | |
| (b) “Plant based” (n = 2065) | (b) Positive | ||||||||||
| (c) “Traditional British” (n = 2037) | (c) None | ||||||||||
| England | 1991–1992/2004–2006 | Avon | 0.87 (2000) | 13 | 3951 1916 B 2035 G | FFQ/PCA | Maternal education | (a) “Traditional/health-conscious” | (a) Positive | [46] | |
| (b) “Processed” | (b) Inverse | ||||||||||
| (c) “Snacks/sugared drinks” | (c) Inverse | ||||||||||
| (d) “Vegetarian” | (d) Positive | ||||||||||
| England | 1998–1999 | Avon | 0.87 (2000) | 4 and 7 | 4 years old (6592) 3411 B 3171 G | FFQ/PCA | Maternal education | 4 years old | [65] | ||
| (a) “Junk” | (a) Inverse | ||||||||||
| (b) “Health conscious” | (b) Positive | ||||||||||
| (c) “Traditional” | (c) None | ||||||||||
| 7 years old (6215) 3196 B 3019 G | 7 years old | ||||||||||
| (a) “Junk” | (a) Inverse | ||||||||||
| (b) “Health conscious” | (b) Positive | ||||||||||
| (c) “Traditional” | (c) None | ||||||||||
| Greece | 2007–2011 | Creete | 0.87 (2000) | 4 | 683 | FFQ/PCA | Parent’s education | (a) “Mediterranean (b) “Snacky” (c) “Western”” | (a) None (b) Inverse (c) None | [66] | |
| New Zealand | 1995–1997 2002–2004 | Auckland | 0.87 (2000) | 3.5–7 | 550 (3.5 years); 591 (7 years) | FFQ/PCA | Maternal education | (a) “Junk” | (a) None | [67] | |
| (b) “Traditional” | (b) None | ||||||||||
| (c) “Healthy” | (c) None | ||||||||||
| Finland | 2003–2005 | Oulu and Tampere | 0.86 (2000) | 3 and 6 | 3 years old (708) | 3-day FD/CA | Maternal education | 3 years old | [68] | ||
| (a) “Fast food, sweet” (n = 387) | (a) Inverse | ||||||||||
| 6 years old (841) | 6 years old | ||||||||||
| (a) “Fast food, sweet” (n = 198) | (a) None | ||||||||||
| Portugal | 2009–2010 | Porto | 0.82 (2010) | 4 | 3422 1749 B 1673 G | FFQ/LCA | Maternal education Family income | (a) Energy-dense foods dietary pattern (n = 1400) (b) Snacking (n = 484) (c) Healthier (n = 1538) | (a) Inverse (education) (a) None (income) (b) Inverse (education) (b) None (income) (c) NA | [69] | |
| Portugal | 2006–2007 | Porto | 0.82 (2010) | 5–10 | 1976 985 B 991 G | FFQ/PCA | Maternal education | (a) “Vegetables, pulses, fruit, olive oil” | (a) Positive | [49] | |
| (b) “Fish, meat, processed meats, eggs, and starchy foods” | (b) Positive | ||||||||||
| (c) “Vegetable soup, olive oil, butter, starchy foods, and bread” | (c) Positive | ||||||||||
| (d) “Fast-food, SSB, and pastry” | (d) Inverse | ||||||||||
| European cities | 2006–2007 | Athens, Dortmund, Ghent, Lille, Rome, Stockholm, Vienna, and Zaragoza | Mean 0.81 (2010) | 12.5–17.5 | 2213 1021 B 1192 G | 24-h DR HELENA-Dietary Assessment Tool (DIAT)/PCA | Parent’s education | Boys (a) “Western” (b) Traditional European (c) Breakfast Girls (d) “Western” (e) Traditional European (f) Breakfast (g) Monotonous | Boys (a) Inverse (maternal educational) (a) None (paternal education) (b) Positive (parent’s education) (c) Positive (parent’s education) Girls (d) Inverse (parent’s education) (e) Positive (parent’s education) (f) None (parent’s education) (g) None (parent’s education) | [47] | |
| Australia | 2011–2013 | Adelaide | 0.94 (2010) | 9–11 | 508 236 B 272 G | FFQ/PCA | Household income and parent’s education. | (a) Unhealthy (b) Healthy | (a) Inverse (income and parent’s education) (b) None (income and parent’s education) | [70] | |
| Canada | 2011–2013 | Ottawa | 0.89 (2010) | 9–11 | 551 230 B 321 G | FFQ/PCA | Household income and parent’s education. | (a) Unhealthy (b) Healthy | (a) Inverse (income and parent’s education) (b) Positive (income) (b) None (parent’s education) | [70] | |
| Finland | 2011–2013 | Helsinki, Espoo and Vantaa) | 0.87 (2010) | 9–11 | 495 235 B 260 G | FFQ/PCA | Household income and parent’s education. | (a) Unhealthy (b) Healthy | (a) Inverse (income and parent’s education) (b) None (income and parent’s education) | [70] | |
| USA | 2011–2013 | Baton Rouge | 0.90 (2010) | 9–11 | 588 254 B 334 G | FFQ/PCA | Household income and parent’s education. | (a) Unhealthy (b) Healthy | (a) Inverse (income and parent’s education) (b) None (income and parent’s education) | [70] | |
| Portugal | 2011–2013 | Porto | 0.82 (2010) | 9–11 | 667 294 B 373 G | FFQ/PCA | Household income and parent’s education. | (a) Unhealthy (b) Healthy | (a) Inverse (income and parent’s education) (b) Positive (income) (b) None (parent’s education) | [70] | |
| United Kington | 2011–2013 | Bath and North East Somerset) | 0.85 (2010) | 9–11 | 465 208 B 257 G | FFQ/PCA | Household income and parent’s education. | (a) Unhealthy (b) Healthy | (a) Inverse (parent’s education) (a) None (income) (b) Positive (parent’s education) (b) None (income) | [70] | |
| Poland | 2010–2011 | Central and north-eastern Poland | 0.80 (2010) | 13–18 | 1176 551 B 625 G | FFQ/CA | Parent’s education | (a) Low-Fiber” DP (n = 446) (b) “Average-Fiber” DP (n = 286) (c) “High-Fiber” DP (n = 444) | (a, b) NA (c) Positive (parent’s education) | [48] | |
| Country | Survey Year | Study Location | HDI | Age Range | Sample Size | DAM/DPM | SES Indicator | DP Identified | Association of SES with DP | Ref. | ||
|---|---|---|---|---|---|---|---|---|---|---|---|---|
| Medium Human Development Countries | ||||||||||||
| Portugal | 2003–2004 | Porto | 0.78 (2000) | 13 | 1489 687 B 802 G | FFQ/CA | Parent’s education | (a) “Healthier” (n = 239) (b) “Dairy products” (n = 442) (c) “Fast food and sweets” (n = 212) | (a) Positive (b) Positive (c) Inverse | [38] | ||
| Malaysia | 2014 | District Selangor | 0.78 (2014) | 13–17 | 2480 882 B 1366 G | FFQ/PCA | Parent’s education and family income | (a) “Fruit and vegetable” (b) “Sugar and fat” (c) “Meat and Chicken” | (a) Positive (education) (a) None (income) (b) Positive (education) (b) None (income) (c) Positive (education, income) | [32] | ||
| Malaysia | - | Kelantan | 0.78 (2014) | 12–19 | 454 204 B 250 G | FFQ/PCA | Parent’s education and family income | (a) “Western-based” (b) “Health-based” (c) “Local-based” | Malay adolescents (a) Inverse (income) (a) None (maternal and paternal education) (b) None ((maternal and paternal education and income) (c) None ((maternal and paternal education and income) Chinese adolescents (a) None ((maternal and paternal education and income) (b) Positive (maternal education) (b) None (paternal education and income) (c) None (maternal and paternal education and income) | [41] | ||
| England | 1991–1992 1994–1995 | Avon | 0.77 (1990) | 3 | 7814 4019 B 3795 G | FFQ/PCA | Maternal education | (a) “Junk” | (a) Inverse | [22] | ||
| (b) “Healthy” | (b) Positive | |||||||||||
| (c) “Traditional” | (c) Positive | |||||||||||
| (d) “Snacks” | (d) Positive | |||||||||||
| England | 1993–1994 | Avon | 0.77 (1990) | 2 | 9599 4963 B 4636 G | FFQ/PCA | Maternal education | (a) “Family foods” (b) “Sweet and easy” (c) “Healthy conscious” | (a) Positive (b) Inverse (c) Positive | [25] | ||
| Brazil | 2008 | Salvador | 0.70 (2010) | 7–14 | 1136 577 B 559 G | FFQ/PCA | Maternal education and family income | (a) “Obesogenic” (b) “Traditional” | (a) Positive (education, income) (b) None (education, income) | [31] | ||
| Brazil | 2009–2010 | Diamantina | 0.70 (2010) | 5 | 232 - | FFQ/PCA | Maternal education and per capita income | (a) “Mixed diet” (b) “Snack” (c) “Unhealthy” | (a) None (education) (a) Positive (income) (b) Positive (education) (b) Inverse (income) (c) None (education) (c) Positive (income) | [30] | ||
| Brazil | 2011 | Montes Claros | 0.70 (2010) | 11–17 | 535 171 B 364 G | FFQ/PCA | Parent’s education and family income | (a) “Junk food” (b) “Healthy” (c) “Traditional” | (a) None (education) (a) Positive (income) (b) None (education, income) (c) None (education, income) | [33] | ||
| Brazil | 2012–2013 | Viçosa | 0.70 (2010) | 8–9 | 328 135 B 193 G | 3-day FD PCA | Maternal education | (a) “Sweetened drinks and snacks” (b) “Egg-dairy” | (a) Positive (b) Positive | [52] | ||
| Brazil | 2008–2009 | National | 0.70 | 12.5–17.5 | 3194 1635 B 1559 G | 2-day FD/PCA | Maternal education and family income | Boys (a) “Traditional Brazilian” (b) “Western” (c) “Snacks” (d) “Healthy” Girls (e) “Western” (f) “Breakfast” (g) “Sweets and Fried Foods” (h) “Traditional Brazilian” | Boys (a) Positive (maternal education and income) (b) Positive (maternal education and income) (c) None (income) (c) None (maternal education) (d) None (maternal education and income) Girls (e) Positive (income and maternal education) (f) None (income and maternal education) (g) None (income and maternal education) (h) Inverse (income) h) None (maternal education) | [47] | ||
| Brazil | 2014 | Campinas | 0.70 (2010) | 2–9 | 929 | FFQ/FA | Maternal education and family income | (a) “Traditional” (b) “Ultraprocessed” | NA (a) Inverse maternal education (b)None (family income) | [71] | ||
| India | 1997–1998 2006–2007 | Mysore | 0.52 (2010) | 9.5 | 538 254 B 284 G | FFQ PCA | Parent’s education | (a) “Snack and fruit” | (a) None | [50] | ||
| (b) “Lacto-vegetarian” | (b) None | |||||||||||
| Lebanon | 2011–2012 | National | 0.77 (2014) | 2–5 | 525 281 B 244 G | 24-h DR/FA | Maternal education | (a) Fast food and Sweets (b) Traditional Lebanese | (a) Inverse (maternal education) (b) Positive (maternal education) | [72] | ||
| China | 2009 | Beijing and four provincial capital cities including Haerbin, Jinan, Shanghai, and Guangzhou | 0.66 (2010) | 6–13 | 5267 2643 B 2624 G | 24-h DR/FA and CA | Parent’s education and monthly household income | (a) “Healthy” (n = 3679) (b) “Transitive diet” (high positive loadings on organ meat, pork, seafood, processed meat, edible fungi and algae and light vegetables) (n = 1395) (c) “Western” (m = 193) | High Healthy DP was more frequent in lower parent’s education and High “transitive diet” and “western” DP was more frequent in higher parent’s education. High transitive diet was more frequent in higher income | [51] | ||
| China | 2010 | Taiwan | 0.66 (2010) | 5 | 18046 9463 B 8583 G | FFQ/PCA | Parent’s education and family monthly income | (a) Unhealthy non-core food (b) “Health-conscious food” | (a) Inverse (parent’s education and income) (b) Positive (parent’s education and income) | [60] | ||
| Brazil | 2011–2013 | São Paulo | 0.70 (2010) | 9–11 | 501 245 B 256 G | FFQ/PCA | Household income and parent’s education | (a) Unhealthy (b) Healthy | (a) Inverse (parent’s education) (a) None (income) (b) None (income and parent’s education) | [70] | ||
| Colombia | 2011–2013 | Bogota | 0.69 (2010) | 9–11 | 914 454 B 460 G | FFQ/PCA | Household income and parent’s education | (a) Unhealthy (b) Healthy | (a) None (income and parent’s education) (b) None (parent’s education) (b) Positive (income) | [70] | ||
| China | 2011–2013 | Tianjin | 0.66 (2010) | 9–11 | 542 288 B 254 G | FFQ/PCA | Household income and parent’s education | (a) Unhealthy (b) Healthy | (a) None (income and parent’s education) (b) None (parent’s education and income) | [70] | ||
| South Africa | 2011–2013 | Cape Town | 0.60 (2010) | 9–11 | 423 167 B 256 G | FFQ/PCA | Household income and parent’s education | (a) Unhealthy (b) Healthy | (a) Inverse (income and parent’s education) (b) None (parent’s education and income) | [70] | ||
| India | 2011–2013 | Bangalore | 0.52 (2010) | 9–11 | 602 282 B 320 G | FFQ/PCA | Household income and parent’s education | (a) Unhealthy (b) Healthy | (a) Inverse (income) (a) None (parent’s education) (b) Positive (parent’s education and income) | [70] | ||
| Low Human Development Country | ||||||||||||
| Kenya | 2011–2013 | Nairobi | 0.47 (2010) | 9–11 | 552 257 B 295 G | FFQ/PCA | Household income and parent’s education | (a) Unhealthy (b) Healthy | (a) Inverse (income and parent’s education) (b) None (parent’s education and income) | [70] | ||
| Study Design/Level of Human Development | SES Indicator x Dietary Patterns | Total (Number of Times the Association Was Tested) | Direction of Association n (%) | ||
|---|---|---|---|---|---|
| Positive | Inverse | No Association | |||
| Cohort/HHDC | Education x Unhealthy | 11 | 0 | 7 (63.6) | 4 (36.4) |
| Education x Healthy | 8 | 7 (87.5) | 0 | 1 (12.5) | |
| Education x Traditional | 0 | 0 | 0 | 0 | |
| Income x Unhealthy | 4 | 0 | 2 (50.0) | 2 (50.0) | |
| Income x Healthy | 4 | 1 (25.0) | 0 | 3 (75.0) | |
| Income x Traditional | 0 | 0 | 0 | 0 | |
| Cohort/MHDC | Education x Unhealthy | 3 | 0 | 3 (100.0) | 0 |
| Education x Healthy | 1 | 1 (100.0) | 0 | 0 | |
| Education x Traditional | 2 | 0 | 2 (100.0) | 0 | |
| Income x Unhealthy | 0 | 0 | 0 | 0 | |
| Income x Healthy | 0 | 0 | 0 | 0 | |
| Income x Traditional | 0 | 0 | 0 | 0 | |
| Cross-sectional/HHDC | Education x Unhealthy | 32 | 2 (9.3) | 22 (68.8) | 7 (21.9) |
| Education x Healthy | 22 | 12 (54.5) | 0 | 10 (45.5) | |
| Education x Traditional | 8 | 3 (37.5) | 0 | 5 (62.5) | |
| Income x Unhealthy | 15 | 1(6.6) | 10 (66.7) | 4 (26.7) | |
| Income x Healthy | 14 | 6 (42.9) | 0 | 8 (57.1) | |
| Income x Traditional | 0 | 0 | 0 | 0 | |
| Cross-sectional/MHDC | Education x Unhealthy | 27 | 8 (29.6) | 8 (29.6) | 11 (40.8) |
| Education x Healthy | 17 | 7 (41.2) | 1 (5.9) | 9 (52.9) | |
| Education x Traditional | 12 | 4 (33.3) | 0 | 8 (66.7) | |
| Income x Unhealthy | 19 | 5 (26.3) | 5 (26.3) | 9 (47.4) | |
| Income x Healthy | 12 | 3 (25.0) | 0 | 9 (75.0) | |
| Income x Traditional | 7 | 2 (28.6) | 1 (14.3) | 4 (57.1) | |
| Cross-sectional/LHDC | Education x Unhealthy | 1 | 0 | 1 (100.0) | 0 |
| Education x Healthy | 1 | 0 | 0 | 1 (100.0) | |
| Education x Traditional | 0 | 0 | 0 | 0 | |
| Income x Unhealthy | 1 | 0 | 1 (100.0) | 0 | |
| Income x Healthy | 1 | 0 | 0 | 1 (100.0) | |
| Income x Traditional | 0 | 0 | 0 | 0 | |
© 2018 by the authors. Licensee MDPI, Basel, Switzerland. This article is an open access article distributed under the terms and conditions of the Creative Commons Attribution (CC BY) license (http://creativecommons.org/licenses/by/4.0/).
Share and Cite
Hinnig, P.D.F.; Monteiro, J.S.; De Assis, M.A.A.; Levy, R.B.; Peres, M.A.; Perazi, F.M.; Porporatti, A.L.; Canto, G.D.L. Dietary Patterns of Children and Adolescents from High, Medium and Low Human Development Countries and Associated Socioeconomic Factors: A Systematic Review. Nutrients 2018, 10, 436. https://0-doi-org.brum.beds.ac.uk/10.3390/nu10040436
Hinnig PDF, Monteiro JS, De Assis MAA, Levy RB, Peres MA, Perazi FM, Porporatti AL, Canto GDL. Dietary Patterns of Children and Adolescents from High, Medium and Low Human Development Countries and Associated Socioeconomic Factors: A Systematic Review. Nutrients. 2018; 10(4):436. https://0-doi-org.brum.beds.ac.uk/10.3390/nu10040436
Chicago/Turabian StyleHinnig, Patrícia De Fragas, Jordanna Santos Monteiro, Maria Alice Altenburg De Assis, Renata Bertazzi Levy, Marco Aurélio Peres, Fernanda Machado Perazi, André Luís Porporatti, and Graziela De Luca Canto. 2018. "Dietary Patterns of Children and Adolescents from High, Medium and Low Human Development Countries and Associated Socioeconomic Factors: A Systematic Review" Nutrients 10, no. 4: 436. https://0-doi-org.brum.beds.ac.uk/10.3390/nu10040436