Proteomic Profiles of Adipose and Liver Tissues from an Animal Model of Metabolic Syndrome Fed Purple Vegetables

 ,
,
Abstract
:1. Introduction
2. Materials and Methods
2.1. Experimental Design, Sample Collection and Tissue Homogenization
2.2. Sample Preparation (Denaturation, Alkylation and Digestion) and TMT Labelling
2.3. Liquid Chromatography and Tandem Mass Spectrometry (LC-MS/MS)
2.4. Protein Identification and Quantitation
2.5. In-Silico Functional Analyses
3. Results and Discussion
3.1. Adipose Tissue Protein Expression
3.1.1. Protein Folding and Endoplasmic Reticulum (ER) Stress
3.1.2. Lipid Metabolism
Lipid Synthesis
Lipid Catabolism
3.1.3. Cholesterol Efflux/Reverse Cholesterol Transport (RCT)
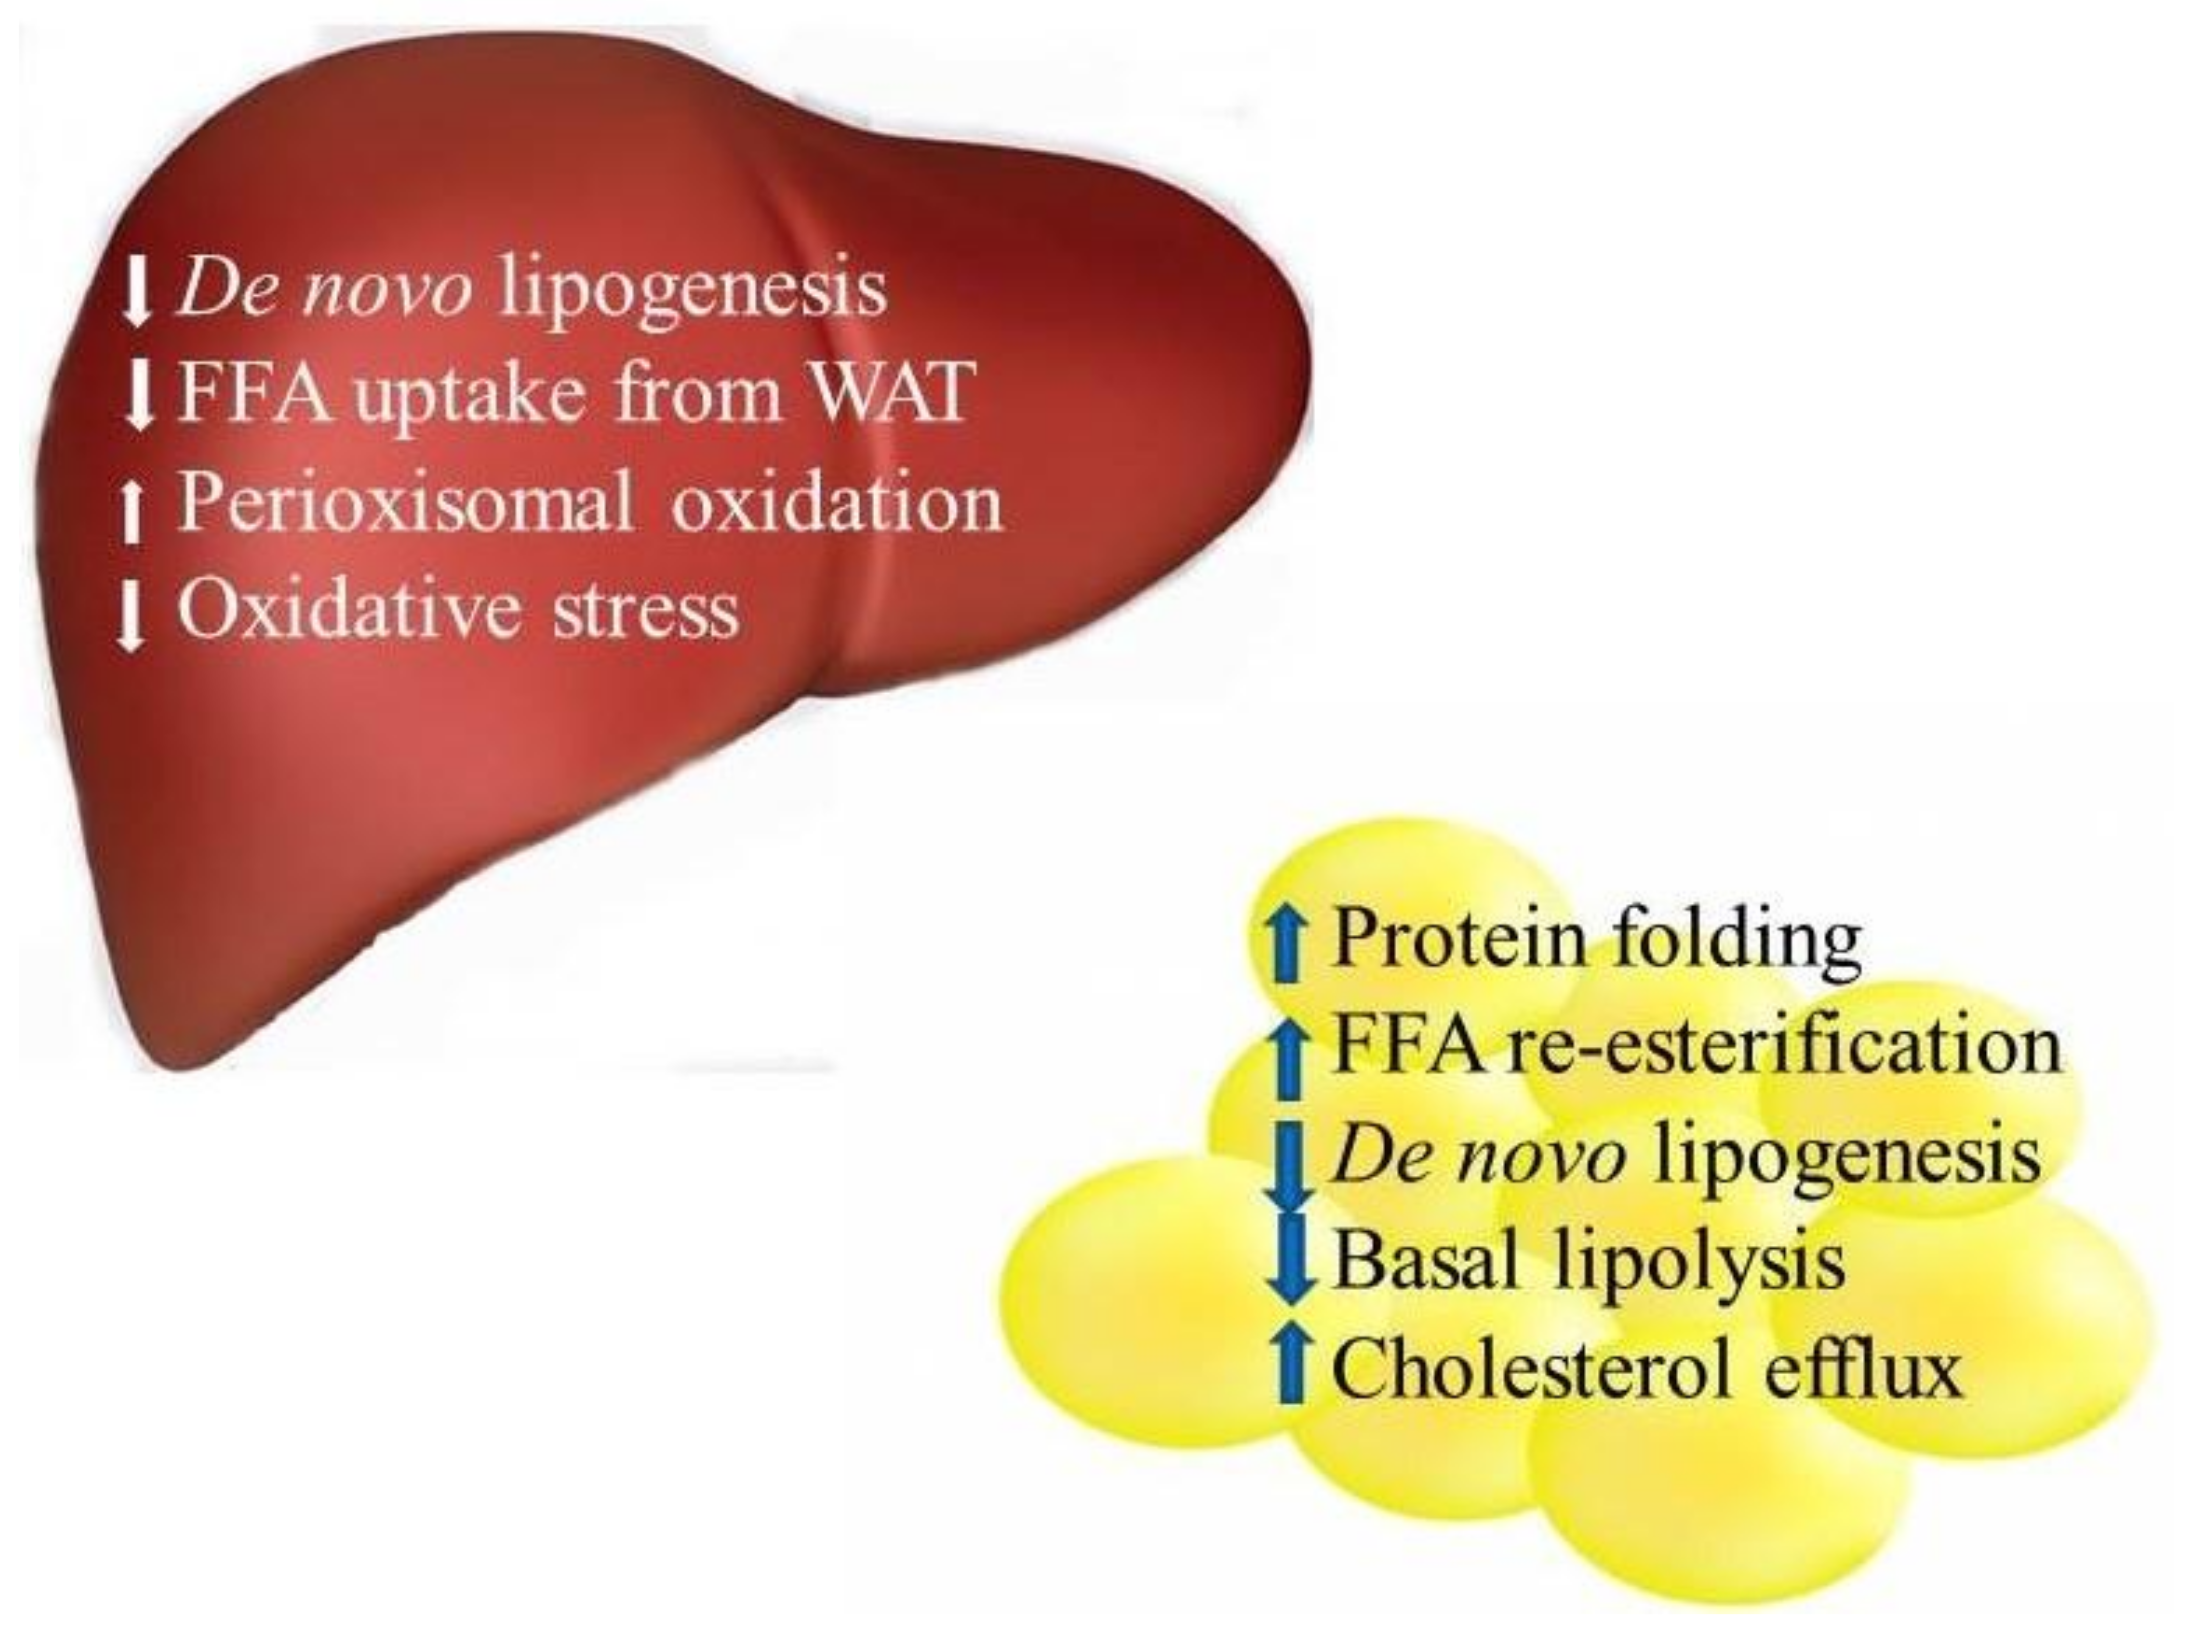
3.2. Liver Protein Expression
3.2.1. Lipid Metabolism
Lipid Synthesis
Lipid Catabolism
3.2.2. Carbohydrate Metabolism
3.2.3. Oxidative Stress
4. Conclusions
Supplementary Materials
Acknowledgments
Author Contributions
Conflicts of Interest
References
- Gallagher, E.J.; LeRoith, D.; Karnieli, E. Insulin resistance in obesity as the underlying cause for the metabolic syndrome. Mt. Sinai J. Med. J. Transl. Pers. Med. 2010, 77, 511–523. [Google Scholar] [CrossRef] [PubMed]
- Rubio-Aliaga, I.; Silva-Zolezzi, I.; Affolter, M.; Dayon, L.; Panchaud, A.; Kussmann, M. Proteomics in the systems-level study of the metabolic syndrome. In A Systems Biology Approach to Study Metabolic Syndrome; Springer: New York, NY, USA, 2014; pp. 185–212. [Google Scholar]
- Kim, E.Y.; Kim, W.K.; Oh, K.-J.; Han, B.S.; Lee, S.C.; Bae, K.-H. Recent advances in proteomic studies of adipose tissues and adipocytes. Int. J. Mol. Sci. 2015, 16, 4581–4599. [Google Scholar] [CrossRef] [PubMed]
- Maier, T.; Güell, M.; Serrano, L. Correlation of mRNA and protein in complex biological samples. FEBS Lett. 2009, 583, 3966–3973. [Google Scholar] [CrossRef] [PubMed]
- Hsieh, C.-C.; Liao, C.-C.; Liao, Y.-C.; Hwang, L.S.; Wu, L.-Y.; Hsieh, S.-C. Proteomic changes associated with metabolic syndrome in a fructose-fed rat model. J. Food Drug Anal. 2016, 24, 754–761. [Google Scholar] [CrossRef] [PubMed]
- Luo, M.; Mengos, A.E.; Stubblefield, T.M.; Mandarino, L.J. High fat diet-induced changes in hepatic protein abundance in mice. J. Proteom. Bioinform. 2012, 5, 60–66. [Google Scholar] [CrossRef]
- Seymour, E.; Lewis, S.K.; Urcuyo-Llanes, D.E.; Tanone, I.I.; Kirakosyan, A.; Kaufman, P.B.; Bolling, S.F. Regular tart cherry intake alters abdominal adiposity, adipose gene transcription, and inflammation in obesity-prone rats fed a high fat diet. J. Med. Food 2009, 12, 935–942. [Google Scholar] [CrossRef] [PubMed]
- Seymour, E.M.; Singer, A.A.; Kirakosyan, A.; Urcuyo-Llanes, D.E.; Kaufman, P.B.; Bolling, S.F. Altered hyperlipidemia, hepatic steatosis, and hepatic peroxisome proliferator-activated receptors in rats with intake of tart cherry. J. Med. Food 2008, 11, 252–259. [Google Scholar] [CrossRef] [PubMed]
- Tsuda, T.; Horio, F.; Uchida, K.; Aoki, H.; Osawa, T. Dietary cyanidin 3-O-β-D-glucoside-rich purple corn color prevents obesity and ameliorates hyperglycemia in mice. J. Nutr. 2003, 133, 2125–2130. [Google Scholar] [CrossRef] [PubMed]
- Peng, C.-H.; Liu, L.-K.; Chuang, C.-M.; Chyau, C.-C.; Huang, C.-N.; Wang, C.-J. Mulberry water extracts possess an anti-obesity effect and ability to inhibit hepatic lipogenesis and promote lipolysis. J. Agric. Food Chem. 2011, 59, 2663–2671. [Google Scholar] [CrossRef] [PubMed]
- DeFuria, J.; Bennett, G.; Strissel, K.J.; Perfield, J.W.; Milbury, P.E.; Greenberg, A.S.; Obin, M.S. Dietary blueberry attenuates whole-body insulin resistance in high fat-fed mice by reducing adipocyte death and its inflammatory sequelae. J. Nutr. 2009, 139, 1510–1516. [Google Scholar] [CrossRef] [PubMed]
- Takikawa, M.; Inoue, S.; Horio, F.; Tsuda, T. Dietary anthocyanin-rich bilberry extract ameliorates hyperglycemia and insulin sensitivity via activation of AMP-activated protein kinase in diabetic mice. J. Nutr. 2010, 140, 527–533. [Google Scholar] [CrossRef] [PubMed]
- Tsuda, T.; Ueno, Y.; Aoki, H.; Koda, T.; Horio, F.; Takahashi, N.; Kawada, T.; Osawa, T. Anthocyanin enhances adipocytokine secretion and adipocyte-specific gene expression in isolated rat adipocytes. Biochem. Biophys. Res. Commun. 2004, 316, 149–157. [Google Scholar] [CrossRef] [PubMed]
- Ayoub, H.M.; McDonald, M.R.; Sullivan, J.A.; Tsao, R.; Platt, M.; Simpson, J.; Meckling, K.A. The effect of anthocyanin-rich purple vegetable diets on metabolic syndrome in obese Zucker rats. J. Med. Food 2017, 20, 1240–1249. [Google Scholar] [CrossRef] [PubMed]
- MacPherson, R.; Huber, J.S.; Frendo-Cumbo, S.; Simpson, J.A.; Wright, D.C. Adipose tissue insulin action and IL-6 signaling after exercise in obese mice. Med. Sci. Sports Exerc. 2015, 47, 2034–2042. [Google Scholar] [CrossRef] [PubMed]
- Castellani, L.; Perry, C.G.; Macpherson, R.E.; Root-McCaig, J.; Huber, J.S.; Arkell, A.M.; Simpson, J.A.; Wright, D.C. Exercise-mediated IL-6 signaling occurs independent of inflammation and is amplified by training in mouse adipose tissue. J. Appl. Physiol. 2015, 119, 1347–1354. [Google Scholar] [CrossRef] [PubMed]
- Mahadevan, V.; Khademullah, C.S.; Dargaei, Z.; Chevrier, J.; Uvarov, P.; Kwan, J.; Bagshaw, R.D.; Pawson, T.; Emili, A.; De Koninck, Y. Native KCC2 interactome reveals PACSIN1 as a critical regulator of synaptic inhibition. eLife 2017, 6, e28270. [Google Scholar] [CrossRef] [PubMed]
- Huang, D.W.; Sherman, B.T.; Lempicki, R.A. Systematic and integrative analysis of large gene lists using DAVID bioinformatics resources. Nat. Protoc. 2009, 4, 44–57. [Google Scholar] [CrossRef] [PubMed]
- Malhotra, J.D.; Kaufman, R.J. The endoplasmic reticulum and the unfolded protein response. In Seminars in Cell & Developmental Biology; Elsevier: New York, NY, USA, 2007; pp. 716–731. [Google Scholar]
- Naidoo, N. ER and aging—Protein folding and the ER stress response. Ageing Res. Rev. 2009, 8, 150–159. [Google Scholar] [CrossRef] [PubMed]
- Flamment, M.; Hajduch, E.; Ferré, P.; Foufelle, F. New insights into ER stress-induced insulin resistance. Trends Endocrinol. Metab. 2012, 23, 381–390. [Google Scholar] [CrossRef] [PubMed]
- Wang, X.; Zhang, Z.-F.; Zheng, G.-H.; Wang, A.-M.; Sun, C.-H.; Qin, S.-P.; Zhuang, J.; Lu, J.; Ma, D.-F.; Zheng, Y.-L. The inhibitory effects of purple sweet potato color on hepatic inflammation is associated with restoration of NAD+ levels and attenuation of NLRP3 inflammasome activation in high-fat-diet-treated mice. Molecules 2017, 22, 1315. [Google Scholar] [CrossRef] [PubMed]
- Huber, M.D.; Vesely, P.W.; Datta, K.; Gerace, L. Erlins restrict SREBP activation in the ER and regulate cellular cholesterol homeostasis. J. Cell Biol. 2013, 203, 427–436. [Google Scholar] [CrossRef] [PubMed]
- Nye, C.; Kim, J.; Kalhan, S.C.; Hanson, R.W. Reassessing triglyceride synthesis in adipose tissue. Trends Endocrinol. Metab. 2008, 19, 356–361. [Google Scholar] [CrossRef] [PubMed]
- Franckhauser, S.; Muñoz, S.; Pujol, A.; Casellas, A.; Riu, E.; Otaegui, P.; Su, B.; Bosch, F. Increased fatty acid re-esterification by PEPCK overexpression in adipose tissue leads to obesity without insulin resistance. Diabetes 2002, 51, 624–630. [Google Scholar] [CrossRef] [PubMed]
- Turban, S.; Hajduch, E. Protein kinase C isoforms: Mediators of reactive lipid metabolites in the development of insulin resistance. FEBS Lett. 2011, 585, 269–274. [Google Scholar] [CrossRef] [PubMed]
- Cao, J.; Li, J.-L.; Li, D.; Tobin, J.F.; Gimeno, R.E. Molecular identification of microsomal acyl-CoA: Glycerol-3-phosphate acyltransferase, a key enzyme in de novo triacylglycerol synthesis. Proc. Natl. Acad. Sci. USA 2006, 103, 19695–19700. [Google Scholar] [CrossRef] [PubMed]
- Tulenko, T.N.; Sumner, A.E. The physiology of lipoproteins. J. Nucl. Cardiol. 2002, 9, 638–649. [Google Scholar] [CrossRef] [PubMed]
- Larsson, M.; Vorrsjö, E.; Talmud, P.; Lookene, A.; Olivecrona, G. Apolipoproteins CI and C-III inhibit lipoprotein lipase activity by displacement of the enzyme from lipid droplets. J. Biol. Chem. 2013, 288, 33997–34008. [Google Scholar] [CrossRef] [PubMed]
- Hegardt, F.G. Mitochondrial 3-hydroxy-3-methylglutaryl-CoA synthase: A control enzyme in ketogenesis. Biochem. J. 1999, 338, 569–582. [Google Scholar] [CrossRef] [PubMed]
- MacPherson, R.E.; Peters, S.J. Piecing together the puzzle of perilipin proteins and skeletal muscle lipolysis. Appl. Physiol. Nutr. Metab. 2015, 40, 641–651. [Google Scholar] [CrossRef] [PubMed]
- Tansey, J.; Sztalryd, C.; Gruia-Gray, J.; Roush, D.; Zee, J.; Gavrilova, O.; Reitman, M.; Deng, C.-X.; Li, C.; Kimmel, A. Perilipin ablation results in a lean mouse with aberrant adipocyte lipolysis, enhanced leptin production, and resistance to diet-induced obesity. Proc. Natl. Acad. Sci. USA 2001, 98, 6494–6499. [Google Scholar] [CrossRef] [PubMed]
- Soni, K.G.; Lehner, R.; Metalnikov, P.; O’Donnell, P.; Semache, M.; Gao, W.; Ashman, K.; Pshezhetsky, A.V.; Mitchell, G.A. Carboxylesterase 3 (EC 3.1. 1.1) is a major adipocyte lipase. J. Biol. Chem. 2004, 279, 40683–40689. [Google Scholar] [CrossRef] [PubMed]
- Jernås, M.; Olsson, B.; Arner, P.; Jacobson, P.; Sjöström, L.; Walley, A.; Froguel, P.; McTernan, P.G.; Hoffstedt, J.; Carlsson, L.M. Regulation of carboxylesterase 1 (CES1) in human adipose tissue. Biochem. Biophys. Res. Commun. 2009, 383, 63–67. [Google Scholar] [CrossRef] [PubMed]
- Reddy, J.K.; Hashimoto, T. Peroxisomal β-oxidation and peroxisome proliferator–activated receptor α: An adaptive metabolic system. Annu. Rev. Nutr. 2001, 21, 193–230. [Google Scholar] [CrossRef] [PubMed]
- Ahmadian, M.; Wang, Y.; Sul, H.S. Lipolysis in adipocytes. Int. J. Biochem. Cell Biol. 2010, 42, 555–559. [Google Scholar] [CrossRef] [PubMed]
- Braseamble, D. The perilipin family of structural lípid droplet proteins: Stabilization of lípid droplets and control of lipolysis. J. Lipid Res. 2007, 48, 2547–2559. [Google Scholar]
- Lass, A.; Zimmermann, R.; Haemmerle, G.; Riederer, M.; Schoiswohl, G.; Schweiger, M.; Kienesberger, P.; Strauss, J.G.; Gorkiewicz, G.; Zechner, R. Adipose triglyceride lipase-mediated lipolysis of cellular fat stores is activated by CGI-58 and defective in chanarin-dorfman syndrome. Cell Metab. 2006, 3, 309–319. [Google Scholar] [CrossRef] [PubMed]
- Miccoli, R.; Bianchi, C.; Penno, G.; Del Prato, S. Insulin resistance and lipid disorders. Future Lipidol. 2008, 3, 651–664. [Google Scholar] [CrossRef]
- Lewis, G.F.; Rader, D.J. New insights into the regulation of HDL metabolism and reverse cholesterol transport. Circ. Res. 2005, 96, 1221–1232. [Google Scholar] [CrossRef] [PubMed]
- Lin, Y.-C.; Ma, C.; Hsu, W.-C.; Lo, H.-F.; Yang, V.C. Molecular interaction between caveolin-1 and ABCA1 on high-density lipoprotein-mediated cholesterol efflux in aortic endothelial cells. Cardiovasc. Res. 2007, 75, 575–583. [Google Scholar] [CrossRef] [PubMed]
- Remaley, A.T.; Stonik, J.A.; Demosky, S.J.; Neufeld, E.B.; Bocharov, A.V.; Vishnyakova, T.G.; Eggerman, T.L.; Patterson, A.P.; Duverger, N.J.; Santamarina-Fojo, S. Apolipoprotein specificity for lipid efflux by the human ABCAI transporter. Biochem. Biophys. Res. Commun. 2001, 280, 818–823. [Google Scholar] [CrossRef] [PubMed]
- Gall, J.; Frisdal, E.; Bittar, R.; Le Goff, W.; Bruckert, E.; Lesnik, P.; Guerin, M.; Giral, P. Association of cholesterol efflux capacity with clinical features of metabolic syndrome: Relevance to atherosclerosis. J. Am. Heart Assoc. 2016, 5, e004808. [Google Scholar] [CrossRef] [PubMed]
- Saleheen, D.; Scott, R.; Javad, S.; Zhao, W.; Rodrigues, A.; Picataggi, A.; Lukmanova, D.; Mucksavage, M.L.; Luben, R.; Billheimer, J. Association of HDL cholesterol efflux capacity with incident coronary heart disease events: A prospective case-control study. Lancet Diabetes Endocrinol. 2015, 3, 507–513. [Google Scholar] [CrossRef]
- Bauer, D.E.; Hatzivassiliou, G.; Zhao, F.; Andreadis, C.; Thompson, C.B. ATP citrate lyase is an important component of cell growth and transformation. Oncogene 2005, 24, 6314–6322. [Google Scholar] [CrossRef] [PubMed]
- Wang, Q.; Jiang, L.; Wang, J.; Li, S.; Yu, Y.; You, J.; Zeng, R.; Gao, X.; Rui, L.; Li, W. Abrogation of hepatic ATP-citrate lyase protects against fatty liver and ameliorates hyperglycemia in leptin receptor-deficient mice. Hepatology 2009, 49, 1166–1175. [Google Scholar] [CrossRef] [PubMed]
- Russell, D.W. Cholesterol biosynthesis and metabolism. Cardiovasc. Drugs Ther. 1992, 6, 103–110. [Google Scholar] [CrossRef] [PubMed]
- Mihalik, S.J.; Steinberg, S.J.; Pei, Z.; Park, J.; Kim, D.G.; Heinzer, A.K.; Dacremont, G.; Wanders, R.J.; Cuebas, D.A.; Smith, K.D. Participation of two members of the very long-chain acyl-CoA synthetase family in bile acid synthesis and recycling. J. Biol. Chem. 2002, 277, 24771–24779. [Google Scholar] [CrossRef] [PubMed]
- Möller, G.; Van Grunsven, E.; Wanders, R.; Adamski, J. Molecular basis of d-bifunctional protein deficiency. Mol. Cell. Endocrinol. 2001, 171, 61–70. [Google Scholar] [CrossRef]
- Seltman, H.; Diven, W.; Rizk, M.; Noland, B.; Chanderbhan, R.; Scallen, T.; Vahouny, G.; Sanghvi, A. Regulation of bile-acid synthesis. Role of sterol carrier protein2 in the biosynthesis of 7α-hydroxycholesterol. Biochem. J. 1985, 230, 19–24. [Google Scholar] [CrossRef] [PubMed]
- Kondo, K.H.; Kai, M.H.; Setoguchi, Y.; Eggertsen, G.; Sjöblom, P.; Setoguchi, T.; Okuda, K.I.; Björkhem, I. Cloning and expression of cDNA of human δ4-3-oxosteroid 5β-reductase and substrate specificity of the expressed enzyme. FEBS J. 1994, 219, 357–363. [Google Scholar]
- Coleman, R.A.; Lewin, T.M.; Van Horn, C.G.; Gonzalez-Baró, M.R. Do long-chain acyl-CoA synthetases regulate fatty acid entry into synthetic versus degradative pathways? J. Nutr. 2002, 132, 2123–2126. [Google Scholar] [CrossRef] [PubMed]
- Bu, S.Y.; Mashek, D.G. Hepatic long-chain acyl-CoA synthetase 5 mediates fatty acid channeling between anabolic and catabolic pathways. J. Lipid Res. 2010, 51, 3270–3280. [Google Scholar] [CrossRef] [PubMed]
- Li, L.O.; Ellis, J.M.; Paich, H.A.; Wang, S.; Gong, N.; Altshuller, G.; Thresher, R.J.; Koves, T.R.; Watkins, S.M.; Muoio, D.M. Liver-specific loss of long chain acyl-CoA synthetase-1 decreases triacylglycerol synthesis and β-oxidation and alters phospholipid fatty acid composition. J. Biol. Chem. 2009, 284, 27816–27826. [Google Scholar] [CrossRef] [PubMed]
- Xu, X.; Zhao, J.; Xu, Z.; Peng, B.; Huang, Q.; Arnold, E.; Ding, J. Structures of human cytosolic NADP-dependent isocitrate dehydrogenase reveal a novel self-regulatory mechanism of activity. J. Biol. Chem. 2004, 279, 33946–33957. [Google Scholar] [CrossRef] [PubMed]
- Berg, J.M.; Tymoczko, J.; Stryer, L. Glycolysis is an energy-conversion pathway in many organisms. In Biochemistry, 5th ed.; W.H. Freeman: New York, NY, USA, 2002. [Google Scholar]
- Berg, J.; Tymoczko, J.; Stryer, L. The pentose phosphate pathway generates NADPH and synthesizes five-carbon sugars. In Biochemistry, 5th ed.; W.H. Freeman: New York, NY, USA, 2002. [Google Scholar]
- Lu, S.C. Glutathione synthesis. Biochim. Biophys. Acta (BBA)-Gen. Subj. 2013, 1830, 3143–3153. [Google Scholar] [CrossRef] [PubMed]
- Adeva-Andany, M.M.; González-Lucán, M.; Donapetry-García, C.; Fernández-Fernández, C.; Ameneiros-Rodríguez, E. Glycogen metabolism in humans. BBA Clin. 2016, 5, 85–100. [Google Scholar] [CrossRef] [PubMed]
- Tang, W.H.; Martin, K.A.; Hwa, J. Aldose reductase, oxidative stress, and diabetic mellitus. Front. Pharmacol. 2012, 3, 87. [Google Scholar] [CrossRef] [PubMed]
- Chelikani, P.; Fita, I.; Loewen, P. Diversity of structures and properties among catalases. Cell. Mol. Life Sci. 2004, 61, 192–208. [Google Scholar] [CrossRef] [PubMed]
- Liu, W.; Baker, S.S.; Baker, R.D.; Nowak, N.J.; Zhu, L. Upregulation of hemoglobin expression by oxidative stress in hepatocytes and its implication in nonalcoholic steatohepatitis. PLoS ONE 2011, 6, e24363. [Google Scholar] [CrossRef] [PubMed]
- Gomer, C.J.; Ryter, S.W.; Ferrario, A.; Rucker, N.; Wong, S.; Fisher, A.M. Photodynamic therapy-mediated oxidative stress can induce expression of heat shock proteins. Cancer Res. 1996, 56, 2355–2360. [Google Scholar] [PubMed]
- Miura, Y.; Kano, M.; Abe, K.; Urano, S.; Suzuki, S.; Toda, T. Age-dependent variations of cell response to oxidative stress: Proteomic approach to protein expression and phosphorylation. Electrophoresis 2005, 26, 2786–2796. [Google Scholar] [CrossRef] [PubMed]
- Eltoweissy, M.; Müller, G.A.; Bibi, A.; Van Nguye, P.; Dihazi, G.H.; Müller, C.A.; Dihazi, H. Proteomics analysis identifies PARK7 as an important player for renal cell resistance and survival under oxidative stress. Mol. Biosyst. 2011, 7, 1277–1288. [Google Scholar] [CrossRef] [PubMed]
- Houstis, N.E. Reactive Oxygen Species Play a Causal Role in Multiple Forms of Insulin Resistance; Massachusetts Institute of Technology: Cambridge, MA, USA, 2007. [Google Scholar]
- Rodrigo, R.; González, J.; Paoletto, F. The role of oxidative stress in the pathophysiology of hypertension. Hypertens. Res. 2011, 34, 431–440. [Google Scholar] [CrossRef] [PubMed]
- Park, E.; Giacca, A. Mechanisms underlying fat-induced hepatic insulin resistance. Future Lipidol. 2007, 2, 503–512. [Google Scholar] [CrossRef]
- Polimeni, L.; Del Ben, M.; Baratta, F.; Perri, L.; Albanese, F.; Pastori, D.; Violi, F.; Angelico, F. Oxidative stress: New insights on the association of non-alcoholic fatty liver disease and atherosclerosis. World J. Hepatol. 2015, 7, 1325. [Google Scholar] [CrossRef] [PubMed]
- Kaspar, K.L.; Park, J.S.; Brown, C.R.; Mathison, B.D.; Navarre, D.A.; Chew, B.P. Pigmented potato consumption alters oxidative stress and inflammatory damage in men. J. Nutr. 2011, 141, 108–111. [Google Scholar] [CrossRef] [PubMed]
- Poudyal, H.; Panchal, S.; Brown, L. Comparison of purple carrot juice and β-carotene in a high-carbohydrate, high-fat diet-fed rat model of the metabolic syndrome. Br. J. Nutr. 2010, 104, 1322–1332. [Google Scholar] [CrossRef] [PubMed]
- Zhang, H.; Liu, R.; Tsao, R. Anthocyanin-rich phenolic extracts of purple root vegetables inhibit pro-inflammatory cytokines induced by H2O2 and enhance antioxidant enzyme activities in Caco-2 cells. J. Funct. Foods 2016, 22, 363–375. [Google Scholar] [CrossRef]
- Nagle, C.A.; Klett, E.L.; Coleman, R.A. Hepatic triacylglycerol accumulation and insulin resistance. J. Lipid Res. 2009, 50, S74–S79. [Google Scholar] [CrossRef] [PubMed]
- Ahmed, M.; Neville, M.J.; Edelmann, M.J.; Kessler, B.M.; Karpe, F. Proteomic analysis of human adipose tissue after rosiglitazone treatment shows coordinated changes to promote glucose uptake. Obesity 2010, 18, 27–34. [Google Scholar] [CrossRef] [PubMed]
- Rosenow, A.; Noben, J.-P.; Jocken, J.; Kallendrusch, S.; Fischer-Posovszky, P.; Mariman, E.C.; Renes, J. Resveratrol-induced changes of the human adipocyte secretion profile. J. Proteome Res. 2012, 11, 4733–4743. [Google Scholar] [CrossRef] [PubMed]
- Bouwman, F.G.; Claessens, M.; van Baak, M.A.; Noben, J.-P.; Wang, P.; Saris, W.H.; Mariman, E.C. The physiologic effects of caloric restriction are reflected in the in vivo adipocyte-enriched proteome of overweight/obese subjects. J. Proteome Res. 2009, 8, 5532–5540. [Google Scholar] [CrossRef] [PubMed]


| Component in g/kg Diet | Control | PP 1 | PC 2 |
|---|---|---|---|
| Casein (protein) | 140 | 140 | 140 |
| L-Cystine | 1.8 | 1.8 | 1.8 |
| Lard | 120 | 120 | 120 |
| Soybean Oil | 40 | 40 | 40 |
| Maltodextrin 10 | 150 | 150 | 150 |
| Sucrose | 450 | - | 150 |
| Freeze dried baked purple potato | - | 450 | - |
| Freeze dried raw purple carrot | - | - | 300 |
| Cellulose, BW200 | 50 | 50 | 50 |
| Vitamin Mix v10037 | 10 | 10 | 10 |
| Mineral Mix s10022M | 35 | 35 | 35 |
| Choline bitartrate | 2.5 | 2.5 | 2.5 |
| Differentially Expressed Proteins | Gene Name | Log2 Fold Change 1 | Up- or Down-Regulated | p Value 2 |
|---|---|---|---|---|
| Serum albumin precursor | Alb | −0.17 | down | 0.0001 |
| Serotransferrin precursor | Tf | −0.33 | down | 0.0001 |
| Fatty acid synthase | Fasn | −0.26 | down | 0.0001 |
| Myosin-9 | Myh9 | −0.14 | down | 0.0001 |
| Alpha-1-macroglobulin precursor | A1m | 0.32 | up | 0.0001 |
| Fibrillin-1 isoform X1 | Fbn1 | −0.12 | down | 0.0001 |
| Filamin-A isoform X2 | Flna | −0.06 | down | 0.0001 |
| Spectrin beta chain, non-erythrocytic 1 isoform X1 | SPTBN1 | 0.07 | up | 0.0001 |
| 78 kDa glucose-regulated protein precursor | Hspa5 | 0.3 | up | 0.0001 |
| Membrane primary amine oxidase | Aoc3 | 0.11 | up | 0.0001 |
| Calreticulin precursor | Calr | 0.33 | up | 0.0001 |
| Transketolase isoform X1 | Tkt | −0.19 | down | 0.0001 |
| Endoplasmin precursor | Hsp90b1 | 0.33 | up | 0.0001 |
| Inter-alpha-trypsin inhibitor heavy chain H4 precursor | Itih4 | 0.12 | up | 0.0001 |
| Carboxylesterase 1D precursor | Ces1d | 0.38 | up | 0.0001 |
| Pyruvate kinase PKM isoform X2 | Pkm | −0.11 | down | 0.0001 |
| Apolipoprotein A-I preproprotein | Apoa1 | 0.26 | up | 0.0001 |
| Hemopexin precursor | Hpx | −0.3 | down | 0.0001 |
| Cofilin-1 | Cfl1 | −0.16 | down | 0.0001 |
| Vitamin D-binding protein precursor | Gc | −0.14 | down | 0.0001 |
| Fibrinogen beta chain precursor | Fgb | 0.2 | up | 0.0001 |
| Myoferlin | Myof | −0.18 | down | 0.0001 |
| Hypoxia up-regulated protein 1 isoform X1 | Hyou1 | 0.38 | up | 0.0001 |
| Plastin-3 isoform X2 | Pls3 | 0.29 | up | 0.0001 |
| Complement factor B precursor | Cfb | −0.25 | down | 0.0001 |
| Carbamoyl-phosphate synthase [ammonia], mitochondrial precursor | Cps1 | −0.38 | down | 0.0001 |
| Fibrinogen gamma chain isoform X1 | Fgg | 0.22 | up | 0.0001 |
| Dolichyl-diphosphooligosaccharide-protein glycosyltransferase subunit 2 isoform X1 | Rpn2 | 0.26 | up | 0.0001 |
| UDP-glucose:glycoprotein glucosyltransferase 1 precursor | Uggt1 | 0.15 | up | 0.0001 |
| Protein disulfide-isomerase A6 precursor | Pdia6 | 0.31 | up | 0.0001 |
| Dolichyl-diphosphooligosaccharide-protein glycosyltransferase subunit 1 precursor | Rpn1 | 0.22 | up | 0.0001 |
| Adipocyte plasma membrane-associated protein isoform X2 | Apmap | 0.16 | up | 0.0001 |
| Acetyl-coa carboxylase 1 | Acaca | −0.26 | down | 0.0001 |
| Apolipoprotein E precursor | Apoe | −0.4 | down | 0.0001 |
| Fibrinogen alpha chain isoform 2 precursor | Fga | 0.21 | up | 0.0001 |
| Catechol O-methyltransferase isoform X1 | Comt | −0.21 | down | 0.0001 |
| Peroxiredoxin-5, mitochondrial precursor | Prdx5 | −0.29 | down | 0.0001 |
| Phosphoenolpyruvate carboxykinase, cytosolic [GTP] | Pck1 | 0.19 | up | 0.0001 |
| Coronin-1A isoform X1 | CORO1A | −0.24 | down | 0.0001 |
| Hydroxymethylglutaryl-coa synthase, mitochondrial isoform X1 | Hmgcs2 | −0.25 | down | 0.0001 |
| Complement component C7 isoform X1 | C7 | −0.25 | down | 0.0001 |
| Perilipin-2 | Plin2 | −0.4 | down | 0.0001 |
| Galectin-3 | Lgals3 | −0.44 | down | 0.0001 |
| Integrin alpha-M isoform X1 | Itgam | −0.3 | down | 0.0001 |
| Brain acid soluble protein 1 | Basp1 | 0.19 | up | 0.0001 |
| Carbonyl reductase [NADPH] 1 | LOC102556347 | 0.27 | up | 0.0001 |
| Apolipoprotein C-II precursor | Apoc2 | 0.46 | up | 0.0001 |
| Laminin subunit alpha-4 precursor | Lama4 | 0.1 | up | 0.0002 |
| Protein disulfide-isomerase A3 precursor | Pdia3 | 0.22 | up | 0.0002 |
| Cathepsin D precursor | Ctsd | −0.23 | down | 0.0002 |
| Macrophage mannose receptor 1 precursor | Mrc1 | −0.14 | down | 0.0003 |
| Filamin-B | Flnb | 0.11 | up | 0.0003 |
| 3-ketoacyl-coa thiolase, mitochondrial | Acaa2 | −0.14 | down | 0.0003 |
| Chloride intracellular channel protein 1 | Clic1 | −0.15 | down | 0.0003 |
| Integrin beta-2 precursor | Itgb2 | −0.26 | down | 0.0003 |
| Cystatin-B | Cstb | −0.23 | down | 0.0003 |
| Von Willebrand factor A domain-containing protein 5A isoform X2 | LOC108348048 | −0.16 | down | 0.0003 |
| Apolipoprotein A-II isoform X1 | Apoa2 | 0.41 | up | 0.0003 |
| Neutral alpha-glucosidase AB isoform X1 | Ganab | 0.14 | up | 0.0004 |
| Transaldolase | Taldo1 | −0.14 | down | 0.0004 |
| Tissue alpha-L-fucosidase precursor | Fuca1 | 0.76 | up | 0.0004 |
| Phosphatidylethanolamine-binding protein 1 | Pebp1 | 0.36 | up | 0.0004 |
| Apolipoprotein C-I precursor | Apoc1 | 0.39 | up | 0.0005 |
| Protein disulfide-isomerase A4 precursor | Pdia4 | 0.29 | up | 0.0006 |
| Selenium-binding protein 1 isoform X1 | LOC103689947 | −0.12 | down | 0.0006 |
| Heat shock 70 kDa protein 1A | Hspa1b | 0.12 | up | 0.0006 |
| Ester hydrolase c11orf54 homolog | RGD1309534 | −0.15 | down | 0.0006 |
| Complement C3 precursor | C3 | −0.15 | down | 0.0007 |
| Reticulocalbin-1 precursor | Rcn1 | 0.29 | up | 0.0007 |
| Histidine-trna ligase, cytoplasmic | Hars | 0.27 | up | 0.0007 |
| Transmembrane glycoprotein NMB precursor | Gpnmb | −0.3 | down | 0.0009 |
| Rho GDP-dissociation inhibitor 2 isoform X1 | Arhgdib | −0.22 | down | 0.0010 |
| Granulins isoform a precursor | Grn | −0.23 | down | 0.0011 |
| Betaine-homocysteine S-methyltransferase 1 | Bhmt | −0.32 | down | 0.0011 |
| Plastin-2 isoform X2 | Lcp1 | −0.14 | down | 0.0012 |
| Transgelin-2 isoform X1 | Tagln2 | −0.15 | down | 0.0012 |
| Calnexin isoform X1 | Canx | 0.13 | up | 0.0013 |
| Nucleolin | Ncl | −0.13 | down | 0.0016 |
| Prothymosin alpha | Ptma | −0.14 | down | 0.0016 |
| ATP synthase subunit d, mitochondrial | Atp5h | −0.11 | down | 0.0017 |
| Alpha-1-acid glycoprotein precursor | Orm1 | −0.36 | down | 0.0017 |
| Perilipin-1 isoform X1 | Plin1 | 0.1 | up | 0.0018 |
| NAD(P)H-hydrate epimerase | Naxe | 0.18 | up | 0.0018 |
| Fructose-bisphosphate aldolase A isoform X2 | Aldoa | −0.09 | down | 0.0019 |
| Cysteine sulfinic acid decarboxylase isoform X1 | Csad | 0.12 | up | 0.0019 |
| Defferntially Expressed Proteins | Gene Name | Log2 Fold Change 1 | Down- or Up-Regulated | p Value 2 |
|---|---|---|---|---|
| Serum albumin precursor | Alb | −0.19 | down | 0.0001 |
| Serotransferrin precursor | Tf | −0.22 | down | 0.0001 |
| Fatty acid synthase | Fasn | −0.15 | down | 0.0001 |
| Myosin-9 | Myh9l1 | −0.07 | down | 0.0001 |
| Elongation factor 1-alpha 1 | Eef1a1 | −0.11 | down | 0.0001 |
| Filamin-A isoform X2 | Flna | −0.09 | down | 0.0001 |
| Alpha-enolase | Eno1 | −0.15 | down | 0.0001 |
| Ribosome-binding protein 1 isoform X4 | Rrbp1 | −0.16 | down | 0.0001 |
| Plastin-2 isoform X2 | Lcp1 | −0.17 | down | 0.0001 |
| Aldehyde dehydrogenase, mitochondrial precursor | Aldh2 | −0.16 | down | 0.0001 |
| Collagen alpha-1 (XIV) chain precursor | Col14a1 | −0.44 | down | 0.0001 |
| ATP-citrate synthase isoform X1 | Acly | −0.26 | down | 0.0001 |
| Glutamate dehydrogenase 1, mitochondrial precursor | Mrc1 | −0.14 | down | 0.0001 |
| Carbamoyl-phosphate synthase [ammonia], mitochondrial precursor | Cps1 | −0.75 | down | 0.0001 |
| Heterogeneous nuclear ribonucleoprotein U | Hnrnpu | −0.2 | down | 0.0001 |
| Serine protease inhibitor A3N | Serpina3n | −0.27 | down | 0.0001 |
| Decorin isoform X1 | Dcn | −0.4 | down | 0.0001 |
| Glutathione S-transferase alpha-3 | Gsta1 | −0.27 | down | 0.0001 |
| Prolargin isoform X3 | Prelp | −0.29 | down | 0.0001 |
| 3-ketoacyl-coa thiolase, mitochondrial | Acaa2 | −0.29 | down | 0.0001 |
| Acetyl-coa carboxylase 1 | Acaca | −0.18 | down | 0.0001 |
| Aspartate aminotransferase, mitochondrial | Got2 | −0.21 | down | 0.0001 |
| Heterogeneous nuclear ribonucleoprotein K isoform X2 | Hnrnpk | −0.18 | down | 0.0001 |
| ATP synthase subunit d, mitochondrial | Atp5h | −0.14 | down | 0.0001 |
| Catechol O-methyltransferase isoform X1 | Comt | −0.34 | down | 0.0001 |
| Nucleolin | Ncl | −0.32 | down | 0.0001 |
| Hydroxymethylglutaryl-coa synthase, mitochondrial isoform X1 | Hmgcs2 | −0.47 | down | 0.0001 |
| Complement component C7 isoform X1 | C7 | −0.21 | down | 0.0001 |
| Galectin-3 | Lgals3 | −0.34 | down | 0.0001 |
| Biglycan precursor | Bgn | −0.24 | down | 0.0001 |
| Granulins isoform a precursor | Grn | −0.33 | down | 0.0001 |
| Ezrin | Ezr | −0.24 | down | 0.0001 |
| Nucleophosmin | Npm1 | −0.33 | down | 0.0001 |
| Elongation factor Tu, mitochondrial precursor | Tufm | −0.12 | down | 0.0001 |
| Beta-2-glycoprotein 1 precursor | Apoh | −0.37 | down | 0.0001 |
| Betaine-homocysteine S-methyltransferase 1 | Bhmt | −0.69 | down | 0.0001 |
| Obg-like atpase 1 | Ola1 | −0.14 | down | 0.0001 |
| Glutathione S-transferase Mu 1 | Gstm1 | −0.62 | down | 0.0001 |
| High mobility group box 1 like | Hmg1l1 | −0.4 | down | 0.0001 |
| Alcohol dehydrogenase 1 | Adh1 | −0.75 | down | 0.0001 |
| Fatty acid-binding protein, liver | Fabp1 | −0.77 | down | 0.0001 |
| Von Willebrand factor A domain-containing protein 5A isoform X2 | LOC108348048 | −0.17 | down | 0.0001 |
| Serine/threonine-protein kinase N3 | Pkn3 | −0.26 | down | 0.0001 |
| Heterogeneous nuclear ribonucleoprotein M isoform b | Hnrnpm | −0.22 | down | 0.0001 |
| Argininosuccinate synthase isoform X1 | Ass1 | −0.53 | down | 0.0001 |
| Fructose-bisphosphate aldolase B | Aldob | −0.65 | down | 0.0001 |
| LIM and senescent cell antigen-like-containing domain protein 1 | Lims1 | −0.17 | down | 0.0001 |
| Arginase-1 | Arg1 | −0.5 | down | 0.0001 |
| Sorbitol dehydrogenase | Sord | −0.31 | down | 0.0001 |
| Carbonic anhydrase 3 isoform X1 | Car3 | 0.15 | up | 0.0001 |
| Vimentin | Vim | 0.23 | up | 0.0001 |
| Long-chain-fatty-acid-coa ligase 1 isoform X1 | Acsl1 | 0.12 | up | 0.0001 |
| Alpha-1-macroglobulin precursor | Pzp | 0.21 | up | 0.0001 |
| Fibrillin-1 isoform X1 | Fbn1 | 0.15 | up | 0.0001 |
| Complement C3 precursor | C3 | 0.14 | up | 0.0001 |
| Spectrin beta chain, non-erythrocytic 1 isoform X1 | Sptbn1 | 0.1 | up | 0.0001 |
| Plectin isoform 1 | Plec | 0.06 | up | 0.0001 |
| Membrane primary amine oxidase | Aoc3 | 0.21 | up | 0.0001 |
| All-trans-retinol 13,14-reductase precursor | Retsat | 0.17 | up | 0.0001 |
| Collagen alpha-3(VI) chain isoform X4 | Col6a3 | 0.12 | up | 0.0001 |
| Vinculin | Vcl | 0.12 | up | 0.0001 |
| Carboxylesterase 1D precursor | Ces1d | 0.32 | up | 0.0001 |
| Perilipin-1 isoform X1 | Plin1 | 0.19 | up | 0.0001 |
| Complement C4 precursor | C4a | 0.25 | up | 0.0001 |
| Malate dehydrogenase, cytoplasmic isoform Mdh1 | Mdh1 | 0.12 | up | 0.0001 |
| EH domain-containing protein 1 | Ehd1 | 0.13 | up | 0.0001 |
| Catalase | Cat | 0.14 | up | 0.0001 |
| Laminin subunit alpha-4 precursor | Lama4 | 0.27 | up | 0.0001 |
| Laminin subunit beta-1 isoform X2 | Lamb1 | 0.26 | up | 0.0001 |
| Laminin subunit gamma-1 precursor | Lamc1 | 0.21 | up | 0.0001 |
| Aldose reductase | Akr1b1 | 0.17 | up | 0.0001 |
| Periostin isoform X2 | Postn | 0.25 | up | 0.0001 |
| Hormone-sensitive lipase | Lipe | 0.18 | up | 0.0001 |
| L-lactate dehydrogenase B chain isoform Ldhb | Ldhb | 0.15 | up | 0.0001 |
| Succinyl-coa:3-ketoacid coenzyme A transferase 1, mitochondrial precursor | Oxct1 | 0.15 | up | 0.0001 |
| Dolichyl-diphosphooligosaccharide-protein glycosyltransferase subunit 2 isoform X1 | Rpn2 | 0.12 | up | 0.0001 |
| Cysteine sulfinic acid decarboxylase isoform X1 | Csad | 0.16 | up | 0.0001 |
| Cell surface glycoprotein MUC18 isoform 1 precursor | Mcam | 0.24 | up | 0.0001 |
| Adipocyte plasma membrane-associated protein isoform X2 | Apmap | 0.19 | up | 0.0001 |
| Alanine aminotransferase 1 isoform X1 | Gpt | 0.19 | up | 0.0001 |
| Nidogen-1 isoform X2 | Nid1 | 0.18 | up | 0.0001 |
| Fibrinogen alpha chain isoform 2 precursor | Fga | 0.17 | up | 0.0001 |
| Annexin A3 isoform X1 | Anxa3 | 0.16 | up | 0.0001 |
| Glutathione peroxidase 3 precursor | Gpx3 | 0.2 | up | 0.0001 |
| Phosphoenolpyruvate carboxykinase, cytosolic [GTP] | Pck1 | 0.32 | up | 0.0001 |
| Perilipin-4 isoform X2 | Plin4 | 0.21 | up | 0.0001 |
| Laminin subunit alpha-2 isoform X1 | Lama2 | 0.23 | up | 0.0001 |
| Heat shock protein beta-1 | Hspb1 | 0.27 | up | 0.0001 |
| Integrin alpha-7 isoform X1 | Itga7 | 0.18 | up | 0.0001 |
| Acetolactate synthase-like protein | Ilvbl | 0.21 | up | 0.0001 |
| Caveolin-1 isoform alpha | Cav1 | 0.29 | up | 0.0001 |
| Ras-related protein Rab-18 isoform X1 | Rab18 | 0.16 | up | 0.0001 |
| Apolipoprotein A-II isoform X1 | Apoa2 | 0.37 | up | 0.0001 |
| 1-acyl-sn-glycerol-3-phosphate acyltransferase gamma | Agpat3 | 0.18 | up | 0.0001 |
| GNAS isoform GNASL | Gnas | 0.22 | up | 0.0001 |
| Chloride intracellular channel protein 1 | Clic1 | −0.15 | down | 0.0001 |
| Neprilysin isoform X1 | Mme | 0.24 | up | 0.0001 |
| Creatine kinase B-type | Ckb | −0.15 | down | 0.0001 |
| Protein S100-B isoform X1 | S100b | 0.17 | up | 0.0001 |
| Fibrinogen beta chain precursor | Fgb | 0.14 | up | 0.0001 |
| Calumenin isoform a precursor | Calu | 0.15 | up | 0.0001 |
| T-complex protein 1 subunit zeta | Cct6a | −0.12 | down | 0.0001 |
| Hepatoma-derived growth factor | Hdgf | −0.3 | down | 0.0001 |
| Transaldolase | Taldo1 | −0.13 | down | 0.0002 |
| Sorbin and SH3 domain-containing protein 2 | Sorbs2 | 0.29 | up | 0.0002 |
| Fibrinogen gamma chain isoform X1 | Fgg | 0.14 | up | 0.0002 |
| Dysferlin | Dysf | 0.16 | up | 0.0002 |
| Aminoacyl trna synthase complex-interacting multifunctional protein 1 | Aimp1 | −0.32 | down | 0.0002 |
| Apolipoprotein C-III precursor | Apoc3 | 0.25 | up | 0.0002 |
| Heat shock 70 kDa protein 1A | Hspa1b | 0.11 | up | 0.0002 |
| Transmembrane protein 43 | Tmem43 | 0.14 | up | 0.0002 |
| Monoglyceride lipase isoform X1 | Mgll | 0.14 | up | 0.0002 |
| Apolipoprotein A-IV precursor | Apoa4 | 0.15 | up | 0.0002 |
| Alcohol dehydrogenase [NADP(+)] | Akr1a1 | −0.13 | down | 0.0002 |
| Glucose-6-phosphate isomerase | Gpi | 0.13 | up | 0.0002 |
| Lumican precursor | Lum | −0.18 | down | 0.0003 |
| Glutamine synthetase | Glul | −0.22 | down | 0.0003 |
| PDZ and LIM domain protein 1 | Pdlim1 | 0.25 | up | 0.0003 |
| Filamin-B | Flnb | 0.1 | up | 0.0003 |
| Legumain precursor | Lgmn | −0.17 | down | 0.0003 |
| RNA-binding protein FUS isoform X1 | Fus | −0.2 | down | 0.0003 |
| Septin-9 isoform 2 | Sept9 | −0.17 | down | 0.0003 |
| Delta-1-pyrroline-5-carboxylate dehydrogenase, mitochondrial | Aldh4a1 | −0.32 | down | 0.0003 |
| Cadherin-13 precursor | Cdh13 | 0.25 | up | 0.0003 |
| Apolipoprotein C-II precursor | Apoc2 | 0.34 | up | 0.0003 |
| Protein-glutamine gamma-glutamyltransferase 2 | Tgm2 | −0.3 | down | 0.0003 |
| Glutathione S-transferase Mu 2 | Gstm2 | −0.25 | down | 0.0004 |
| 60S ribosomal protein L5 | Rpl5 | −0.18 | down | 0.0004 |
| Transketolase isoform X1 | Tkt | −0.1 | down | 0.0005 |
| Synapse-associated protein 1 isoform X1 | Syap1 | 0.2 | up | 0.0005 |
| Sulfated glycoprotein 1 isoform X1 | Psap | −0.32 | down | 0.0005 |
| Camp-dependent protein kinase type II-beta regulatory subunit | Prkar2b | 0.15 | up | 0.0005 |
| Proliferation-associated protein 2G4 | Pa2g4 | −0.27 | down | 0.0005 |
| L-lactate dehydrogenase A chain isoform X1 | Ldha | −0.14 | down | 0.0005 |
| Unconventional myosin-Ic | Myo1c | 0.07 | up | 0.0006 |
| Prelamin-A/C | Lmna | 0.1 | up | 0.0006 |
| Phosphoserine aminotransferase | Psat1 | 0.15 | up | 0.0006 |
| Isocitrate dehydrogenase [NADP], mitochondrial precursor | Idh2 | −0.23 | down | 0.0006 |
| Reticulon-4 | Rtn4 | 0.18 | up | 0.0006 |
| Transmembrane glycoprotein NMB precursor | Gpnmb | −0.27 | down | 0.0006 |
| Nucleobindin-1 isoform X1 | Nucb1 | 0.13 | up | 0.0006 |
| Retinol dehydrogenase 11 precursor | Rdh11 | 0.28 | up | 0.0006 |
| Poly [ADP-ribose] polymerase 3 | Parp3 | −0.19 | down | 0.0007 |
| Hsc70-interacting protein | St13 | 0.11 | up | 0.0007 |
| 40S ribosomal protein S19 | Rps19 | −0.23 | down | 0.0007 |
| Alpha-actinin-4 | Actn4 | 0.08 | up | 0.0007 |
| Serine hydroxymethyltransferase, cytosolic | Shmt1 | −0.25 | down | 0.0008 |
| Cofilin-1 | Cfl1 | −0.12 | down | 0.0009 |
| Lamin-B1 | Lmnb1 | 0.17 | up | 0.0010 |
| Heterogeneous nuclear ribonucleoprotein A3 isoform a | Hnrnpa3 | −0.26 | down | 0.0010 |
| Polymerase I and transcript release factor | Ptrf | 0.12 | up | 0.0010 |
| Ras gtpase-activating-like protein IQGAP1 | Iqgap1 | −0.07 | down | 0.0011 |
| Probable ATP-dependent RNA helicase DDX5 isoform X1 | Ddx5 | −0.14 | down | 0.0011 |
| Eukaryotic initiation factor 4A-II isoform X1 | Eif4a2 | 0.12 | up | 0.0011 |
| Moesin | Msn | −0.14 | down | 0.0012 |
| Ribonuclease UK114 | Rida | −0.32 | down | 0.0012 |
| Dynactin subunit 2 | Dctn2 | 0.1 | up | 0.0012 |
| Splicing factor U2AF 65 kDa subunit isoform X1 | U2af2 | −0.18 | down | 0.0013 |
| Annexin A1 isoform X2 | Anxa1 | 0.11 | up | 0.0013 |
| ATP synthase subunit O, mitochondrial precursor | Atp5o | −0.13 | down | 0.0014 |
| Uncharacterized protein LOC315963 | RGD1310507 | −0.14 | down | 0.0014 |
| Coagulation factor XIII A chain | F13a1 | 0.16 | up | 0.0014 |
| 1-acylglycerol-3-phosphate O-acyltransferase ABHD5 | Abhd5 | 0.16 | up | 0.0014 |
| Receptor of activated protein C kinase 1 | Rack1 | −0.16 | down | 0.0015 |
| Ethylmalonyl-coa decarboxylase isoform X2 | Echdc1 | 0.15 | up | 0.0015 |
| Peptidyl-prolyl cis-trans isomerase FKBP9 precursor | Fkbp9 | 0.2 | up | 0.0015 |
| Glutathione S-transferase Mu 5 | Got2 | −0.43 | down | 0.0016 |
| ATP synthase-coupling factor 6, mitochondrial isoform X2 | Atp5j | −0.13 | down | 0.0016 |
| Epididymal secretory protein E1 precursor | Npc2 | −0.15 | down | 0.0016 |
| Glycerol-3-phosphate acyltransferase 3 isoform X1 | Gpat3 | 0.27 | up | 0.0016 |
| 60S ribosomal protein L4 | Rpl4 | −0.13 | down | 0.0017 |
| Carbonyl reductase [NADPH] 1 | LOC102556347 | 0.24 | up | 0.0017 |
| Transmembrane protein 120A | Tmem120a | 0.33 | up | 0.0017 |
| Annexin A5 | Anxa5 | 0.12 | up | 0.0019 |
| Trifunctional enzyme subunit alpha, mitochondrial precursor | Hadha | −0.08 | down | 0.0021 |
| Sorbin and SH3 domain-containing protein 1 isoform X6 | Sorbs1 | 0.16 | up | 0.0021 |
| Long-chain fatty acid transport protein 3 precursor | Slc27a3 | 0.22 | up | 0.0021 |
| Ceruloplasmin isoform 1 precursor | Cp | −0.08 | down | 0.0022 |
| Heterogeneous nuclear ribonucleoproteins C1/C2-like isoform X5 | LOC100911576 | −0.13 | down | 0.0022 |
| Peroxisomal bifunctional enzyme | Ehhadh | −0.29 | down | 0.0022 |
| Fructose-1,6-bisphosphatase 1 | Fbp1 | −0.52 | down | 0.0024 |
| Aconitate hydratase, mitochondrial precursor | Aco2 | 0.08 | up | 0.0025 |
| General vesicular transport factor p115 isoform X1 | Uso1 | 0.14 | up | 0.0025 |
| Antigen-presenting glycoprotein CD1d precursor | Cd1d1 | 0.18 | up | 0.0025 |
| Bifunctional glutamate/proline-trna ligase isoform X1 | Eprs | −0.12 | down | 0.0027 |
| Alpha-2-HS-glycoprotein precursor | Ahsg | −0.27 | down | 0.0027 |
| Macrophage mannose receptor 1 precursor | Mrc1 | −0.09 | down | 0.0028 |
| Peptidyl-prolyl cis-trans isomerase B precursor | Ppib | −0.17 | down | 0.0028 |
| 40S ribosomal protein S9 | LOC103689992 | −0.13 | down | 0.0028 |
| Aldehyde dehydrogenase family 8 member A1 | Aldh8a1 | −0.8 | down | 0.0028 |
| Erlin-2 isoform X1 | Erlin2 | 0.1 | up | 0.0028 |
| Peroxiredoxin-5, mitochondrial precursor | Prdx5 | −0.18 | down | 0.0029 |
| Pantetheinase precursor | Vnn1 | 0.24 | up | 0.0029 |
| Adenosylhomocysteinase | Ahcy | −0.18 | down | 0.0030 |
| 3-oxo-5-beta-steroid 4-dehydrogenase | Akr1d1 | −0.44 | down | 0.0030 |
| Septin-11 | Sept11 | −0.14 | down | 0.0032 |
| Cathepsin D precursor | Ctsd | −0.16 | down | 0.0033 |
| ATP synthase subunit delta, mitochondrial isoform X1 | Atp5d | 0.1 | up | 0.0033 |
| Coronin-1A isoform X1 | Coro1A | −0.14 | down | 0.0034 |
| Calcium-binding mitochondrial carrier protein Aralar2 isoform X1 | Slc25a13 | −0.33 | down | 0.0034 |
| Annexin A6 | Anxa6 | 0.08 | up | 0.0034 |
| 40S ribosomal protein S15 | Rps15 | 0.23 | up | 0.0034 |
| Mitochondrial dicarboxylate carrier | Slc25a10 | −0.12 | down | 0.0035 |
| Serum deprivation-response protein | Sdpr | 0.12 | up | 0.0035 |
| Ras-related protein Rab-2A | Rab2a | 0.12 | up | 0.0035 |
| Platelet endothelial cell adhesion molecule precursor | Pecam1 | 0.17 | up | 0.0036 |
| Glyceraldehyde-3-phosphate dehydrogenase | Gapdh | −0.09 | down | 0.0038 |
| Peptidyl-prolyl cis-trans isomerase A | LOC100360977 | −0.14 | down | 0.0039 |
| Actin-related protein 2/3 complex subunit 1B | Arpc1b | −0.17 | down | 0.0040 |
| Thiosulfate sulfurtransferase | Tst | −0.2 | down | 0.0040 |
| Guanine nucleotide-binding protein G(I)/G(S)/G(T) subunit beta-1 | Gnb1 | 0.14 | up | 0.0040 |
| Phenylalanine-4-hydroxylase | Pah | −0.4 | down | 0.0046 |
| Talin-1 | Tln1 | −0.05 | down | 0.0048 |
| 60S ribosomal protein L30 | Rpl30 | −0.14 | down | 0.0048 |
| Erythrocyte band 7 integral membrane protein | Stom | 0.26 | up | 0.0048 |
| Camp-dependent protein kinase catalytic subunit alpha | Prkaca | 0.23 | up | 0.0050 |
| Calcineurin B homologous protein 1 | Chp1 | 0.15 | up | 0.0050 |
| Trifunctional enzyme subunit beta, mitochondrial isoform X2 | Hadhb | −0.1 | down | 0.0052 |
| Transmembrane 9 superfamily member 3 isoform X2 | Tm9sf3 | −0.22 | down | 0.0052 |
| Peroxiredoxin-1 | Prdx1 | −0.12 | down | 0.0053 |
| UDP-glucuronosyltransferase 2B2 precursor | Ugt2b | −0.64 | down | 0.0053 |
| Carbonyl reductase [NADPH] 3 | Cbr3 | 0.14 | up | 0.0055 |
| Guanylate-binding protein 4 isoform X1 | LOC685067 | 0.15 | up | 0.0056 |
| Creatine kinase M-type | Ckm | 0.19 | up | 0.0057 |
| Biological Theme | GO (BP) and KEGG Pathway 1 | Gene Names 2 | p-Value 3 |
|---|---|---|---|
| Protein Folding | GO:0006457~protein folding | Uggt1, Canx, Calr, Hspa1b, Hsp90b1, Pdia3, Pdia4, Pdia6 | 1.46 × 10⁻⁶ |
| rno04141~Protein processing in endoplasmic reticulum | Uggt1, Canx, Calr, Ganab, Hspa1b, Hsp90b1, Hspa5, Hyou1, Pdia3, Pdia4, Pdia6, Rpn1, Rpn2 | 7.66 × 10⁻¹⁰ | |
| Lipid Metabolism | GO:0006633~fatty acid biosynthetic process | Acaca, Apoa1, Apoc1, Apoc2, Fasn | 2.95 × 10⁻³ |
| GO:0008610~lipid biosynthetic process | Hmgcs2, Acaca, Apoa1, Apoc1, Apoc2, Apoe, C3, Fasn, Pck1 | 2.29 × 10⁻³ | |
| GO:0016042~lipid catabolic process | Apoa1, Apoa2, Apoc1, Apoe, Cps1, Ces1d, Plin1 | 2.71 × 10⁻⁴ | |
| GO:0006641~triglyceride metabolic process | Apoa1, Apoc1, Apoc2, Apoe, Cps1, C3, Plin1, Pck1 | 2.65 × 10⁻⁷ | |
| Cholesterol efflux | GO:0033344~cholesterol efflux | Apoa1, Apoa2, Apoc1, Apoc2, Apoe | 3.68 × 10⁻⁵ |
| GO:0043691~reverse cholesterol transport | Apoa1, Apoa2, Apoe | 1.34 × 10⁻³ |
| Biological Theme | GO (BP) and KEGG Pathway 1 | Gene Names 2 | p-Value 3 |
|---|---|---|---|
| Lipid Metabolism | GO:0006633~fatty acid biosynthetic process | Erlin2, Acaca, Anxa1, Apoa4, Apoc2, Apoc3, Fasn, Mgll | 9.44 × 10⁻⁴ |
| GO:0008610~lipid biosynthetic process | Hmgcs2, Erlin2, Abhd5, Acaca, Acsl1, Aldh8a1, Akr1d1, Anxa1, Apoa4, Apoc2, Apoc3, C3, Fasn, Gpat3, Mgll, Pck1 | 1.14 × 10⁻³ | |
| GO:0016042~lipid catabolic process | Abhd5, Acaa2, Akr1d1, Apoa2, Apoa4, Apoc2, Apoc3, Apoh, Cps1, Ces1d, Ehhadh, Fabp1, Hadha, Hadhb, Lipe, Mgll, Plin1, Prkaca | 3.35 × 10⁻⁸ | |
| GO:0009062~fatty acid catabolic process | Acaa2, Ces1d, Ehhadh, Fabp1, Hadha, Hadhb, Lipe | 5.28 × 10⁻⁴ | |
| rno04923:Regulation of lipolysis in adipocytes | Gnas, Abhd5, Lipe, Mgll, Plin1, Prkaca | 5.01 × 10⁻³ | |
| Cholesterol efflux | GO:0033344~cholesterol efflux | Npc2, Apoa2, Apoa4, Apoc2, Apoc3, Cav1 | 1.20 × 10⁻⁴ |
| Differentially Expressed Proteins | Gene Name | Log2 Fold Change 1 | Up- or Down-Regulated | p Value 2 |
|---|---|---|---|---|
| Carbamoyl-phosphate synthase [ammonia], mitochondrial | Cps1 | 0.17 | up | 0.0001 |
| Fatty acid-binding protein, liver | Fabp1 | 0.27 | up | 0.0001 |
| Long-chain-fatty-acid-CoA ligase 1 | Acsl1 | 0.1 | up | 0.0001 |
| Bucs1 protein | Acsm1 | 0.19 | up | 0.0001 |
| 3-alpha-hydroxysteroid dehydrogenase | Akr1c9 | 0.17 | up | 0.0001 |
| Aldh4a1 protein (Fragment) | Aldh4a1 | 0.13 | up | 0.0001 |
| Alpha-aminoadipic semialdehyde dehydrogenase | Aldh7a1 | 0.17 | up | 0.0001 |
| Cystathionine gamma-lyase | Cth | 0.2 | up | 0.0001 |
| Microsomal triglyceride transfer protein | Mttp | 0.15 | up | 0.0001 |
| Long-chain-fatty-acid-CoA ligase 5 | Acsl5 | 0.24 | up | 0.0001 |
| Bile acyl-CoA synthetase | Slc27a5 | 0.22 | up | 0.0001 |
| Alcohol sulfotransferase A | St2a2 | 0.43 | up | 0.0001 |
| Aldose reductase-related protein 1 | Akr1b7 | 1.41 | up | 0.0001 |
| Fatty acid synthase | Fasn | −0.18 | down | 0.0001 |
| Pyruvate carboxylase, mitochondrial | Pc | −0.09 | down | 0.0001 |
| Serum albumin | Alb | −0.13 | down | 0.0001 |
| Triokinase/FMN cyclase | Tkfc | −0.14 | down | 0.0001 |
| Transketolase | Tkt | −0.13 | down | 0.0001 |
| ATP-citrate synthase | Acly | −0.27 | down | 0.0001 |
| Serotransferrin | Tf | −0.24 | down | 0.0001 |
| Pyruvate kinase | Pklr | −0.18 | down | 0.0001 |
| Selenium-binding protein 1 | Selenbp1 | −0.14 | down | 0.0001 |
| Glucose-6-phosphate isomerase | Gpi | −0.18 | down | 0.0001 |
| Purine nucleoside phosphorylase | Pnp | −0.12 | down | 0.0001 |
| Malate dehydrogenase, mitochondrial | Mdh2 | −0.22 | down | 0.0001 |
| Keratin, type II cytoskeletal 8 | Krt8 | −0.2 | down | 0.0001 |
| Glycerol kinase | Gk | −0.16 | down | 0.0001 |
| Cytochrome P450 2C11 | Cyp2c11 | −0.37 | down | 0.0001 |
| Keratin, type I cytoskeletal 18 | Krt18 | −0.23 | down | 0.0001 |
| Phosphate carrier protein, mitochondrial | Slc25a3 | −0.2 | down | 0.0001 |
| Isoform 2 of Fibrinogen beta chain | Fgb | 0.27 | up | 0.0001 |
| Acyl-coenzyme A synthetase ACSM5, mitochondrial | Acsm5 | −0.35 | down | 0.0001 |
| Farnesyl pyrophosphate synthase 1 | Fdps | 0.21 | up | 0.0001 |
| Protein disulfide-isomerase | P4hb | 0.1 | up | 0.0002 |
| Choline dehydrogenase, mitochondrial | Chdh | −0.13 | down | 0.0002 |
| Carboxylesterase 1D | Ces1d | 0.36 | up | 0.0002 |
| Malate dehydrogenase, cytoplasmic | Mdh1 | 0.15 | up | 0.0003 |
| Malic enzyme | Me1 | −0.15 | down | 0.0003 |
| Glutathione peroxidase | Gpx1 | 0.17 | up | 0.0003 |
| Aflatoxin B1 aldehyde reductase member 3 | Akr7a3 | −0.26 | down | 0.0004 |
| Lactamase, beta | Lactb | −0.14 | down | 0.0004 |
| Alpha-aminoadipic semialdehyde synthase, mitochondrial | Aass | 0.22 | up | 0.0005 |
| Perilipin 2 | Plin2 | −0.41 | down | 0.0005 |
| Acyl-coenzyme A oxidase | Acox3 | 0.09 | up | 0.0005 |
| Kynurenine/alpha-aminoadipate aminotransferase, mitochondrial | Aadat | 0.18 | up | 0.0005 |
| Dihydrolipoyllysine-residue acetyltransferase component of pyruvate dehydrogenase complex, mitochondrial | Dlat | −0.17 | down | 0.0006 |
| Carboxylic ester hydrolase (Fragment) | Ces2e | 0.49 | up | 0.0009 |
| Cytochrome P450 2B3 | Cyp2b3 | 0.18 | up | 0.0009 |
| Estrogen sulfotransferase, isoform 3 | Ste | −0.46 | down | 0.001 |
| Glucose-6-phosphate 1-dehydrogenase | G6pdx | 0.35 | up | 0.001 |
| Alcohol dehydrogenase 1 | Adh1 | 0.08 | up | 0.0012 |
| Isocitrate dehydrogenase [NADP] cytoplasmic | Idh1 | 0.09 | up | 0.0012 |
| Glutathione S-transferase alpha-4 | Gsta4 | 0.13 | up | 0.0012 |
| Myosin, heavy polypeptide 9, non-muscle | Myh9 | −0.1 | down | 0.0012 |
| Protein deglycase DJ-1 | Park7 | −0.26 | down | 0.0012 |
| Transgelin-2 | Tagln2 | −0.21 | down | 0.0013 |
| Phosphoenolpyruvate carboxykinase, cytosolic [GTP] | Pck1 | 0.11 | up | 0.0014 |
| Long-chain specific acyl-CoA dehydrogenase, mitochondrial | Acadl | −0.1 | down | 0.0014 |
| Voltage-dependent anion-selective channel protein 3 | Vdac3 | −0.27 | down | 0.0017 |
| Alpha-1-macroglobulin | A1m | 0.14 | up | 0.0018 |
| Aflatoxin B1 aldehyde reductase member 2 | Akr7a2 | −0.15 | down | 0.0019 |
| Fructose-bisphosphate aldolase | Aldob | −0.11 | down | 0.0021 |
| Epoxide hydrolase 1 | Ephx1 | −0.11 | down | 0.0021 |
| UDP-glucuronosyltransferase 2B2 | Ugt2b | 0.17 | up | 0.0023 |
| 3 beta-hydroxysteroid dehydrogenase type 5 | Hsd3b5 | −0.24 | down | 0.0024 |
| 3-hydroxyisobutyryl-CoA hydrolase, mitochondrial | Hibch | −0.16 | down | 0.0027 |
| Cytosol aminopeptidase | Lap3 | −0.08 | down | 0.0028 |
| UDP-glucuronosyltransferase 2B17 OS | Ugt2b17 | 0.27 | up | 0.003 |
| Biliverdin reductase A | Blvra | −0.15 | down | 0.0033 |
| Differentially Expressed Proteins | Gene Name | Log2 Fold Change 1 | Up- or Down-Regulated | p Value 2 |
|---|---|---|---|---|
| Carbamoyl-phosphate synthase [ammonia], mitochondrial | Cps1 | 0.05 | up | 0.0001 |
| Cytosolic 10-formyltetrahydrofolate dehydrogenase | Aldh1l1 | 0.14 | up | 0.0001 |
| Catalase | Cat | 0.15 | up | 0.0001 |
| Cytochrome P450 2C7 | Cyp2c7 | 0.29 | up | 0.0001 |
| Alcohol dehydrogenase 1 | Adh1 | 0.14 | up | 0.0001 |
| Alpha-1-macroglobulin | A1m | 0.14 | up | 0.0001 |
| Epoxide hydrolase 1 | Ephx1 | 0.21 | up | 0.0001 |
| Cystathionine gamma-lyase | Cth | 0.19 | up | 0.0001 |
| 4-hydroxyphenylpyruvate dioxygenase | Hpd | 0.25 | up | 0.0001 |
| Glutathione S-transferase | Gsta5 | 0.46 | up | 0.0001 |
| Protein Sar1a | Sar1a | 0.18 | up | 0.0001 |
| Aflatoxin B1 aldehyde reductase member 3 | Akr7a3 | 0.45 | up | 0.0001 |
| Histidine ammonia-lyase | Hal | 0.35 | up | 0.0001 |
| Carboxylesterase 1D | Ces1d | 0.54 | up | 0.0001 |
| Fatty acid synthase | Fasn | −0.13 | down | 0.0001 |
| Aldehyde dehydrogenase, mitochondrial | Aldh2 | −0.25 | down | 0.0001 |
| 3-ketoacyl-CoA thiolase, mitochondrial | Acaa2 | −0.27 | down | 0.0001 |
| 60 kDa heat shock protein, mitochondrial | Hspd1 | −0.07 | down | 0.0001 |
| Transketolase | Tkt | −0.25 | down | 0.0001 |
| ATP-citrate synthase | Acly | −0.3 | down | 0.0001 |
| Malate dehydrogenase, mitochondrial | Mdh2 | −0.22 | down | 0.0001 |
| Keratin, type II cytoskeletal 8 | Krt8 | −0.13 | down | 0.0001 |
| Sorbitol dehydrogenase | Sord | −0.14 | down | 0.0001 |
| Aldehyde dehydrogenase X, mitochondrial | Aldh1b1 | −0.46 | down | 0.0001 |
| Protein LOC679794 | LOC679794 | −0.33 | down | 0.0001 |
| UDP-glucuronosyltransferase 2B2 | Ugt2b | 0.18 | up | 0.0002 |
| Hemoglobin subunit beta-1 | Hbb | −0.24 | down | 0.0002 |
| Pyruvate kinase | Pklr | −0.12 | down | 0.0002 |
| Protein Ugp2 | Ugp2 | 0.25 | up | 0.0002 |
| Isoform 2 of Fibrinogen beta chain | Fgb | 0.21 | up | 0.0002 |
| UDP-glucuronosyltransferase 2B15 | Ugt2b15 | 0.13 | up | 0.0003 |
| Alpha-aminoadipic semialdehyde synthase, mitochondrial | Aass | 0.17 | up | 0.0004 |
| Cytochrome P450 2C23 | Cyp2c23 | 0.2 | up | 0.0004 |
| Argininosuccinate synthase | Ass1 | 0.11 | up | 0.0004 |
| Pyruvate dehydrogenase E1 component subunit alpha | Pdha1 | −0.22 | down | 0.0004 |
| Keratin, type I cytoskeletal 18 | Krt18 | −0.17 | down | 0.0006 |
| 3-oxo-5-beta-steroid 4-dehydrogenase | Akr1d1 | −0.08 | down | 0.0006 |
| 3-alpha-hydroxysteroid dehydrogenase | Akr1c9 | 0.1 | up | 0.0007 |
| Perilipin 2 | Plin2 | −0.31 | down | 0.0007 |
| Hemoglobin subunit alpha-1/2 | Hba1 | −0.22 | down | 0.0007 |
| Long-chain specific acyl-CoA dehydrogenase, mitochondrial | Acadl | −0.1 | down | 0.0008 |
| Carnitine O-palmitoyltransferase 1, liver isoform | Cpt1a | −0.22 | down | 0.0009 |
| L-gulonolactone oxidase | Gulo | −0.17 | down | 0.0009 |
| Retinol dehydrogenase 7 | Rdh7 | 0.15 | up | 0.0010 |
| Protein deglycase DJ-1 | Park7 | −0.17 | down | 0.0010 |
| Peroxisomal multifunctional enzyme type 2 | Hsd17b4 | 0.07 | up | 0.0015 |
| 60S ribosomal protein L14 | Rpl14 | −0.17 | down | 0.0015 |
| Glutathione S-transferase | Gsta2 | 0.53 | up | 0.0017 |
| Malate dehydrogenase, cytoplasmic | Mdh1 | 0.13 | up | 0.0017 |
| Probable 2-oxoglutarate dehydrogenase E1 component DHKTD1, mitochondrial | Dhtkd1 | 0.12 | up | 0.0017 |
| 3-hydroxy-3-methylglutaryl-Coenzyme A synthase 2 (Mitochondrial) | Hmgcs2 | −0.07 | down | 0.0017 |
| Pterin-4-alpha-carbinolamine dehydratase | Pcbd1 | −0.2 | down | 0.0017 |
| Heat shock cognate 71 kDa protein | Hspa8 | −0.06 | down | 0.0018 |
| Non-specific lipid-transfer protein | Scp2 | −0.15 | down | 0.0020 |
| Carbonic anhydrase 3 | Ca3 | 0.48 | up | 0.0022 |
| Protein LOC100911833 | LOC297568 | 0.14 | up | 0.0023 |
| Cytochrome P450 2A2 | Cyp2a2 | 0.38 | up | 0.0023 |
| Cullin-associated NEDD8-dissociated protein 1 | Cand1 | −0.2 | down | 0.0023 |
| Eukaryotic translation elongation factor 1 beta 2 | Eef1b2 | −0.16 | down | 0.0023 |
| Ectonucleoside triphosphate diphosphohydrolase 5 | Entpd5 | 0.17 | up | 0.0027 |
| Glutathione S-transferase alpha-5 | Gsta5 | 0.33 | up | 0.0027 |
| Formimidoyltransferase-cyclodeaminase | Ftcd | 0.06 | up | 0.0033 |
| Biological Them | GO (BP) and KEGG Pathway 1 | Gene Names 2 | p-Value 3 |
|---|---|---|---|
| Lipid Metabolism | GO:0006633~fatty acid biosynthetic process | Acly, Acadl, Acsm1, Acsm5, Fasn | 1.58× 10⁻³ |
| GO:0008610~lipid biosynthetic process | Hsd3b5, Acly, Acadl, Acsl1, Acsl5, Acsm1, Acsm5, Fdps, Fasn, G6pd, Idh1, Pck1, Pc, Slc27a5 | 6.00 × 10⁻⁸ | |
| GO:0016042~lipid catabolic process | Hibch, Acadl, Acox3, Acsl5, Cps1, Ces1d, Fabp1, Idh1 | 7.64 × 10⁻⁵ | |
| GO:0006635~fatty acid beta-oxidation | Hibch, Acadl, Acox3, Acsl5, Ces1d, Fabp1 | 1.32 × 10⁻⁴ | |
| Carbohydrate Metabolism | GO:0016052~carbohydrate catabolic process | Aldob, Cps1, Gpi, Gk, Pklr | 1.42 × 10⁻³ |
| rno00030:Pentose phosphate pathway | Aldob, G6pd, Gpi, Tkt | 1.19× 10⁻³ |
| Biological Theme | GO (BP) and KEGG Pathway 1 | Gene Names 2 | p-Value 3 |
|---|---|---|---|
| Lipid Metabolism | GO:0009062~fatty acid catabolic process | Acaa2, Acadl, Ces1d, Cpt1a,Hsd17b4 | 2.46 × 10⁻⁴ |
| GO:0071616~acyl-CoA biosynthetic process | Acly, Fasn, Pdha1, Pdha1l1 | 1.85 × 10⁻⁴ | |
| rno00120:Primary bile acid biosynthesis | Akr1d1, Hsd17b4, Scp2 | 4.77 × 10⁻³ | |
| Carbohydrate Metabolism | GO:0005975~carbohydrate metabolic process | Ugp2, Cps1, Cpt1a,Dhtkd1,Entpd5,Mdh1, Mdh2, Pdha1, Pklr, Sord | 8.83 × 10⁻⁴ |
| Oxidative Stress | GO:0006979~response to oxidative stress | Park7, Car3, Cat, Hsp70, Hspa8, Hspd1, Hbb, Hba1 | 1.60 × 10⁻³ |
| GO:0042744~hydrogen peroxide catabolic process | Cat, Hbb, Hba1 | 2.55 × 10⁻³ |
© 2018 by the authors. Licensee MDPI, Basel, Switzerland. This article is an open access article distributed under the terms and conditions of the Creative Commons Attribution (CC BY) license (http://creativecommons.org/licenses/by/4.0/).
Share and Cite
Ayoub, H.M.; McDonald, M.R.; Sullivan, J.A.; Tsao, R.; Meckling, K.A. Proteomic Profiles of Adipose and Liver Tissues from an Animal Model of Metabolic Syndrome Fed Purple Vegetables. Nutrients 2018, 10, 456. https://0-doi-org.brum.beds.ac.uk/10.3390/nu10040456
Ayoub HM, McDonald MR, Sullivan JA, Tsao R, Meckling KA. Proteomic Profiles of Adipose and Liver Tissues from an Animal Model of Metabolic Syndrome Fed Purple Vegetables. Nutrients. 2018; 10(4):456. https://0-doi-org.brum.beds.ac.uk/10.3390/nu10040456
Chicago/Turabian StyleAyoub, Hala M, Mary Ruth McDonald, James Alan Sullivan, Rong Tsao, and Kelly A Meckling. 2018. "Proteomic Profiles of Adipose and Liver Tissues from an Animal Model of Metabolic Syndrome Fed Purple Vegetables" Nutrients 10, no. 4: 456. https://0-doi-org.brum.beds.ac.uk/10.3390/nu10040456