
Systems Biology of the Fluxome

Department of Medicine, School of Medicine, Johns Hopkins University, Baltimore, MD 21205 USA
*
Author to whom correspondence should be addressed.
†
Present address: National Institute on Aging, National Institutes of Health, BRC BG Rm 09B119, 251 Bayview Blvd., Baltimore, MD 21224, USA
Processes 2015, 3(3), 607-618; https://0-doi-org.brum.beds.ac.uk/10.3390/pr3030607
Submission received: 16 May 2015
/
Accepted: 6 July 2015
/
Published: 22 July 2015
Abstract
:The advent of high throughput -omics has made the accumulation of comprehensive data sets possible, consisting of changes in genes, transcripts, proteins and metabolites. Systems biology-inspired computational methods for translating metabolomics data into fluxomics provide a direct functional, dynamic readout of metabolic networks. When combined with appropriate experimental design, these methods deliver insightful knowledge about cellular function under diverse conditions. The use of computational models accounting for detailed kinetics and regulatory mechanisms allow us to unravel the control and regulatory properties of the fluxome under steady and time-dependent behaviors. This approach extends the analysis of complex systems from description to prediction, including control of complex dynamic behavior ranging from biological rhythms to catastrophic lethal arrhythmias. The powerful quantitative metabolomics-fluxomics approach will help our ability to engineer unicellular and multicellular organisms evolve from trial-and-error to a more predictable process, and from cells to organ and organisms.
Keywords:
systems biology; metabolic disorders; diabetes; cancer; metabolomics; multi-scale modeling
1. Introduction
Systems Biology entails a systemic analysis of complex, whole-system inter-connections and their functional interrelationships rather than component parts [1,2,3]. Cells, organisms, social, economic, and eco-systems are complex because they consist of a large number of usually non-linearly interacting parts; they also operate in multiple spatial and temporal scales [4,5,6].
Systems biology started to emerge as a distinct field with the advent of high throughput-omics technologies, i.e., gen-, transcript-, prote- and metabol-omics, that seek a comprehensive description of changes in genes, transcripts, proteins and metabolites occurring under the influence of perturbations driven by, e.g., disease or pharmacological intervention. Massive data gathering, together with the growing capability of generating computational models of complicated systems, have made possible a comprehensive integration and interpretation of information constituting the core of systems biology. Top–down and bottom–up approaches can be utilized. The top–down approach involves the integrated study of different sort of networks, and their simulation with computational models [7,8]. Bottom–up approaches include the study of selected processes in cells, organs, or organisms, at high spatio-temporal resolution, which can also be simulated through computational modeling [9,10,11,12,13,14,15,16]. From improving the production of a high-value metabolite or polymer in unicellular eukaryotes or prokaryotes, to the understanding of the pathophysiology of a disease, the focus can be placed on single mechanistic pathways such as amino acids or sympathetic signaling in cardiovascular disease, or a global study of a large number of molecules and then dissecting the individual pathways involved [3].
Emergent organization in complex systems is the single most distinguishing feature of organized complexity, and cannot be anticipated in any way from the behavior of the isolated components. The Complex Systems Approach [3,4] integrates systems biology to nonlinear dynamic systems analysis, involving a combination of experimental with mathematical techniques. One of the foundational concepts of the Complex Systems Approach is self-organization which is based on non-equilibrium thermodynamics of nonlinear open systems, i.e., those that exchange energy and matter like cells, organisms, and ecosystems [17,18,19,20,21,22].
High throughput-omics enabled the accumulation of large data sets that with the help of systems biology, are transforming medical, production and engineering practice [23]. However, as James Gleick pointed out: “A barrage of data so often fails to tell us what we need to know (…) particularly in a world where all bits are created equal and information is divorced from meaning” [24]. Consequently, this review addresses our next step to effectively improve, e.g., bioengineering of industrial strains, crops or combat chronic diseases such as diabetes and cancer, with the aim of gaining knowledge from these inventories by assessing their functional significance.
2. Limitations of the “Big Data” Approach and the Ubiquitous Cyclic Topologies of the Living
Humans (Homo sapiens), plants (Arabidopsis thaliana), worms (Caenorhabditis elegans) and mice (Mus musculus) possess about 22,000 protein-encoding genes and 10,000 proteins. The numbers for protein-encoding genes and the proteomes are less staggering in yeast (Saccharomyces cerevisiae) and fly (Drosophila melanogaster) with 6000/4000 and 13,000/8000 each, respectively [3]. Thus, articulating the functional nexus (beyond correlations) between genotype and phenotype is not a trivial task.
Quantitatively speaking, there is not a direct relationship between gene, mRNA, and protein levels and activity. A direct correlation between the expression of a gene, the abundance of the protein product and its activity is also non evident, the latter due to posttranslational modifications, e.g., phosphorylation, redox, that change structural conformation or the maximal velocity of an enzyme. Additionally, the autopoietic (from the Greek “auto” [self] and “poiesis” [to make]) [25] nature of living systems introduces another layer of complexity, accounting for the fundamental biological fact that cells and organisms make themselves, a distinguishing trait from man-made machines so far [26].
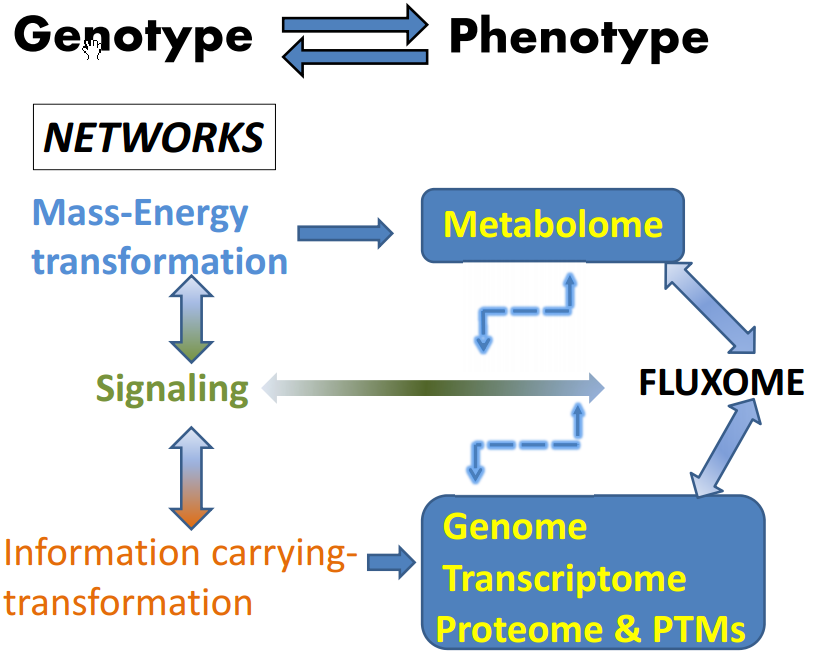
Figure 1.
The fluxome integrates the outcomes of mass-energy/information and signaling networks. Signaling networks connect and modulate the mass-energy-information networks. The fluxome represents the complete ensemble of fluxes in a cell, and as such it provides a true dynamic picture of the phenotype because it captures, in response to the environment, the metabolome (mass-energy) in its functional interactions with the information (genome, transcriptome, proteome and post-translational modifications, PTMs) and signaling networks. As a result of this integration between several cellular processes, the fluxome represents a unique phenotypic signature of cells. The double sense of the arrows denote reciprocal interactions and an overall cyclic topology and connectivity that results in circular causality. Thus an output from a network (metabolome, e.g., ROS or AMP:ATP ratio) is the input of the next network (signaling, e.g., AMPK network), which after processing will feedback on the same network that produced the initial triggers (e.g., ROS, AMP) thus modulating their levels. Modified from Aon, 2013 [1]. Systems Biology of Metabolic and Signaling Networks. Springer 2014.

The autopoietic nature of the living is based on networks connected by overall cyclic topologies (Figure 1), thus making their study relevant for understanding the control and regulation of cells’ and organisms’ behavior in health and disease. From this perspective, cell function can be seen as the unfolding in space and time of three different kind of interacting networks: mass-energy, information, and signaling [1]. Topologically, cyclic connectivity bestows self-organizing properties to these networks as they occur in thermodynamically open systems such as cells, sustained by continuous exchange of energy and matter with the environment; for this trait it is essential to include dynamic analysis, a basic ingredient for understanding emergent organization in complex networks. The output of mass-energy/information networks, composed of proteins, transcriptional factors, metabolites, is at the same time input for signaling networks which output activates or represses those same networks that produced them [1,3,27]. The overall result of this process is the phenotype represented by the fluxome, which accounts for the whole set of fluxes sustained by a diverse range of processes associated with vital cellular functions such as growth, division, differentiation, autophagy, apoptosis/necrosis, or the response to key environmental signals such as starvation or hypoxia [1].
3. Metabolism and the Fluxome as a Phenotypic Signature
A metabolic network can be interpreted, in a topological sense, as an interconnected ensemble of nodes, denoting intermediary metabolites, and edges, representing enzyme-catalyzed reactions. The familiar metabolic chart is a well-known representation of how biochemical reactions are wired. However, the topological portrayal of metabolism is insufficient. The full description of a biological system comprises the structure (catalog of individual components, e.g., proteins, genes, enzymes, transcriptional factors), the pattern of organization denoting how the components are wired (linked), organized topologically (e.g., linear or branched sequence of reactions, feed-forward, feed-back), and morphologically (membrane-bound or functional compartmentalization), and the function, how the ensemble works (i.e., unfolding in space and time of functional interrelationships, mass-energy-information fluxes, response to stimuli, growth) [1,28,29].
Metabolism is remodeled as a result of disease or inborn genetic error, involving gene-environment, gene-nutrient interactions that alter the rate (flux) at which metabolites are turned over. In a metabolic network, flux is defined as the rate (i.e., molar per unit time) at which metabolites are converted or transported between compartments. One primary metabolite flux is affected in an inborn error with Mendelian inheritance. However, in a complex disease or metabolic disorder, an entire network of metabolite fluxes might be altered to cause a phenotype [30].
The fluxome, or set of metabolic fluxes, that give rise to the metabolome represents a direct functional dynamic readout of the interaction between the genome and the environment, thus a unique phenotypic signature [31,32]. Although untargeted metabolomics still does not capture the entirety of the metabolome, this approach renders detectable ions across a wide m/z range using mass-spectrometry platforms [33]. Bioinformatic tools enable alignment, integration, and comparison of all m/z ion intensities between different biological samples and identify differentially changing ions.
A major advantage of fluxomics over genomics and proteomics is that it is based on information from the metabolome that is far smaller compared to the total number of genes or proteins [34]. For example, in the mouse there are ~600 essential low-molecular-weight intermediates [35], whereas there are ~10,000 proteins and ~22,000 protein-encoding genes [3].
4. From Metabolomics to Fluxomics: A Brief Survey of Existing Methodologies
Modeling of metabolic networks can be done based on constraints of mass and charge conservation along with stoichiometric and thermodynamic ones [9,36,37]. Accounting for the stoichiometry of the reactants and products of biochemical reactions, flux balance analysis (FBA) can estimate metabolic fluxes without knowledge about the kinetics of the participating enzymes.
FBA constraint-based models can encompass large metabolic networks, however, by leaving regulatory interactions and detailed kinetics uncounted only yields results that are valuable for the rather limited biological situation of systems at steady-state, excluding time-dependent behavior and, implicitly, prediction [3,9]. Moreover, in FBA the equation system is usually underdetermined, thus no unique solution can be found by simply solving the linear equation system [38]. FBA uses linear optimization both for flux calculation and the sensitivity to experimental error [39]. To limit the solution space, linear optimization requires an objective function, e.g., maximization of ATP synthesis and/or NADH and NADPH generation. Different constraints can be used to limit the solution space, e.g., redox balance, thermodynamics [40].
Isotope-labelled precursors of metabolic pathways, mainly 13C-labelled substrates can be used for estimating metabolic fluxes [41]. Although 13C-fluxomics does not rely on cofactor balances or optimization functions [37] it requires a priori knowledge of possible distributions of the tracer used within the network. Due to metabolic network size restriction, most flux analyses performed with this methodology so far has been limited to the central carbon metabolism [31]. To minimize deviations of calculated fluxes from measured isotope enrichments and measurable rates (substrate, product, biomass), 13C-fluxomics simultaneously fits free flux parameters. 13C-fluxomics can be used to even resolve parallel and cycle pathways and reversible reactions, which are inaccessible to FBA. In addition to metabolic steady-state 13C-fluxomics requires isotopic steady state, i.e., all metabolite labelling and concentrations should be constant over the course of the analysis, and expensive tracer molecules along with mass spectrometry or NMR instrumentation. Depending on the label position in the tracer, e.g., glucose labelled in the first position ([1-13C]glucose) or uniformly labelled [U-13C]glucose), allows to differentiate the contribution of some metabolic pathways [31]. For example, unlike [1-13C]glucose, [1,2-13C]glucose allows to detect both newly synthesized glycogen and ribose 5-phosphate molecules instead of only the former. Thus glycogen synthesis and oxidative pentose phosphate pathway fluxes can be quantified using one tracer.
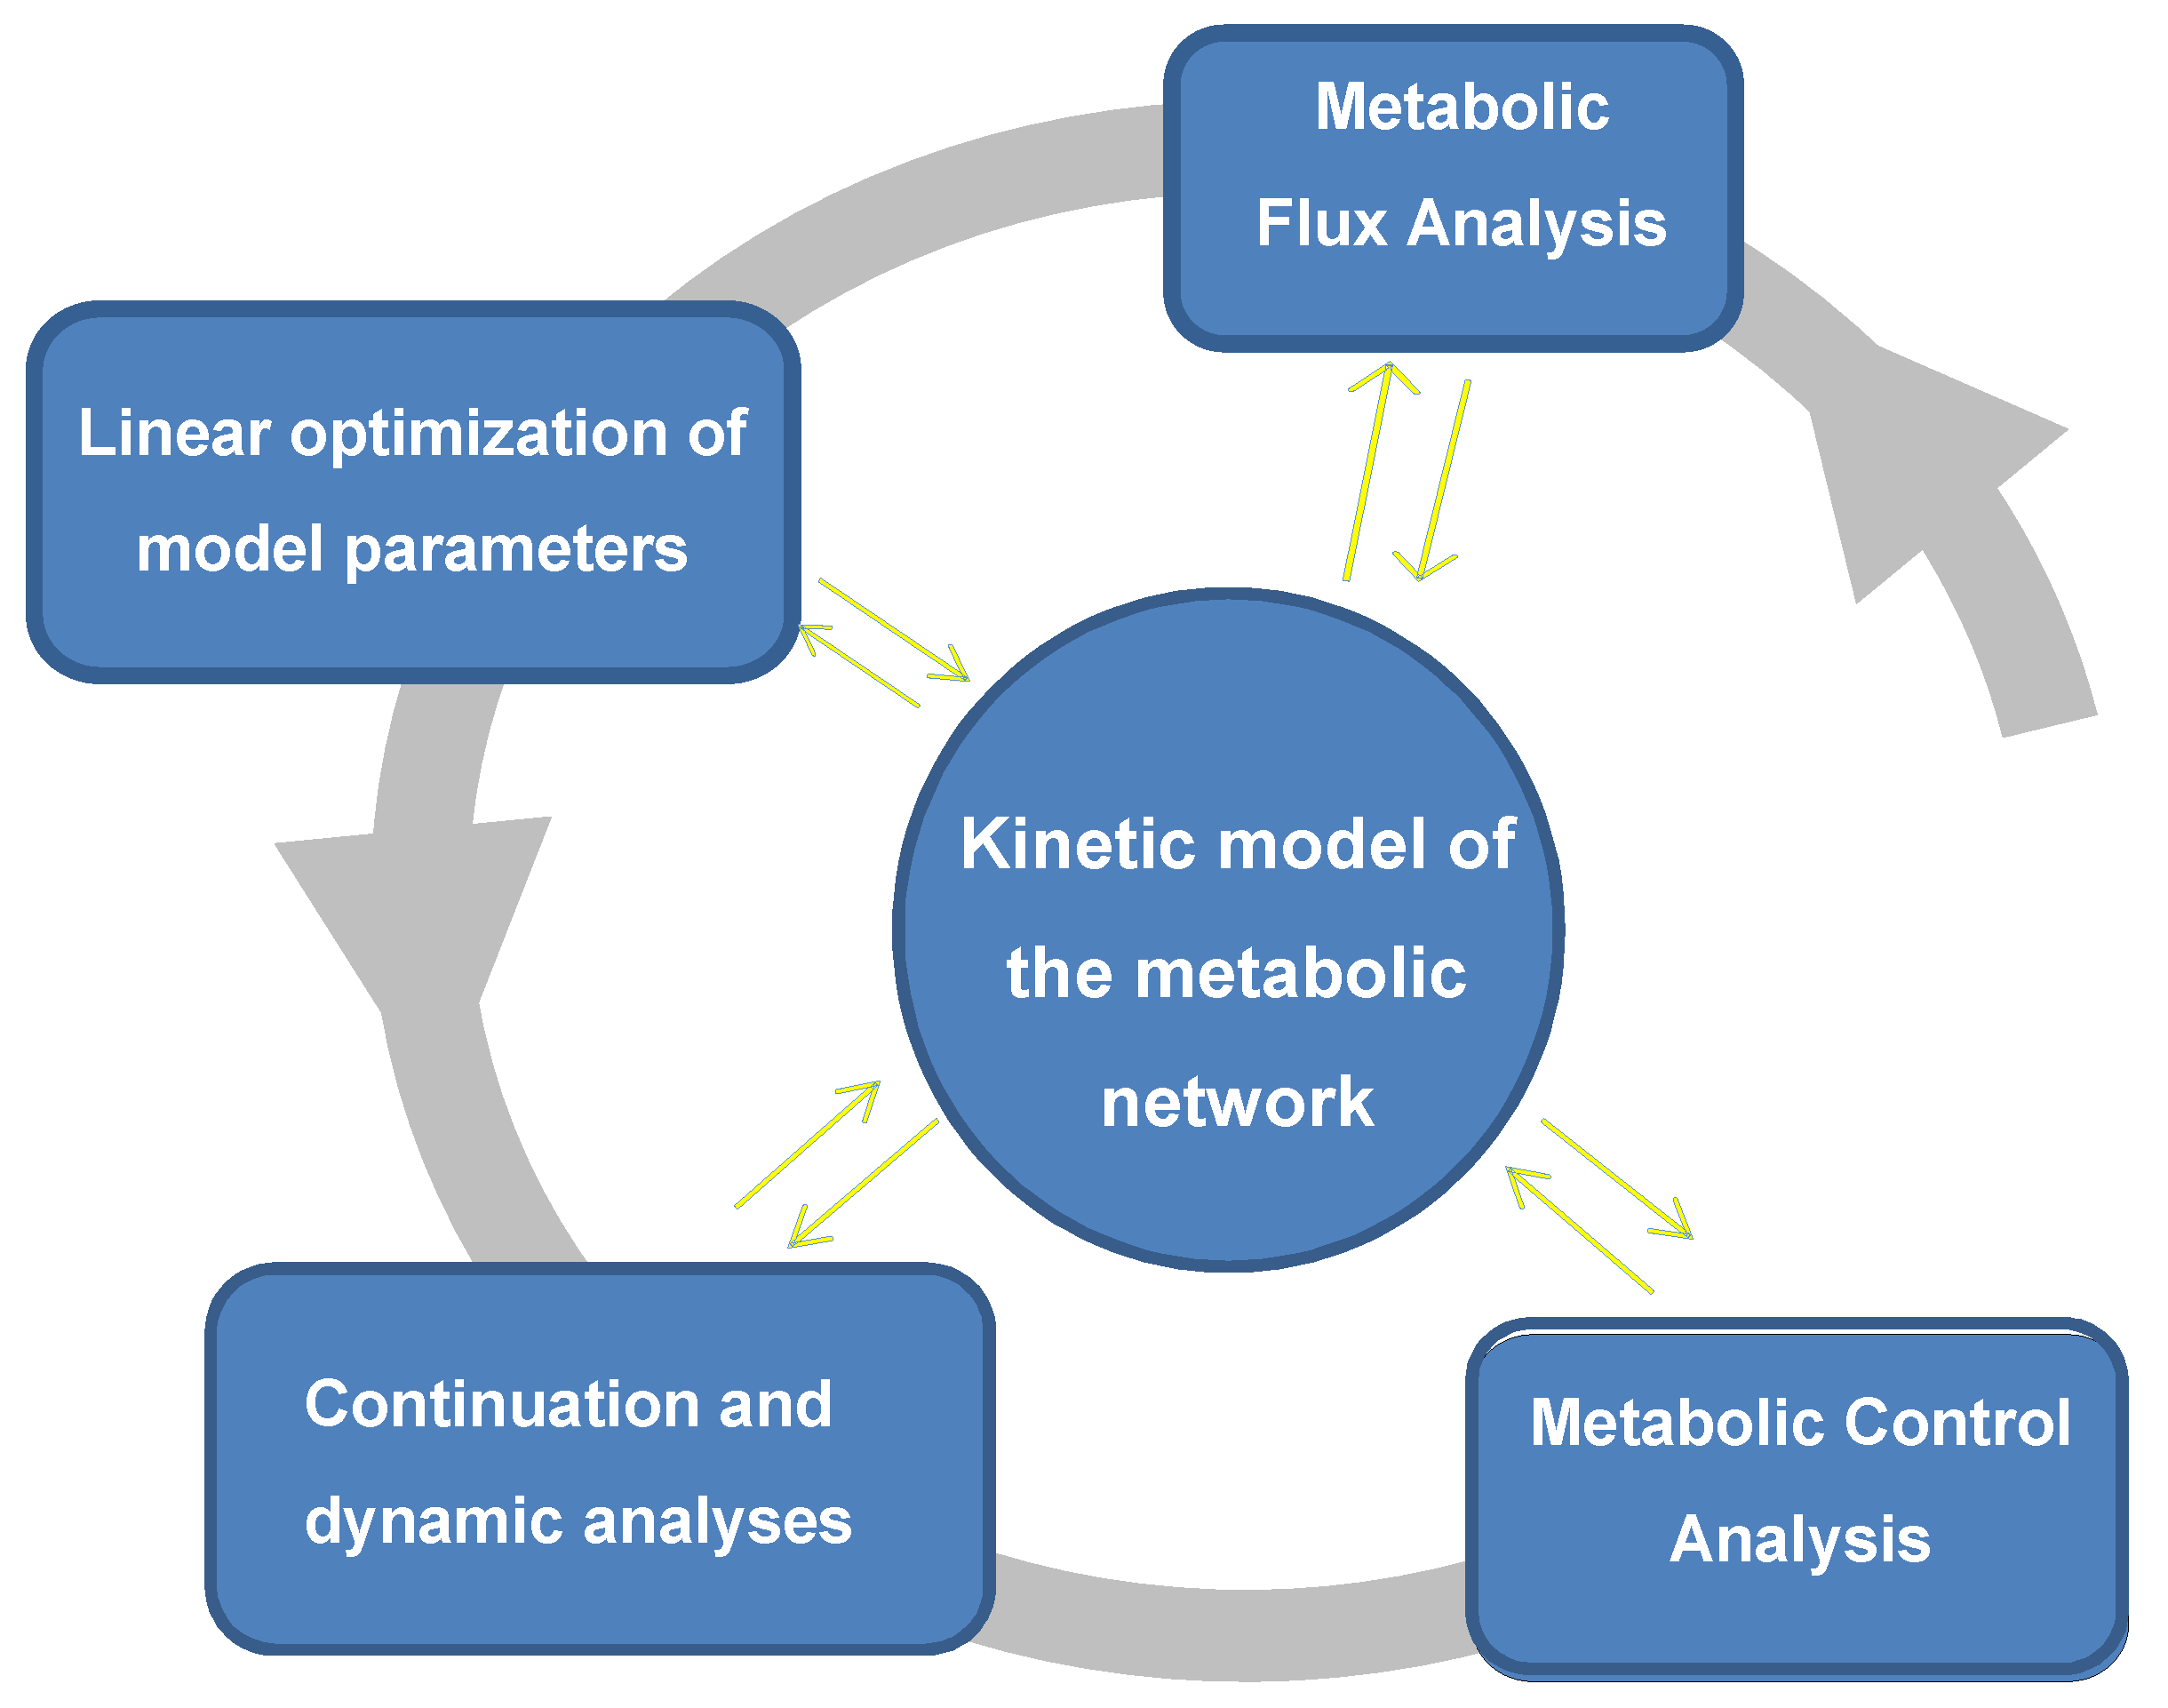
Kinetic models can circumvent the limitations of stoichiometric approaches because their description also includes regulatory interactions and kinetic mechanisms. Recently, a novel metabolomics-fluxomic procedure enabling the translation of high throughput metabolite profiles (metabolome) into the fluxome was reported [32]. From a network perspective, this approach assesses the nodes experimentally via metabolomics, and the edges computationally integrating the concentration of metabolites into enzymatic or transport rate expressions. A detailed computational kinetic model accounting for regulatory interactions was utilized and parameterized with a set of optimized Vmax values using an analytical platform comprising several integrated quantitative methodologies (Figure 2). Tested with metabolite profiles obtained from Langendorff-perfused mouse hearts, Cortassa and collaborators were able to quantitatively reproduce the metabolome concentration profile corresponding to the main catabolic routes (glycolysis, polyols, glycogenolysis, pentose phosphate) involved in glucose degradation. Further metabolic control analysis showed that the step catalyzed by phosphofructokinase together with ATP demand and glycogenolysis exert the highest control on the glycolytic flux. The negative flux control exerted by phosphofructokinase on the pentose phosphate (PP) and polyol pathways revealed that the extent of glycolytic flux directly affects flux redirection through these pathways, i.e., the higher the glycolytic flux the lower the PP and polyols [32]. Because the volume of possible solutions exhibited by the model depends on the choice of objective function to optimize Vmax, further validation of this procedure will need an independent experimental approach to quantify metabolic fluxes. 13C flux analysis can be combined with mechanistic kinetic modeling for flux estimation corroboration. Although this contribution represents a step forward for addressing multifaceted metabolic disorders such as cancer and diabetes that may help in designing new therapeutic strategies, it is not exempt of limitations. Like all -omics technologies, it does not address compartmentation and cellular heterogeneity. When applied to cell populations, metabolomics assumes an average cell that ignores cellular heterogeneity and compartmentation thus unable to discriminate distinct metabolite concentrations in different subcellular compartments. Other potential limitations of this approach involve missing regulatory mechanisms that specifically occur under intracellular conditions.
Figure 2.
Integrated quantitative analytical approach of a computational model for translating metabolite profiles into metabolic fluxes. The method of Cortassa et al. (2015) [32] utilizes the experimentally obtained metabolome in terms of actual metabolite concentrations as initial input, to calculate the fluxome, or set of metabolic fluxes from which the initial metabolite profile emerged. Depicted is the platform of analytical and quantitative methodologies used interactively and iteratively with the computational model.

5. Prediction, Control and Modulation of Complex Dynamic Behavior
The full power of systems biology approaches can be unveiled by the use of quantitative methods of model validation and their ability to predict and analyze complex dynamic behavior, e.g., rhythms [42,43,44]. The systole-diastole cycle of heart dynamics [10,45], nutrition and circadian dynamics [46], plant cell growth and differentiation [47] or microbial transitions from simple to mixed substrate utilization [48,49] are relevant examples from the biomedical, plant biology and microbial physiology fields. In these cases, as well as many others, the possibility of engineering nonlinear dynamic behavior represents a valuable asset in any computationally-based systems biology approach. Accounting for nonlinear mechanisms opens the possibility of addressing emergent, self-organized behavior in the form of, e.g., chemical waves, oscillations. This capacity has been shown to be crucial in the case of heart arrhythmias where blockage of membrane channels can prevent ventricular fibrillation mediated by mitochondrial or Ca2+ oscillations [50,51,52,53]. An integrated experimental-computational modeling approach enabled a mechanistic understanding of the conditions under which mitochondrial energy-redox criticality can originate arrhythmias during acute heart failure [10,16,54,55,56,57].
Self-synchronized continuous cultures of the yeast Saccharomyces cerevisiae exhibit ultradian rhythmicity in which the cell population functions like a multicellular, multi-oscillatory system communicating via metabolites like acetaldehyde [43,58]. Several periods of 13 h, 40 min and 4 min were detected in the O2 and CO2 time series obtained by mass spectrometry. Further analysis of these time series revealed that the broad range of temporal scales among multi-oscillatory states exhibit self-similar scaling, described by an inverse power law [59].
The existence of scale-free dynamics in temporal organization in the ultradian domain in yeast suggested that a change in one time scale will be felt across the frequency range from the intracellular to the intercellular. Inhibiting mitochondrial respiration at the level of cytochrome oxidase with hydrogen sulfide (H2S) abated all oscillatory frequencies including the 40 min-period ultradian clock. This result provided proof of principle in support of the idea that multi-scale timekeeping is an emergent property of the overall network involved in metabolism, growth and proliferation of yeast [44,60]. This finding also poses the interesting possibility that, in principle, multi-rhythmic processes could be modulated over the whole frequency range.
6. The Next Frontier: Multiscale Systems Biology
The 1999 influential article by Hartwell and colleagues introduced the notion that functional “modules” represent a critical level of biological organization that obey general “design principles” and are profoundly shaped by evolutionary constraints [61]. Departing from the concept that a functional module is a discrete entity whose function is separable from those of other modules, they suggested that modules can be insulated from or connected to each other. Consequently, higher-level functions can be built by connecting modules together.
The modular approach has become paramount in computational modeling of complex systems [62], synthetic biology [63] and multi-scale modeling that integrates different mechanistic models of gene expression networks, proteins, and metabolic pathways with the purpose to aid in system-wide predictions across scales [64,65,66].
Multi-scale modeling is actively developed in microbiology, Mycoplasma genitalium [65] and plant biology, specifically for in silico approaches to improving photosynthetic efficiency [67,68]. In the Mycoplasma case, a bottom-up approach was adopted to simulate emergent phenotypes from individual molecules and their interactions. The known annotated functions of the 525 genes containing genome of the Mycoplasma urogenital parasite were taken into account to simulate a wide range of behaviors at the single cell level [65]. In plants, computational models of shoot and root development, and canopy microclimate were integrated to account for interactions with the rest of the plant system or crop ecosystem. Many of these models have been used in isolation to predict synthetic and systems as a mean to improve photosynthetic efficiency ignoring, however, interactions with the rest of the plant system or crop ecosystem [68].
Using a modular approach, a multi-scale computational model of gene dynamics, carbon partitioning, organ growth, shoot architecture, and development in response to environmental signals was established for Arabidopsis thaliana [69]. Among other abilities this model exhibited flexible control of photosynthesis across photoperiods, and predicted the pleiotropic phenotype of a developmentally mis-regulated transgenic line. Multi-scale models can be used as an in silico bench test of genetic or experimental strategies designed to improve photosynthetic efficiency. For example, the test of potentially new pathways of photosynthetic carbon metabolism to be engineered in crops for increasing photosynthetic efficiency was simulated and the impact on the complete photosynthetic system evaluated via an energy balance analysis [70]. This approach led to predict the strategy that would actually increase net photosynthetic efficiency [68].
7. Concluding Remarks
Without losing sight of the important limitations in all the approaches and methodologies analyzed in this review, we remain optimistic about their inherent potential and attributes. To cope with the enormous complexity of the problems addressed [2,45], we are now able to computationally model very complicated systems, and to analyze their control and regulation, as well as predict changes in qualitative behavior. We possess an arsenal of theoretical tools (each with its own plethora of methods) and high-throughput technologies that allow the simultaneous monitoring of an enormous number of variables. Powerful imaging methods and online monitoring systems provide the means of studying living systems at high spatial and temporal resolution for several variables simultaneously.
The fluxome represents a dynamic picture of the phenotype because it captures the metabolome that reflects the functional interactions between the environment and the genome. Ultimately, the fluxome integrates the outcomes from the genome, transcriptome and proteome, including posttranslational modifications, hence being a unique phenotypic signature of cells. Thus, in maladies like diabetes and cancer to know about metabolic fluxes becomes crucial because systemic metabolic remodeling occurs. Current combined experimental-computational methods enable quantification of rate-controlling steps of flux and metabolite concentrations from high throughput metabolomics. These advancements open new possibilities to perform predictive metabolic engineering at the organ level, including complex dynamic behavior.
Gains in crop and food production for the forthcoming decades rely on improving overall crop photosynthetic efficiency. Based on our understanding of the photosynthetic process, this goal is achievable today thanks to the knowledge available to model a whole crop plant in silico. Among other tools, multi-scale computational models will be helpful in biological discovery and system-wide integration of systems biology studies applied to function at the cellular, organ, organism, populations and their interactions with the environment. This approach will be useful for a synergic optimization of all these relevant facets.
Author Contributions
This contribution is dedicated to the memory of Daniel Thomas, who passed away on 4 May 2014, a mentor of MAA and SC during their postdoctoral stage (1987–1989) at the Université de Technologie de Compiègne. The work and teachings of Daniel Thomas inspired the authors of this article to use and apply the concepts of thermodynamics of non-equilibrium systems and nonlinear dynamics in enzymology and microbiology, allying experimental and modeling work. His obituary can be read at [71].
Conflicts of Interest
The authors declare no conflict of interest.
References
- Aon, M.A. Complex systems biology of networks: The riddle and the challenge. In Systems Biology of Metabolic and Signaling Networks. Energy, Mass and Information Transfer, 1st ed.; Aon, M.A., Saks, V., Schlattner, U., Eds.; Springer-Verlag: Berlin, Germany, 2013; pp. 19–35. [Google Scholar]
- Aon, M.A.; Lloyd, D.; Saks, V. From physiology, genomes, systems, and self-organization to systems biology: The historical roots of a twenty-first century approach to complexity. In Systems Biology of Metabolic and Signaling Networks. Energy, Mass and Information Transfer, 1st ed.; Aon, M.A., Saks, V., Schlattner, U., Eds.; Springer-Verlag: Berlin, Germany, 2013; pp. 3–17. [Google Scholar]
- Cortassa, S.; Aon, M.A.; Iglesias, A.A.; Aon, J.C.; Lloyd, D. An Introduction to Metabolic and Cellular Engineering, 2nd ed.; World Scientific Publishers: Singapore, 2012; p. 448. [Google Scholar]
- Aon, M.A.; Cortassa, S. Chaotic dynamics, noise and fractal space in biochemistry. In Encyclopedia of Complexity and Systems Science; Meyers, R., Ed.; Springer: New York, NY, USA, 2009. [Google Scholar]
- Lloyd, D.; Rossi, E.L. Epilogue: A new vision of life. In Ultradian Rhythms from Molecules to Mind; Lloyd, D., Rossi, E.L., Eds.; Springer Science+Business Media B.V.: New York, NY, USA, 2008; pp. 431–439. [Google Scholar]
- Vidal, M. A unifying view of 21st century systems biology. FEBS Lett. 2009, 583, 3891–3894. [Google Scholar] [CrossRef] [PubMed]
- Barabasi, A.L.; Oltvai, Z.N. Network biology: Understanding the cell’s functional organization. Nat. Rev. Genet. 2004, 5, 101–113. [Google Scholar] [CrossRef] [PubMed]
- Liu, L.; Agren, R.; Bordel, S.; Nielsen, J. Use of genome-scale metabolic models for understanding microbial physiology. FEBS Lett. 2010, 584, 2556–2564. [Google Scholar] [CrossRef] [PubMed]
- Cortassa, S.; Aon, M.A. Computational modeling of mitochondrial function. Methods Mol. Biol. 2012, 810, 311–326. [Google Scholar] [PubMed]
- Cortassa, S.; Aon, M.A. Dynamics of mitochondrial redox and energy networks: Insights from an experimental-computational synergy. In Systems Biology of Metabolic and Signaling Networks. Energy, Mass and Information Transfer, 1st ed.; Aon, M.A., Saks, V., Schlattner, U., Eds.; Springer-Verlag: Berlin, Germany, 2013; pp. 115–144. [Google Scholar]
- Cortassa, S.; O’Rourke, B.; Winslow, R.L.; Aon, M.A. Control and regulation of mitochondrial energetics in an integrated model of cardiomyocyte function. Biophys. J. 2009, 96, 2466–2478. [Google Scholar] [CrossRef] [PubMed]
- Cortassa, S.; O’Rourke, B.; Winslow, R.L.; Aon, M.A. Control and regulation of integrated mitochondrial function in metabolic and transport networks. Int. J. Mol. Sci. 2009, 10, 1500–1513. [Google Scholar] [CrossRef] [PubMed]
- De Vargas Roditi, L.; Claassen, M. Computational and experimental single cell biology techniques for the definition of cell type heterogeneity, interplay and intracellular dynamics. Curr. Opin. Biotechnol. 2014, 34, 9–15. [Google Scholar] [CrossRef] [PubMed]
- Kurz, F.T.; Aon, M.A.; O’Rourke, B.; Armoundas, A.A. Spatio-temporal oscillations of individual mitochondria in cardiac myocytes reveal modulation of synchronized mitochondrial clusters. Proc. Natl. Acad. Sci. USA 2010, 107, 14315–14320. [Google Scholar] [CrossRef] [PubMed]
- Kurz, F.T.; Aon, M.A.; O’Rourke, B.; Armoundas, A.A. Cardiac mitochondria exhibit dynamic functional clustering. Front. Physiol. 2014, 5, 329. [Google Scholar] [CrossRef] [PubMed]
- Zhou, L.; Aon, M.A.; Almas, T.; Cortassa, S.; Winslow, R.L.; O’Rourke, B. A reaction-diffusion model of ROS-induced ROS release in a mitochondrial network. PLoS Comput. Biol. 2010, 6, e1000657. [Google Scholar] [CrossRef] [PubMed]
- Aon, M.A.; Cortassa, S. Dynamic Biological Organization. Fundamentals as Applied to Cellular Systems; Chapman & Hall: London, UK, 1997. [Google Scholar]
- Cortassa, S.; Aon, M.A.; Westerhoff, H.V. Linear nonequilibrium thermodynamics describes the dynamics of an autocatalytic system. Biophys. J. 1991, 60, 794–803. [Google Scholar] [CrossRef]
- Lloyd, D.; Poole, R.K.; Edwards, S.W. The Cell Division Cycle: Temporal Organization and Control of Cellular Growth and Reproduction; Academic Press: London, UK, 1982; p. 523. [Google Scholar]
- Nicolis, G.; Prigogine, I. Self-organization in Nonequilibrium Systems: From Dissipative Structures to Order Through Fluctuations; Wiley: New York, NY, USA, 1977; p. xii, 491. [Google Scholar]
- Schneider, E.D.; Sagan, D. Into the Cool. Energy Flow, Thermodynamics and Life; The University of Chicago Press: Chicago, IL, USA, 2005. [Google Scholar]
- Yates, E.F. Self-Organizing Systems. The Emergence of Order; Plenum Press: New York, NY, USA, 1987; pp. 1–14. [Google Scholar]
- Hood, L.; Tian, Q. Systems approaches to biology and disease enable translational systems medicine. Genomics Proteomics Bioinform. 2012, 10, 181–185. [Google Scholar] [CrossRef] [PubMed]
- Gleick, J. The Information: A History, a Theory, a Flood; Vintage Books: New York, NY, USA, 2011. [Google Scholar]
- Varela, F.; Maturana, H.; Uribe, R. Autopoiesis: The organization of living sytems, its characterization and a model. Biosystems 1974, 5, 187–196. [Google Scholar] [CrossRef]
- Maturana, H.; Varela, F. De Maquinas y Seres Vivos. Autopoiesis: La Organizacion de lo Vivo; Editorial Universitaria: Santiago de Chile, Chile, 1994; (in French). [Google Scholar]
- McKnight, S.L. On getting there from here. Science 2010, 330, 1338–1339. [Google Scholar] [CrossRef] [PubMed]
- Capra, F. The Web of Life; Anchor books Doubleday: New York, NY, USA, 1996. [Google Scholar]
- Kitano, H. Computational systems biology. Nature 2002, 420, 206–210. [Google Scholar] [CrossRef] [PubMed]
- Lanpher, B.; Brunetti-Pierri, N.; Lee, B. Inborn errors of metabolism: The flux from mendelian to complex diseases. Nat. Rev. Genet. 2006, 7, 449–460. [Google Scholar] [CrossRef] [PubMed]
- Cascante, M.; Marin, S. Metabolomics and fluxomics approaches. Essays Biochem. 2008, 45, 67–81. [Google Scholar] [CrossRef] [PubMed]
- Cortassa, S.; Caceres, V.; Bell, L.N.; O’Rourke, B.; Paolocci, N.; Aon, M.A. From metabolomics to fluxomics: A computational procedure to translate metabolite profiles into metabolic fluxes. Biophys. J. 2015, 108, 163–172. [Google Scholar] [CrossRef] [PubMed]
- Niedenfuhr, S.; Wiechert, W.; Noh, K. How to measure metabolic fluxes: A taxonomic guide for 13C fluxomics. Curr. Opin. Biotechnol. 2014, 34, 82–90. [Google Scholar] [CrossRef] [PubMed]
- Raamsdonk, L.M.; Teusink, B.; Broadhurst, D.; Zhang, N.; Hayes, A.; Walsh, M.C.; Berden, J.A.; Brindle, K.M.; Kell, D.B.; Rowland, J.J.; et al. A functional genomics strategy that uses metabolome data to reveal the phenotype of silent mutations. Nat. Biotechnol. 2001, 19, 45–50. [Google Scholar] [PubMed]
- Griffin, J.L. The Cinderella story of metabolic profiling: Does metabolomics get to go to the functional genomics ball? Philos. Trans. R. Soc. Lond. B Biol. Sci. 2006, 361, 147–161. [Google Scholar] [CrossRef] [PubMed]
- Kell, D.B.; Goodacre, R. Metabolomics and systems pharmacology: Why and how to model the human metabolic network for drug discovery. Drug Discov. Today 2014, 19, 171–182. [Google Scholar] [CrossRef] [PubMed]
- Winter, G.; Kromer, J.O. Fluxomics―connecting 'omics analysis and phenotypes. Environ. Microbiol. 2013, 15, 1901–1916. [Google Scholar] [CrossRef] [PubMed]
- Orth, J.D.; Thiele, I.; Palsson, B.O. What is flux balance analysis? Nat. Biotechnol. 2010, 28, 245–248. [Google Scholar] [CrossRef] [PubMed]
- Savinell, J.M.; Palsson, B.O. Optimal selection of metabolic fluxes for in vivo measurement. II. Application to escherichia coli and hybridoma cell metabolism. J. Theor. Biol. 1992, 155, 215–242. [Google Scholar] [CrossRef]
- Feist, A.M.; Henry, C.S.; Reed, J.L.; Krummenacker, M.; Joyce, A.R.; Karp, P.D.; Broadbelt, L.J.; Hatzimanikatis, V.; Palsson, B.O. A genome-scale metabolic reconstruction for Escherichia coli K-12 MG1655 that accounts for 1260 ORFs and thermodynamic information. Mol. Syst. Biol. 2007, 3, 121. [Google Scholar] [CrossRef] [PubMed]
- Sauer, U. Metabolic networks in motion: 13C-based flux analysis. Mol. Syst. Biol. 2006, 2, 62. [Google Scholar] [CrossRef] [PubMed]
- Lloyd, D. Oscillations, synchrony and deterministic chaos. Prog. Bot. 2009, 70, 70–91. [Google Scholar]
- Lloyd, D.; Murray, D.B. Redox rhythmicity: Clocks at the core of temporal coherence. Bioessays 2007, 29, 465–473. [Google Scholar] [CrossRef] [PubMed]
- Murray, D.B.; Amariel, C.; Sasidharan, K.; Machne, R.; Aon, M.A.; Lloyd, D. Temporal partitioning of the yeast cellular network. In Systems Biology of Metabolic and Signaling Networks. Energy, Mass and Information Transfer; Aon, M.A., Saks, V., Schlattner, U., Eds.; Springer-Verlag: Berlin, Germany, 2013; pp. 323–349. [Google Scholar]
- Aon, M.A.; Cortassa, S.; Lloyd, D. Chaos in biochemistry and physiology. In Encyclopedia of Molecular Cell Biology and Molecular Medicine: Systems Biology; Meyers, R., Ed.; Wiley-VCH: Weinheim, Germany, 2011. [Google Scholar]
- Asher, G.; Sassone-Corsi, P. Time for food: The intimate interplay between nutrition, metabolism, and the circadian clock. Cell 2015, 161, 84–92. [Google Scholar] [CrossRef] [PubMed]
- Liu, J.; Grieson, C.S.; Webb, A.A.; Hussey, P.J. Modelling dynamic plant cells. Curr. Opin. Plant Biol. 2010, 13, 744–749. [Google Scholar] [CrossRef] [PubMed]
- Aon, J.C.; Cortassa, S. Involvement of nitrogen metabolism in the triggering of ethanol fermentation in aerobic chemostat cultures of saccharomyces cerevisiae. Metab. Eng. 2001, 3, 250–264. [Google Scholar] [CrossRef] [PubMed]
- Fu, Z.; Verderame, T.D.; Leighton, J.M.; Sampey, B.P.; Appelbaum, E.R.; Patel, P.S.; Aon, J.C. Exometabolome analysis reveals hypoxia at the up-scaling of a saccharomyces cerevisiae high-cell density fed-batch biopharmaceutical process. Microb. Cell Factories. 2014, 13, 32. [Google Scholar] [CrossRef] [PubMed]
- Akar, F.G.; Aon, M.A.; Tomaselli, G.F.; O’Rourke, B. The mitochondrial origin of postischemic arrhythmias. J. Clin. Investig. 2005, 115, 3527–3535. [Google Scholar] [CrossRef] [PubMed]
- Aon, M.A.; Cortassa, S.; Akar, F.G.; Brown, D.A.; Zhou, L.; O’Rourke, B. From mitochondrial dynamics to arrhythmias. Int. J. Biochem. Cell Biol. 2009, 41, 1940–1948. [Google Scholar] [CrossRef] [PubMed]
- Kurz, F.T.; Aon, M.A.; O’Rourke, B.; Armoundas, A.A. Wavelet analysis reveals heterogeneous time-dependent oscillations of individual mitochondria. Am. J. Physiol. Heart Circ. Physiol. 2010, 299, H1736–H1740. [Google Scholar] [CrossRef] [PubMed]
- Qu, Z. Network dynamics in cardiac electrophysiology. In Systems Biology of Metabolic and Signaling Networks. Energy, Mass and Information Transfer, 1st ed.; Aon, M.A., Saks, V., Schlattner, U., Eds.; Springer-Verlag: Berlin, Germany, 2013; pp. 243–260. [Google Scholar]
- Aon, M.A.; Cortassa, S.; O’Rourke, B. Percolation and criticality in a mitochondrial network. Proc. Natl. Acad. Sci. USA 2004, 101, 4447–4452. [Google Scholar] [CrossRef] [PubMed]
- Kembro, J.M.; Cortassa, S.; Aon, M.A. Mitochondrial ros and arrhythmias. In Systems Biology of Free Radicals and Anti-oxidants; Laher, I., Ed.; Springer-Verlag: Berlin, Germany, 2014. [Google Scholar]
- Zhou, L.; Cortassa, S.; Wei, A.C.; Aon, M.A.; Winslow, R.L.; O’Rourke, B. Modeling cardiac action potential shortening driven by oxidative stress-induced mitochondrial oscillations in guinea pig cardiomyocytes. Biophys. J. 2009, 97, 1843–1852. [Google Scholar] [CrossRef] [PubMed]
- Zhou, L.; Solhjoo, S.; Millare, B.; Plank, G.; Abraham, M.R.; Cortassa, S.; Trayanova, N.; O’Rourke, B. Effects of regional mitochondrial depolarization on electrical propagation: Implications for arrhythmogenesis. Circ. Arrhythm. Electrophysiol. 2014, 7, 143–151. [Google Scholar] [CrossRef] [PubMed]
- Roussel, M.R.; Lloyd, D. Observation of a chaotic multioscillatory metabolic attractor by real-time monitoring of a yeast continuous culture. FEBS J. 2007, 274, 1011–1018. [Google Scholar] [CrossRef] [PubMed]
- Aon, M.A.; Roussel, M.R.; Cortassa, S.; O’Rourke, B.; Murray, D.B.; Beckmann, M.; Lloyd, D. The scale-free dynamics of eukaryotic cells. PLoS ONE 2008, 3, e3624. [Google Scholar] [CrossRef] [PubMed] [Green Version]
- Sasidharan, K.; Tomita, M.; Aon, M.; Lloyd, D.; Murray, D.B. Time-structure of the yeast metabolism in vivo. Adv. Exp. Med. Biol. 2012, 736, 359–379. [Google Scholar] [PubMed]
- Hartwell, L.H.; Hopfield, J.J.; Leibler, S.; Murray, A.W. From molecular to modular cell biology. Nature 1999, 402, C47–C52. [Google Scholar] [CrossRef] [PubMed]
- Cortassa, S.; Aon, M.A.; O’Rourke, B.; Jacques, R.; Tseng, H.J.; Marban, E.; Winslow, R.L. A computational model integrating electrophysiology, contraction, and mitochondrial bioenergetics in the ventricular myocyte. Biophys. J. 2006, 91, 1564–1589. [Google Scholar] [CrossRef] [PubMed]
- Del Vecchio, D. Modularity, context-dependence, and insulation in engineered biological circuits. Trends Biotechnol. 2015, 33, 111–119. [Google Scholar] [CrossRef] [PubMed]
- Freddolino, P.L.; Tavazoie, S. The dawn of virtual cell biology. Cell 2012, 150, 248–250. [Google Scholar] [CrossRef] [PubMed]
- Karr, J.R.; Sanghvi, J.C.; Macklin, D.N.; Gutschow, M.V.; Jacobs, J.M.; Bolival, B., Jr.; Assad-Garcia, N.; Glass, J.I.; Covert, M.W. A whole-cell computational model predicts phenotype from genotype. Cell 2012, 150, 389–401. [Google Scholar] [CrossRef] [PubMed]
- Plank, G.; Zhou, L.; Greenstein, J.L.; Cortassa, S.; Winslow, R.L.; O’Rourke, B.; Trayanova, N.A. From mitochondrial ion channels to arrhythmias in the heart: Computational techniques to bridge the spatio-temporal scales. Philos. Trans. A Math. Phys. Eng. Sci. 2008, 366, 3381–3409. [Google Scholar] [CrossRef] [PubMed]
- Ducat, D.C.; Silver, P.A. Improving carbon fixation pathways. Curr. Opin. Chem. Biol. 2012, 16, 337–344. [Google Scholar] [CrossRef] [PubMed]
- Long, S.P.; Marshall-Colon, A.; Zhu, X.-G. Meeting the global food demand of the future by engineering crop photosynthesis and yield potential. Cell 2015, 161, 56–66. [Google Scholar] [CrossRef] [PubMed]
- Chew, Y.H.; Wenden, B.; Flis, A.; Mengin, V.; Taylor, J.; Davey, C.L.; Tindal, C.; Thomas, H.; Ougham, H.J.; de Reffye, P.; et al. Multiscale digital arabidopsis predicts individual organ and whole-organism growth. Proc. Natl. Acad. Sci. USA 2014, 111, E4127–E4136. [Google Scholar] [CrossRef] [PubMed]
- Xin, C.P.; Tholen, D.; Devloo, V.; Zhu, X.G. The benefits of photorespiratory bypasses: How can they work? Plant Physiol. 2015, 167, 574–585. [Google Scholar] [CrossRef] [PubMed]
- Obituary intimation Prof. Daniel Thomas, UTC pioneer. Available online: http://www.utc.fr/utc_espacepresse/iso_album/cp_danielthomas_gb.pdf (accessed on 10 July 2015).
© 2015 by the authors; licensee MDPI, Basel, Switzerland. This article is an open access article distributed under the terms and conditions of the Creative Commons Attribution license (http://creativecommons.org/licenses/by/4.0/).
Share and Cite
MDPI and ACS Style
Aon, M.A.; Cortassa, S. Systems Biology of the Fluxome. Processes 2015, 3, 607-618. https://0-doi-org.brum.beds.ac.uk/10.3390/pr3030607
AMA Style
Aon MA, Cortassa S. Systems Biology of the Fluxome. Processes. 2015; 3(3):607-618. https://0-doi-org.brum.beds.ac.uk/10.3390/pr3030607
Chicago/Turabian StyleAon, Miguel A., and Sonia Cortassa. 2015. "Systems Biology of the Fluxome" Processes 3, no. 3: 607-618. https://0-doi-org.brum.beds.ac.uk/10.3390/pr3030607