Biomass Sources and Energy Potential for Energy Sector in Myanmar: An Outlook


1
Department of Power Engineering, VŠB-Technical University of Ostrava, 17. Listopadu 15, 70833 Ostrava-Poruba, Czech Republic
2
Department of Mechanical Engineering, Government Technical Institute, Mawlamyine MMR011001, Mon State, Myanmar
3
Department of Energy Engineering, Czech Technical University, Zikova 1903/4, 166 36 Prague, Czech Republic
*
Author to whom correspondence should be addressed.
Resources 2019, 8(2), 102; https://0-doi-org.brum.beds.ac.uk/10.3390/resources8020102
Submission received: 3 May 2019
/
Revised: 16 May 2019
/
Accepted: 24 May 2019
/
Published: 28 May 2019
(This article belongs to the Special Issue Renewable Energy and Chemical Sources from the Thermal Conversion of Biomass)
Abstract
:Nowadays, renewable energy utilization plays a key role in developing countries to fulfill the additional energy requirements of a country and reduce dependency on fossil fuels and traditional biomass consumption. As Myanmar has an agriculture-based economy and 48% of forest-cover (32.2 million hectares); biomass is one of the major renewable energy sources, contributing around 50% of total energy consumption. Therefore, the study aimed to highlight the available biomass sources and energy potential for the energy sector in Myanmar. In order to achieve the aim, the study collated the types, quantity and qualities of biomass resources, and energy utilization around Myanmar. Besides, the study synthesized and evaluated the energy potential of the major biomass resources coming from the agriculture sector, forest sector, livestock and poultry sector, and municipal sector. It was estimated that the total energy potential of the major biomass sources amounted to approximately 15.19 million tons of oil equivalent (Mtoe) in 2005 and 17.29 Mtoe in 2017, respectively. The unexploited biomass energy potential around the country was estimated to be nearly 50% higher than that of the projected biomass energy utilization during 2015–2019. Finally, the study concluded with recommendations to provide the future sustainable development of biomass energy in Myanmar.
1. Introduction
Myanmar is one of the Southeast Asian countries, being composed of seven states and seven divisions—three cities and 331 towns [1,2]. Myanmar had the total population of over 54 million residents in 2019 [3]. The annual population growth rate is 1.62%, and around 37% of the total population resides in urban area [2,3]. The population in Myanmar is expected to reach 56.32 million in 2020 [4]. Naypyidaw is the capital city. However, Yangon is the largest city and a commercial centre of the country. The neighbouring countries are Thailand, Laos PDR, China, Bangladesh and India. There are three seasons during a year: namely, summer, rainy season and winter.
Myanmar covers approximately an area of 677,000 square kilometers and around 50% of such total land area is forested. Wood-fuel plays a vital role for cooking and cottage industries in both urban and rural areas [5]. Along with the installed capacity of 3494 megawatt (MW) for power generation around the country, the electrification rate of Myanmar was approximately 26% in the year 2012, projecting to 60% in 2020 [6]. The primary energy supply comes from biomass, coal, gas, and hydro power. Myanmar’s energy policies and strategies have expressed efforts to provide sufficient energy resources for the country’s development need [7] by expecting the energy security from hydropower to provide a high-energy balance and an enhancer for bio-fuel production [8].
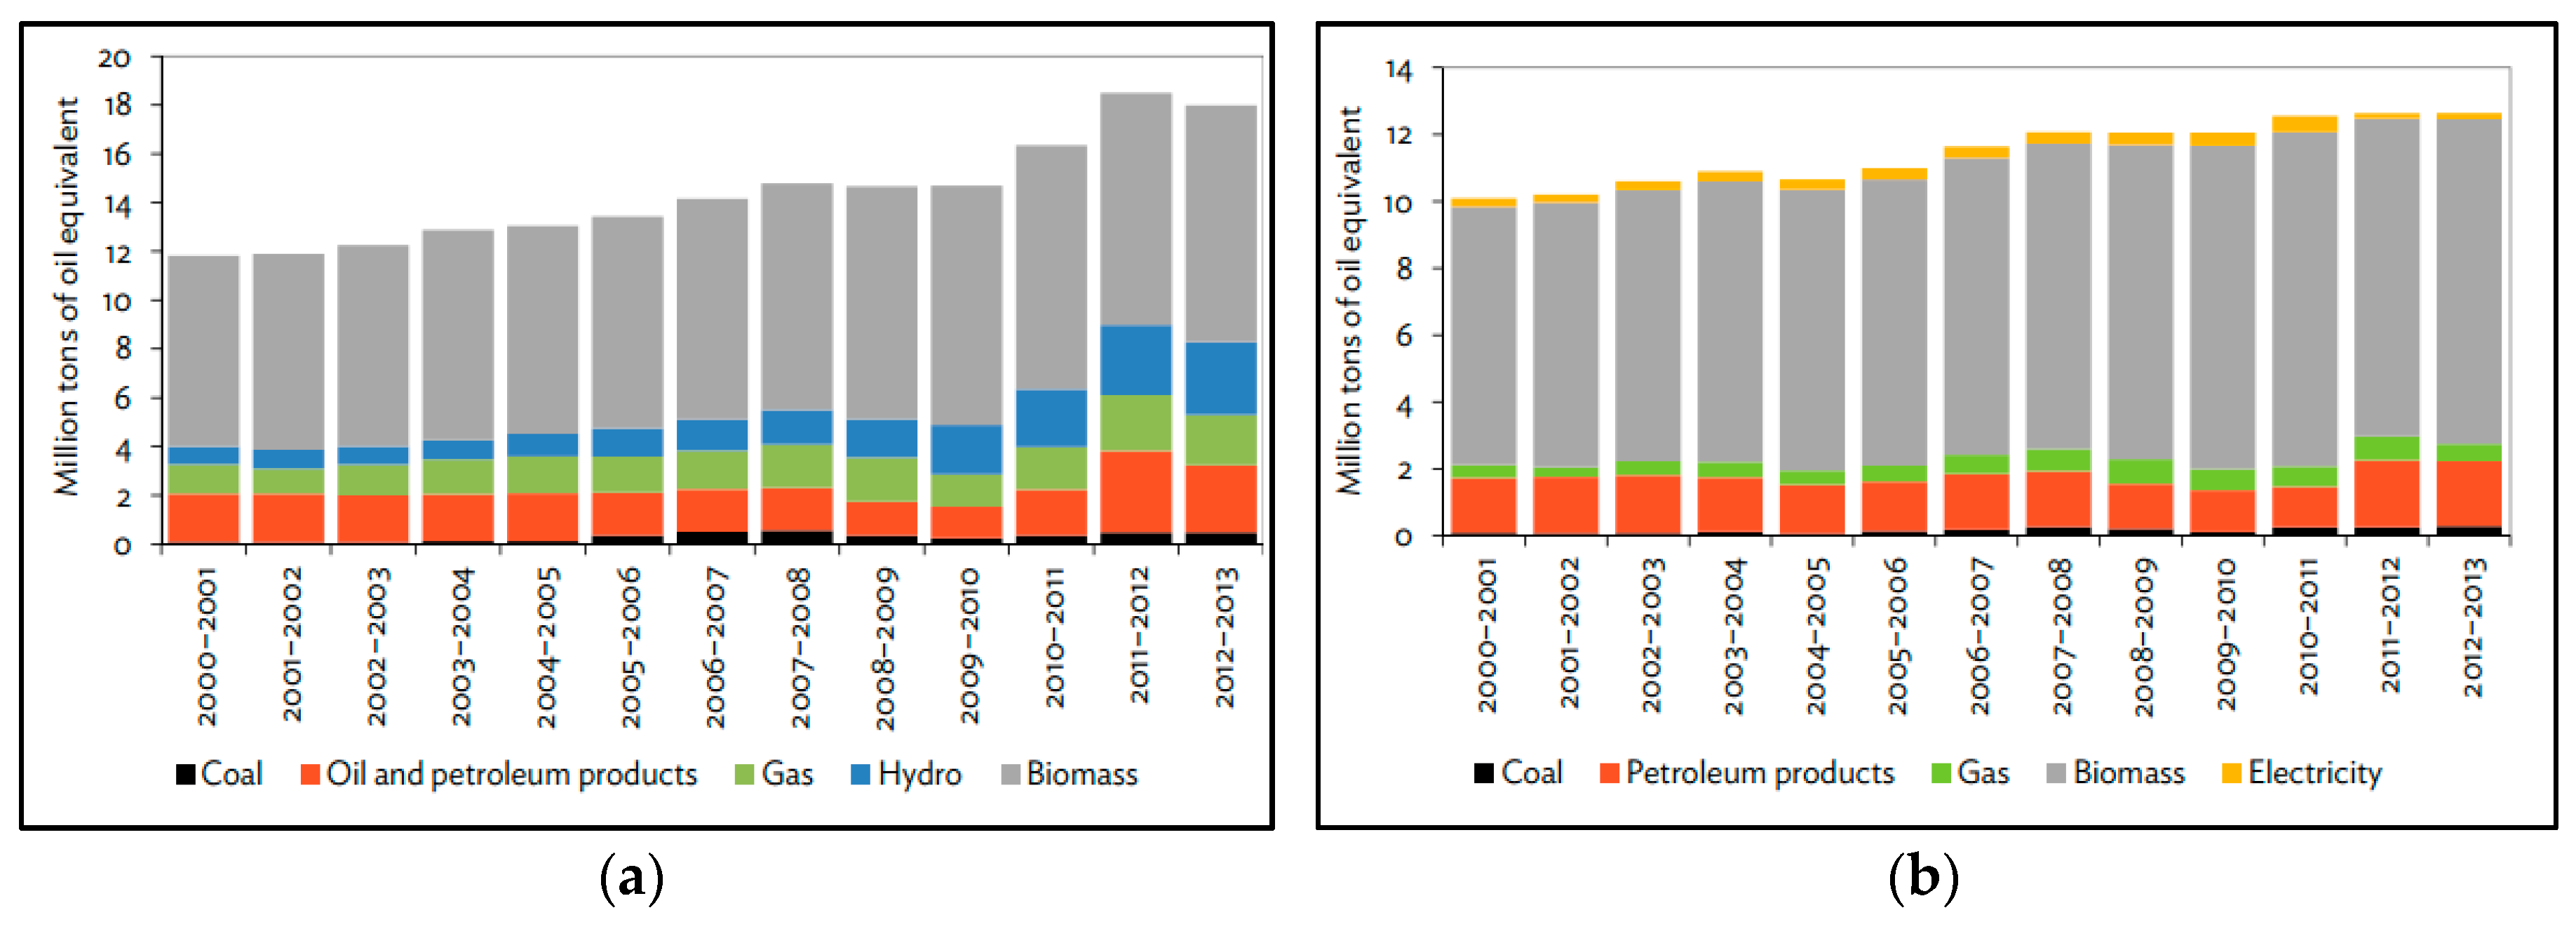
The major energy sources for the total primary energy supply in Myanmar are coal, oil and petroleum products, gas, hydro, and biomass (Figure 1a). Most of the total energy supply came from biomass, with about 10 million tons of oil equivalent (Mtoe) in 2012–2013 [9]. It was more than half of the total energy supply, followed by 17% hydro, 15% oil, 12% gas, and 3% coal. Meanwhile, the total final energy consumption in Myanmar had a gradual increase by around 2% annually during 2000–2013 (Figure 1b). The major energy consumption by fuel type accounted for biomass (77%), followed by petroleum products (16%) and gas (2%).
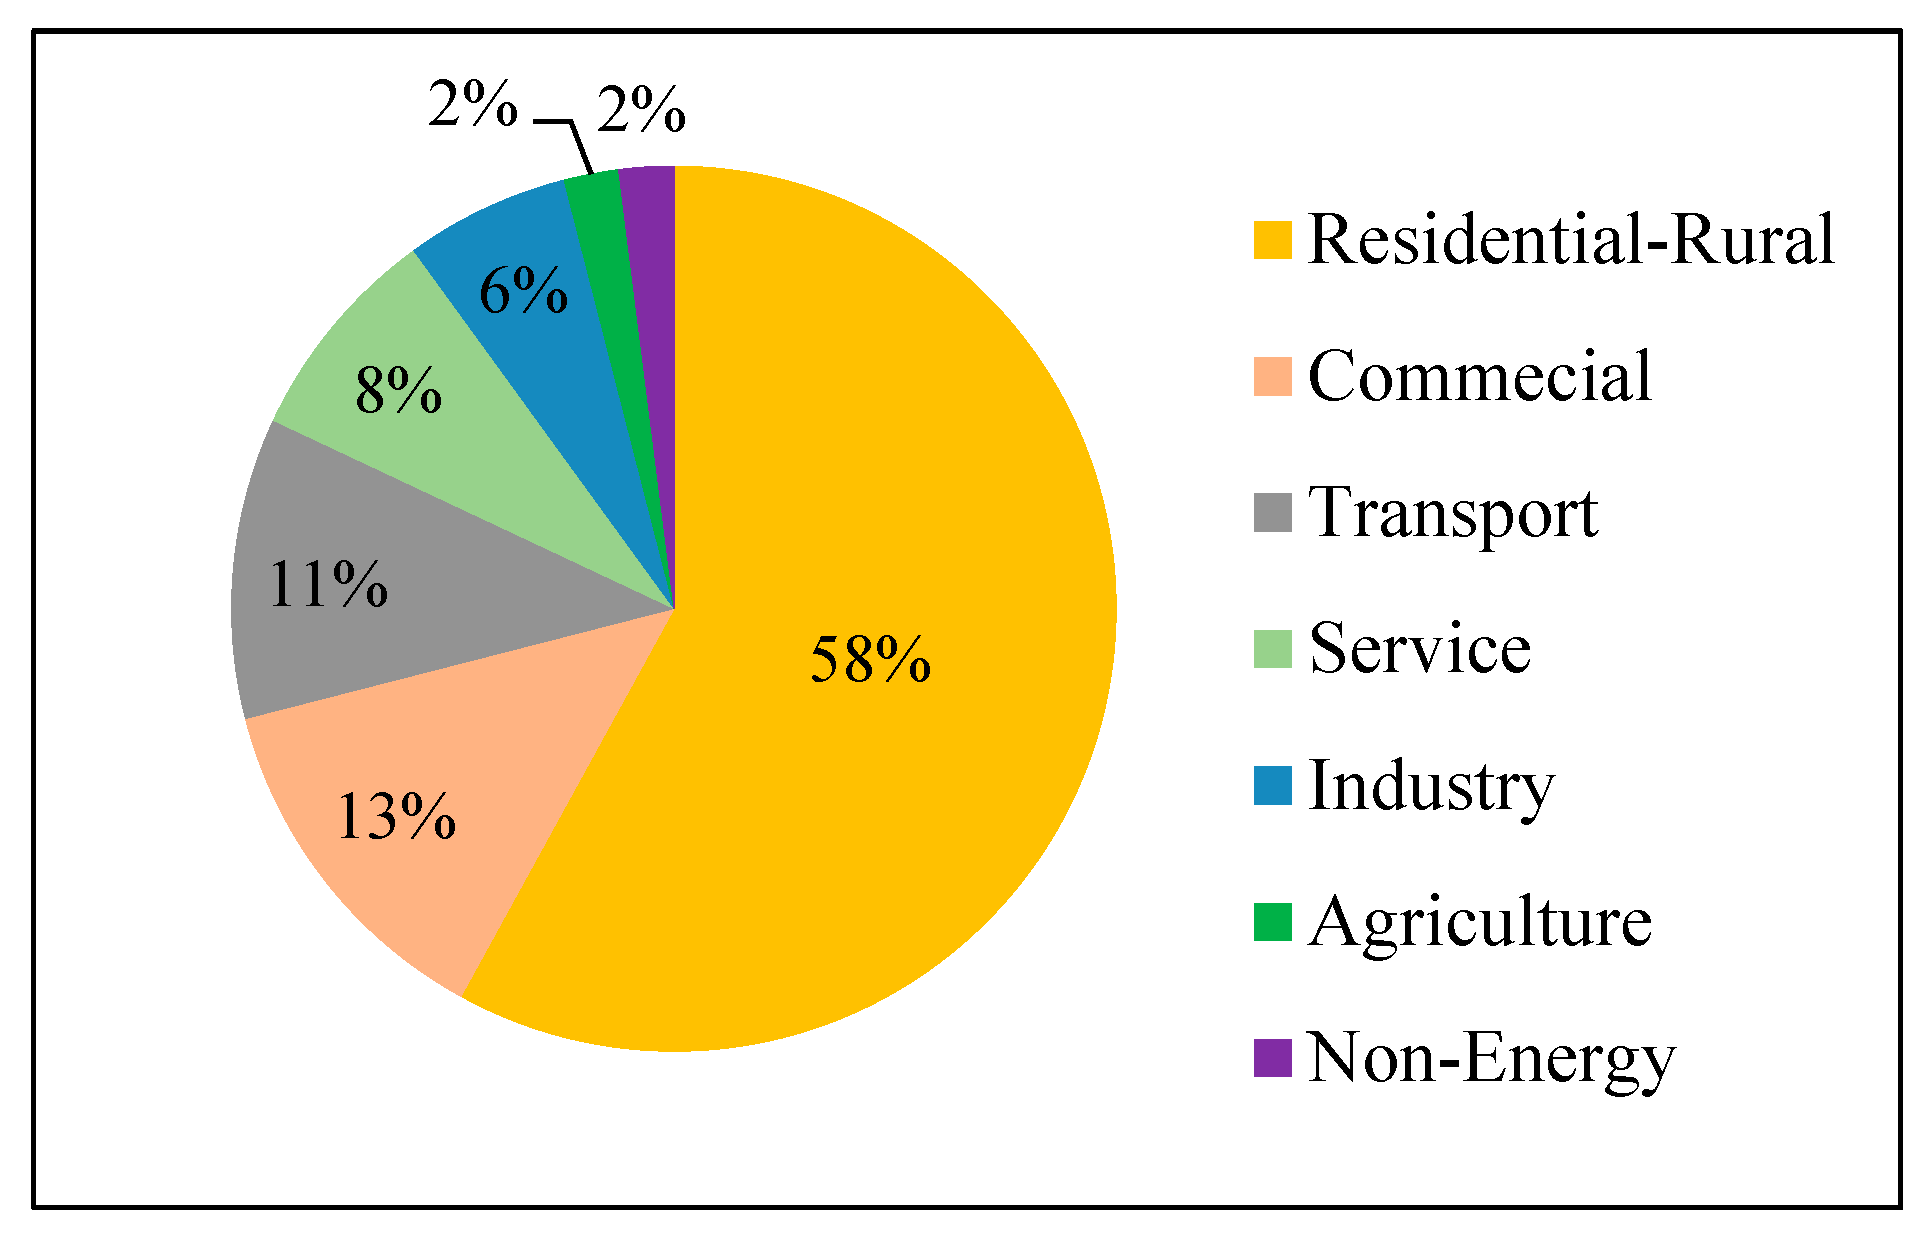
Myanmar’s energy consumption by sector in 2012 is shown in Figure 2. Over 50% of the major energy was consumed by the residential and rural sector; followed by commercial sector (13%), transport sector (11%) and service sector (8%). However, the agriculture sector had only 2% of the total energy consumption. It reflected that being an agriculture-based country, Myanmar needed more energy consumption for agriculture sector to boost the agricultural economy and sustainable development of the country.
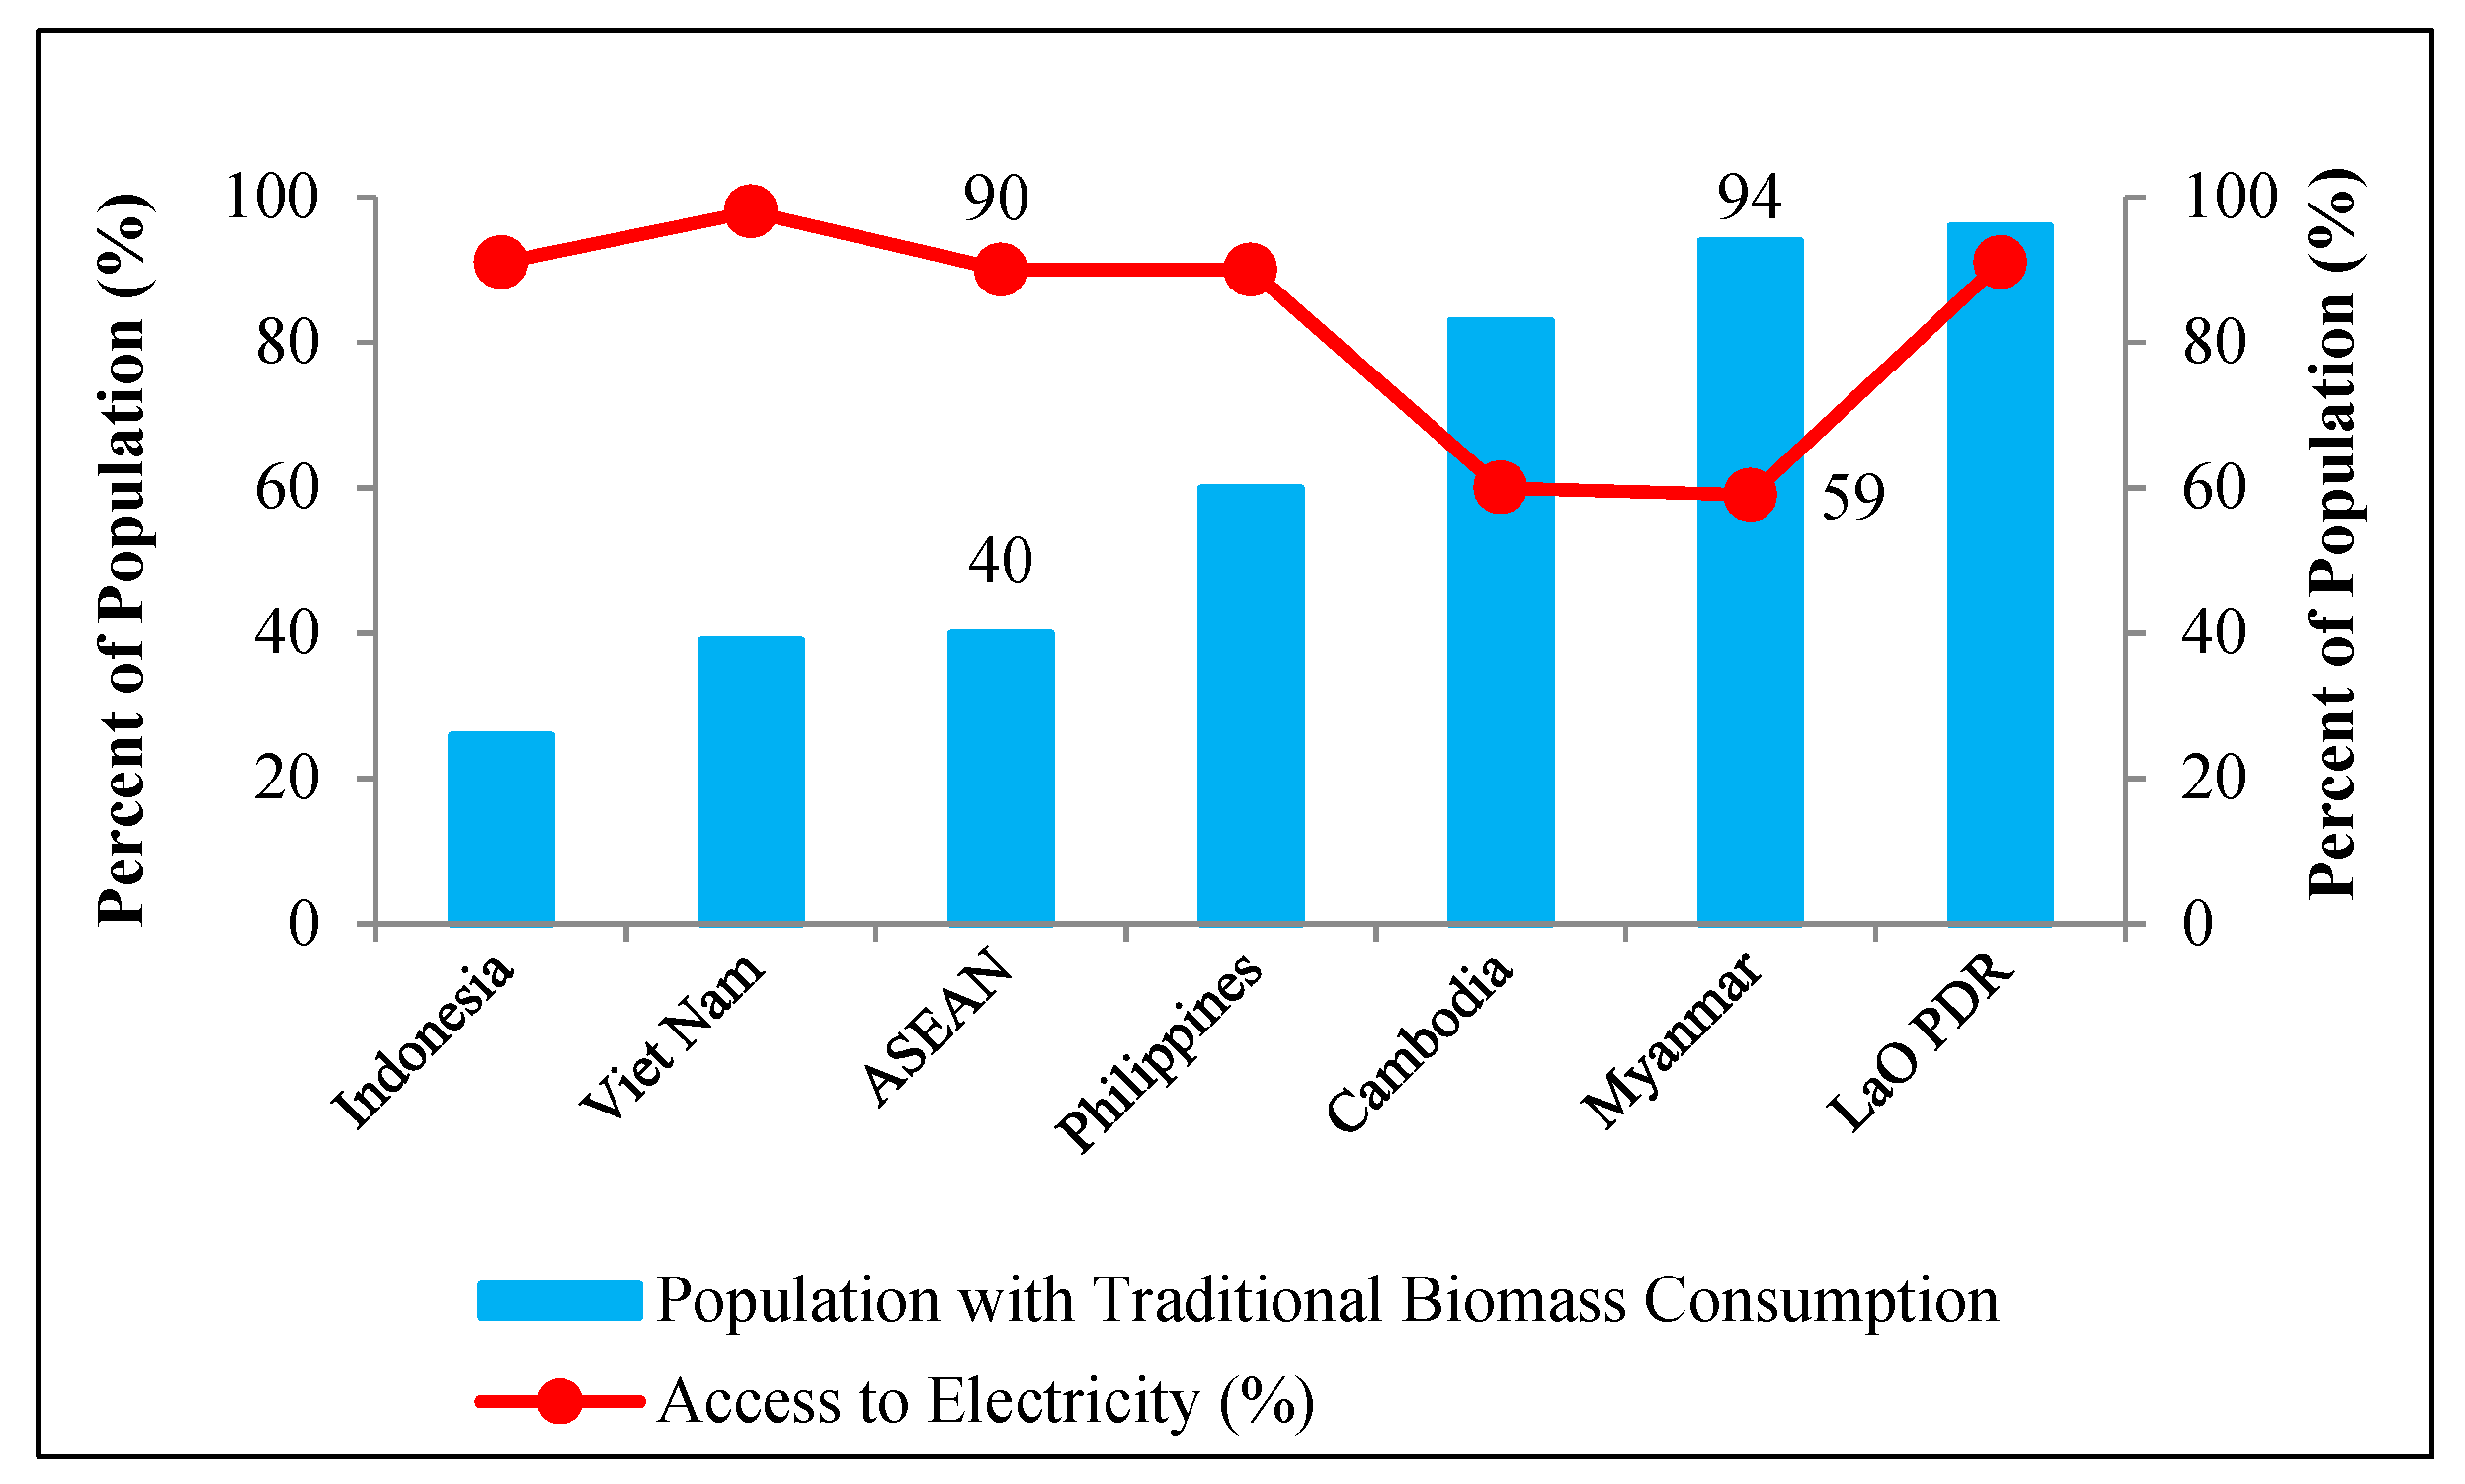
In Association of Southeast Asian Nations (ASEAN) member countries, the energy from biomass such as wood and agricultural residues represent about 40% of total energy consumption—more than 2.5 million Terajoules per year [11]. Among the ASEAN member countries, Myanmar is more dependent on solid traditional fuels for cooking and heating [12]. As a traditional type of biomass, fuelwood is the only source of the major energy consumption [6]. However, the high rates of rural poverty place severe stress on Burmese forests and mangroves for fuelwood collection and charcoal production—homes cannot afford modern cooking fuels, so they cut down trees or scavenge for free wood [12]. Despite the sustainable forest management practices in Myanmar, these practices could not produce enough wood for the residents of the country [13]. Figure 3 describes traditional biomass consumption and access to electricity in the selected ASEAN member countries. Myanmar had the second largest biomass consumption in the selected ASEAN member countries, by approximately 94% of population, after LaO PDR. However, Myanmar remained the least access to electricity among the member countries, with an electricity access of only 59% in 2016. Besides, Myanmar had encountered the highest transmission and distribution losses of electricity in the Southeast Asian countries [14].
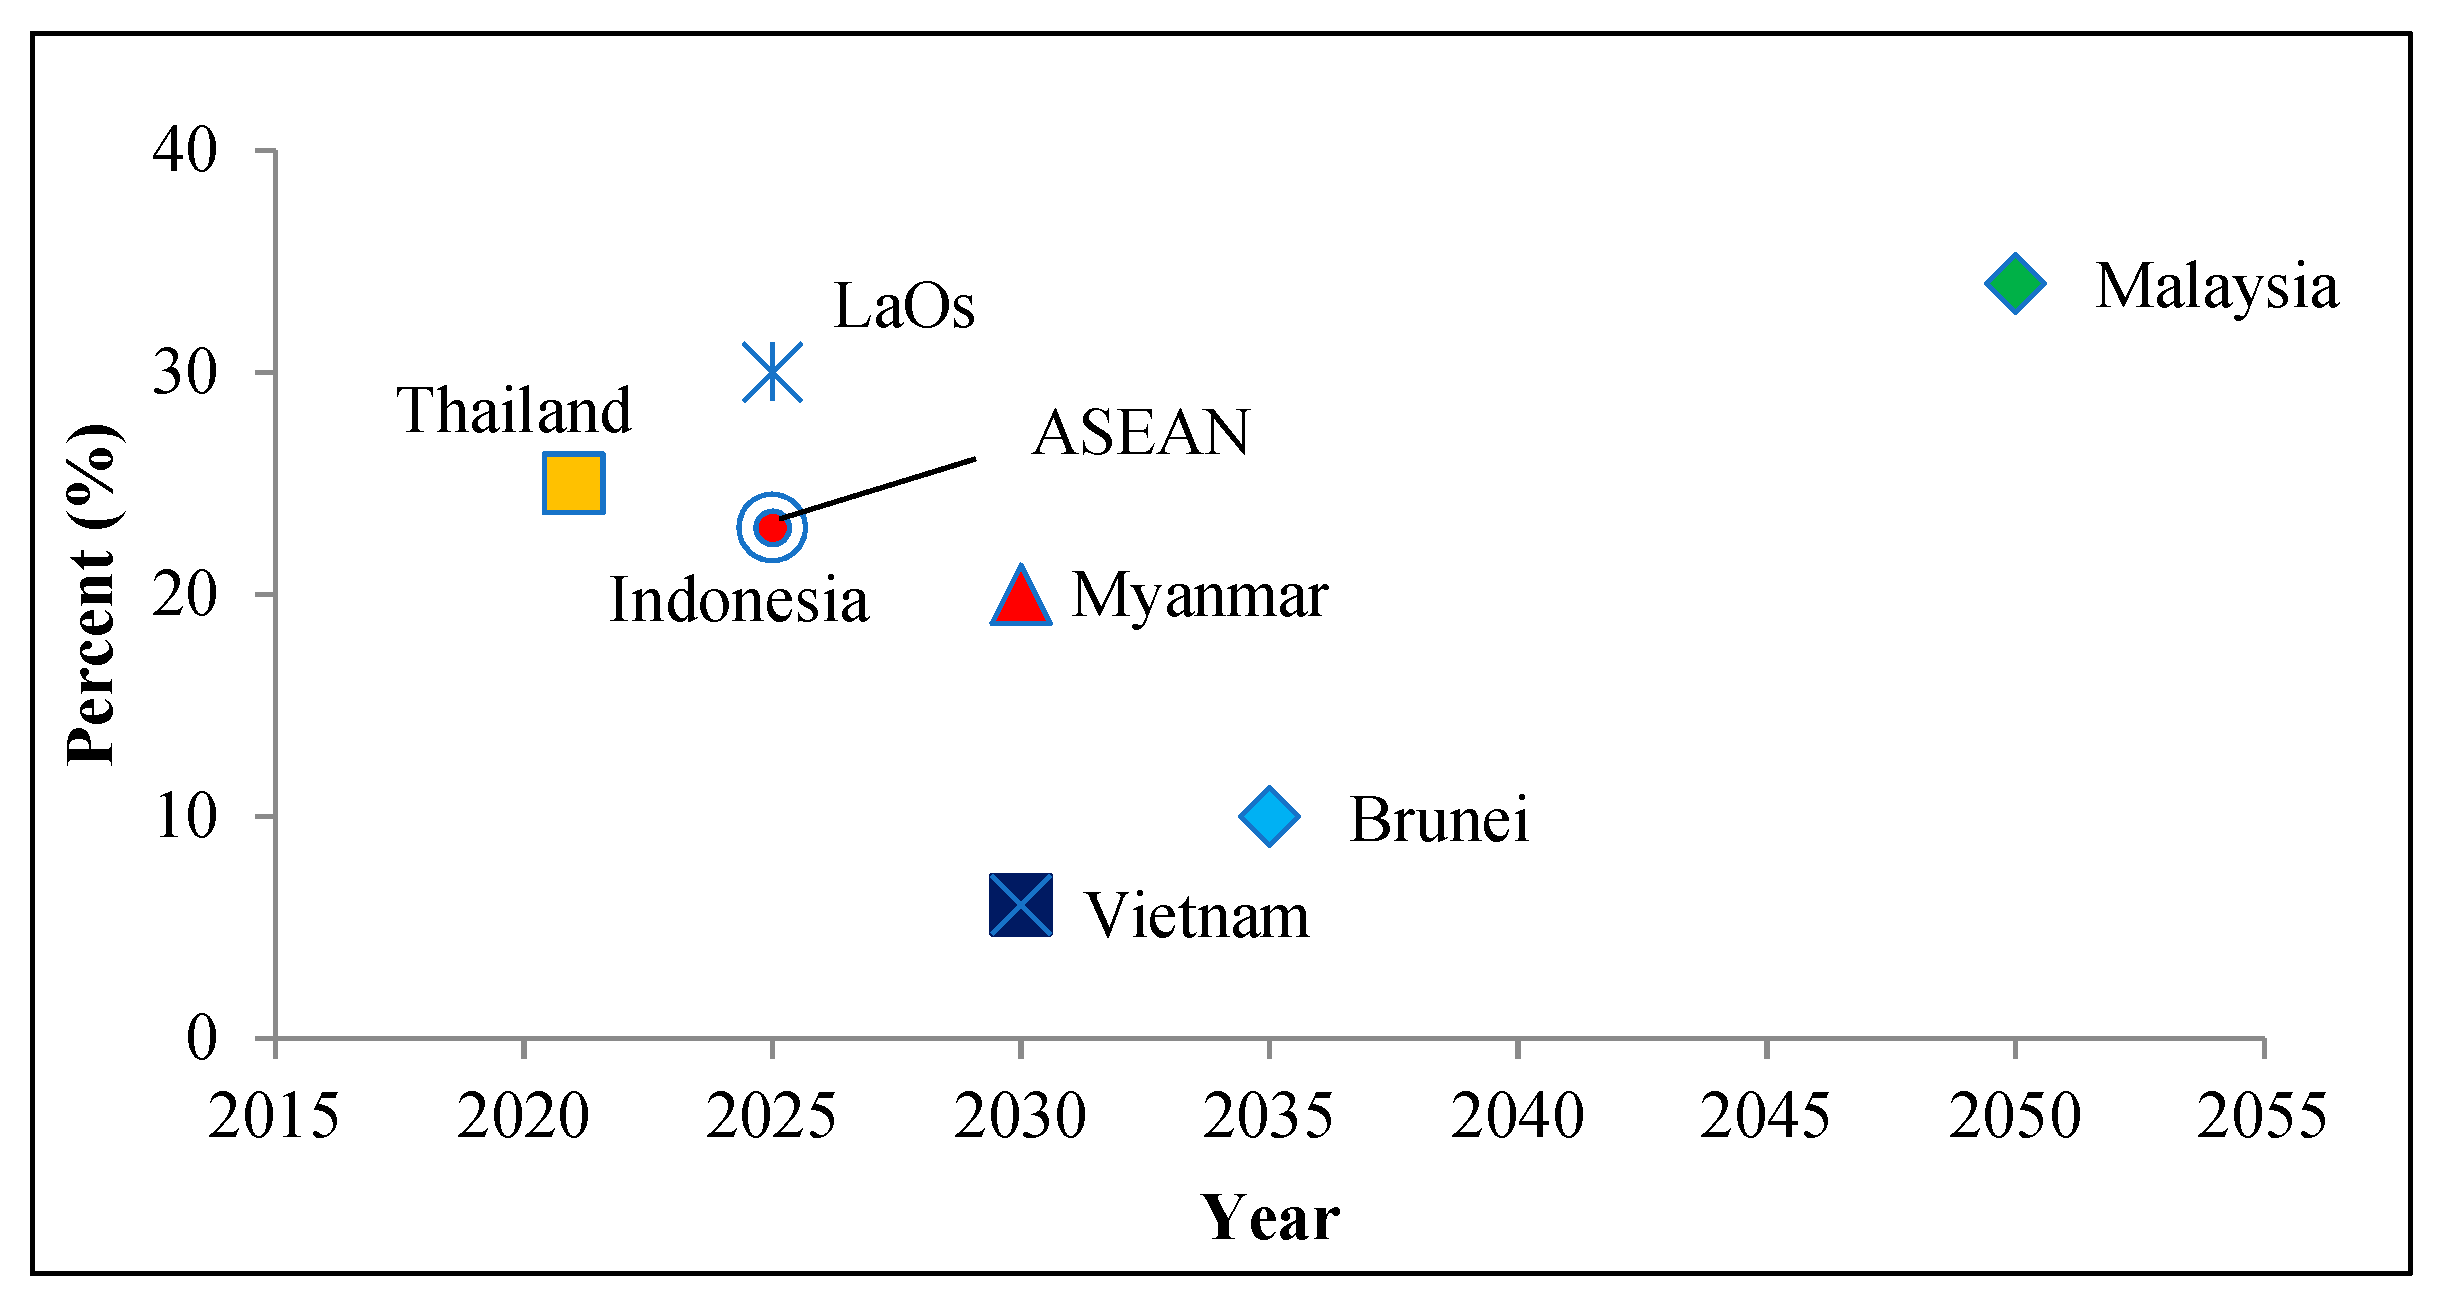
Figure 4 illustrates the potential share of renewable energy in the selected ASEAN member countries. Depending on the availability of the renewable energy sources within the countries such as forest resources, agriculture resources, hydropower, solar energy, wind energy, geothermal energy, etc., the different countries have different shares of renewable energy to their major energy supply within their projected years. Regarding the research studies by the scholars [10,16,17,18] on the renewable energy resource assessment of the ASEAN member countries, the target of renewable energy of the countries are described as follows: The target of renewable energy in Thailand is aimed at 25% of total energy consumption by 2021. Out of this, 4390 MW of power generation is planning to be gained from bio-energy sector. In Vietnam, the target of the country related to the energy sector is to increase the share of renewable energy from 3% in 2010 to 6% in 2030. Among the renewable energy sources in Vietnam, wind energy, solar energy, and bio-energy are playing a key role. In Cambodia, as a major biomass source for electricity generation, rice husk from agricultural wastes might contribute one million tons per year to generate 60–100 MW capacity. Meanwhile, old rubber trees could also generate 20–50 MW capacity. In Laos PDR, with an abundance of the forest resources, fuelwood is crucial in providing the energy around the country, accounting for about 88% of total energy needs. The projected power generation from biomass could increase from approximately 13 MW in 2015 to 58 MW in 2025. In Myanmar, the share of renewable energy to the total installed capacity is planning to reach 15–20% for the electricity sector by 2030, regardless of hydropower. Meanwhile, the contribution of biomass in Myanmar is projected to around 50% of the total energy supply. The total potential of renewable energy in ASEAN is estimated at approximately 23% in 2025.
Seven ministries of Myanmar are responsible for energy matters, with the Ministry of Energy as the focal point for overall energy policy and coordination [19]. To increase the energy self-sufficiency of the country, Myanmar is also implementing the energy strategy [20], regarding the availability of energy sources within the environmental constraints in the country. As a major power source that has the installed capacity of over 3 Gigawatt (GW) and an identified capacity potential of over 46 GW, the utilization of hydropower has been accelerated. Moreover, to prevent deforestation and environmental conservation, the use of fuelwood and charcoal will be reduced by substituting biomass energy as alternative fuels in the households and by using other renewable energies such as solar energy and wind energy.
Having agriculture-based economy and 48% of forest-cover (32.2 million hectares), Myanmar has been planning to boost biomass fuel productivity around the country in the years to come. Additionally, due to the long-term strategies related to the prevention of deforestation and the promotion of the renewable energy sector in the ASEAN member countries, biomass energy is playing a crucial role in the energy sector of Myanmar. Therefore, the aim of the study was to highlight the available biomass sources and their energy potential for the energy sector in Myanmar and to provide recommendations for the development of the biomass energy in the future of the country.
2. Materials and Methods
2.1. Data Collections
The data related to biomass sources and biomass energy utilization for this study were collected from the published research articles, reviewed articles, governmental reports and reports conducted by nongovernmental organizations during 2005 and 2019. Since Myanmar is a developing country, some country-specific data related to the biomass sources and their qualities were not sufficiently available, having the similar situations faced by other developing countries. Despite that, because most developing countries normally have a regular increase in the economic growth, the data related to biomass are not expected to have a dramatic change within a decade. Additionally, the recorded values related to biomass qualities such as the heating values of the biomass sources and residue-to-product ratios were collected from the ASEAN member countries such as Thailand, Vietnam, Cambodia, etc.
The sources of biomass in Myanmar majorly come from the forest sector, agricultural sector, and municipal sector. To estimate the future biomass energy potential in Myanmar, the study considered the following major biomass sources:
- The residues of the major agricultural crops (residues from paddy, maize, sugarcane, coconut, cassava, oil palm)
- The residues of the major livestock and poultry (manure of buffalo, cattle, pig and chicken)
- The residues from the forest sector (wood residues and fuelwood) and
- The residues from the municipal sector (municipal solid wastes).
The future fuelwood production potential was derived from the data of National Forestry Master Plan (2002–2030) [19]. The future crop production potential was derived from the data of Asian Development Bank 2015 report [21], Ricepedia (2000–2014) [22], Food and Agriculture Organization (FAO) [23] and the reports [24,25]. Municipal solid waste generation potential was also taken from Tun and Juchelkova (2018) [26].
Table 1 shows the crops, livestock, and poultry production in Myanmar. Being an agriculture-based country, the rice is the most important agricultural commodity of the country [27,28]. In 2017, the paddy production amounted to 25.67 million tons per year. However, paddy production had slightly decreased since the year 2010 due to the fluctuating weather patterns of the monsoon season, on which most farmers in Myanmar were depending as their primary water sources for agriculture, and the unusual flooding. Along with the agriculture-based economy, the country has so many cattle and goats in the central regions of the country—mostly in Nay Pyi Taw, Mandalay, Sagaing, Magway, Ayeyarwaddy Division, Shan, Kayah and Kachin State [6]. According to the population figures for the livestock and poultry subsectors from 2000 to 2012, the rapid growth rates in the livestock population numbers experienced since 2000, especially for pigs and poultry, underscore the potential for biogas production in Myanmar [21].
Table 2 presents the predicted supply of fuelwood as per National Forestry Master Plan of Myanmar. Nowadays, Myanmar’s forest policy is designed to promote the conservation and efficient use of management of forestry resources [19]. According to the Master Plan, the total predicted fuelwood supply from plantations, non-forest land, community forests and natural forests might range from about 31.55 million cubic meters in 2002 to 29.37 million cubic meters in 2030. It is observed that there is going to be a slight fall in the total predicted fuelwood supply during 2002–2030 in order to implement the forest conservation and lead to more reliance on renewable energy sources such as hydropower, solar power and alternative energy sources.
The rapid urbanization and increasing population have accelerated the municipal solid waste generation rates in Myanmar. The projected municipal solid waste generation in the country was described in Table 3.
2.2. Methods
2.2.1. Data Collation, Estimation and Evaluation of Biomass Sources
The collected data related to biomass sources were collated based on the types, quantity and qualities of biomass resources, and energy utilization around Myanmar during 2005–2019, except the fuelwood supply during 2002–2030. The estimated production of crops, livestock and poultry production and wood fuel supply, where some data were not sufficiently available, was carried out by means of the linear regression model—which of the estimated data during 2005–2019 can be seen in the supplementary table section. The estimation of biomass energy potential was made based on the following equations. Then, the study synthesized and evaluated the future energy potential from the major biomass resources in Myanmar.
Estimation of Biomass Energy Potential
Based on the calculation methods of biomass energy in the Asian developing countries [16,21], the biomass energy potential of Myanmar was estimated as follows:
(a) Residues of the agricultural crops
(b) Wood residues
(c) Livestock and poultry
where EPresidue and EPLP are the energy potential of residue and energy potential of livestock and poultry (Mega Joule per kilogram (MJ/kg)) respectively;
- APcrop is the annual production of crop (kilo tons);
- RPR is the residue-to-product ratio;
- LHV are the lower heating of the residue/manure (MJ/kg or Megajoule per cubic meter (MJ/m3));
- MPV is main produced volume (Million cubic meter (Mm3));
- APHead is annual production of heads of livestock or poultry (million heads);
- DMPF is a daily manure production factor (kg/animal);
- DMF is a dry matter factor of manure (%);
- MBYF is the mean biogas yield factor (m3/kg dry matter). 365 days are considered in a year.
3. Results and Discussion
3.1. Biomass Sources in Myanmar
In Myanmar, around 50% of the land is still covered by forest [8]. Closed forest has an area of over 13 million hectares (19.87%) while open forest has over 18 million hectares (27.09%). Natural forests produced about 14.06 million cubic tons of wood fuel during 1999–2000 [5]. Almost 6 million ha (8.29%) of the total land area is still available for biofuel crops [8]. Having an abundance of forest resources and agriculture, it is observed that the biomass sources in Myanmar [20] include sugarcane, maize, cassava, sorghum, sweet sorghum, potato, toddy palm, nipa palm, root crops, palm oil, rapeseed, jatropha, coconut, niger, neem seed, cotton seed, soy bean, sesame, peanuts, rice husk, sawdust, other wastes of forest products, agricultural wastes, urban wastes, and livestock wastes. The types, quantity and energy contribution of bioenergy sources in Myanmar are shown in Table 6.
3.2. Biomass Energy Utilization in Myanmar
In Myanmar, biomass energy contributes more than 50% of the total energy consumption. Fuelwood is the major biomass energy source in Myanmar. It is used for cooking and heating by 93% of the households in rural areas [43]. Biogas, bio-ethanol, straight vegetable oil, bio-diesel and producer gas from biomass gasification have not played a significant role in the energy sector yet [43]. The total quantity of biomass consumption in the rural area of Myanmar accounts for 8.85 tons per household per annum (Table 7). Biomass consumption in the rural area is much larger than in the urban area. Traditional biomass consumption in Myanmar is mostly conducted by fire-stoves.
Nowadays, the developing countries have access to several applicable technologies related to biomass energy utilization from the developed countries. These technologies include direct combustion and cofiring of biomass products for heat and electricity, anaerobic digestion of animal wastes for methane-rich gas, pyrolysis of biomass products for bio-char, gas, and oil and gasification of agricultural waste such as rice husk and others, wood chips, sawdust, forest residues, product waste, etc [33]. Therefore, being an agriculture-based country with 48% of forest cover, Myanmar could take advantage of biomass sources for energy self-sufficiency through the developed technologies. Although some technologies are costly, locally accessible technologies could be created. As an example, rice husks disposed from rice mills as well as rice starw can be utilized as fuel for combustion of biomass in order to generate steam for heat and power. Regarding a private micro-grid business model with rise husk gasification in Myanmar [49], gasifier plants are most suitable to be built near rice mills to easily utilize the rice husk fuel disposed from the rice mills. Meanwhile, the electricity generated from the gasifier plants could power the operation of rice mills partly or entirely again. Additionally, such generated electricity can also power the village for lighting as well as for small and medium-sized enterprises (SMEs), depending on the availability of rice husks and the capacity of gasifier plants. One of the main hurdles for using rice harvest residues as biomass is the necessity of a pre-treatment process prior to the use of the feedstock.
Currently, the various types of the fuel alternatives and the biomass feeding rates by Kaung Kyaw Say (KKS) Gasifiers in Myanmar [50] are described respectively as follows: 1 kilogram per kilowatt-hour (kg per kWh) for wood chips, tree branches, elephant grass and pigeon stalk; 1.2 kg per kWh for core of palm oil fruit; 1.4 kg per kWh for groundnut shell; 1.6 kg per kWh for rice husk.
Table 8 shows the biomass energy utilization around Myanmar. Myanmar government have invested efforts in the research and development of rice husk gasification technologies [5,34]. There had been a total of over 1000 biomass gasification plants built in all states and regions by 2010. Besides, a 1000-kilowatt (kW) biomass gasification power plant was operated in one of the biggest rice mills in Myanmar in 2014 [51]. It consisted of one-unit 1000 kW rice husk circulating fluidized bed gasifier and 2-unit 500 kW biomass gas gensets. The major fuel sources for gasification in Myanmar account for rice husk and wood chips. Other sources for gasification might include sawdust, wastes of forest products, agricultural wastes, and urban wastes.
Biogas production from manure of livestock and poultry has also implemented in Myanmar. Currently, there are two types of biogas plants operating around Myanmar—biogas plant with a movable gasholder, and biogas plant with built-in, fixed dome gasholder [5]. Typically, a village with 100 cows could run a 50 m3 fixed dome type biogas plant for lighting 300 homes [5]. The biogas is mostly used for lighting, cooking and heating in Myanmar. Besides, the effluent slurry from biogas production can be used as organic fertilizers for agriculture purposes. In Myanmar, the total installed capacity of biomass energy in 2013 accounted for approximately 115 MW [52]. Myanmar has the total biomass energy capacity potential of around 11,640 MW [53].
Table 9 presents the energy balance of Myanmar, based on the available energy sources during the year 2014–2016. The total net energy supply amounted to 15,696 kilo tons of oil equivalent (ktoe) per year in 2014–2015 and 15,538 ktoe per year in 2015–2016. The net energy supply available from biomass in the country accounted for approximately 9,036 ktoe. Out of them, fuelwood contribued 94.68%, followed by bagasse (3.57%), charcoal (1.74%) and biogas (0.01%). The share of the biomass energy to the final energy consumption had approximately 58%.
3.3. Energy Potential from Biomass Sources
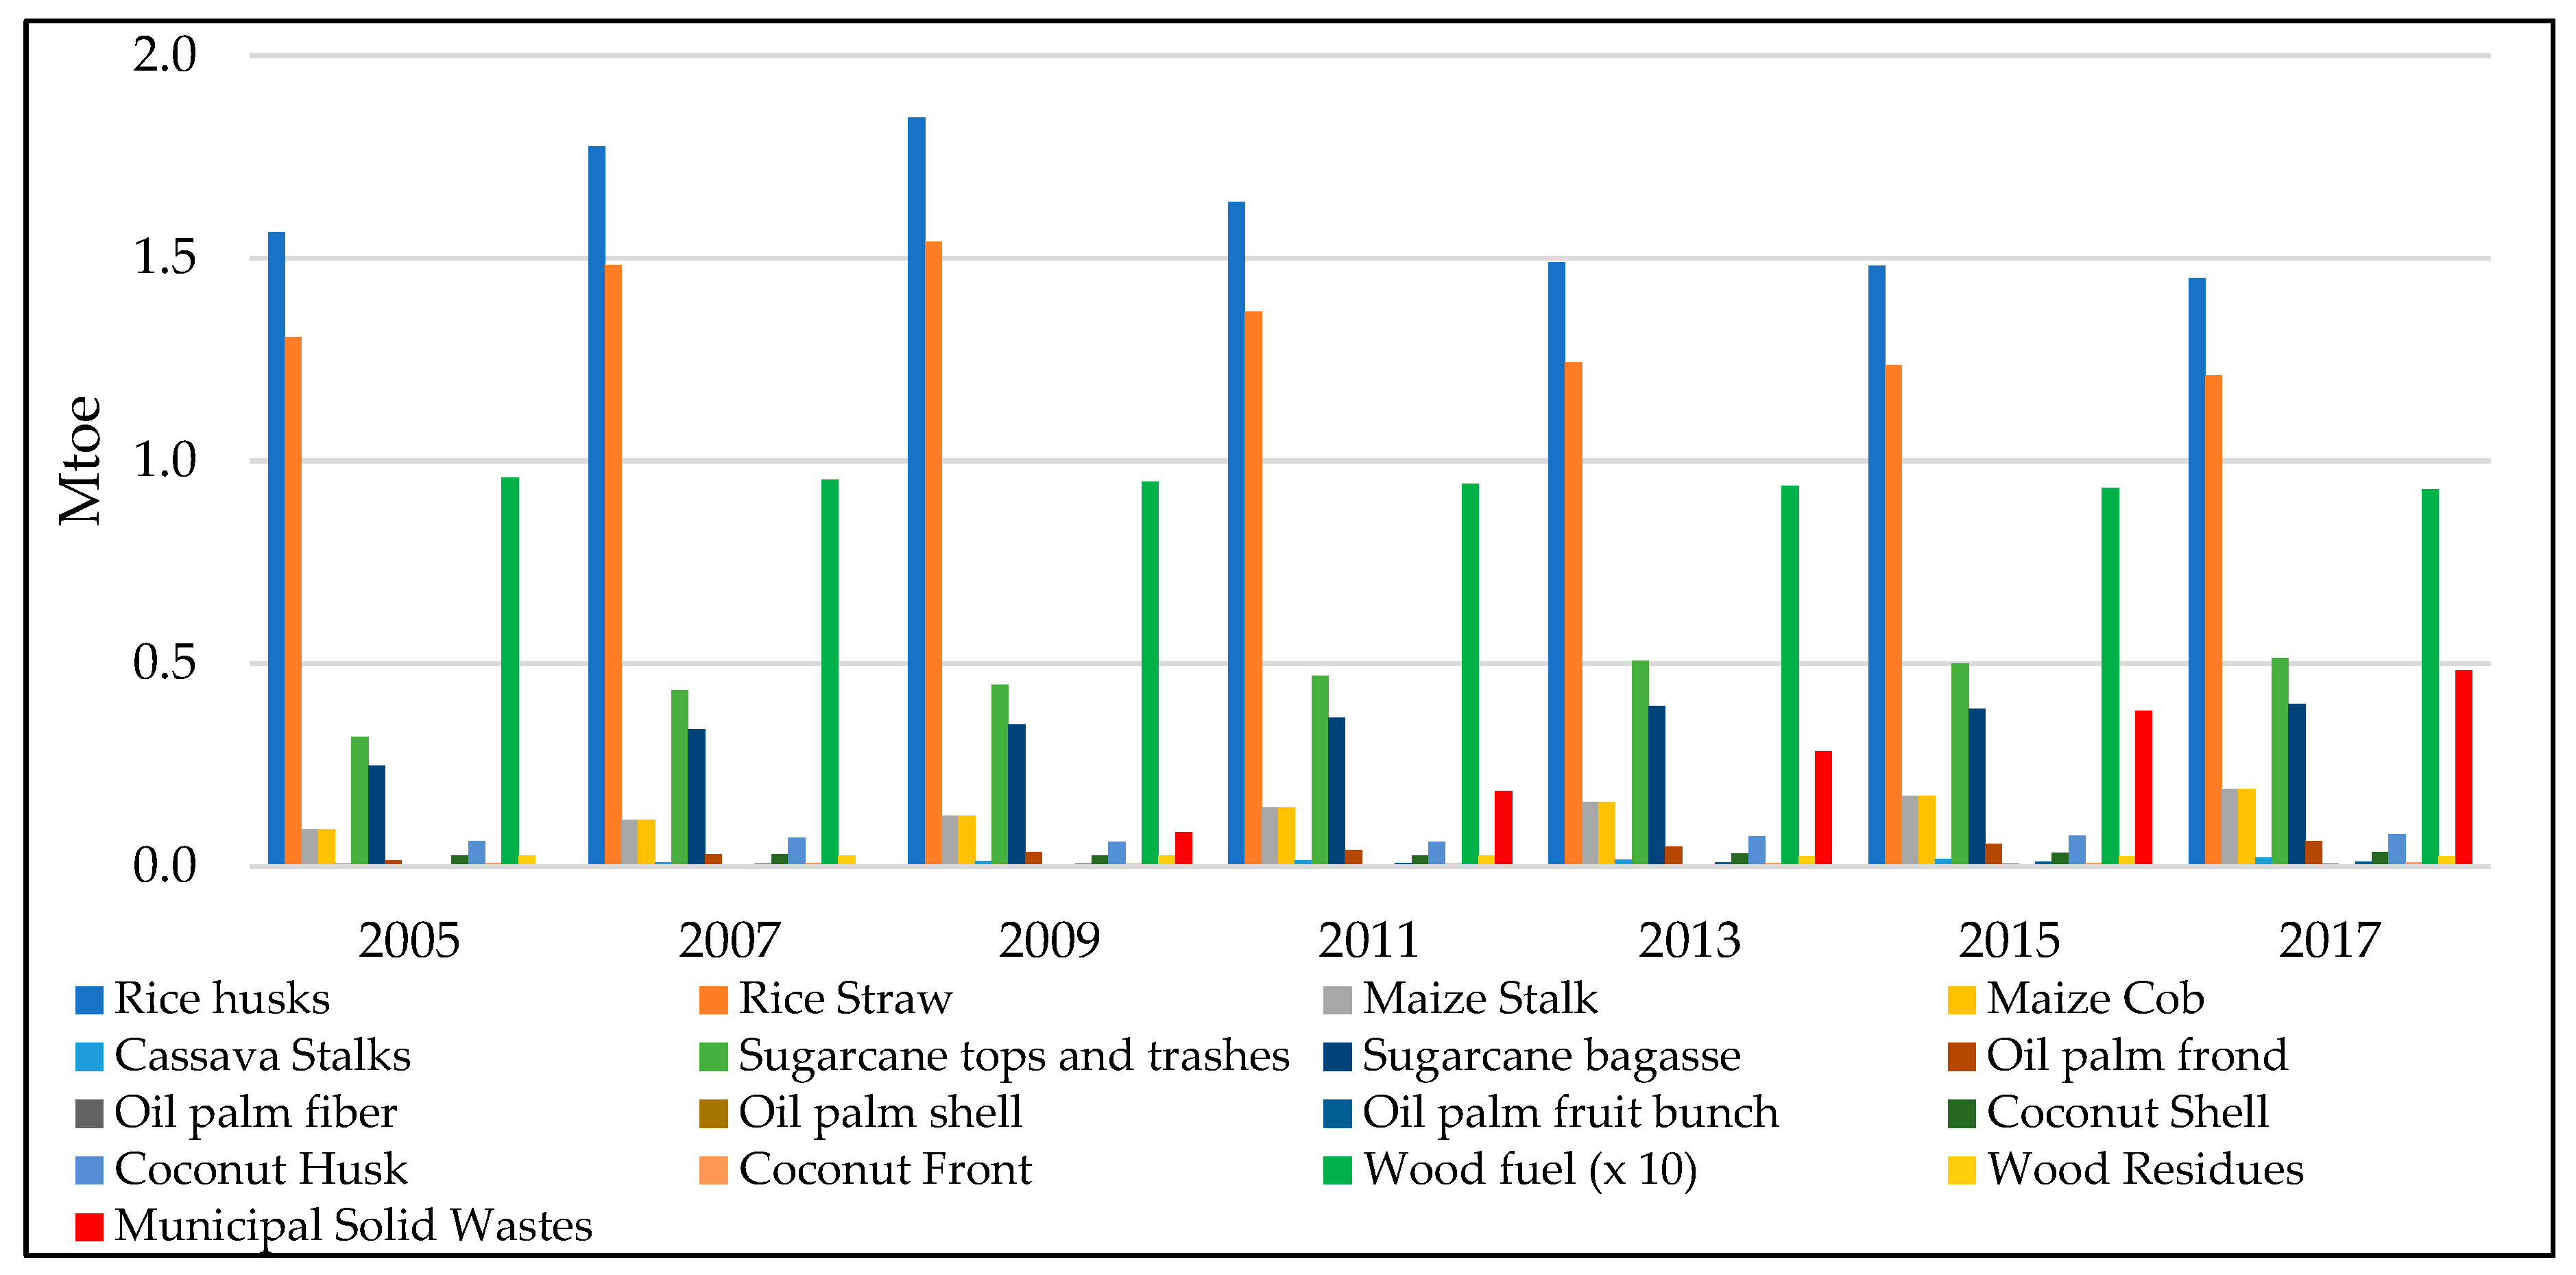
Figure 5 presents the biomass energy potential from the agricultural sector, forest sector and municipal sector. It was observed that the total quantity of biomass energy potential from the agriculture residues had increased gradually from 1.8 Mtoe in 2005 to 3.3 Mtoe in 2017. Meanwhile, with rapid urbanization and increasing population, the biomass energy potential from the municipal sector had grew from 0.1 Mtoe in 2011 to 0.5 Mtoe in 2017. However, the biomass energy potential from the forest sector in 2005 was decreased by 3% in 2017, due to the planned fuelwood supply as per National Forestry Master Plan (2002–2030).
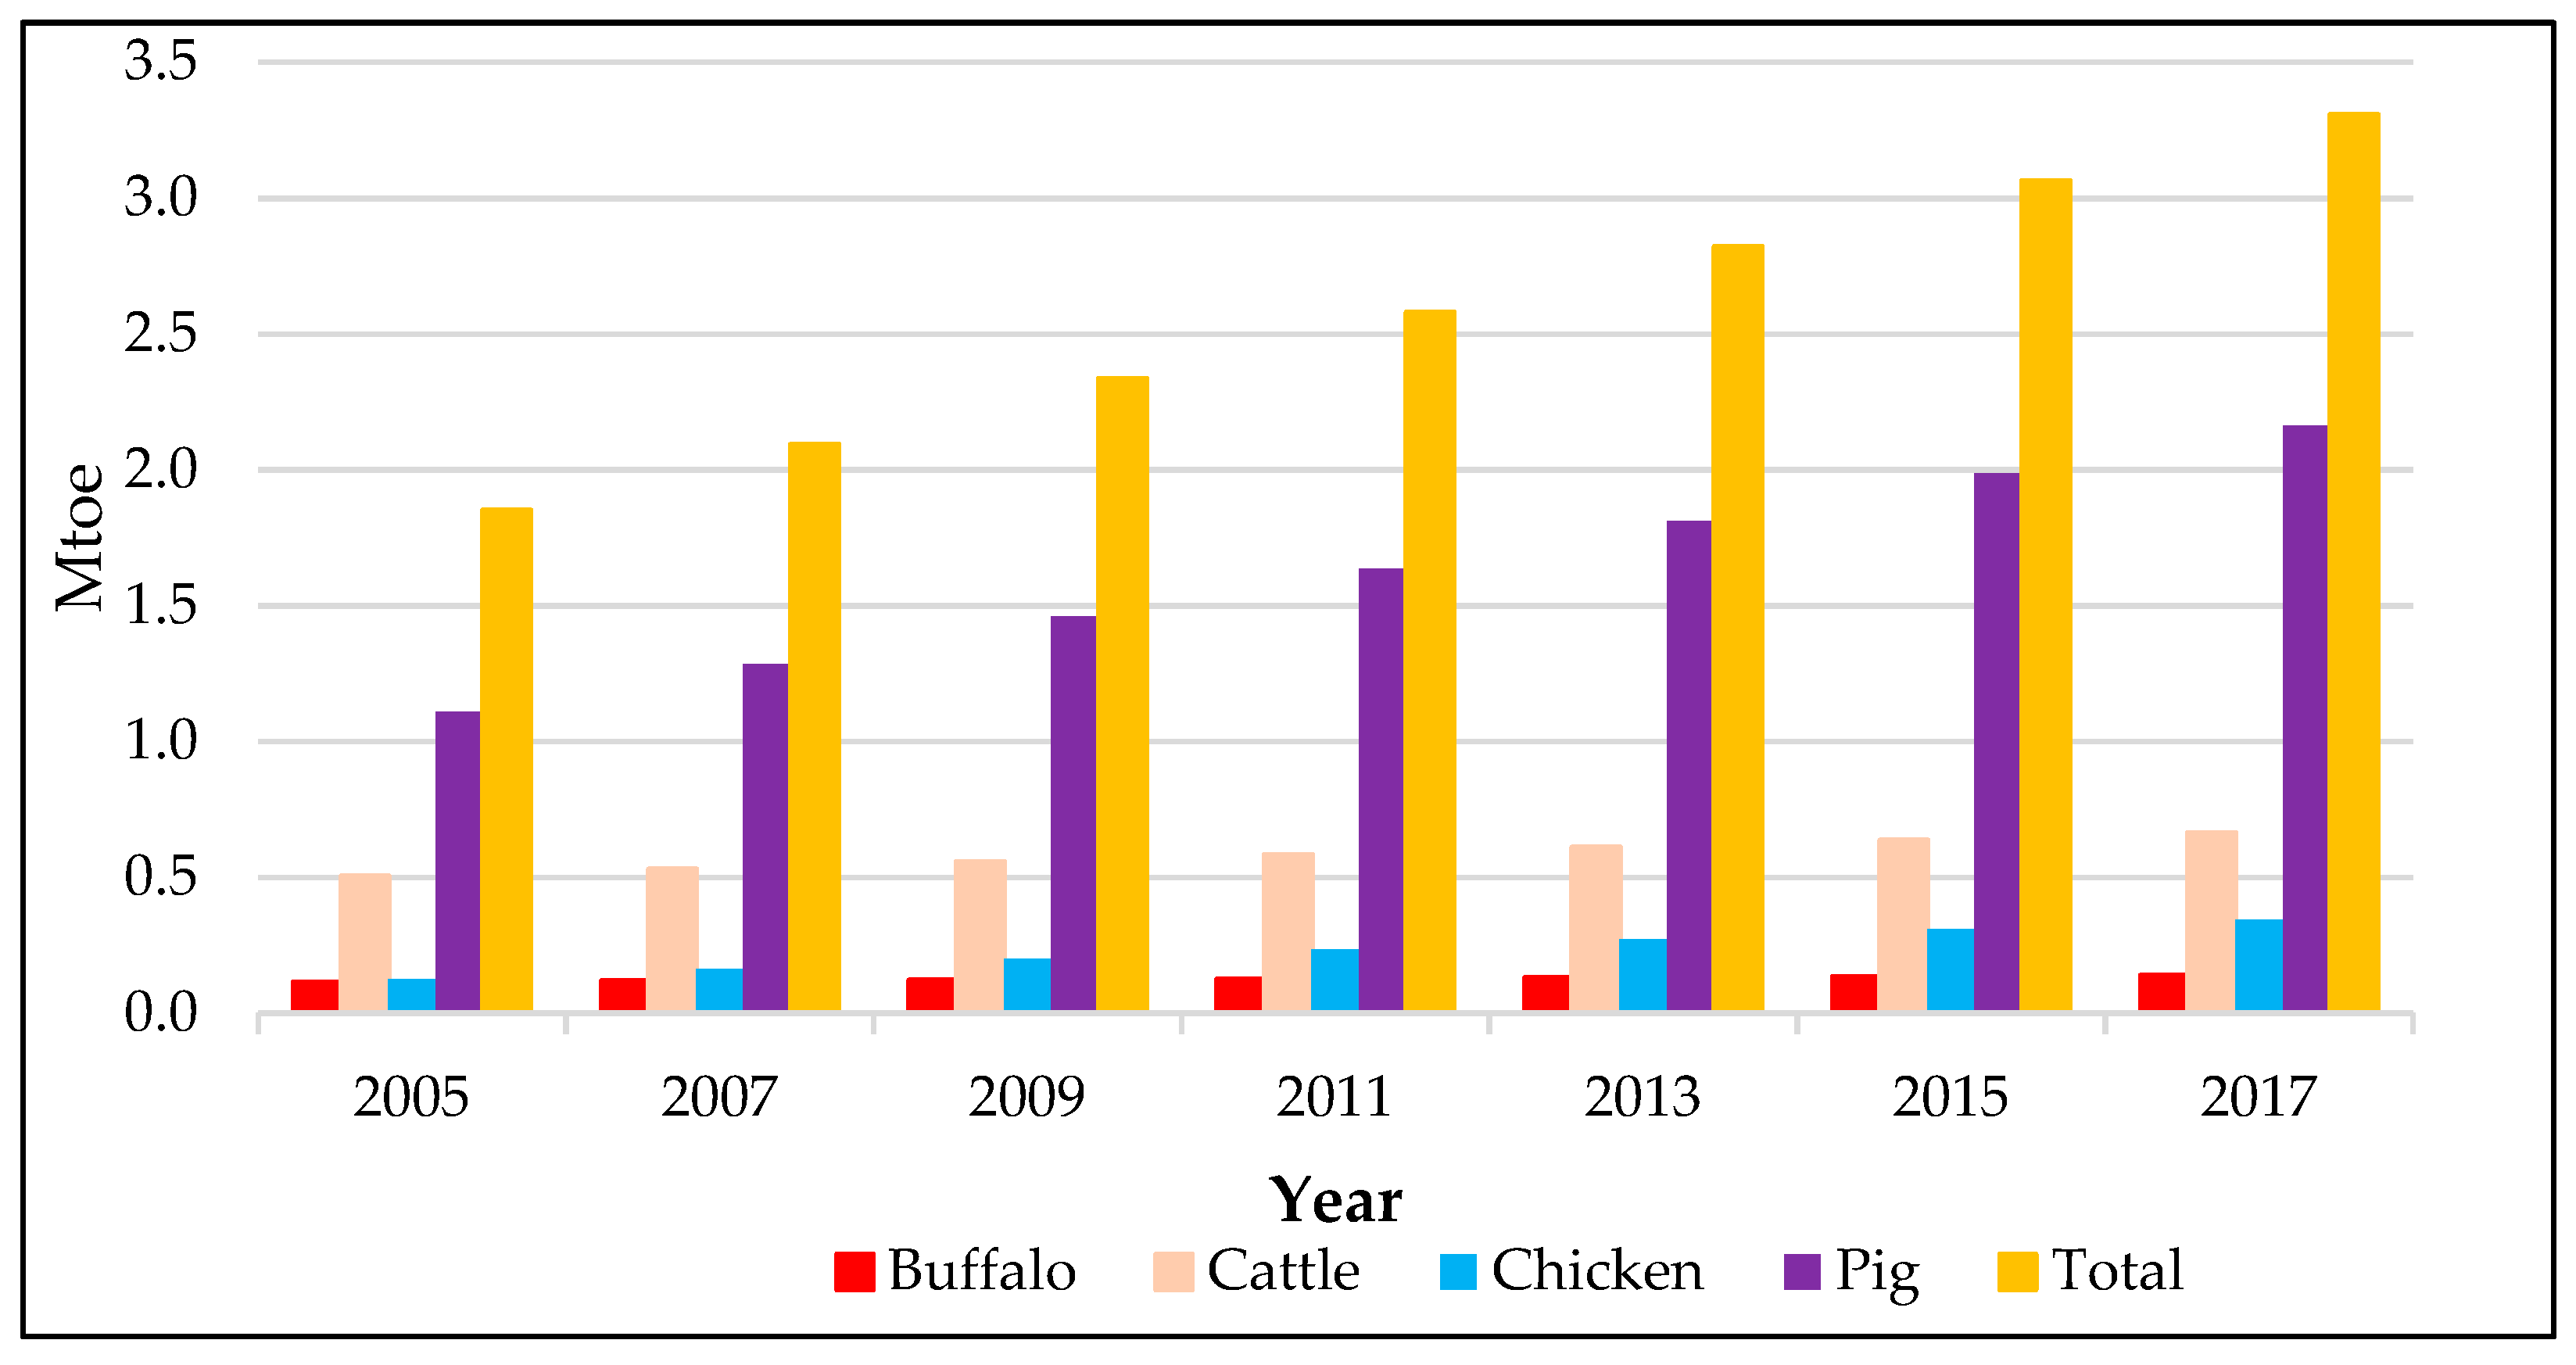
Figure 6 shows the biomass energy potential from the livestock and poultry sector. Although Myanmar is planning to shift from traditional agriculture economy to industrialized agriculture economy, the former is still being conducted in several parts of the country. Besides, poultry farming also remains common around the country. It was estimated that the total biomass energy potential from the livestock and poultry sector amounted to approximately 1.85 Mtoe in 2005 and 3.3 Mtoe in 2017, respectively.
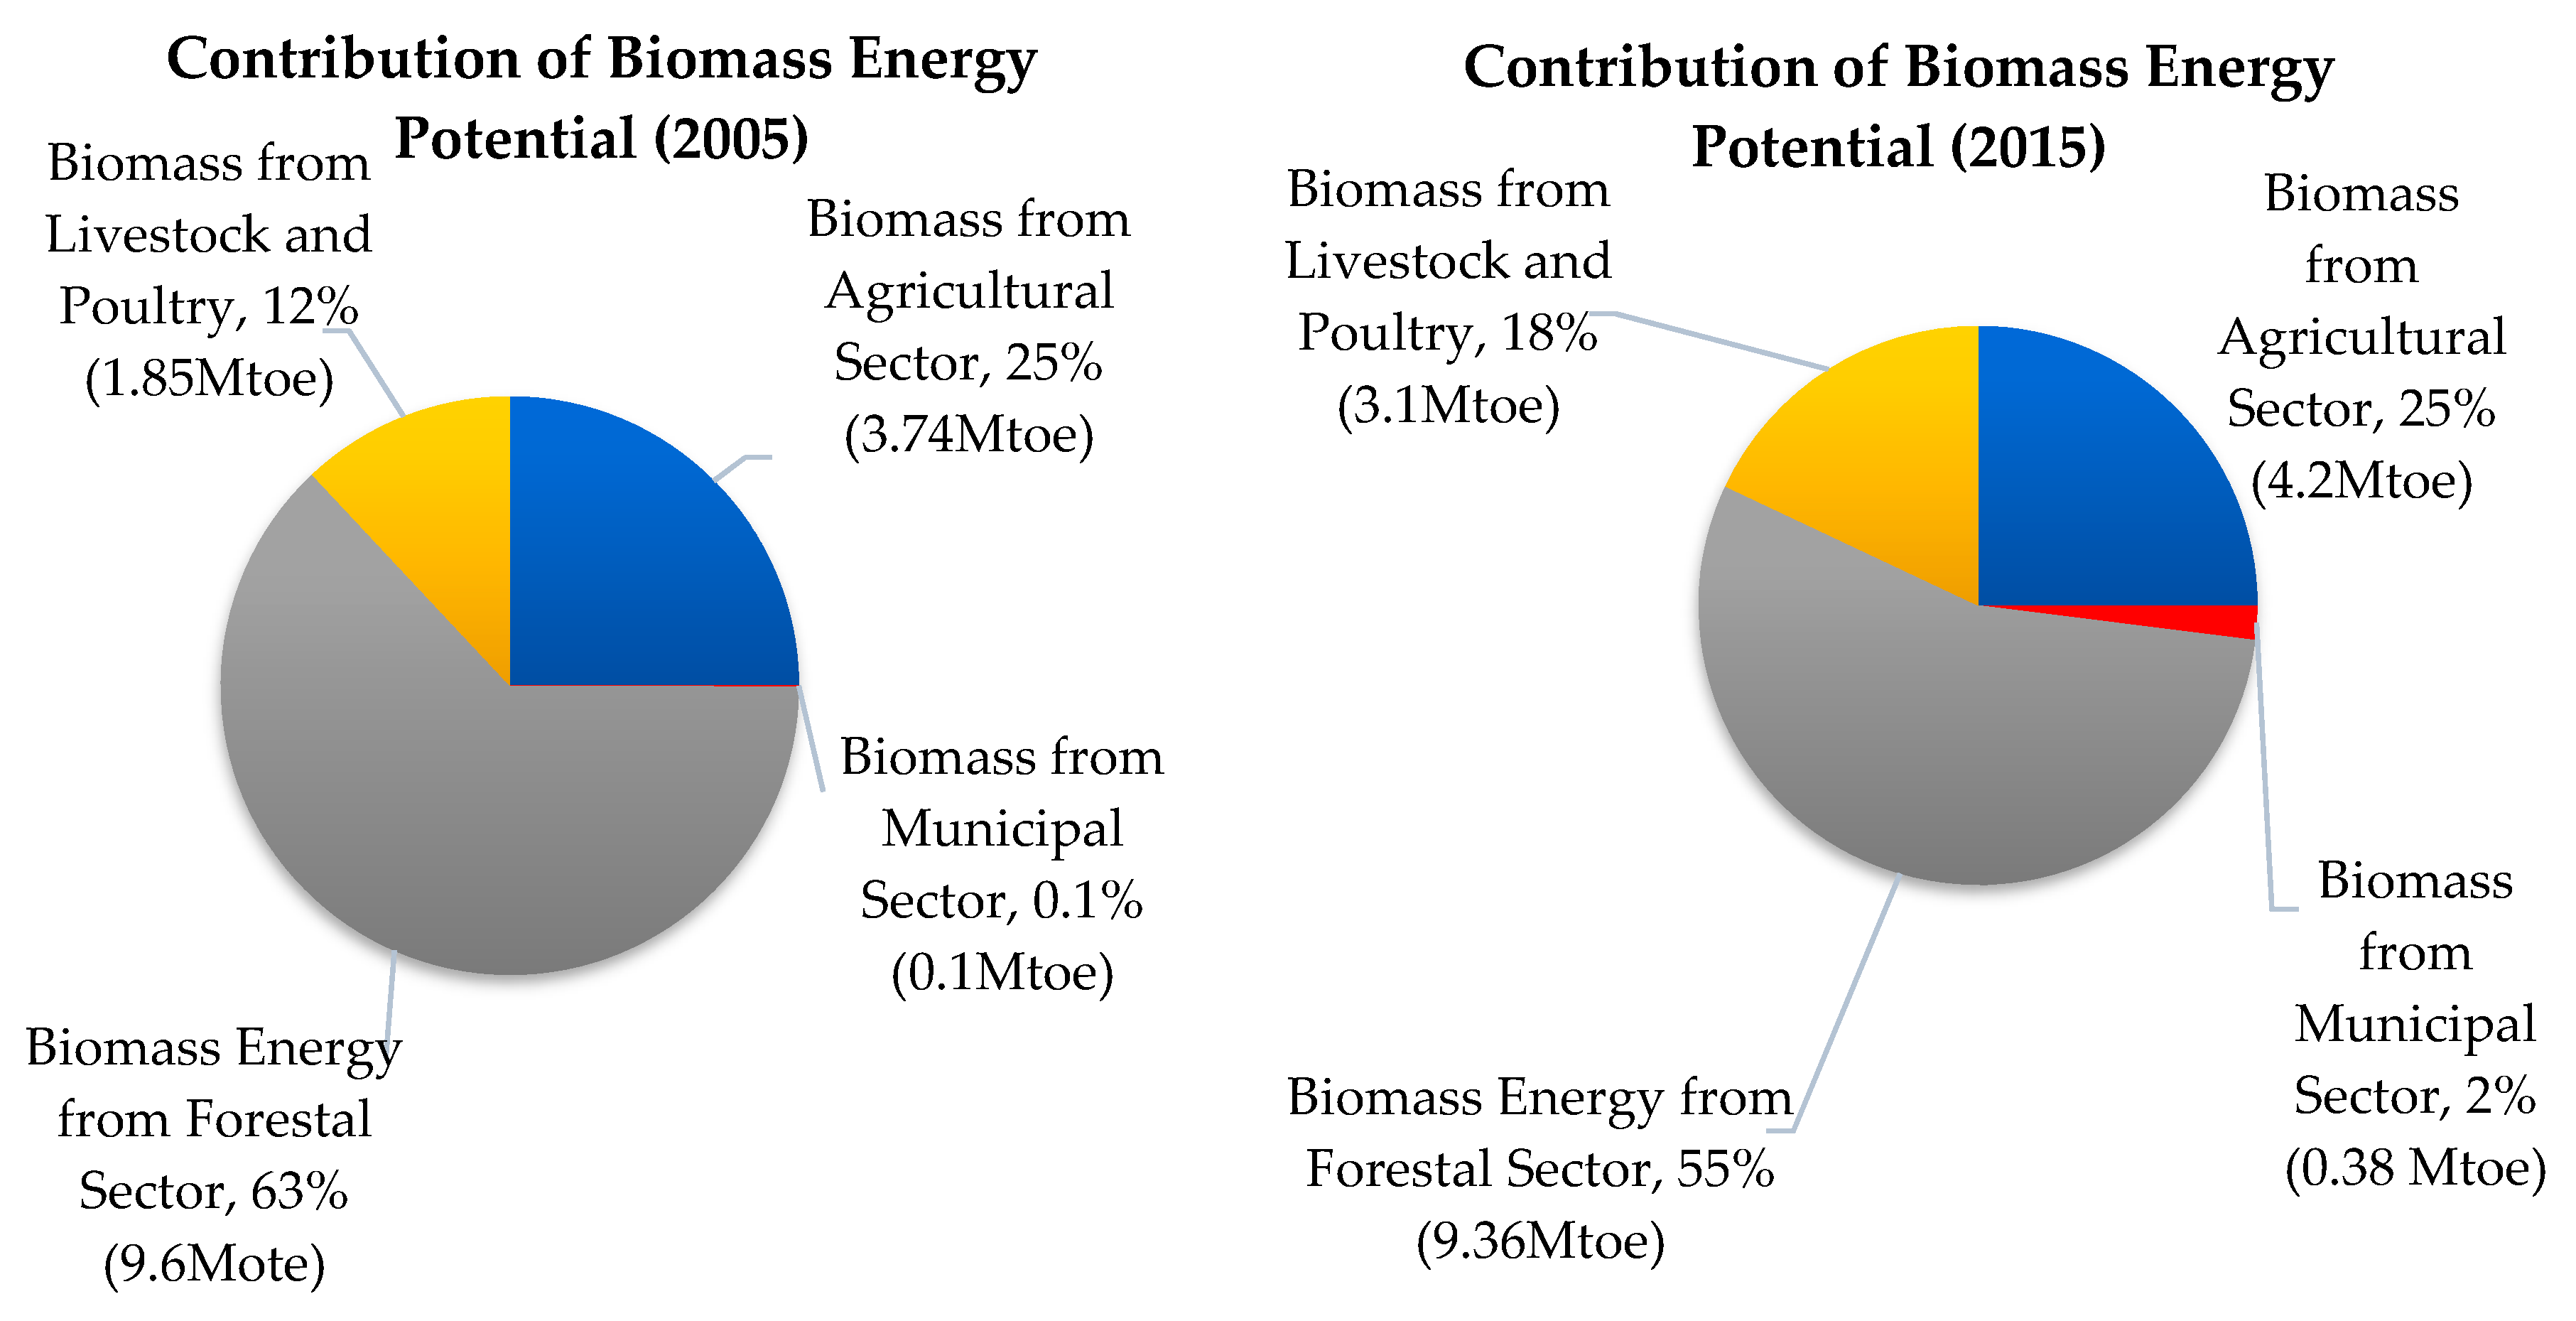
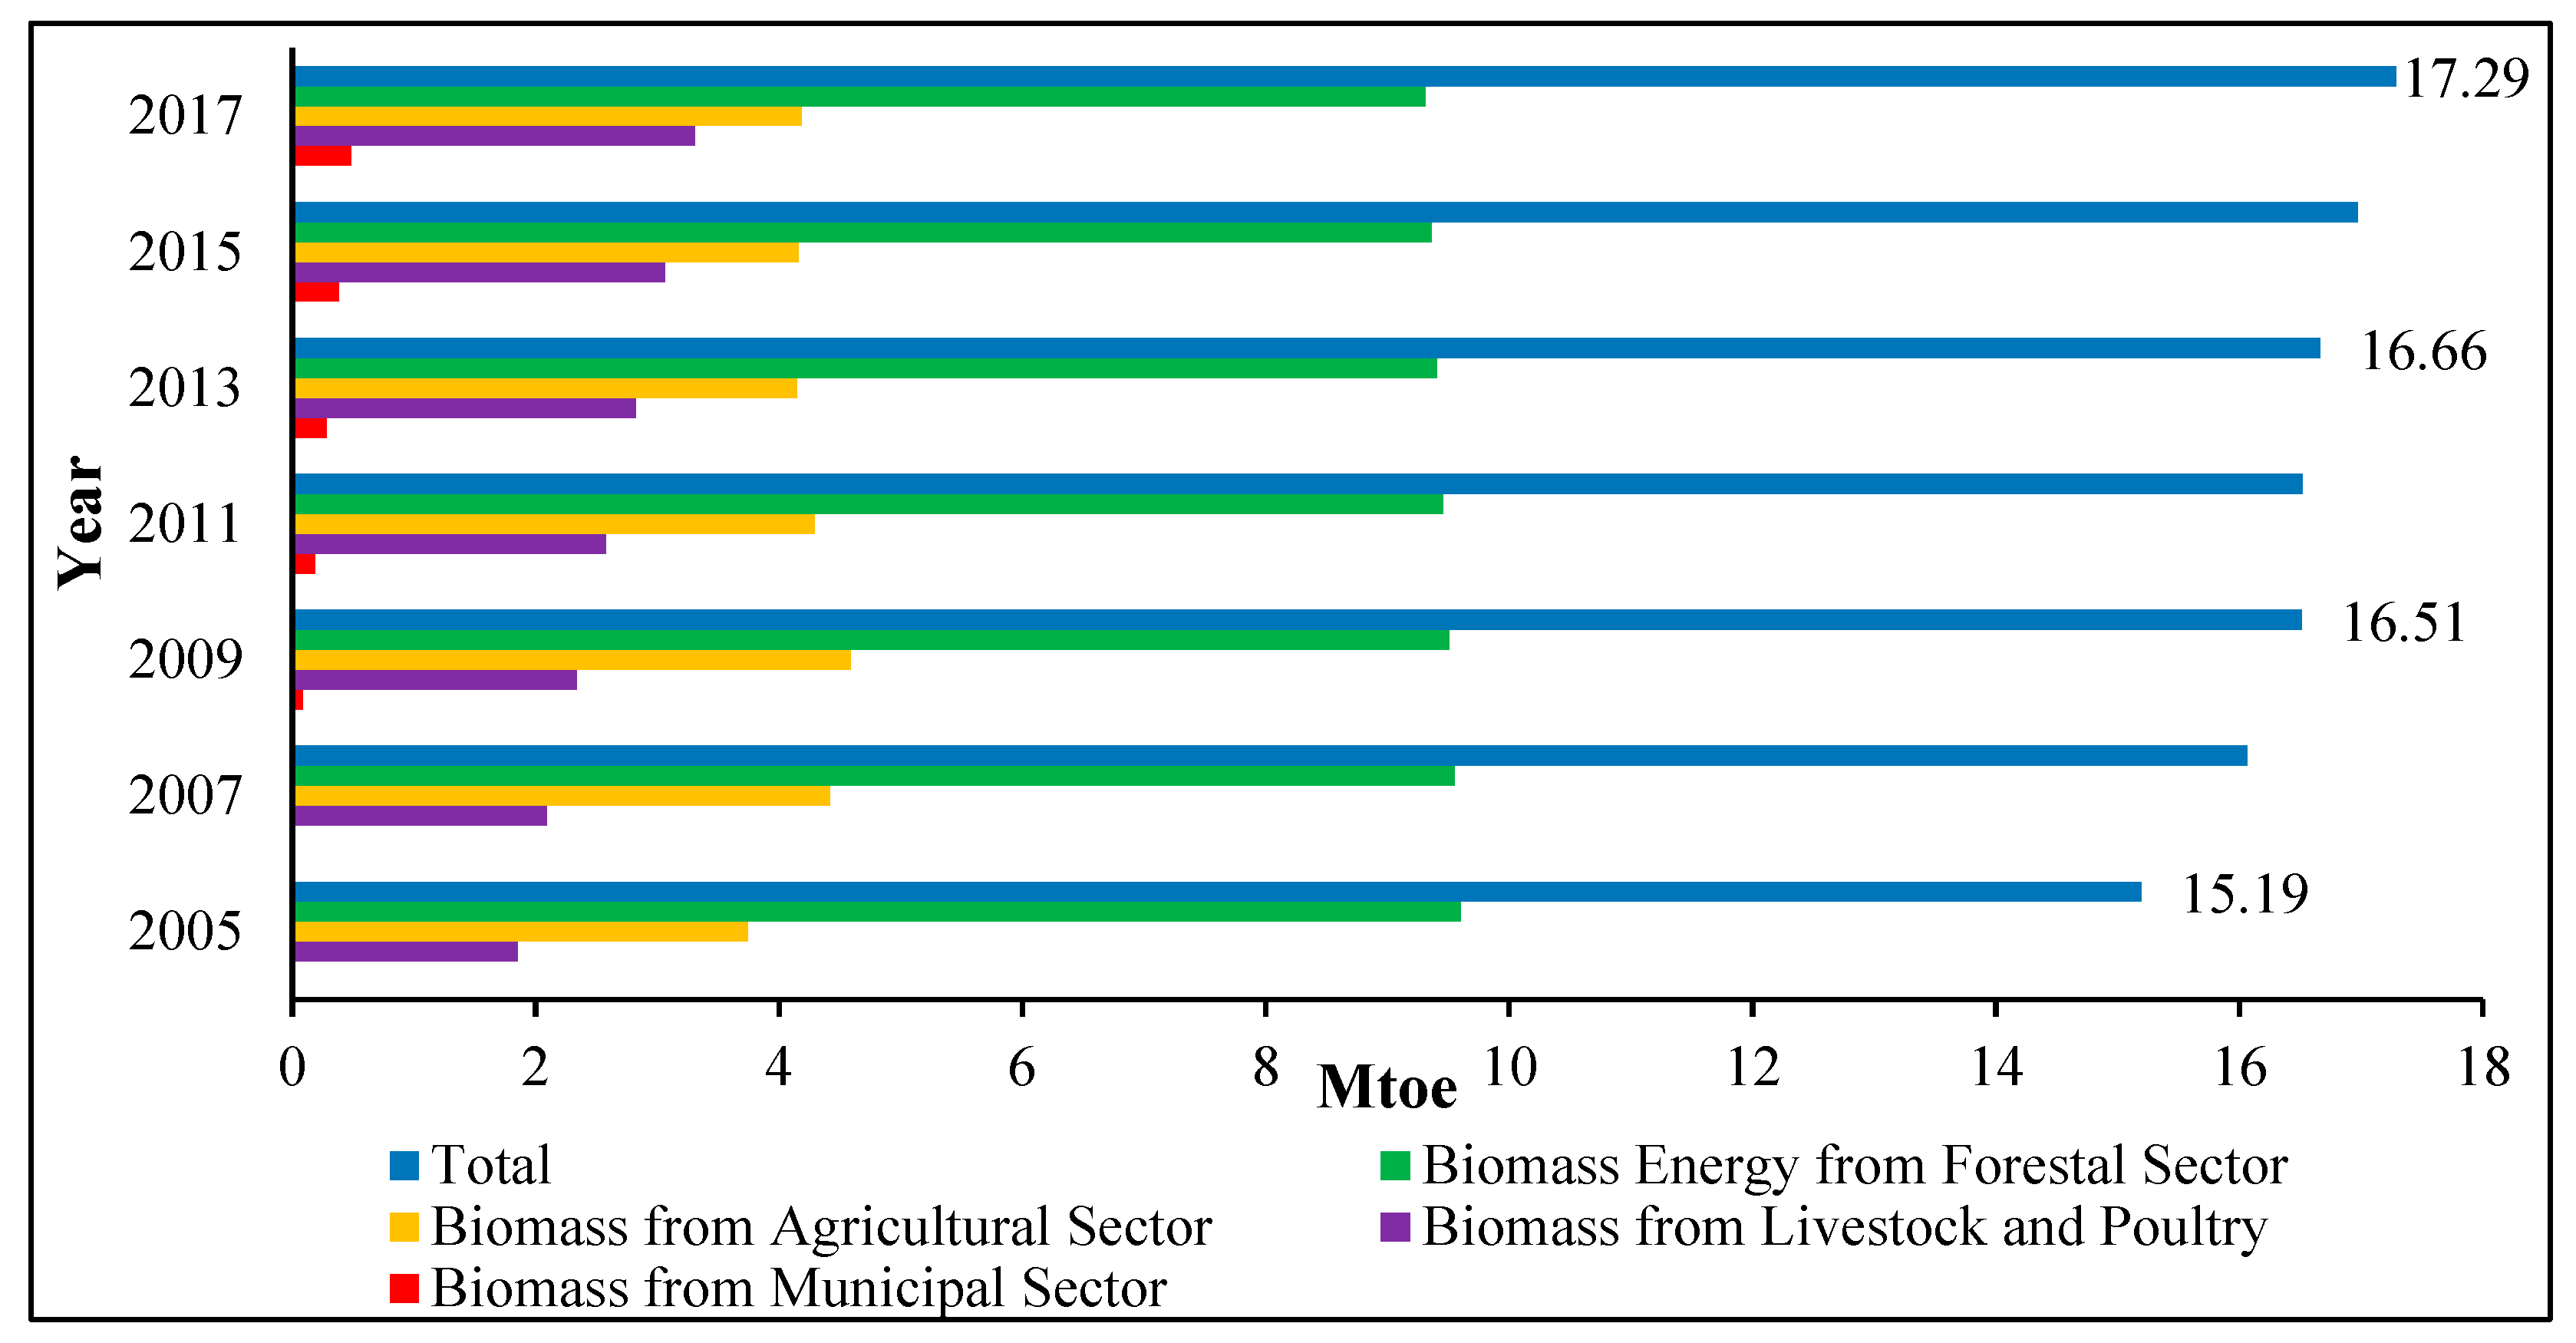
Figure 7 shows the contribution of biomass energy potential from the different sectors in Myanmar in 2005 and 2015. It was found that the majority of the total biomass energy potential in 2005 came from the forest sector, with 63% of the total. However, its contribution decreased slightly to 55% in 2015, due to a forest conservation program of the country. The second most biomass energy contribution came from the agricultural sector, with 25% of the total during 2005–2015, respectively. The total biomass energy potential in Myanmar was estimated at 15.19 Mtoe in 2005 and 17.29 Mtoe in 2017 respectively (Figure 8).
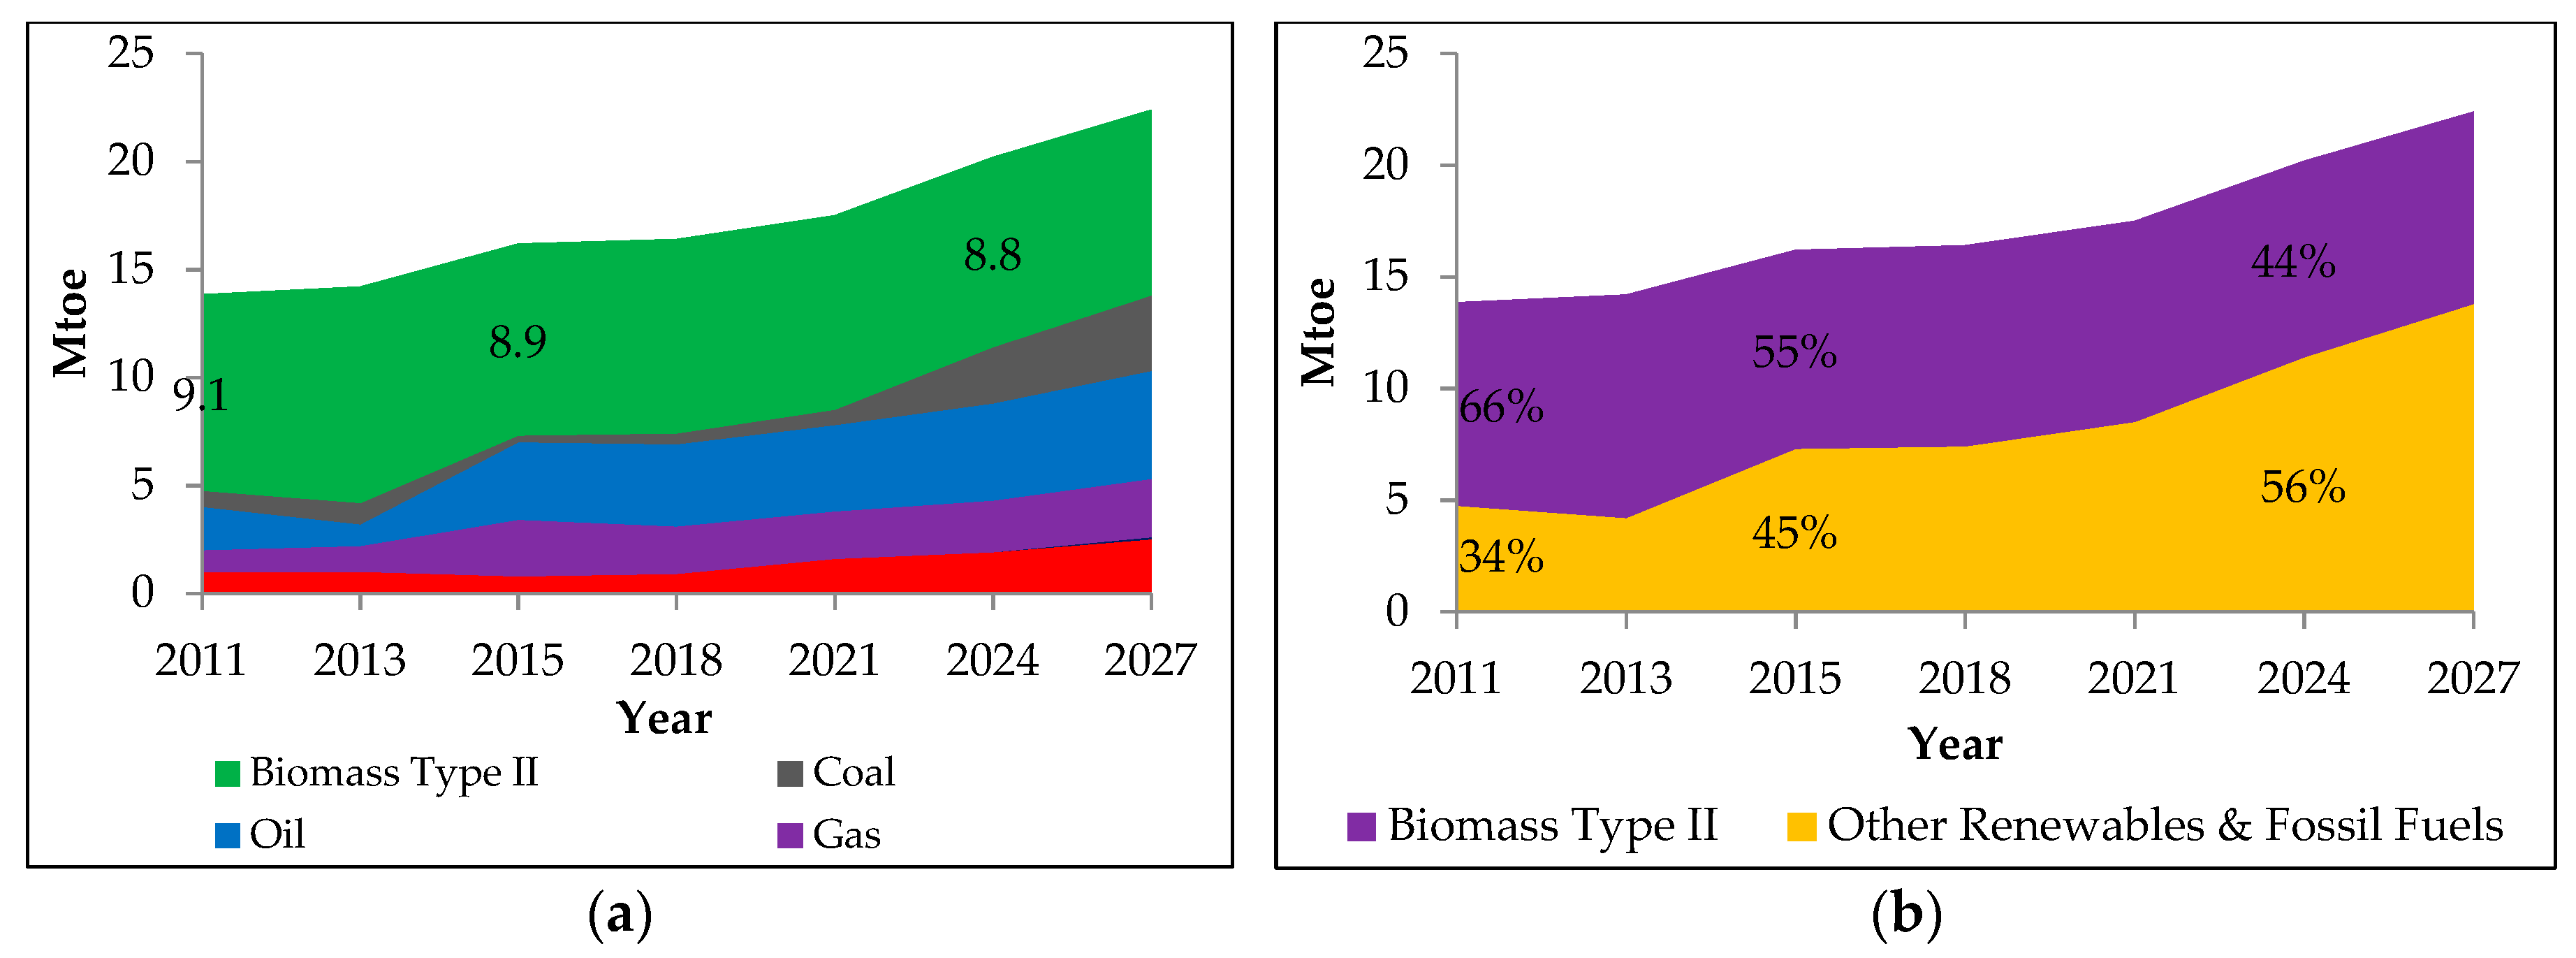
According to Myanmar Energy Master Plan [10], as shown in Figure 9a, the total projected energy supply from the energy sources in Myanmar had around 16 Mtoe in 2015 and 22 Mtoe in 2027, respectively. Out of this, the major energy supply might come from biomass type II (fuelwood) (Figure 9b). However, due to deforestation and a strategic program to reduce the consumption of fuelwood and to promote the utilization of alternative energy sources by 2030, there might be a slight decrease in the biomass energy supply to the total projected energy since 2011. As a result, the contribution of the biomass energy to the total projected energy supply might decrease from approximately 55% in 2015 to 44% in 2024 (Figure 9b).
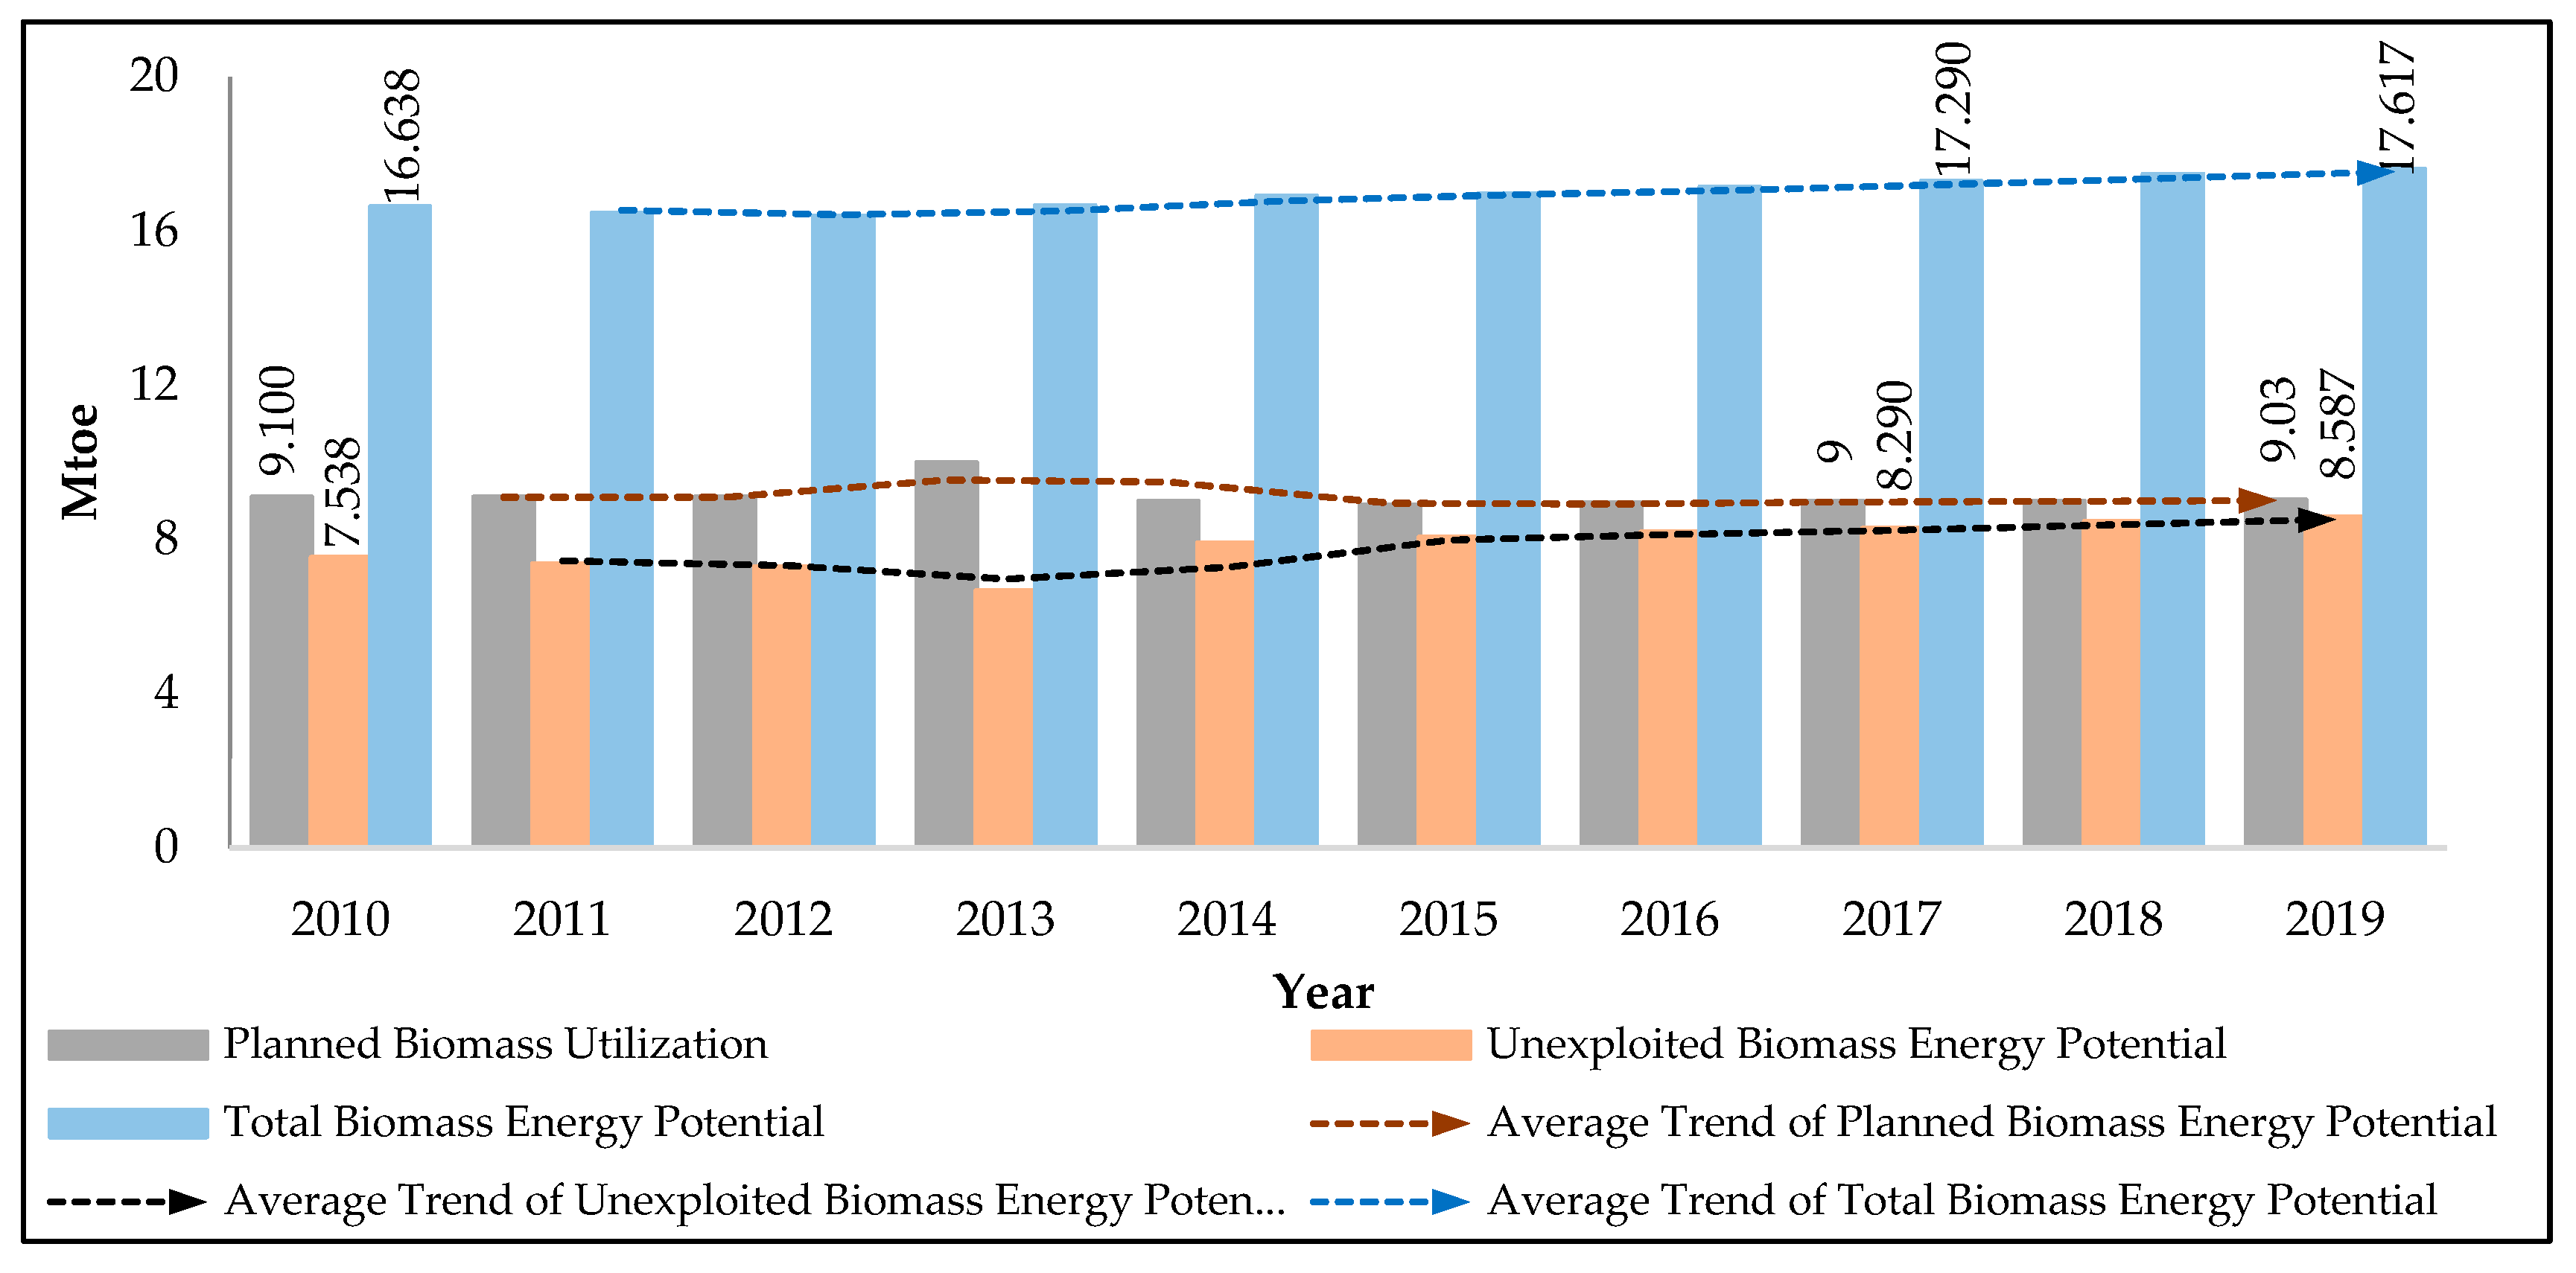
Figure 10 illustrates the comparison of the biomass energy utilization projected by Myanmar Energy Master Plan and the total biomass energy potential of Myanmar from this study. Out of all the available biomass sources in Myanmar, Myanmar Energy Master Plan considered only biomass type II (fuelwood) for the energy supply projection of the country. That was due to the likelihood of the sufficient uncertainty of the energy contribution from other biomass sources. It was observed that the share of biomass energy from biomass type II (fuelwood) to the total biomass energy potential might account for approximately 50% during 2010–2015 (Figure 10). As a result, the quantity of the unexploited biomass energy potential out of the total energy potential was estimated to be approximately equal to that of the planned biomass energy utilization during 2018–2019. Additionally, according to the past and current average trends of biomass energy potential in Myanmar, the total biomass energy potential will probably grow slightly after 2018–2019 due to the likelihood of increased biomass production from agriculture sector, livestock and poultry sector and municipal sector, despite a slide decrease in biomass sources from forest sector. However, climate changes, land availability and applied technologies could also have a huge impact on the estimation of total biomass energy potential, considering all the factors from plantation and harvesting to valorization and conversation of the biomass sources into energy [33].
4. Challenges and Possible Solutions to the Development of Biomass Energy
As Myanmar is an agriculture-based country with an abundance of forest resources, Myanmar has possibilities of land use and sustainable biomass production. Additionally, the major biomass sources could be collected from the residues of agricultural crops and forest sector. Moreover, about 6 million hectares of the total land area of Myanmar is still available for growing biomass energy crops. Biomass energy potential from livestock and poultry could be boosted in line with the development of agricultural sector. Similarly, biomass energy sources from the municipal sector might also be increasing along with growing population in urban areas.
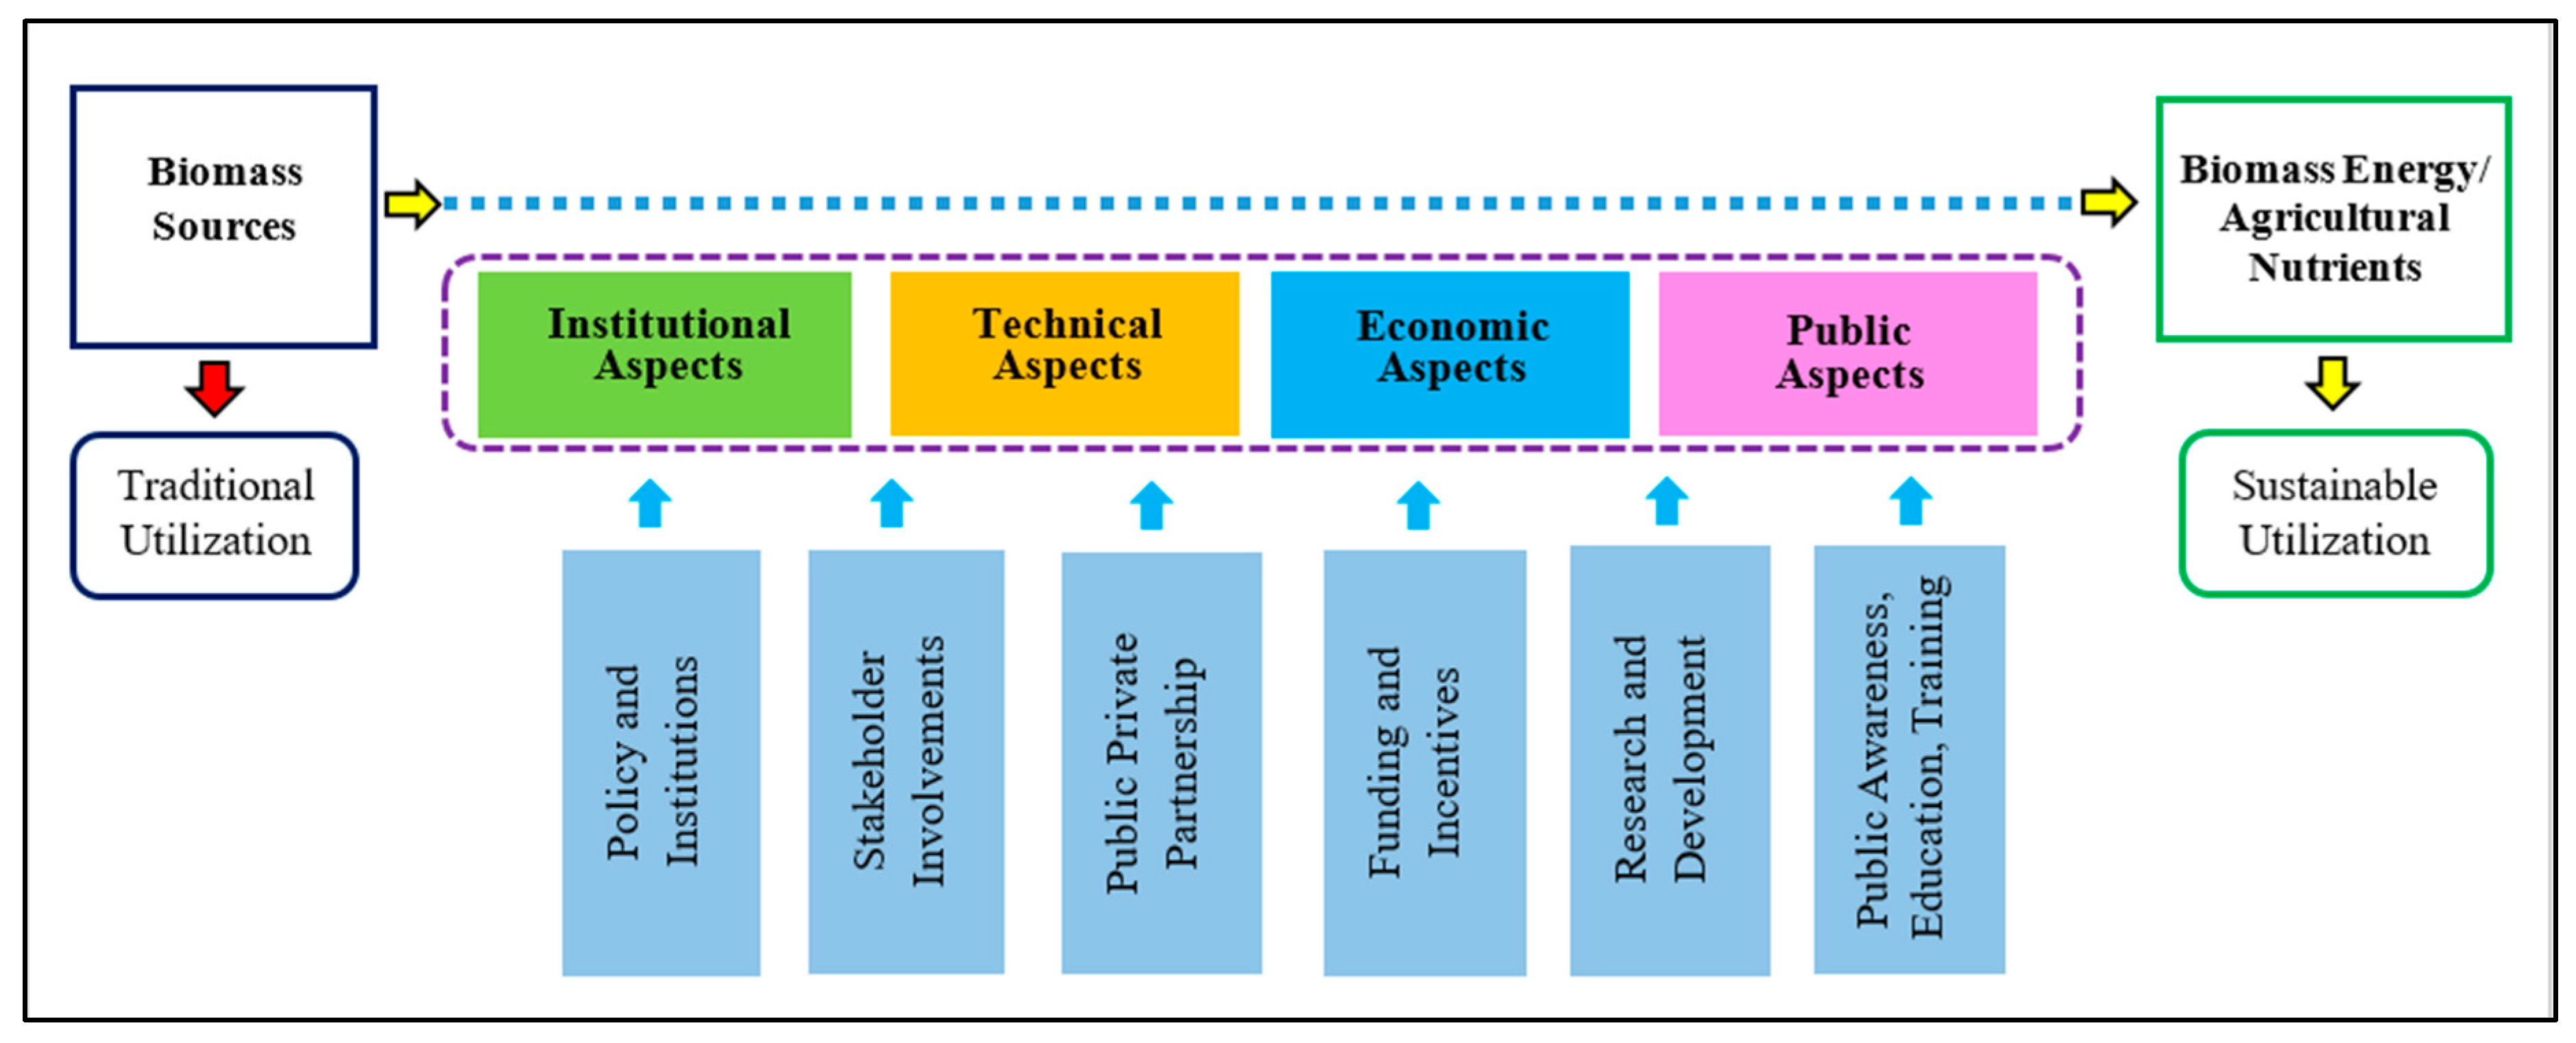
Currently, Myanmar majorly use traditional practices in consuming the biomass sources such as traditional consumption for heating and cooking, traditional agriculture nutrients, open burning, open disposal, animal feeds, etc. On the other hand, although the efforts and initiatives of the government sector have been made to promote the development of biomass energy in Myanmar, there are still some constraints and barriers that biomass energy utilization could not be easily achievable. The major constraints and barriers for the development of biomass energy sector might come from the four major aspects; institutional aspects, technical aspects, economic aspects, and public aspects (Figure 11), which could be potentially overcome through the possible solutions (policy and institutions, all stakeholder involvements, public private partnership, research and development, funding and incentives, and public awareness, education and trainings), as stated by [33]. The four major aspects and recommendations are highlighted as follows:
4.1. Institutional Aspects
There exist several Myanmar Ministries with the different roles, functions and responsibilities, related to the renewable and non-renewable energy sector. These ministries such as Ministry of Energy, Ministry of Education, Ministry of Industry, Ministry of Environmental Conservation and Forestry, and Ministry of Livestock, Fisheries and Rural Development, have focused on the energy sources and utilization under their different roles and functions. Different ministries have different research projects and research plans on the same energy sources. They have mostly worked separately on the same trend of research and development. As energy is an agenda-based policy, which could not be handled by single Minister [58], if the ministries could work closely and harmonically on the same goals from different aspects, they could face the challenges and solve the barriers together. Meanwhile, all the outcomes of the cooperation work would be more profitable. So far, the government has not specified biofuel targets and a road map for realizing them [21]. Therefore, the government will need supportive policies favorable for all the stakeholders in biofuel value chains [20].
4.2. Technical Aspects
Technical barriers were resulted from the lack of standards on bioenergy systems and equipment, especially where the energy sources are so diverse [58]. Biomass technologies are still in emerging stage in Myanmar. Despite the research findings for the rural development of some areas by several non-governmental organizations, only limited research and development have been made on the biomass energy utilization for local communities. Insufficient and inaccurate data collection and information about biomass energy sources could make energy planners and project developers completely hard to implement the sustainable development of biomass energy sector in Myanmar. Although the local research institutions and universities could predominantly carry out the research and development of biomass energy, most research institutions and universities are hardly gaining specific research grants by the ministries or the government annually. Therefore, the concerned ministries will need to take a strong cooperation with the local research institutions to create and innovate the green technologies (in some cases, locally accessible and affordable technologies) that are well suited to the local conditions. Local technological standards for the different biomass energy sources could be carried out by the cooperation of the ministries, technical consultancy agencies and research institutions. Therefore, if the government or ministries would support reasonable grants or finical aids to the biomass energy research projects, including technical and economic research, the biomass energy sector could be comparatively advanced in the country.
4.3. Economic Aspects
Though large-scale biogas, gasification and pyrolysis technologies are playing a key role in utilization of biomass energy, the investment in them is costly. Especially, the costs come greatly from the capital cost, cost of maintenance and repair, and cost of skilled labours. During the past two decades, about 1200 biogas plants were installed with assistance from various organizations, but still troubled in operation due to high maintenance and repair cost and needs of skilled labours [21]. Therefore, it is also hard to gain the economic benefits from the costly technologies such as large-scale biogas plants, gasification, and pyrolysis in a developing country like Myanmar. Hence, co-firing or combustion of biomass could be more economically sustainable in Myanmar, gaining the experiences from the neighbouring countries such as Thailand.
Unlike the fossil fuels, biomass residues or biofuels are difficult and costly to collect, transport, and store. The annual yields of most biomass residues are also fluctuating. As a result, the economic potential of biomass energy could be comparatively lower than the theoretical biomass energy yields. Therefore, instead of large-scale biomass power plants, small-scale ones could be more suitable for energy production. The hybrid system that applies biomass energy and solar/wind/diesel-engine power could also lead to more reliable full-time energy access to the households in the rural areas throughout the year. As domestic solutions, national banks could enable households and communities to purchase energy equipment through loans and other financing packages [12]. The government will also need to encourage private sector involvement and international cooperation in the sustainable development of the biomass energy sector. Besides, government should support the provision of capital subsidies to the processing industries, subsidized interest rates to set up the biofuel plant, and tax concession for biodiesel producers [59].
4.4. Public Aspects
Currently, biomass energy markets and technologies in Myanmar are still emerging. It is also difficult to see the economic profits from them. As a result, people are slightly interested in the applied biomass energy, and public demand in biomass energy remains low. Therefore, public awareness and public participation are a must to promote the market development of biomass energy in Myanmar.
In Myanmar, the majority of households in rural areas are still consuming biomass sources traditionally. They could be informed about what are the benefits and drawbacks of traditional biomass consumption, through education and training. Since the actual on-going demand of biomass energy sources lies majorly within local people, governments should support subsidies to the rural people for building a hybrid system for power generation from biomass energy and other renewable or non-renewable energy. As a benefit, the power generation system could boost the economy of the local people, by promoting the development of small-and-medium enterprises, offering job opportunities and increasing household incomes.
Nowadays, biomass energy technologies have been adopted and mature in developed countries. A developing country like Myanmar could gain the technologies, knowledge, and experiences from the developed countries and other Asian developing countries, which have been successful in biomass energy utilization. Besides, Myanmar could create locally available green technologies and markets that are well suited to the local conditions. With an abundance of biomass energy sources in Myanmar, biomass energy could potentially play a key role in the energy sector for the energy self-sufficiency, economic development, and conservation of the environment of the country in the future.
5. Conclusions
Myanmar has an abundance of biomass energy sources due to agriculture-based economy and 48% of forest cover. The major biomass sources in Myanmar are fuelwood, wood residues, rice husks, rice straw, coconut residues, sugarcane residues, palm oil residues, cassava residues, maize residues, manure from livestock, and poultry sector. Biomass energy potential from the major biomass sources in Myanmar was estimated at 15.19 Mtoe in 2005 and 17.29 Mtoe in 2017, respectively. Besides, the quantity of the unexploited biomass energy potential was estimated to be approximately 50 percent higher than that of the planned biomass energy utilization during 2015–2019. To be more efficient in utilization of biomass sources, Myanmar will need to develop more innovative solutions to the constraints and opportunities of biomass energy of the country. Involvement of all stakeholders including governments, private sector, research institutions, public sector, and local or international organizations are crucial to the development of biomass energy sector. Gaining and applying the experiences related to biomass energy utilization from the developed countries and neighboring countries will also be one of the best approaches to sustainable biomass energy utilization. As Myanmar is rich in biomass resources, biomass energy could become a high potential of sustainable development of the country to increase energy self-sufficiency and promote utilization of renewable energy sources in the future.
Supplementary Materials
The following are available online at https://0-www-mdpi-com.brum.beds.ac.uk/2079-9276/8/2/102/s1, Table S1: Estimated Crop Production (Million Tons per year) during 2005–2019, Table S2: Estimated Livestock and Poultry (Million heads per day) during 2005–2019, Table S3: Estimated Fuel Wood and Waste Generation during 2005–2019.
Author Contributions
Conceptualization, M.M.T.; Methodology, M.M.T.; Resources, M.M.T.; Formal Analysis and Investigation, M.M.T. and D.J.; Supervision, D.J.; Writing Original Draft Preparation, M.M.T.; Writing review and editing, M.M.T. and D.J.
Funding
The study was funded by the Ministry of Education, Youth and Sports of the Czech Republic and the projects: SP2019/156 and CZ.02.1.01/0.0/0.0/16_019/0000753.
Acknowledgments
The author would like to express his special sincere gratitude to Ministry of Education, Youth and Sports of the Czech Republic, the projects: “SP2019/156” and CZ.02.1.01/0.0/0.0/16_019/0000753, and Ministry of Education of Myanmar.
Conflicts of Interest
The authors declare no conflict of interest.
References
- Aung, T. Ministry of Industry, The Republic of the Union of Myanmar, Country Analysis Paper on 3R Practice in Myanmar. In Proceedings of the Fourth Regional 3R Forum in Asia, Ha Noi, Vietnam, 18–20 March 2013. [Google Scholar]
- Mann, U.; Myint, O. Myanmar Participants. Community-based 3 Rs Practices in Myanmar. 2017. Available online: www.iges.or.jp/en/archive/wmr/pdf/.../6_Myanmar_Day1_Session2.pdf (accessed on 31 March 2017).
- Southeast Asia: Myanmar. Myanmar Population. Available online: http://www.worldometers.info/world-population/myanmar-population/ (accessed on 31 April 2019).
- Trading Economics. Myanmar Population Forecast 2016–2020. 2017. Available online: https://tradingeconomics.com/myanmar/population (accessed on 1 April 2017).
- Khaing, W. Myanmar’s Future Potentials in Low Carbon Energy. In Proceedings of the Myanmar 2nd Forum, Green Economy Green Growth, MICC, Nay Pyi Taw, Myanmar, 13–15 November 2012. [Google Scholar]
- Myanmar Representative. Renewable Energy and Rural Development in Myanmar. Hanoi, Vietnam, 20 November 2012. Available online: https://slideplayer.com/slide/4742681/ (accessed on 1 April 2019).
- Kyaw, W.W.; Sukchai, S.; Ketjoy, N.; Ladpala, S. Energy utilization and the status of sustainable energy in Union of Myanmar. Energy Procedia 2011, 9, 351–358. [Google Scholar] [CrossRef] [Green Version]
- Tar, M.M. Bioenergy Status and Country Updates; Ministry of Agriculture and Irrigation, Department of Agricultural Research: Yezin, Zay Pyi Taw, Myanmar, 2017; Available online: http://charltonsmyanmar.com/wp-content/uploads/2013/10/presentation.pdf (accessed on 31 June 2017).
- Nam, K.Y.; Cham, W.M.; Halili, P.R. Power Sector Development in Myanmar; Economics Working Paper Series-460; Asian Development Bank: Manila, Philippines, 2015; pp. 1–30. [Google Scholar]
- Emmerton, M.; Thorncraft, S.; Oksanen, S.; Soe, M.; Hlaing, K.K.; Thein, Y.Y.; Khin, M. Myanmar Energy Master Plan. In Proceedings of the National Energy Management Committee Myanmar, Naypyitaw, Myanmar, December 2015. [Google Scholar]
- Regional Wood Energy Development Programme in Asia (RWEDP). Biomass Energy in ASEAN Member Countries; Biomass: More than a Traditional Form of Energy. Available online: http://wgbis.ces.iisc.ernet.in/energy/HC270799/RWEDP/asean.html (accessed on 31 March 2017).
- Sovacool, B.K. Confronting energy poverty behind the bamboo curtain: A review of challenges and solutions for Myanmar (Burma). Energy Sustain. Dev. 2013, 4, 305–314. [Google Scholar] [CrossRef]
- Than, T.M.M. Myanmar’s energy sector: Banking on natural gas. Southeast Asian Aff. 2005, 2005, 257–289. [Google Scholar] [CrossRef]
- D’Agostino, A.L.; Sovacool, B. Numbers and Futures: Energy Security Trends; Asian Trends Monitoring, 2010. Available online: http://srodev.sussex.ac.uk/id/eprint/58200 (accessed on 1 May 2019 2019).
- International Energy Agency (IEA). Southeast Asia Energy Outlook, 2017. In World Energy Outlook Special Reports; IEA: Paris, France, 2017; pp. 3–141. [Google Scholar]
- Laemsak, N.; Haruthaithanasan, M. Potential of Biomass Utilization in ACMECS (Laos, Myanmar, Cambodia, Vietnam and Thailand); Kasetsart University: Bangkok, Thailand, 2017; Available online: https://www.oeaw.ac.at/forebiom/WS2lectures/02-02-NLAEMSAK.pdf (accessed on 16 June 2017).
- Ministry of Energy (MOE). Energy sector development in Myanmar. In Proceedings of the Greater Mekong Subregion 5th Meeting of the Sub-Regional Energy Forum (SEF-5), Ho Chi Minh City, Vietnam, 11 November 2011. [Google Scholar]
- Yosiyana, B. Renewable Energy Development in ASEAN. ASEAN Centre for Energy. In Proceedings of the 2nd Asia Renewable Energy Workshop, Jakarta, Indonesia, 2–4 December 2015. [Google Scholar]
- Asian Development Bank (ADB). Myanmar: Energy Sector Initial Assessment; ADB: Mandaluyong City, Philippines, 2012. [Google Scholar]
- Hlaing, A. Policy Approaches to Sustainable Bio-energy Development in Myanmar; Ministry of Agriculture and Irrigation, Myanmar: Bangkok, Thailand, 2011; Available online: http://www.fao.org/fileadmin/templates/rap/files/meetings/2011/110603_myanmar.pdf (accessed on 1 May 2019).
- Ener, A.B.L.E.; Devel, Y. Renewable Energy Developments and Potential in the Greater Mekong Subregion; Asian Development Bank: Mandaluyong, Philippines, 2015; pp. 1–147. [Google Scholar]
- Ricepedia. The Online Authority on Rice: Myanmar. Available online: http://ricepedia.org/myanmar (accessed on 19 June 2018).
- Food and Agriculture Organization (FAO). Available online: http://data.un.org/Data.aspx?d=FAO&f=itemCode%3a249#f_A (accessed on 1 May 2019).
- Myanmar: Ranking-Maize-Production (Tons). Available online: https://en.actualitix.com/country/mmr/myanmar-maize-production.php (accessed on 1 May 2019).
- Central Statistical Organization. Myanmar Agriculture: Production by Products (1986–2017). Available online: https://www.ceicdata.com/en/myanmar/agriculture-production-by-products (accessed on 1 May 2019).
- Tun, M.M.; Juchelkova, D. Estimation of greenhouse gas emissions: An alternative approach to waste management for reducing the environmental impacts in Myanmar. Environ. Eng. Res. 2019, 24, 618–629. [Google Scholar] [CrossRef]
- Encyclopedia of the Nations. Burma (Myanmar)-Agriculture. Available online: http://www.nationsencyclopedia.com/economies/Asia-and-the-Pacific/Burma-Myanmar-AGRICULTURE.html (accessed on 1 May 2019).
- Tun, M.M. An Overview of Renewable Energy Sources and Their Energy Potential for Sustainable Development in Myanmar. Eur. J. Sustain. Dev. Res. 2019, 3, 1–13. [Google Scholar] [CrossRef]
- Kaosol, T. Sustainable solutions for municipal solid waste management in Thailand. World Acad. Sci. Eng. Technol. 2009, 60, 665–670. [Google Scholar]
- Krajnc, N. Wood Fuels Handbook; Food and Agriculture Organization of the United Nations: Pristina, Kosovo, 2015; Available online: http://agris.fao.org/agris-search/search.do?recordID=XF2017001919 (accessed on 1 May 2019).
- Simpson, W.; Anton, T.W. Chapter 3: Physical properties and moisture relations of wood. In Wood Handbook: Wood as An Engineering Material; General Technical Report FPL (GTR-113); USDA Forest Service, Forest Products Laboratory: Madison, WI, USA, 1999; pp. 1–24. [Google Scholar]
- Ludington, D. Calculating the Heating Value of Biogas; DLtech, Inc.: New York, NY, USA, 2006. [Google Scholar]
- Tun, M.M.; Juchelkova, D.; Win, M.M.; Thu, A.M.; Puchor, T. Biomass Energy: An Overview of Biomass Sources, Energy Potential, and Management in Southeast Asian Countries. Resources 2019, 8, 81. [Google Scholar] [CrossRef]
- Hlaing, T.M.; Khine, N.N. Mitigation Activities in Myanmar: Energy Sector. In Proceedings of the Regional Workshop on Innovative and Sustainable Energy Technologies for Developing Countries: Opportunities and Challenges, New Delhi, India, 28–30 May 2014. [Google Scholar]
- Kapur, T.; Kandpal, T.C.; Garg, H.P. Electricity generation from rice husk in Indian rice mills: Potential and financial viability. Biomass Bioenergy 1996, 10, 393–403. [Google Scholar] [CrossRef]
- Koppejan, J.; Van Loo, S. The Handbook of Biomass Combustion and Co-Firing, 1st ed.; Routledge: London, UK, 2012. [Google Scholar]
- Alena, A.; Sahu, O. Cogenerations of energy from sugar factory bagasse. J. Energy Eng. 2013, 1, 22–29. [Google Scholar] [CrossRef]
- Curtin, L.V. Molasses—General considerations. In Molasses in Animal Nutrition; National Feed Ingredients Association: West Des Moines, IA, USA, 1983; pp. 1–10. [Google Scholar]
- Hoornweg, D.; Bhada-Tata, P. What a Waste: A Global Review of Solid Waste Management; Urban Development Series Knowledge Papers; The World Bank Group: Washington, DC, USA, 2012; pp. 1–98. [Google Scholar]
- George Thomas Sandia National Laboratories. Overview of Storage Development DOE Hydrogen Program: Safe, efficient and cost-effective storage is a key element in the development of hydrogen as an energy carrier. In Proceedings of the Hydrogen Program 2000 Annual Review, San Ramon, CA, USA, 9–11 May 2000; Available online: http://www1.eere.energy.gov/hydrogenandfuelcells/pdfs/storage.pdf (accessed on 23 October 2017).
- Elsayed, M.A.; Matthews, R.; Mortimer, N.D. Technical Report: Carbon and Energy Balances for a Range of Biofuels Options; Resources Research Unit, Sheffield Hallam University: Sheffield, UK, 2003. [Google Scholar]
- Baquero, G.; Esteban, B.; Riba, J.R.; Puig, R.; Rius, A. Use of rapeseed straight vegetable oil as fuel produced in small-scale exploitations. In InBiofuel’s Engineering Process Technology; IntechOpen: London, UK, 2011. [Google Scholar]
- Bodenbender, M.; Messinger, C.; Ritter, R. Mission Report: Energy Scoping Myanmar. EUEI Energy Dev. 2012, 12, 1–58. [Google Scholar]
- Dubey, A.K.; Chandra, P. Energy form Cotton Stalk and Other Agro Residues. Central Institute of Agricultural Engineering BHOPAL. Available online: https://www.icac.org/projects/CommonFund/20_ucbvp/papers/01_dubey.pdf (accessed on 1 May 2018).
- Dubey, A.K.; Chandra, P.; Padhee, D.; Gangil, S. Energy from Cotton Stalks and Other Crop Residues. Available online: https://www.icac.org/projects/CommonFund/20_ucbvp/papers/15_chandra.pdf (accessed on 27 October 2017).
- Gebresas, A.; Asmelash, H.; Berhe, H.; Tesfay, T. Briquetting of charcoal from sesame stalk. J. Energy 2015, 2015, 757284. [Google Scholar] [CrossRef]
- List and Values of Wood Fuel Parameters—Part 1: Wood Fuel Characteristics. Available online: http://www.woodenergy.ie/woodasafuel/listandvaluesofwoodfuelparameters-part1/ (accessed on 5 May 2019).
- El Bassam, N. Handbook of Bioenergy Crops: A Complete Reference to Species, Development and Applications, 1st ed.; Routledge: London, UK, 2010. [Google Scholar]
- Indigo Energy Company. Biomass. Available online: http://www.indigoenergy.net/distributed-generation/biomass/ (accessed on 1 March 2018).
- Kaung Kyaw Say Group of Companies (KKS). Our Products: The Best Manufacturer of All Kinds of Gasifiers in Myanmar. Available online: http://kaungkyawsay.com/products.htm (accessed on 25 October 2017).
- Powermax. Company News: 1000KW Finished Installation in Myanmar. Wuxi Teneng Power Machinery Co., Ltd. Available online: http://www.wxteneng.com/en/news/1000KW-finished-installation-in-Myanmar-152.html (accessed on 16 June 2017).
- Pode, R.; Pode, G.; Diouf, B. Solution to sustainable rural electrification in Myanmar. Renew. Sustain. Energy Rev. 2016, 59, 107–118. [Google Scholar] [CrossRef]
- Ministry of Natural Resources and Environmental Conservation (MONREC). Myanmar’s Electricity Vision: Updating National Master Electrification Plan. 2018. Available online: http://d2ouvy59p0dg6k.cloudfront.net/downloads/myanmar_s_electricity_vision_final_web.pdf (accessed on 30 April 2018).
- Khaing, W. Opportunities of clean energy solutions in Myanmar and in the Region. In Proceedings of the GECC 3rd Forum, Nay Pyi Taw-Yangon, Myanmar, 22–23 November 2013. [Google Scholar]
- Green Economy Green Group (GEGG). Green Economy and Green Growth in Myanmar. Available online: http://www.uncrd.or.jp/content/documents/Country%20Analysis%20Paper_Myanmar.pdf (accessed on 16 June 2017).
- Aung, H. Ministry of Electricity and Energy. In Proceedings of the Current Status of Myanmar’s Energy Statistics, Kuala Lumpur, Malaysia, 21–23 November 2017. [Google Scholar]
- Asian Development Bank (ADB). Myanmar Energy Sector Assessment, Strategy and Road Map; Asian Development Bank: Mandaluyong City, Philippines, 2016; pp. 1–25. [Google Scholar]
- Prasertsan, S.; Sajjakulnukit, B. Biomass and biogas energy in Thailand: Potential, opportunity and barriers. Renew. Energy 2006, 31, 599–610. [Google Scholar] [CrossRef]
- Myanmar: Country Assessment on Biofuels and Renewable Energy. Greater Mekong Subregion Economic Cooperation Program. March 2009. Available online: http://www.oilseedcrops.org/wp-content/uploads/2013/07/Myanmar-Country-Report-Assessment-on-Biofuels.pdf (accessed on 1 May 2019).
Figure 1.
(a) Total primary energy supplies (b) Total final energy consumption [9]. Source: Ministry of Electric Power, Myanmar.
Figure 1.
(a) Total primary energy supplies (b) Total final energy consumption [9]. Source: Ministry of Electric Power, Myanmar.

Figure 2.
Energy consumption by sector in Myanmar (2012) [10]. Source: Emmerton et al. (2015).
Figure 2.
Energy consumption by sector in Myanmar (2012) [10]. Source: Emmerton et al. (2015).

Figure 3.
Traditional biomass consumption (2015) and access to electricity (2016) in the Selected ASEAN Countries [15].
Figure 3.
Traditional biomass consumption (2015) and access to electricity (2016) in the Selected ASEAN Countries [15].

Figure 4.
Potential share of renewable energy in the Selected ASEAN Countries [18].
Figure 4.
Potential share of renewable energy in the Selected ASEAN Countries [18].

Figure 5.
Estimated biomass energy potential from the agricultural, forest and municipal sector.

Figure 6.
Biomass energy potential from livestock and poultry.

Figure 7.
Contribution of biomass energy potential in 2005 and 2015.

Figure 8.
Total biomass energy potential from different sectors in Myanmar.

Figure 9.
(a) Energy supply projection in Myanmar (b) Potential share of biomass energy to the total energy supply. Source: Adapted from Tun (2019) [28] and [10,57]

Figure 10.
Comparison of planned biomass energy utilization, unexploited biomass energy potential and total biomass energy potential in Myanmar.
Figure 10.
Comparison of planned biomass energy utilization, unexploited biomass energy potential and total biomass energy potential in Myanmar.

Figure 11.
Challenges and possible solutions to development of biomass energy in Myanmar.


| Year | Crop Production (Million Tons) | |||||
|---|---|---|---|---|---|---|
| Maize | Paddy | Sugarcane | Coconut | Oil Palm | Cassava | |
| 2005 | 0.92 | 27.68 | 6.48 | 0.43 | 0.03 | 0.20 |
| 2006 | 1.03 | 30.92 | 7.69 | 0.46 | 0.05 | 0.21 |
| 2007 | 1.15 | 31.45 | 8.82 | 0.49 | 0.06 | 0.28 |
| 2008 | 1.20 | 32.57 | 9.25 | 0.51 | 0.06 | 0.33 |
| 2009 | 1.25 | 32.68 | 9.12 | 0.42 | 0.07 | 0.36 |
| 2010 | 1.35 | 32.58 | 9.25 | 0.43 | - | - |
| 2011 | 1.46 | 29.01 | 9.54 | 0.42 | - | - |
| 2012 | 1.50 | 26.22 | 9.41 | 0.49 | - | - |
| 2013 | 1.60 | 26.37 | 10.31 | 0.51 | - | - |
| 2014 | 1.69 | 26.42 | 11.13 | 0.51 | - | - |
| 2015 | 1.75 | 26.21 | 10.14 | 0.52 | - | - |
| 2016 | - | 26.21 | 10.14 | 0.53 | - | - |
| 2017 | - | 25.67 | 10.44 | 0.55 | - | - |
| Year | Livestock and Poultry Production (Million Heads) | |||||
| Buffalo | Cattle | Pig | Chicken | |||
| 2005 | 2.70 | 12.10 | 5.70 | 81.70 | ||
| 2007 | 2.80 | 12.60 | 7.00 | 107.40 | ||
| 2008 | 2.90 | 12.90 | 7.70 | 122.30 | ||
| 2009 | 2.90 | 13.20 | 8.30 | 135.40 | ||
| 2011 | 3.00 | 14.02 | - | 153.30 | ||
Table 2.
Predicted supply of fuelwood in National Forestry Master Plan [19].
Table 2.
Predicted supply of fuelwood in National Forestry Master Plan [19].
| Source | 2002 | 2030 | ||
|---|---|---|---|---|
| (Million Cubic Meters) | (%) | (Million Cubic Meters) | (%) | |
| Plantations | 1.06 | 3.36 | 1.26 | 4.23 |
| Non-forest land | 7.89 | 25.01 | 7.44 | 25.00 |
| Community forests | 0.06 | 0.19 | 7.44 | 25.00 |
| Natural forests | 22.54 | 71.44 | 13.63 | 45.77 |
| Total | 31.55 | 100.00 | 29.37 | 100.00 |
Table 3.
Projected municipal solid waste generation in Myanmar [26].
Table 3.
Projected municipal solid waste generation in Myanmar [26].
| Year | Municipal Solid Waste Generation (Tons per Day) | Per Capita Waste Generation (kg per Capita per Day) |
|---|---|---|
| 2012 | 5616 | 0.44 |
| 2013 | 6800 | 0.47 |
| 2014 | 7985 | 0.50 |
| 2015 | 9169 | 0.53 |
| 2016 | 10,353 | 0.57 |
| 2017 | 11,538 | 0.60 |
| 2018 | 12,722 | 0.63 |
Table 4.
The data assumptions related to each type of biomass residues for the estimation of biomass energy potential in Myanmar [19,21,29,30,31].
| Sector | Biomass | RPR | LHV (MJ/kg) |
|---|---|---|---|
| Agricultural Sector | Rice husks | 0.230 | 12.850 |
| Rice Straw | 0.447 | 8.830 | |
| Maize Stalk | 0.250 | 16.630 | |
| Maize Cob | 0.250 | 16.630 | |
| Cassava Stalks | 0.088 | 16.990 | |
| Sugarcane tops and trashes | 0.302 | 6.820 | |
| Sugarcane bagasse | 0.250 | 6.430 | |
| Oil palm frond | 2.604 | 7.970 | |
| Oil palm fibre | 0.147 | 16.190 | |
| Oil palm shell | 0.049 | 17.000 | |
| Oil palm fruit bunch | 0.250 | 16.440 | |
| Coconut shell | 0.160 | 16.480 | |
| Coconut husk | 0.362 | 16.710 | |
| Coconut frond | 0.225 | 14.550 | |
| Municipal Sector | Municipal solid wastes | 6.000 | |
| Forest Sector | Wood residues | 0.400 | 11 (8.8 GJ per m3) |
Table 5.
The data assumptions related to each type of livestock and poultry for the estimation of biomass energy potential in Myanmar [21,32].
| Livestock/Poultry | DMPF (kg/Animal) | DMF (%) | MBYF (m3/kg dry Matter) | LHV (MJ/m3) |
|---|---|---|---|---|
| Buffalo | 8.000 | 16 | 0.250 | 15 |
| Cattle | 8.000 | 16 | 0.250 | 15 |
| Pig | 2.000 | 17 | 4.200 | 15 |
| Chicken | 0.080 | 25 | 0.575 | 15 |
Table 6.
Types, quantity and energy contribution of bioenergy sources in Myanmar. Source: Adapted from Tun (2019) [28].
Table 6.
Types, quantity and energy contribution of bioenergy sources in Myanmar. Source: Adapted from Tun (2019) [28].
| Type of Biomass | Growing Area/Heads | Quantity | Energy Contribution | Remarks |
|---|---|---|---|---|
| Residues/Wastes | Area (×1000 ha.) | kilotons per Year | Net Calorific Value (MJ/Kg) | Annual Biomass Resources in Myanmar [34]; Municipal solid waste generation in 2015 [39] |
| Rice Husks | 6872 (paddy) [33] | 4392 [34] | 12.1–14.2 [35] | |
| Lumber Waste | NA | 1500 [34] | 8–12 [36] | |
| Bagasse | NA | 2126 [34] | 6.43–7.44 [21,37] | |
| Molasses | NA | 240 [34] | 8.21–13.472 [38] | |
| Municipal solid wastes | - | 3510 [39] | 5.163–6.121 [29] | |
| Fuelwood | Area (×1000 ha.) | Million cubic meters per year | Net Calorific Value (MJ/Kg) | National Forestry Master Plan of Ministry of Forestry (2002–2030) [19] |
| Plantations | NA | 1.110 | 16–21 [30] | |
| Non-forest land | 15,772 [16] | 7.780 | (2.94–21.84 MJ/L) [30,31] | |
| Community forests | NA | 1.905 | ||
| Natural forests | NA | 20.313 | ||
| Ethanol Producible Crops | Growing Area (×1000 ha.) | Million gallons per year | Energy Density (MJ/Kg) | |
| Sugarcane | 308 | 309 | 26.8 [40] | Ministry of Agriculture and Irrigation, Myanmar (2008–2009) [20] |
| Cassava | 22 | 30 | ||
| Sorghum | 210 | 2 | ||
| Maize | 347 | 81 | ||
| Potato | 37 | NA | ||
| Sweet Potato | 7 | NA | ||
| Bio-Diesel Producible Crops | Growing Area (×1000 ha.) | 103 × Million tons per year | Energy Density (MJ/kg) | Ministry of Agriculture and Irrigation, Myanmar (2008–2009) [20]; The energy density of the bio-diesel producible crops accounts for 37.273–9.62 MJ/kg. |
| Oil Palm | 105 | 52 | 37.27–39.62 [41,42] | |
| Niger | 145 | 30 | ||
| Rape Seed | 87 | 22 | ||
| Sunflower | 857 | 218 | ||
| Sesame | 1552 | 334 | ||
| Groundnut | 813 | 358 | ||
| Soybean | 165 | 29 | ||
| Coconut | 53 | 350(copra) | ||
| Jatropha | 2722 | 3 | ||
| Livestock and Poultry | Heads (Million) | Quantity of Manure (kg/day) | Net Calorific Value (MJ/m3) | Estimation of quantity of manure from livestock and poultry with pig and chicken production figures in 2010 and buffalo and cattle production figures in 2011–2012 [21] |
| Buffalo | 3.09 | 24,720,000 | 14.344–25.150 [32] | |
| Cattle | 14.02 | 112,160,000 | ||
| Pigs | 9.30 | 18,600,000 | ||
| Chicken | 153.20 | 12,256,000 |
NA: non-accessible.
Table 7.
Biomass consumption in rural area (per household per annum). Source: Ministry of Agriculture and Irrigation, Myanmar.
Table 7.
Biomass consumption in rural area (per household per annum). Source: Ministry of Agriculture and Irrigation, Myanmar.
| Biomass Source | Consumption (Dry ton) | Share of Biomass Source (%) | Energy Content (MJ/kg) |
|---|---|---|---|
| Fuel wood | 3.76 | 42.70 | 16–21 [30] |
| Pigeon pea stalk | 2.30 | 26.20 | 18.6 [44] |
| Cotton stalk | 0.50 | 5.60 | 17.4–18.1 [44,45] |
| Sesame stalk | 1.20 | 13.60 | 17.4 [46] |
| Coconut or palm leaves | 0.60 | 6.80 | 14.55 [21] |
| Rice husk | 0.30 | 3.00 | 12.1–14.2 [35] |
| Sawdust | 0.07 | 0.80 | 6–19.2 [47] |
| Bamboo | 0.12 | 1.30 | 17.1 [48] |
| Total | 8.85 | 100 | - |
| Type of Biomass | Types of Technologies/Traditional Way | Capacity | Quantity (Number) | Purpose of Energy Utilization | Remarks | |
|---|---|---|---|---|---|---|
| Rice Husk | Circulating Fluidized Bed Gasifier | 1000 kW | 1 | - | Electricity | 2014 |
| Rice Husk + Wood Chip | Down-draft Gasifier/Circulating Fluidized Bed Gasifier | 30–50 kW | 1096 | - | Electricity | 2016 |
| Wood Chip | Down-draft Gasifier | 50 kW | 7 | - | Electricity | 2013 |
| Down-draft Gasifier | 30 kW | 1 | - | Electricity | ||
| Biogas | Floating type | 5–50 m3 | 867 | Cooking and Heating | Electricity | |
| Biogas | Fixed-Dome Type | 5 m3 | 1 | Cooking and Heating | - | 2012 |
| Fixed-Dome Type | 8 m3 | 11 | Cooking and Heating | - | ||
| Fixed-Dome Type | 10 m3 | 8 | Cooking and Heating | - | ||
| Fixed-Dome Type | 15 m3 | 3 | - | Electricity | ||
| Fixed-Dome Type | 25 m3 | 5 | - | Electricity | ||
| Fixed-Dome Type | 35 m3 | 3 | - | Electricity | ||
| Fixed-Dome Type | 50 m3 | 141 | - | Electricity | ||
| Fixed-Dome Type | 60 m3 | 1 | - | Electricity | ||
| Fixed-Dome Type | 100 m3 | 1 | - | Electricity | ||
| Fuelwood, pigeon pea stalk, cototn stalk, seasame stalk, coconut or palm leaves, rice husk, saw dust, bamboo | Traditional Biomass Use | - | 8.85 dry ton per household per annum | Cooking and Heating | - | Annual biomass consumption per household per annum in rural area |
| Total Installed Capacity | 115 MW | - | Installed capacity in 2013 | |||
Table 9.
Energy balance of Myanmar during the year 2014–2016 (ktoe in unit) [56]. Source: Ministry of Electricity and Energy (2017).
Table 9.
Energy balance of Myanmar during the year 2014–2016 (ktoe in unit) [56]. Source: Ministry of Electricity and Energy (2017).
| Year | Commodity Transaction | Coal | Crude Oil | Petroleum Products * | Natural Gas | Electricity | Biomass | Total | |||
|---|---|---|---|---|---|---|---|---|---|---|---|
| Fuelwood | Bagasse | Charcoal | Biogas | ||||||||
| 2014–2015 | Net Supply Available | 254 | 18 | 4872 | 364 | 1152 | 8555 | 323 | 157 | 0.52 | 15696 |
| Final Consumption ** | 253 | - | 4740 | 360 | 1152 | 8555 | 323 | 157 | 0.52 | 15541 | |
| 2015–2016 | Net Supply Available | 254 | 18 | 4714 | 364 | 1152 | 8555 | 323 | 157 | 0.52 | 15538 |
| Final Consumption ** | 253 | - | 4714 | 360 | 1152 | 8555 | 323 | 157 | 0.52 | 15515 | |
* Petroleum products included LGP, gasoline, jet fuel/aviation, gas/diesel oil and others. ** Final consumption included the consumption by the sectors of industry, transport, commercial, residential and others.
© 2019 by the authors. Licensee MDPI, Basel, Switzerland. This article is an open access article distributed under the terms and conditions of the Creative Commons Attribution (CC BY) license (http://creativecommons.org/licenses/by/4.0/).
Share and Cite
MDPI and ACS Style
Tun, M.M.; Juchelková, D. Biomass Sources and Energy Potential for Energy Sector in Myanmar: An Outlook. Resources 2019, 8, 102. https://0-doi-org.brum.beds.ac.uk/10.3390/resources8020102
AMA Style
Tun MM, Juchelková D. Biomass Sources and Energy Potential for Energy Sector in Myanmar: An Outlook. Resources. 2019; 8(2):102. https://0-doi-org.brum.beds.ac.uk/10.3390/resources8020102
Chicago/Turabian StyleTun, Maw Maw, and Dagmar Juchelková. 2019. "Biomass Sources and Energy Potential for Energy Sector in Myanmar: An Outlook" Resources 8, no. 2: 102. https://0-doi-org.brum.beds.ac.uk/10.3390/resources8020102
Note that from the first issue of 2016, this journal uses article numbers instead of page numbers. See further details here.