Improving the Efficiency of Pyrolysis and Increasing the Quality of Gas Production through Optimization of Prototype Systems


Abstract
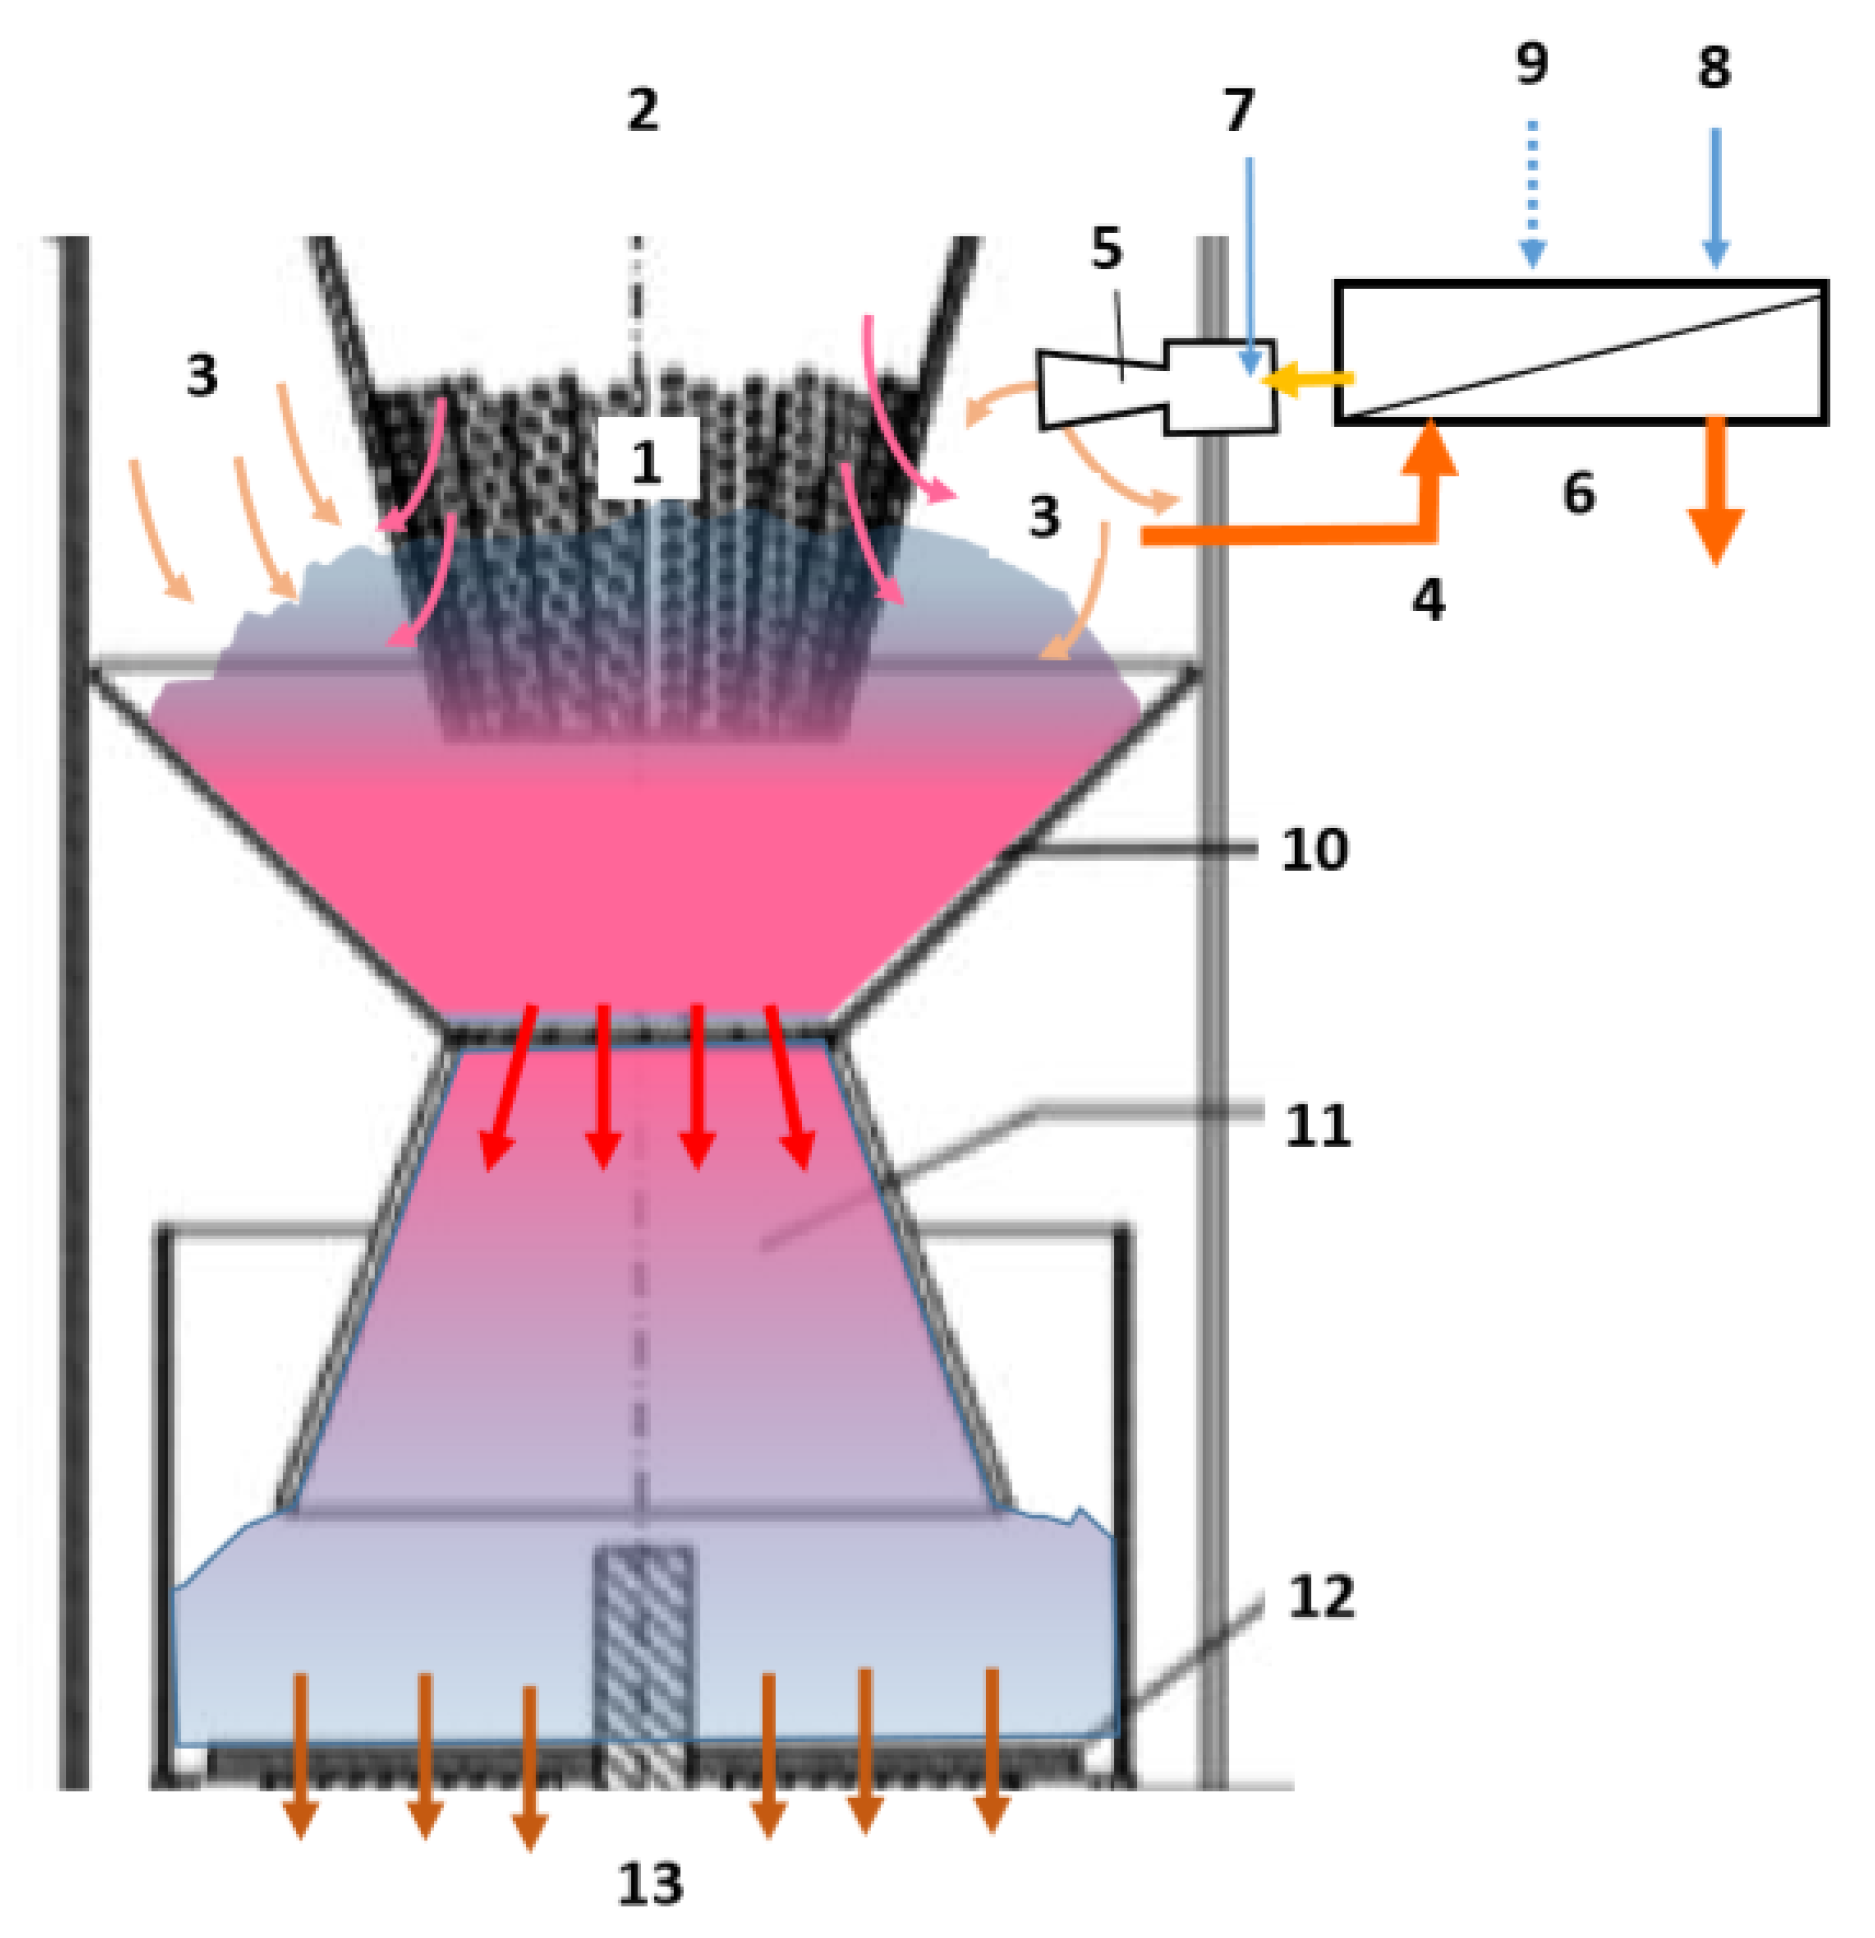
:1. Description of the Developed System within the Project
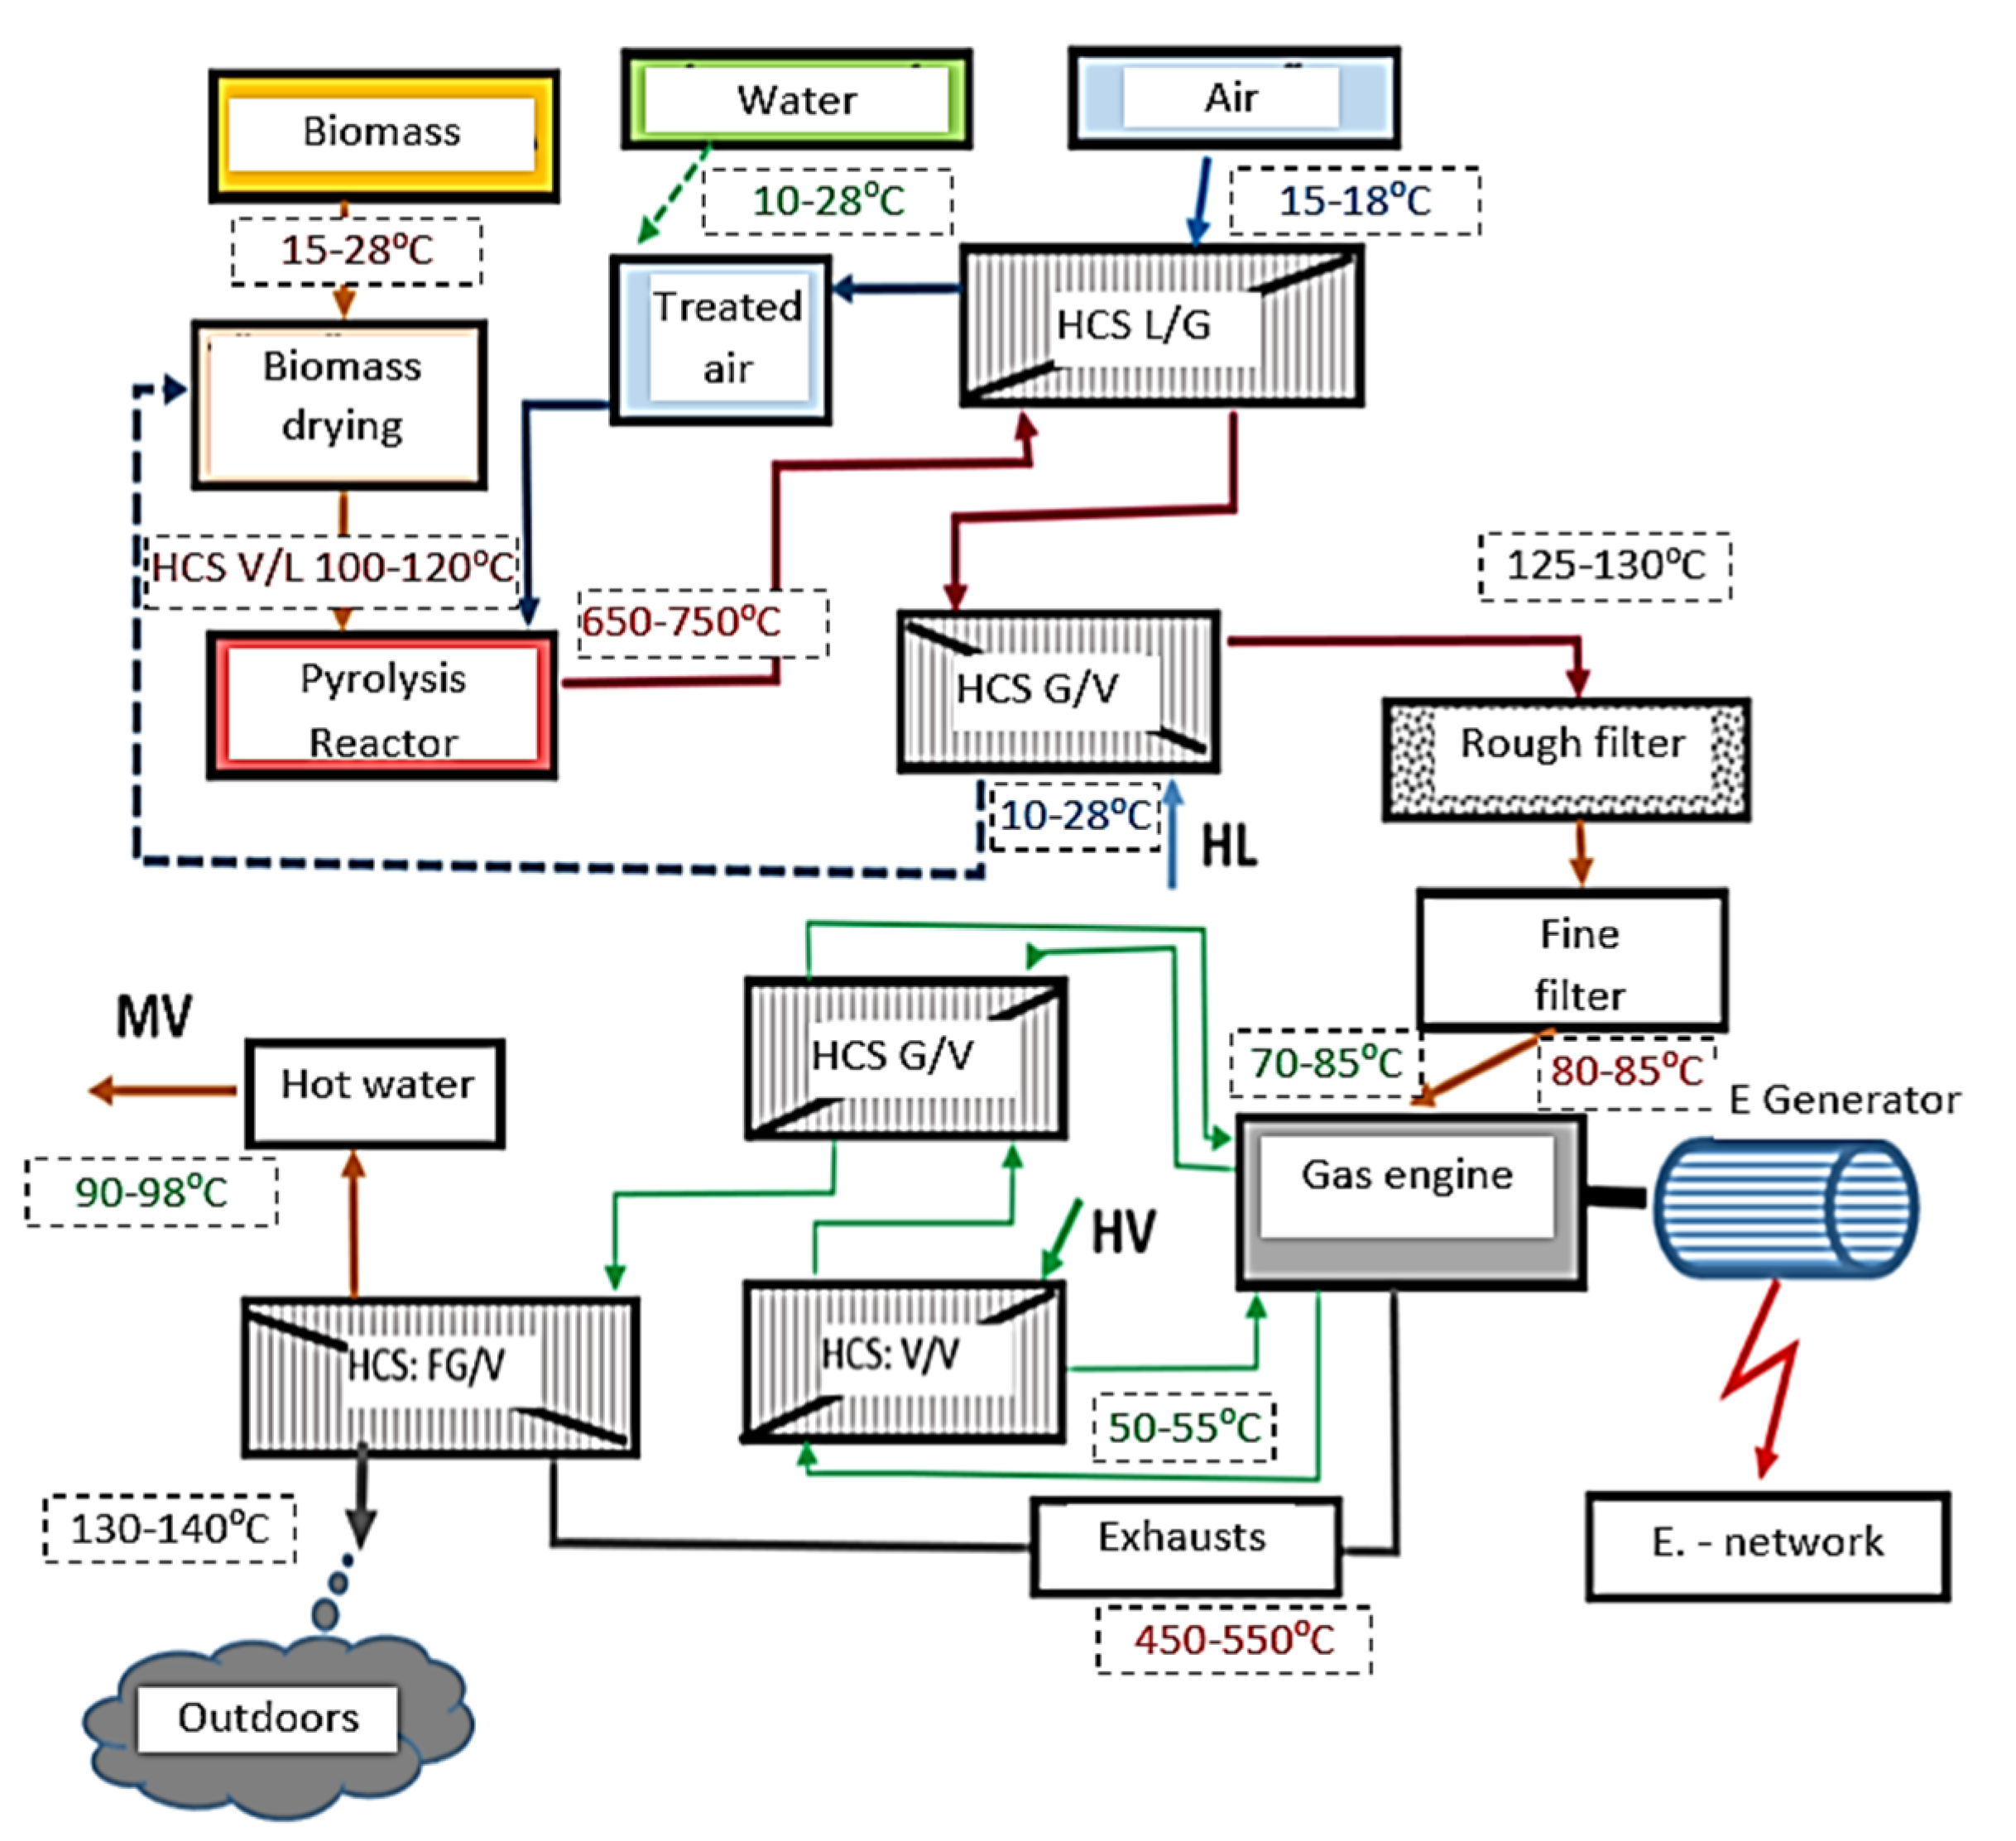
2. Flowchart and Structure of the Developed System
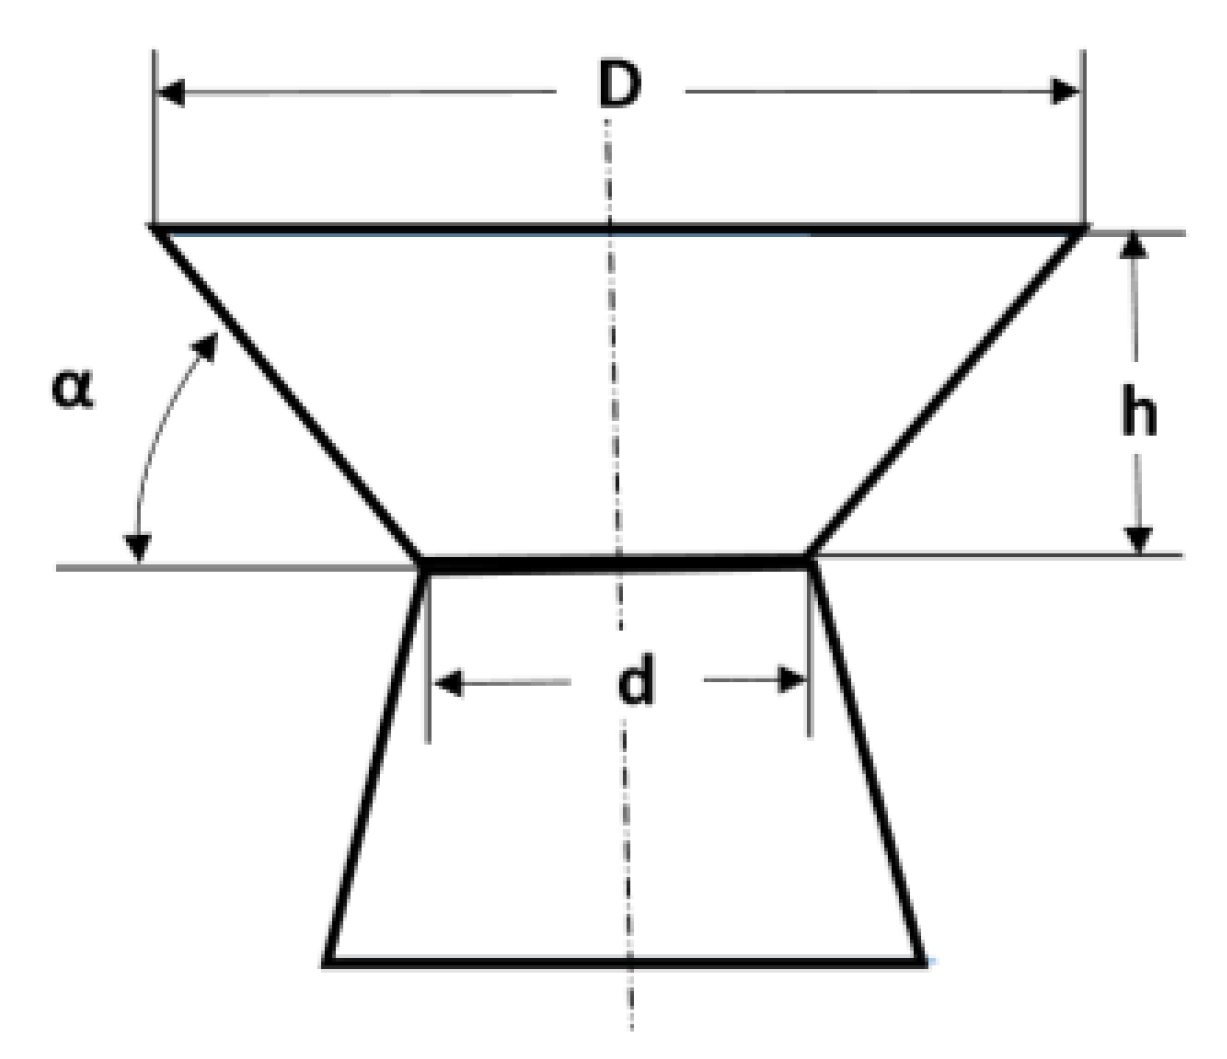
3. The Aperture and Angle of the Reduction Cone
4. The Effect of Porosity
5. Effect of Adding Water and Air
6. Conclusions
Author Contributions
Funding
Acknowledgments
Conflicts of Interest
References
- Saravanakumar, A.; Haridasan, T.M.; Reed, T.B.; Bai, R.K. Experimental investigation and modelling study of long stick wood gasification in a top lit updraft fixed bed gasifier. Fuel 2007, 86, 2846–2856. [Google Scholar] [CrossRef]
- Siedlecki, M.; de Jong, W. Biomass gasification as the first hot step in clean syngas production process—Gas quality optimization and primary tar reduction measures in a 100 kW thermal input steam–oxygen blown CFB gasifier. Biomass Bioenergy 2011, 35, S40–S62. [Google Scholar] [CrossRef]
- Thanapal, S.S.; Annamalai, K.; Sweeten, J.M.; Gordillo, G. Fixed bed gasification of dairy biomass with enriched air mixture. Appl. Energy 2012, 97, 525–531. [Google Scholar] [CrossRef]
- Bird, R.C.; Park, S.K. The Domains of Corporate Counsel in an Era of Compliance. Am. Bus. Law J. 2016, 53, 203–249. [Google Scholar] [CrossRef]
- Morf, P.; Hasler, P.; Nussbaumer, T. Mechanisms and kinetics of homogeneous secondary reactions of tar from continuous pyrolysis of wood chips. Fuel 2002, 81, 843–853. [Google Scholar] [CrossRef]
- Bhattacharya, S.; Mizanur Rahman Siddique, A.H.M.; Pham, H.-L. A study on wood gasification for low-tar gas production. Energy 1999, 24, 285–296. [Google Scholar] [CrossRef]
- Dhaundiyal, A.; Gupta, V.K. The Analysis of Pine Needles as a Substrate for Gasification. Hydro Nepal J. Water Energy Environ. 2014, 15, 73–81. [Google Scholar] [CrossRef] [Green Version]
- Kihedu, J. Torrefaction and Combustion of Ligno-Cellulosic Biomass. Energy Procedia 2015, 75, 162–167. [Google Scholar] [CrossRef] [Green Version]
- Patwardhan, P.R.; Brown, R.C.; Shanks, B.H. Product Distribution from the Fast Pyrolysis of Hemicellulose. ChemSusChem 2011, 4, 636–643. [Google Scholar] [CrossRef]
- Fogarassy, C. Rationalisation of production structure of arable land energy-crops in Hungary. Bodenkultur 2001, 52, 225–231. [Google Scholar]
- Callegari, A.; Capodaglio, A.G. Properties and Beneficial Uses of (Bio)Chars, with Special Attention to Products from Sewage Sludge Pyrolysis. Resources 2018, 7, 20. [Google Scholar] [CrossRef] [Green Version]
- Ukanwa, K.S.; Patchigolla, K.; Sakrabani, R.; Anthony, E.; Mandavgane, S. A Review of Chemicals to Produce Activated Carbon from Agricultural Waste Biomass. Sustainability 2019, 11, 6204. [Google Scholar] [CrossRef] [Green Version]
- Guo, F.; Dong, Y.; Dong, L.; Guo, C. Effect of design and operating parameters on the gasification process of biomass in a downdraft fixed bed: An experimental study. Int. J. Hydrog. Energy 2014, 39, 5625–5633. [Google Scholar] [CrossRef]
- Basu, P. Biomass Gasification and Pyrolysis: Practical Design and Theory; Academic Press: Burlington, MA, USA, 2010; ISBN 978-0-12-374988-8. [Google Scholar]
- Barman, N.S.; Ghosh, S.; De, S. Gasification of biomass in a fixed bed downdraft gasifier—A realistic model including tar. Bioresour. Technol. 2012, 107, 505–511. [Google Scholar] [CrossRef]
- Raman, P.; Ram, N.K.; Gupta, R. A dual fired downdraft gasifier system to produce cleaner gas for power generation: Design, development and performance analysis. Energy 2013, 54, 302–314. [Google Scholar] [CrossRef]
- Mondal, P.; Ghosh, S. Bio-gasification based Externally Fired Combined Cogeneration Plant: Thermo-economic Performance Analysis. In Materials Today: Proceedings (Vol. 5, pp. 22963–22978); Elsevier Ltd; Available online: https://0-doi-org.brum.beds.ac.uk/10.1016/j.matpr.2018.11.024 (accessed on 15 December 2019).
- Oldal, I.; Keppler, I.; Bablena, A.; Safranyik, F.; Varga, A. On the Discrete Element Modeling of Agricultural Granular Materials. Mech. Eng. Lett. Res. Dev. 2017, 11, 8–17. [Google Scholar]
- Márta, B.; Szent István Egyetem (Gödöllő); Mezőgazdaság-és Környezettudományi Kar. Környezetkímélő és Energiatakarékos Talajművelés; Szent István Egyetem: Gödöllő, Hungary, 2002; ISBN 978-963-9256-80-4. [Google Scholar]
- Ghosh, D.; Dasgupta, D.; Agrawal, D.; Kaul, S.; Adhikari, D.K.; Kurmi, A.K.; Arya, P.K.; Bangwal, D.; Negi, M.S. Fuels and Chemicals from Lignocellulosic Biomass: An Integrated Biorefinery Approach. Energy Fuels 2015, 29, 3149–3157. [Google Scholar] [CrossRef]
- Bacskai, I.; Madar, V.; Fogarassy, C.; Toth, L. Modeling of Some Operating Parameters Required for the Development of Fixed Bed Small Scale Pyrolysis Plant. Resources 2019, 8, 79. [Google Scholar] [CrossRef] [Green Version]
- Mendiburu, A.Z.; Carvalho, J.A.; Coronado, C.J.R. Thermochemical equilibrium modeling of biomass downdraft gasifier: Stoichiometric models. Energy 2014, 66, 189–201. [Google Scholar] [CrossRef]
- Chan, W.-C.R.; Kelbon, M.; Krieger, B.B. Modelling and experimental verification of physical and chemical processes during pyrolysis of a large biomass particle. Fuel 1985, 64, 1505–1513. [Google Scholar] [CrossRef]
- Di Blasi, C. Modeling wood gasification in a countercurrent fixed-bed reactor. AIChE J. 2004, 50, 2306–2319. [Google Scholar] [CrossRef] [Green Version]
- Cao, Y.; Wang, Y.; Riley, J.T.; Pan, W.-P. A novel biomass air gasification process for producing tar-free higher heating value fuel gas. Fuel Process. Technol. 2006, 87, 343–353. [Google Scholar] [CrossRef]
- Antonopoulos, I.-S.; Karagiannidis, A.; Elefsiniotis, L.; Perkoulidis, G.; Gkouletsos, A. Development of an innovative 3-stage steady-bed gasifier for municipal solid waste and biomass. Fuel Process. Technol. 2011, 92, 2389–2396. [Google Scholar] [CrossRef]
- Madár, V.; Bácskai, I.; Dhaundiyal, A.; Tóth, L. Development of biomass-based pyrolisis CHP (R + D). Hung. Agric. Eng. 2018, 17–23. [Google Scholar] [CrossRef]
- Sharma, S.; Sheth, P.N. Air–Steam biomass gasification: Experiments, modeling and simulation. Energy Convers. Manag. 2016, 110, 307–318. [Google Scholar] [CrossRef]
- Madár, V.; Tóth, L. Fagázgenerátor üzemű bio-kiserőmű és öntözőberendezés (Biogas generator and irrigation plant powered by wood gas). Mezőgazdasági Technika 2012, 52, 3–8. [Google Scholar]
- Madár, V.; Tóth, L.; Madár, G.; Schremof, N. Kísérleti fagázgenerátor (Experimental wood gas generator). Mezőgazdasági Technika 2014, 55, 2–5. [Google Scholar]
- Kung, H.-C. A mathematical model of wood pyrolysis. Combust. Flame 1972, 18, 185–195. [Google Scholar] [CrossRef]
- Oldal, I. Szemcsés anyagok kifolyási és boltozódási tulajdonságai (Outflowing and arching properties of granular materials). Ph.D. Dissertation, Szent Istvan University, Gödöllő, Hungary, 2007. Available online: https://szie.hu/file/tti/archivum/Oldal_Istvan_tezis.pdf (accessed on 14 December 2019).
- Hadroug, S.; Jellali, S.; Leahy, J.J.; Kwapinska, M.; Jeguirim, M.; Hamdi, H.; Kwapinski, W. Pyrolysis Process as a Sustainable Management Option of Poultry Manure: Characterization of the Derived Biochars and Assessment of their Nutrient Release Capacities. Water 2019, 11, 2271. [Google Scholar] [CrossRef] [Green Version]
- László, T.; Csaba, F. “Low-Carbon” Energiaellátási Rendszerek a Gyakorlatban: A Megújulóenergia-Termelés Technológiái Magyarországon (Low-Carbon Energy Supply in Practice: The Renewable Energy Production Technologies in HUNGARY); Szaktudás K. Ház: Gödöllő, Hungary, 2012; ISBN 978-615-5224-37-9. [Google Scholar]
- Korzenszky, P.; Lányi, K.; Simándi, P. Test results of a pyrolysis pilot plant in Hungary. Hung. Agric. Eng. 2015, 48–52. [Google Scholar] [CrossRef] [Green Version]
- Borocz, M.; Herczeg, B.; Horvath, B.; Fogarassy, C. Evaluation of biochar lifecycle processes and related lifecycle assessments. Hung. Agric. Eng. 2016, 60–64. [Google Scholar] [CrossRef] [Green Version]
- Dhaundiyal, A.; Tewari, P. Kinetic Parameters for the Thermal Decomposition of Forest Waste Using Distributed Activation Energy Model (DAEM). Environ. Clim. Technol. 2017, 19, 15–32. [Google Scholar] [CrossRef] [Green Version]
- Dhaundiyal, A.; Tewari, P.C. Performance Evaluation of Throatless Gasifier Using Pine Needles as a Feedstock for Power Generation. Acta Technol. Agric. 2016, 19, 10–18. [Google Scholar] [CrossRef] [Green Version]
- Centre for Research & Technology Hellas. 15th European Biomass Conference: From Research to Market Deployment: Proceedings of the International Conference Held in Berlin, Germany, 7–11 May 2007; European Biomass Conference, Ed.; ETA-Renewable Energies: Florence, Italy, 2007; ISBN 978-3-936338-21-8. [Google Scholar]
- Martínez, J.D.; Silva Lora, E.E.; Andrade, R.V.; Jaén, R.L. Experimental study on biomass gasification in a double air stage downdraft reactor. Biomass Bioenergy 2011, 35, 3465–3480. [Google Scholar] [CrossRef]
- Chen, W.-H.; Lu, K.-M.; Liu, S.-H.; Tsai, C.-M.; Lee, W.-J.; Lin, T.-C. Biomass torrefaction characteristics in inert and oxidative atmospheres at various superficial velocities. Bioresour. Technol. 2013, 146, 152–160. [Google Scholar] [CrossRef]
- Phanphanich, M.; Mani, S. Impact of torrefaction on the grindability and fuel characteristics of forest biomass. Bioresour. Technol. 2011, 102, 1246–1253. [Google Scholar] [CrossRef]
- Charisteidis, I.; Lazaridis, P.; Fotopoulos, A.; Pachatouridou, E.; Matsakas, L.; Rova, U.; Christakopoulos, P.; Triantafyllidis, K. Catalytic Fast Pyrolysis of Lignin Isolated by Hybrid Organosolv—Steam Explosion Pretreatment of Hardwood and Softwood Biomass for the Production of Phenolics and Aromatics. Catalysts 2019, 9, 935. [Google Scholar] [CrossRef] [Green Version]
- Francioso, O.; Sanchez-Cortes, S.; Bonora, S.; Roldán, M.L.; Certini, G. Structural characterization of charcoal size-fractions from a burnt Pinus pinea forest by FT-IR, Raman and surface-enhanced Raman spectroscopies. J. Mol. Struct. 2011, 994, 155–162. [Google Scholar] [CrossRef]
- Phuphuakrat, T.; Namioka, T.; Yoshikawa, K. Tar removal from biomass pyrolysis gas in two-step function of decomposition and adsorption. Appl. Energy 2010, 87, 2203–2211. [Google Scholar] [CrossRef]
- Lettner, F.; Haselbacher, P.; Timmerer, H.L.; Leitner, P.; Suyitno, S.; Rasch, B. Lastest Results of CLEANSTGAS-Staged Biomass Gasification CHP. In Proceedings of the 15th European Biomass Conference and Exhibition for Research to Market Deployment, Berlin, Germany, 7–11 May 2007; pp. 1–5. [Google Scholar]
- Wiinikka, H.; Wennebro, J.; Gullberg, M.; Pettersson, E.; Weiland, F. Pure oxygen fixed-bed gasification of wood under high temperature (\textgreater1000 °C) freeboard conditions. Appl. Energy 2017, 191, 153–162. [Google Scholar] [CrossRef]
- Brandt, P.; Larsen, E.; Henriksen, U. High Tar Reduction in a Two-Stage Gasifier. Energy Fuels 2000, 14, 816–819. [Google Scholar] [CrossRef]
- González, J.F.; Román, S.; Bragado, D.; Calderón, M. Investigation on the reactions influencing biomass air and air/steam gasification for hydrogen production. Fuel Process. Technol. 2008, 89, 764–772. [Google Scholar] [CrossRef]


| Sign | Name of Each Part | Sign | Name of Each Part |
|---|---|---|---|
| HCS | Exchanger | L | Air |
| FG | Flue gas (Exhausts) | MV | Hot water |
| V | Water | HL | Cold air |
| G | Gas | HV | Cold water |
| Numbers | Names of Each Part of the System |
|---|---|
| 1 | Fuel Feeder (Screw) |
| 2 | Preheated air, gasification aid |
| 3 | Carbonation zone (pyrolysis cone) |
| 4 | Oxidation chamber |
| 5 | Reduction zone (reduction cone) |
| 6 | Cross-section part |
| 7 | Rotating blade (scraper blade) |
| 8 | Pyrolysis gas exhaust gas pump |
| 9 | Grate |
| 10 | Rotary excavator |
| 11 | Drainage of gas |
| 12 | Gas closure outer jacket |
| 13 | Thermal insulation |
| 14 | Gas and solid baffle inner heat resistant jacket |
| 15 | Drive motor |
| 16 | Driveshaft |
| 17 | Closure cover for repair and assembly |
| Performance (KW) | Air Supply (m3/h) | Time (s) | Oxidation Temperature (°C) | Mass Flow of Water (kg/h) |
|---|---|---|---|---|
| 5 | 11.25 | 83.2 | 1165 | 0.43 |
| 5 | 10.50 | 69.2 | 1150 | 0.52 |
| 5 | 10.00 | 55.4 | 1140 | 0.65 |
| 5 | 9.75 | 43.4 | 1136 | 0.83 |
| 5 | 9.25 | 35.6 | 1128 | 1.01 |
| 5 | 8.75 | 30.6 | 1116 | 1.18 |
| 5 | 8.50 | 26.8 | 1080 | 1.34 |
| 5 | 8.50 | 23.8 | 1048 | 1.51 |
| 5 | 8.50 | 21,2 | 1021 | 1.70 |
| 5 | 8.25 | 19.2 | 1010 | 1.88 |
| 5 | 8.12 | 17.8 | 1000 | 2.02 |
| 5 | 8.25 | 16.8 | 1000 | 2.14 |
| Gas Components | H2O (%) | Ai (%) | RG + Ai (%) |
|---|---|---|---|
| CxHy * | 1.91 | 1.37 | 1.89 |
| H2O | 2.00 | 12.10 | 15.20 |
| H2 | 39.80 | 29.44 | 24.50 |
| CH4 | 8.47 | 6.01 | 7.44 |
| CO | 22.00 | 37.98 | 43.20 |
| CO2 | 25.83 | 13.10 | 7.76 |
© 2019 by the authors. Licensee MDPI, Basel, Switzerland. This article is an open access article distributed under the terms and conditions of the Creative Commons Attribution (CC BY) license (http://creativecommons.org/licenses/by/4.0/).
Share and Cite
Fogarassy, C.; Toth, L.; Czikkely, M.; Finger, D.C. Improving the Efficiency of Pyrolysis and Increasing the Quality of Gas Production through Optimization of Prototype Systems. Resources 2019, 8, 182. https://0-doi-org.brum.beds.ac.uk/10.3390/resources8040182
Fogarassy C, Toth L, Czikkely M, Finger DC. Improving the Efficiency of Pyrolysis and Increasing the Quality of Gas Production through Optimization of Prototype Systems. Resources. 2019; 8(4):182. https://0-doi-org.brum.beds.ac.uk/10.3390/resources8040182
Chicago/Turabian StyleFogarassy, Csaba, Laszlo Toth, Marton Czikkely, and David Christian Finger. 2019. "Improving the Efficiency of Pyrolysis and Increasing the Quality of Gas Production through Optimization of Prototype Systems" Resources 8, no. 4: 182. https://0-doi-org.brum.beds.ac.uk/10.3390/resources8040182