1. Introduction
Settlements and urban areas characterize the cores of human activity. Population growth and the related urbanization as well as climate change represent the most relevant developments for the human presence on the planet that challenge our ecologic, societal and economic systems at a global scale. The global population is prospected to increase to 9.8 billion in 2050, and the persistent urbanization process will lead to a constantly growing share of the urban population. In 2007, the urban population exceeded 50% for the first time in history and this proportion will most likely rise to more than 66% in 2050 according to the 2014 revision of the World Urbanization Prospects [
1,
2,
3]. However, the phenomenon of population growth and urbanization is not distributed evenly on our planet since 90% of the total population growth until 2050 will take place in Asia and Africa.
The massive and dynamic growth of population and urban agglomerations plays a key role for environmental monitoring and sustainability frameworks. Therefore, a precise mapping of the current and future human settlements pattern and dynamics—in urban as well as in rural areas and from local to global scale—is essential. Detailed and reliable information on global human settlements can directly contribute to the monitoring and decision making regarding the 2030 Agenda for Sustainable Development and provides relevant data for the Sustainable Development Goals (SDG), specifically SDG 11 [
4]. The Urban Sustainability Framework (USF) of the World Bank points out the relevance of data on urban development for sustainable planning processes [
5]. Besides those well-known frameworks, many other assessment tools exist on regional and national level to measure sustainability in urban development [
6,
7,
8].
Earth observation (EO) is capable of providing information on human settlements and urban agglomerations on a global scale and allows monitoring their development. Potere et al. [
9,
10] provide comprehensive overview global information products on human settlements, which often are derived of medium resolution multispectral imagery like the MODIS 500 and the GlobCover 2009 land cover maps [
11,
12]. Potere et al. [
9] report enormous variations in the total global urban extent of the different products and identify three main reasons: (i) the varying production dates of the maps, (ii) different spatial resolutions of the utilized data, and (iii) the diverse class descriptions of urban land use. In addition, the accuracy in detecting and classifying small and scattered settlements is low for all compared products. Miyazaki et al. [
13] demonstrated the integrated analysis of ASTER multispectral images and existing GIS data to process a global HR settlement mask. Ban et al. [
10] utilized a robust processing chain for a method based on spatial indices and Grey Level Co-occurrence Matrix (GLCM) textures developed by Gamba and Lisni [
14] on ENVISAT ASAR C-band data. Wieland and Pittore [
15] applied an object-based analysis on Support Vector Machine (SVM)-based pattern recognition on Landsat-8 images over large areas. The Global Human Settlement Layer (GHSL) was proposed by the European Joint Research Center (JRC). The built-up areas are semi-automatically extracted from several Landsat for three timesteps [
16]. More recently, they tested also the application of Sentinel-1 C-band radar data for the GHSL [
17]. Liu et al. [
18] derived multitemporal urban settlement products for the period of 1990 to 2010 by utilizing the Landsat archive in the Google Earth Engine (GEE) and deriving the Normalized Urban Areas Composite Index (NUACI). The World Urban Database and Access Portal Tools (WUDAPT) initiative focuses on a global urban database for Local Climate Zones (LCZ) classifications of urban areas [
19,
20].
The TerraSAR-X (TSX) and Tandem-X (TDX) mission and image archive provides another source of high-resolution satellite images with global coverage. Two years prior to the launch of TSX X-band microwave satellite system, Roth et al. [
21] already raised the question “TerraSAR-X—How can high-resolution SAR data support the observation of urban areas?” in 2005. They assumed that TSX will enable the detection and mapping of buildings and transport infrastructure, as well as the assessment of disaster damage and detection of ground motions applying differential interferometry and persistent scatterer techniques in urban areas. Succeeding research of various groups worldwide proofed these assumptions correct [
22,
23,
24,
25,
26]. In preparation for the TSX mission, Esch [
27] validated the potential of high-resolution X-band data for the automated mapping of settlement areas. In the following years, the methodology was improved and operationalized [
28,
29,
30], finally boosted by the launch of the TDX mission [
31]. The methodology was then applied at a global scale and resulted in the Global Urban Footprint (GUF) dataset with a spatial resolution of 12 m [
32,
33]. Considering this evolution and the more than 10 years of experience in the SAR-based mapping of built-up areas, this paper aims at providing a summary of the major achievements and intended future developments of the GUF initiative and product, respectively. Hence, a first section details the data base and methodological concept of the UFP processing and analysis framework (
Section 2.1). Next, the basic product characteristics of the generated GUF dataset and the first-time results of a global validation campaign (
Section 2.2) are presented, followed by first statistics on the global human settlements distribution derived from the GUF layer (
Section 2.3).
Section 3 then focuses on the user perspective by analyzing the 300 requests for GUF data that have been submitted since the first release of the product in November 2016 (
Section 3). Finally, the conclusions are drawn, and an outlook on the GUF follow-on activities and products is given. Considering this content, the presented contribution is expected to provide an overview of the state-of-the-art global settlement mapping and the potentials of global, continental and regional analyses of the urban system and development.
2. Global Urban Footprint—Pushing the Limits of Mapping Human Settlements from Space
Strengthened by the promising results of diverse studies on the use of SAR data for detecting and delineating human settlements, the German Aerospace Center (DLR, Cologne, Germany) initiated the Global Urban Footprint campaign [
31]. This initiative aimed at the generation of a so far unprecedented worldwide map of human settlements that would for the first time also include a significant proportion of the small-scale rural settlements in addition to the comparably large structures of cities and urban clusters already covered by other data sets available at that time.
2.1. Data Base and Processing Framework
In the context of the GUF campaign, the constellation of the identically constructed TerraSAR-X and TanDEM-X satellites was utilized to collect a global coverage of SAR imagery within a comparably short period of time. In detail, a total of 182,249 single look complex (SSC) images was acquired in StripMap mode with 3 m ground resolution between 2011 and 2012 (93% of the global coverage), completed by some final additions collected in 2013–2014. The volume of this input data set adds up to 308 TB. Considering all auxiliary data used and intermediate products generated during GUF processing, the UFP framework had to handle >20 million files with a total volume of >400 TB.
2.1.1. Urban Footprint Processor
The production of the GUF layer is based on a fully automatic, generic and autonomous processing environment orchestrating an extensive suite of processing and analysis modules: the Urban Footprint Processor (UFP). Basically, the UFP consists of five main technical modules covering functionalities for data management, feature extraction, unsupervised classification, mosaicking, and automatic post-editing. The systems design and implementation of the UFP was first described by Esch et al. [
33]. Additional modifications are geared towards the elimination of false positives during post-editing and are detailed in Esch et al. [
32].
2.1.2. Data Management
The UFP is implemented at DLR’s German Remote Sensing Data Center (DFD, Oberpfaffenhofen, Germany) and deployed on two basic processing platforms: a Sun cluster on the one hand and a Calvalus cluster on the other. The Sun Fire X4640 machine with eight CPUs is used for feature extraction and unsupervised classification. Processing on the Sun cluster is orchestrated by DLR’s Processing System Management (PSM) described in further detail by Böttcher et al. [
34]. Digital Elevation Model (DEM) data required in the GUF analysis process are obtained through the W42 Raster Data Repository, which provides a best-of-DEM for any given area from different sources such as SRTM or ASTER [
35]. The Calvalus cluster [
36] based on Apache Hadoop consists of 50 compute nodes and is employed to for the mosaicking and post editing modules of the UFP.
2.1.3. Feature Extraction
Characteristic properties of SAR data in built environments arise from the high local image heterogeneity that originates from intense backscatter plus shadow effects around vertical structures. This texture directly relates to the presence of buildings or any structure with a distinct vertical component. To define this local image heterogeneity or texture the UFP calculates the so-called speckle divergence feature, which is defined as the ratio between the local standard deviation and local mean of the backscatter computed in a given local neighborhood. A detailed description of the feature extraction algorithm is provided in Esch et al. [
33].
2.1.4. Unsupervised Classification
The classification procedure couples an analysis of the original backscatter amplitude data and the derived local texture image. For that purpose, an unsupervised classification method based on advanced Support Vector Data Description (SVDD) one-class classification was implemented as described in detail in Esch et al. [
33]. For each single scene, the approach identifies the optimal settings for the classification by using training samples that are automatically identified based on thresholds derived from image statistics of the amplitude and texture data, respectively.
The SVDD technique aims at (i) determining the hypersphere with minimum radius enclosing all the training samples available for the built-up class and (ii) finally associating all the unknown samples falling inside the boundary with it. This approach allows increased generalization and obtains a more consistent and reliable GUF map [
33]. The outcome of the classification procedure is a binary raster layer indicating the class built-up area and the category non-built-up for any other region. The resulting GUF masks reflect the detailed building distribution and not the impervious surface that is usually resulting from built-up area extractions based on (multi-)spectral satellite imagery.
In order to compensate effects of over- or underestimation caused by specific land cover types, environmental conditions or acquisition constellations, six additional GUF raw versions with systematically altered classification settings were generated. Therefore, the speckle divergence threshold initially defined by the automated estimation procedure is systematically increased, respectively decreased three times, by 200 DN with each step, resulting in three increasingly stricter (levels 3, 2, 1) as well as three more relaxed (levels 5, 6, 7) classification versions. The initial classification result based on the automatically defined threshold is represented by level 4. If the underlying speckle divergence threshold for the level 4 was 2000, the corresponding values are 2200 for level 3, 2400 for level 2, 2600 for level 1, and 1800 for level 5, 1600 for level 6 and 1400 for level 7, respectively. Hence, the different GUF versions can be considered as varying confidence levels—from level 3 to level 1 the completeness will decrease while reliability increases (increasing error of omission, decreasing error of commission) and vice versa from level 5 to level 7 [
32].
2.1.5. Mosaicking
In order to provide more manageable working units for the post-editing procedure, all seven individual GUF raw masks or confidence levels, respectively, were merged from their original image geometry to tiles of 5° × 5° geographical latitude and longitude. During mosaicking the overlapping areas of several individual scenes were aggregated by means of a majority vote for the binary classification assignment of each single pixel (built-up, non-built-up) and for each individual GUF level. If a certain area of the mosaic is, for instance, covered by four different scenes, there are four classifications available for each confidence level in that overlap region. Separately for each individual confidence level, the pixels of the overlap areas are therefore finally assigned the dominating classification outcome (e.g., if the pixel is three times labelled as “built-up” and only in one scene as “non-built”, the pixel is finally assigned as “built-up” in corresponding GUF level of the mosaic). As a result, each tile comprises seven GUF bands in the geometric resolution of 0.4″ (12 m), or approaching the poles, in correspondingly lower longitudinal resolutions—e.g., 0.6″ between 50°N and 60°N [
32].
2.1.6. Automated Post-Editing
The automated post-editing stage of the GUF production is split-up into two phases. Image segmentation based on Chang et al. [
37] transfers all clusters of connected pixels classified as built-up in each of the seven GUF raw raster layers (confidence levels) into individual image objects and a corresponding set of descriptive attributes. After that, a rule-based approach implemented in Python selects the appropriate local GUF confidence level and finally removes all GUF segments from the resulting collection that most likely represent false alarms.
Nine global reference layers were used for the optimal GUF level definition as well as for the formulation of exclusion or inclusion criteria in the context of false alarms identification [
32]. Two of them, TimeScan-ASAR (DLR-TSA) and TimeScan-Landsat (DLR-TSL), are GeoTIFF in float formatting [
38], and the others (OSM-Settlements, OSM-Roads, GL30-Settlements, DLR-ReliefMap, DLR-RoadCluster, CIL, and NLCD) are binary masks derived from defined thresholds or specific classes of selected source data sets, namely Open Street Map, GL30, SRTM/ASTER, Copernicus Imperviousness Layer, and US National Land Cover Dataset. The reference layers are merged by summing up the number of positive reference counts: a value of 1 representing a built-up area is assigned if at least two out of seven binary masks are positive; otherwise, it is discarded and set to 0.
Next, for each single GUF object at each confidence level, it is calculated to what part of the reference layer intersects with the GUF object. The optimal GUF version (level 1–7) is determined for an entire 5° × 5° tile by analyzing the overlap calculated above. Empirical tests on the basis of local ground truth data available for various globally distributed test regions indicated that overestimation usually starts as soon as two-thirds of the GUF object area corresponds with the reference data. The optimal confidence level is chosen when the majority of all GUF objects of a tile satisfy the 66%-rule.
The final step of the post-editing phase includes a procedure to identify and eliminate false alarms that might still be present in the previously selected best-fitting GUF layer by applying exclusion masks, thresholds regarding NDVI, and mean temporal backscatter. GUF features with high NDVI (e.g., highly textured forests), low temporal backscatter (e.g., rice fields), and an overlap exceeding a certain percentage with exclusion features (e.g., water areas) are removed.
It should be stressed that no correction procedure ever introduces features that do not originate from the original SAR data and classification procedure.
2.2. GUF Product Specification and Validation
The GUF data produced by the UFP processor is provided as 8-bit, LZW-compressed GeoTIFF with a value of 255 indicating built-up area, a value of 0 representing all non-built-up areas, and no data assigned by value 128. Near the equator, the geometric resolution of the GUF product is 0.4″ (which corresponds to 12 m per pixel), whereas the resolution decreases toward the poles (0.6″ between 50°–60°N/S, 0.8″ from 60°–70°N/S, and 1.2″ > 80°N/S). The projection is Geographic coordinates (lat/lon). Due to the TerraSAR-X/TanDEM-X data policy of the underlying Public Private Partnership between DLR and Airbus DS, the full resolution GUF layer is freely available for scientific use, whereas any nonscientific/non-commercial application can use a GUF version with a resolution of 2.8″ (84 m near the equator). For commercial GUF use cases, Airbus DS has to be contacted. The generalized GUF version in 2.8″ is directly derived from the 0.4″ version by assigning a value of 255 (= built-up) to all pixels whose coverage contains a proportion of >25% GUF area as defined by the original 0.4″ data.
The very high accuracy and reliability of the GUF layer have already been discussed in [
32] for a set of 12 different test locations. Nevertheless, this mostly included largely urbanized areas, hence not fully characterizing the many existing settlement patterns scattered around the globe. To overcome this limitation, a new broader and more comprehensive validation set has been produced in collaboration with Google for a collection of 50 globally distributed test sites (tiles of 1° × 1° lat/lon each) including a total of ~900,000 reference points. This activity is part of a currently on-going campaign for assessing the quality of the current state-of-the-art global human settlements maps, in particular, the novel World Settlement Footprint (WSF) 2015. The WSF2015 is a 10 m spatial resolution global map outlining the 2015 settlement extent that has been newly generated at DLR by jointly exploiting multitemporal optical Landsat-8 and radar Sentinel-1 imagery [
39]. To include a representative population of settlement patterns in the global accuracy assessment, the 50 tiles have been selected in a way that there are tiles assigned to all continents and that they cover the full range of potential “settlement densities” (defined by the ratio between the number of settlements within each tile—i.e., disjoint clusters of pixel assigned as built-up, with the WSF2015 being used as a basis—and their total area). For all selected tiles, 2000 locations were randomly extracted and used as the center of a 3 × 3 block sampling units whose nine cells show a size of 10 × 10 m each. Next, each cell has been labelled by crowd-sourcing via photointerpretation of 2015 very high resolution (VHR) imagery available from Google Earth. In particular, it has been marked as settlement only if it intersects a building defined—according to United Nations [
40]—as any structure having a roof supported by columns or walls and intended for the shelter, housing, or enclosure of any individual, animal, process, equipment, goods, or materials of any kind. Overall, due to the lack in some few cases of reference cloud-free VHR data, it was possible to label 892,926 cells, of which 137,910 (15.44%) have been marked as settlement, and the remaining 755,016 (84.56%) as non-settlement.
Table 1 reports the kappa coefficient, as well as percentage overall (OA%), user’s (UA%) and producer’s (PA%) accuracies exhibited against the above-mentioned validation set by: the GUF 0.4″ and GUF 2.8″, and a selection of comparable, frequently referenced layers such as GHSL, GL30, and the MODIS500. Here, given the different spatial resolution of the datasets, each cell of the block sample units has been considered as settlement if the intersection with the given settlement layer at hand (GUF 0.4″, GUF 2.8″, GHSL, GL30, or MODIS500, respectively) showed any built-up assignment. It is worth noting that, despite changes might have occurred over time, we reasonably expect that these do not sensibly affect the figures exhibited by the GUF and the GHSL (derived from imagery acquired in 2012–2013 and 2014, respectively). Instead, results shown by GL30 and, especially, MODIS500 (generated from 2010 and 2001–2002 imagery, respectively) might be more significantly affected. A more comprehensive documentation and discussion of the global (cross-)validation campaign and its findings—also including additional layers such as CIESIN’s HBase [
41] and the multi-temporal urban land products presented by Liu et al. [
18]—is currently being conducted by the authors and a dedicated publication is planned for 2018.
As one can immediately notice, the difference between the GUF 0.4″ and GUF 2.8″ is very limited for all six considered accuracy measures (i.e., on average lower than 2%), hence confirming that the spatially reduced version shows a level of detail and quality almost identical to the full-resolution product [
32]. All layers exhibit relatively high OA% (with the GUF 0.4″ being the only one exceeding 90); nevertheless, such measure is not particularly meaningful in our case where the vast majority of reference cells belongs to the non-settlement class (i.e., an “empty” map where no pixel is marked as settlement would result in 84.56 OA%). Instead, when analyzing the Kappa coefficient (which is derived also by accounting for both omission and commission errors with respect to simple agreement calculation) it is evident that the GUF outperforms the other three layers (with an increase for the GUF 0.4″ higher than 0.16 with respect to both GHSL and GL30 and about 0.4 with respect to MODIS500). This occurs especially in the light of the better capability in detecting true built-up areas, corresponding to a PA% for the settlement class greater than 70 (i.e., about +25, +27, and +50 with respect to GHSL, GL30, and MODIS500, respectively, which exhibited severe underestimation issues).
2.3. The State of Global Urbanization—First Figures Derived from the GUF Data
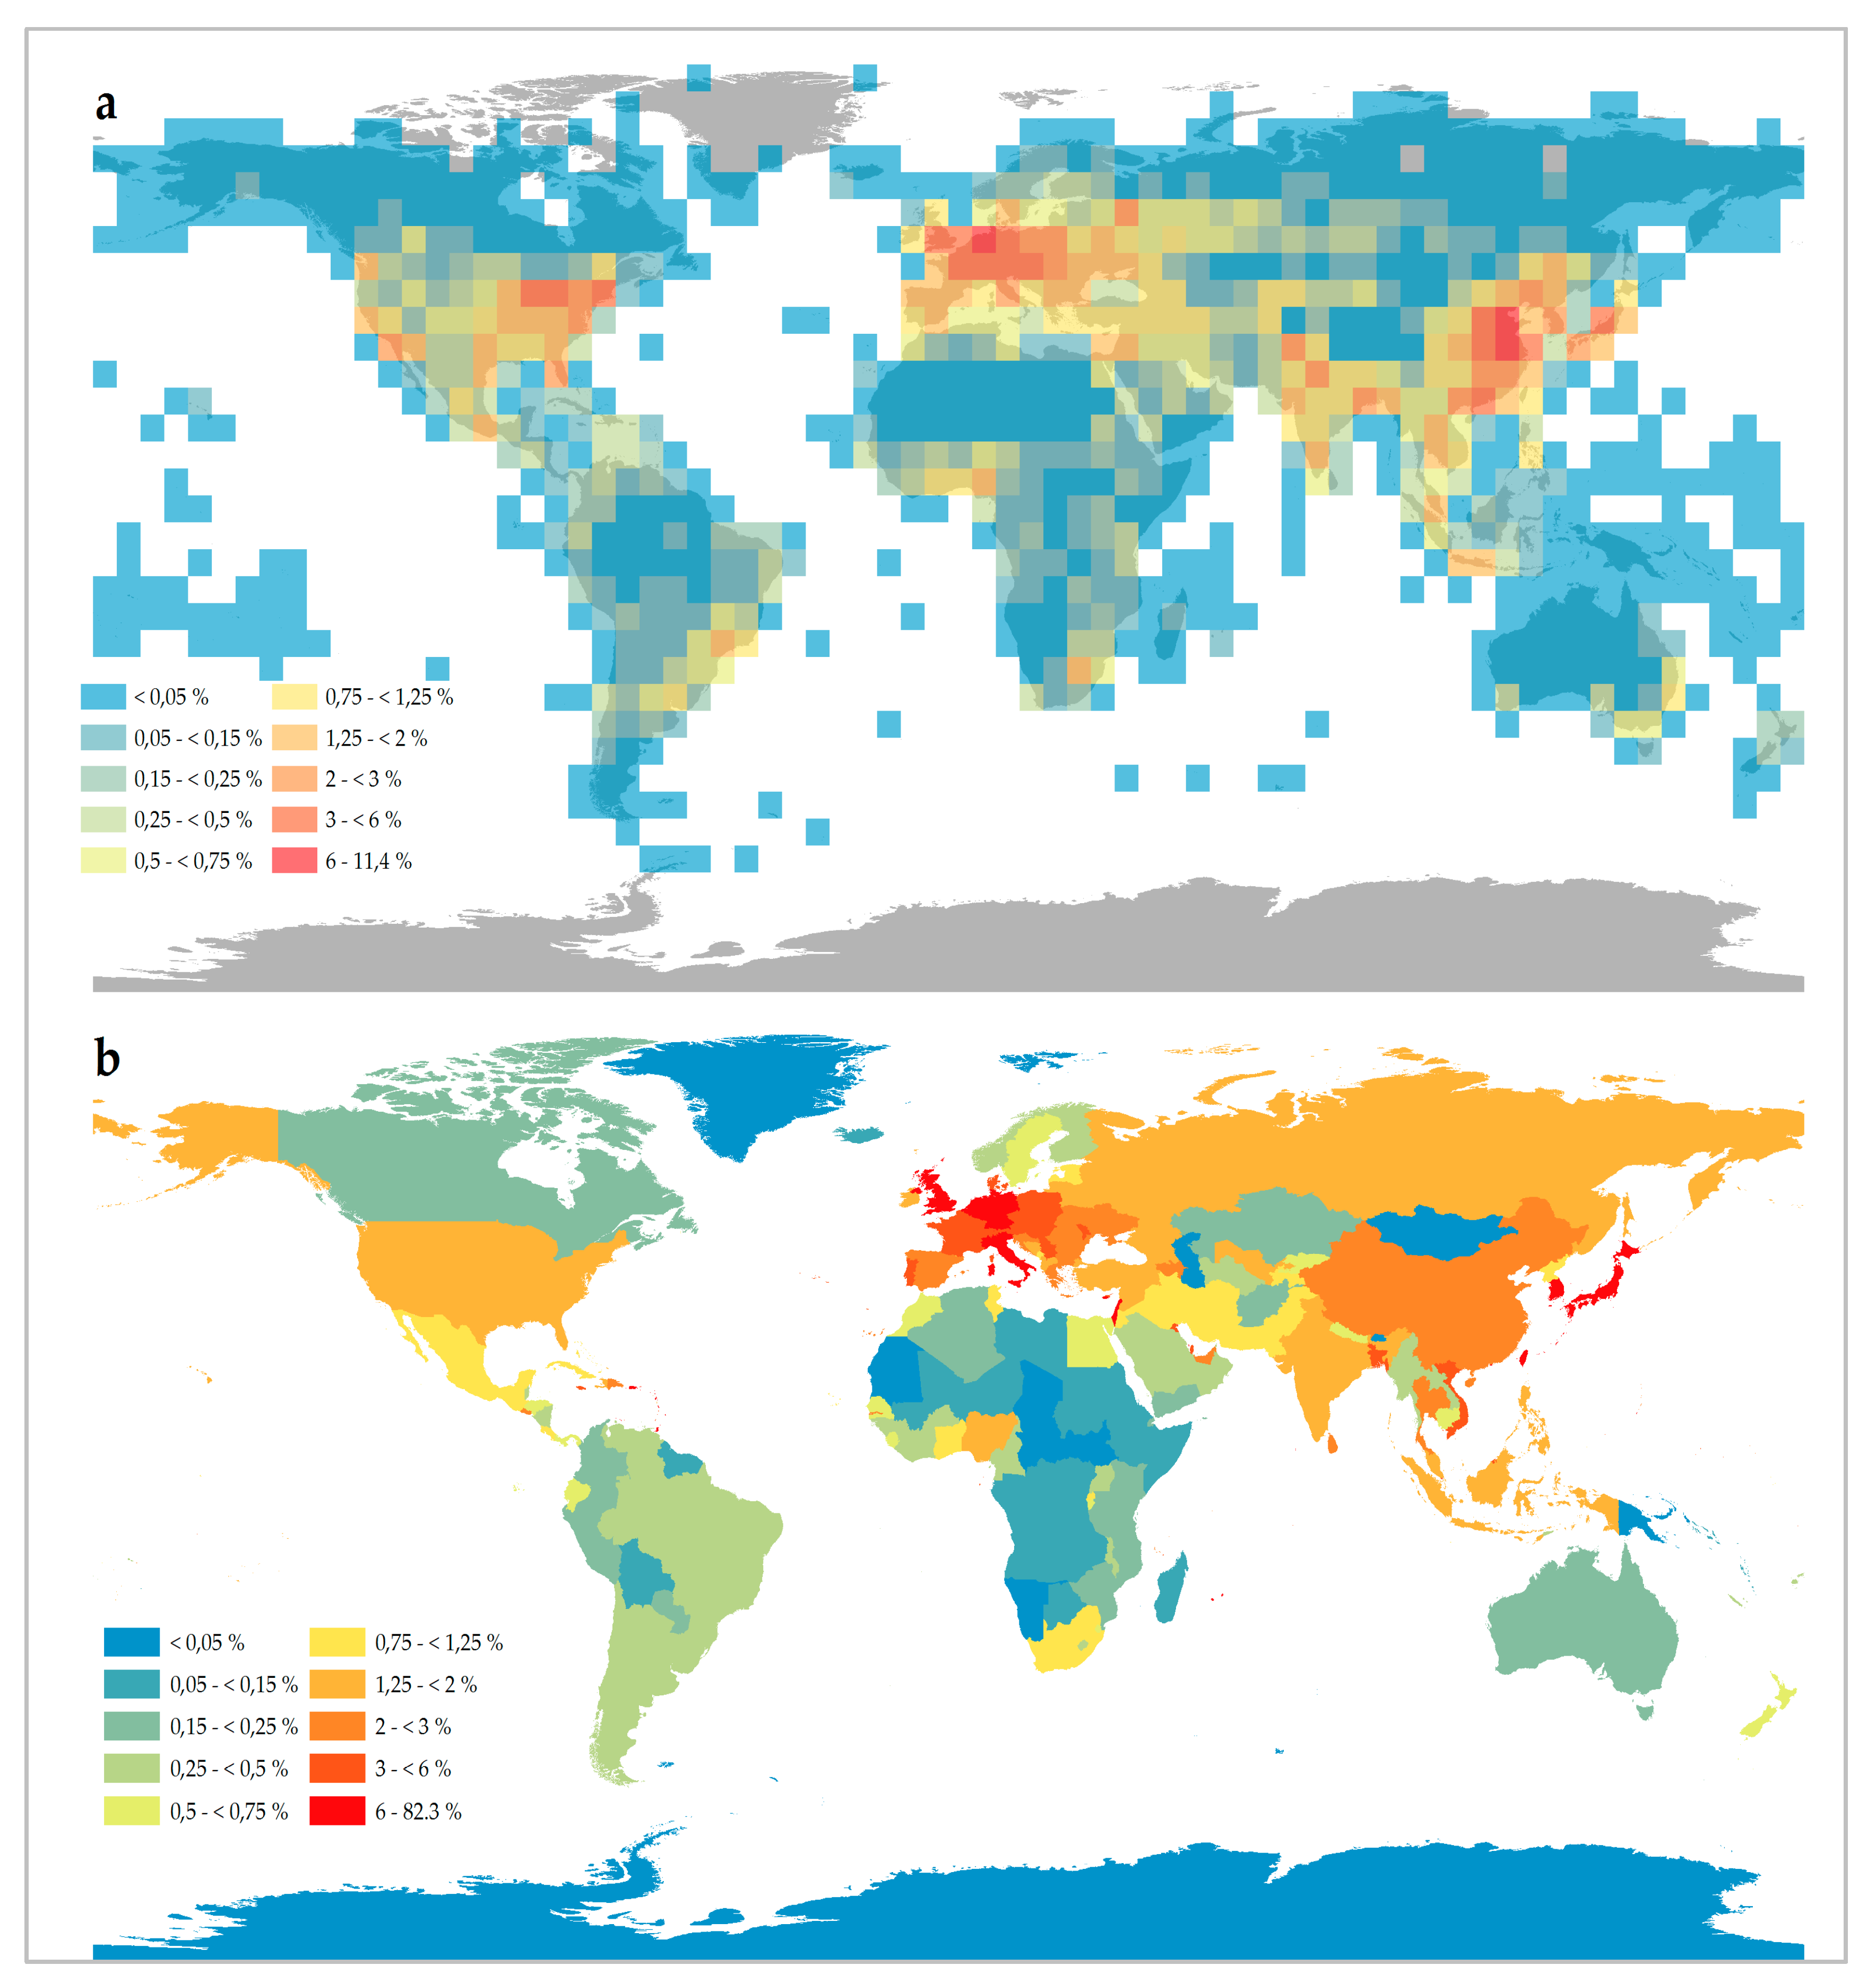
A global analysis of the GUF layer indicates a total global built-up area of 834,260 km
2 which represents approximately 0.64% of the Earth’s land surface. At continental scale Europe shows the highest proportion of built-up area per land surface (1.52%), whereas in Australia only 0.12% of the land mass is covered by settlements. In Asia 0.71%, North America 0.46%, South America 0.31%, and Africa 0.25% of the land surface falls upon built-up area.
Figure 1a depicts the percentage of GUF pixels for a raster of 5° × 5° degrees (lat/lon) tiles. Therefore, the highest share of GUF pixels (11.44%) is detected for the tile covering the larger urban region of the city of Beijing, China. In general, the analysis shows that the highest densities of built-up area per tile occur in China, Central-Europe, the north-east USA and India. The pattern over Europe reveals continuous high percentages of >1% for almost all tiles except for those covering Iceland and Scandinavia, with the highest value observed for the tile covering the Ruhr region in Germany and parts of Netherland and Belgium.
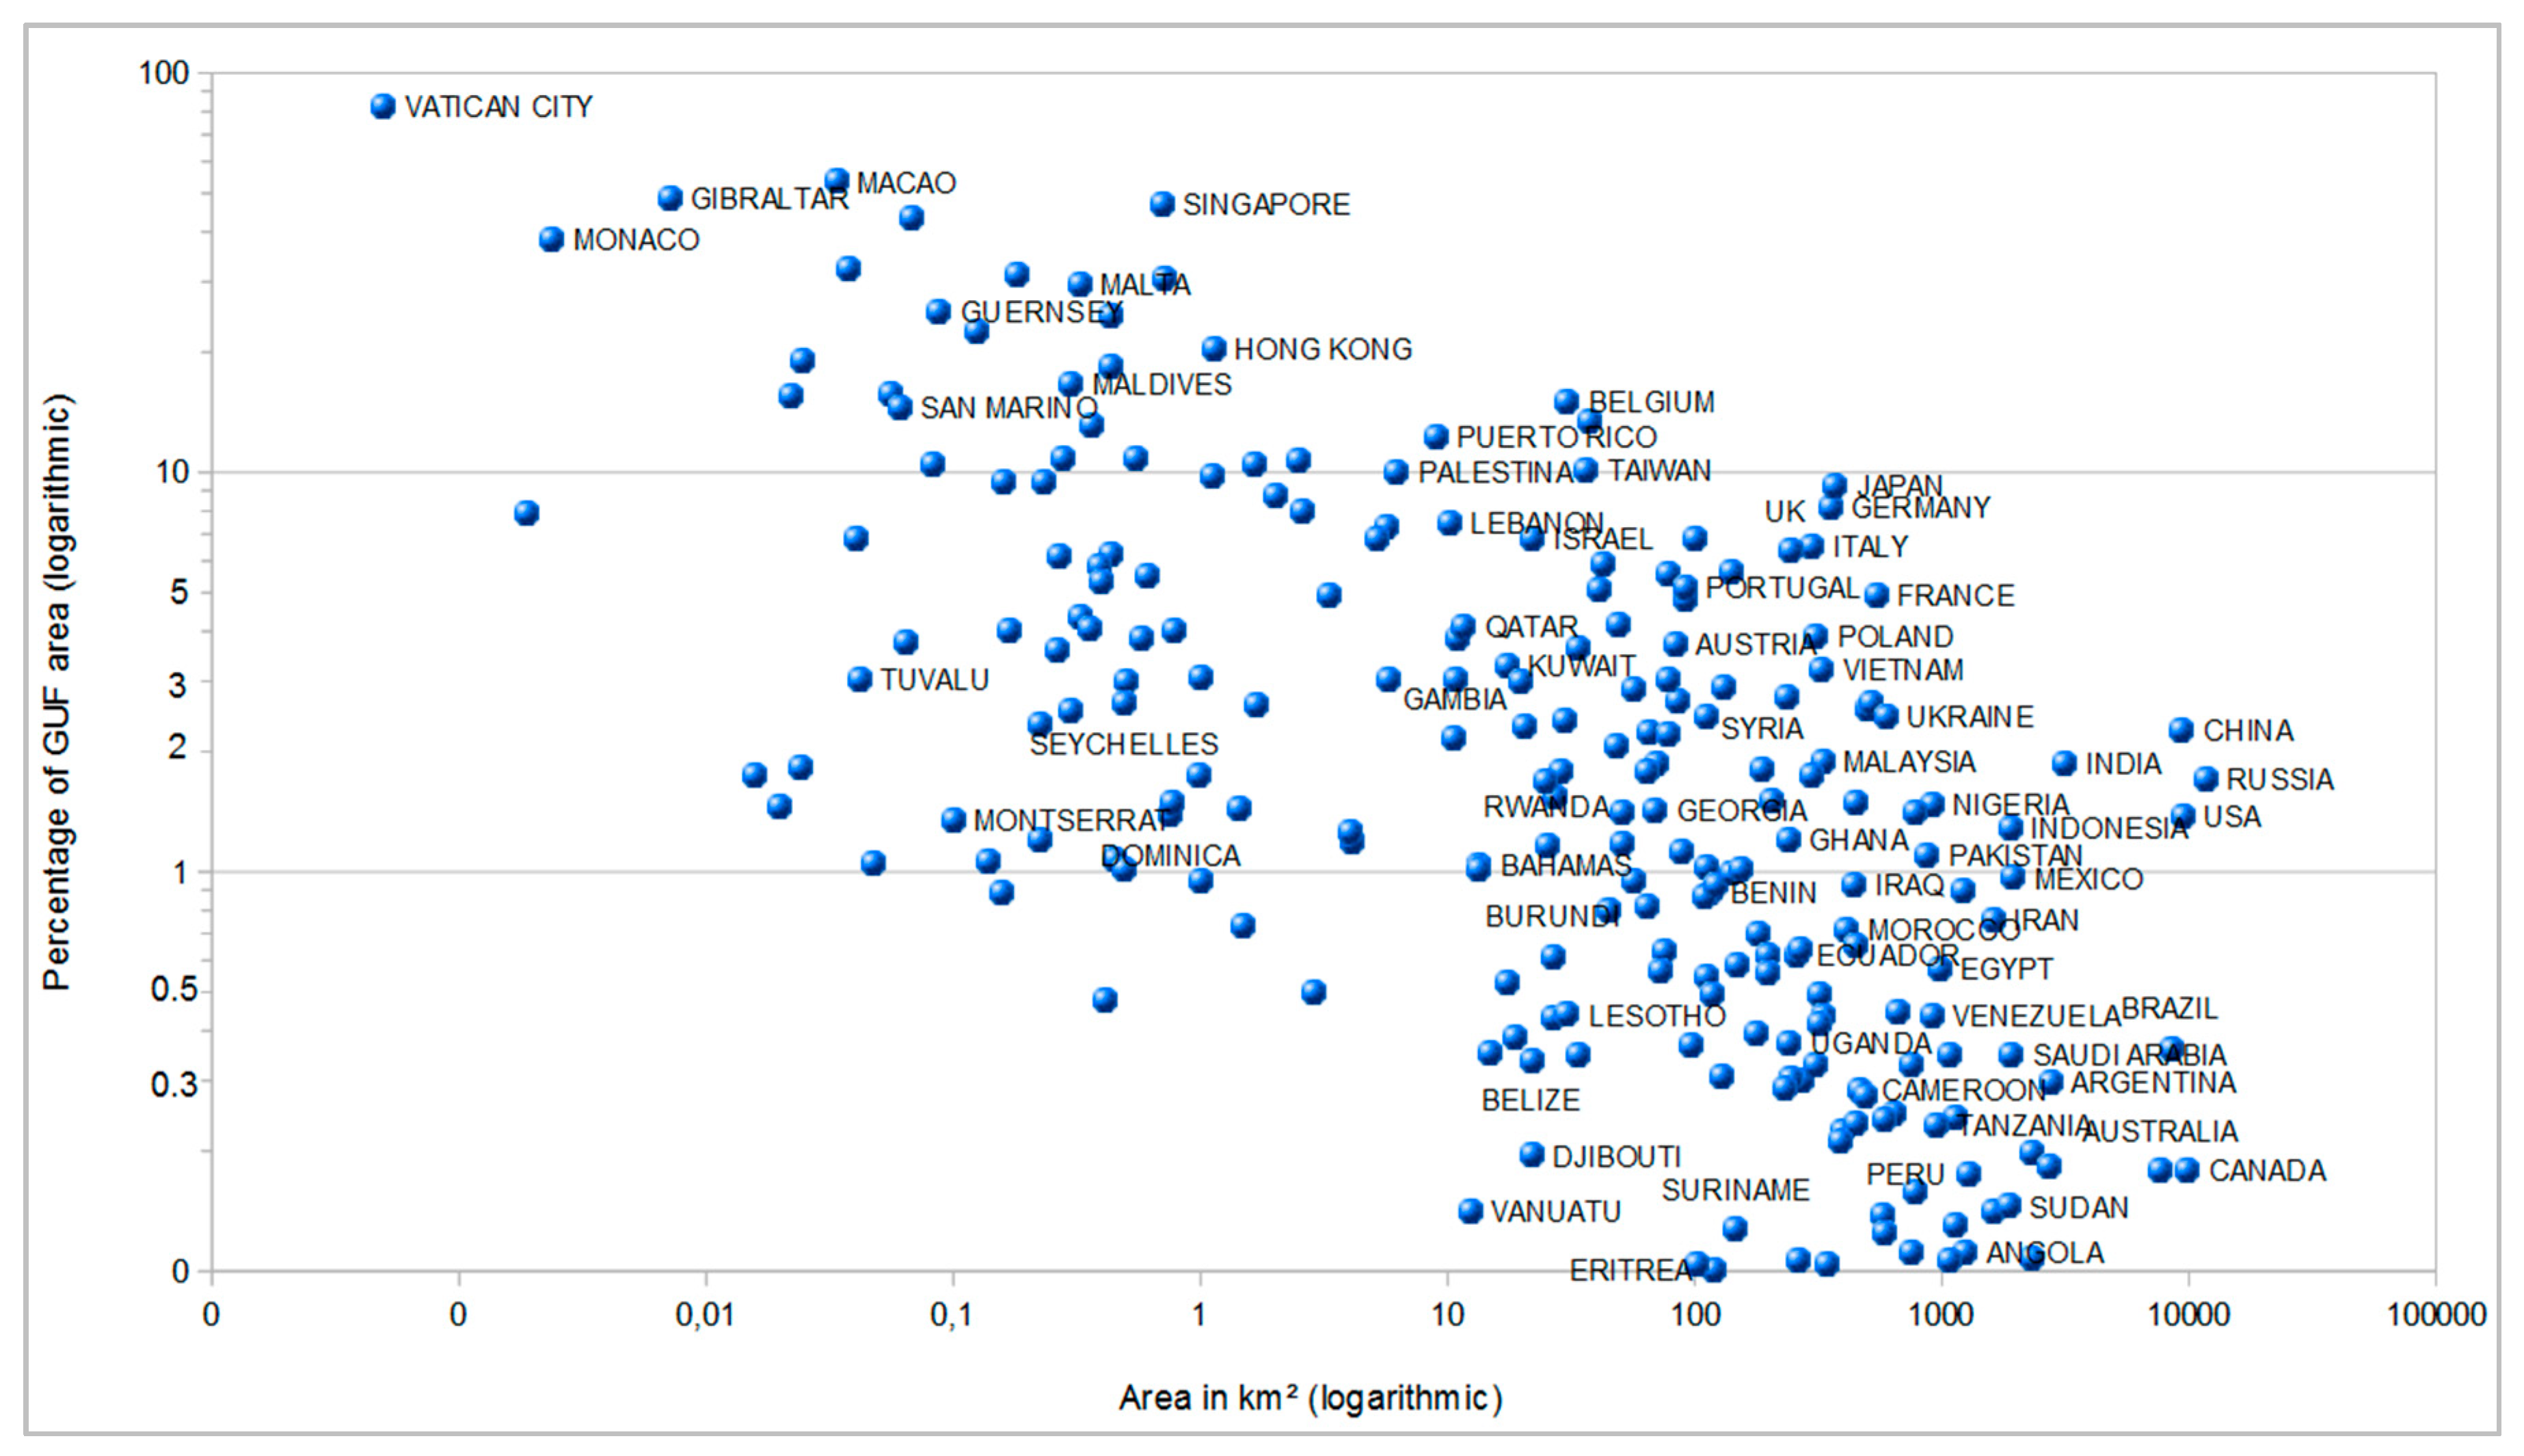
Figure 1b illustrates the percentage of settlement area (defined by GUF coverage) for the administrative units of countries. The use of these national boundaries as an alternative to the 5 × 5° lat/lon tiles leads to a spatial homogenization of the information (at least within each country) so that the distribution of the urban agglomerations and the low density rural areas are finally blurred. However, this representation is more appropriate for (future) studies that aim at combining the information on the human settlement area with other data sources such as socio-economic or population-related statistics which are normally collected and related to administrative units. The scatterplot provided in
Figure 2 highlights that—as expected—the city-states show the highest share of settlement area in relation to the country area, whereas large-area states feature a comparably low proportion of settlement area compared to the total area of the country.
3. The User Perspective—Precise Data for Evidence-Based Planning and Decision Making
Since the release of the Global Urban Footprint (GUF) dataset in November 2016, more than 300 institutions have requested the corresponding thematic data (record date: 31 December 2017). Due to the data policy defined in the PPP between DLR and Airbus DS, a pre-requisite to get access to the GUF layer is the submission of a filled License Agreement and Order Form that also includes a short questionnaire. Based on an analysis of the questionnaires received in the first year of GUF delivery, the team was able to develop a comprehensive picture of the requirements and application scenarios—and therewith the societal benefit—of the new global dataset. The results of this survey are presented in this section.
In general, 260 out of the 300 data requests were positively evaluated and the users could be provided with the GUF data. Only four requests had to be rejected because the use scenario described a commercial application or challenged the commercial license exclusively granted to Airbus DS. Another 40 requests could not be successfully processed yet due to a missing or incomplete order form, an unspecified area of interest, etc. From all requests, 182 aimed at the 0.4″ version (scientific use), and 103 wanted access to the 2.8″ dataset. 33 users requested the GUF in both resolutions.
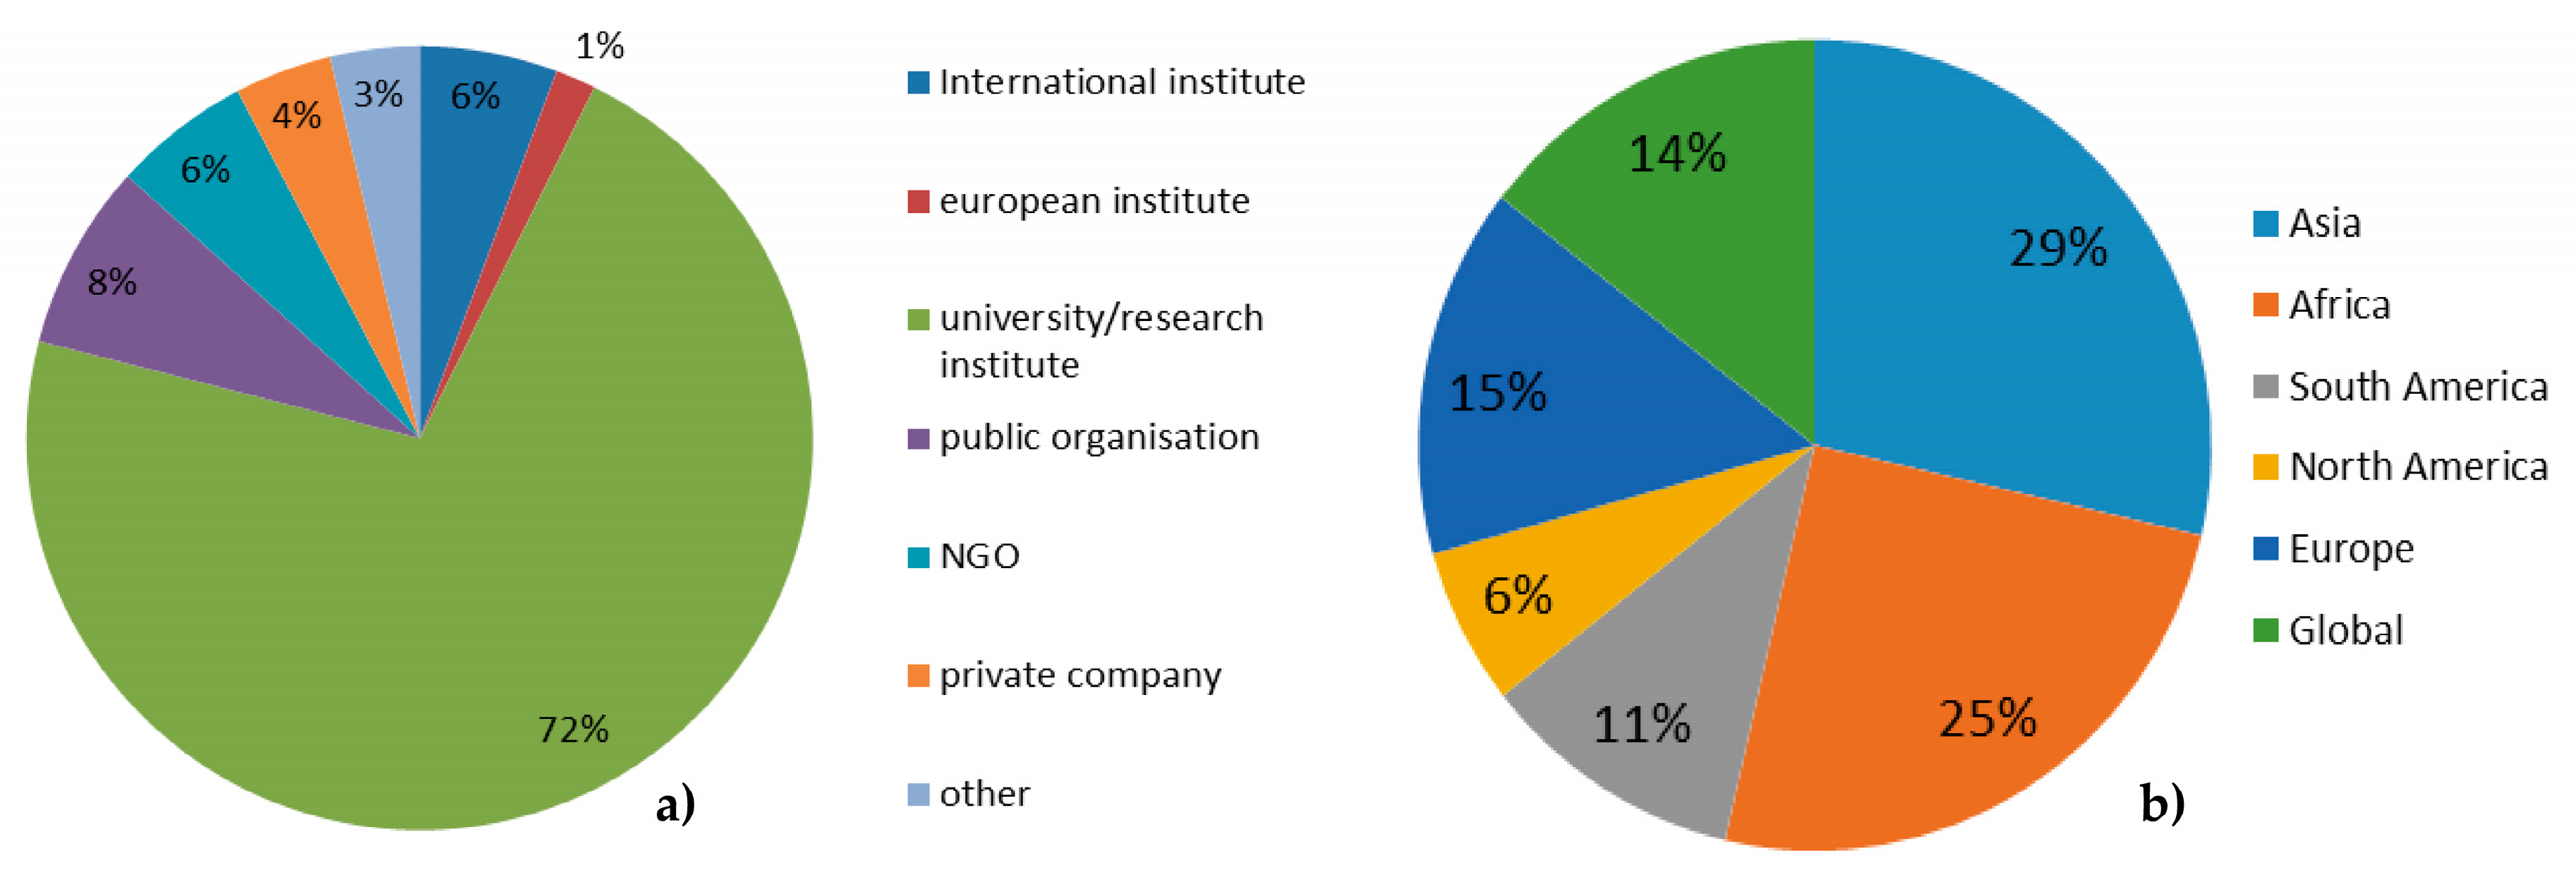
Figure 3a indicates that 72% of the GUF users are affiliated with a university or a research institute, 21% with non-profit NGOs, public organizations and international or European institutions, and only 4% with private companies. From these users, 62% of the requests had a clear scientific objective, and 17% a non-profit background. Eight percent of the users indicated both options. For the remaining 10%, no use type was specified. The provenience of the institutions requesting the GUF is shown in
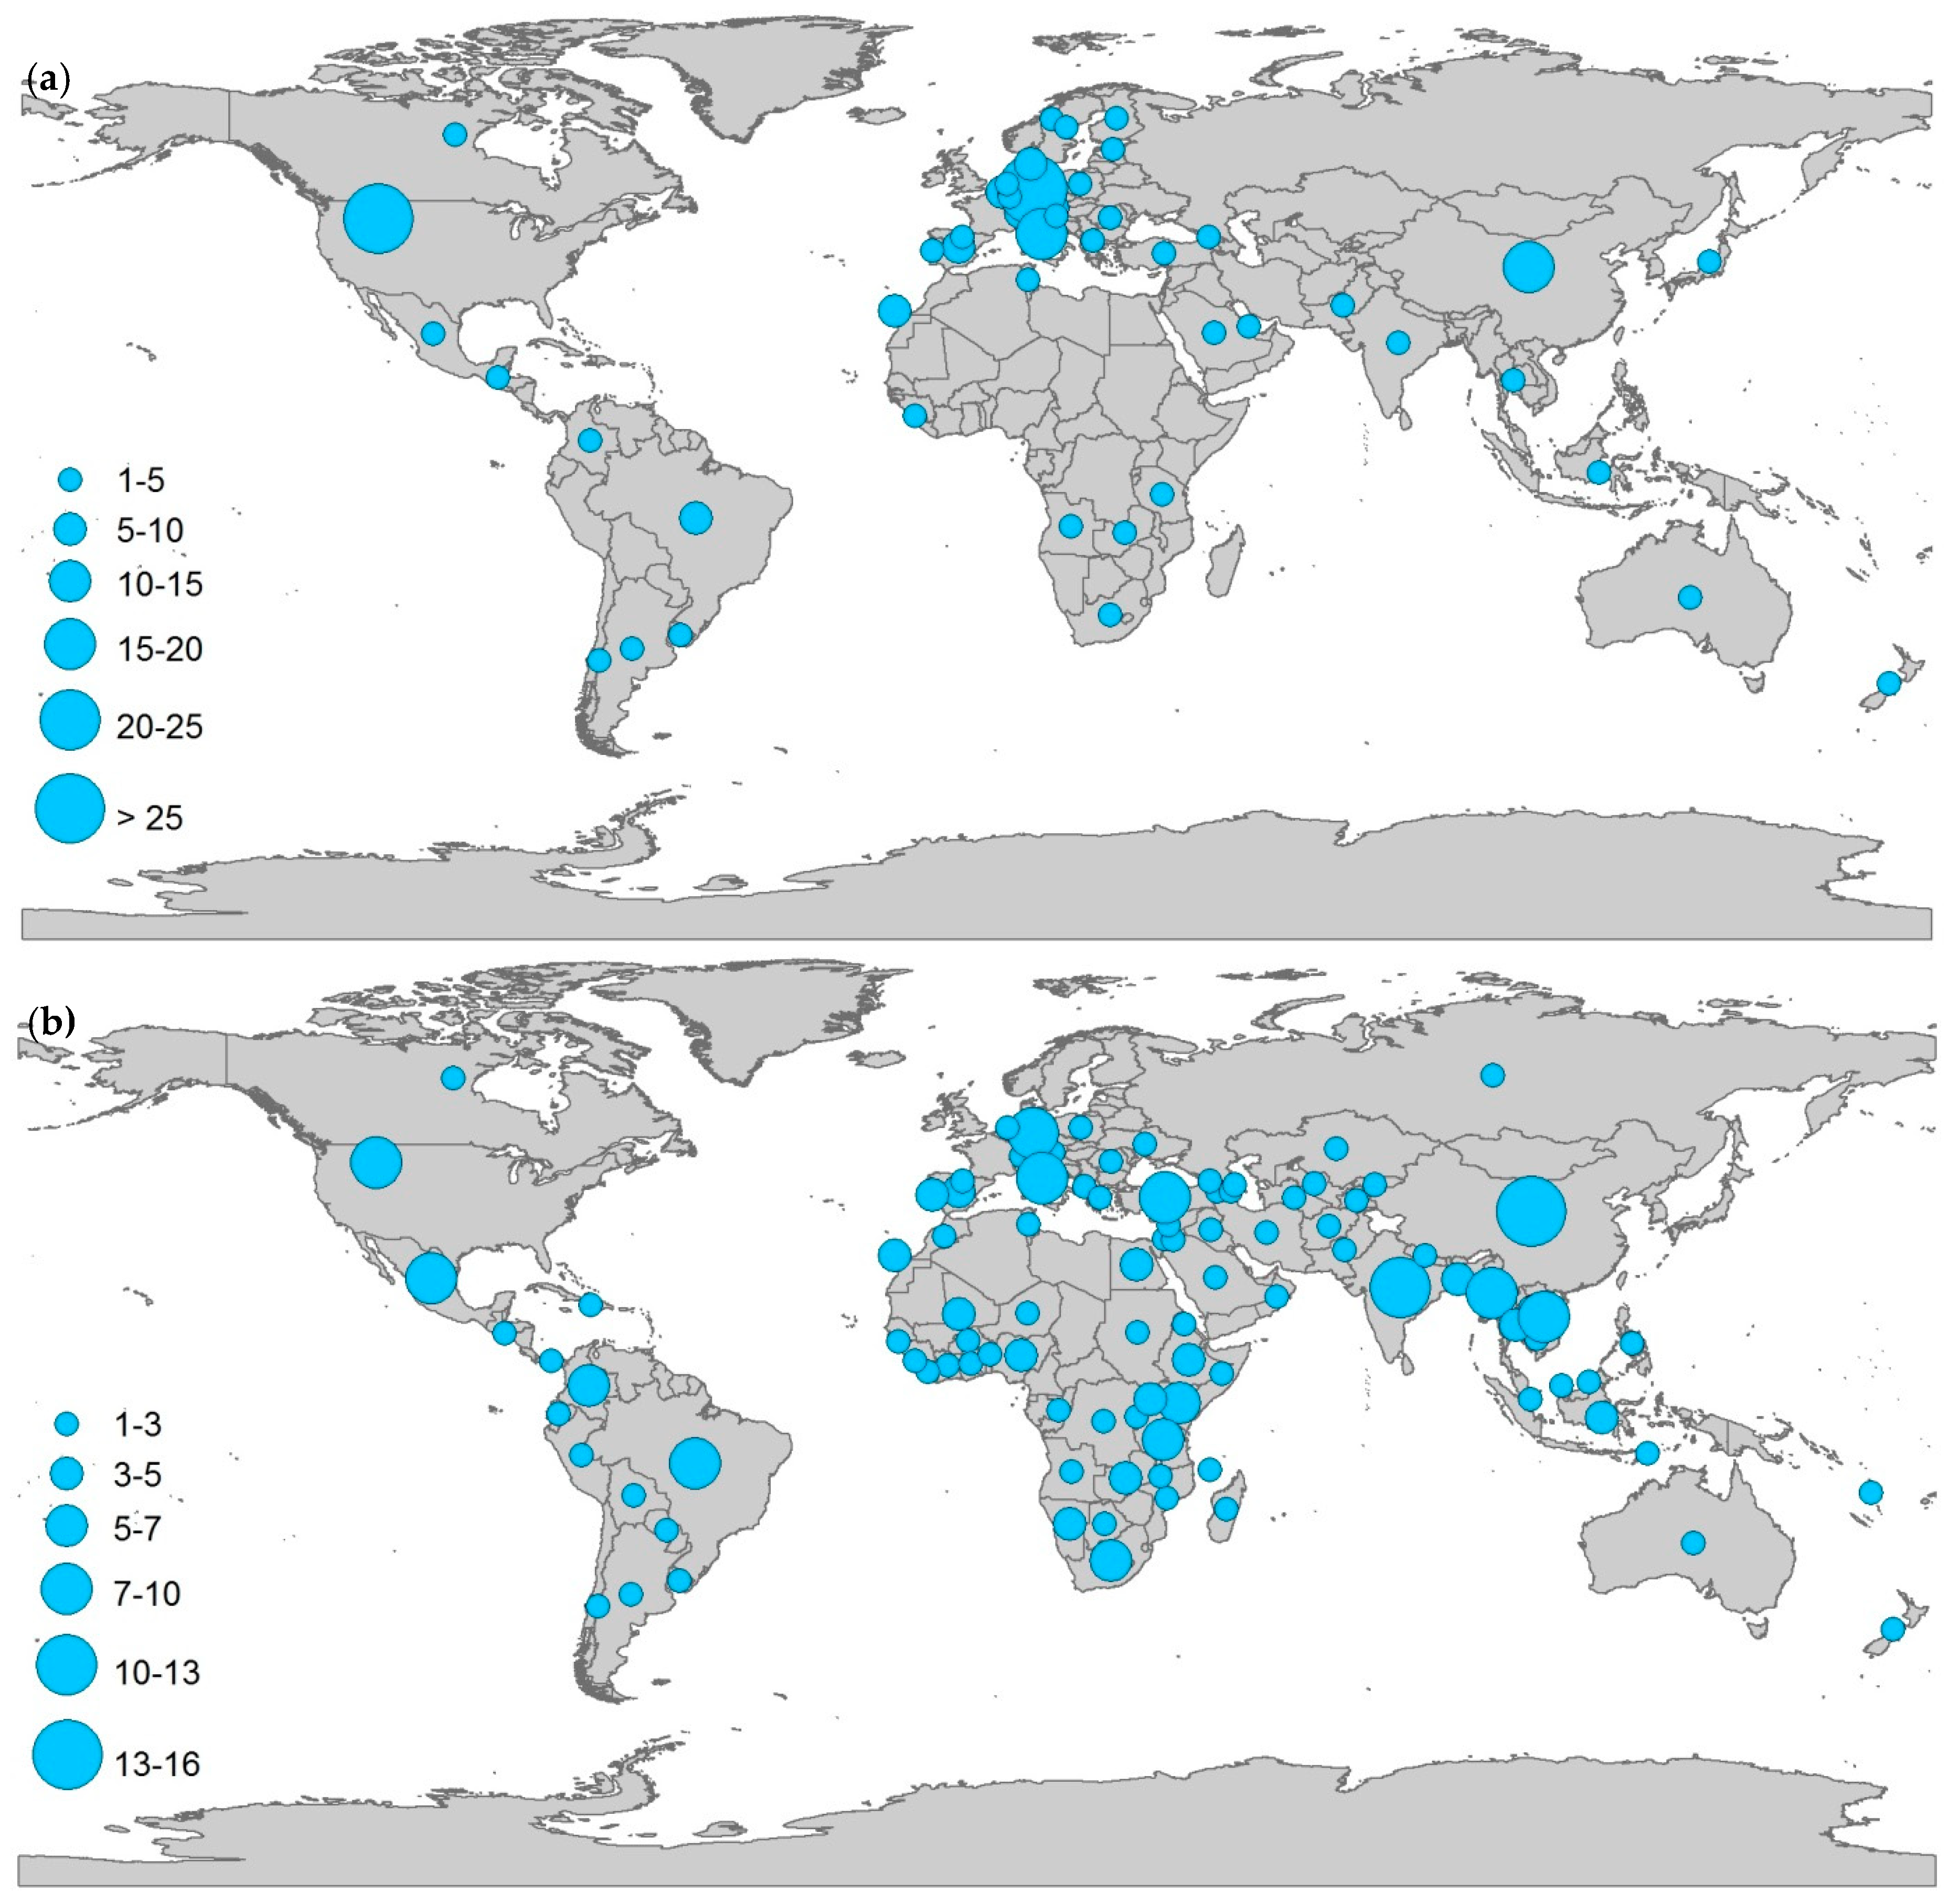
Figure 4a, with most users being located in the US (23%), followed by Germany (14%), UK (7%), Italy (6%), and China (6%).
Summarized per continent,
Figure 3b provides statistics related to the location of the 399 area(s) of interest (AOI) that have been defined by the users. The statistics reveal that the GUF layer is most often requested for regions in Asia (29%) and Africa (25%). This is not surprising since these two continents show the highest growth rates of urban expansion, often coupled with a lack of accurate and/or up-to-date data on the actual settlements location and distribution, in particular in rural areas. Most users requested the GUF for a country or even a smaller regional extent AOIs (291 times). In addition, 47 requests related to entire continents with Africa, South America, and Europe as top three (13, 12, and 11 times, respectively). A global GUF coverage was asked for in 58 cases.
Figure 4 visualizes the amount and origin of GUF requests (a) and areas of interest (b) per country.
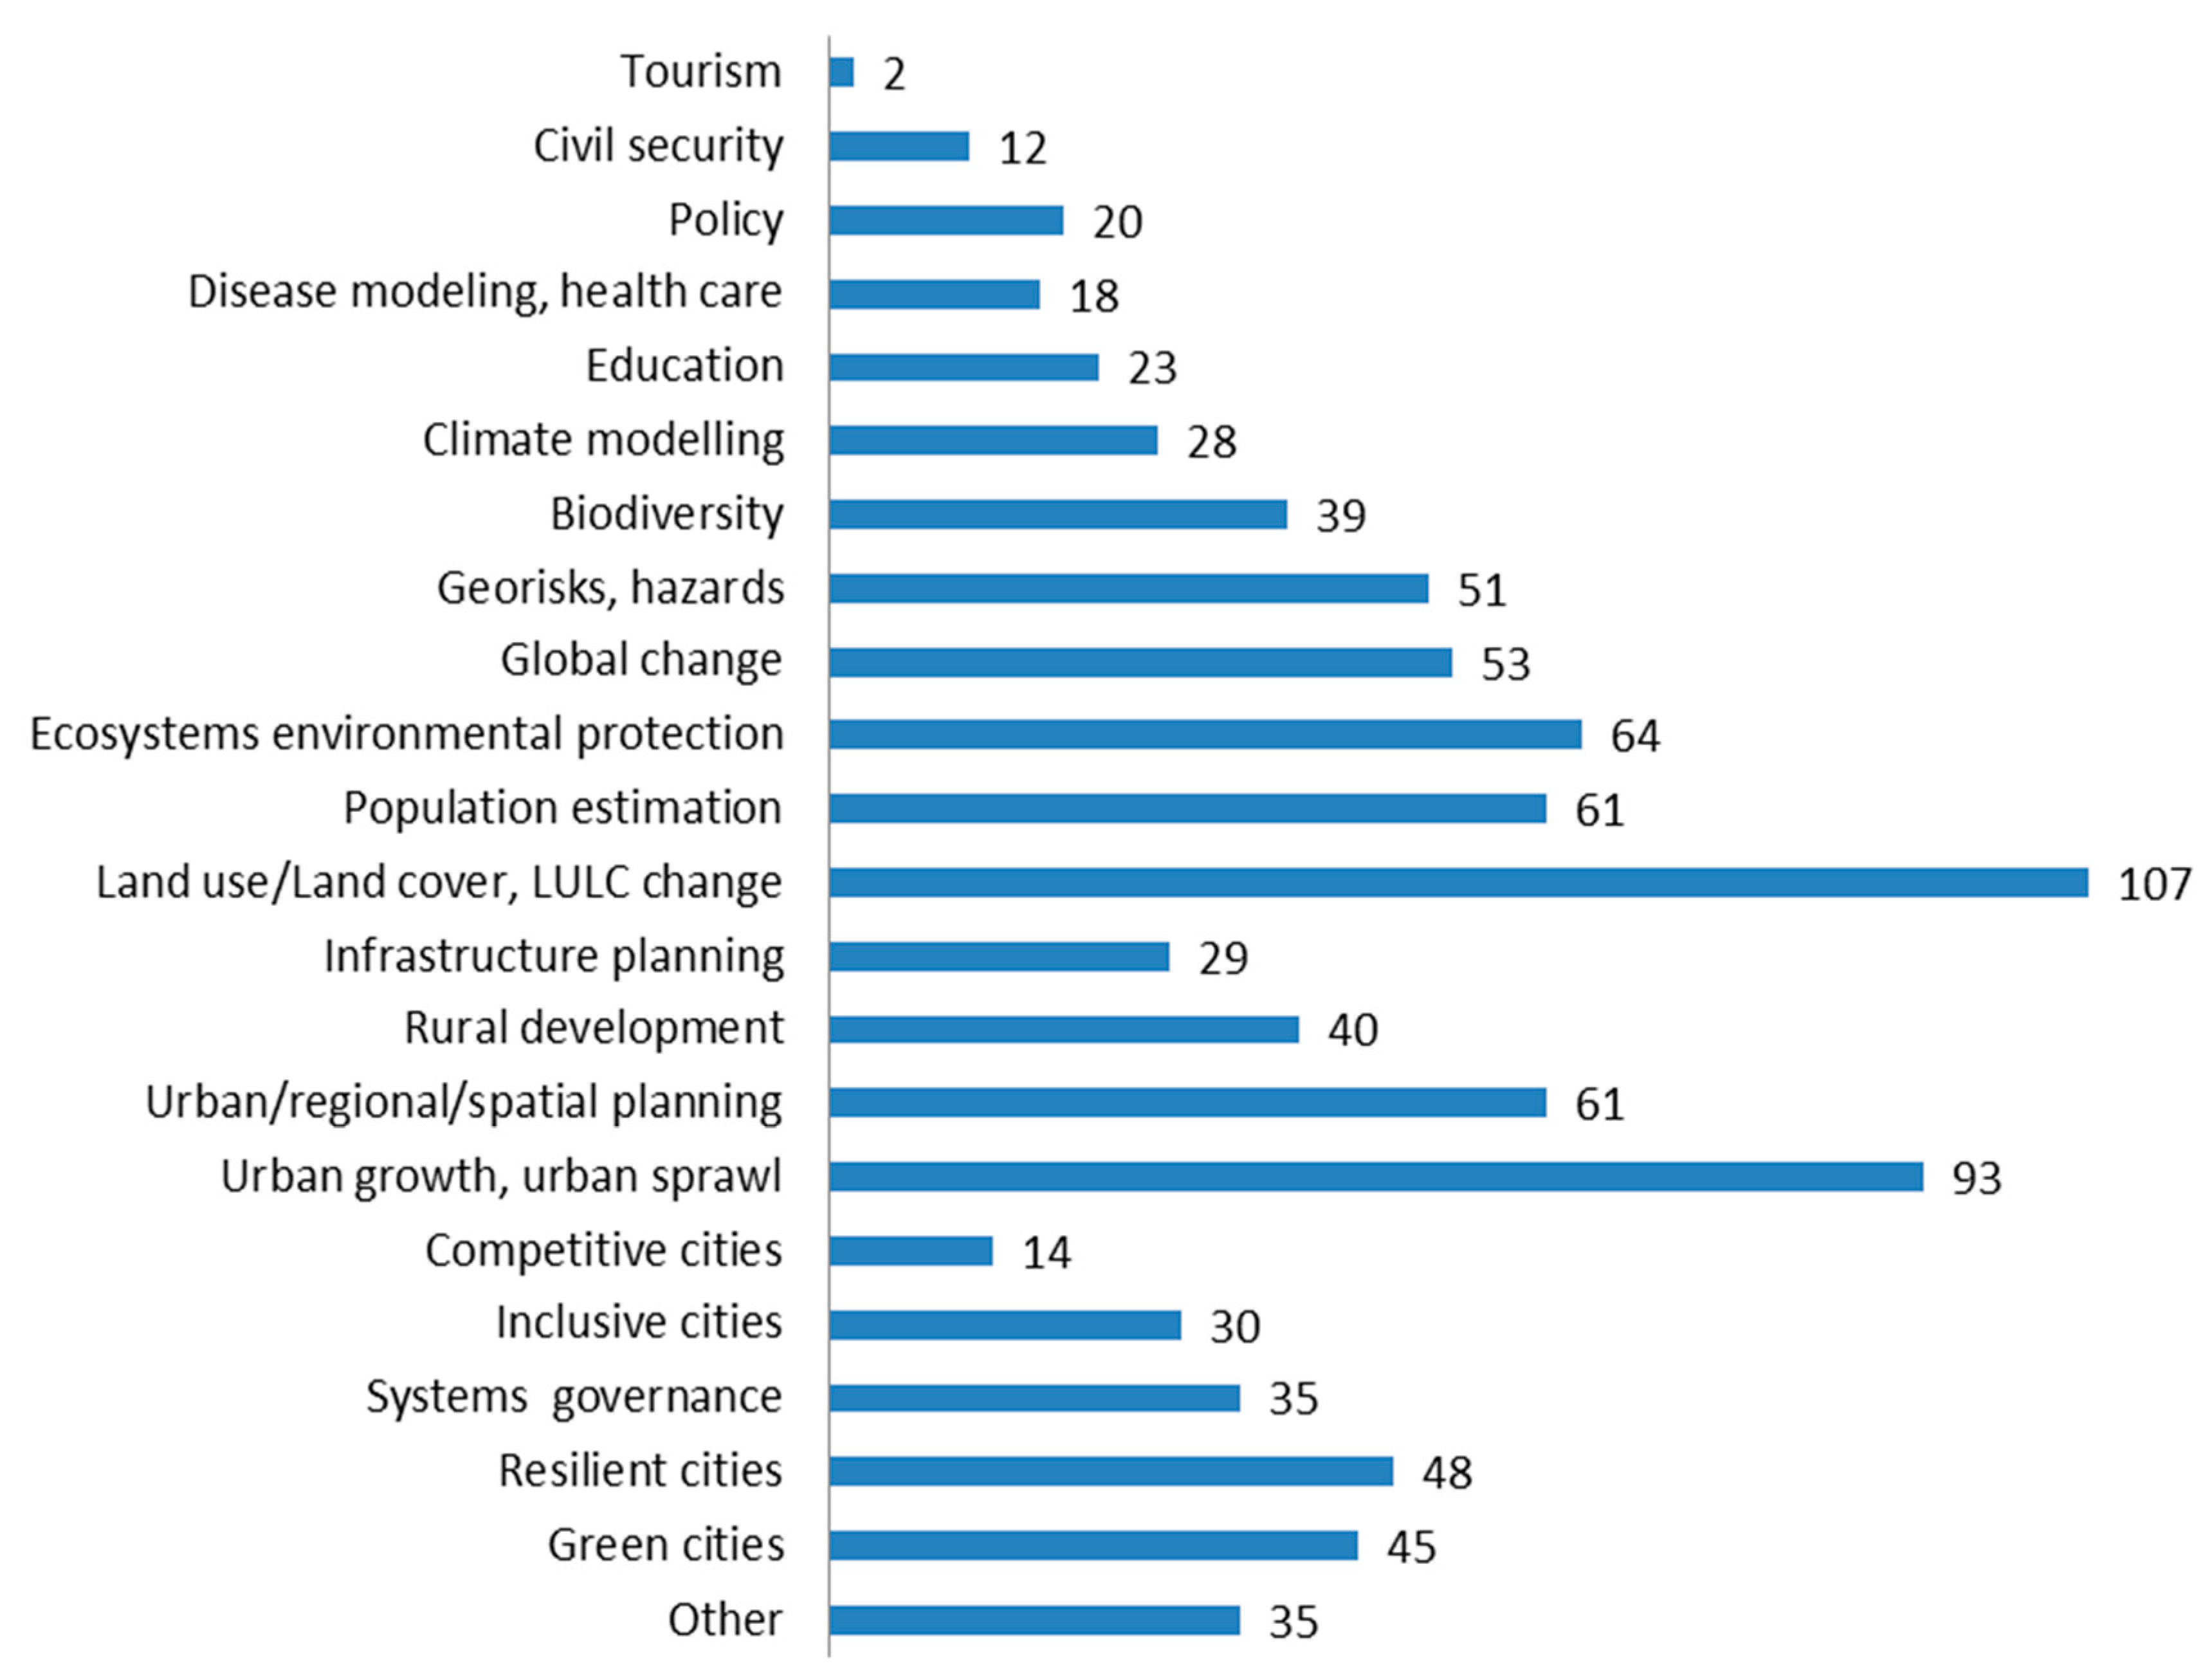
The questionnaire in the GUF License Agreement and Order Form also contained a question about the intended overall use of the data, with multiple answers being possible for a selection of pre-defined sectors (which could in case be supplement by individual user-defined fields). Generally, the average number of different use scenarios aimed at by a user comes up to 2.13. Therefore, the main intended use is that of a primary spatial/statistical analysis based on the GUF (148 cases), followed by using the GUF data as an input for further follow-on processing such as modelling (125 cases) or simply as spatial reference or background to generate new maps or figures (80 cases). More details on the specific fields of application behind these general use cases are provided by
Figure 5. Also using the user input for a selected list of options provided in the questionnaire, an average of 4.26 different applications were indicated by each user. Most popular are “land use and land use change” and “urban growth and urban sprawl”. This is followed by other applications such as “ecosystems and environmental protection”, “population estimation”, or “urban/regional planning”. Additionally, many users selected application fields such as “disease modelling and health care”, “climate modelling”, “Biodiversity”, or “infrastructure planning”.
In addition to the statistics that could be derived from the License Agreement and Order Form, the GUF team finally conducted a first general analysis of scientific publications that refer to the GUF data and the underlying techniques. This study shows that, so far, a total of 470 publications cite the primary DLR publications related to GUF data or methodology, respectively. Soon the GUF team plans to conduct a more dedicated survey of these citations, in particular with respect to the key characteristics of the underlying studies (e.g., thematic or technical sector, background of organization, etc.).
4. Evolution of the Product Portfolio and Future Updating Capability
Based on the lessons learnt from the GUF development and operations and considering the comprehensive feedback of the GUF user community, DLR has already started a systematic enhancement and extension of the current product and service portfolio. On the one hand, this includes an enhancement of the semantic and thematic scope of the layer. Here, first experimental developments include extensions of the GUF in form of the GUF-NetS, GUF-DenS, and GUF 3D.
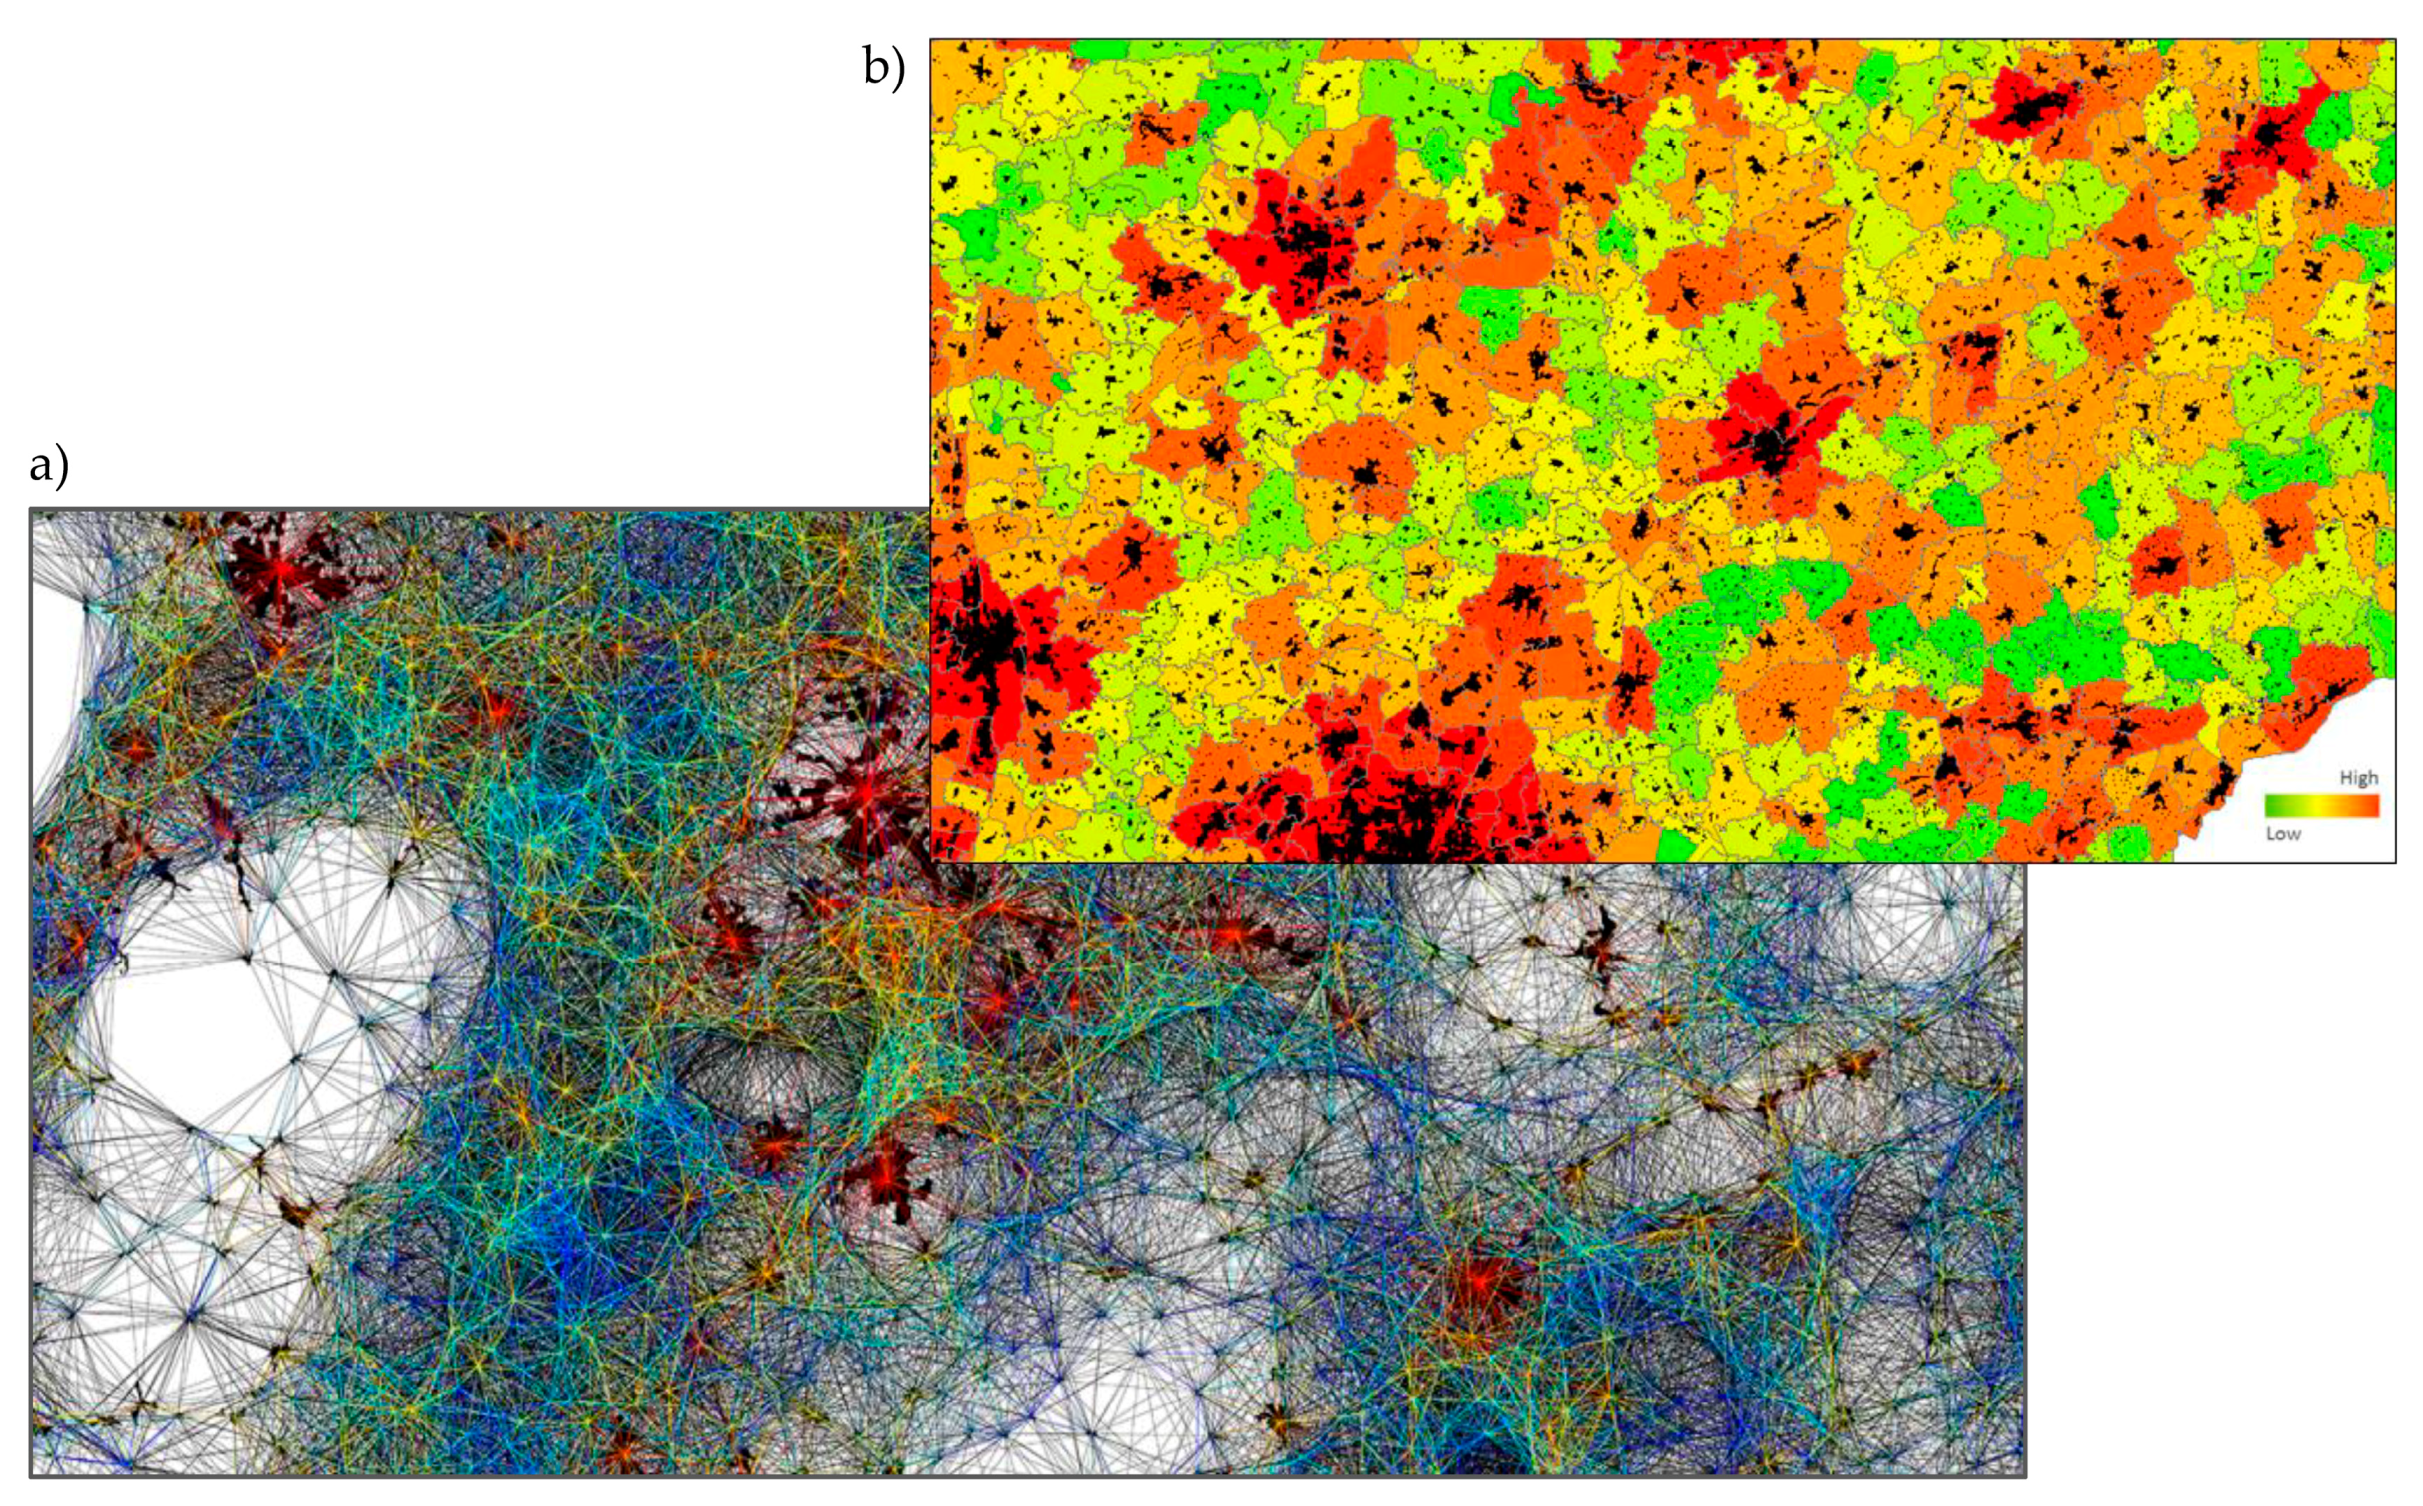
The GUF-NetS aims at providing dedicated parameters and information tailored for an effective characterization of settlements properties and patterns such as their sizes and shapes, but also their spatial arrangement and relative properties with respect to the network of neighboring settlements. Such information is, for instance, needed for the differentiation of urban and rural areas, infrastructure planning, or disease modeling. The GUF-NetS is derived from the binary GUF layer (see
Figure 6), and its parameters include attributes related to the geometry of the settlement patches (e.g., area, perimeter, shape index) as well as metrics describing the settlement pattern—meaning the spatial arrangement the built-up patches in their local or regional neighborhood (e.g., sparsely spread small settlements versus contiguous arrangement of large built-up patches). The major objective of this approach is to enable the users to analyze the settlement properties and patterns in high spatial detail at continental or even global scale. The GUF-NetS processing starts with a segmentation of the binary GUF mask that transforms all adjacent GUF pixels assigned as “built-up”—and thus forming a settlement patch—into an individual object. Then various geometric properties are derived for each single settlement object which are then added as attributes to the related polygon. These geometric parameters include area, perimeter, eccentricity, equivalent diameter, solidity and shape index. Next, a virtual spatial network is created with each node representing the centroid of an extracted GUF object and the edges connecting all neighboring objects that lie within a defined distance from each other. For each edge of the network a specific set of weights can be calculated—e.g., centroid distance, minimum distance, number of crossed edges or the local significance as a function of the distance between two connected nodes and the area of the two corresponding settlement objects. Finally, a collection of indexes such as betweenness, closeness, or eigenvector centrality is computed that describes the relevance of the individual settlements within the spatial network of their surrounding settlement objects. A detailed description of the GUF + NetS methodology is given by Esch et al. [
42].
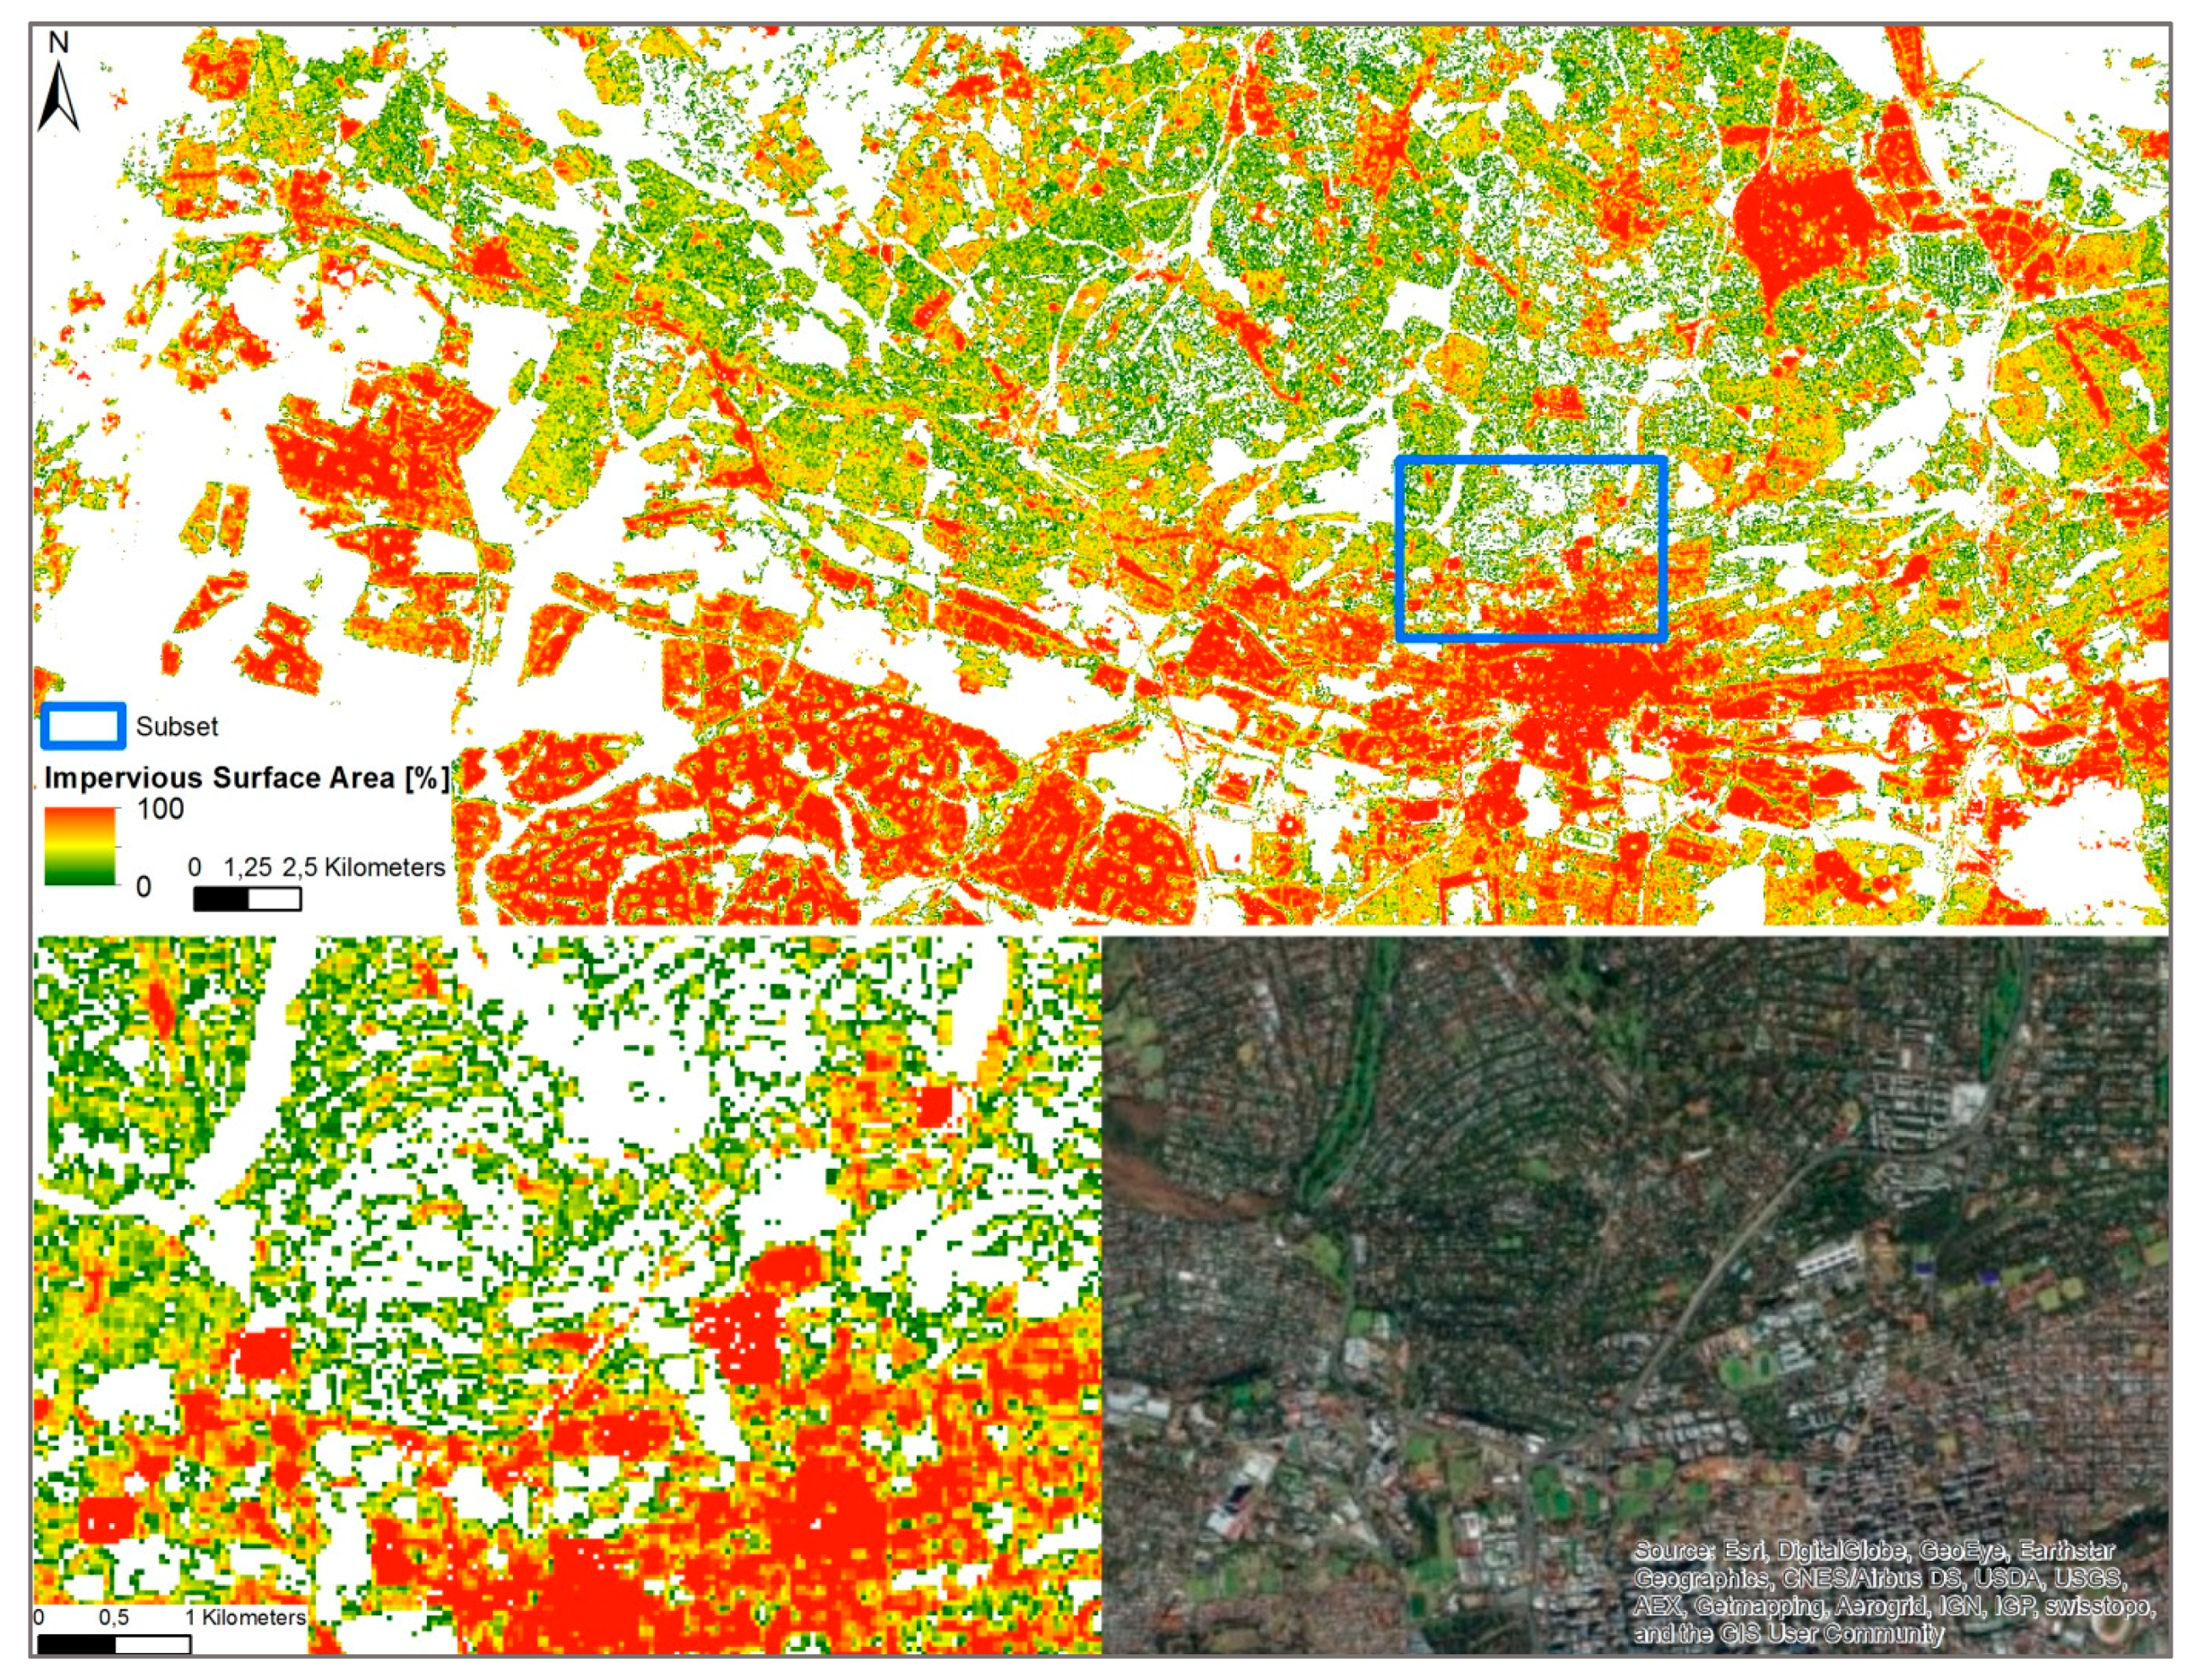
The GUF-DenS is an enhanced GUF version that specifies the built-up density or—as an inverse, the urban greenness—in form of the percent impervious surface within the area assigned as settlements by the conventional GUF. This information is particularly interesting for urban climate or hydrological modelling or approaches of population disaggregation. Technically, the GUF-DenS results from a combination of the GUF mask and imperviousness/greenness information modelled from temporal characteristics of the Normalized Difference Vegetation Index (NDVI) provided by a TimeScan dataset derived from Landsat imagery [
32]. Assuming a strong inverse relation between vegetated and sealed surfaces, the intensity of vegetation cover defined by the NDVI can be used as a proxy for the percent impervious surface [
43].
Figure 7 shows a subset of the GUF-DenS layer representing the impervious surface area for Johannesburg (South Africa). The layer is a continuous raster with values between 0 and 100, where red tone indicates high and green tone low density of impervious surface area. The global GUF-DenS product can be inspected at the Urban Thematic Exploitation Platform (
https://urban-tep.eo.esa.int).
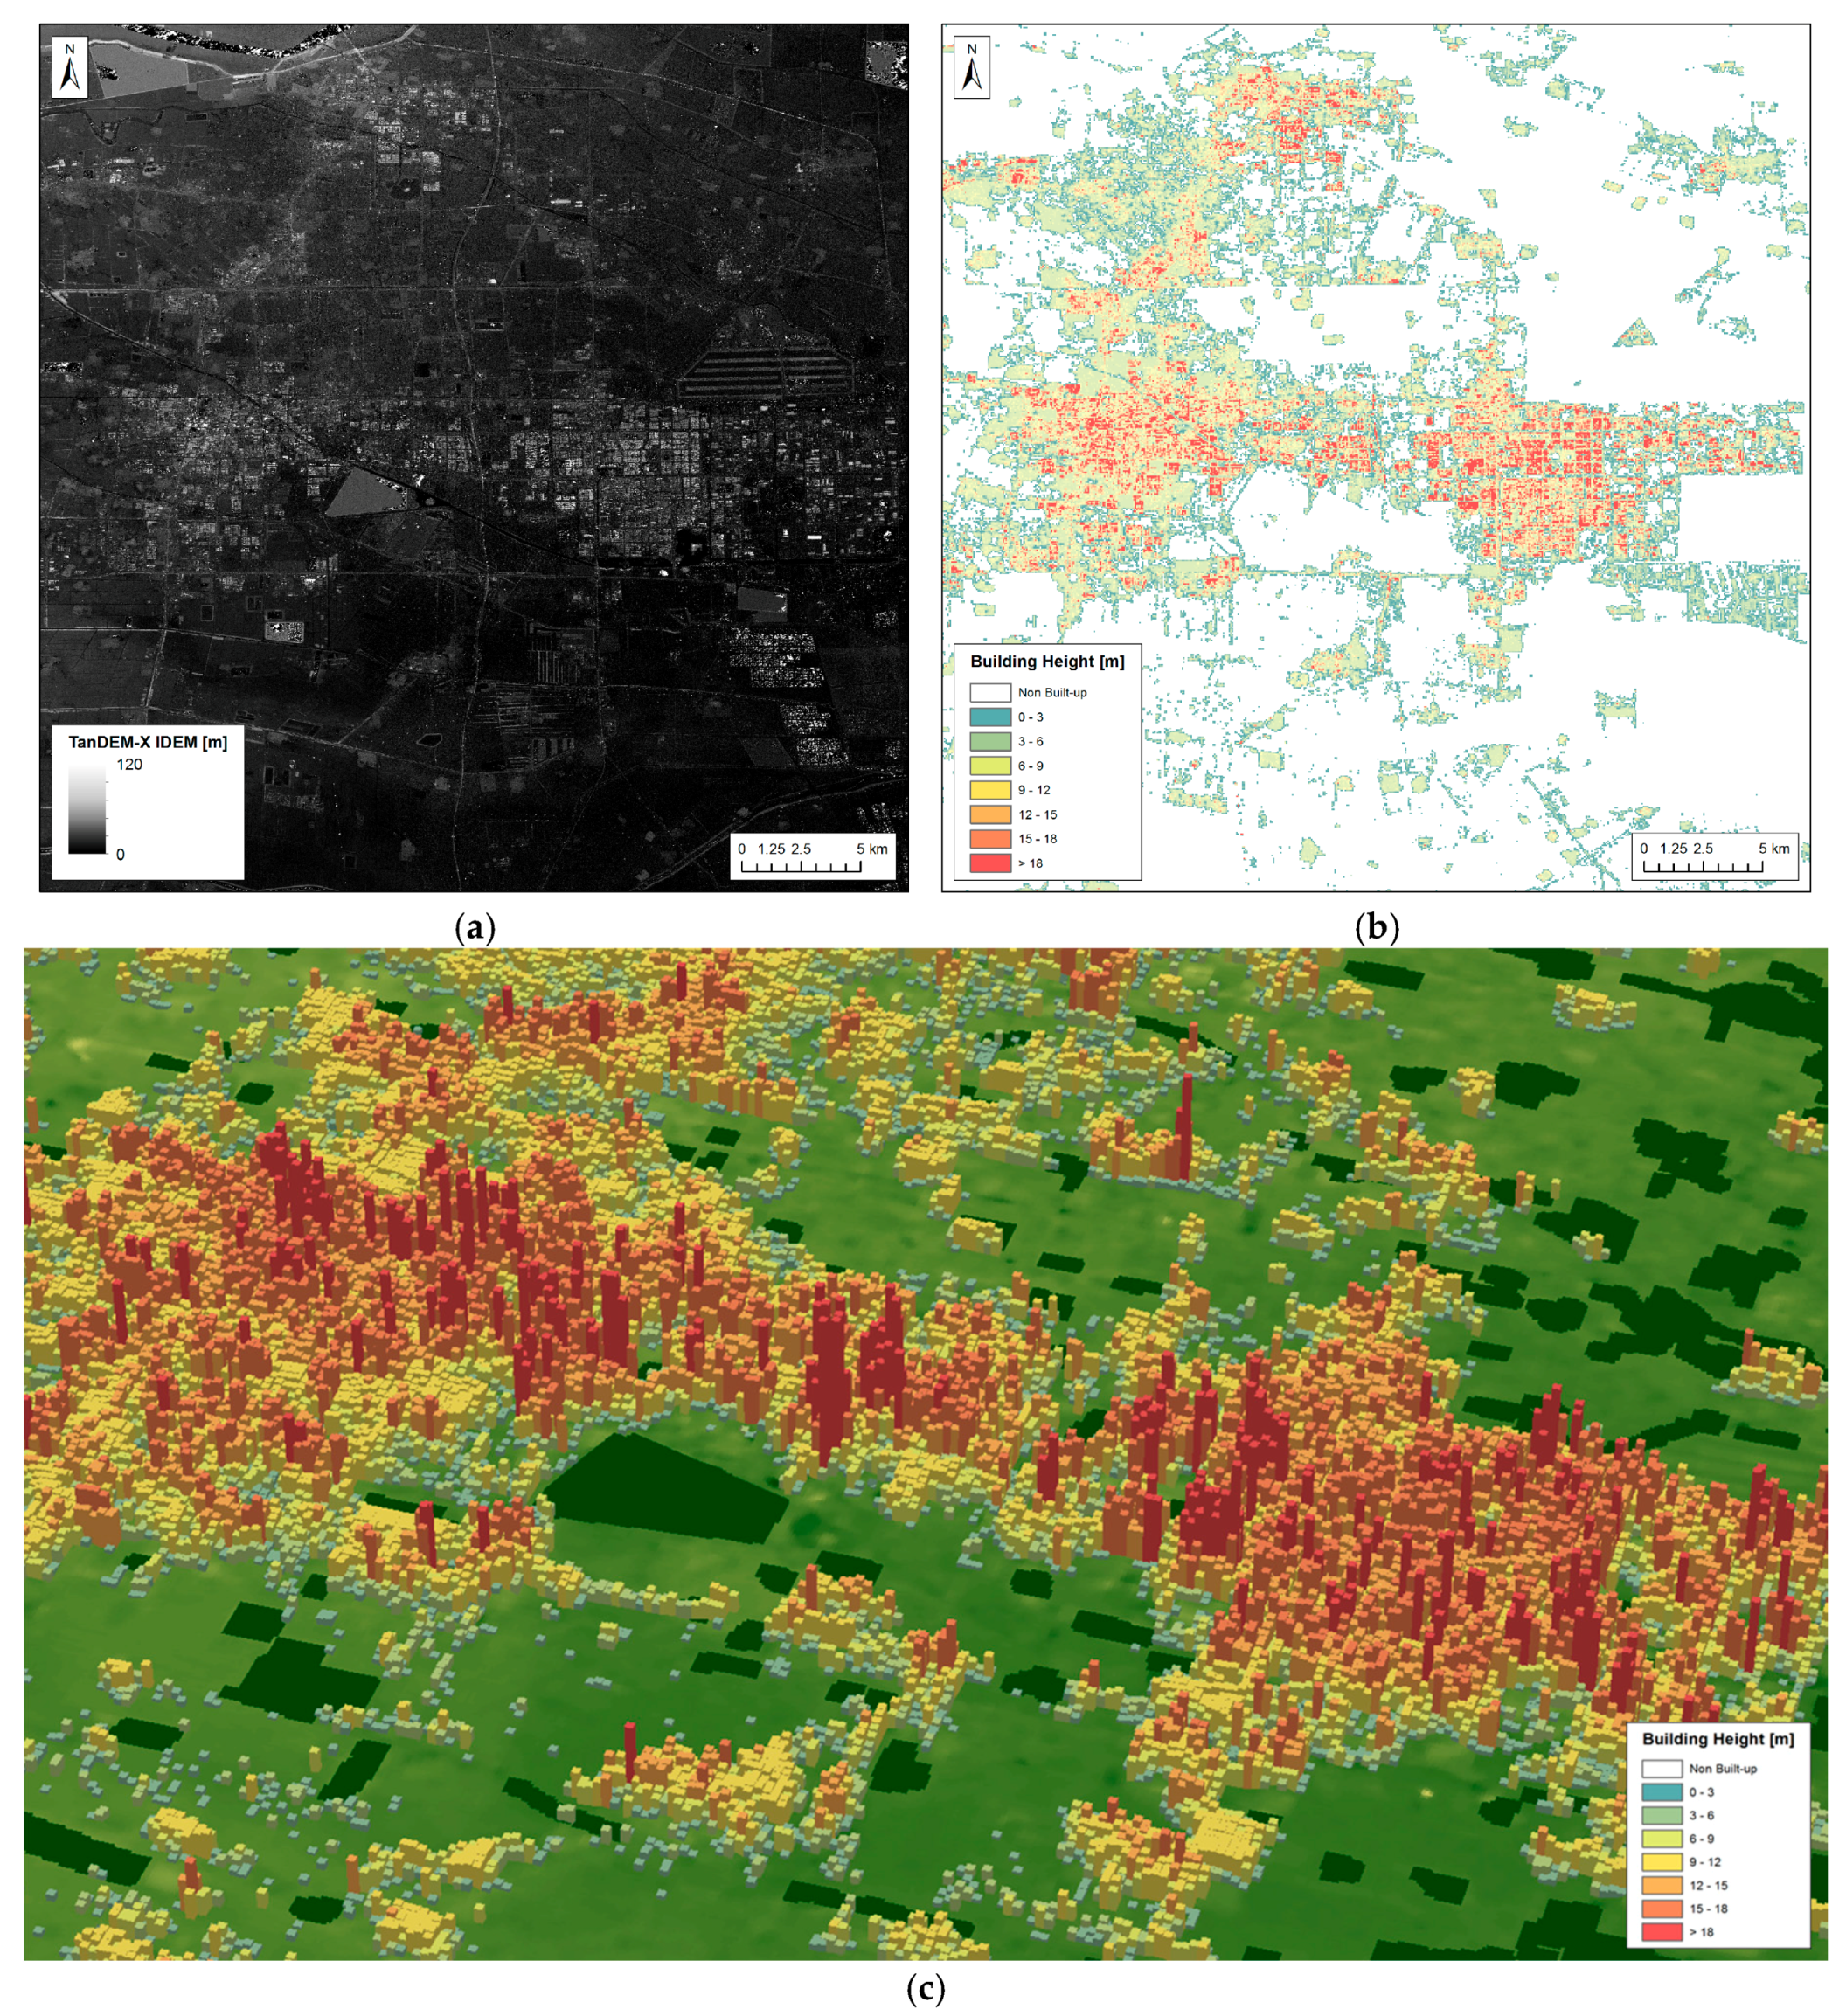
The GUF-3D layer will define the average building height within the built-up area indicated by the GUF mask based on an analysis of DEM data. Compared to the GUF or GUF DenS, this new layer can provide additional valuable information such as it is particularly required for improved population or urban climate modelling. The methodological approach along with some first results obtained on the basis of TanDEM-X DEM information are detailed in Marconcini et al. [
44]. In particular, the basic idea is to first identify ground pixels (i.e., whose elevation corresponds to that of the terrain) by iteratively analyzing the relative change in elevation within local neighborhoods of growing size. Next, these are used as seeds for Natural Neighbor (NN) interpolation [
45] for retrieving a Digital Terrain Model (DTM) of the study area. Specifically, the NN algorithm has been chosen since it does not require any input parameter and due to its proven effectiveness in the presence of irregularly distributed data (making it then particularly suitable for large-scale application). The final building height is retrieved by subtracting the computed DTM from the original DEM within the areas labelled as positive in the GUF layer. However, to compensate for noise in the TanDEM-X DEM over built-up areas, a median filter is first applied and then the average height is derived over a grid of 120 × 120 m. As an example, in
Figure 8 we report the results obtained for an area enclosing the city of Dongying (China) located at the delta of the Yellow River. In particular,
Figure 8a shows a quicklook of the corresponding TanDEM-X DEM, whereas
Figure 8b,c depict the building height estimated with the implemented methodology in 2D and 3D, respectively.
A key requirement for effective and serviceable global urban monitoring using EO is the capability of future updates (and related mapping campaigns) in regular intervals of 1–3 years. In order to meet this requirement, DLR is currently adapting the methodologies for the GUF, GUF-NetS, and GUF-DenS generation to the use of the fully open and free satellite data provided by the European Sentinel-1 (SAR) and Sentinel-2 (multispectral) as well as the US Landsat (multispectral) missions. This activity will lead to the provision of a new suite of global layers under the label “World Settlement Footprint (WSF)”, starting in 2018 with a release of the WSF 2015 (equivalent of binary GUF, based on a joint analysis of multi-temporal Sentinel-1 and Landsat-8 data for the year 2015) and followed by WSF-2015-NetS and WSF-2015-DenS versions. In addition, a WSF-Evolution product will be produced that provides detailed information about the spatiotemporal development from 1985–2015 for each human settlement identified in the WSF-2015. The corresponding analysis is based on a processing of multitemporal mass data collections of the Landsat archive using the Google Earth Engine [
46].
5. Conclusions and Outlook
With its spatial resolution of 12 m, the Global Urban Footprint dataset currently represents the most detailed and consistent global inventory of human settlements. At the same time, the outcome of the worldwide quality assessment confirms a high accuracy of the GUF map as it had already been indicated at regional scales by previous studies [
32,
47,
48]. With a Kappa coefficient of 0.6373, the GUF 0.4″ shows values about 0.16 higher with respect to both the state-of-the-art GHSL and GL30 layer derived from optical data, which exhibited severe underestimation issues (see
Section 2.2). Here, a direct comparison revealed that the layers based on multispectral data most frequently suffer from the spectral similarity between bare soils or rock (e.g., mountain ranges, deserts, beaches, agricultural areas) on the one hand and urban impervious surface types on the other hand.
In contrary, built-up areas show a comparably distinct and globally consistent appearance in radar images. Due to the SAR imaging principle, the backscattering—and the image characteristics—are rather determined by structural and geometric features of the observed surfaces and objects than by chemical or physiologic properties as in case of optical/multispectral data. These geometric features are also quite distinct in the case of human settlements with their unique side-by-side accumulation of man-made vertical structures (inducing bright corner reflections and dark shadow regions) and low-signal areas due to specular reflection at smooth impervious surfaces. Accordingly, false positive alarms in the GUF classification mainly arise from confusions with structurally similar surface types such as rugged terrain in deserts or mountainous regions. However, Esch et al. [
33] showed that these could effectively be eliminated during the post-editing phase by the inclusion of correction layers that are partially derived from multispectral satellite data that provided complementary features for an improved discrimination between real built-up areas and other critical non-built-up regions (see
Section 2.1.6).
In addition, the GUF campaign benefitted from the SAR-specific advantage of a comparably fast collection of the required global database of satellite imagery: actually, 93% of the input SAR data had been acquired within a period of just two years—a significant improvement compared to the use of optical data. Here, the actual acquisition dates of the single scenes in fact frequently differ by several years while still showing local data gaps due to cloud coverage. Nevertheless, with the TimeScan approach, Esch et al. [
38] have recently introduced a methodology based on multitemporal data collections that helps to compensate for this limiting factor in multispectral data. Indeed, a global TimeScan layer derived from >450.000 Landsat images acquired within a two-year period was already successfully used as correction layer for the false alarms identification and removal in the context of the GUF post-processing (see
Section 2.1.6). Moreover, the new TimeScan technology forms the basis for a currently ongoing GUF-update for the year 2015 (WSF product), which has been described in more detail in
Section 4.
Due to the characteristics and qualities described afore, the GUF product could already attract a large community of users within the first year after its official release. Thereby the systematic community survey documents that the activated users come from diverse sectors and scientific disciplines with their use scenarios covering a wide span of different applications. In combination with the direct feedback from the users, it can therefore be reasoned that the GUF initiative—and therewith also the underlying TerraSAR-X mission—has successfully provided a new dimension of valuable data, facts, and figures on the global phenomenon of urbanization. This new empirical evidence is supposed to substantially help address future key societal and environmental challenges such as rapid urban expansion, population growth, poverty reduction, loss of biodiversity, increasing carbon emissions, and ongoing climate change. Currently, every interested user can request the global GUF data via email (
[email protected]) free of charge at full spatial resolution of 0.4″ (12 m) for any scientific application and the generalized version at 2.8″ (84 m) for any non-profit use. For commercial use cases, Airbus DS has to be contacted (
http://www.intelligence-airbusds.com). More information about the access procedure is available at DLR’s GUF website (
http://www.dlr.de/guf). In addition, the GUF layer is provided via a Web Mapping Service (WMS) from DLR’s Earth Observation Center (
https://geoservice.dlr.de/web/maps/eoc:guf:4326) and the Urban Thematic Exploitation Platform (
https://urban-tep.eo.esa.int/) which is funded by the European Space Agency (ESA, Frascati, Italy). To further increase the societal benefit of the GUF, DLR actively shares the GUF layer and derived metrics with several international activities and networks—amongst others including the “Task GI-17—Global Urban Observation and Information” [
49] and the “Human Planet Initiative” [
50] of the Group on Earth Observations (GEO) or the POPGRID data collective [
51].
However, in order to further increase the efficiency in reaching and supporting the science and policy communities developing the concrete strategies for the design, implementation, and management of sustainable urban environments, it is actually necessary to provide them with actionable information derived from a variety of sources in one single place. For this purpose, the ESA-funded “Urban Thematic Exploitation Platform (U-TEP)” has recently been set up [
52]. U-TEP represents a web-based enabling instrument (
https://urban-tep.eo.esa.int/) in form of an open, collaborative virtual environment that combines high-performance access to multi-source data repositories (e.g., EO, statistics, surveying data, volunteered geographic information, social media data) with efficient processing, analysis, and visualization functionalities and mechanisms for the effective development and sharing of methods and knowledge. For the future, it is planned that the entire suite of WSF products will be available at the U-TEP platform along with dedicated analytics tools to address major urban challenges such as urban growth/transformation monitoring, livable cities, resilience and disaster risk reduction, poverty eradication, health issues and diseases, world heritage conservation, biodiversity/ecosystem services, energy and supplies, traffic, and climate change adaptation and mitigation.


 ,
, 


