East Africa Rainfall Trends and Variability 1983–2015 Using Three Long-Term Satellite Products


1
National Research Council of Italy, Institute of Atmospheric Sciences and Climate, CNR-ISAC, 40129 Bologna, Italy
2
Environmental Institute (IMA), University of León, 24071 Léon, Spain
3
Spanish State Meteorological Agency (AEMET), Balearic Islands Office, 07015 Palma de Mallorca, Spain
*
Author to whom correspondence should be addressed.
Remote Sens. 2018, 10(6), 931; https://0-doi-org.brum.beds.ac.uk/10.3390/rs10060931
Submission received: 26 April 2018
/
Revised: 28 May 2018
/
Accepted: 8 June 2018
/
Published: 13 June 2018
(This article belongs to the Special Issue Remote Sensing of Essential Climate Variables and Their Applications)
Abstract
:Daily time series from the Climate Prediction Center (CPC) Africa Rainfall Climatology version 2.0 (ARC2), Climate Hazards Group InfraRed Precipitation with Stations (CHIRPS) and Tropical Applications of Meteorology using SATellite (TAMSAT) African Rainfall Climatology And Time series version 2 (TARCAT) high-resolution long-term satellite rainfall products are exploited to study the spatial and temporal variability of East Africa (EA, 5S–20N, 28–52E) rainfall between 1983 and 2015. Time series of selected rainfall indices from the joint CCl/CLIVAR/JCOMM Expert Team on Climate Change Detection and Indices are computed at yearly and seasonal scales. Rainfall climatology and spatial patterns of variability are extracted via the analysis of the total rainfall amount (PRCPTOT), the simple daily intensity (SDII), the number of precipitating days (R1), the number of consecutive dry and wet days (CDD and CWD), and the number of very heavy precipitating days (R20). Our results show that the spatial patterns of such trends depend on the selected rainfall product, as much as on the geographic areas characterized by statistically significant trends for a specific rainfall index. Nevertheless, indications of rainfall trends were extracted especially at the seasonal scale. Increasing trends were identified for the October–November–December PRCPTOT, R1, and SDII indices over eastern EA, with the exception of Kenya. In March–April–May, rainfall is decreasing over a large part of EA, as demonstrated by negative trends of PRCPTOT, R1, CWD, and R20, even if a complete convergence of all satellite products is not achieved.
1. Introduction
The analysis of space–time variations of rainfall is of paramount importance in East Africa (EA, 5S–20N and 28–52E; Figure 1) where extremes (floods and droughts) deeply affect the population, especially via relevant effects on agriculture and consequently on food security. Around 203 million people, 30% of them living in Ethiopia and Kenya, are affected by such floods and droughts [1].
During the last four decades, some major drought events hit the region (Figure S1), very often affecting more than one rain season consecutively [2]: 1983–1985 for Ethiopia with estimated 1 million deaths [3]; the extensive 1999 episode affecting Burundi, Eritrea, Ethiopia, Kenya, Rwanda, and Uganda; the prolonged period of depressed rainfall 2003–2009 (with the exception of 2006) over Kenya, Ethiopia, and Tanzania; and the “worst in 60 years” 2010–2011 drought in Ethiopia, Somalia, and Kenya [4,5]. On the other hand, extreme rainfall giving rise to flood events is equally possible (Figure S2), as during the El Niño-related 1997–1998 flood episode over Ethiopia, Somalia, Kenya, and Uganda (2906 deaths, source: Emergency Events Database—EM-DAT, http://www.emdat.be, last accessed 14 March 2018). In this case, rainfall was further enhanced by the Indian Ocean’s sea surface temperature (SST) configuration, with anomalously high SSTs in the western equatorial Indian Ocean (10S–10N, 50–70E) accompanied by negative SST anomalies in the eastern sector (10S–0, 90–110E), an SST spatial pattern usually identified as the positive phase of the Indian Ocean Dipole (IOD) [6]. A similar episode happened in 2006 (1290 deaths, source: EM-DAT) [7]. In 2015–2016, another drought event associated with El Niño affected EA, with 24 million people facing critical and emergency food insecurity by August 2016. Drought indices have recently been used to characterize historical episodes in the Upper Blue Nile Basin in Ethiopia [8] and intraseasonal descriptors of wet and dry spells were applied to equatorial EA using rain gauge data [9]. Excessive rainfall was recorded during late 2015 and the March–May 2016 rainy season, leading to flooding in parts of Somalia, Kenya, Ethiopia, and Uganda (source: United Nation Office for the Coordination of Humanitarian Affairs, UN OCHA, http://www.unocha.org, last accessed 13 March 2018).
Climate projections are a source of great concern for EA. A multi-model ensemble experiment exploited to identify regions where the impact of climate change on hydrological drought shows a strong signal between the end of the 20th and the beginning of the 21st century [10]. EA is identified as a region with little average change in the drought severity, measured as the fraction of land area in a given region that is under drought conditions. However, drought projections in the region are characterized by very large uncertainties [10]. Future rainfall projections foresee a general increase of the median precipitation over EA, but the range of changes in precipitation regime is significant: −2 to +20% by the end of the 21st century [11]. Even larger variations are projected at seasonal scale: for example, in Ethiopia the projected precipitation change varies from −42 to +78% in January–February–March and from −10 to +70% in October–November–December (OND). Moreover, a negative impact of climate change on crop yields characterizes the region [11]. EA’s population is thus very vulnerable considering that 65% is employed in agriculture, which is highly affected by rainfall availability, due to the very scarce use of irrigation [11].
EA’s rainfall is characterized by a marked seasonality, with regional variations of the annual cycle [12,13]. Rainfall time series need, thus, to be analyzed for evaluating the spatial and temporal variations and trends in the different areas characterized by a local rainfall annual cycle. Several recent observational studies were focused on Ethiopia [14,15,16]. Studies on other EA countries or on the whole EA territory are also available [4,6,17,18,19,20]. These studies consider, separately, the typical EA rainy seasons: the short rain season (OND) and the long rain season (March–April–May, MAM) for the equatorial area (Kenya, Uganda, northern Tanzania, and Somalia); and the Kiremt (June–July–August–September, JJAS) and Belg (MAM) rain seasons for western Ethiopia and South Sudan.
Significant declines in the Kiremt rainfall totals were found since 1982 in eastern and southwestern Ethiopia by analyzing rain gauge data time series for 1965–2002 [14], and similarly for 1960–2002 [15]. Decreases in Kiremt rainfall were found for the Baro-Akobo, Omo-Ghibe, Rift Valley, and southern Blue Nile watersheds located in southwestern and central Ethiopia. A downward trend in rainfall of −0.4 mm month−1 per year was observed over southwestern Ethiopia in 1948−2006 [16].
A recent decline of long rains was documented alongside an increase of short rains [21,22]. The existence of a significant negative trend in MAM rainfall over the central and southern Horn of Africa was identified using the Global Precipitation Climatology Centre (GPCC) and Global Precipitation Climatology Project (GPCP) data during the period 1979−2012 [6]. In the short rain season (OND), both datasets indicate an increase of precipitation with significant trend particularly on the Somalia coast. Negative anomalies of EA long rains were studied using GPCC and GPCP datasets, together with the Climatic Research Unit (CRU) at the University of East Anglia, and the Climate Prediction Centre (CPC) Merged Analysis of Precipitation (CMAP) datasets, with estimated linear trends from 1983 onwards of −0.19, −0.33, −0.35, and −0.08 mm day−1 per decade for GPCC, GPCP, CMAP, and CRU, respectively [20]. Similarly, the analysis of rainfall variability and trends using GPCP, CRU, and Tropical Applications of Meteorology using SATellite (TAMSAT) datasets, and simulations from the Coupled Model Intercomparison Project Phase 5 (CMIP5) over Africa for the period 1983–2010 found decreases in MAM EA rainfall ranging from −14 to −65 mm year−1 per decade [17].
Several climate data records (CDRs) of satellite-derived precipitation as an Essential Climate Variable (ECV) [23] exist and are becoming of sufficient length for their effective use in climatological applications over the African continent, alone or in conjunction with other ECVs, such as SST and soil moisture [24]. Daily accumulated rainfall from three of such CDRs (Section 2a) are exploited, hereafter, to investigate how the single satellite dataset captures precipitation variability and trends. The analysis is focused on the time series of the joint CCl/CLIVAR/JCOMM Expert Team on Climate Change Detection and Indices (ETCCDI, http://etccdi.pacificclimate.org/index.shtml, last accessed 13 March 2018), computed starting from the daily precipitation datasets at the yearly and seasonal scales. The purpose is to extract spatial patterns of precipitation variability by trend analysis on precipitation data from satellite using the Mann–Kendall trend test.
In Section 2, details on the satellite products and the analysis methodologies are introduced, whereas a description of the characteristics of EA’s precipitation and its seasonality is provided in Section 3. Section 4 focuses on the results of the trend analysis of the ETCCDIs at the annual and seasonal scales, and a summary of the main results and conclusions is offered in Section 5.
2. Data and Methodologies
2.1. Satellite Rainfall Products
The spatial and temporal variability of EA precipitation during the last three decades (1983–2015) is studied using daily estimates from three satellite rainfall products based on infrared (IR) geostationary brightness temperatures, which are among the most used products over Africa and the longest high-resolution satellite series to date:
- CPC Africa Rainfall Climatology version 2.0 (ARC2) is a daily climatological dataset centered over Africa (40S–40N and 20W–55E) with a spatial resolution of 0.1° starting from 1983 and updated in near-real time [25]. The dataset guarantees an historical consistency through the use of a single retrieval algorithm based on the use of calibrated three-hourly IR satellite imagery with quality-controlled gauge observations from the Global Telecommunication System (GTS), and is particularly suited for studies of extreme events, wet and dry spells, and rainfall frequency. The algorithm is based on the use of the Geostationary Operational Environmental Satellite (GOES) Precipitation Index (GPI), whose rainfall estimates are combined in a two-step merging methodology with the GTS rain gauge measurements.
- TAMSAT African Rainfall Climatology And Time series (TARCAT), version 2, contains rainfall estimation over Africa at a spatial resolution of 0.0375°, and provides daily estimates since 1983 [26,27,28]. The main input data are the IR brightness temperatures from Meteosat platforms. The number of hours for which a given satellite pixel is associated with a temperature lower than a specific threshold value over a 10-day period, i.e., the cold cloud duration (CCD), is the basis of this algorithm, and is linearly related to precipitation over the same time period. The threshold temperature and the linear relationship coefficients are estimated for a given region and time of the year (month) by means of the analysis of historic rain gauge data relative to that region and time of the year. This calibration methodology based on a historical rain gauge dataset, rather than on simultaneous rain gauge observations, makes TARCAT useful for climate-related risk assessment, even in regions with insufficient gauge coverage.
- Climate Hazards Group InfraRed Precipitation with Stations (CHIRPS) version 2.0 starts from 1981 to near present with a quasi-global land coverage (50S–50N) and a 0.05° spatial resolution; it was designed for studies on hydrologic impacts and trend analysis [29]. The algorithm dwells on pentadal CCDs obtained with a fixed IR brightness temperature threshold (235 K) to identify precipitating cloud systems. The CCD’s calibration method makes use of the Tropical Rainfall Measuring Mission (TRMM) Multi-satellite Precipitation Analysis (TMPA 3B42 v7). These IR rainfall estimates are converted to percent anomalies, and subsequently multiplied by the high-resolution climatology CHPclim to produce unbiased precipitation fields. Finally, rain gauge data are combined with the previous precipitation estimates to obtain rain gauge adjusted estimates. The number of gauges is higher than for ARC2 since additional gauges from National Meteorological Agencies are included.
All three datasets were projected on a common grid at 0.25° resolution, using a local area averaging approach to interpolate data from a higher resolution rectilinear grid to the 0.25° grid (i.e., the National Center for Atmospheric Research—NCAR Command Language—NCL function “area_hi2lores”). The satellite time series temporal gaps were filled according to their duration, i.e., by interpolation for gaps of a maximum of 2 days, whereas for longer gaps long-term averages were used.
2.2. Analysis Methodologies
2.2.1. Time Series Homogenization
Before carrying out the trend analysis, the satellite precipitation time series at each grid cell were inspected for the possible presence of discontinuities/break points through a homogenization procedure aimed at the identification of temporal inconsistencies. This is a common practice in case of rain gauge time series to eliminate, or at least reduce, the non-climatic noise caused by station relocation, changes in instruments, etc., which can affect the trends introducing spurious signals not produced by the real climate variability [30,31,32]. The datasets exploited in the present work come all from a reprocessing activity granting for the use of an unvaried version of the retrieval algorithms over the time. Nevertheless, satellite time series could, in principle, be affected by inhomogeneities due to changes in satellite sensors, rain gauge network density, and data gap fill-up procedure. These aspects can introduce unwanted perturbations. In particular, the exploitation of simultaneous rain gauge measurements within the retrieval algorithms to be merged with the satellite estimates as in ARC2 and CHIRPS can insert inhomogeneities [33]. TARCAT makes use only of an historical rain gauge dataset for the calibration of IR brightness temperatures, and this mitigates the possible effects of the variations of rain gauge network density over time.
Time series discontinuities were detected and corrected through the R-based package “climatol” [34] (available at https://cran.r-project.org/web/packages/climatol/index.html, last accessed 11 June 2018). The software package climatol works with “normalized” time series obtained by dividing each element of the series by the mean. This approach is particularly appropriate for variables with a zero lower limit and a biased frequency distribution, as is precipitation in this work, and especially for daily precipitation, in which zeros may be the most frequent values in the series. “Estimated” precipitation time series are then computed by means of synchronous data from nearby grid cells and the orthogonal regression. The aim is to obtain series of anomalies (observed–estimated data) on which to detect outliers or shifts in the mean through the standard normal homogeneity test (SNHT) [35]. When the SNHT statistics of the series are greater than a prescribed threshold, the series is split at the point of maximum SNHT, giving birth to a new series that is incorporated into the data pool. This procedure is done iteratively, splitting only the series with the higher SNHT values at every iteration, until no series is found inhomogeneous.
The main problem in the homogenization of daily data is the high variability of the series, which lowers the power of detection of shifts in their mean in time. This is why the detection of the inhomogeneities is preferably done on monthly aggregates of the series, with less inherent variability. The aggregation of daily into monthly data and a first exploratory application of the homogen function of the climatol package allowed choosing appropriate thresholds for outlier rejection and break point detection. This exploratory analysis showed that the spotted outliers were most probably real isolated intense precipitation peaks, and therefore no extreme daily rainfall was corrected during the homogenization of the daily series. A new application of this procedure yielded a list of break points, which was used to split the daily series and to obtain the homogeneous series by filling in all missing data resulting from the splitting process. The number of breakpoints detected in the monthly aggregations and corrected in the daily series in each dataset was 136 (ARC2), 204 (CHIRPS), and 271 (TARCAT), impacting 132 (ARC2), 192 (CHIRPS), and 201 (TARCAT) grid cells out of the 9894 cells that cover the analyzed region.
This inspection demonstrated the robustness of the satellite precipitation time series with respect to the homogeneity issue and represents a result in favor of the exploitation of the satellite precipitation datasets for climatological analyses as an alternative and reliable source of data, particularly valuable in this region with limited availability of rain gauge measurements.
2.2.2. CCL/CLIVAR/JCOMM ETCCDI Rainfall Indices
Several authors have introduced precipitation indices to characterize the nature of precipitation [36,37]. In this study, the rainfall variability and trends over EA was investigated considering the ETCCDI Climate Change Index time series [38,39,40,41]. The formulation of these indices was promoted by the CCl/CLIVAR/JCOMM ETCCDI since 1999 to monitor and analyze daily climate records, with the purpose of identifying trends in extreme climate events during the second half of the 20th century. They have been widely used in studies of climate variability at global [42] or regional scale [43,44].
Six precipitation indices were used (Table 1): the number of precipitating days (R1); the number of days with precipitation exceeding 20 mm day−1 (R20); the total precipitation (PRCPTOT), and the simple daily intensity index (SDII), to summarize the characteristics of the wet part of the year; the maximum number of consecutive dry days (CDD), which can be interpreted as a drought indicator; and the corresponding index for the maximum number of consecutive wet days (CWD). These indices are usually employed to analyze precipitation time series from rain gauge stations, but they are computed, hereafter, from the homogenized daily rainfall time series of each satellite product at 0.25° resolution and at seasonal (January–February, JF, MAM, JJAS, and OND) and annual time scales.
2.2.3. Trend Analysis
The nonparametric Mann–Kendall significance test [45,46] is used in climate studies to determine monotonic trends in time series [47,48,49]. In the present study, it was applied to ETCCDI index time series to evaluate the presence of significant trends and map their spatial distribution at annual and seasonal scales. The correlation of the time series was evaluated and the modified Mann–Kendall trend test [50] used for trend analysis in the presence of correlation in space and time. The modified Mann–Kendall trend test takes into account a correction factor, which is applied to the original variance formulation, considering the sample size with temporal autocorrelation. Finally, the non-parametric Sen slope estimator [51] was applied to estimate the magnitude of the change per unit time in a linear trend. The Sen slope estimator is the median value of the slopes Qi of all data pairs in a time series computed as follows:
If n is the number of xj elements in the time series, N = n(n − 1)/2 Qi values will be obtained.
3. East Africa Annual and Seasonal Rainfall Climatology
Rainfall in East Africa is characterized by great spatial variability, as illustrated by the annual means of PRCPTOT, R1, and CDD (obtained by computing the annual mean of the yearly index for each satellite product, and then the ensemble means of the three products) in Figure 2. The annual means for SDII, R20, and CWD are shown in Figure S3. Figure 3 shows the standard deviations of the three-product ensemble as a measure of the spread in the ETCCDI index annual climatologies. The three products show very similar PRCPTOT spatial patterns (Figure 2a) confirmed by standard deviation values within 25% of the ensemble mean values over the majority of EA (Figure 3a), with the exceptions of eastern Ethiopia and the Rift Valley, the arid portion of northern South Sudan, and central Kenya, where the standard deviations rise to 40–50%. These differences stem from the differing algorithmic approaches of the three retrieval methods and from inherent difficulties in estimating rainfall from satellite over complex terrain (e.g., orography, arid areas, etc.), both already discussed in the literature [12,52].
The highest PRCPTOT values (from 1000 to more than 1400 mm year−1) are confined over the mountainous areas of western Ethiopia, Lake Victoria, and the Ruwenzori Mountain Range on the border between Uganda and the Democratic Republic of Congo (DRC). Very low precipitation values (PRCPTOT within 300 mm year−1) characterize the arid regions of northern Somalia, eastern Ethiopia, and South Sudan. The R1 annual mean (number of precipitating days per year; Figure 2b) shows a spatial pattern similar to that of PRCPTOT, i.e., regions with the highest PRCPTOT also exhibit the highest R1 with at least 90 precipitating days, up to more than 200 precipitating days on the Ethiopian Highlands, Lake Victoria, and the DRC. In the other EA areas, there is a drastic decrease in the R1, with values ≤60 days per year, and even <30 days in Sudan and the northern coast of Somalia. Also, in this case, the standard deviation map (Figure 3b) shows a quite uniform spatial pattern, with values <20% of the R1 ensemble mean, except for the arid regions of South Sudan (15–20N), and the central part of Ethiopia and Kenya, where the standard deviations exceed 30%. A vast portion of EA is characterized by precipitating periods lasting no more than 6 consecutive days (CWD index, Figure S3c), with peak values confined over the mountainous areas and Lake Victoria (from 12 up to 40 consecutive precipitating days). These areas are also characterized by the shortest dry periods (CDD index, Figure 2c), no longer than 40 consecutive days. Both indices have standard deviations ranging from 20 to 40%, with the higher values over central Kenya, Ethiopia, and South Sudan (only CWD) (Figure 3c and Figure S4c for CDD and CWD, respectively). The spatial distribution of SDII is quite uniform, with values ranging from 6 to more than 10 mm day−1 (Figure S3a); the southeastern coastal area of Somalia, eastern Kenya, and Ethiopia exhibit the highest SDII values, and correspond also to the areas where the agreement of satellite products decreases (Figure S4a, standard deviation ~ 30–40%). The number of very heavy precipitating days (R20, Figure S3b) does not exceed 10 days per year, on average, except for Lake Victoria, the Ethiopian Highlands, and the DRC. Generally, R20 represents less than 10% of the mean annual number of precipitating days (R1); only eastern Kenya and limited areas in Ethiopia exhibit a greater R20 contribution to R1 (15–20%). The standard deviation of R20 (Figure S4b) is higher with respect to the other indices.
Another feature of the EA rainfall is the marked spatial variability of seasonality, as shown by [12], who divided the EA territory in subareas with respect to rainfall seasonality. West Ethiopia, the Ethiopian Rift Valley and South Sudan are characterized by only one wet season lasting from March–April to September–October, and reaching its maximum during July and August. Proceeding to the southeast, two distinct rainfall peaks are increasingly distinguishable up to the point that two distinct wet seasons (MAM and OND) can be told apart separated by two dry seasons. This seasonal cycle spatial distribution is observable also in Figure 4a–d, where PRCPTOT is shown at seasonal scale. The maximum rainfall accumulation occurs during JJAS in the western portion of the territory, in particular, over the Ethiopian Highlands, where PRCPTOT reaches values up to 1000 mm, thus accounting for more than 50% of the mean annual total precipitation in the area. Moreover, the high total amount of rainfall of this zone matches high R1 values (from 50 to more than 100 precipitating days, Figure 4g), longer wet periods (CWD ≥ 14 days, Figure S5k), and shorter dry periods (CDD values up to 10, Figure 4k), which are scarcely comparable with the values of the other seasons. From Figure 4, JJAS appears to be the major dry season for eastern Ethiopia, Somalia, Kenya, Tanzania, and northern South Sudan. MAM and OND contribute to about 50% of the mean annual PRCPTOT in eastern EA. These two seasons show very similar spatial patterns in terms of the rainfall indices. The highest PRCPTOT values are concentrated over DRC, Uganda, Lake Victoria, central Ethiopia (particularly during MAM), and Kenya, but the peak values are generally lower than those of JJAS. The same is true for the number of precipitating days (R1, Figure 4e–h), which does not exceed 60–70 days, and the duration of the wet periods, generally, is no longer than 16 days. Only Tanzania and the surroundings of Lake Victoria have moderate/weak rainfall in JF, a dry season for almost all EA.
The maps of the ensemble mean standard deviations highlight a more pronounced spread among the values of the rainfall indices of the three satellite products at the seasonal scale (Figure 5 for PRCPTOT, R1, and CDD; Figure S6 for SDII, R20, and CWD). Generally, higher percent standard deviations are associated with lower ensemble mean values, reaching values >90%. PRCPTOT can be taken as a clear example of this behavior, where areas characterized by seasonal rainfall amounts <200 mm exhibit standard deviation values >40%. In addition, the more precipitating regions display standard deviations values within 25%, in agreement with the standard deviations found at the annual scale in the areas with the highest rainfall accumulation.
4. Trend Analysis Results
The results of the trend analysis for the three datasets are summarized by the maps of the Sen slope estimator, with superimposed statistically significant trend areas at confidence levels ≥95% (shaded grid cells) according to the Mann–Kendall test, which are displayed for each index and satellite product at annual and seasonal scale.
Some general issues emerge from the evaluation of trend results: (i) spatial trend patterns can differ among the rainfall products; (ii) not always do all three satellite products show statistically significant trends of a specific rainfall index over the same geographic areas; and (iii) in some cases, only very limited regions have significant trends, and thus, nothing can be concluded on the trend of that index. It should be noted that the three datasets differ substantially in their use of gauge data. In particular, station density is different, leading to quite severe failures in identifying rainfall minima and maxima. The availability of rain gauge data has a fundamental role in the ARC2’s rainfall estimations, where the exploitation of the rain gauges is limited to GTS rain gauge measurements merged with GPI estimates for bias-correction [25]. GTS stations can guarantee only a limited coverage over EA (e.g., only about 20 GTS stations are available over Ethiopia [53] while the number of non-GTS ground stations within the country is much higher) and a percentage of daily reporting, which varies considerably from country to country. CHIRPS makes use of rain gauge data at two stages, in the bias adjustment of the satellite-only precipitation estimates (CHIRP product) through the monthly precipitation climatology CPHclim, and in the final merging phase of CHIRP estimates with simultaneous ground-based measurements [29]. In both cases, wider ground-based datasets are employed with respect to that used in ARC2 algorithm. Finally, a completely different approach was followed in the TARCAT algorithm to fix the problem of the lack of consistency of the station density over time: rain gauges are exploited only for the regional and climatological IR CCD calibration using an historical (non-simultaneous) dataset [26].
4.1. Trend Analysis of Annual Rainfall Indices
The results of the trend analysis of PRCPTOT, R1, and R20 annual index time series are presented in Figure 6, while those of SDII, CDD, and CWD are displayed in Figure S7.
The largest differences are found in PRCPTOT, whereas R1 and CWD are the indices with the best agreement among the three products in terms of the sign of the trend (Figure 6d–f and Figure S7g–i) and trend significance. This is expected, due to the better agreement among the products in terms of R1 and CWD, than PRCPTOT and SDII. Comparisons among the average annual time series of the various indices for the three products over EA (not shown) show substantial agreement for CWD and R1, although with an overestimation of R1 by CHIRPS associated with the use of the TMPA 3B42 version 7 product for the CCD calibration [29]. All datasets show positive R1 trends over the Greater Horn of Africa (GHA, Somalia and eastern Ethiopia), South Sudan, and Uganda, while negative trends characterize eastern Kenya. The product with the widest high confidence areas is TARCAT (high confidence trends over Somalia, eastern Ethiopia, the Ethiopia–Eritrea border, South Sudan, and Uganda, but only a few cells with significant trends over Kenya), followed by CHIRPS and ARC2, both exhibiting significant trends over Kenya. In terms of the trend rates, the best agreement is between CHIRPS and TARCAT, with an R1 decrease over Kenya up to −0.6 precipitating days per year, although the magnitude of the changes is quite small. Similarly, R1 increases up to 1.2 days per year over South Sudan and Uganda. ARC2 is characterized by a more pronounced R1 decrease over Kenya up to −1.5 days per year, a generalized R1 increase over EA within 0.4 days per year, and limited areas with peak rates up to 0.8 days per year. The R1 anomaly time series (hereafter anomaly is the departure of an element from its long-period average value for the location concerned) of the three rainfall products, averaged over Kenya (4S–4N; 36–41E), South Sudan–Uganda (0–20N; 30–35E), and GHA (5–10N; 45–50E) (Figure 7), support the R1 trend analysis results: increasing positive anomalies characterize the South Sudan–Uganda region since 1994, while the increase of positive anomalies started only recently (since 2010) over GHA, usually dominated by R1 negative anomalies. Finally, a predominance of negative anomalies is detected over Kenya starting from 1991, which reach their lowest values around 2000 and 2005, with a slow recovery in recent years. The exceptions to this negative anomaly sequence are the years 1997–1998, 2002, and 2006.
Significant trends are found also for CWD over eastern Kenya, where all the products confirm a moderate negative trend (Figure S7g–i). Considering the rest of EA, only scattered grid cells have significant trends as at the border between Ethiopia and Eritrea where an increase in CWD is detected, and over northern Tanzania, with negative trends confirmed by ARC2 and TARCAT. All rainfall product CWD anomalies averaged over EA reveal a predominance of negative anomalies up to 1 day, starting from 1991 (Figure S8a), which is still confirmed by isolating the CWD anomaly time series over Kenya (Figure S8b). A change from negative to positive CWD anomalies characterizes the temporal evolution over the region at the Ethiopia–Eritrea border (10–15N; 35–40E) since 1998, with a progressive increase of the anomaly values themselves, thus supporting the indication of the trend analysis in this area (Figure S8c).
Limited information can be extracted from the CDD time series analysis (Figure S7d–f): only a few scattered grid cells show significant trends, and little congruence exists among the Sen slope estimator maps of the various rainfall products. ARC2 and TARCAT have more similar patterns with a prevalence of negative trends, while CHIRPS trends are slightly positive (<0.7 days per year). Annual CDD time series averaged over EA (not shown) support the very good agreement between ARC2 and TARCAT Sen slope estimator maps, whereas CHIRPS substantially underestimates CDD with a very scarce interannual variability, probably due to the corresponding overestimation of the number of precipitating days with respect to the other products.
Focusing on the number of days with very heavy precipitation, the R20 index, a wide area including southern South Sudan and the border between DRC and Uganda, displays decreasing significant trends for ARC2 and CHIRPS, with a good agreement also in the trend rate values higher in case of ARC2 (Figure 6g,h). Weak positive trends for both products cover eastern EA and northern South Sudan, but only ARC2 has two high-confidence areas over southern Somalia and western Ethiopia at the border with South Sudan. Completely different results stem from the analysis of TARCAT, whose positive trends are ubiquitous, but without any statistical significance (Figure 6i).
Different spatial patterns result from the trend analysis of PRCPTOT (Figure 6a–c). There is a consensus on positive trends over Somalia and eastern Ethiopia, but only ARC2 and TARCAT show significant trends for this region. Global increase in annual TARCAT PRCPTOT is supported by high confidence levels, but this tendency is not confirmed by the other products. ARC2, in particular, has negative trends over western EA, and positive trends over the eastern sector. Similar results for TARCAT annual trends from 1983 to 2010 over EA are reported in [17] (see their Figure 1h and Figure 2).
Trend analysis results for SDII are similar to those of PRCPTOT (Figure S7a–c). TARCAT shows a widespread positive trend with rates <0.1 mm day−1 per year. ARC2 and TARCAT have the widest areas of significant trends. ARC2 SDII trends are positive over Kenya, Somalia, and eastern Ethiopia, and are confirmed by CHIRPS, although only scattered grid cells show statistically significant trends. ARC2, and to some extent, CHIRPS, provide indications about a decrease in SDII in the western part of the region with higher rates for ARC2 (up to −0.18 mm day−1 per year) than for CHIRPS (−0.05 mm day−1 per year). The analysis of the SDII anomalies shows that ARC2, in particular, exhibits increasing negative anomalies since 1998 over South Sudan–Uganda (0−15N; 30−35E), whereas a sequence of small positive anomalies characterizes TARCAT. All products agree on the sequence of positive SDII anomalies characterizing Kenya–Somalia (5S–5N; 35–50E) since 2002 (Figure S9).
4.2. Trend Analysis of Seasonal Rainfall Indices
4.2.1. January–February (JF) Season
Rainfall is mainly confined to the Lake Victoria area, northern Tanzania, and DRC during this season (Figure 4a). Significant trend areas shared among all satellite products are not evident from Figure 8a–c for PRCPTOT. ARC2 and TARCAT have two distinct regions of significance, Lake Victoria and DRC, respectively. CHIRPS has only scattered grid cells with high levels of significance over DRC, Tanzania, central Ethiopia, and Eritrea. Thus, no consensus on significance exists, but all products display similar spatial trend patterns with a decrease of total precipitation over Lake Victoria and Tanzania (up to −4.8, −1.6, and −0.8 mm per season for ARC2, CHIRPS, and TARCAT, respectively), and an increase over DRC (up to 1.6 mm per season).
The tendency of a decrease in JF PRCPTOT over the whole EA during the last years is perceivable, considering the PRCPTOT anomaly time series (Figure 9). A first period from 1985 to 1998 is characterized by a predominance of increasing positive anomalies, culminating with the prominent 1998 anomaly, a year when EA precipitation was enhanced by the simultaneous presence of El Niño and the positive IOD, starting from late 1997 [24]. A general decrease in the positive anomalies of all rainfall products then follows in favor of a predominance of negative anomalies. PRCPTOT anomaly time series of all rainfall products have negative trends with rates of −0.47, −0.16, and −0.13 mm per season for ARC2, CHIRPS, and TARCAT, respectively.
Confirmation of negative trends of precipitation over Lake Victoria and Tanzania and positive ones over DRC comes also from the R1 trend analysis (Figure 8d–f). Significant negative trends are found over Lake Victoria and Tanzania up to −0.39 (TARCAT) and −0.42 (ARC2) days per season. All datasets show a positive trend over DRC, statistically significant only for CHIRPS and with rates from up to 0.28 (CHIRPS) to 0.14 (TARCAT) days per season. Negative and significant trends characterize all datasets over central Ethiopia with similar spatial pattern for ARC2 and TARCAT.
Limited areas of significant trends are associated with CWD and CDD (Figure S10d−f and Figure 8g−i, respectively). Consistent with previous results, also, the ARC2 and TARCAT CWD exhibit a negative trend over Lake Victoria, and partially over Tanzania, whereas indications of an increased CDD characterize the same regions. Precipitation during this season is the lowest of the year; this is the reason for the almost complete lack of significant trends with respect to R20 (Figure S10g−i). Only up to 3 days per season have rain intensity >20 mm (Figure S5e).
A non-univocal response comes from the SDII trend analysis with an indication of a decreasing trend over Lake Victoria, which accompanies the decreasing tendency of PRCPTOT and R1 for ARC2 and CHIRPS, but with limited significance and a positive trend for TARCAT (Figure S10a–c).
4.2.2. March–April–May (MAM) Season
MAM is the main precipitation season of eastern EA (long rain season), while over the western sector (South Sudan and western Ethiopia) the maximum is reached in JJAS (Figure 4b).
In this season, PRCPTOT trend signatures are not comparable among the datasets (Figure 10a–c). ARC2 and CHIRPS show a predominance of decreasing trends with substantial areas of significance, but centered over opposite zones, i.e., South Sudan, DRC, Uganda, and central Ethiopia at the border with Kenya for ARC2, eastern Ethiopia, southeastern Somalia, and eastern Kenya for CHIRPS. Conversely, TARCAT has a wide area covering South Sudan, Uganda, DRC, and Lake Victoria, with significant positive trends, reaching rates up to 5 mm per season. Moreover, TARCAT areas characterized by decreasing MAM PRCPTOT trends are much less extended than those of the other datasets. Nevertheless, looking at the MAM PRCPTOT anomaly time series, a reduction of total rainfall stands out from all rainfall products over the whole EA (Figure 11). A behavior similar to that of the JF PRCPTOT anomalies (Figure 9), though more pronounced, can be recognized with an abrupt change in the anomaly sign from positive for the period 1985–1998 (only interrupted by the negative anomaly of 1992) to a predominance of negative anomalies since 1999. However, only ARC2 anomalies have a decreasing trend with the rate of −0.91 mm per season, whereas TARCAT and, more weakly, CHIRPS, have positive trend rates of 0.43 and 0.02 mm per season, respectively.
The spatial patterns of the R1 trends resemble those of PRCPTOT, in particular, for CHIRPS and TARCAT, with a correspondence between zones of negative (positive) PRCPTOT trends and R1 negative (positive) trends (Figure S11g–i), and very good agreement of the trend rate values between CHIRPS and TARCAT is found. Nevertheless, in this case, also, ARC2 provides R1 trend spatial patterns resembling those of the other two products, although with limited zones of significance, thus confirming the better agreement among the products with respect to R1, rather than the other indices already expressed in Section 4.1 for the annual trends. The agreement among the three products in terms of PRCPTOT over eastern EA (the area where MAM is the principal wet season) is highly variable from zone to zone (analysis not shown). Kenya, northern Tanzania, and the southern coastal Somalia are characterized by a better correspondence between ARC2 and TARCAT, whereas a wet bias seems to affect the CHIRPS total precipitation. It is very difficult to attribute this behavior to a specific characteristic of the three algorithms. The number of rain gauges steadily decreased in the area (http://chg.geog.ucsb.edu/data/chirps/stations/index.html#_africa, last accessed 11 June 2018); this affected CHIRPS and ARC2 datasets, which merge satellite estimates with simultaneous rain gauge measurements, but only marginally TARCAT, which uses an historical gauge archive for CCD calibration. However, probably this is not the right key to explain the CHIRPS wet bias with respect to ARC2 and TARCAT, which is stable over time without any apparent evolution. On the contrary, Somalia and eastern Ethiopia are characterized by a chronic rain gauge scarcity, and this could justify the better agreement between ARC2 and CHIRPS, similarly lacking of the rain gauge contribution, with respect to TARCAT, which underestimates PRCPTOT (the dry bias issue [26]).
Differences in the spatial patterns of the SDII trends are evident, even if the significance areas are the same for all three satellite datasets, i.e., DRC–Uganda–South Sudan, southern coast of Somalia, and part of Ethiopia (Figure S11a–c). The datasets identify the southern coast of Somalia as a zone of positive trends (TARCAT has the lowest trend rate values up to 0.05 mm day−1 per season). Only ARC2 and CHIRPS display negative trends over DRC–Uganda–South Sudan, with rate values up to −0.15 for ARC2 and −0.05 mm day−1 per season (very weak) for CHIRPS.
Scarce information can be extracted from the CWD trend analysis. Generalized weak positive trends come out of all datasets without significance (Figure 10d–f). Significant negative trends cover only limited areas over Ethiopia (central for TARCAT, and eastern for ARC2 and CHIRPS), central and coastal Kenya, DRC, Ruanda, and Burundi. Considering the average EA MAM CWD anomalies of each rainfall product, a behavior similar to that already observed for PRCPTOT stands out (Figure 12). The anomalies are characterized by a series of negative values interrupted only occasionally, which come after a period (1985–mid-1990s) of consecutive positive CWD anomalies. This change in sign is more evident for TARCAT, which is characterized by the highest values before 1995.
The CDD trend analysis does not offer useful information for this season (Figure S11d–f). Nevertheless, note that positive anomalies over the whole EA indicate an extension of the dry periods since late 1990s (Figure S12).
As for very heavy precipitation events summarized by the R20 index (Figure 10g–i), only the area of South Sudan, DRC, and partially Uganda is characterized by significant negative trends for ARC2 and CHIRPS, in agreement with the decreasing tendency of PRCPTOT and R1 previously observed over this area. TARCAT does not support any significant trends.
4.2.3. June–July–August–September (JJAS) Season
JJAS is the main rain season of western EA and is characterized by the heaviest precipitation concentrated over the western Ethiopian Highlands and DRC (Figure 4c) and the highest number of precipitating days (Figure 4g).
A general characteristic of the trend analysis of JJAS precipitation indices is the larger extent of the areas with statistically significant trends with respect to the previous seasons, in particular, for PRCPTOT, R1, CDD, and SDII. The PRCPTOT spatial trend patterns split the territory in two areas with opposite trend tendencies along a NE–SW direction, the wider areas of significance being on the western part (Figure 13a–c). CHIRPS and TARCAT evidence increasing trends in this part of EA, reaching the maximum rain rate values up to 5 and 6.8 mm per season, respectively.
On the contrary, over the same zone, a decrease in JJAS PRCPTOT is observed from ARC2 data, with rate values up to more than 10 mm per season. A patchier situation characterizes eastern EA, with the simultaneous presence of negative and positive trend areas. The inspection of the PRCPTOT anomalies of the three products confirms the previous results for western EA and the limited agreement among the three products as for precipitation intensity (Figure 14): ARC2 is the rainfall product with the more pronounced sequence of negative anomalies starting from late 1990s (the linear trend rate for ARC2’s anomaly is −3.26 mm per season), whereas CHIRPS and TARCAT display similar anomaly variations with TARCAT, more oriented to an increase of positive anomalies since late 1990s. After all, western EA is a challenging area for the satellite precipitation estimation, due to the presence of a complex orography (Ethiopian Highlands) characterized by intense warm-type precipitation very often underestimated by IR-based algorithms [26,52]. Moreover, it is noteworthy that ARC2 pointed out a marked underestimation of precipitation over Ethiopia specifically during JJAS, motivated by the negative impact of the region’s higher elevations and the failure in capturing warm-type precipitation processes by a methodology based on a fixed brightness temperature (235 K) threshold in the GPI to identify precipitating clouds [25].
R1 provides a strong signal of increasing trend over western EA confirmed by all datasets, and also, the agreement on the trend rates is substantial (Figure 13d–f). In particular, three zones have the strongest trends: the Ethiopian Rift Valley, South Sudan, and Uganda, where the rates reach their maximum values. As a confirmation of this R1 tendency, the R1 anomalies over the whole EA show a prevalence of positive anomalies, with a shared increasing trend since middle 1990s (Figure 15).
Even if the JJAS total number of precipitating days is increasing in western EA, the same is not applicable to the number of very heavy precipitating days R20 (Figure S13g–i). Only ARC2 and CHIRPS show extended areas of significant trends centered over South Sudan at the border with DRC and western Ethiopia, all negative over both areas for ARC2, while being negative over South Sudan–DRC, and positive over Ethiopia for CHIRPS. TARCAT exhibits a generalized weak positive trend, but without areas of significance. Analyzing JJAS R20 anomalies for western EA, it is clear that ARC2, in particular, entered a negative phase since the beginning of the 2000s (Figure S14), which is supportive of the negative trends previously described, but the same is not true for the other rainfall products.
Significant CWD trends take the form of scattered grid cells, with the exception of a limited area over western Ethiopia at the border with Eritrea, where all the three products exhibit strong positive trends (Figure S13d–f). Thus, the R1 extended significant positive trends over the western sector do not imply a clear increase in the duration of the wet periods. On the contrary, the CDD index provides a clearer indication of the tendency of the duration of the dry periods (Figure 13g–i). Apart from the almost ubiquitous significant negative trends of TARCAT, which do not show up for ARC2 and CHIRPS, there are two areas over northern and southern South Sudan characterized by negative significant trends in all products. This result could be interpreted considering that the increase of R1 over these zones does not affect the length of the wet periods, but it happens at the expense of the duration of the dry periods. After all, the CDD anomalies are decreasing with a recent predominance of negative values over western EA (Figure 16).
As for daily rainfall intensity (the SDII index), only ARC2 is characterized by wide zones of significant trends with a spatial pattern resembling that of PRCPTOT (Figure S13a–c). The wider area of trend significance covers southern South Sudan, DRC, Uganda, and western Ethiopia with negative trend up to −0.3 mm day−1 per season, where the SDII decrease goes along with the decreasing PRCPTOT and increasing R1. A further confirmation of the decreasing tendency of SDII especially for ARC2 comes from the anomaly time series for western EA, which are characterized by a series of negative anomalies since 1998 (Figure S15). The observations about the ARC2 underestimations reported previously are applicable also in this case.
4.2.4. October–November–December (OND) Season
OND is the second rainfall season (short rain season) in eastern EA (Somalia, Kenya, Uganda and northern Tanzania, and eastern Ethiopia; Figure 4d).
The best agreement among the satellite products, in terms of spatial trend patterns, stems from the trend analysis in this season, especially for the PRCPTOT, R1, and SDII indices (Figure 17a–f, and Figure S16a–c). A general increase in the total rainfall, number of precipitating days, and daily rainfall intensity characterizes eastern EA in this season. All datasets confirm an increase in PRCPTOT with extended areas of trend significance, even if ARC2 provides a less pronounced response, in terms of extension of the trend significance areas and uniformity of the trend sign as well. Note, also, the existence of an area in central Kenya characterized by PRCPTOT negative trends. All datasets highlight this area, but only CHIRPS identifies it as statistically significant.
The R1 spatial trend patterns match those of PRCPTOT with a generalized increasing trend (Figure 17d–f). The negative trend area over central Kenya is present also for R1 and is identified as significant by all products.
According to the previous results, SDII increases over the eastern part of EA, including Kenya (Figure S16a–c). The highest trend rates characterize the coasts of Somalia and Kenya, reaching the peak values of 0.4 (ARC2), 0.24 (CHIRPS), and 0.18 (TARCAT) mm day−1 per season. SDII anomalies support the results of the trend analysis through a sequence of positive values, starting from middle 1990s in eastern EA (Figure S17).
A small number of precipitating days have intensities >20 mm day−1 in this period of the year, generally <3 days: only a limited area in Kenya exhibits R20 values up to 6 days (Figure S5h). The trend analysis reveals areas of positive trends with significance over Ethiopia and Somalia at the border with Kenya for CHIRPS reaching values up to 0.12 days per season, whereas a wider area of significance with positive trend (rates up to 0.14 days) characterizes ARC2 (Figure S16g–i). TARCAT does not provide any conclusive results due to the almost complete absence of significance.
Even the duration of the wet period, CWD, shows an increasing tendency over eastern EA, with significance limited to eastern Ethiopia and a portion of Somalia (Figure 17g–i). The area of significance is much more restricted than that identified for positive trends in PRCPTOT, R1, or SDII, but it is spotted as a significant area by all the rainfall datasets. Also, in this case, a small portion of central Kenya stands out for a clear negative trend in TARCAT and CHIRPS datasets.
Only TARCAT and ARC2 provide a significant signal of CDD decrease over eastern EA, showing comparable results especially over GHA (Figure S16d–f). CHIRPS results provide fewer elements for the interpretation of the trend due to the fragmentary nature of the significant trend zones and the sign of the trends.
5. Discussion and Conclusions
Six ETCCDI indices, PRCPTOT, R1, R20, SDII, CWD, and CDD, were computed from the daily time series of three satellite precipitation products (ARC2, CHIRPS, and TARCAT) to analyze the spatial and temporal variability and trends of rainfall over EA at annual and seasonal scales, and to investigate the consensus among the responses of the different satellite products.
At the annual scale, three regions are more frequently associated with statistically significant trends, even if they are not always shared among all precipitation products, i.e., central-eastern Kenya, Somalia with part of eastern Ethiopia, and Uganda with adjacent DRC and South Sudan. PRCPTOT, R1, R20, and SDII are the indices with the more extended areas of significant trends, and R1 is the index characterized by the highest consensus among the products in terms of spatial trend patterns followed by R20, CWD, and SDII. According to Sen slope maps, it is possible to identify a tendency toward total precipitation (PRCPTOT) reduction over central-eastern Kenya, followed by a decrease in the number of precipitating days (R1). This is not found for the number of the very heavy precipitation days (R20) and for the daily rainfall intensity (SDII), both characterized by positive trends, without significance for TARCAT and CHIRPS in the case of R20, and statistically significant for all three products in the case of SDII. Similar positive trends of the daily rainfall intensity at the annual scale are reported over Kenya [19] (see their Figure 3, cells G–I), where ARC2 data were analyzed to assess rainfall trends along a transect from northwestern DRC to southern Somalia. Moreover, a substantial rainfall decline in central Kenya is also reported elsewhere [54].
A rising tendency of all the previously mentioned indices is found in Somalia, with wide areas of significant trends more frequent in the southeastern part of the country. A consensus on R1 rising trends, more marked and with wider extension of significance for TARCAT and CHIRPS, characterizes the area including Uganda, DRC, and South Sudan. The indications from the other indices have not the same degree of agreement among the three rainfall products as for R1. SDII and R20 decreasing trends show a good agreement for this region for ARC2 and CHIRPS. On the contrary, TARCAT has a weak rising trend, significant only for SDII. A similar non-homogeneity in the satellite product response is found for PRCPTOT for ARC2, and to a lesser extent, CHIRPS shows negative trends, whereas TARCAT is associated with positive and significant trends.
At the seasonal scale, OND is the season with the most evident results in terms of both trend sign (negative or positive) consensus among the three products, and extension of the trend significance regions. Rising trends stem from the analysis of PRCPTOT, R1, and SDII over eastern EA, the region where OND represents the second wet season after MAM, in agreement with other results [6]. An exception to this increasing tendency is represented by a portion of eastern Kenya, where all the products show a negative trend for PRCPTOT and R1 (PRCPTOT trend with significance only for CHIRPS, R1 trend significant for all datasets), and still confirm the positive trend for SDII. These results for Kenya seem to confirm the findings at the annual scale.
As first noted by Williams and Funk [22], rainfall is substantially reduced in MAM [6,18,55]. In particular, a decline evident since 1980s is already described by Lyon and De Witte [18], but associated with an abrupt rainfall decrease after 1999. Wide regions with negative trends of PRCPTOT, R1, CWD, and R20 indices are found, even if there is not a complete convergence of all satellite products in terms of spatial trend patterns. Anomaly time series for PRCPTOT, CWD, and CDD provide clearer signals of the rainfall decline with a prevalence of negative values (PRCPTOT and CWD) during the 1990s.
JJAS results are difficult to interpret due to the disagreement among the three products. R1 provides the most unambiguous signal with rising trends over western EA for the three datasets, whose maximum values are located over Uganda, South Sudan, and western Ethiopia, with rates from 0.73 to 0.80 days per season. Another significant index is CDD, characterized by decreasing trends, in particular, over Uganda and South Sudan, supported by a sequence of negative anomalies since mid-1990s. This is a season of rainfall reduction [55,56,57], but it is difficult to extract a conclusive outcome for PRCPTOT from the examined satellite products: CHIRPS and TARCAT are associated with rising trends over the western part of the territory, but the same is not true for ARC2.
In JF, all satellite products detect positive trends for PRCPTOT and R1 over DRC and negative over Uganda and Lake Victoria, but without a consensus on the significance areas. PRCPTOT anomalies from the satellite products over EA reinforce the insight on rainfall decrease through a series of negative values since 1999. The literature on precipitation in these months is limited: only Maidment et al. [17] report weak negative trends without significance over the region.
Large-scale factors were associated with rainfall trends in the literature, especially for the MAM and OND rain seasons [58]. The fast warming of the Indian Ocean over the past 60 years, which extended westward the tropical warm pool and the western ascending branch of the Walker circulation, was identified as a driver for the MAM rainfall decline [22]. Moreover, MAM rainfall negative trends were linked to an enhanced east–west SST gradient in the western Pacific, resulting from a warming process in the western Pacific near Indonesia [6]. The consequent enhancement of Walker circulation would have induced an increased subsidence over EA. The recent positive trends observed in the OND rainfall were associated with an enhanced SST gradient across the Indian Ocean [6]. Between 1979 and 2012, an SST increase of 0.48 °C over the western Indian Ocean and a decrease of 0.26 °C over the eastern part were observed. Considering the strong correlation between the OND rainfall and the IOD [6,24], the mentioned SST variations over the Indian Ocean support the observed increasing trends. The long-term variability of short rains and its connections to large-scale factors were analyzed also by Nicholson [59] for a time period of 139 years (1874–2012), considering the relationships among rainfall and zonal wind at the surface and 200 hPa over the central equatorial Indian Ocean, Niño3.4, and IOD indices. Results demonstrated that these relationships are time dependent with changes on a decadal timescale, and zonal winds playing the stronger role in producing wet conditions. Moreover, it is demonstrated how the development of the zonal circulation over the Indian Ocean, accompanied with the weakening of the Pacific cell starting from about 1961, was conducive to a marked increase in the OND rainfall and its interannual variability.
The present analysis demonstrates that satellite rainfall estimates provide long-term datasets, which can be profitably exploited for the evaluation of rainfall trends. In spite of the algorithmic differences, which sometimes make the trend responses more subjective or satellite product-dependent, it is possible to extract suggestions on the areas more exposed to recent rainfall variability, taking into account that the EA territory poses great challenges to the satellite remote sensing of precipitation, due to complex topography and presence of arid areas [12,52].
Trying to summarize some lessons learned regarding the general quality of these long-term rainfall products and their suitability for climatological analysis of the EA rainfall, the present results show that TARCAT and CHIRPS stand out as the most complete and structured approaches to the daily rainfall estimate from using IR satellite data at high spatial resolution. They fully exploit satellite and ground-based data resources. Moreover, CHIRPS includes passive microwave estimates through the direct use of the monthly precipitation climatology CPHclim and in the CCD calibration phase [29]. It must also be mentioned that the next studies will benefit from the recently released version 3 of the TARCAT dataset, whose first results have been described in the literature [27,33]. Whilst maintaining its peculiarity concerning the exclusive use of a historical rain gauge dataset, several aspects regarding the calibration process were updated in this new version of TARCAT with the intent to fix known problems, i.e., the dry bias and the unrealistic spatial artefacts that originated from the use of rectangular calibration zones.
Supplementary Materials
Additional figures are available online at https://0-www-mdpi-com.brum.beds.ac.uk/2072-4292/10/6/931/s1.
Author Contributions
E.C. and V.L. conceived and designed the study and wrote the paper; A.M. carried on several of the statistical tests and analyses; J.A.G. applied the homogenization to the datasets.
Acknowledgments
This study was supported by the European Union’s Seventh Programme for research, technological development, and demonstration under Grant Agreement 603608 (eartH2Observe). The authors acknowledge NOAA/CPC; the Climate Hazards Group (CHG) of the University of California, Santa Barbara; the Dept. of Meteorology of the University of Reading for archiving and providing full access to the precipitation datasets exploited in this article. Datasets can be accessed at the following websites: ARC2 (ftp://ftp.cpc.ncep.noaa.gov/fews/fewsdata/africa/arc2/bin) CHIRPS (ftp://ftp.chg.ucsb.edu/pub/org/chg/products/CHIRPS-2.0) TARCAT (http://tamsat.org.uk/cgi-bin/data/index.cgi). NCAR is acknowledged for the software NCAR Command Language (NCL) version 6.4.0 (2017, Boulder, Colorado: UCAR/NCAR/CISL/TDD. http://0-dx-doi-org.brum.beds.ac.uk/10.5065/D6WD3XH5).
Conflicts of Interest
The authors declare no conflict of interest.
Abbreviations
| ARC2 | Africa Rainfall Climatology v.2 |
| CCD | Cold Cloud Duration |
| CDD | Consecutive Dry Days index |
| CDR | Climate Data Record |
| CHG | Climate Hazards Group of University of California, Santa Barbara |
| CHIRP | CHG InfraRed Precipitation |
| CHIRPS | CHG InfraRed Precipitation with Stations |
| CHPclim | CHG Precipitation Climatology |
| CMAP | CPC Merged Analysis of Precipitation |
| CMIP5 | Coupled Model Intercomparison Project Phase 5 |
| CPC | Climate Prediction Center |
| CRU | Climate Research Unit |
| CWD | Consecutive Wet Days index |
| DRC | Democratic Republic of Congo |
| EA | East Africa |
| ECV | Essential Climate Variable |
| EM-DAT | Emergency Events Database |
| ETCCDI | Expert Team on Climate Change Detection and Indices |
| GHA | Greater Horn of Africa |
| GOES | Geostationary Operational Environmental Satellite |
| GPCC | Global Precipitation Climatology Center |
| GPCP | Global Precipitation Climatology Project |
| GPI | GOES Precipitation Index |
| GTS | Global Telecommunication System |
| IOD | Indian Ocean Dipole |
| IR | Infrared |
| JF | January–February |
| JJAS | June–July–August–September |
| MAM | March–April–May |
| NCAR | National Center for Atmospheric Research |
| NCL | NCAR Command Language |
| OND | October–November–December |
| PRCPTOT | Total precipitation index |
| R1 | Number of precipitating days index |
| R20 | Number of days with precipitation exceeding 20 mm day−1 index |
| SDII | Simple Daily Intensity Index |
| SNHT | Standard Normal Homogeneity Test |
| SST | Sea Surface Temperature |
| TAMSAT | Tropical Applications of Meteorology using SATellite |
| TARCAT | TAMSAT African Rainfall Climatology And Time series |
| TMPA | TRMM Multi-satellite Precipitation Analysis |
| TRMM | Tropical Rainfall Measuring Mission |
| UN-OCHA | United Nation Office for the Coordination of Humanitarian Affairs |
References
- FAO. The Impact of Disasters on Agriculture and Food Security; FAO: Rome, Italy, 2015; 54p, ISBN 978-92-5-108962-0. Available online: http://www.fao.org/publications/card/en/c/fa17f187-9b92-439f-9952-1d6c13d14782/ (accessed on 13 March 2018).
- Nicholson, S.E. An analysis of recent rainfall conditions in eastern Africa. Int. J. Climatol. 2016, 36, 526–532. [Google Scholar] [CrossRef]
- Webb, P.; von Braun, J. Drought and Food Shortages in Ethiopia: A Preliminary Review of Effects and Policy Implications; International Food Policy Research Institute: Washington, DC, USA, 1990; 169p. Available online: http://pdf.usaid.gov/pdf_docs/PNABI218.pdf (accessed on 19 March 2018).
- Lyon, B. Seasonal drought in the Greater Horn of Africa and its recent increase during the March-May long rains. J. Clim. 2014, 27, 7953–7975. [Google Scholar] [CrossRef]
- Masih, I.; Maskey, S.; Mussá, F.E.F.; Trambauer, P. A review of droughts on the African continent—A geospatial and long-term perspective. Hydrol. Earth Syst. Sci. 2014, 18, 3635–3649. [Google Scholar] [CrossRef]
- Liebmann, B.; Hoerling, M.P.; Funk, C.; Bladé, I.; Dole, R.M.; Allured, D.; Quan, X.; Pegion, P.; Eischeid, J.K. Understanding recent eastern Horn of Africa rainfall variability and change. J. Clim. 2014, 27, 8630–8645. [Google Scholar] [CrossRef]
- Kijazi, A.; Reason, C.J.C. Analysis of the 2006 floods over northern Tanzania. Int. J. Climatol. 2009, 29, 955–970. [Google Scholar] [CrossRef] [Green Version]
- Bayissa, Y.; Maskey, S.; Tadesse, T.; van Andel, S.J.; Moges, S.; van Griensven, A.; Solomatine, D. Comparison of the performance of six drought índices in characterizing historical drought for the Upper Blue Nile Basin, Ethiopia. Geosciences 2018, 8, 81. [Google Scholar] [CrossRef]
- Gitau, W.; Camberlin, P.; Ogallo, L.; Bosire, E. Trends of intraseasonal descriptors of wet and dry spells over equatorial eastern Africa. Int. J. Climatol. 2018, 38, 1189–1200. [Google Scholar] [CrossRef]
- Prudhomme, C.; Giuntoli, I.; Robinson, E.L.; Clark, D.B.; Arnell, N.W.; Dankers, R.; Fekete, B.M.; Franssen, W.; Gerten, D.; Gosling, S.N.; et al. Hydrological droughts in the 21st century, hotspots and uncertainties from a global multimodel ensemble experiment. Proc. Natl. Acad. Sci. USA 2014, 111, 3262–3267. [Google Scholar] [CrossRef] [PubMed] [Green Version]
- Adhikari, U.; Nejadhashemi, A.P.; Woznicki, S.A. Climate change and eastern Africa: A review of impact on major crops. Food Energy Secur. 2015, 4, 110–132. [Google Scholar] [CrossRef]
- Cattani, E.; Merino, A.; Levizzani, V. Evaluation of monthly satellite-derived precipitation products over East Africa. J. Hydrometeorol. 2016, 17, 2555–2573. [Google Scholar] [CrossRef]
- Yang, W.; Seager, R.; Cane, M.A. The annual cycle of East African precipitation. J. Clim. 2015, 28, 2385–2404. [Google Scholar] [CrossRef]
- Seleshi, Y.; Zanke, U. Recent changes in rainfall and rainy days in Ethiopia. Int. J. Climatol. 2004, 24, 973–983. [Google Scholar] [CrossRef] [Green Version]
- Cheung, W.H.; Senay, G.B.; Singh, A. Trends and spatial distribution of annual and seasonal rainfall in Ethiopia. Int. J. Climatol. 2008, 28, 1723–1734. [Google Scholar] [CrossRef] [Green Version]
- Jury, M.R.; Funk, C. Climatic trends over Ethiopia: Regional signals and drivers. Int. J. Climatol. 2013, 33, 1924–1935. [Google Scholar] [CrossRef]
- Maidment, R.; Allan, R.P.; Black, E. Recent observed and simulated changes in precipitation over Africa. Geophys. Res. Lett. 2015, 42, 8155–8164. [Google Scholar] [CrossRef] [Green Version]
- Lyon, B.; DeWitt, D.G. A recent and abrupt decline in the East African long rains. Geophys. Res. Lett. 2012, 39, L02702. [Google Scholar] [CrossRef]
- Diem, J.E.; Ryan, S.J.; Hartter, J.; Palace, M.W. Satellite-based rainfall data reveal a recent drying trend in central equatorial Africa. Clim. Chang. 2014, 126, 263–272. [Google Scholar] [CrossRef]
- Yang, W.; Seager, R.; Cane, M.A. The East African long rains in observations and models. J. Clim. 2014, 27, 7185–7202. [Google Scholar] [CrossRef]
- Verdin, J.; Funk, C.; Senay, G.; Choularton, R. Climate science and famine early warning. Philos. Trans. R. Soc. B 2005, 360, 2155–2168. [Google Scholar] [CrossRef] [PubMed] [Green Version]
- Williams, A.P.; Funk, C. A westward extension of the warm pool leads to a westward extension of the Walker circulation, drying eastern Africa. Clim. Dyn. 2011, 37, 2147–2435. [Google Scholar] [CrossRef]
- Bojinski, S.; Verstraete, M.; Peterson, T.C.; Richter, C.; Simmons, A.; Zemp, M. The concept of Essential Climate Variables in support of climate research, applications, and policy. Bull. Am. Meteorol. Soc. 2014, 95, 1431–1443. [Google Scholar] [CrossRef]
- Wenhaji Ndomeni, C.; Cattani, E.; Merino, A.; Levizzani, V. An observational study of the variability of East African rainfall with respect to sea surface temperature and soil moisture. Q. J. R. Meteorol. Soc. 2018. [Google Scholar] [CrossRef]
- Novella, N.S.; Thiaw, W.M. African rainfall climatology version 2 for Famine Early Warning Systems. J. Appl. Meteorol. Climatol. 2013, 52, 588–606. [Google Scholar] [CrossRef]
- Maidment, R.; Grimes, D.; Allan, R.P.; Tarnavsky, E.; Stringer, M.; Hewison, T.; Roebeling, R.; Black, E. The 30 year TAMSAT African Rainfall Climatology and Time series (TARCAT) data set. J. Geophys. Res. 2014, 119, 10619–10644. [Google Scholar] [CrossRef]
- Maidment, R.; Grimes, D.; Black, E.; Tarnavsky, E.; Young, M.; Greatrex, H.; Allan, R.P.; Stein, T.; Nkonde, E.; Senkunda, S.; et al. A new, long-term daily satellite-based rainfall dataset for operational monitoring in Africa. Sci. Data 2017, 4, 170063. [Google Scholar] [CrossRef] [PubMed] [Green Version]
- Tarnavsky, E.; Grimes, D.; Maidment, R.; Black, E.; Allan, R.; Stringer, M.; Chadwick, R.; Kayitakire, F. Extension of the TAMSAT satellite-based rainfall monitoring over Africa and from 1983 to present. J. Appl. Meteorol. Climatol. 2014, 53, 2805–2822. [Google Scholar] [CrossRef]
- Funk, C.; Peterson, P.; Landsfeld, M.; Pedreros, D.; Verdin, J.; Shukla, S.; Husak, G.; Rowland, J.; Harrison, L.; Hoell, A.; et al. The climate hazards infrared precipitation with stations—A new environmental record for monitoring extremes. Sci. Data 2015, 2, 150066. [Google Scholar] [CrossRef] [PubMed]
- Brunetti, M.; Maugeri, M.; Monti, F.; Nanni, T. Temperature and precipitation variability in Italy in the last two centuries from homogenised instrumental time series. Int. J. Climatol. 2006, 26, 345–381. [Google Scholar] [CrossRef] [Green Version]
- Longobardi, A.; Villani, P. Trend analysis of annual and seasonal rainfall time series in the Mediterranean area. Int. J. Climatol. 2010, 30, 1538–1546. [Google Scholar] [CrossRef]
- Otte, I.; Detsch, F.; Mwangomo, E.; Hemp, A. Multidecadal trends and interannual variability of rainfall as observed from five lowland stations at Mt. Kilimanjaro, Tanzania. J. Hydrometeorol. 2017, 18, 349–361. [Google Scholar] [CrossRef]
- Dinku, T.; Funk, C.; Peterson, P.; Maidment, R.; Tadesse, T.; Gadain, H.; Ceccato, P. Validation of the CHIRPS satellite rainfall estimates over eastern of Africa. Q. J. R. Meteorol. Soc. 2018. [Google Scholar] [CrossRef]
- Gujarro, J.A. Automatización de la homogeneización de series climáticas: Nuevas funciones del paquete Climatol 3.0. In Clima, Sociedad, Riesgos y Ordenación del Territorio; Olcina, J., Rico, A.M., Moltó, E., Eds.; Universidad de Alicante: Alicante, Spain; Asociación Española de Climatología: Zaragoza, Spain, 2016; pp. 153–160. ISBN 978-84-16724-19-2. [Google Scholar]
- Alexandersson, H. A homogeneity test applied to precipitation data. Int. J. Climatol. 1986, 6, 661–675. [Google Scholar] [CrossRef]
- López-Moreno, J.I.; Vicente-Serrano, S.M.; Angulo-Martínez, M.; Beguería, S.; Kenawy, A. Trends in daily precipitation on the northeastern Iberian Peninsula, 1955–2006. Int. J. Climatol. 2010, 30, 1026–1041. [Google Scholar] [CrossRef] [Green Version]
- Rodrigo, F.S.; Trigo, R.M. Trends in daily rainfall in the Iberian Peninsula from 1951 to 2002. Int. J. Climatol. 2007, 27, 513–529. [Google Scholar] [CrossRef] [Green Version]
- Karl, T.R.; Nicholls, N.; Ghazi, A. CLIVAR/GCOS/WMO workshop on indices and indicators for climate extremes: Workshop summary. Clim. Chang. 1999, 42, 3–7. [Google Scholar] [CrossRef]
- Peterson, T.C.; Folland, C.; Gruza, G.; Hogg, W.; Mokssit, A.; Plummer, N. Report on the Activities of the Working Group on Climate Change Detection and Related Rapporteurs 1998–2001; WMO, Report WCDMP-47, WMO-TD 1071; WMO: Geneva, Switzerland, 2001; 143p, Available online: http://etccdi.pacificclimate.org/docs/wgccd.2001.pdf (accessed on 13 March 2018).
- Frich, P.; Alexander, L.V.; Della-Marta, P.; Gleason, B.; Haylock, M.; Klein Tank, A.M.G.; Peterson, T. Observed coherent changes in climatic extremes during the second half of the twentieth century. Clim. Res. 2002, 19, 193–212. [Google Scholar] [CrossRef] [Green Version]
- Zhang, X.; Alexander, L.; Hegerl, G.C.; Jones, P.; Klein Tank, A.; Peterson, T.C.; Trewin, B.; Zwiers, F.W. Indices for monitoring changes in extremes based on daily temperature and precipitation data. WIREs Clim. Chang. 2011, 2, 851–870. [Google Scholar] [CrossRef]
- Alexander, L.V.; Zhang, X.; Peterson, T.C.; Caesar, J.; Gleason, B.; Klein Tank, A.M.G.; Haylock, M.; Collins, D.; Trewin, B.; Rahimzadeh, F.; et al. Global observed changes in daily climate extremes of temperature and precipitation. J. Geophys. Res. 2006, 111, D05109. [Google Scholar] [CrossRef]
- Aguilar, E.; Peterson, T.C.; Ramírez Obando, P.; Frutos, R.; Retana, J.A.; Solera, M.; Soley, J.; González García, I.; Araujo, R.M.; Rosa Santos, A.; et al. Changes in precipitation and temperature extremes in Central America and northern South America, 1961–2003. J. Geophys. Res. 2005, 110, D23107. [Google Scholar] [CrossRef]
- Zolina, O.; Simmer, C.; Kapala, A.; Bachner, S.; Gulev, S.; Maechel, H. Seasonally dependent changes of precipitation extremes over Germany since 1950 from a very dense observational network. J. Geophys. Res. 2008, 113, D06110. [Google Scholar] [CrossRef]
- Mann, H.B. Non-parametric tests against trend. Econometrica 1945, 13, 245–259. [Google Scholar] [CrossRef]
- Kendall, M.G. Rank Correlation Methods, 4th ed.; Charles Griffin: London, UK, 1975; ISBN 978-0195208375. [Google Scholar]
- Santos, M.; Fragoso, M. Precipitation variability in Northern Portugal: Data homogeneity assessment and trends in extreme precipitation indices. Atmos. Res. 2013, 131, 34–45. [Google Scholar] [CrossRef]
- Merino, A.; Fernández-Vaquero, M.; López, L.; Fernández-González, S.; Hermida, L.; Sánchez, J.L.; García-Ortega, E.; Gascón, E. Large-scale patterns of daily precipitation extremes on the Iberian Peninsula. Int. J. Climatol. 2016, 36, 3873–3891. [Google Scholar] [CrossRef]
- Tian, J.; Liu, J.; Wang, J.; Li, C.; Nie, H.; Yu, F. Trend analysis of temperature and precipitation extremes in major grain producing area of China. Int. J. Climatol. 2016, 37, 672–687. [Google Scholar] [CrossRef]
- Hamed, K.H.; Rao, A.R. A modified Mann-Kendall trend test for autocorrelated data. J. Hydrol. 1998, 204, 182–196. [Google Scholar] [CrossRef]
- Sen, P.K. Estimates of the regression coefficient based on Kendall’s tau. J. Am. Stat. Assoc. 1968, 63, 1379–1389. [Google Scholar] [CrossRef]
- Dinku, T.; Ceccato, P.; Connor, S.J. Challenges of satellite rainfall estimation over mountainous and arid parts of east Africa. Int. J. Remote Sens. 2011, 32, 5965–5979. [Google Scholar] [CrossRef]
- Dinku, T.; Block, P.; Sharoff, J.; Hailemariam, K.; Osgood, D.; del Corral, J.; Cousin, R.; Thomson, M.C. Bridging critical gaps in climate services and applications in Africa. Earth Perspect. 2014, 1, 1–15. [Google Scholar] [CrossRef]
- Funk, C. A Climate Trend Analysis of Kenya-August 2010. U.S. Geological Survey Fact Sheet 2010-3074. 2010; 4p. Available online: https://pubs.usgs.gov/fs/2010/3074/ (accessed on 13 March 2018).
- Tierney, J.E.; Ummenhofer, C.C.; deMenocal, P.B. Past and future rainfall in the Horn of Africa. Sci. Adv. 2015, 1, e1500682. [Google Scholar] [CrossRef] [PubMed]
- Williams, A.P.; Funk, C.; Michaelsen, J.; Rauscher, S.A.; Robertson, I.; Wils, T.H.G.; Koprowski, M.; Eshetu, Z.; Loader, N.J. Recent summer precipitation trends in the Greater Horn of Africa and the emerging role of Indian Ocean sea surface temperature. Clim. Dyn. 2012, 39, 2307–2328. [Google Scholar] [CrossRef]
- Brown, M.E.; Funk, C.; Pedreros, D.; Korecha, D.; Lemma, M.; Rowland, J.; Williams, E.; Verdin, J. A climate trend analysis of Ethiopia: Examining subseasonal climate impacts on crops and pasture conditions. Clim. Chang. 2017, 142, 169–182. [Google Scholar] [CrossRef]
- Nicholson, S.E. Climate and climatic variability of rainfall over eastern Africa. Rev. Geophys. 2017, 55, 590–635. [Google Scholar] [CrossRef]
- Nicholson, S.E. Long-term variability of the East African ‘short rains’ and its links to large-scale factors. Int. J. Climatol. 2015, 35, 3979–3990. [Google Scholar] [CrossRef]
Figure 1.
Geographic map of the East Africa study region.

Figure 2.
Maps of the annual climatology of PRCPTOT (a), R1 (b), and CDD (c). For each annual index and satellite product, the annual climatology was first computed, followed by the average over the three products (ensemble mean).
Figure 2.
Maps of the annual climatology of PRCPTOT (a), R1 (b), and CDD (c). For each annual index and satellite product, the annual climatology was first computed, followed by the average over the three products (ensemble mean).

Figure 3.
Maps of ensemble mean standard deviations of the rainfall indices in Figure 2, expressed as percentage of the three products’ ensemble mean: PRCPTOT (a), R1 (b), and CDD (c).
Figure 3.
Maps of ensemble mean standard deviations of the rainfall indices in Figure 2, expressed as percentage of the three products’ ensemble mean: PRCPTOT (a), R1 (b), and CDD (c).

Figure 4.
Maps of seasonal rainfall index climatology: PRCPTOT (a–d); R1 (e–h); CDD (i–l). Each column refers to a season in the following order, January–February (JF), March–April–May (MAM), June–July–August–September (JJAS), and October–November–December (OND). Indices were computed with the same procedure of the annual indices but taking seasons as reference periods.

Figure 5.
Maps of ensemble mean standard deviations of the seasonal rainfall indices in Figure 4, expressed as percentage of the three products’ ensemble mean: PRCPTOT (a–d); R1 (e–h); CDD (i–l).
Figure 5.
Maps of ensemble mean standard deviations of the seasonal rainfall indices in Figure 4, expressed as percentage of the three products’ ensemble mean: PRCPTOT (a–d); R1 (e–h); CDD (i–l).

Figure 6.
Sen slope estimator maps relative to annual trends of PRCPTOT (a–c), R1 (d–f), and R20 (g–i) for Africa Rainfall Climatology version 2.0 (ARC2) (left column), Climate Hazards Group InfraRed Precipitation with Stations (CHIRPS) (central column), and Tropical Applications of Meteorology using SATellite (TAMSAT) African Rainfall Climatology And Time series version 2 (TARCAT) (right column) datasets. Stippled grid cells display statistically significant trend at confidence level ≥ 95%.

Figure 7.
Annual R1 anomaly time series: ARC2 (long-dashed), TARCAT (short dashed), and CHIRPS (solid). Anomalies were averaged over Kenya (a), South Sudan–Uganda (b), and the Greater Horn of Africa (GHA) (c).
Figure 7.
Annual R1 anomaly time series: ARC2 (long-dashed), TARCAT (short dashed), and CHIRPS (solid). Anomalies were averaged over Kenya (a), South Sudan–Uganda (b), and the Greater Horn of Africa (GHA) (c).

Figure 8.
Same as in Figure 6, but for JF PRCPTOT (a–c), R1 (d–f), and CDD (g–i).
Figure 8.
Same as in Figure 6, but for JF PRCPTOT (a–c), R1 (d–f), and CDD (g–i).

Figure 9.
JF PRCPTOT anomaly time series over the whole East Africa (EA).

Figure 10.
Same as in Figure 6, but for MAM PRCPTOT (a–c), CWD (d–e), and R20 (g–i).
Figure 10.
Same as in Figure 6, but for MAM PRCPTOT (a–c), CWD (d–e), and R20 (g–i).

Figure 11.
MAM PRCPTOT anomaly time series over the whole EA.

Figure 12.
MAM CWD anomaly time series over the whole EA.

Figure 13.
Same as in Figure 6 but for JJAS PRCPTOT (a–c), R1 (d–f), and CDD (g–i).
Figure 13.
Same as in Figure 6 but for JJAS PRCPTOT (a–c), R1 (d–f), and CDD (g–i).

Figure 14.
JJAS PRCPTOT anomaly time series over western EA.

Figure 15.
JJAS R1 anomaly time series for the whole EA.

Figure 16.
JJAS CDD anomaly time series over western EA.

Figure 17.
Same as in Figure 6, but for OND PRCPTOT (a–c), R1 (d–f), and CWD (g–i).
Figure 17.
Same as in Figure 6, but for OND PRCPTOT (a–c), R1 (d–f), and CWD (g–i).


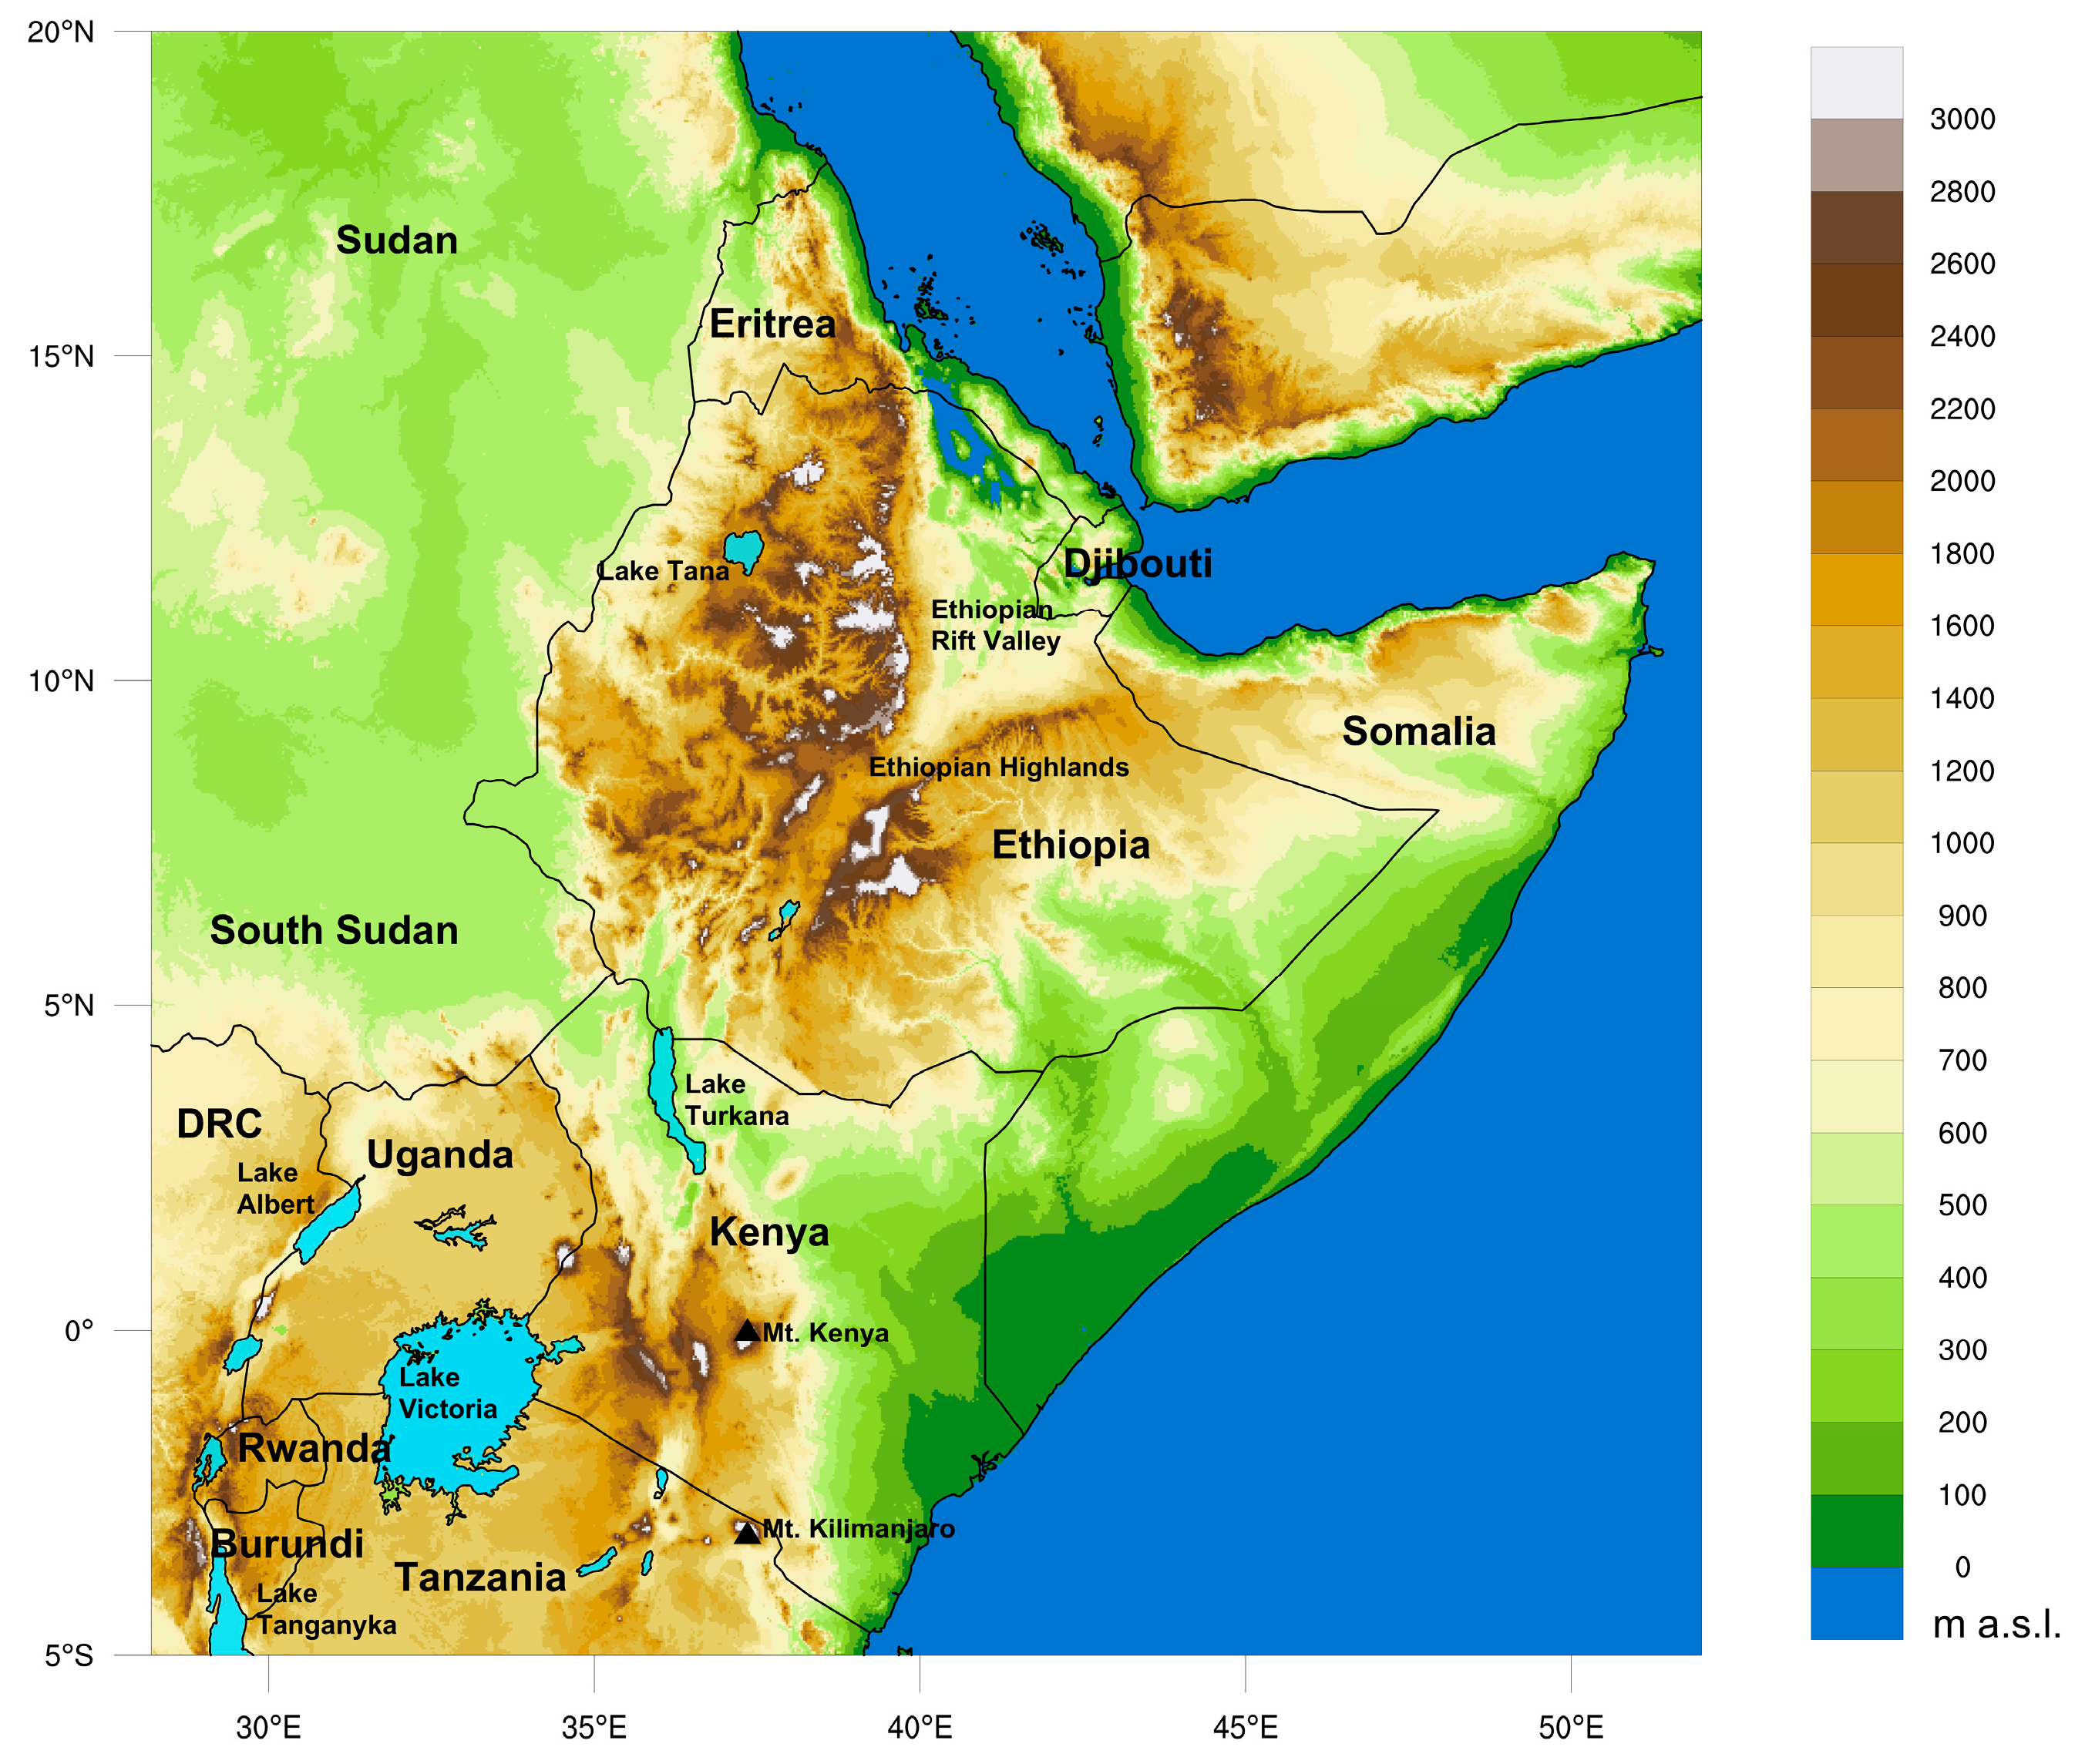
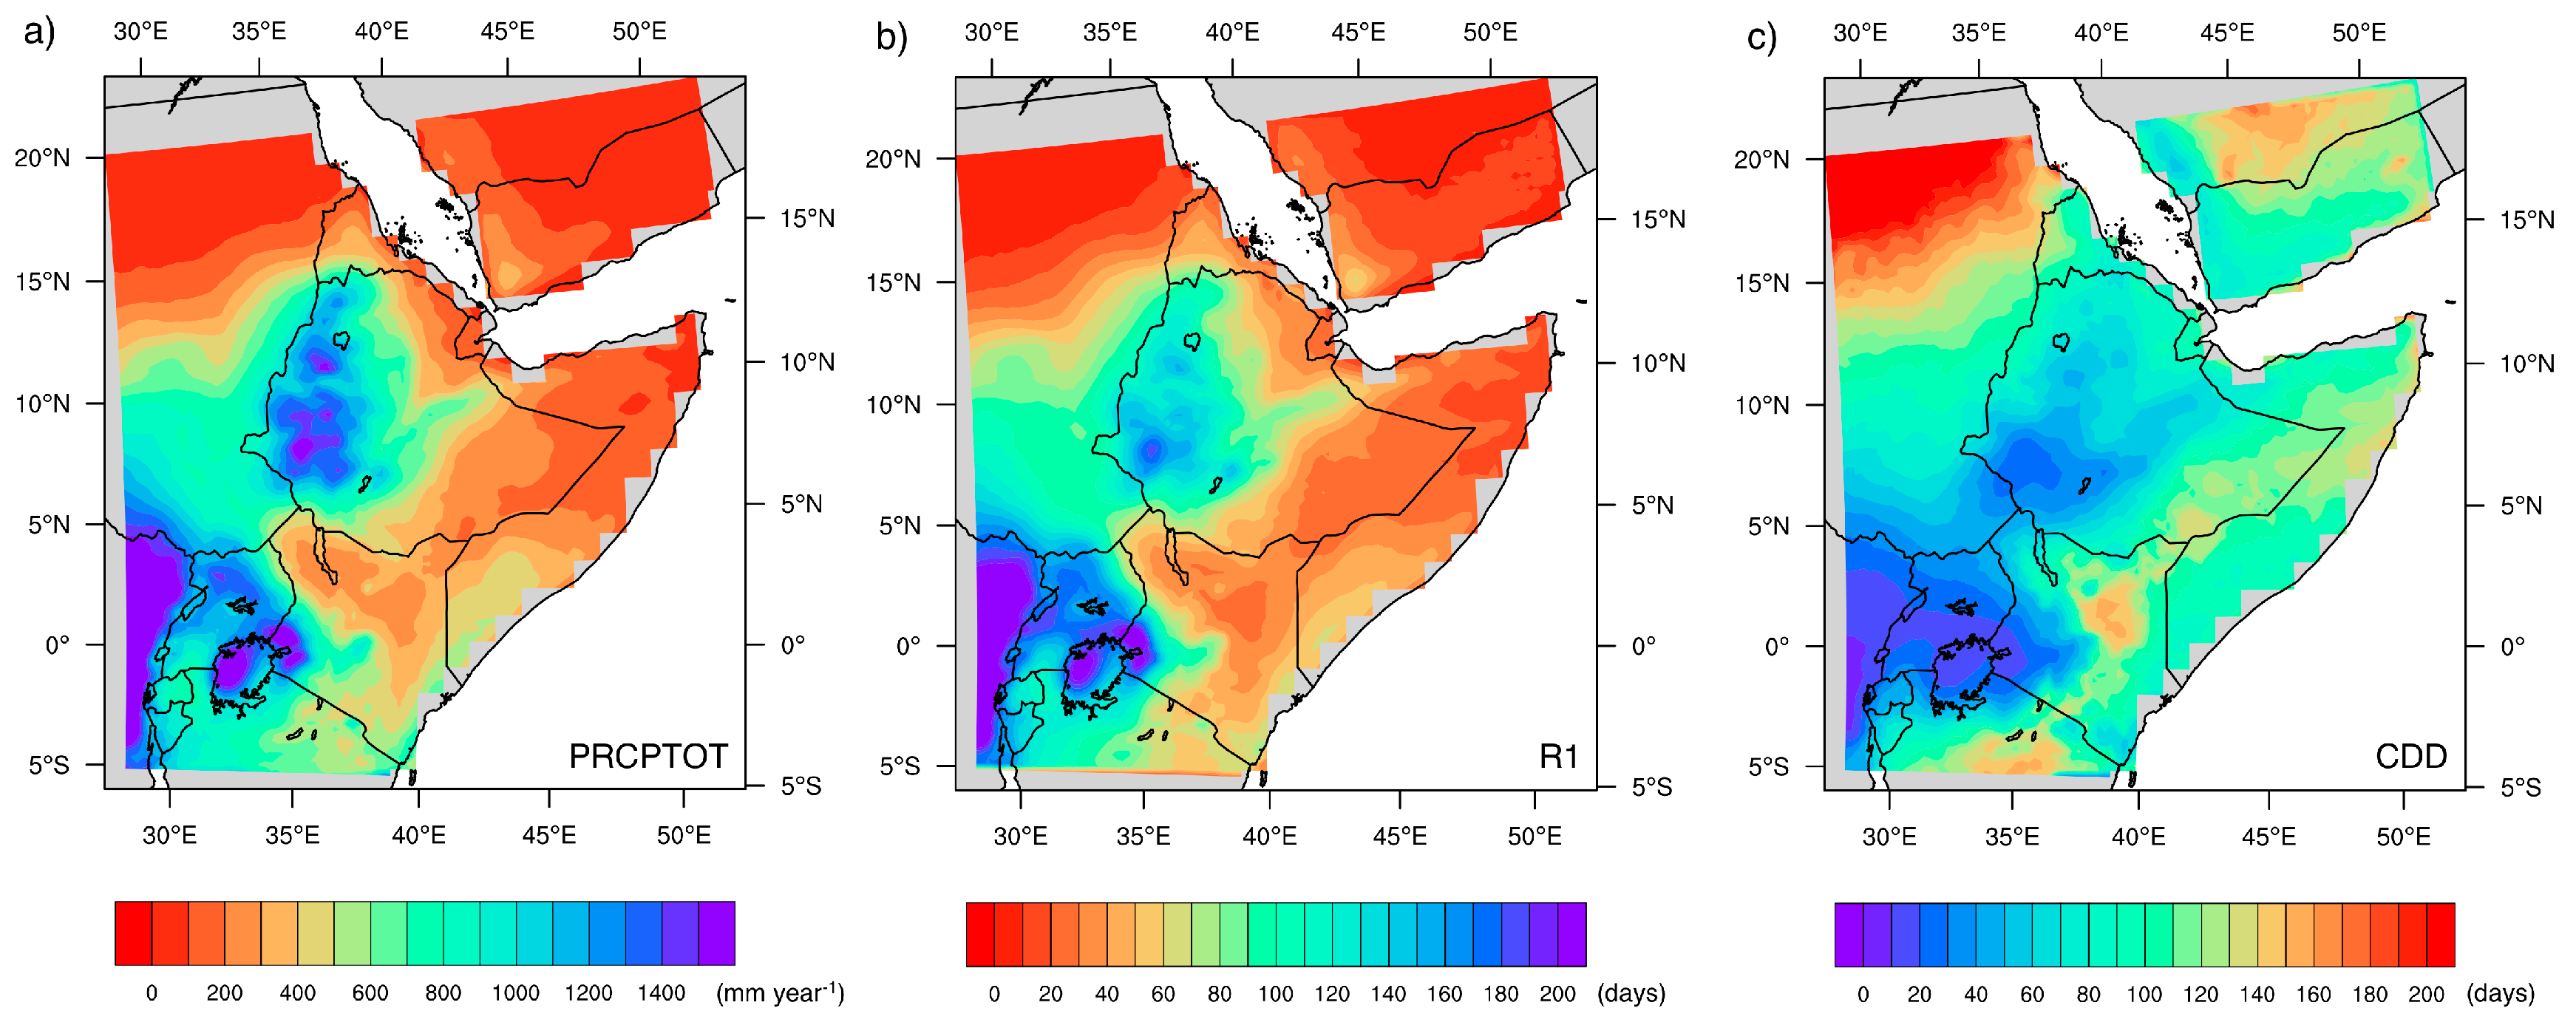
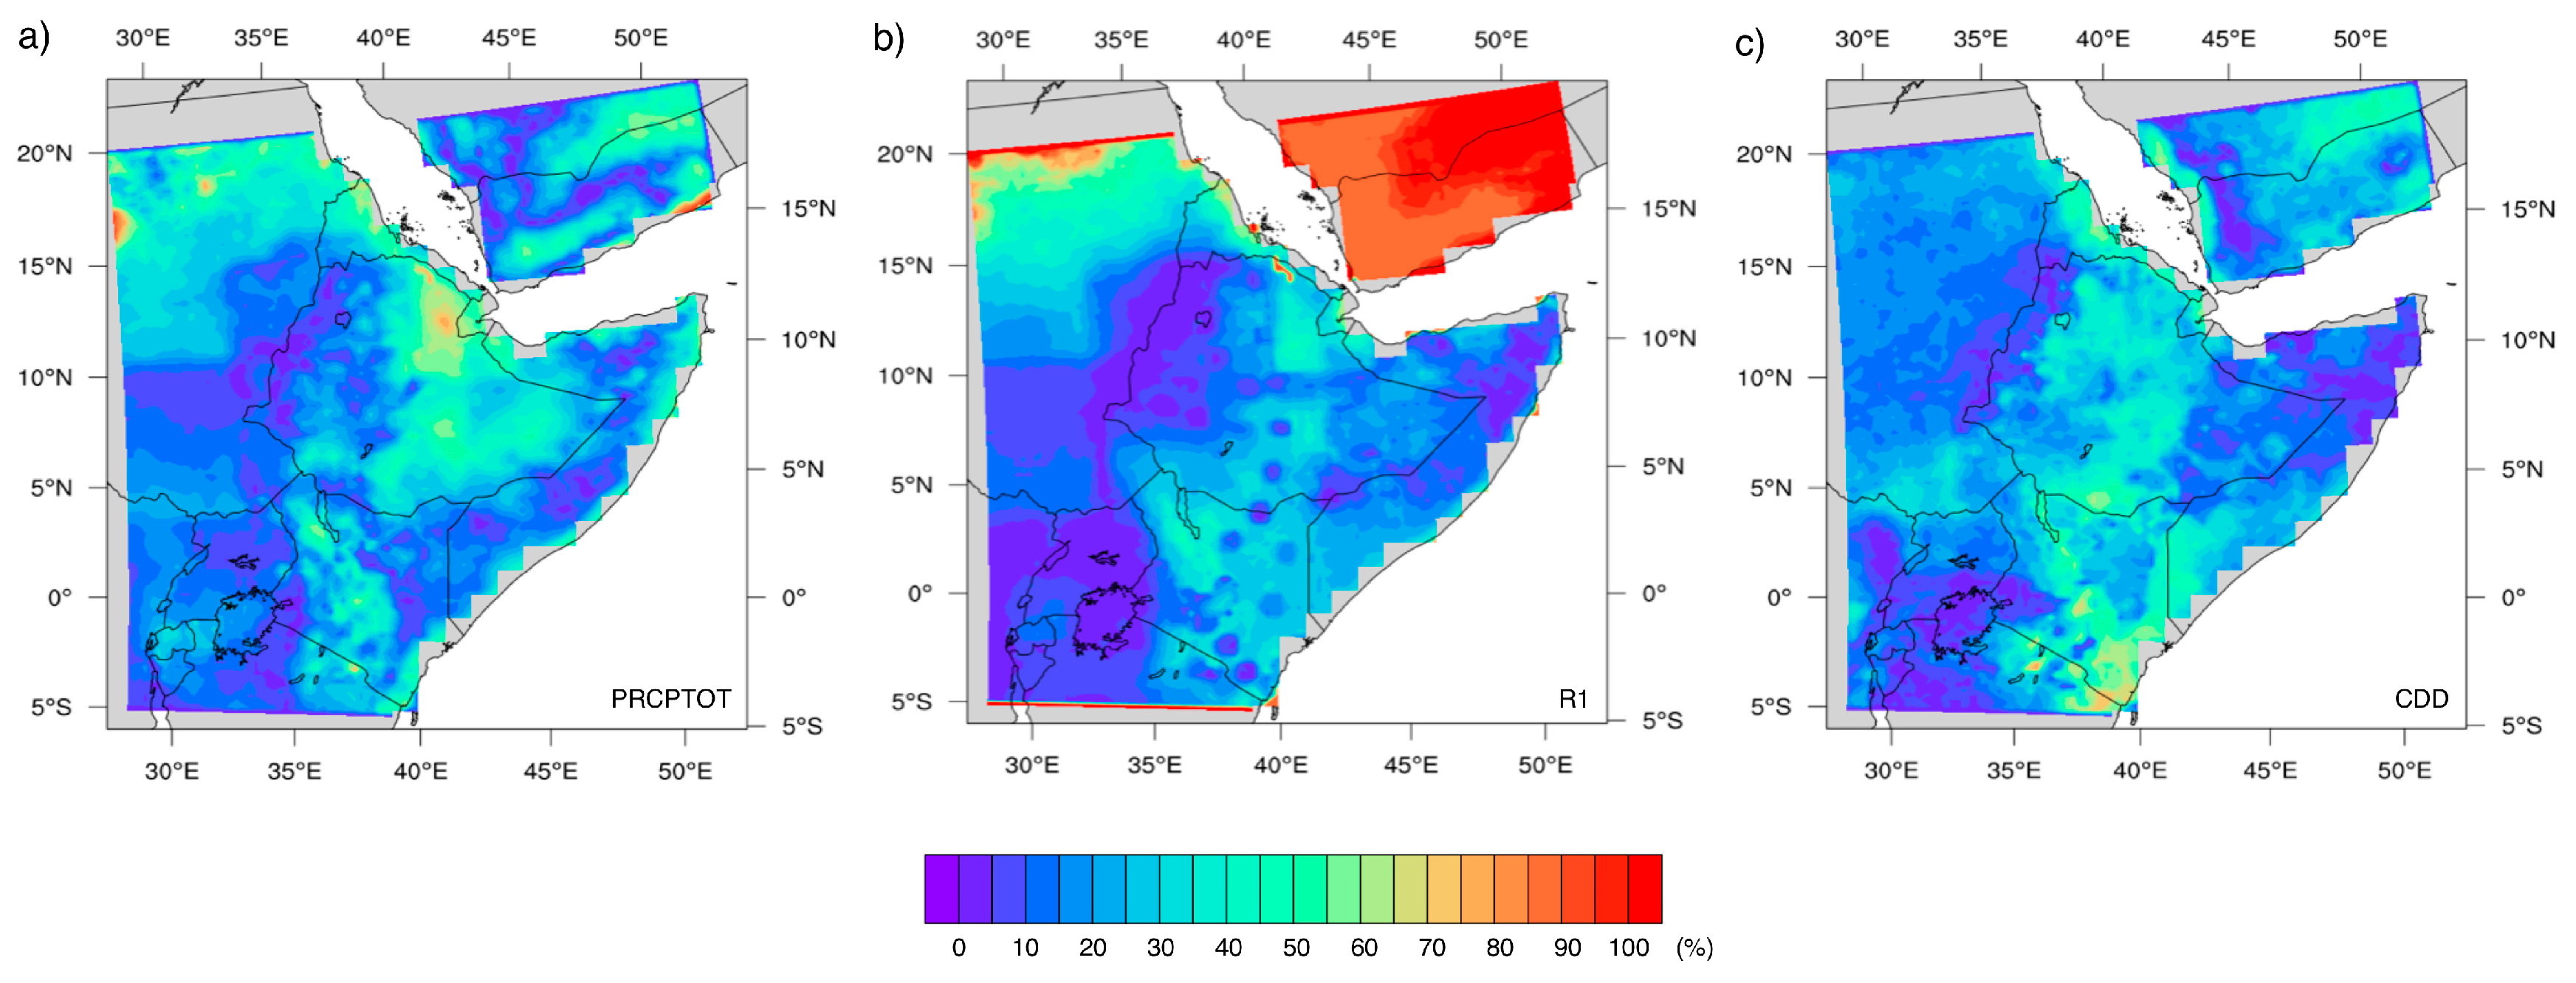
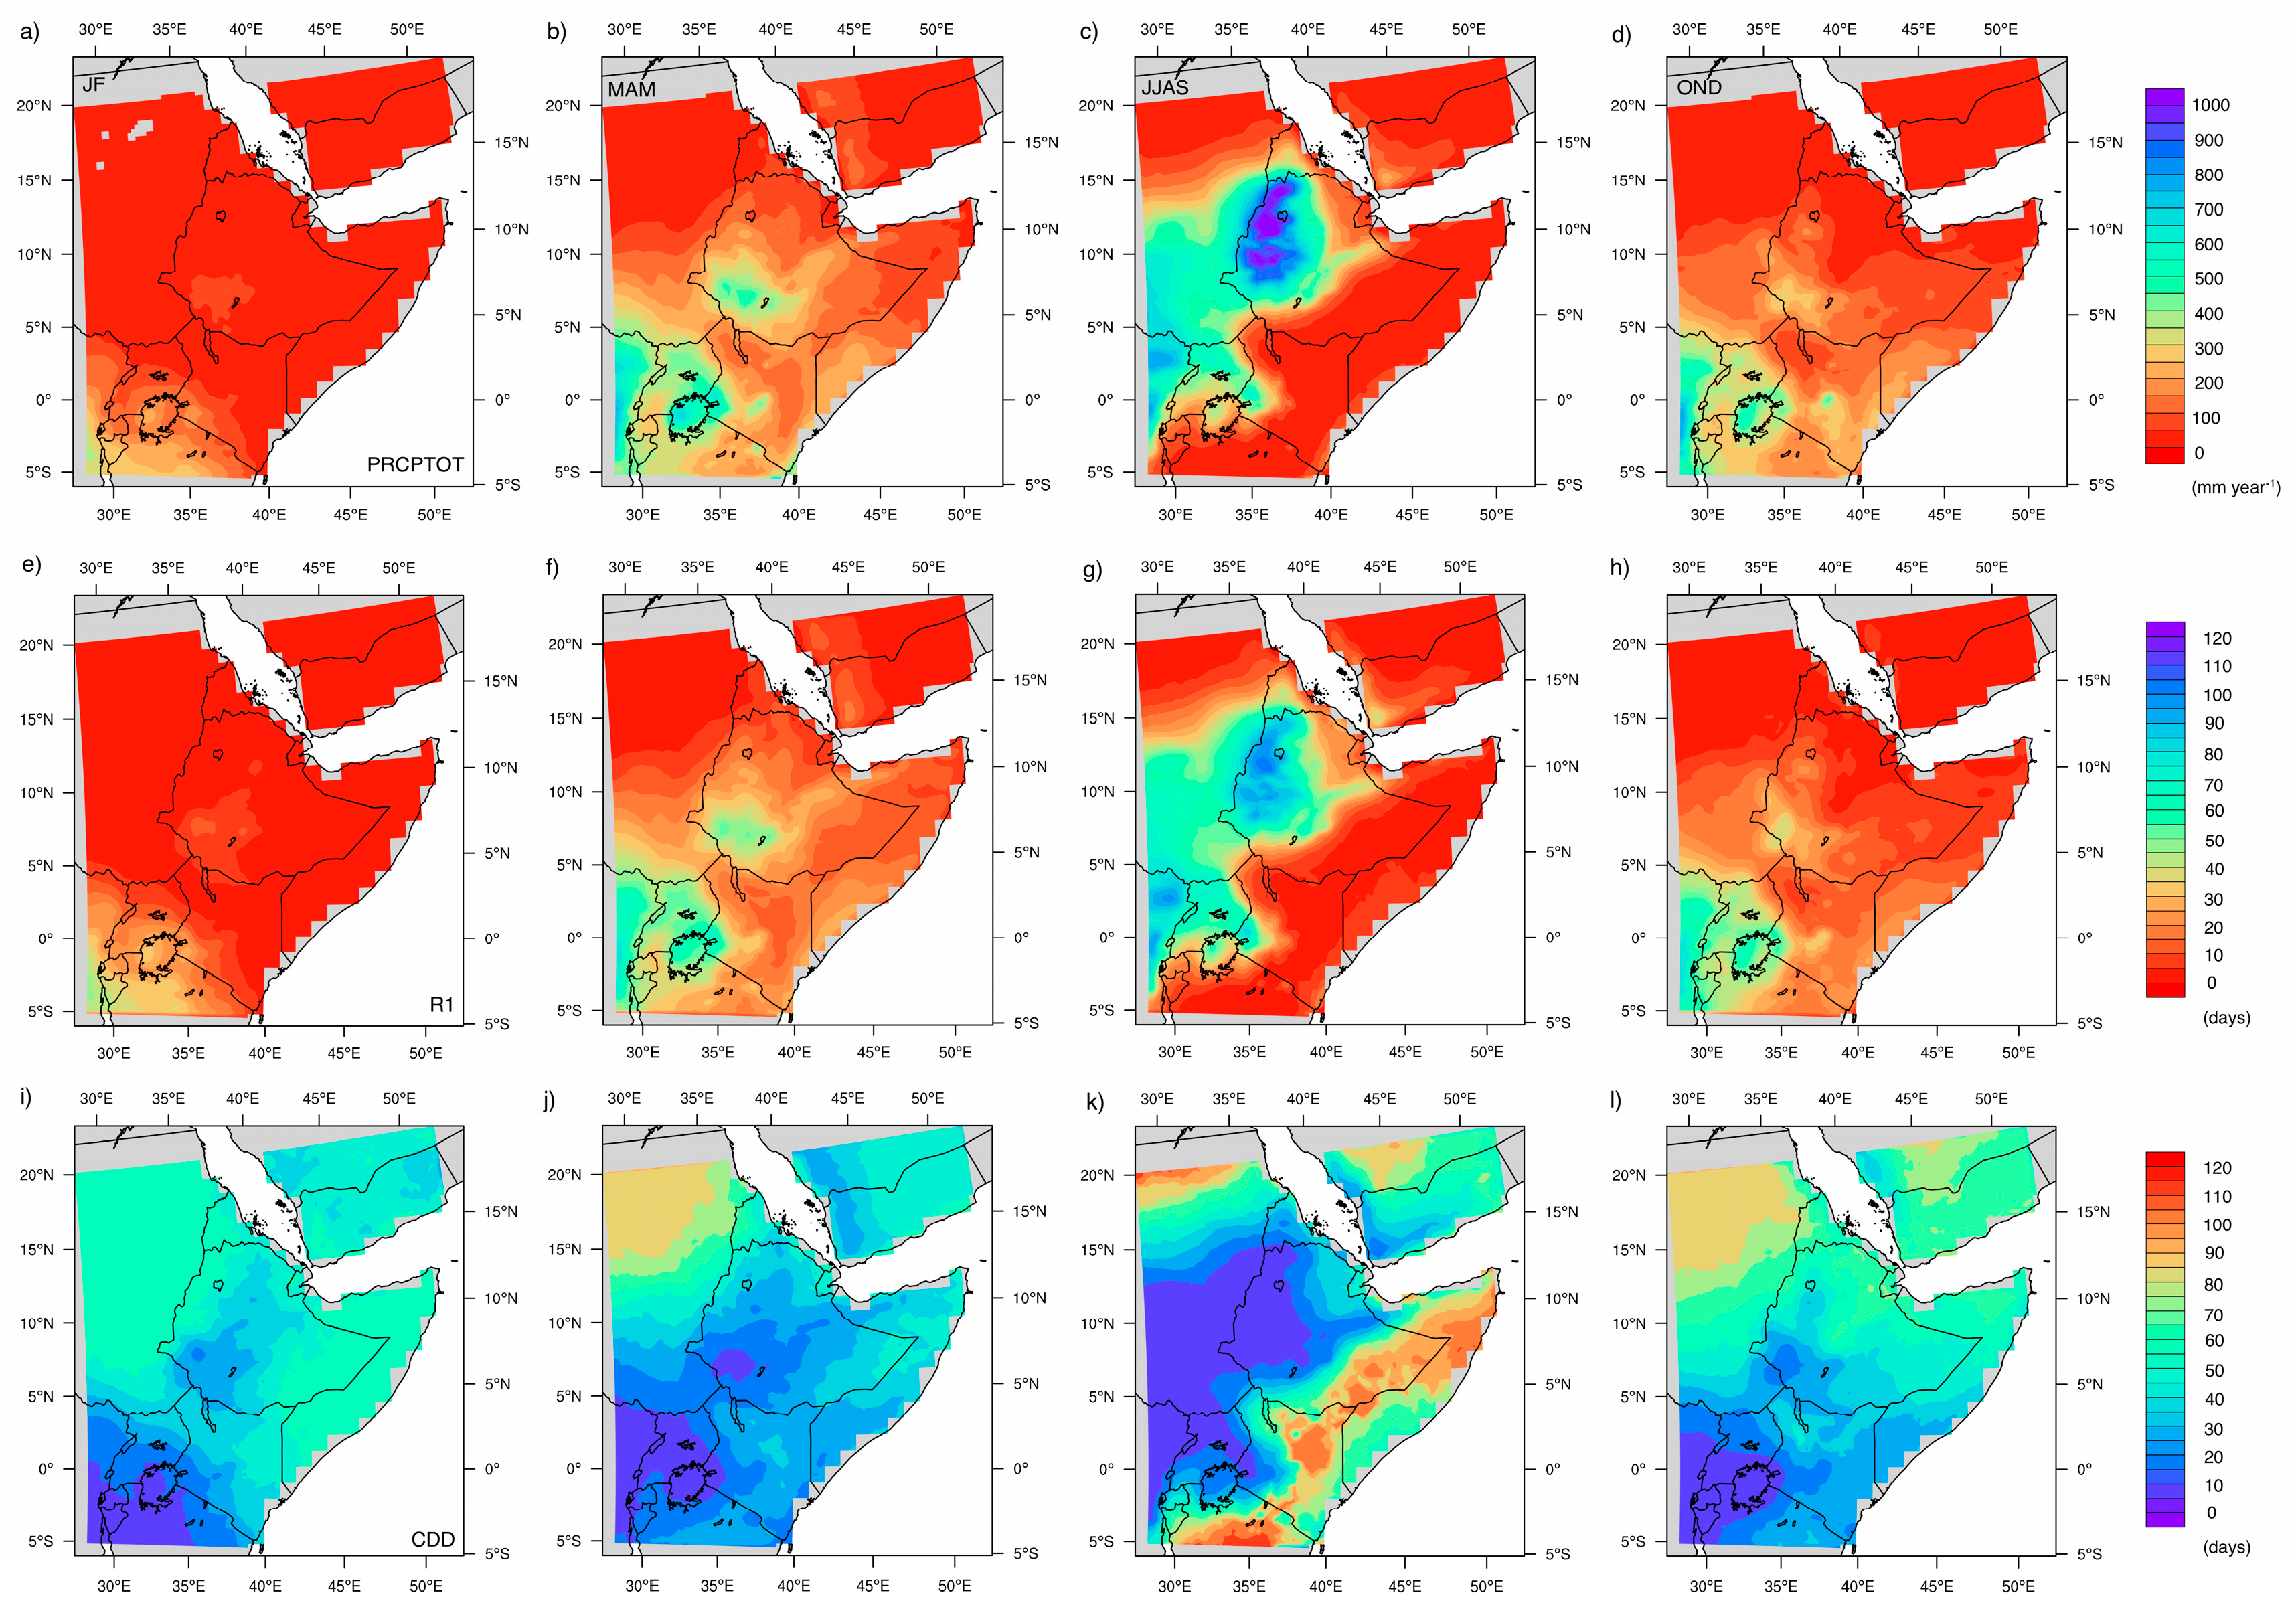
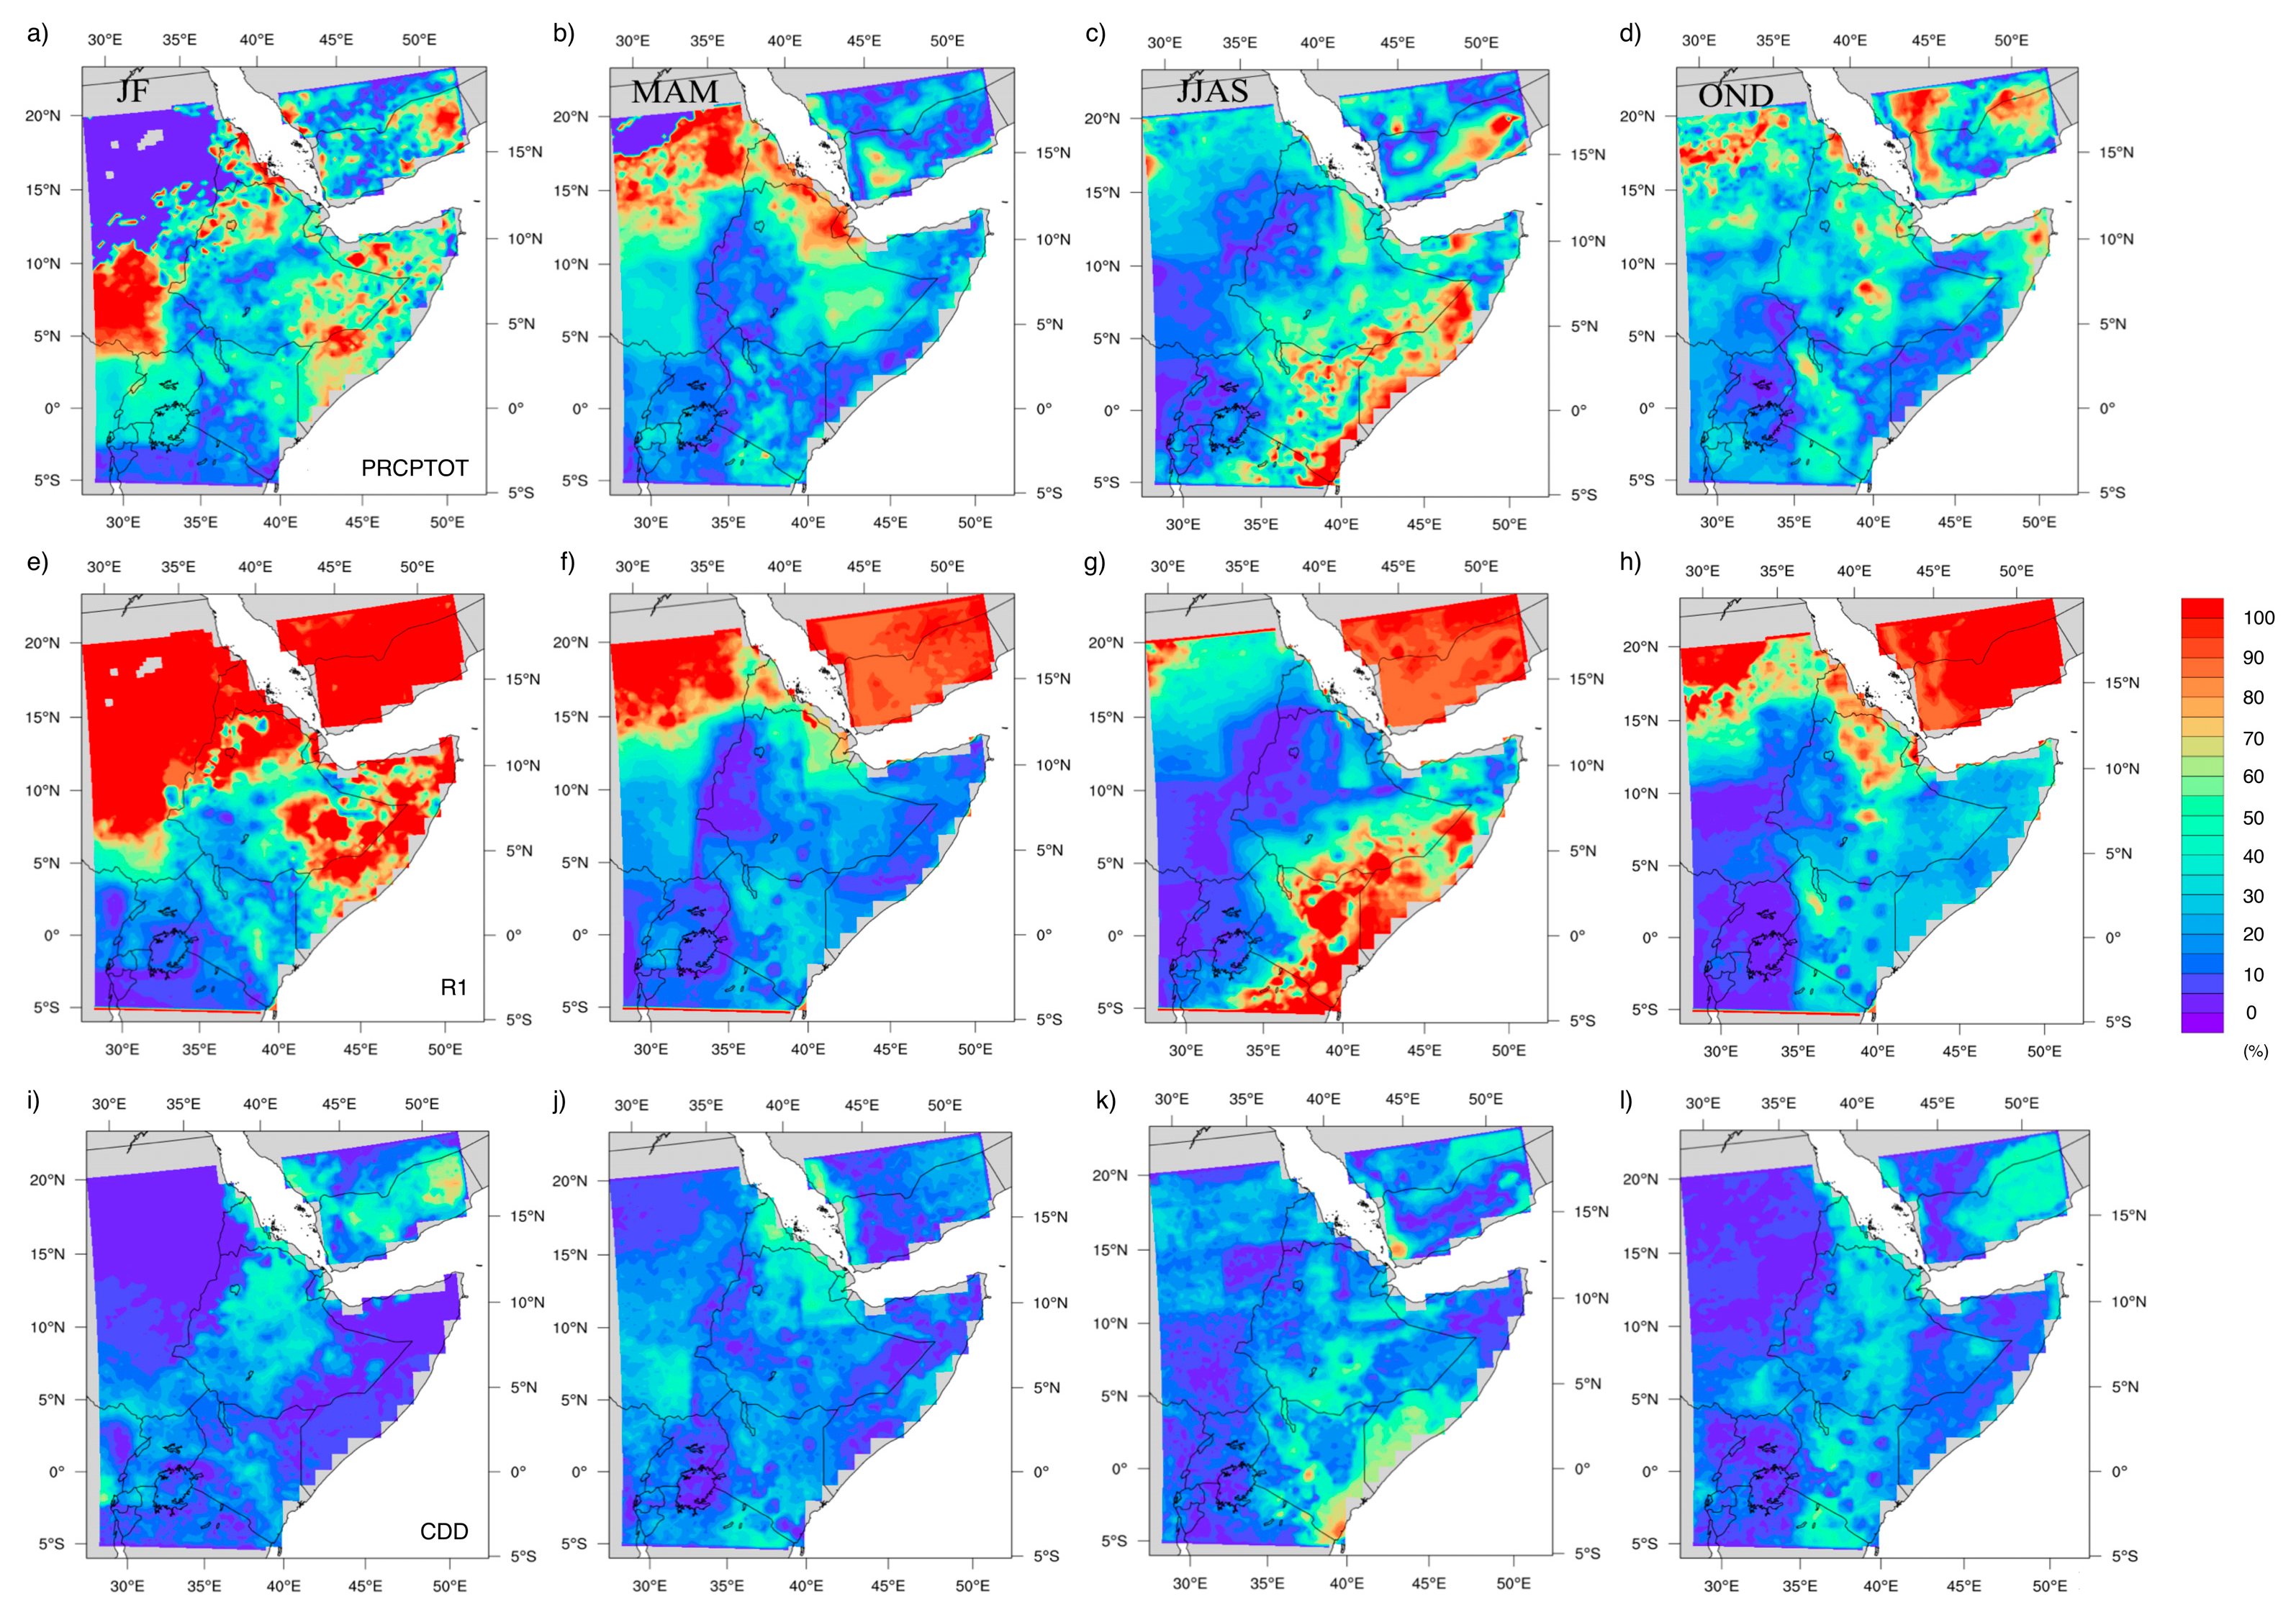
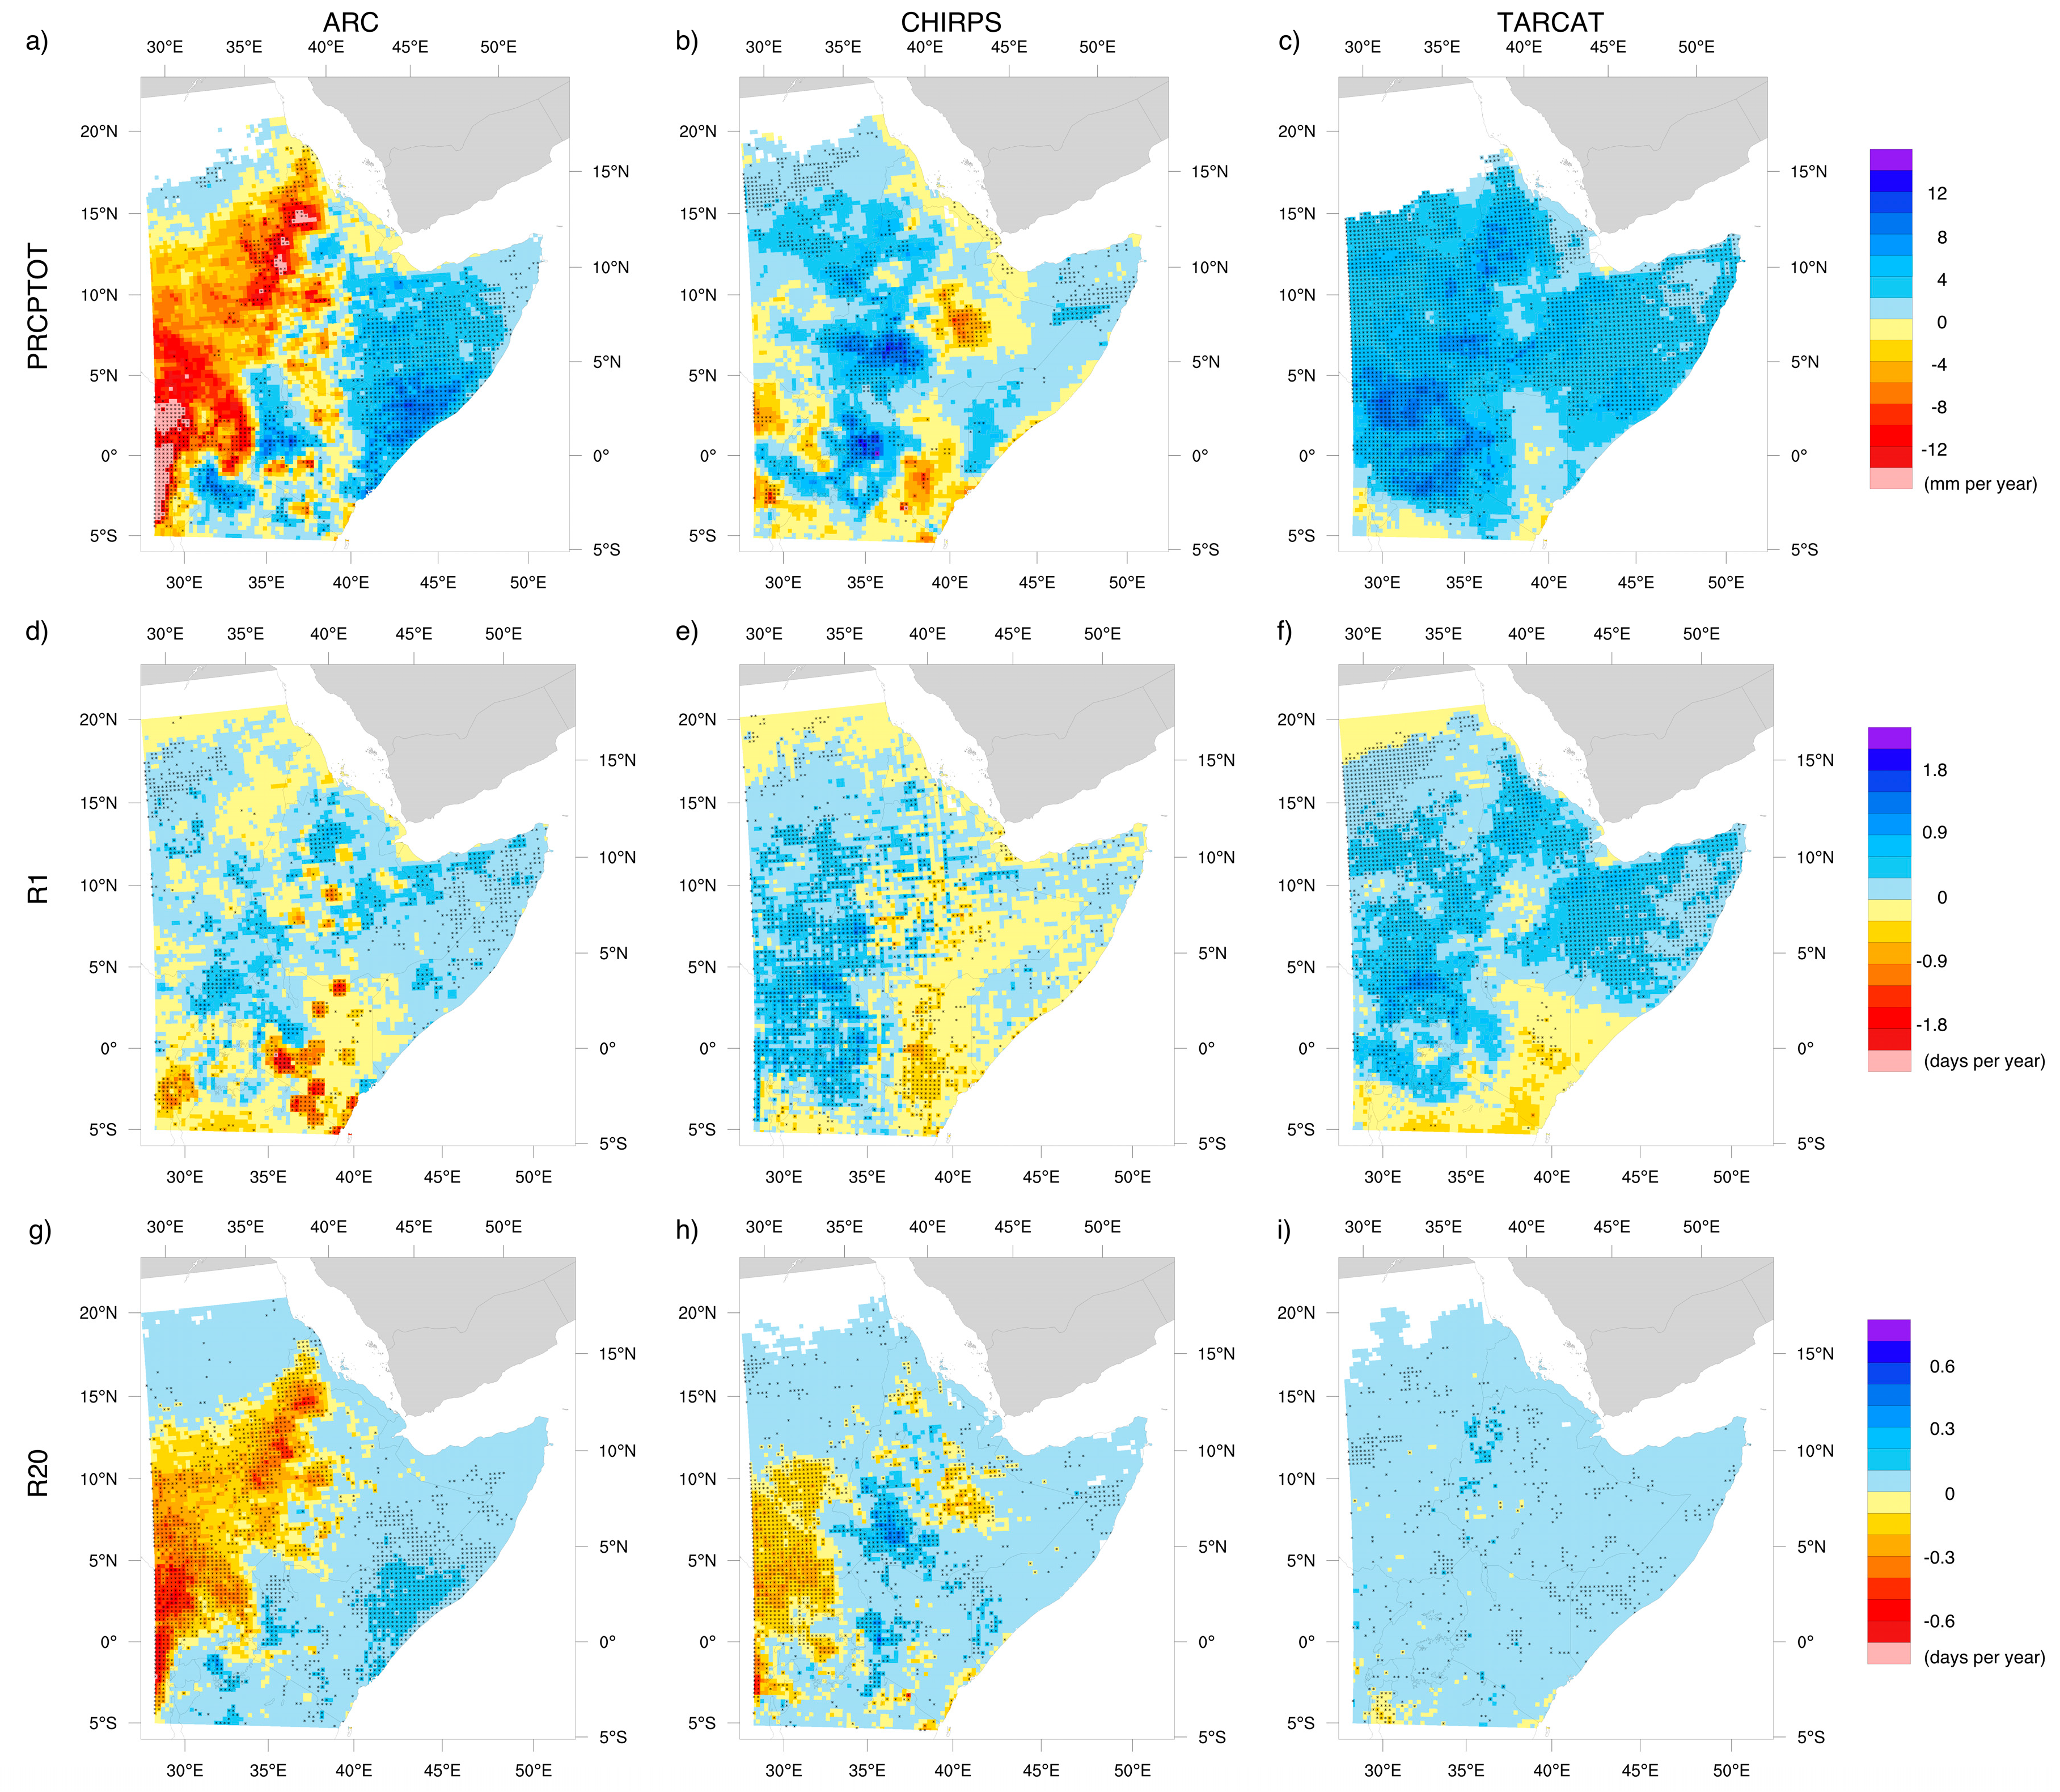
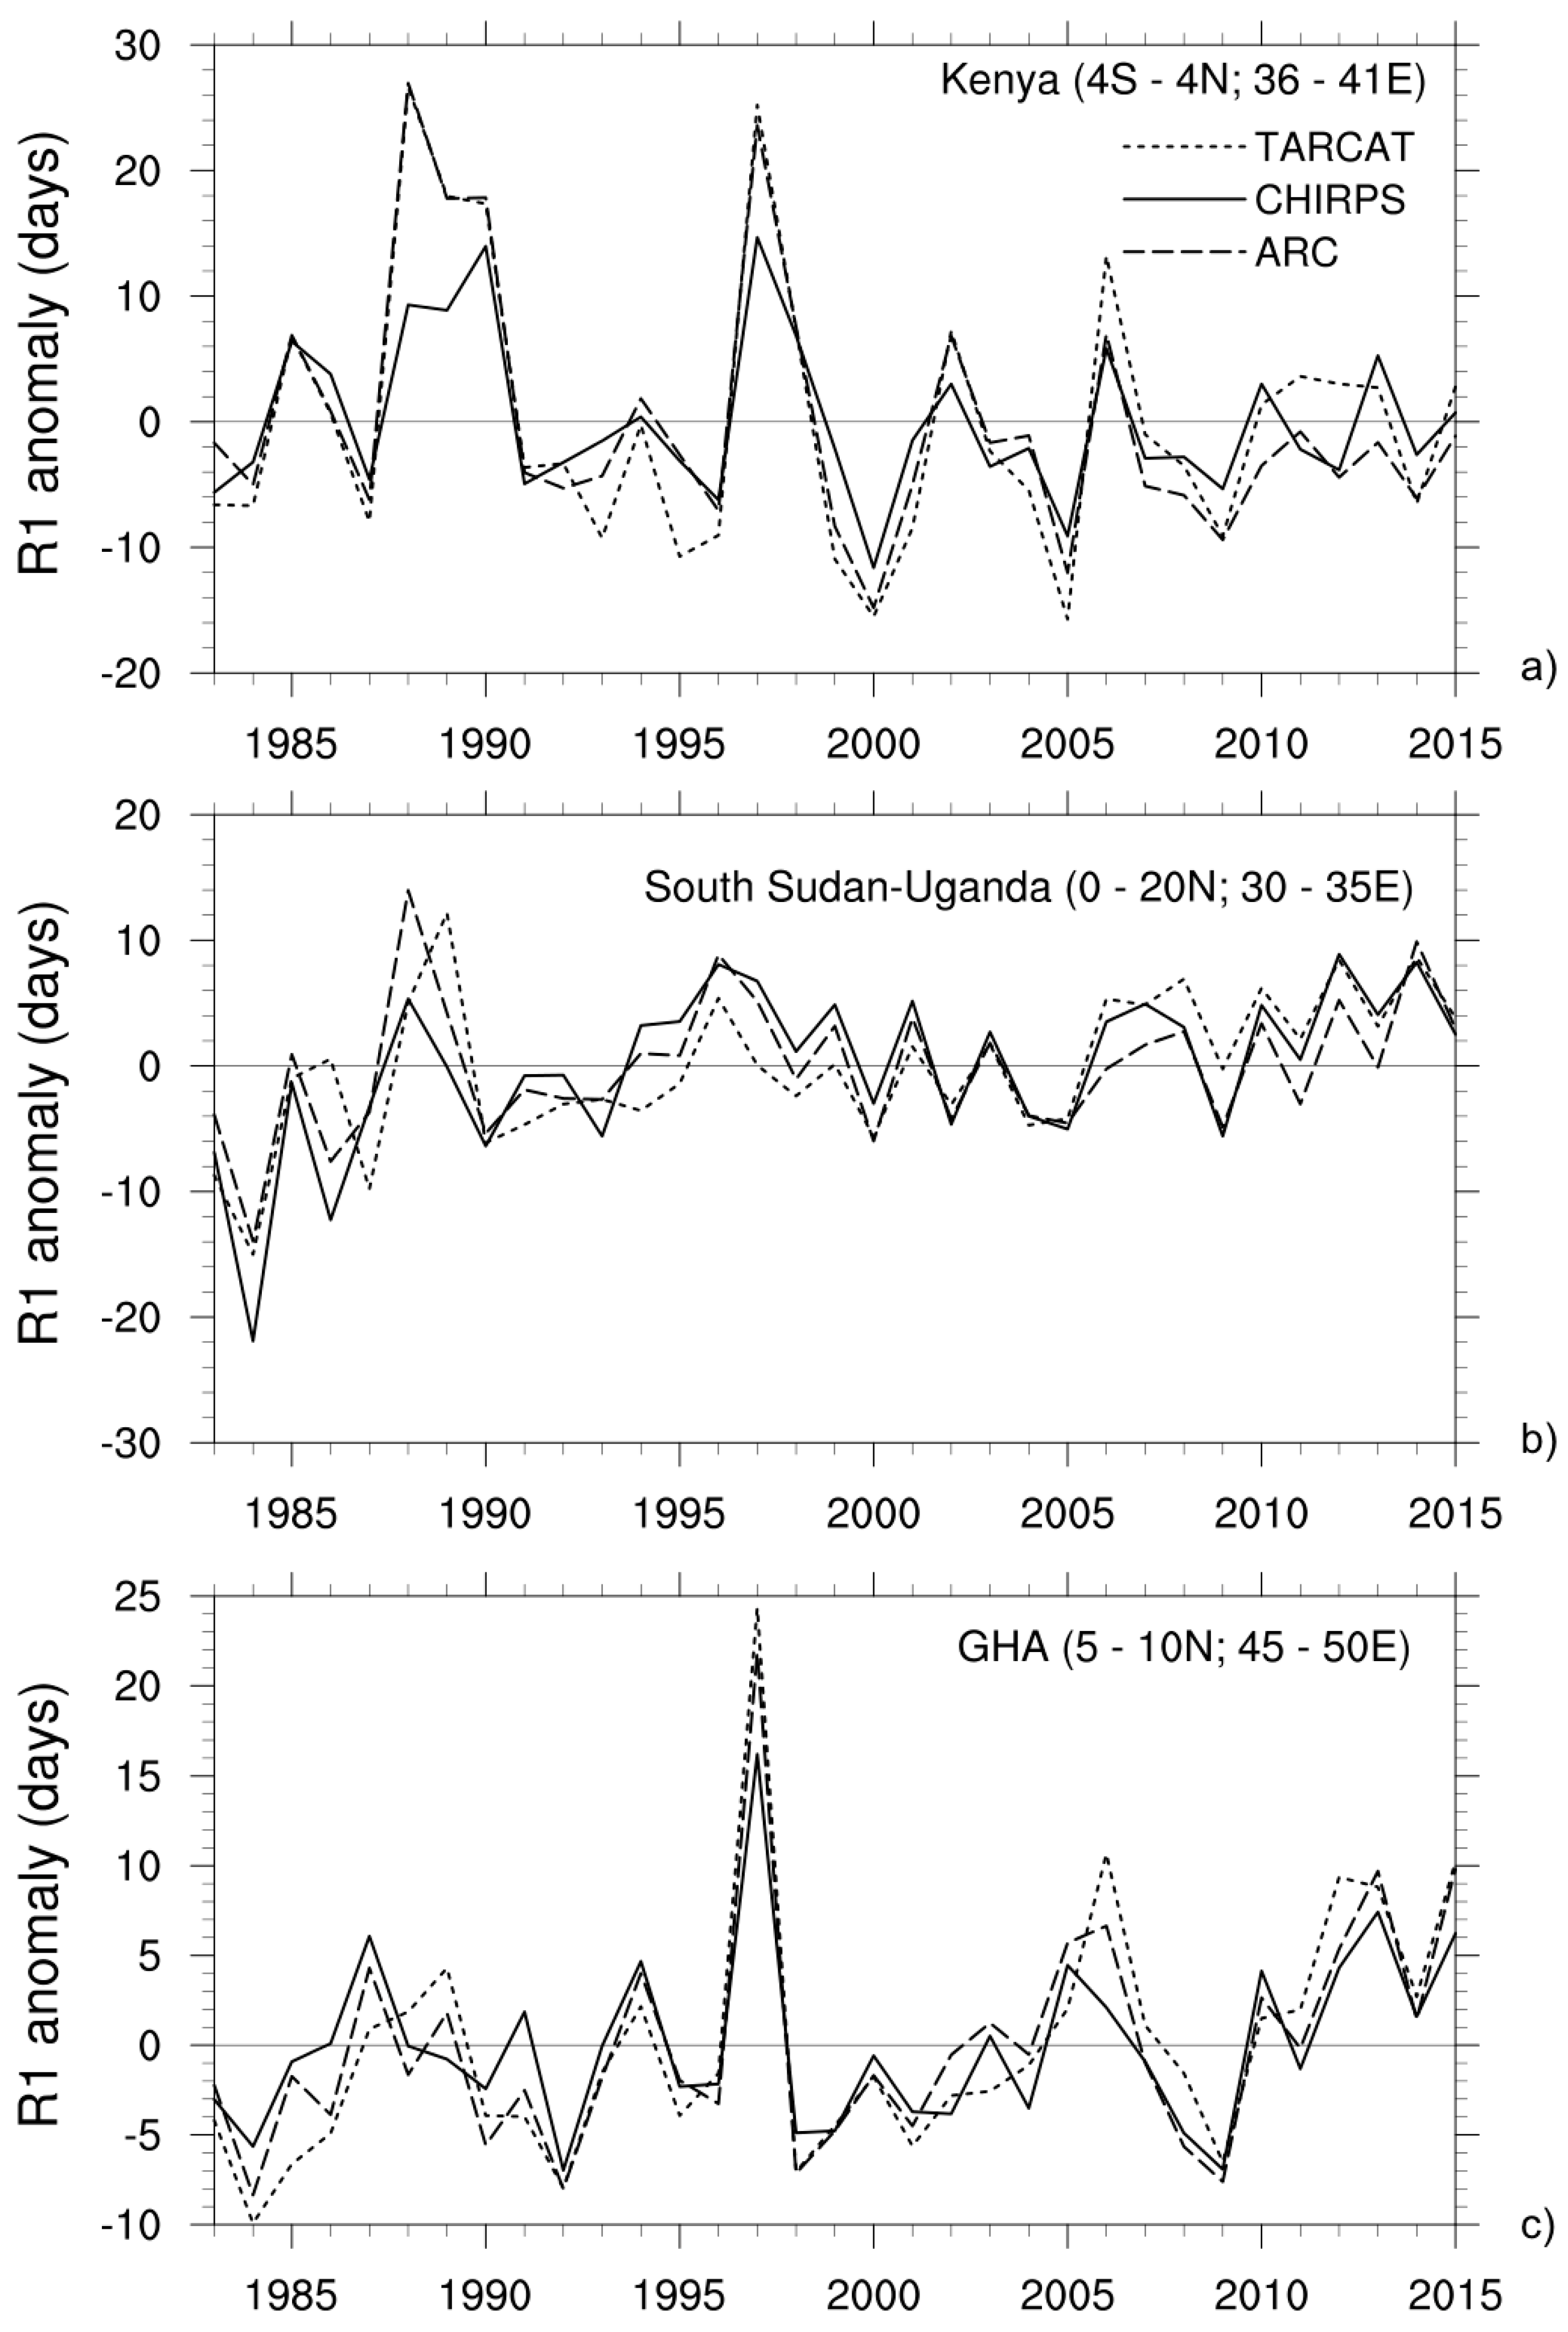
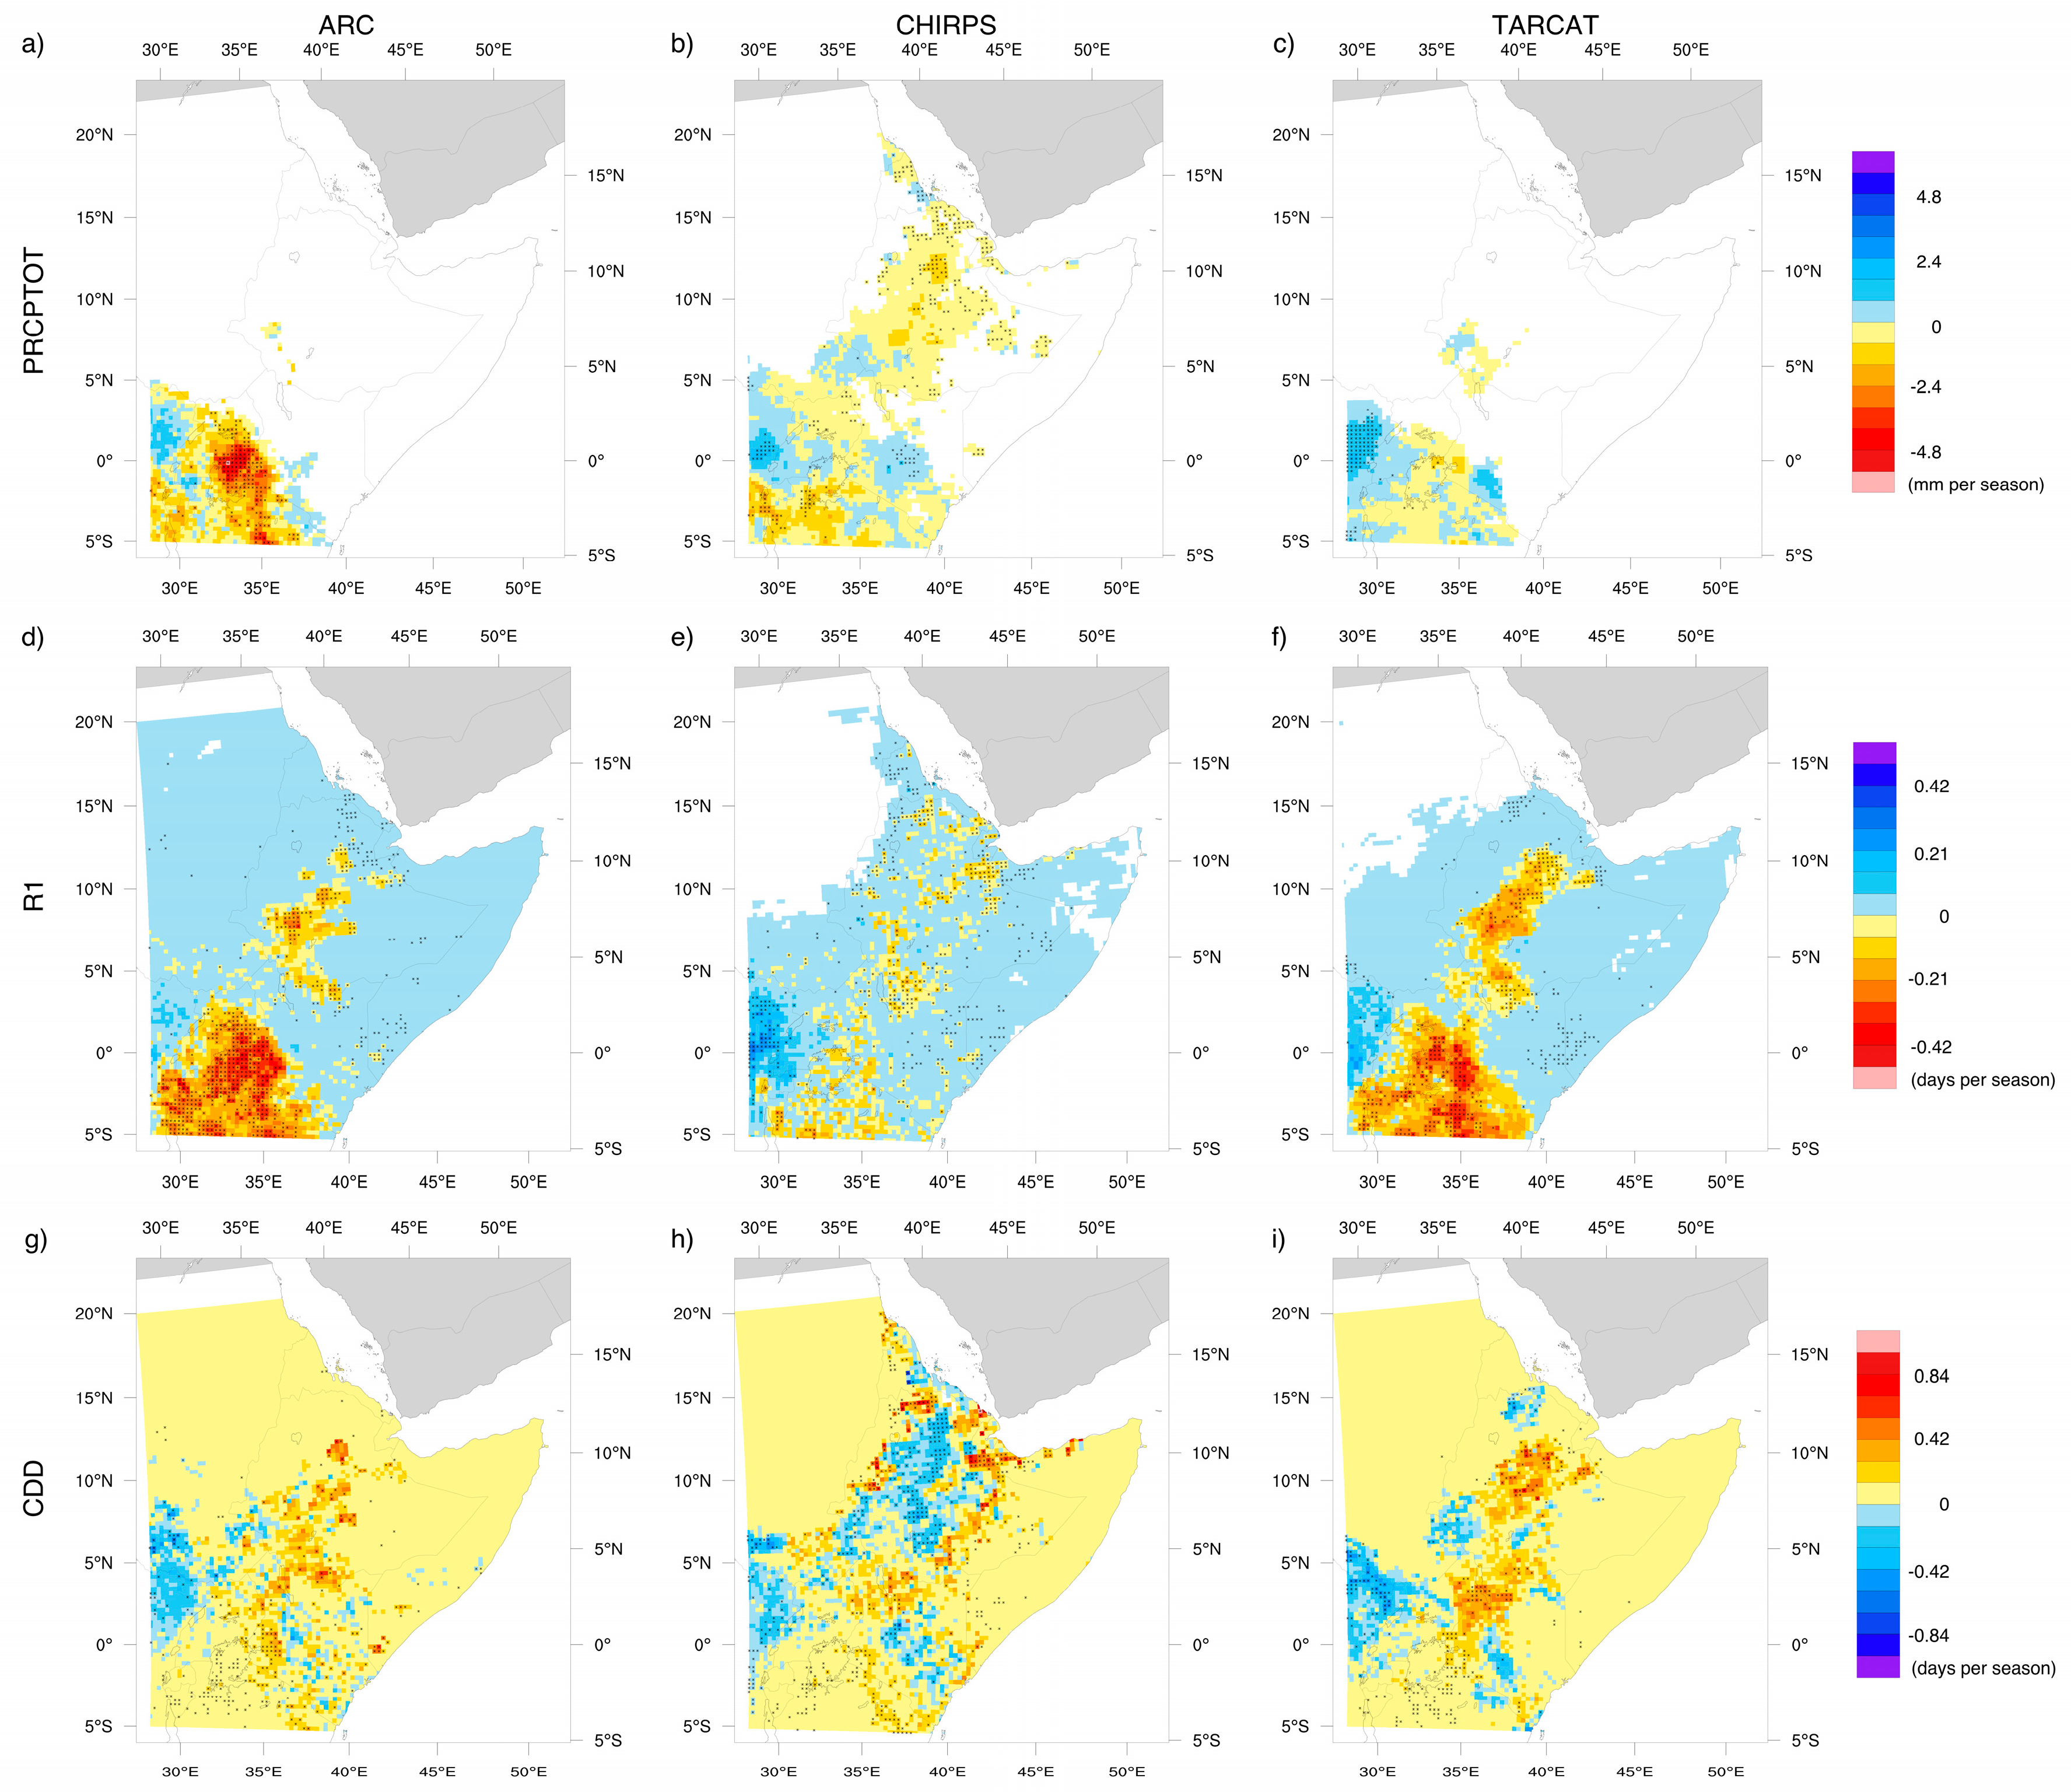
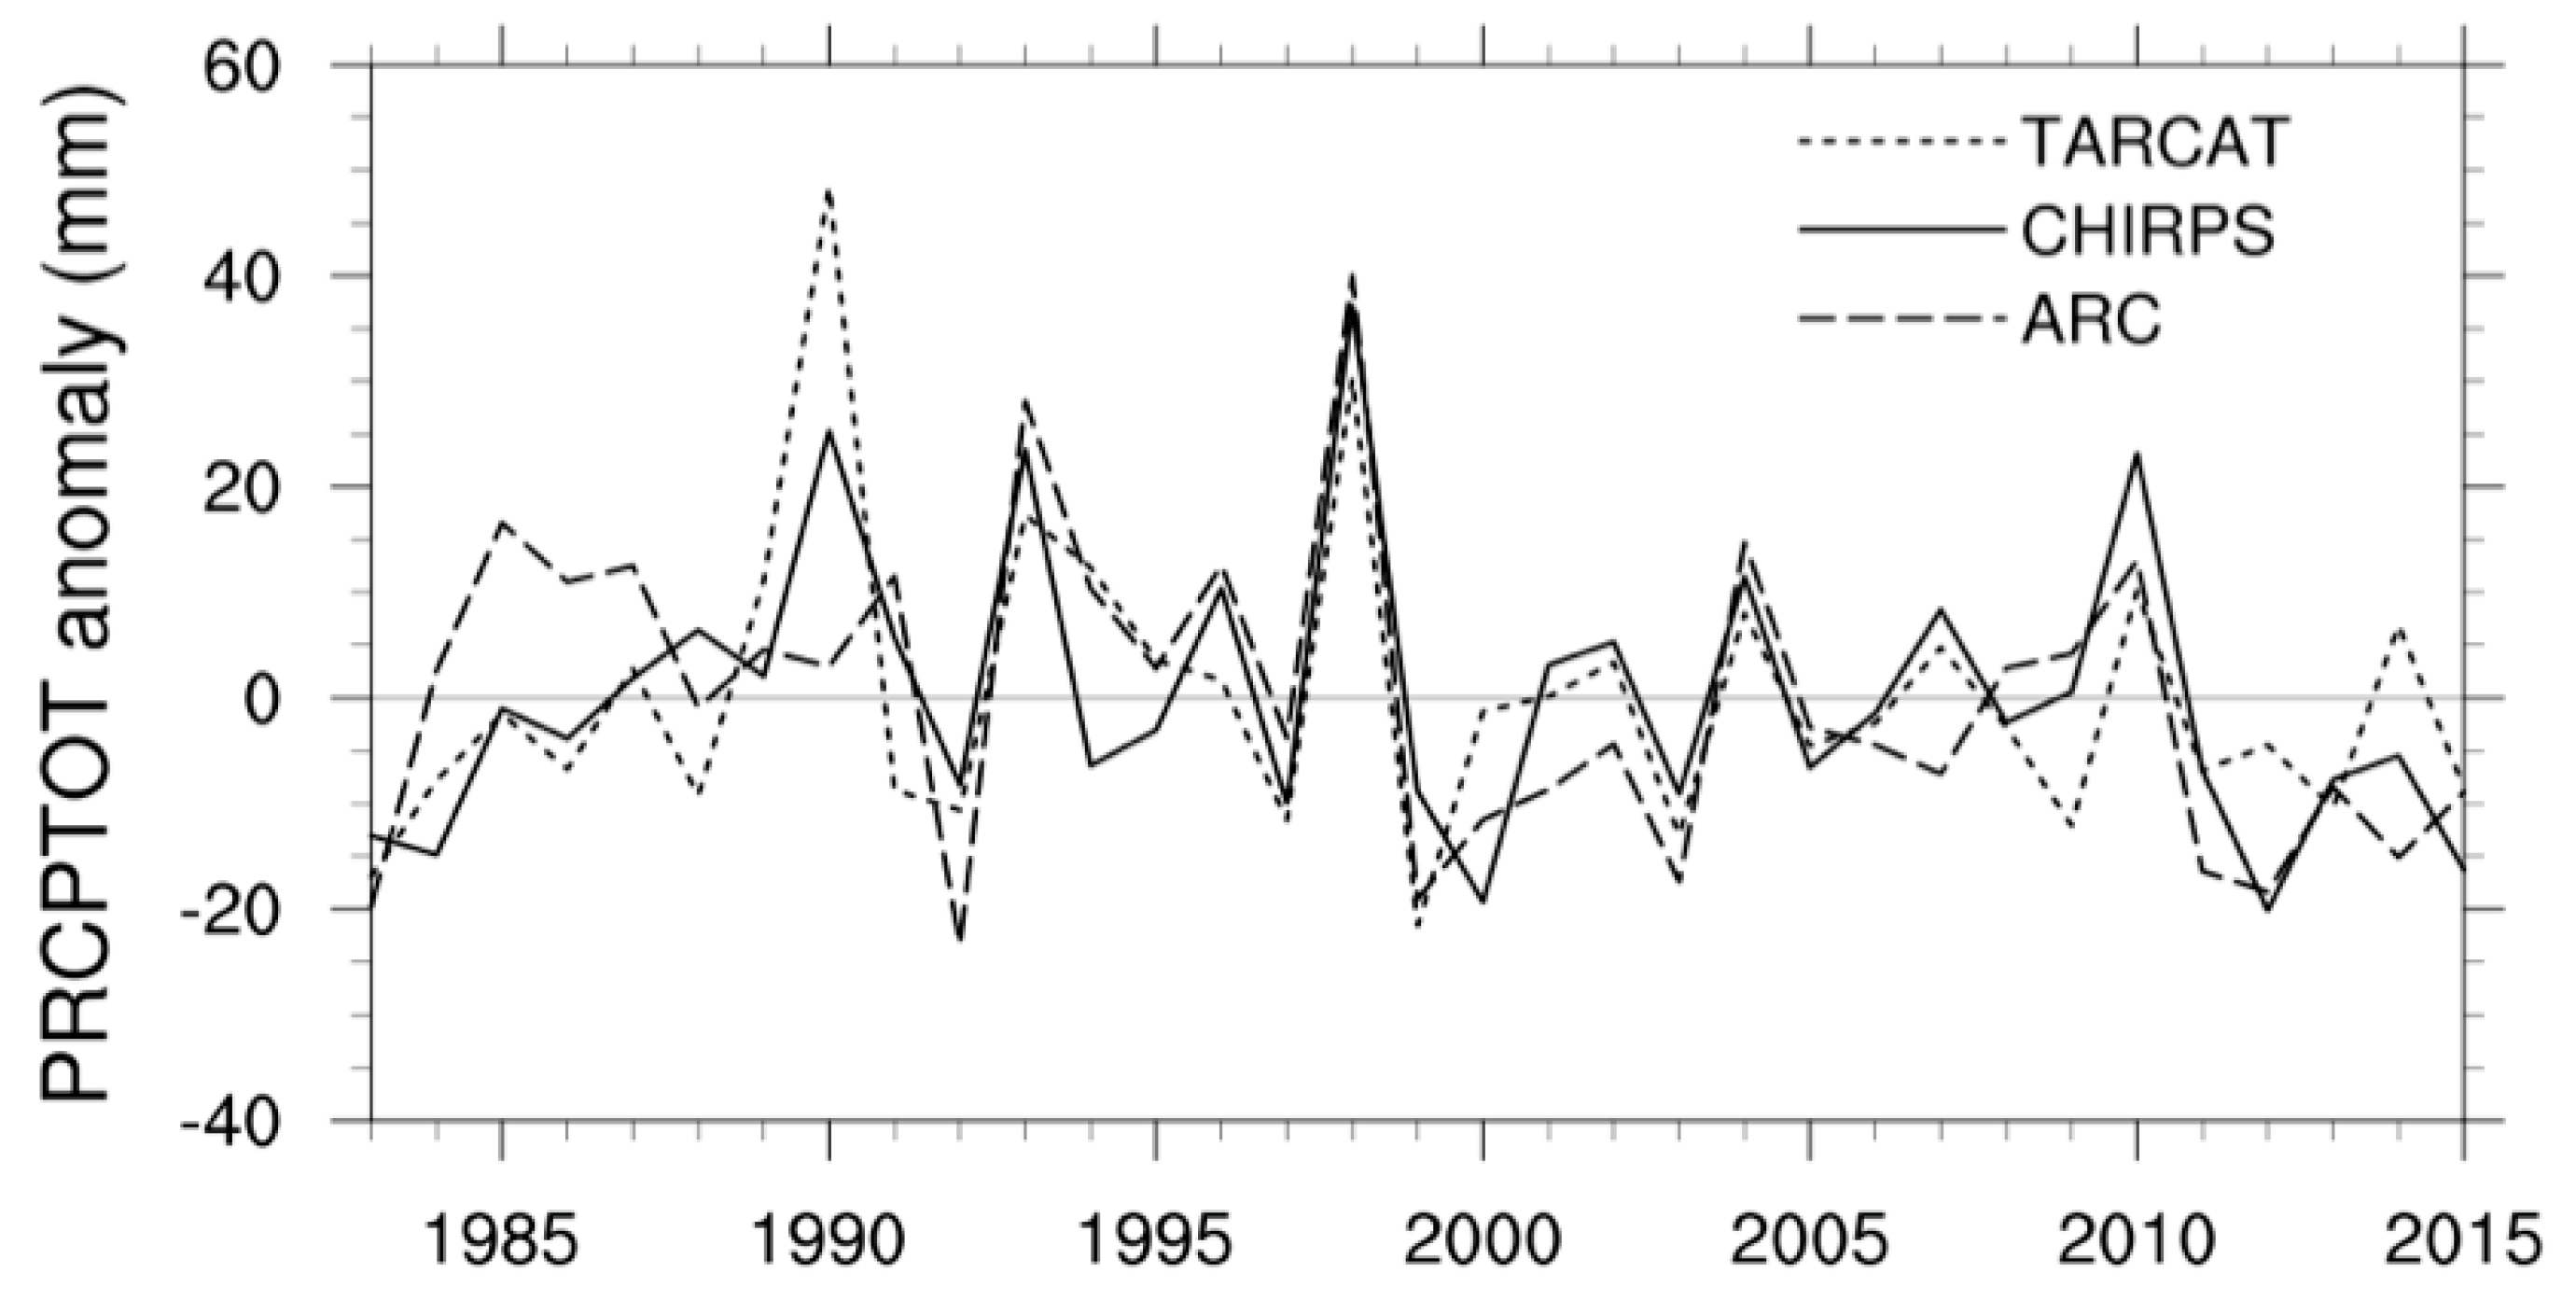
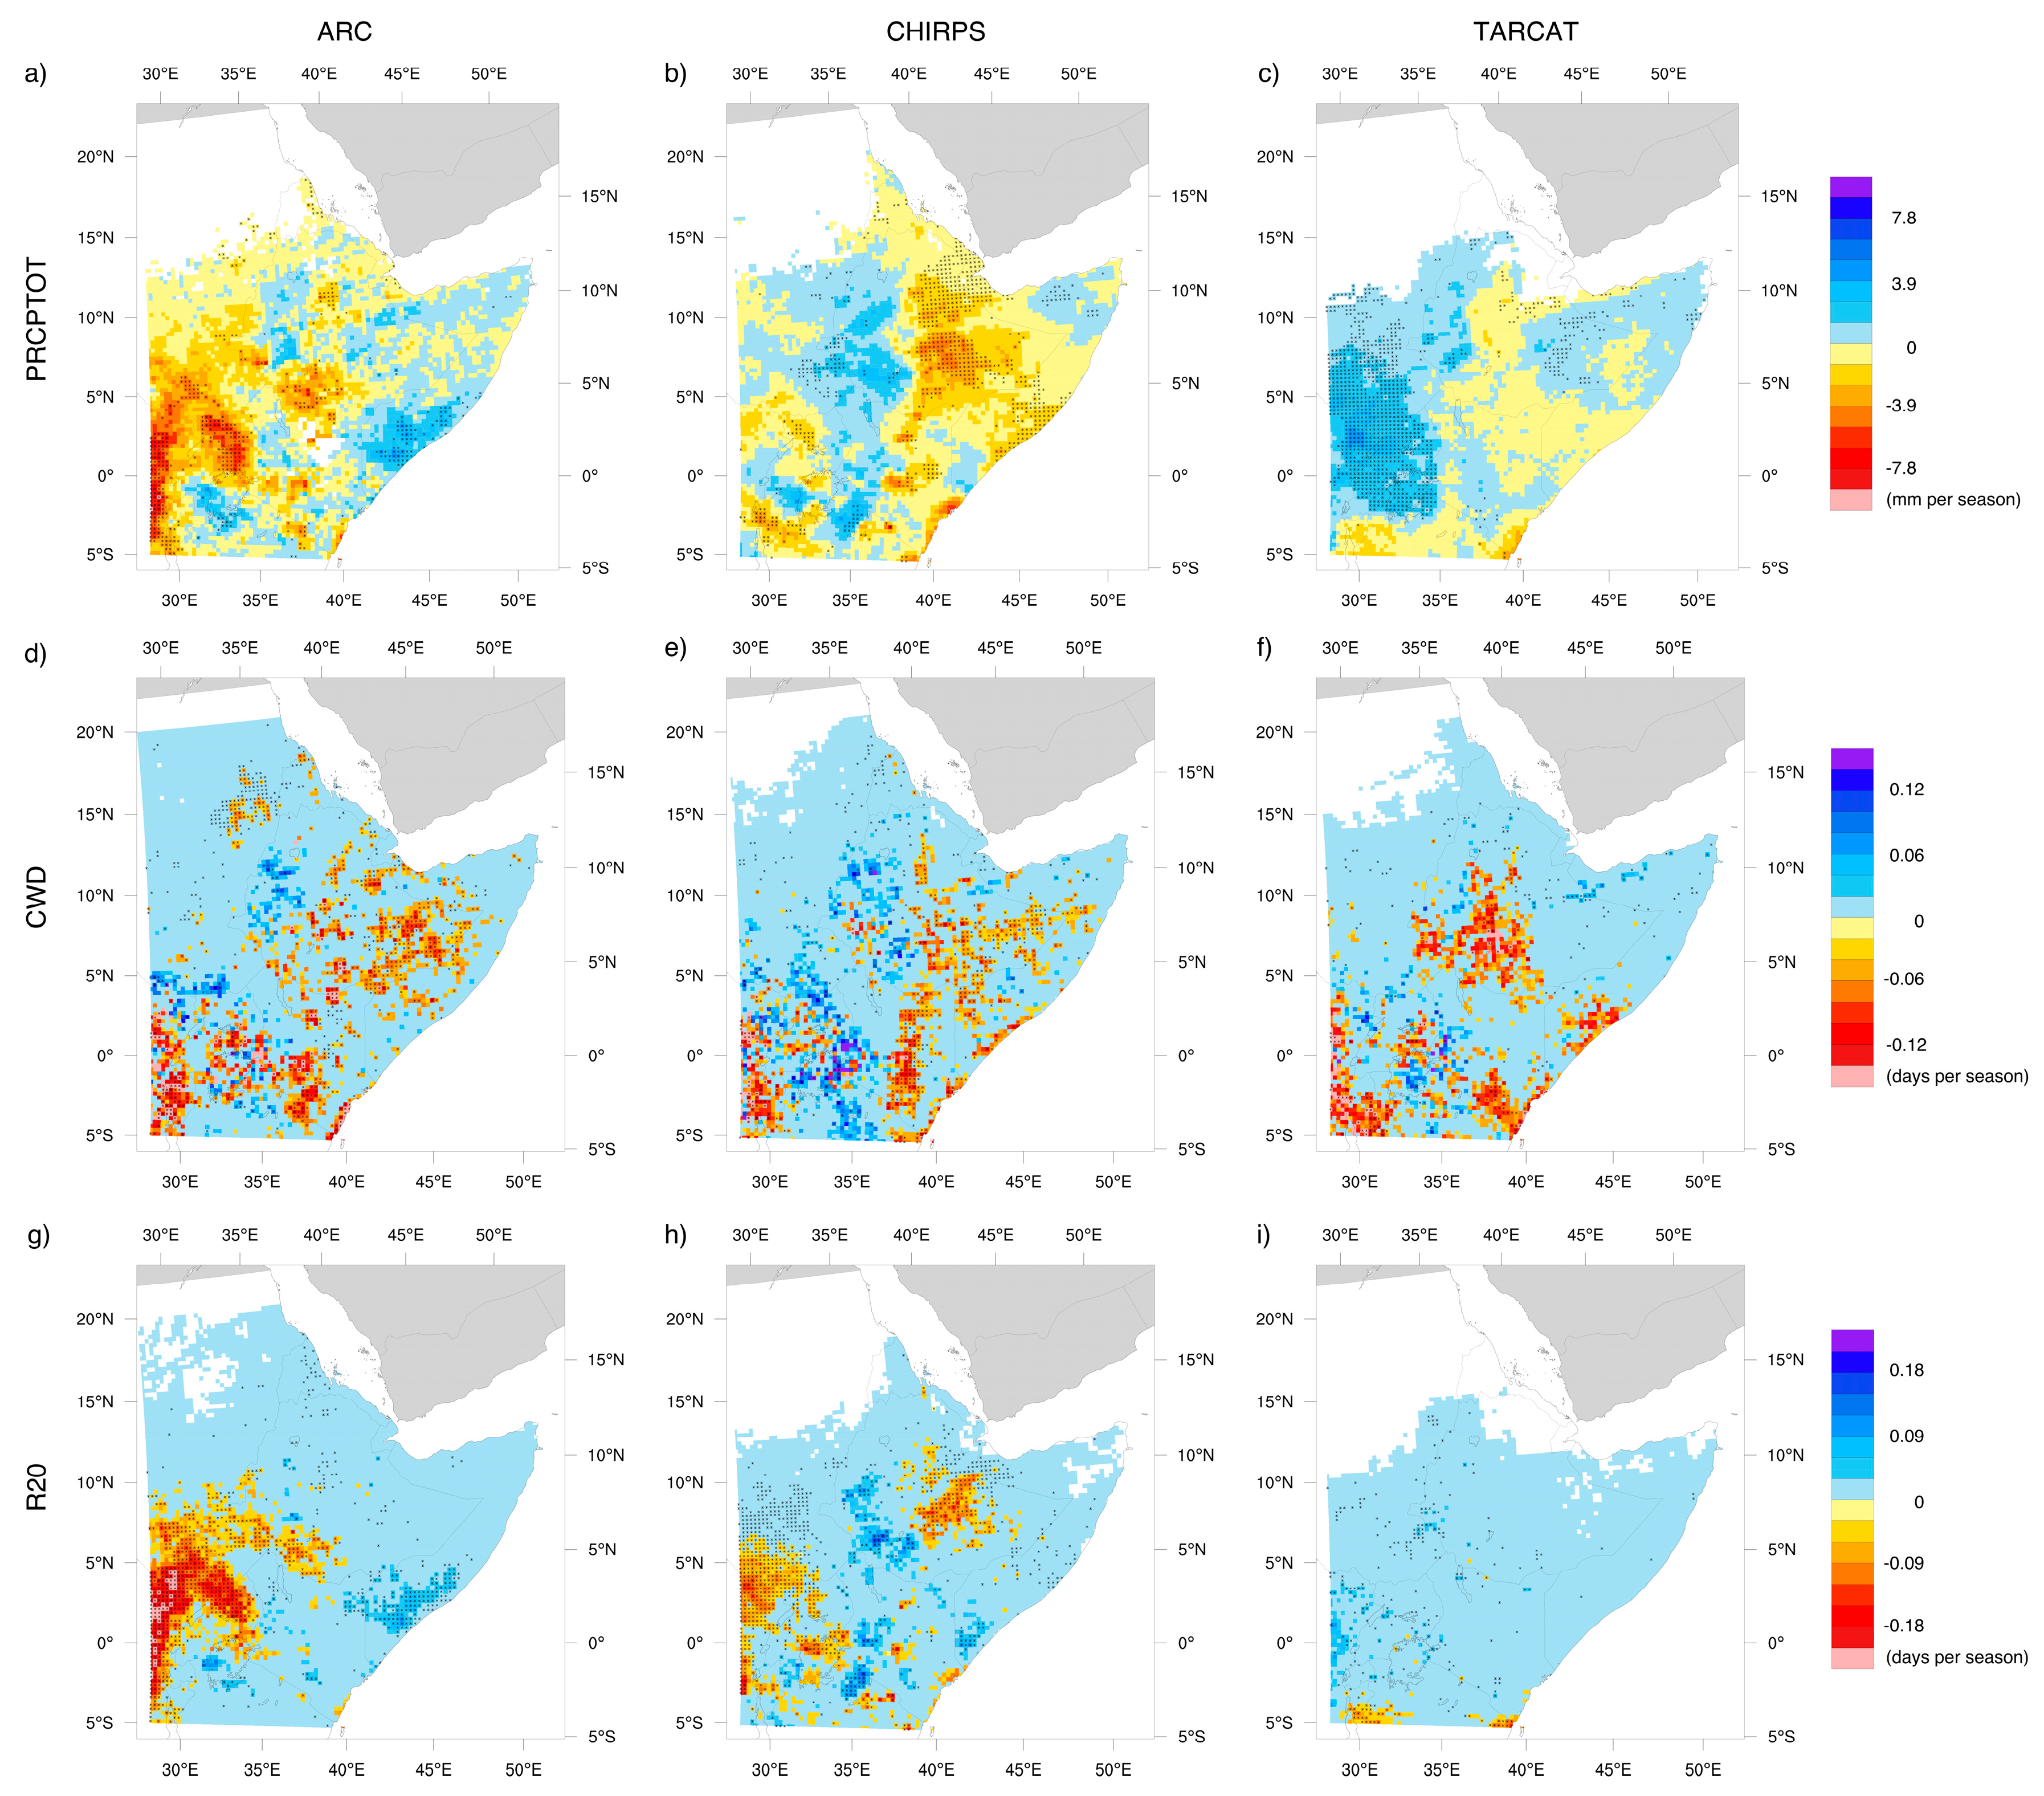
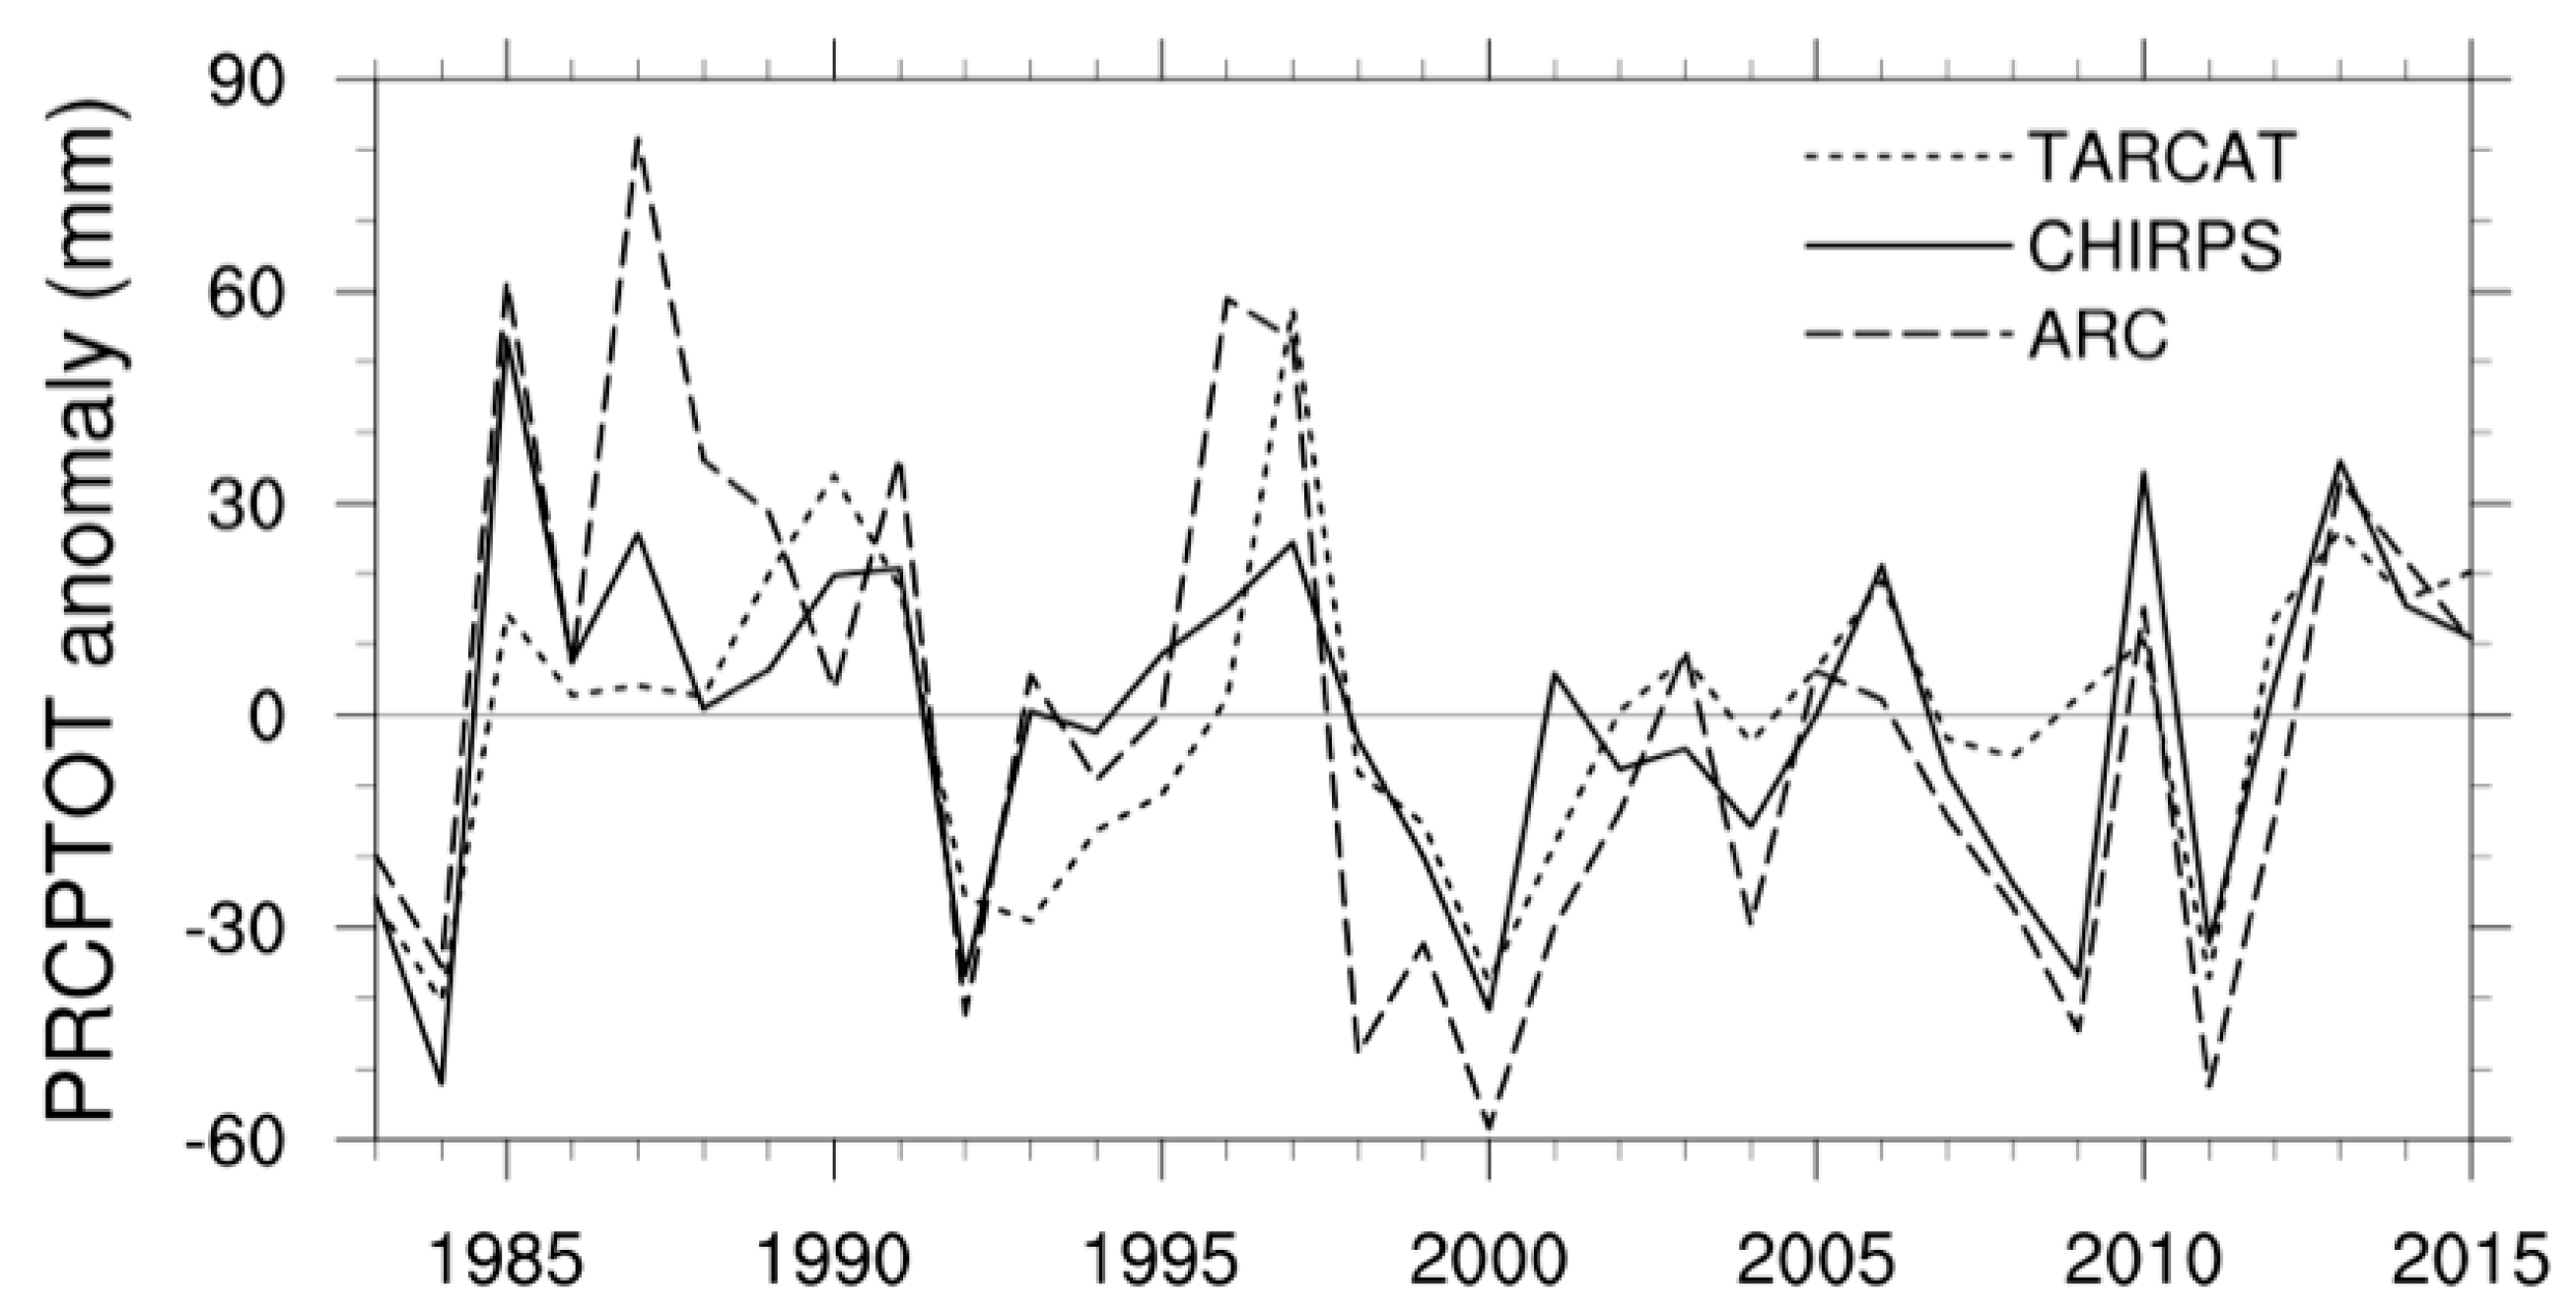
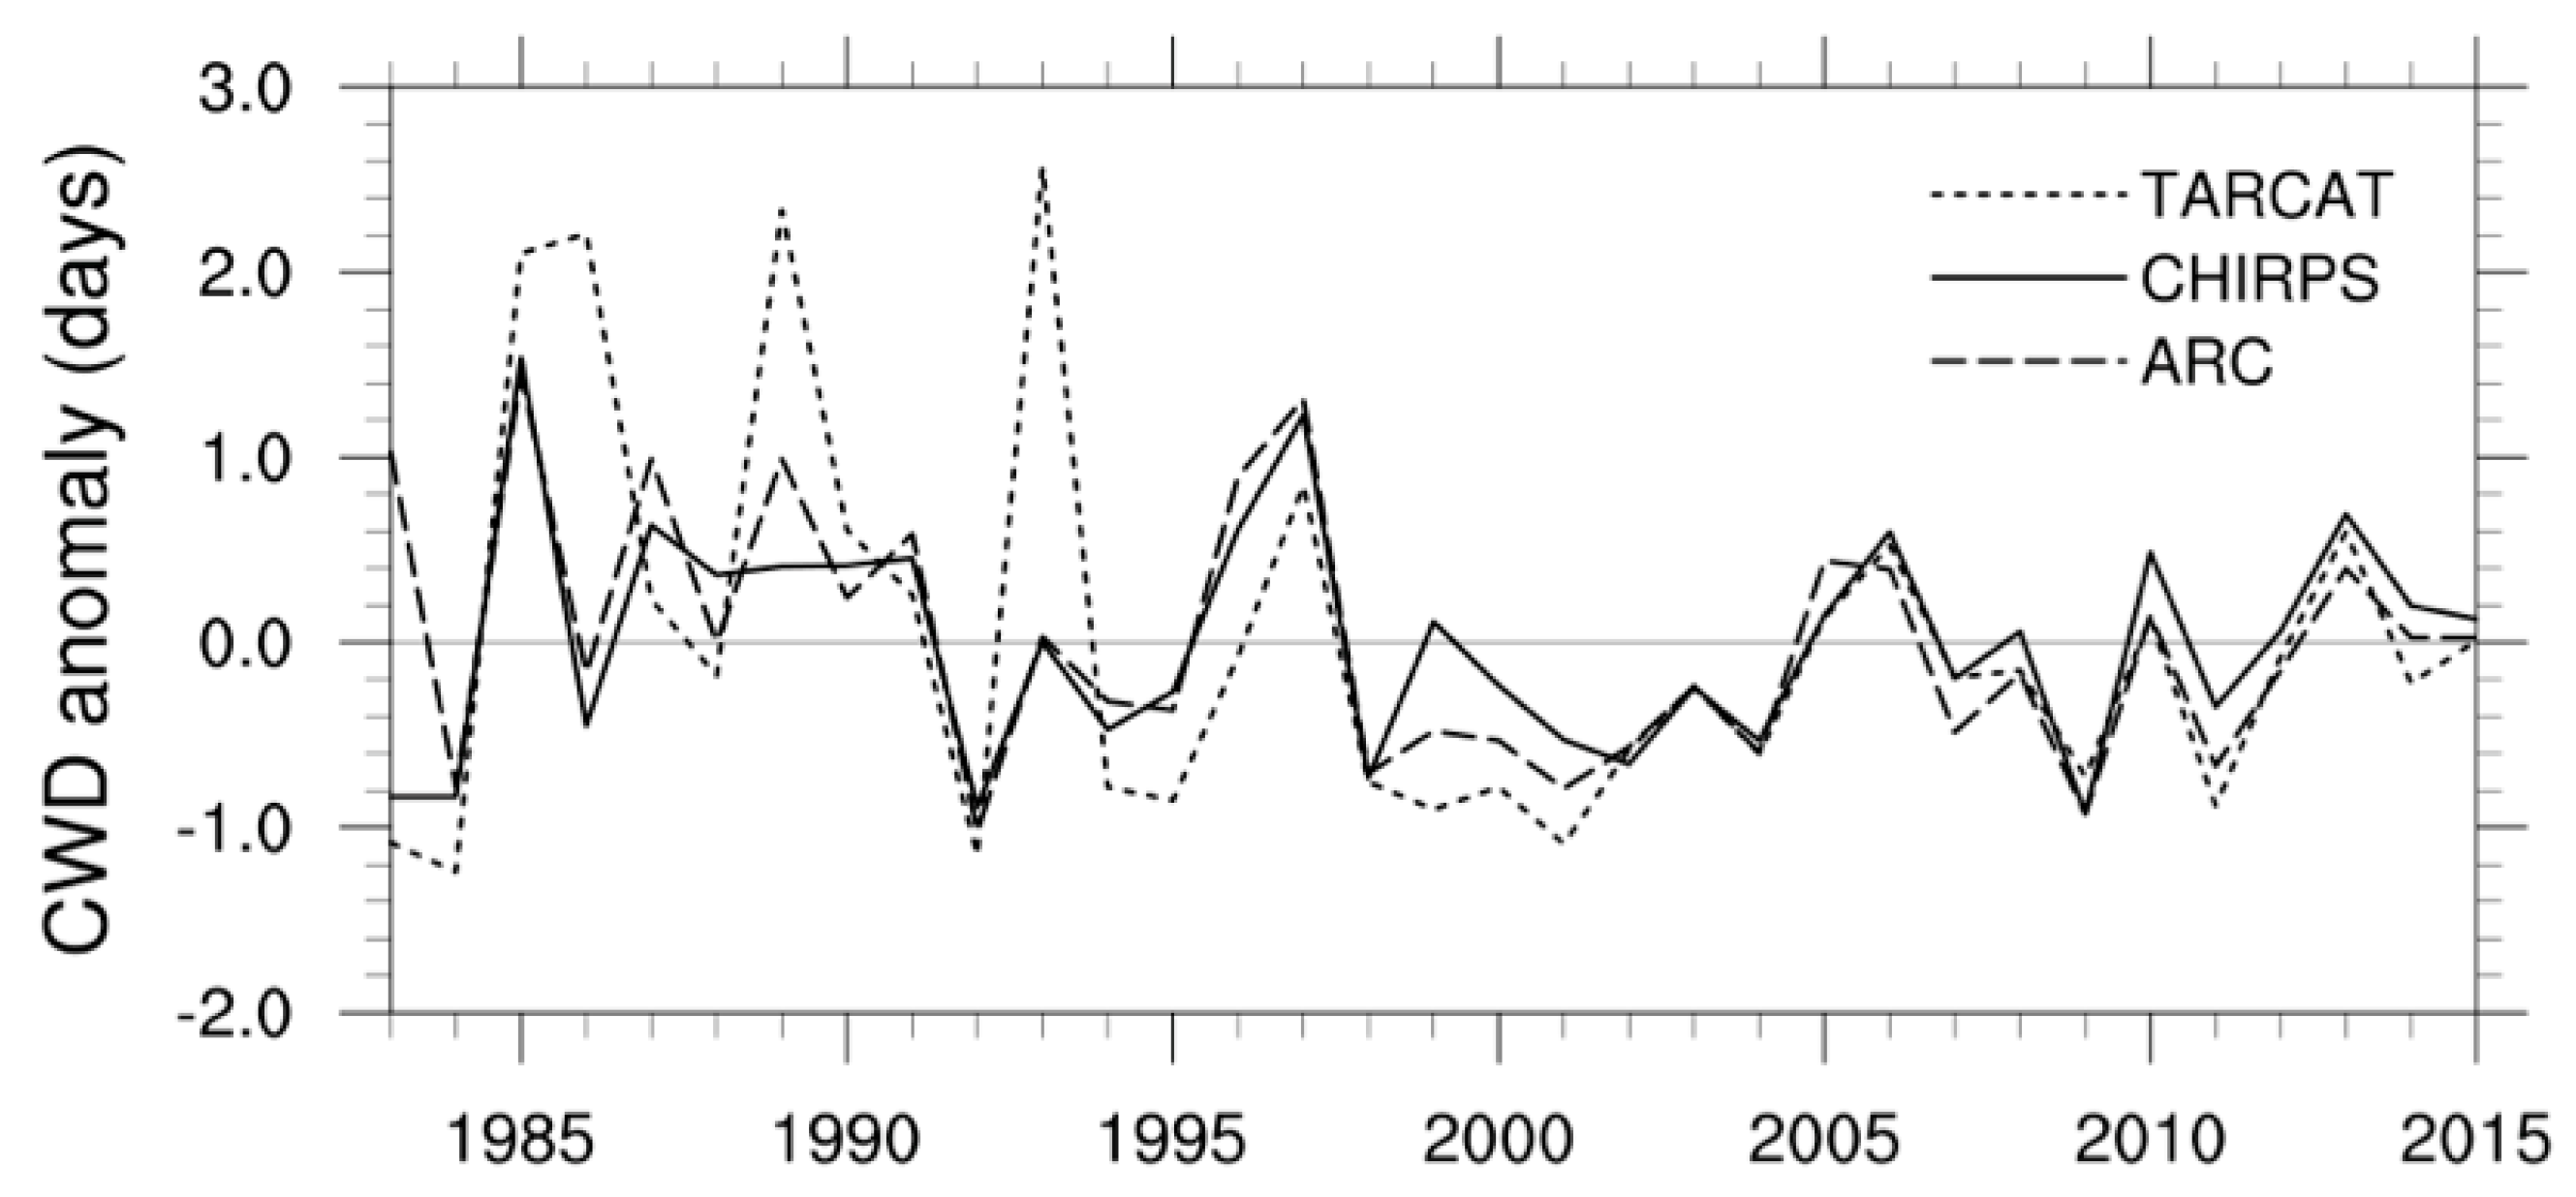
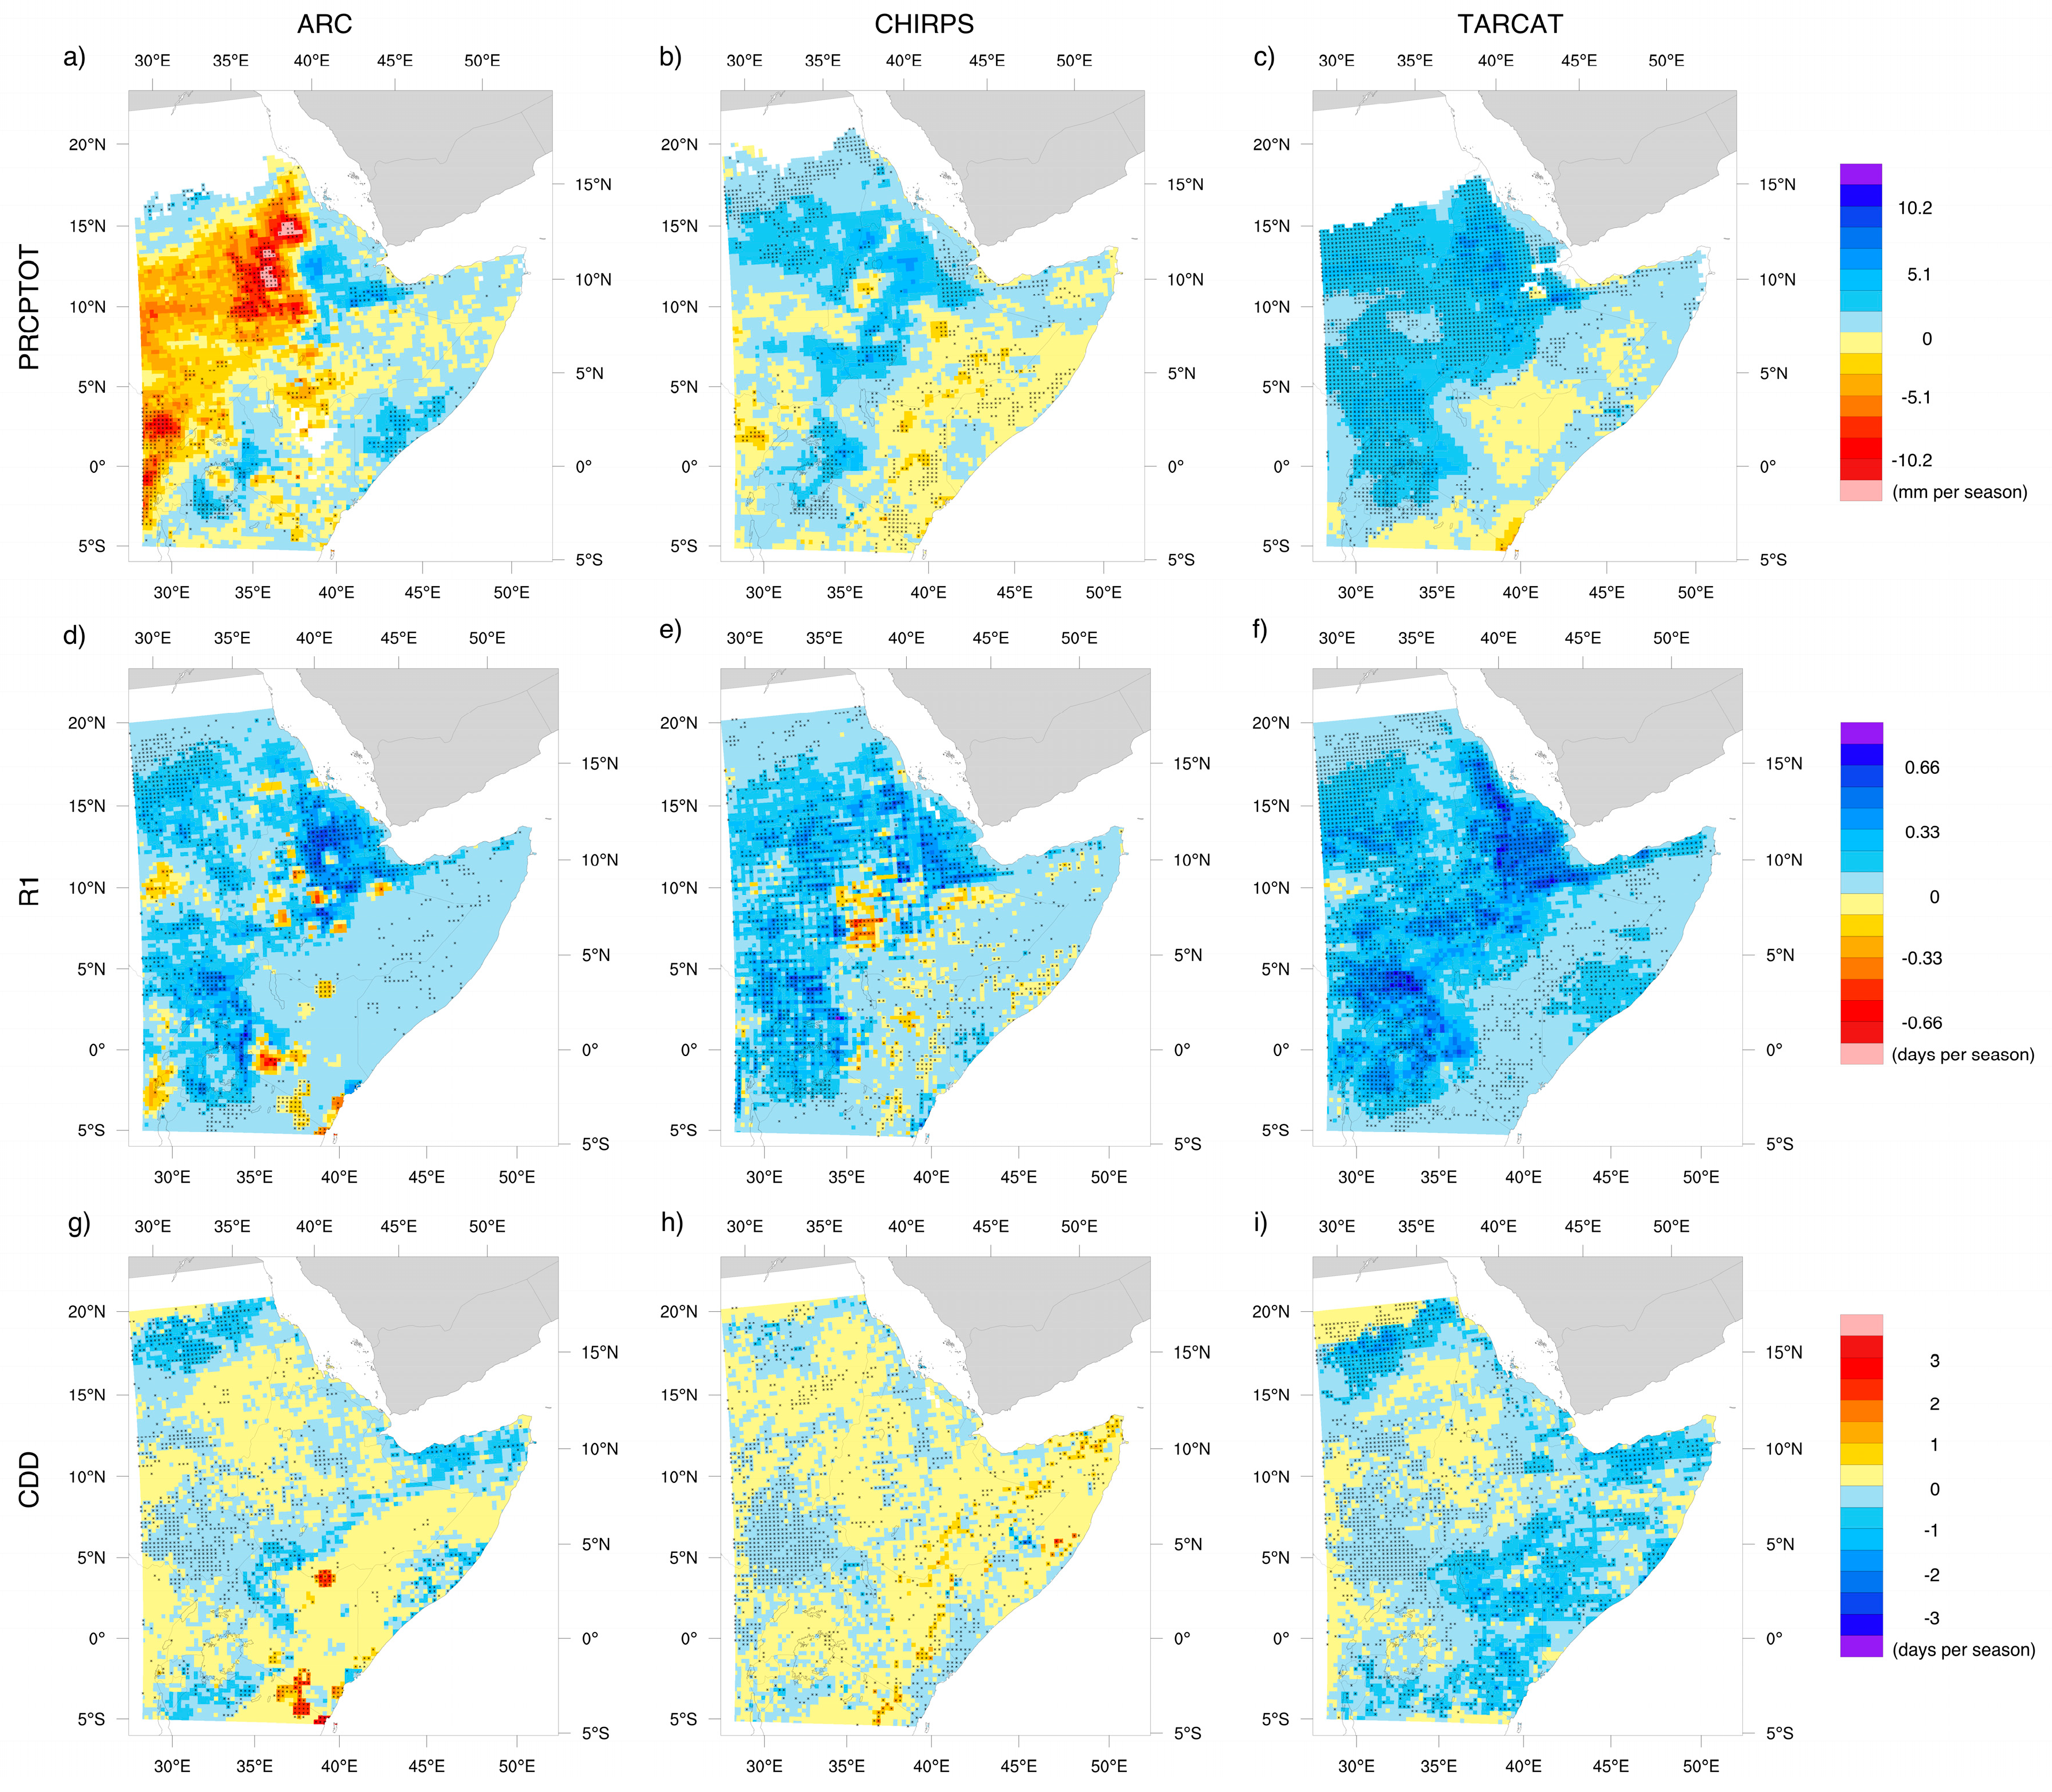
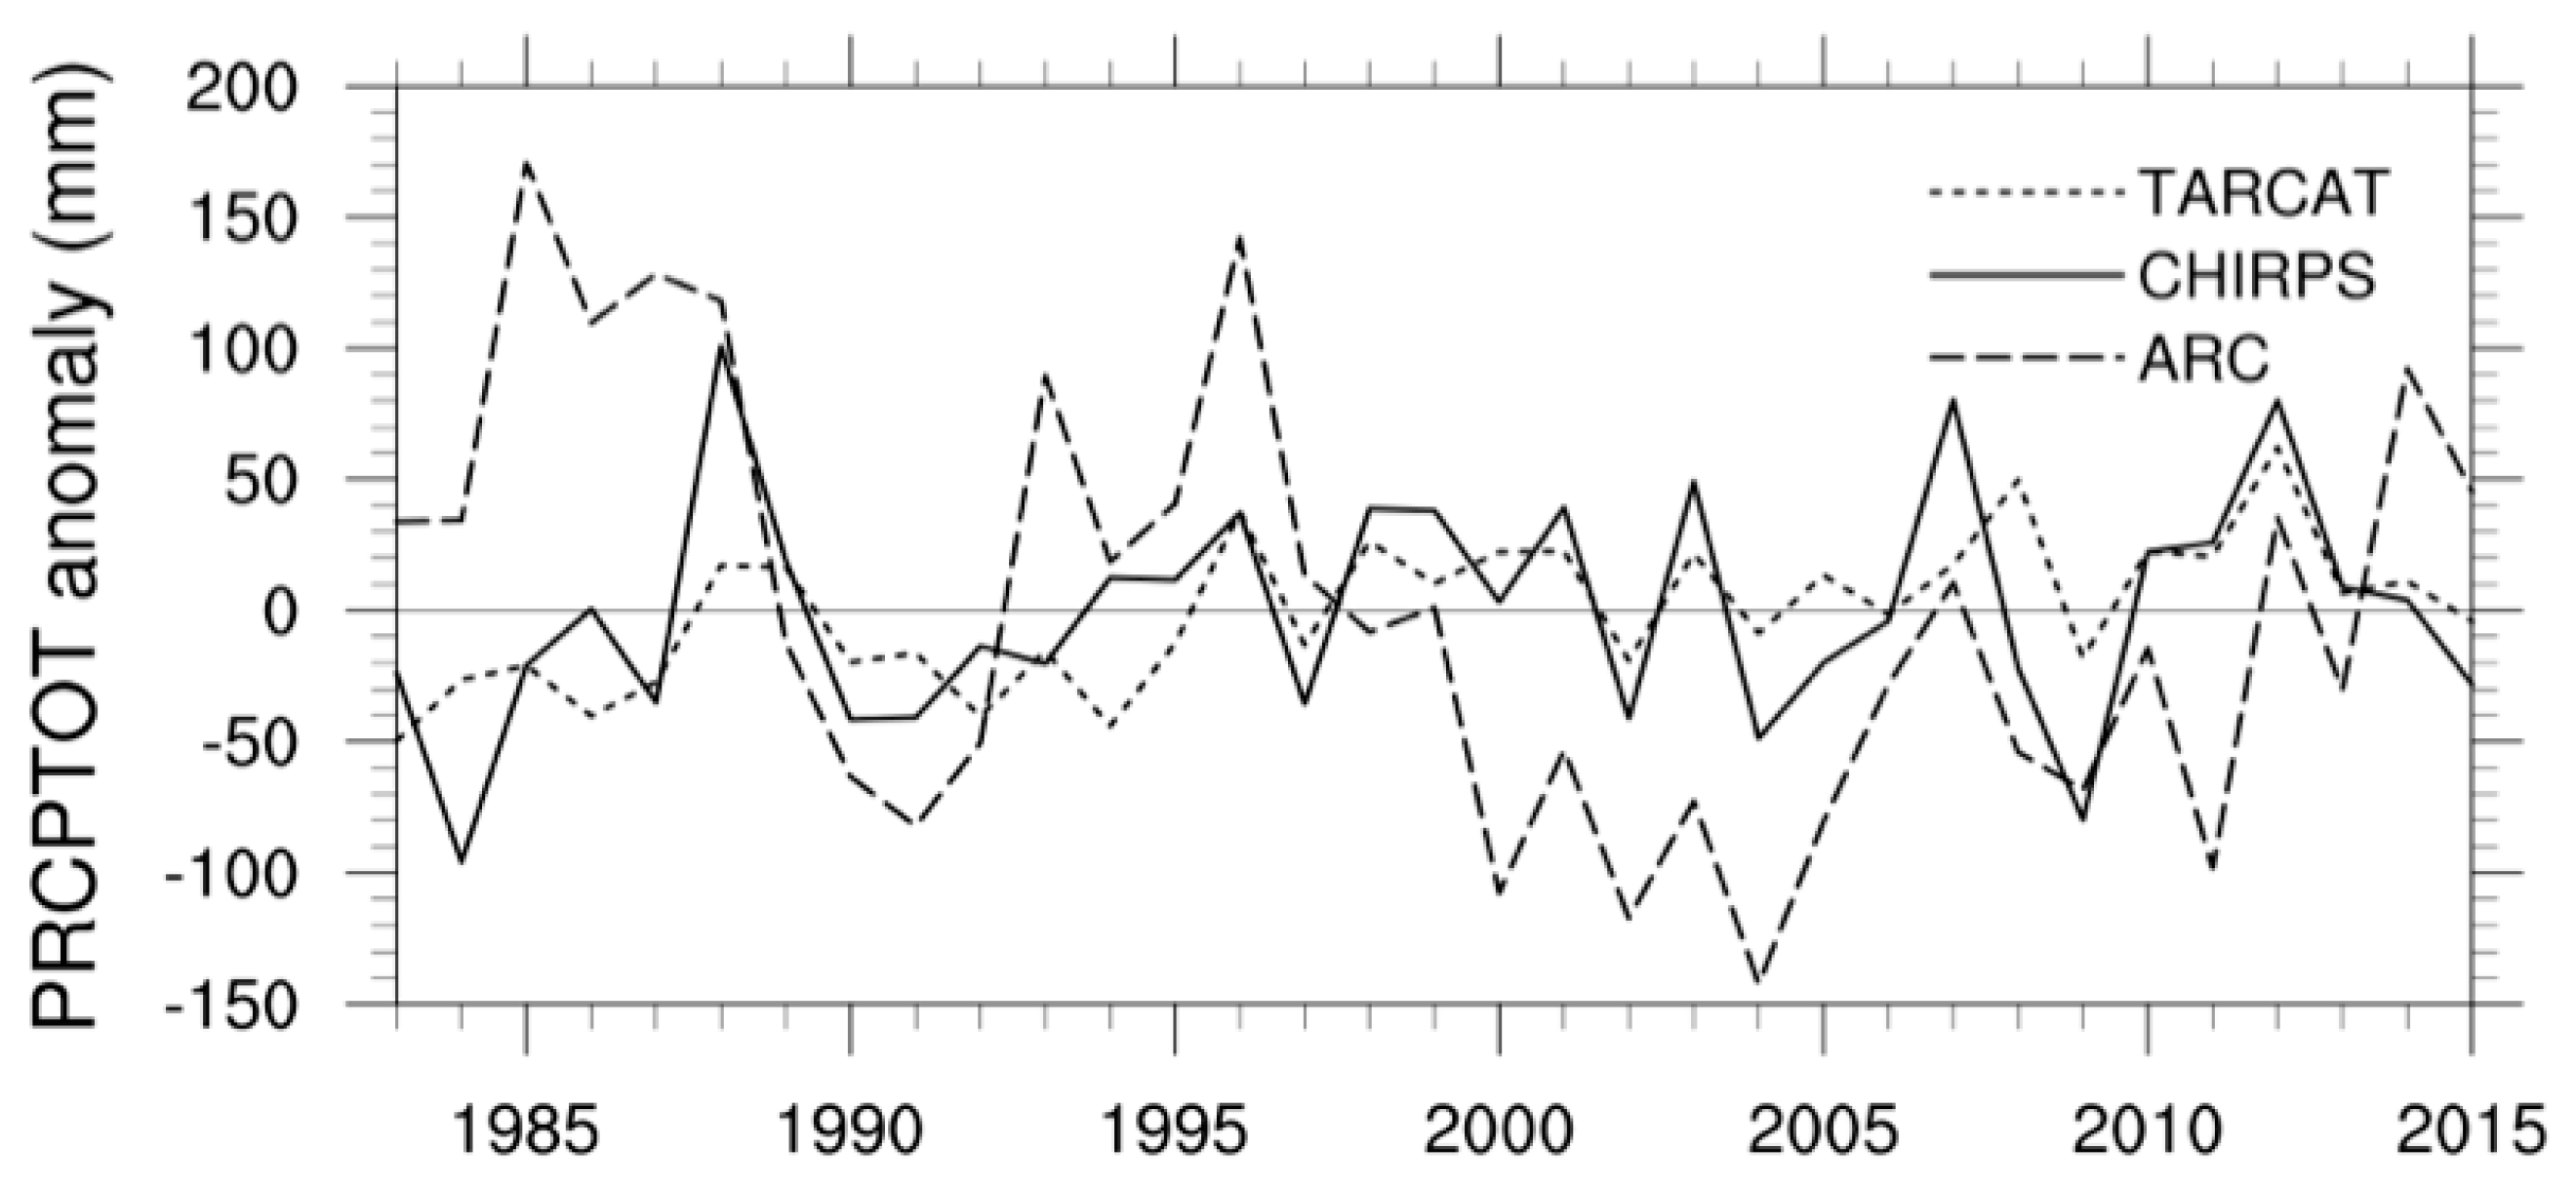
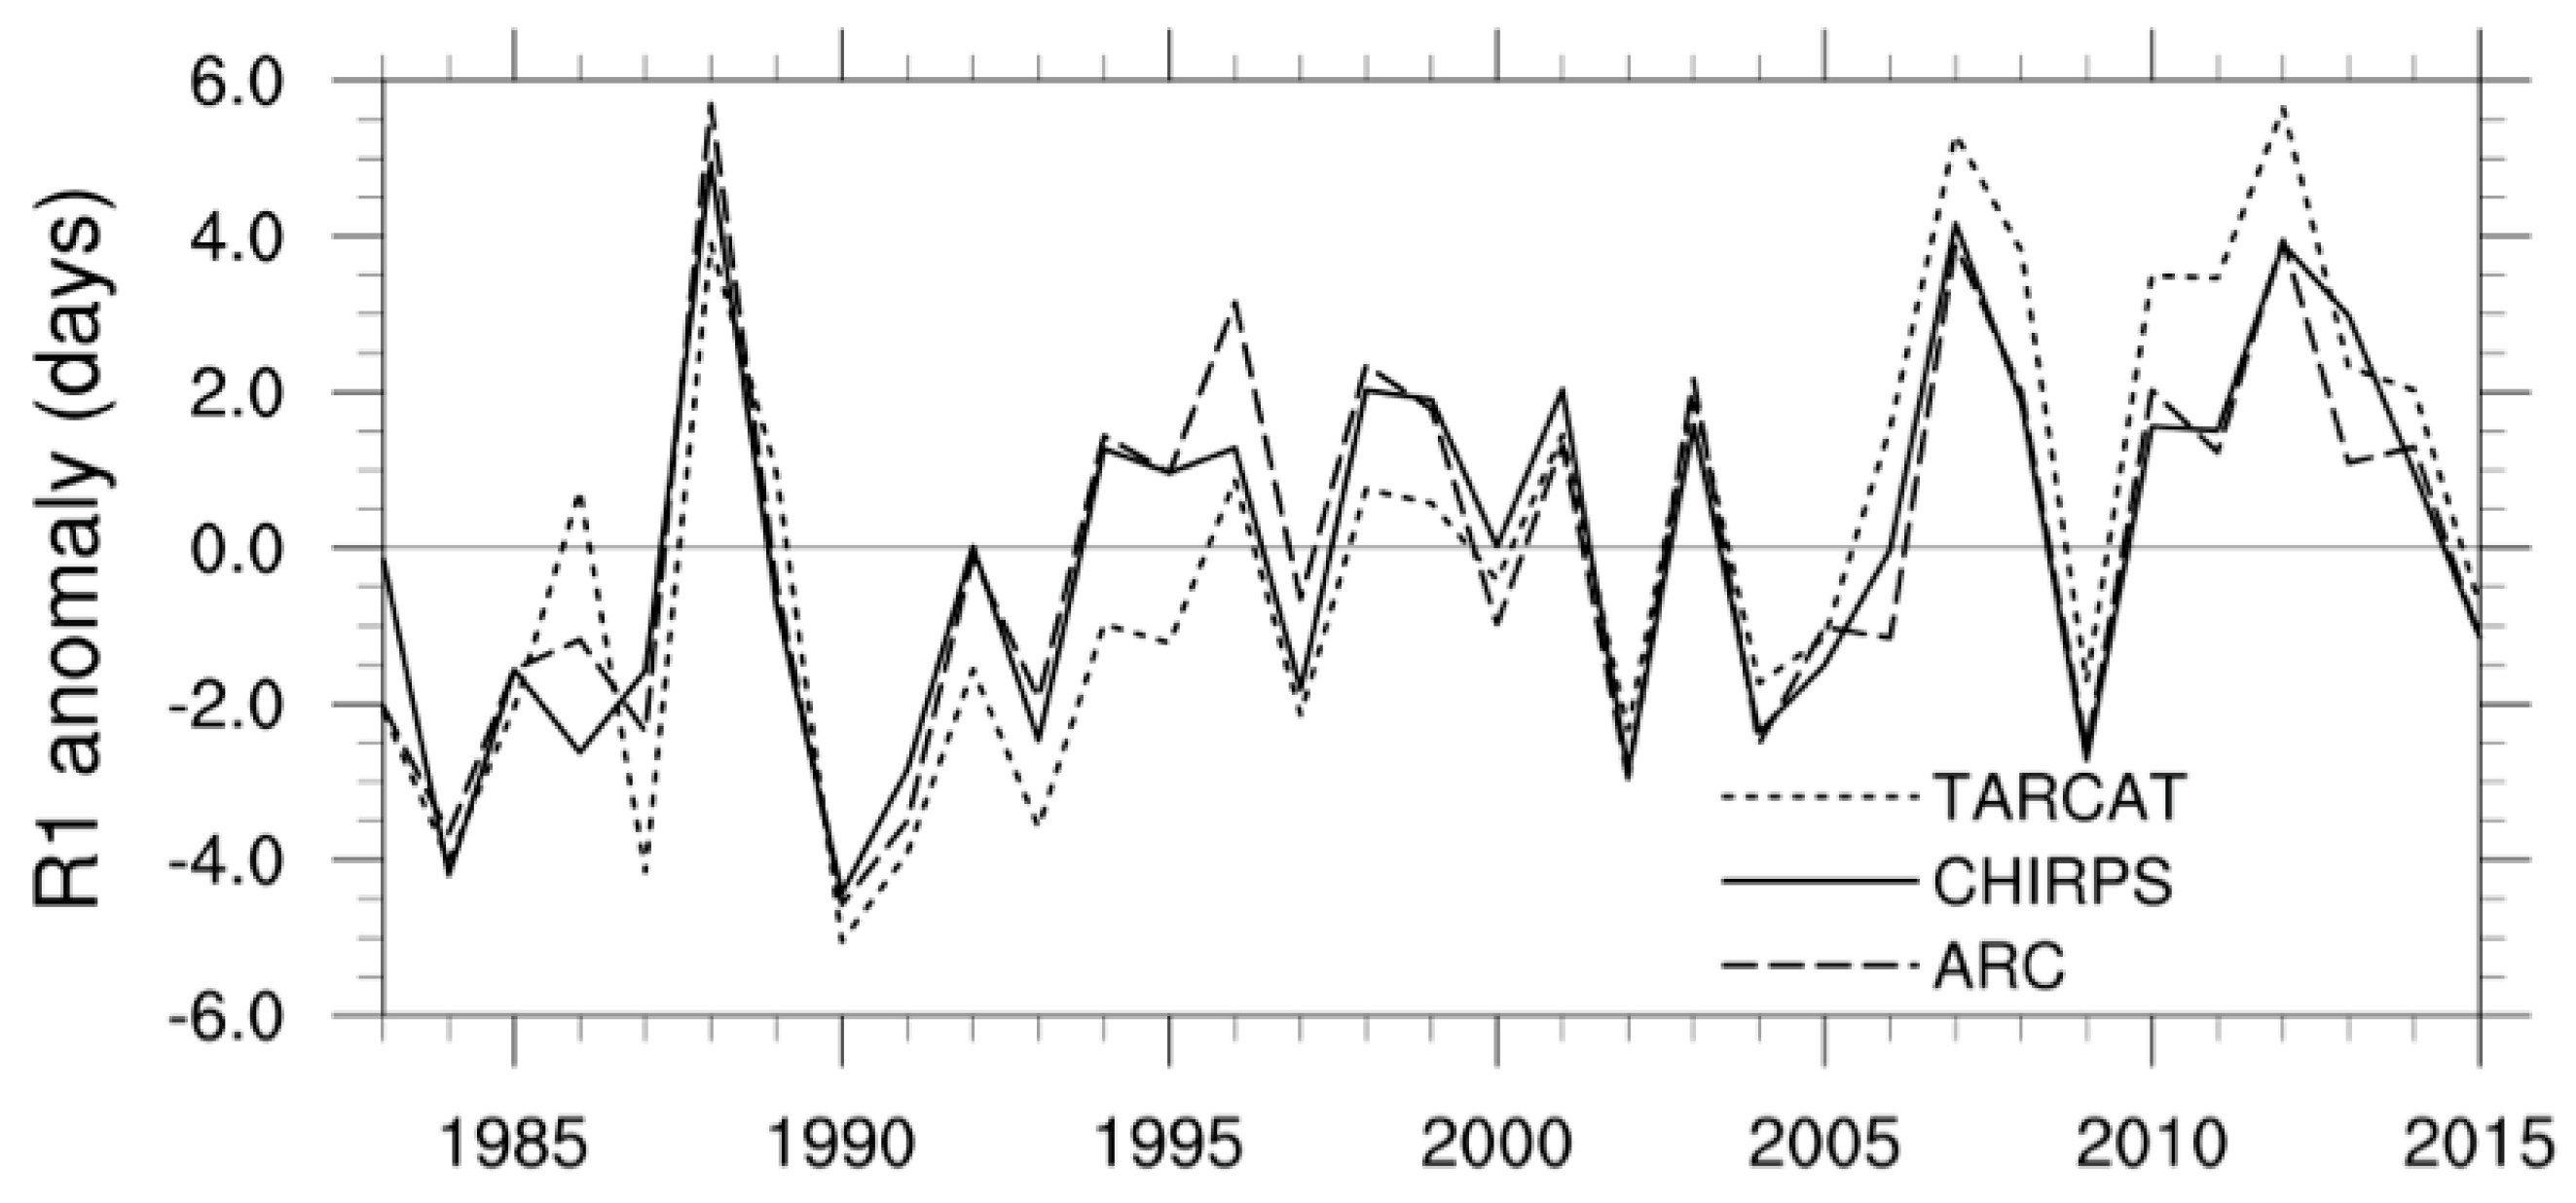
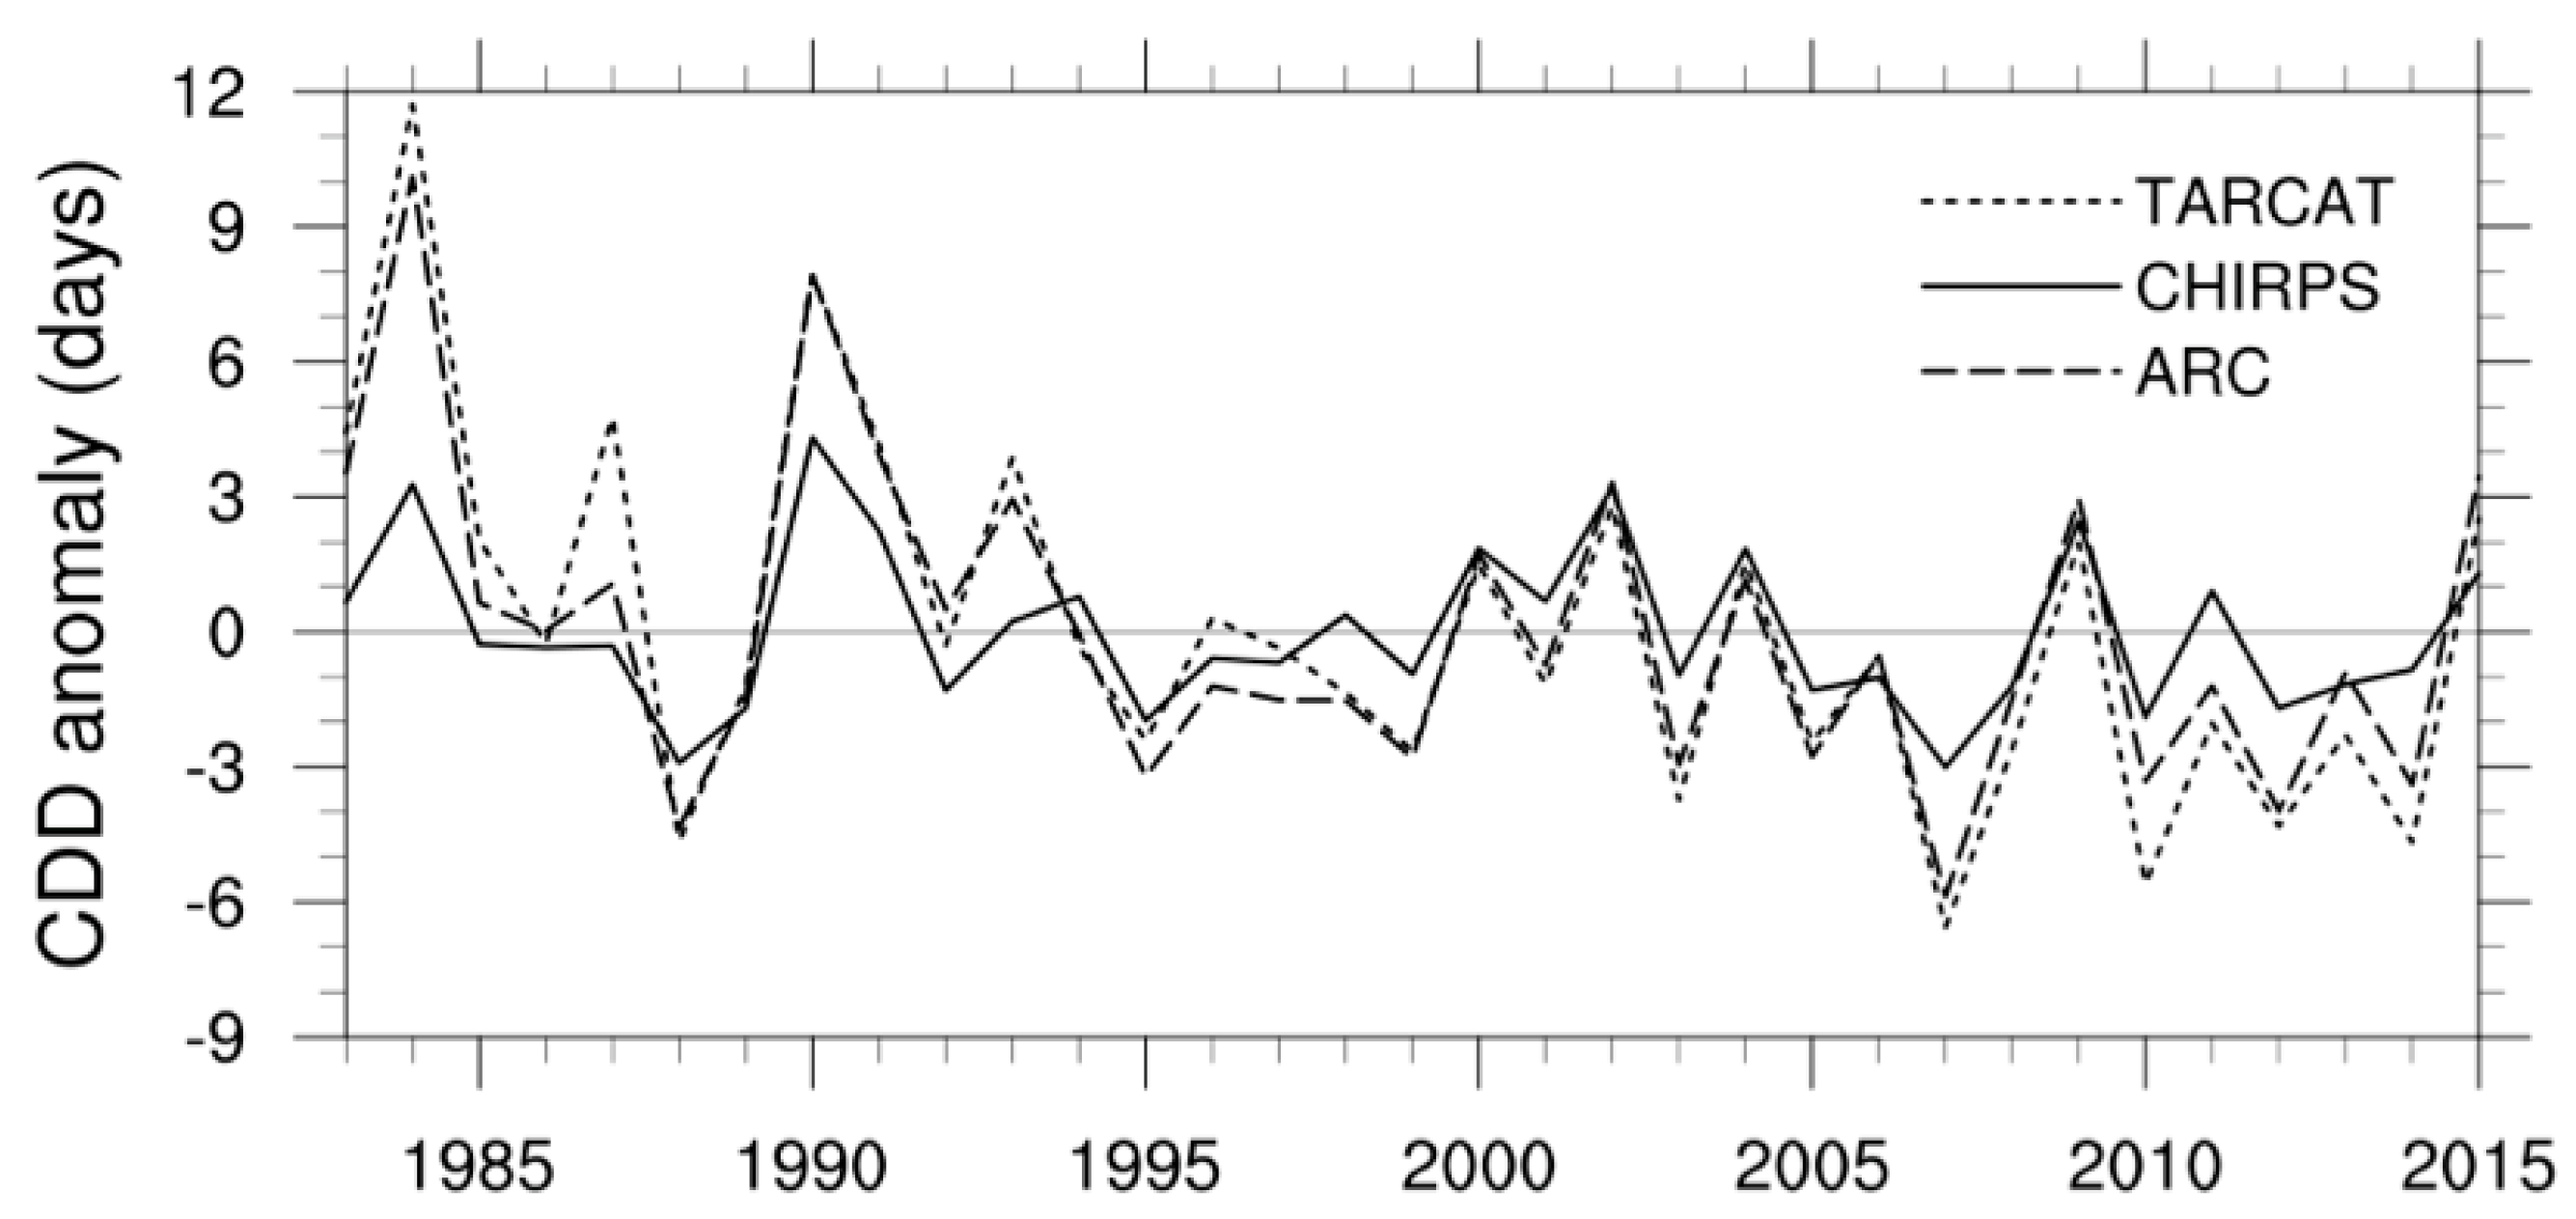
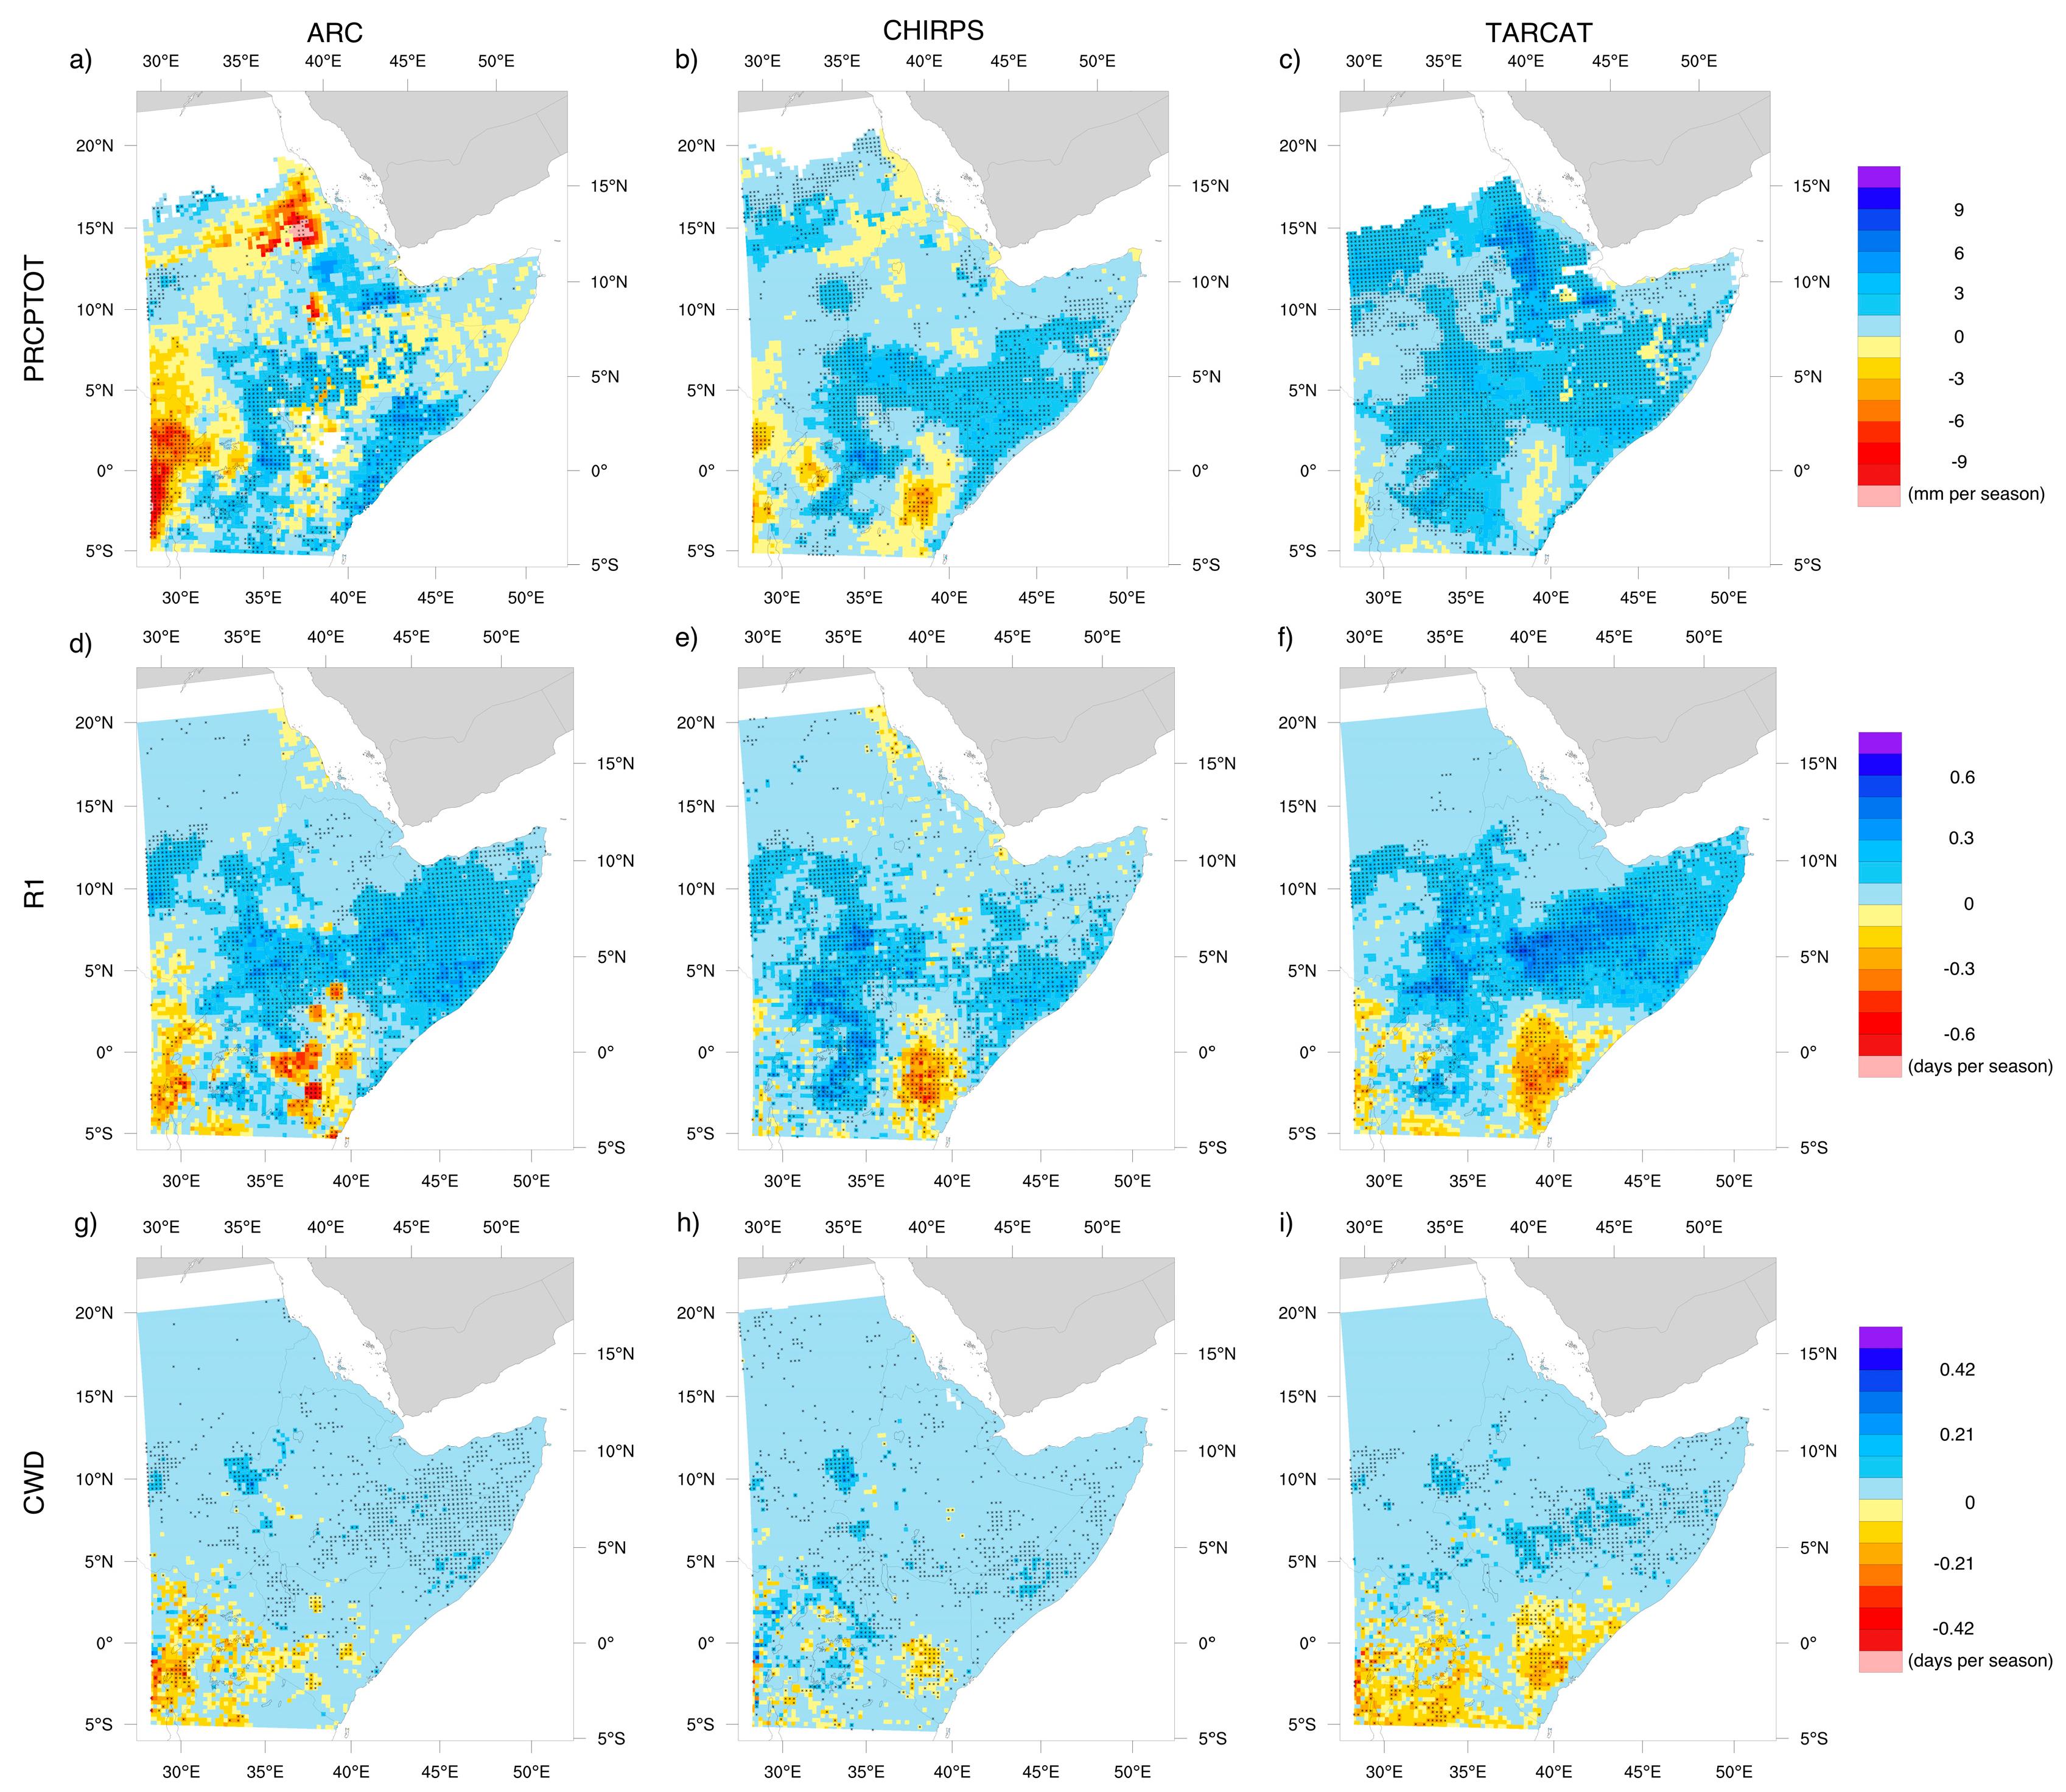
Table 1.
List of the CCl/CLIVAR/JCOMM ETCCDI rainfall indices exploited in the analysis (http://etccdi.pacificclimate.org/index.shtml).
Table 1.
List of the CCl/CLIVAR/JCOMM ETCCDI rainfall indices exploited in the analysis (http://etccdi.pacificclimate.org/index.shtml).
| ID | Definition | Units |
|---|---|---|
| R1 1 | Number of precipitating days (rain rate, RR ≥ 1 mm) | days |
| SDII | Simple daily intensity index Ratio of total precipitation (annual/seasonal) to the number of precipitating days (RR ≥ 1 mm) | mm day−1 |
| R20 | Number of very heavy precipitating days (RR ≥ 20 mm) | days |
| CDD | Maximum number of consecutive dry days (RR < 1 mm) | days |
| CWD | Maximum number of consecutive precipitating days | days |
| PRCPTOT | Total precipitation from days with RR ≥ 1 mm | mm |
1 R1 is not included in the ETCCDI list.
© 2018 by the authors. Licensee MDPI, Basel, Switzerland. This article is an open access article distributed under the terms and conditions of the Creative Commons Attribution (CC BY) license (http://creativecommons.org/licenses/by/4.0/).
Share and Cite
MDPI and ACS Style
Cattani, E.; Merino, A.; Guijarro, J.A.; Levizzani, V. East Africa Rainfall Trends and Variability 1983–2015 Using Three Long-Term Satellite Products. Remote Sens. 2018, 10, 931. https://0-doi-org.brum.beds.ac.uk/10.3390/rs10060931
AMA Style
Cattani E, Merino A, Guijarro JA, Levizzani V. East Africa Rainfall Trends and Variability 1983–2015 Using Three Long-Term Satellite Products. Remote Sensing. 2018; 10(6):931. https://0-doi-org.brum.beds.ac.uk/10.3390/rs10060931
Chicago/Turabian StyleCattani, Elsa, Andrés Merino, José A. Guijarro, and Vincenzo Levizzani. 2018. "East Africa Rainfall Trends and Variability 1983–2015 Using Three Long-Term Satellite Products" Remote Sensing 10, no. 6: 931. https://0-doi-org.brum.beds.ac.uk/10.3390/rs10060931
Note that from the first issue of 2016, this journal uses article numbers instead of page numbers. See further details here.