Mapping Urban Functional Zones by Integrating Very High Spatial Resolution Remote Sensing Imagery and Points of Interest: A Case Study of Xiamen, China


Abstract
:1. Introduction
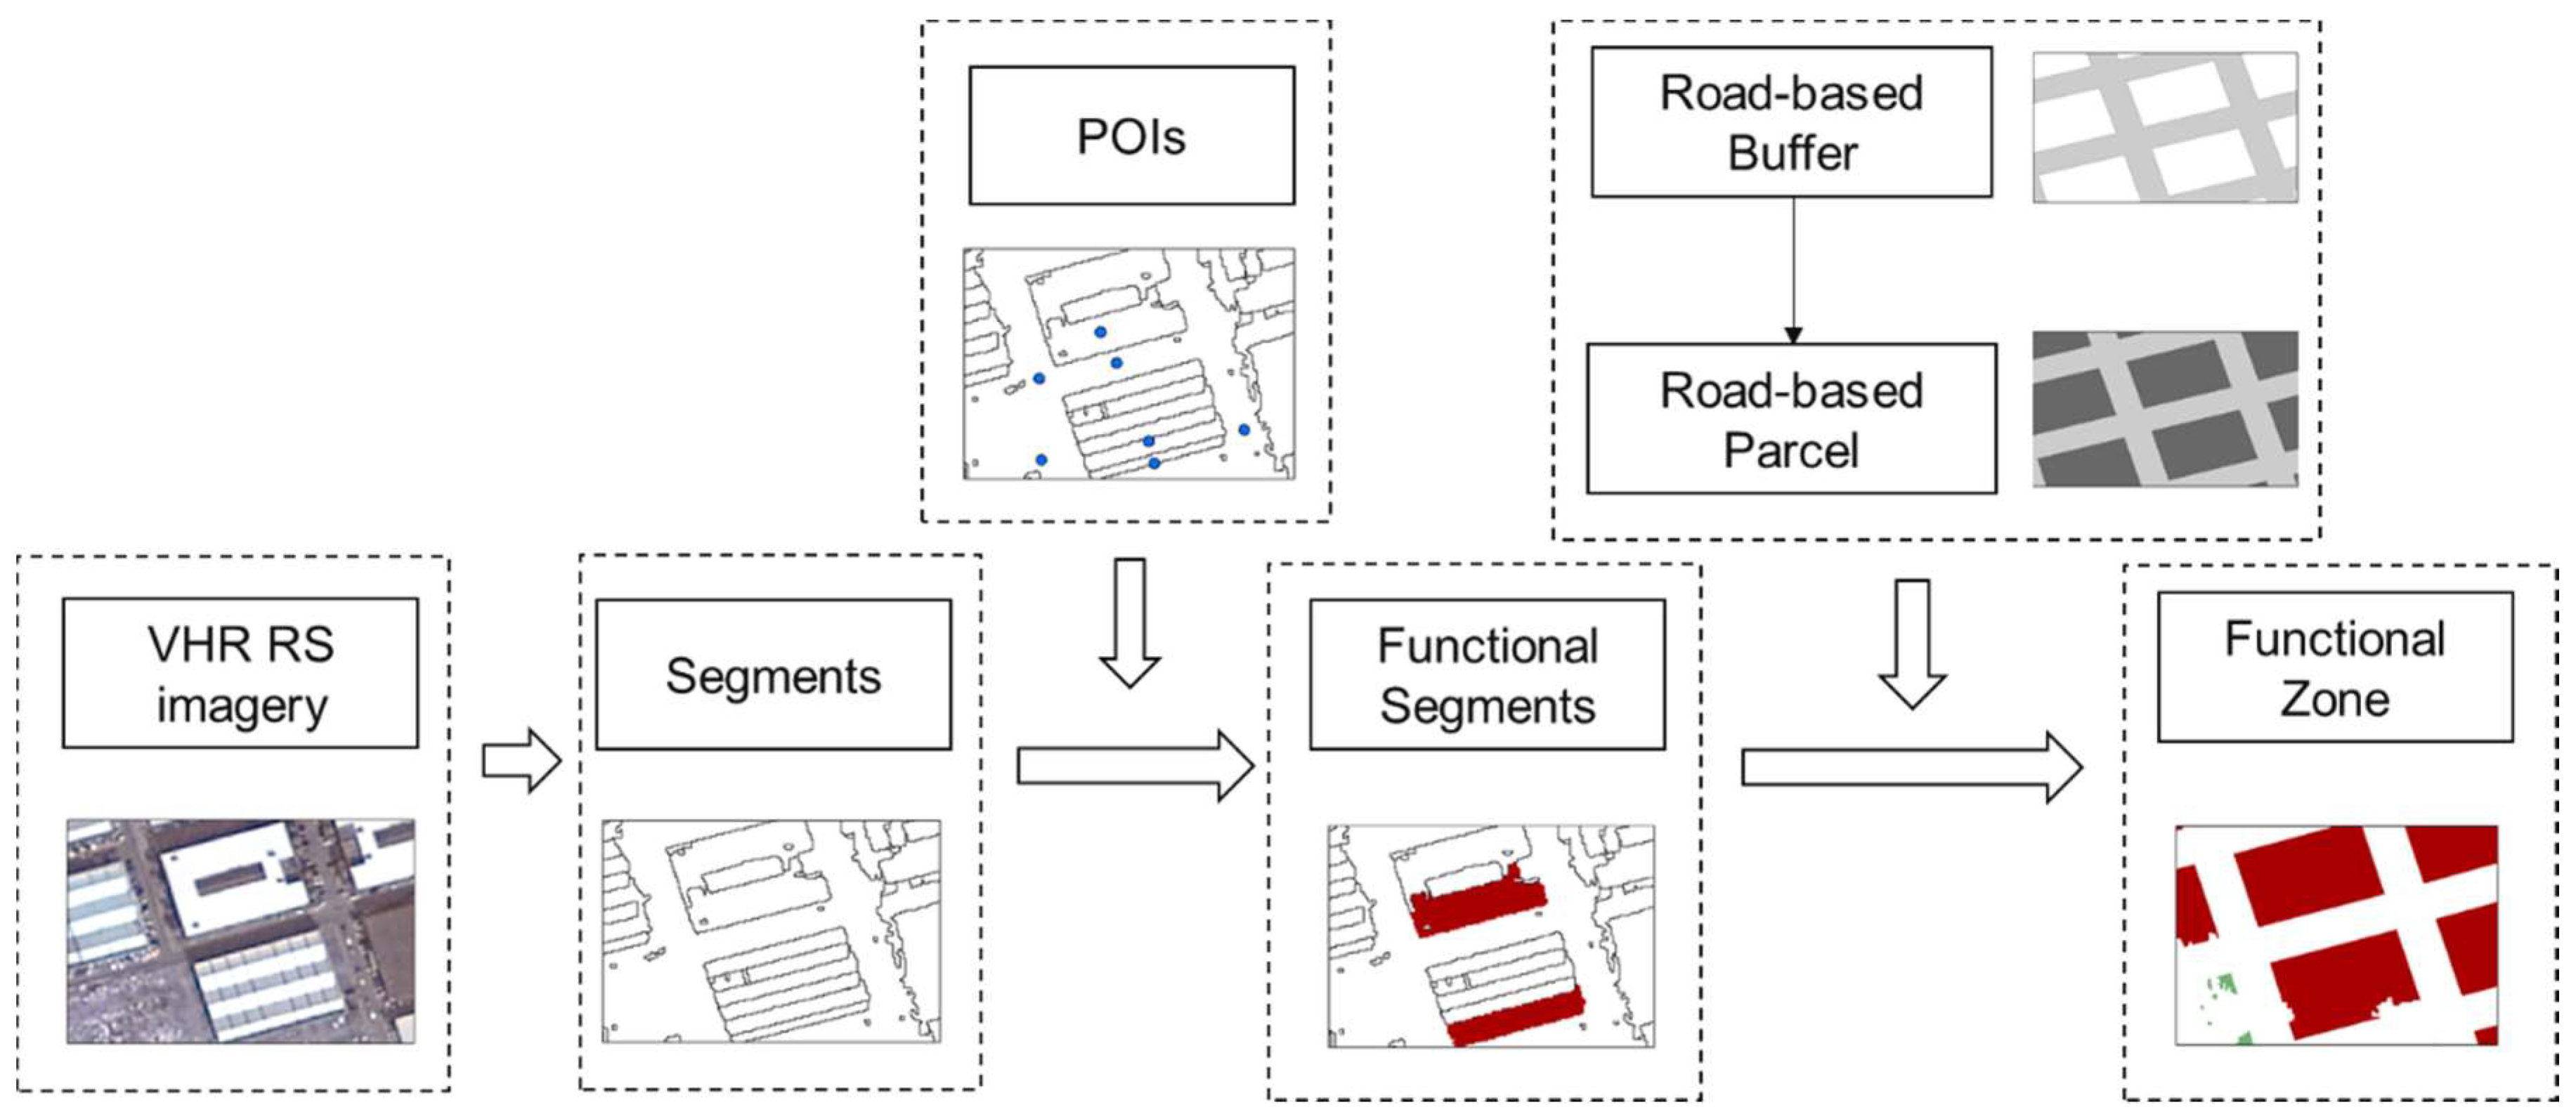
2. Methods
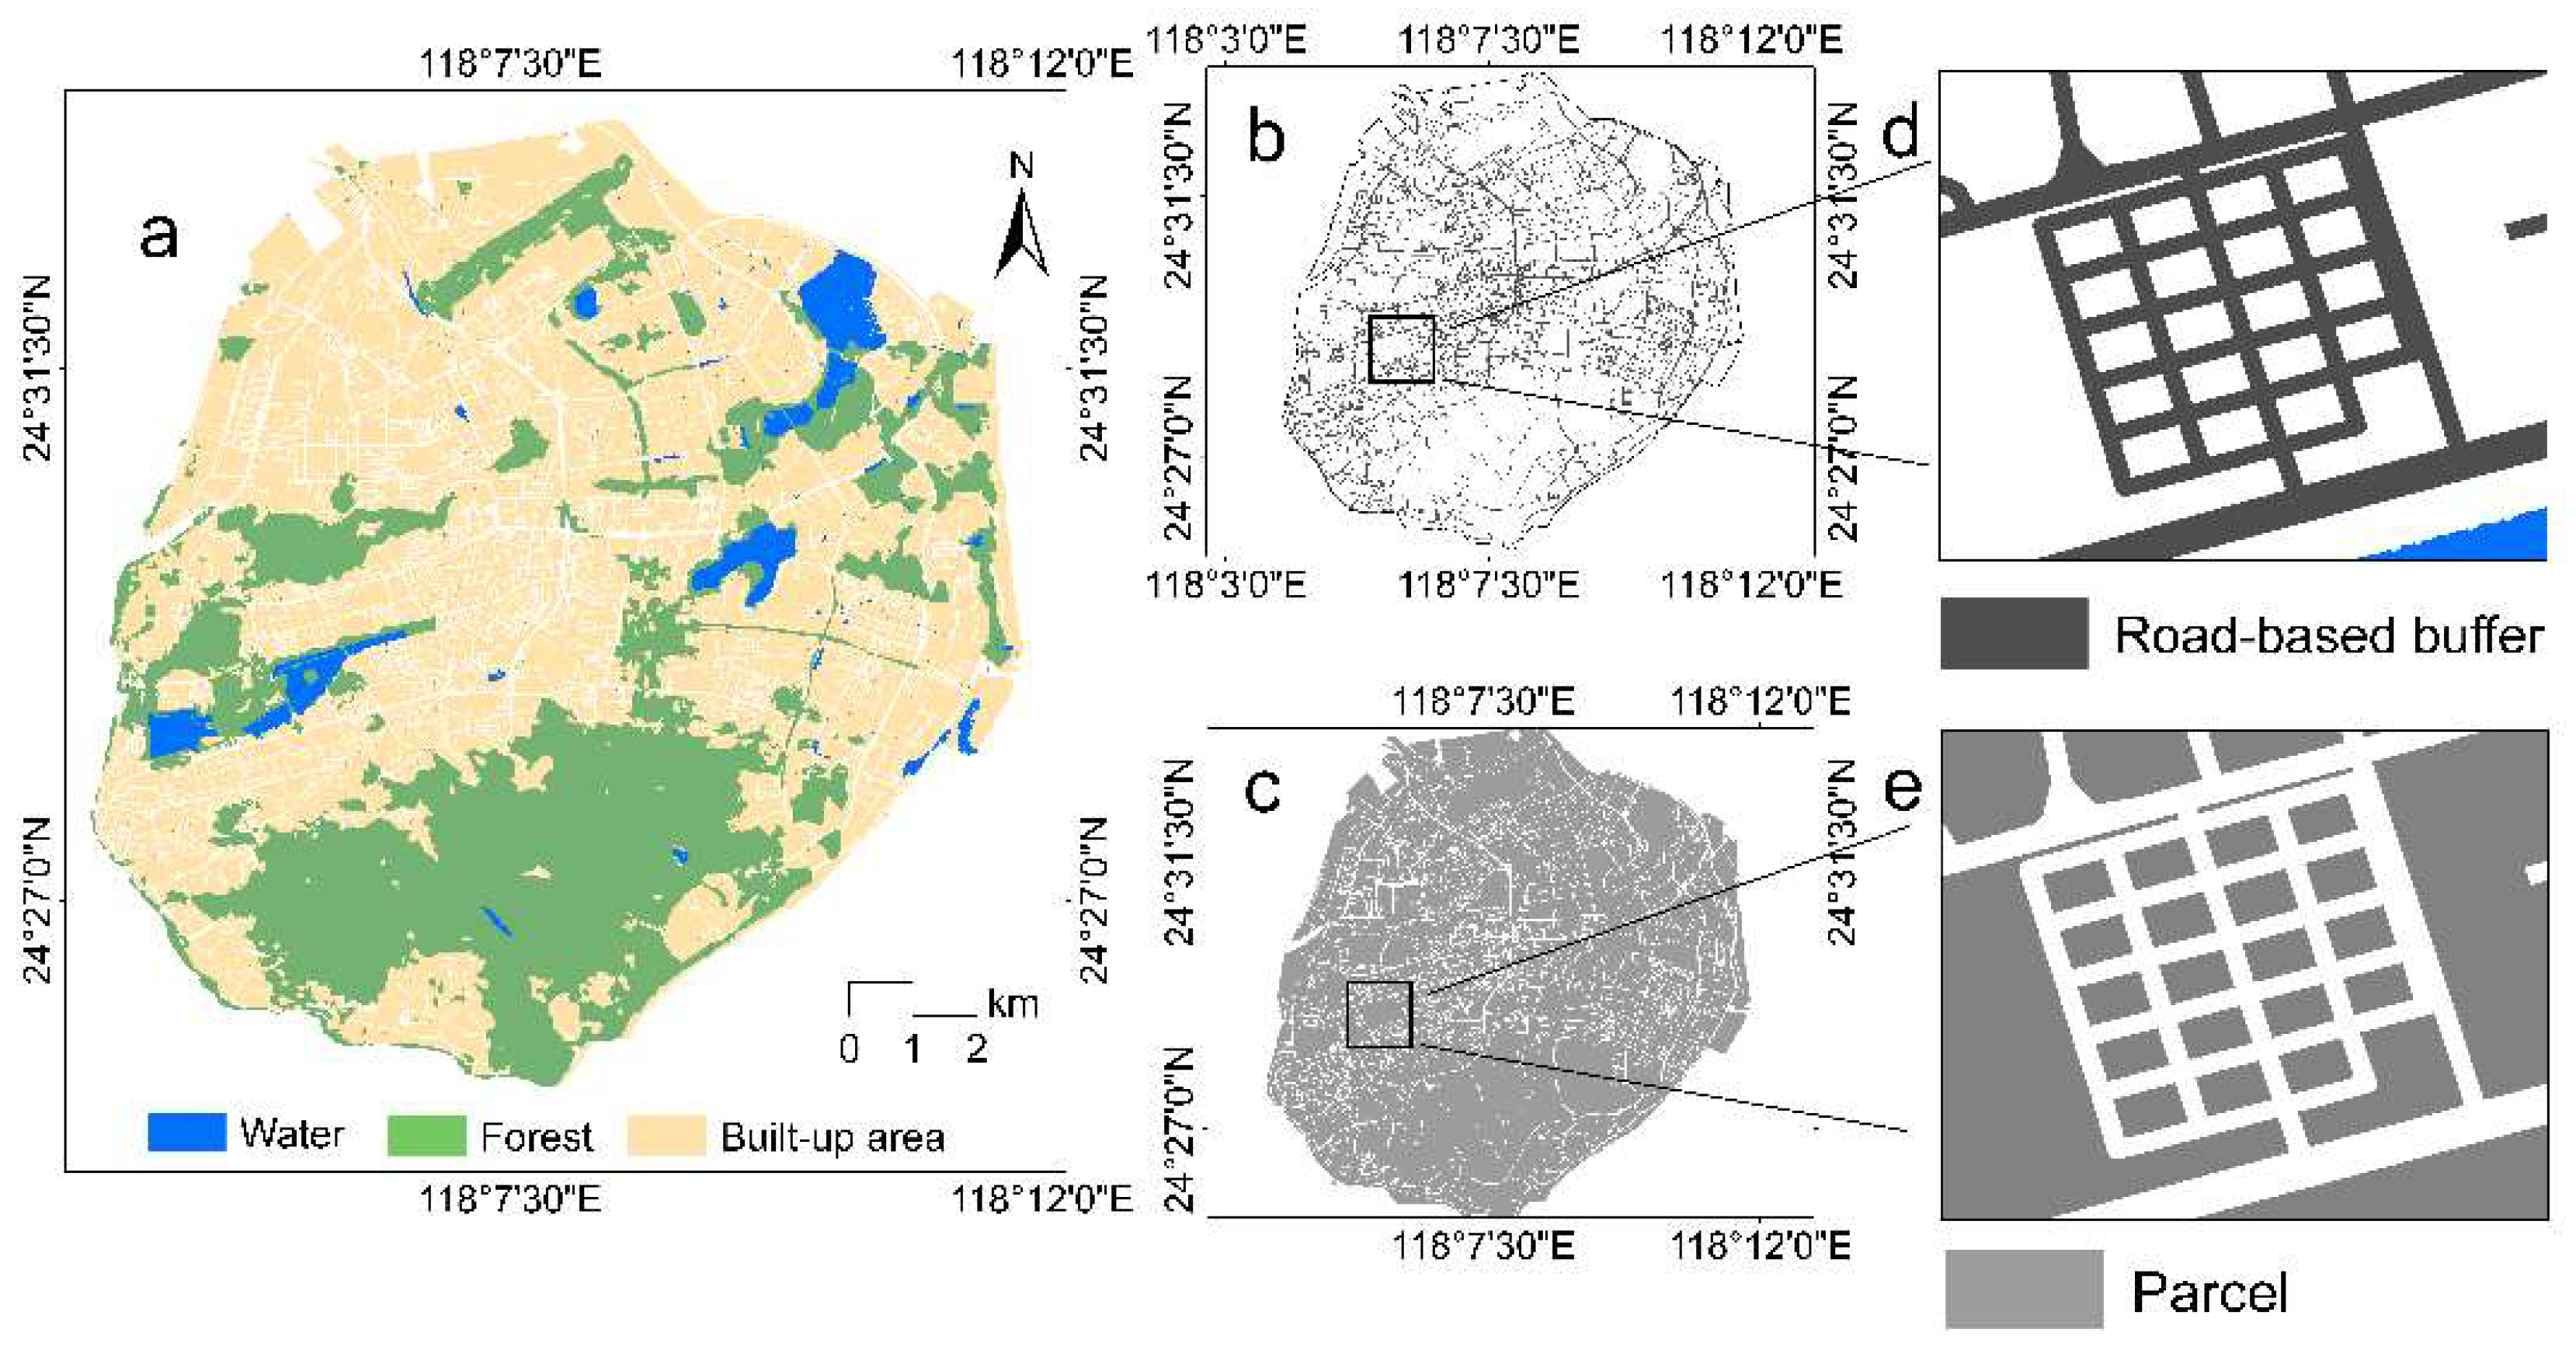
2.1. Urban Land Cover Classification and the Generation of Functional Parcels
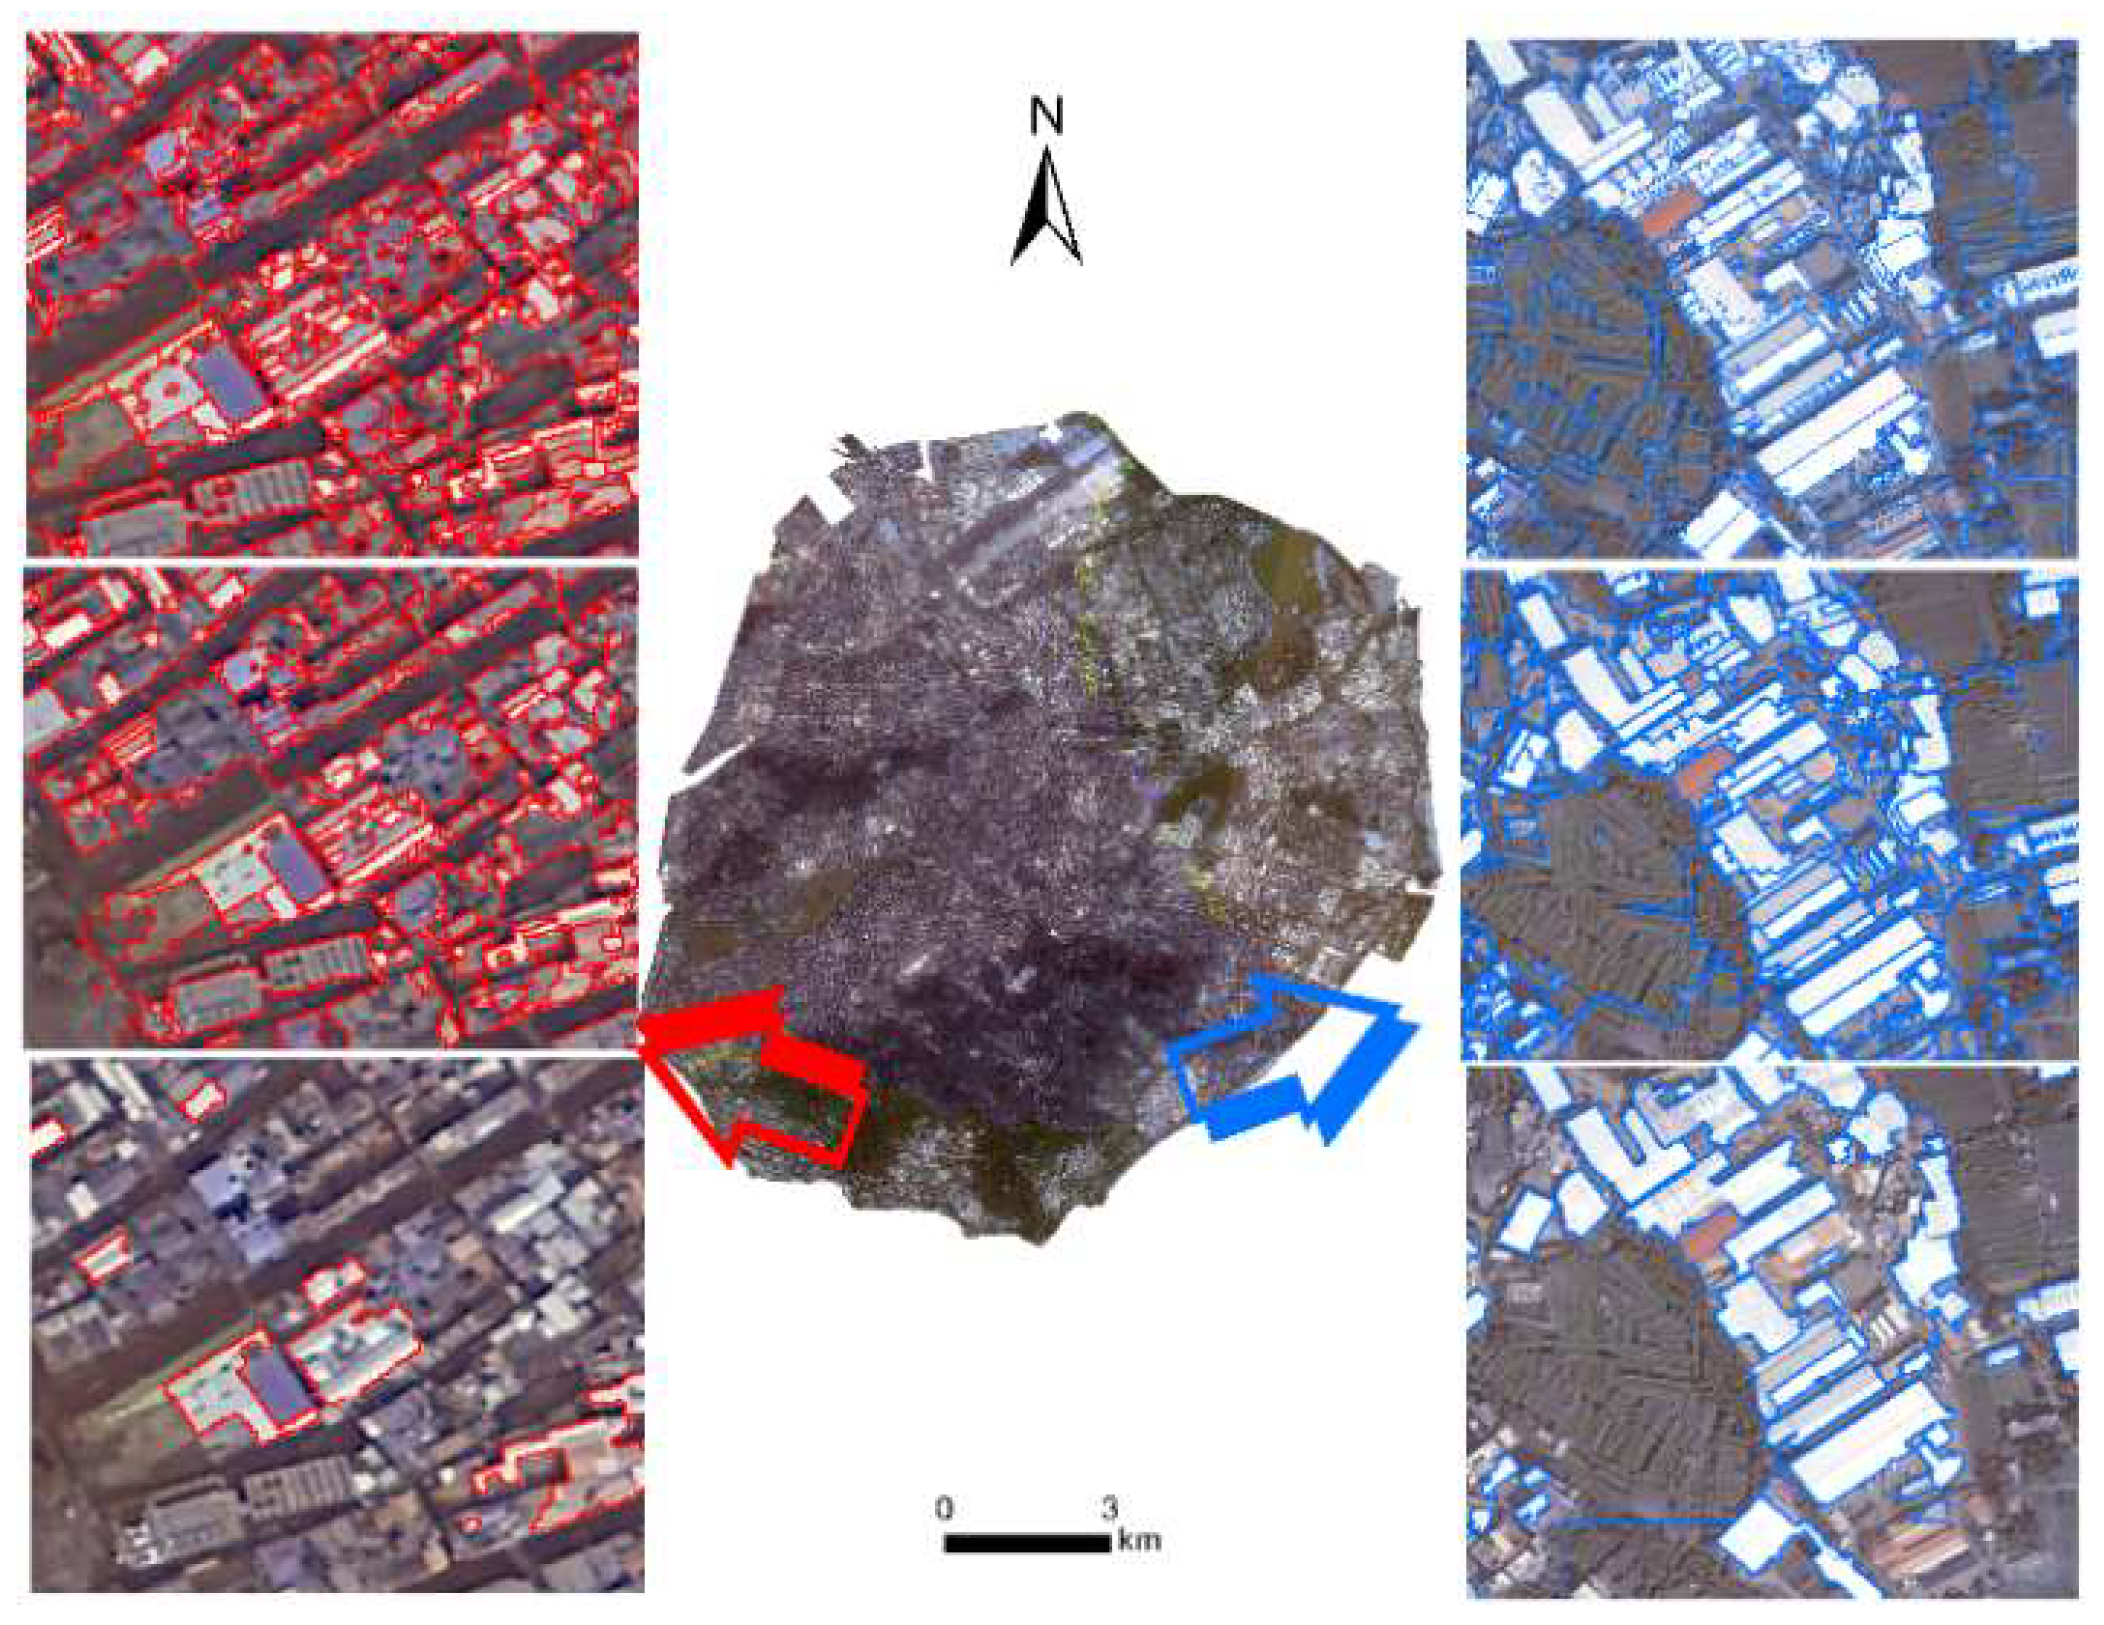
2.2. Image Segmentation on Buildings
2.3. The Weights of POIs and Segmentation
2.4. Appending the Function of POIs to Segmentation
2.5. Appending Functional Segmentation to Parcels
- Firstly, the transportation zone and shopping center should be the primary function. If there is a transportation zone (such as an airport or railway station) and a shopping center in the same parcel, the main function of this parcels is transportation and the shopping center is secondary.
- If there is no transportation or shopping center point in a parcel, the method of determining the function would obey the following rule:
2.6. Accuracy Assessment
3. Case Study
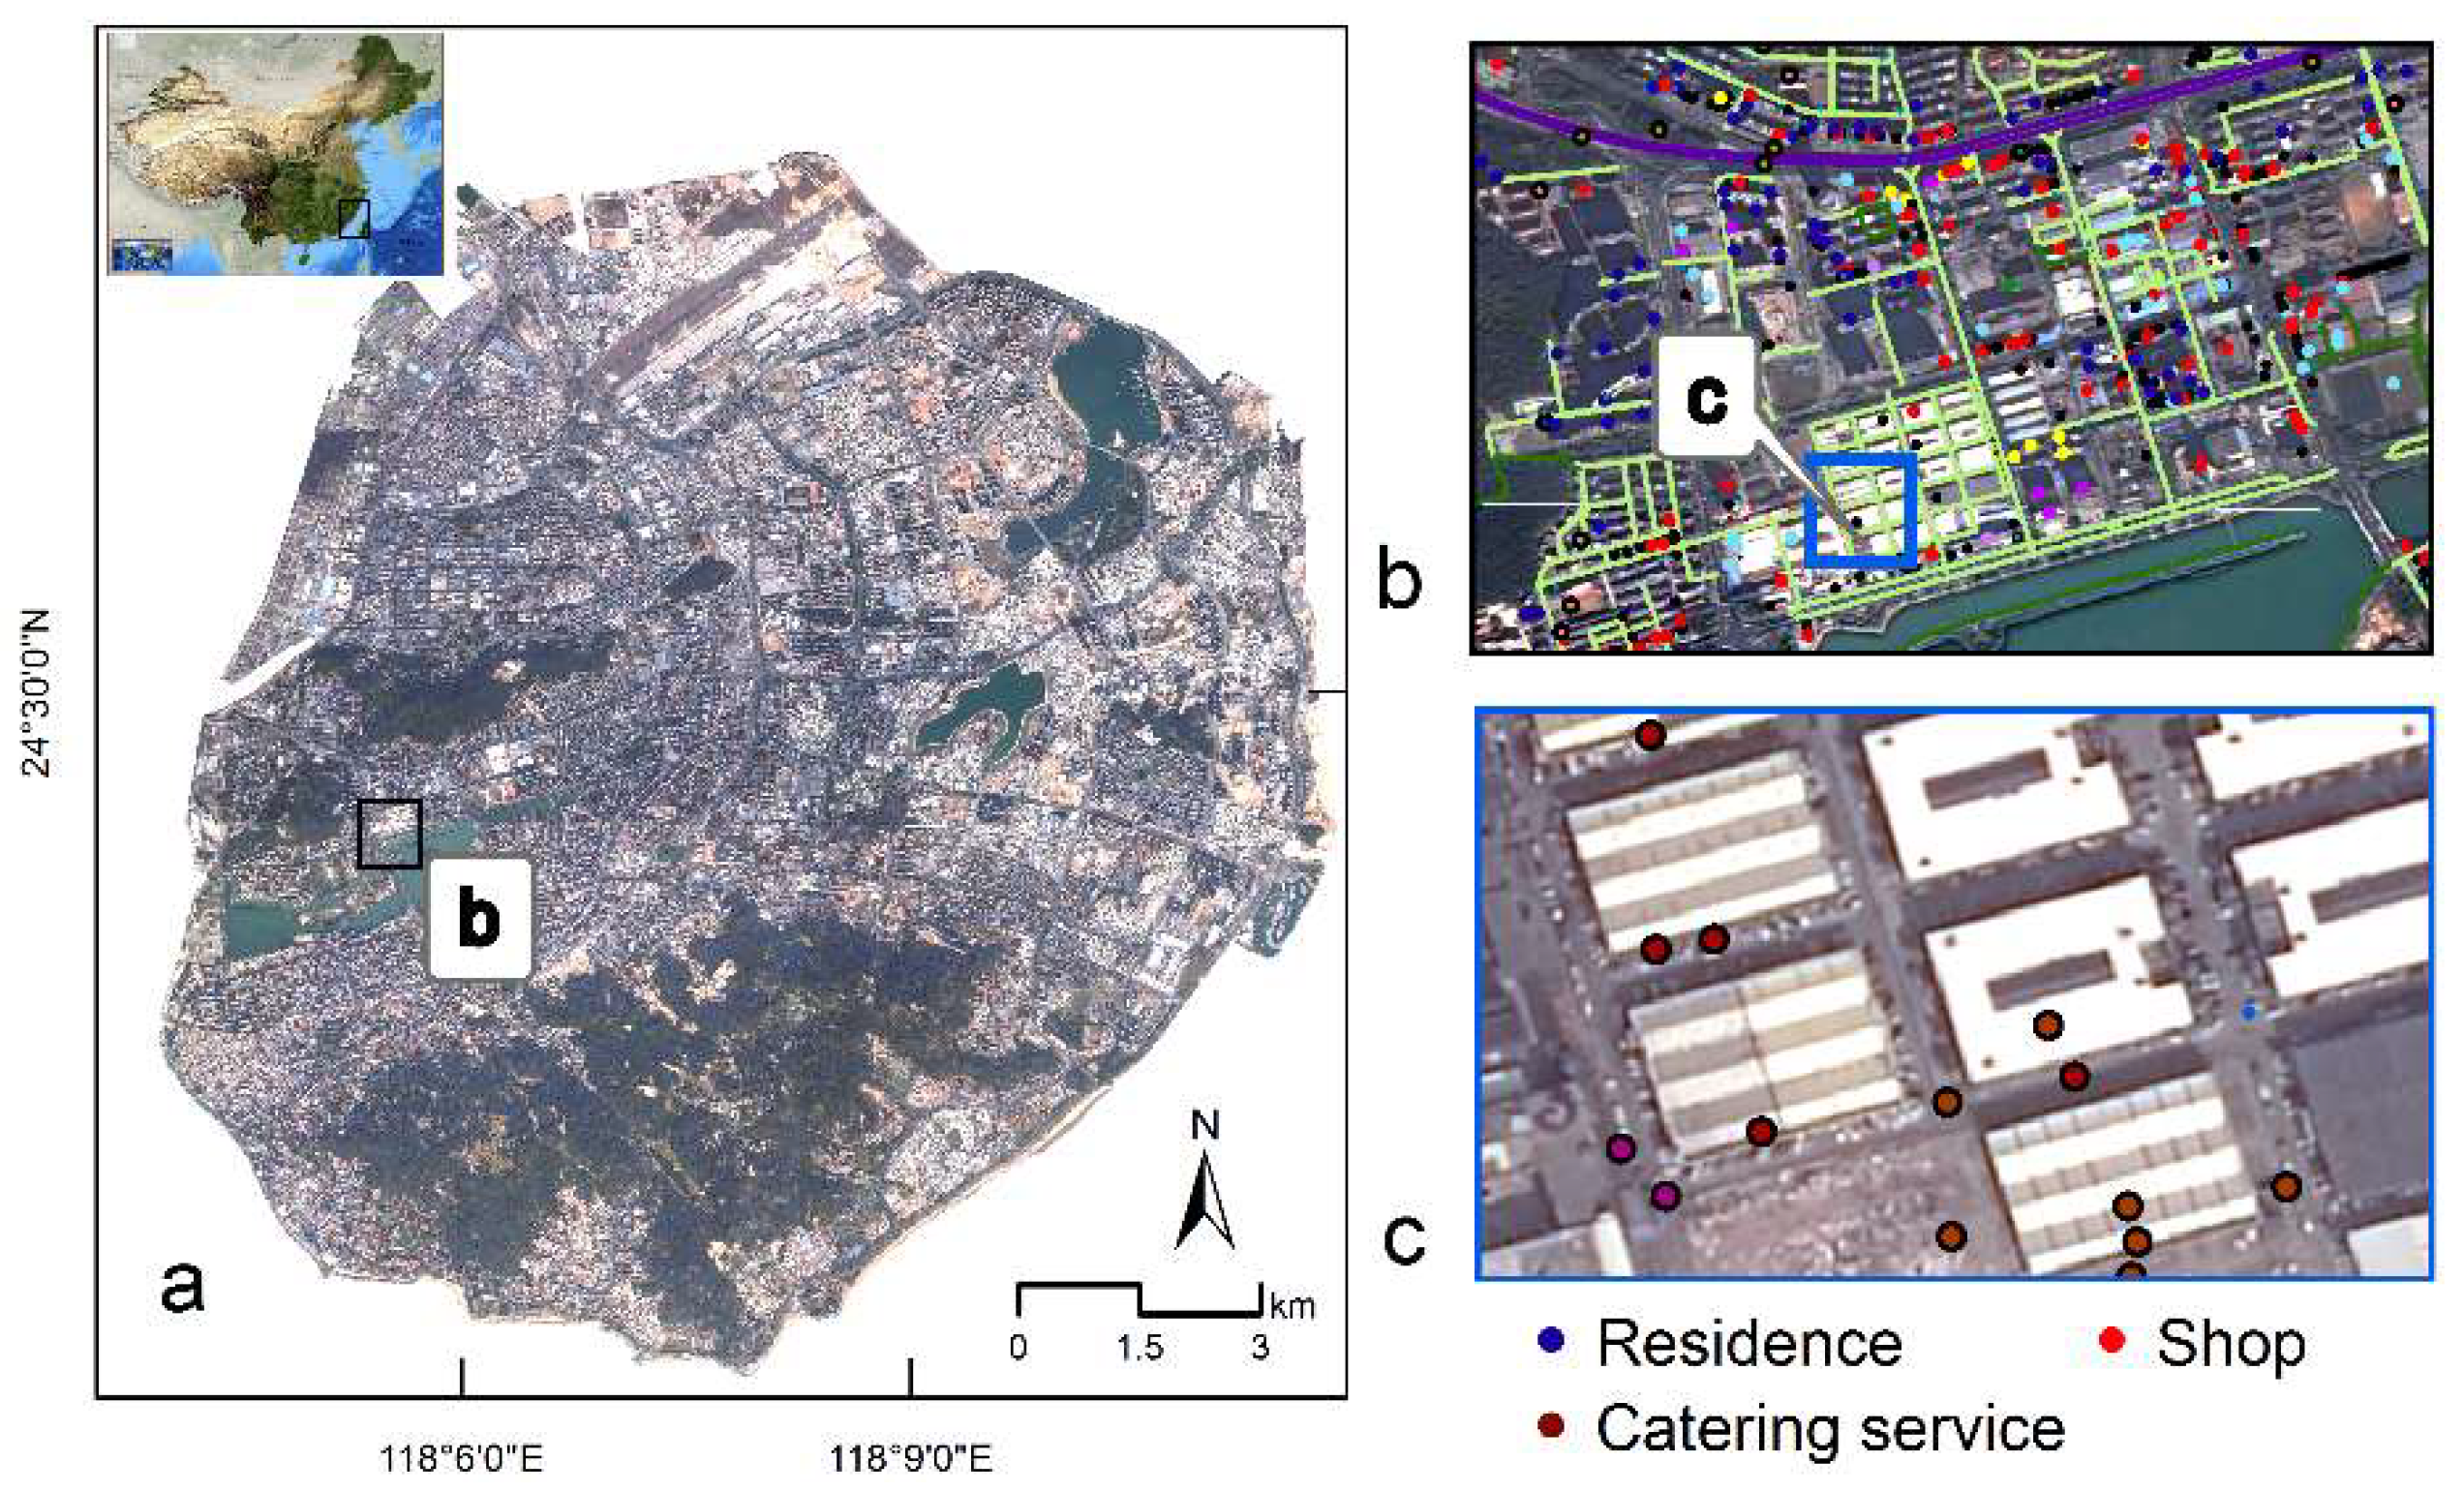
3.1. Study Area
3.2. Data Source and Preprocessing
3.2.1. GaoFen-2 Remote Sensing Imagery
3.2.2. POIs and Functional Classification
3.3.3. Data for Training and Validation
4. Results
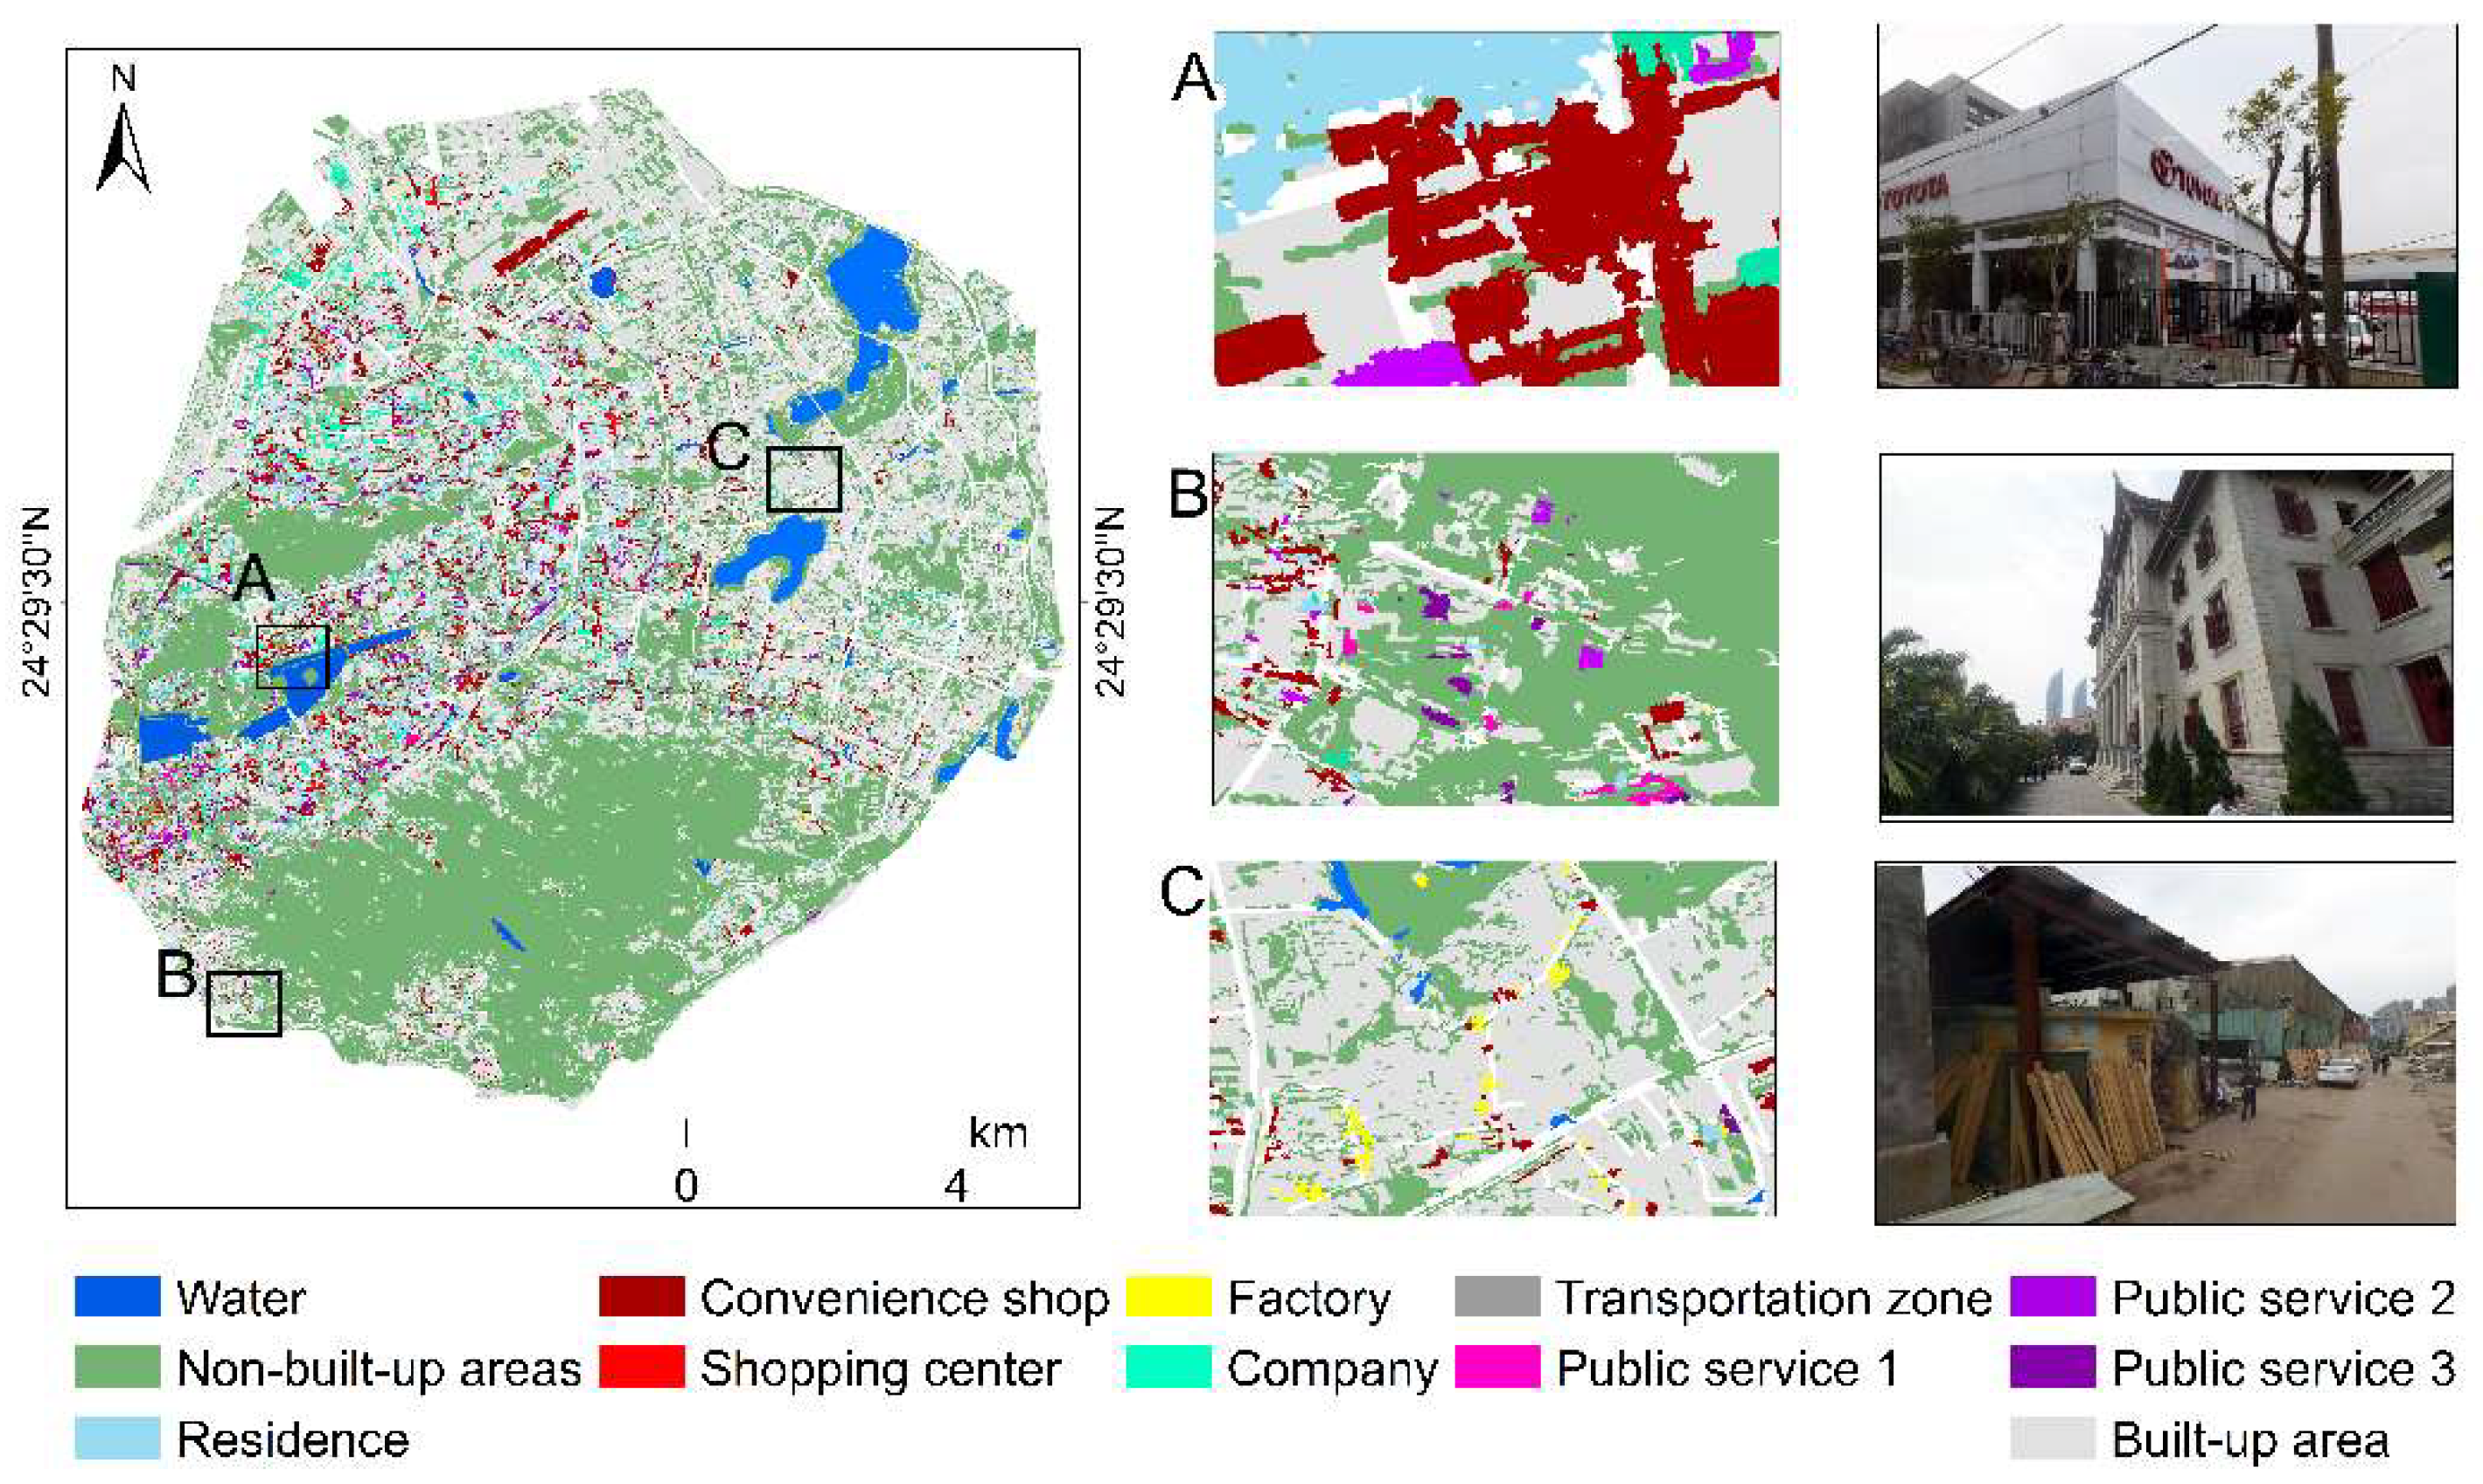
4.1. Land Cover
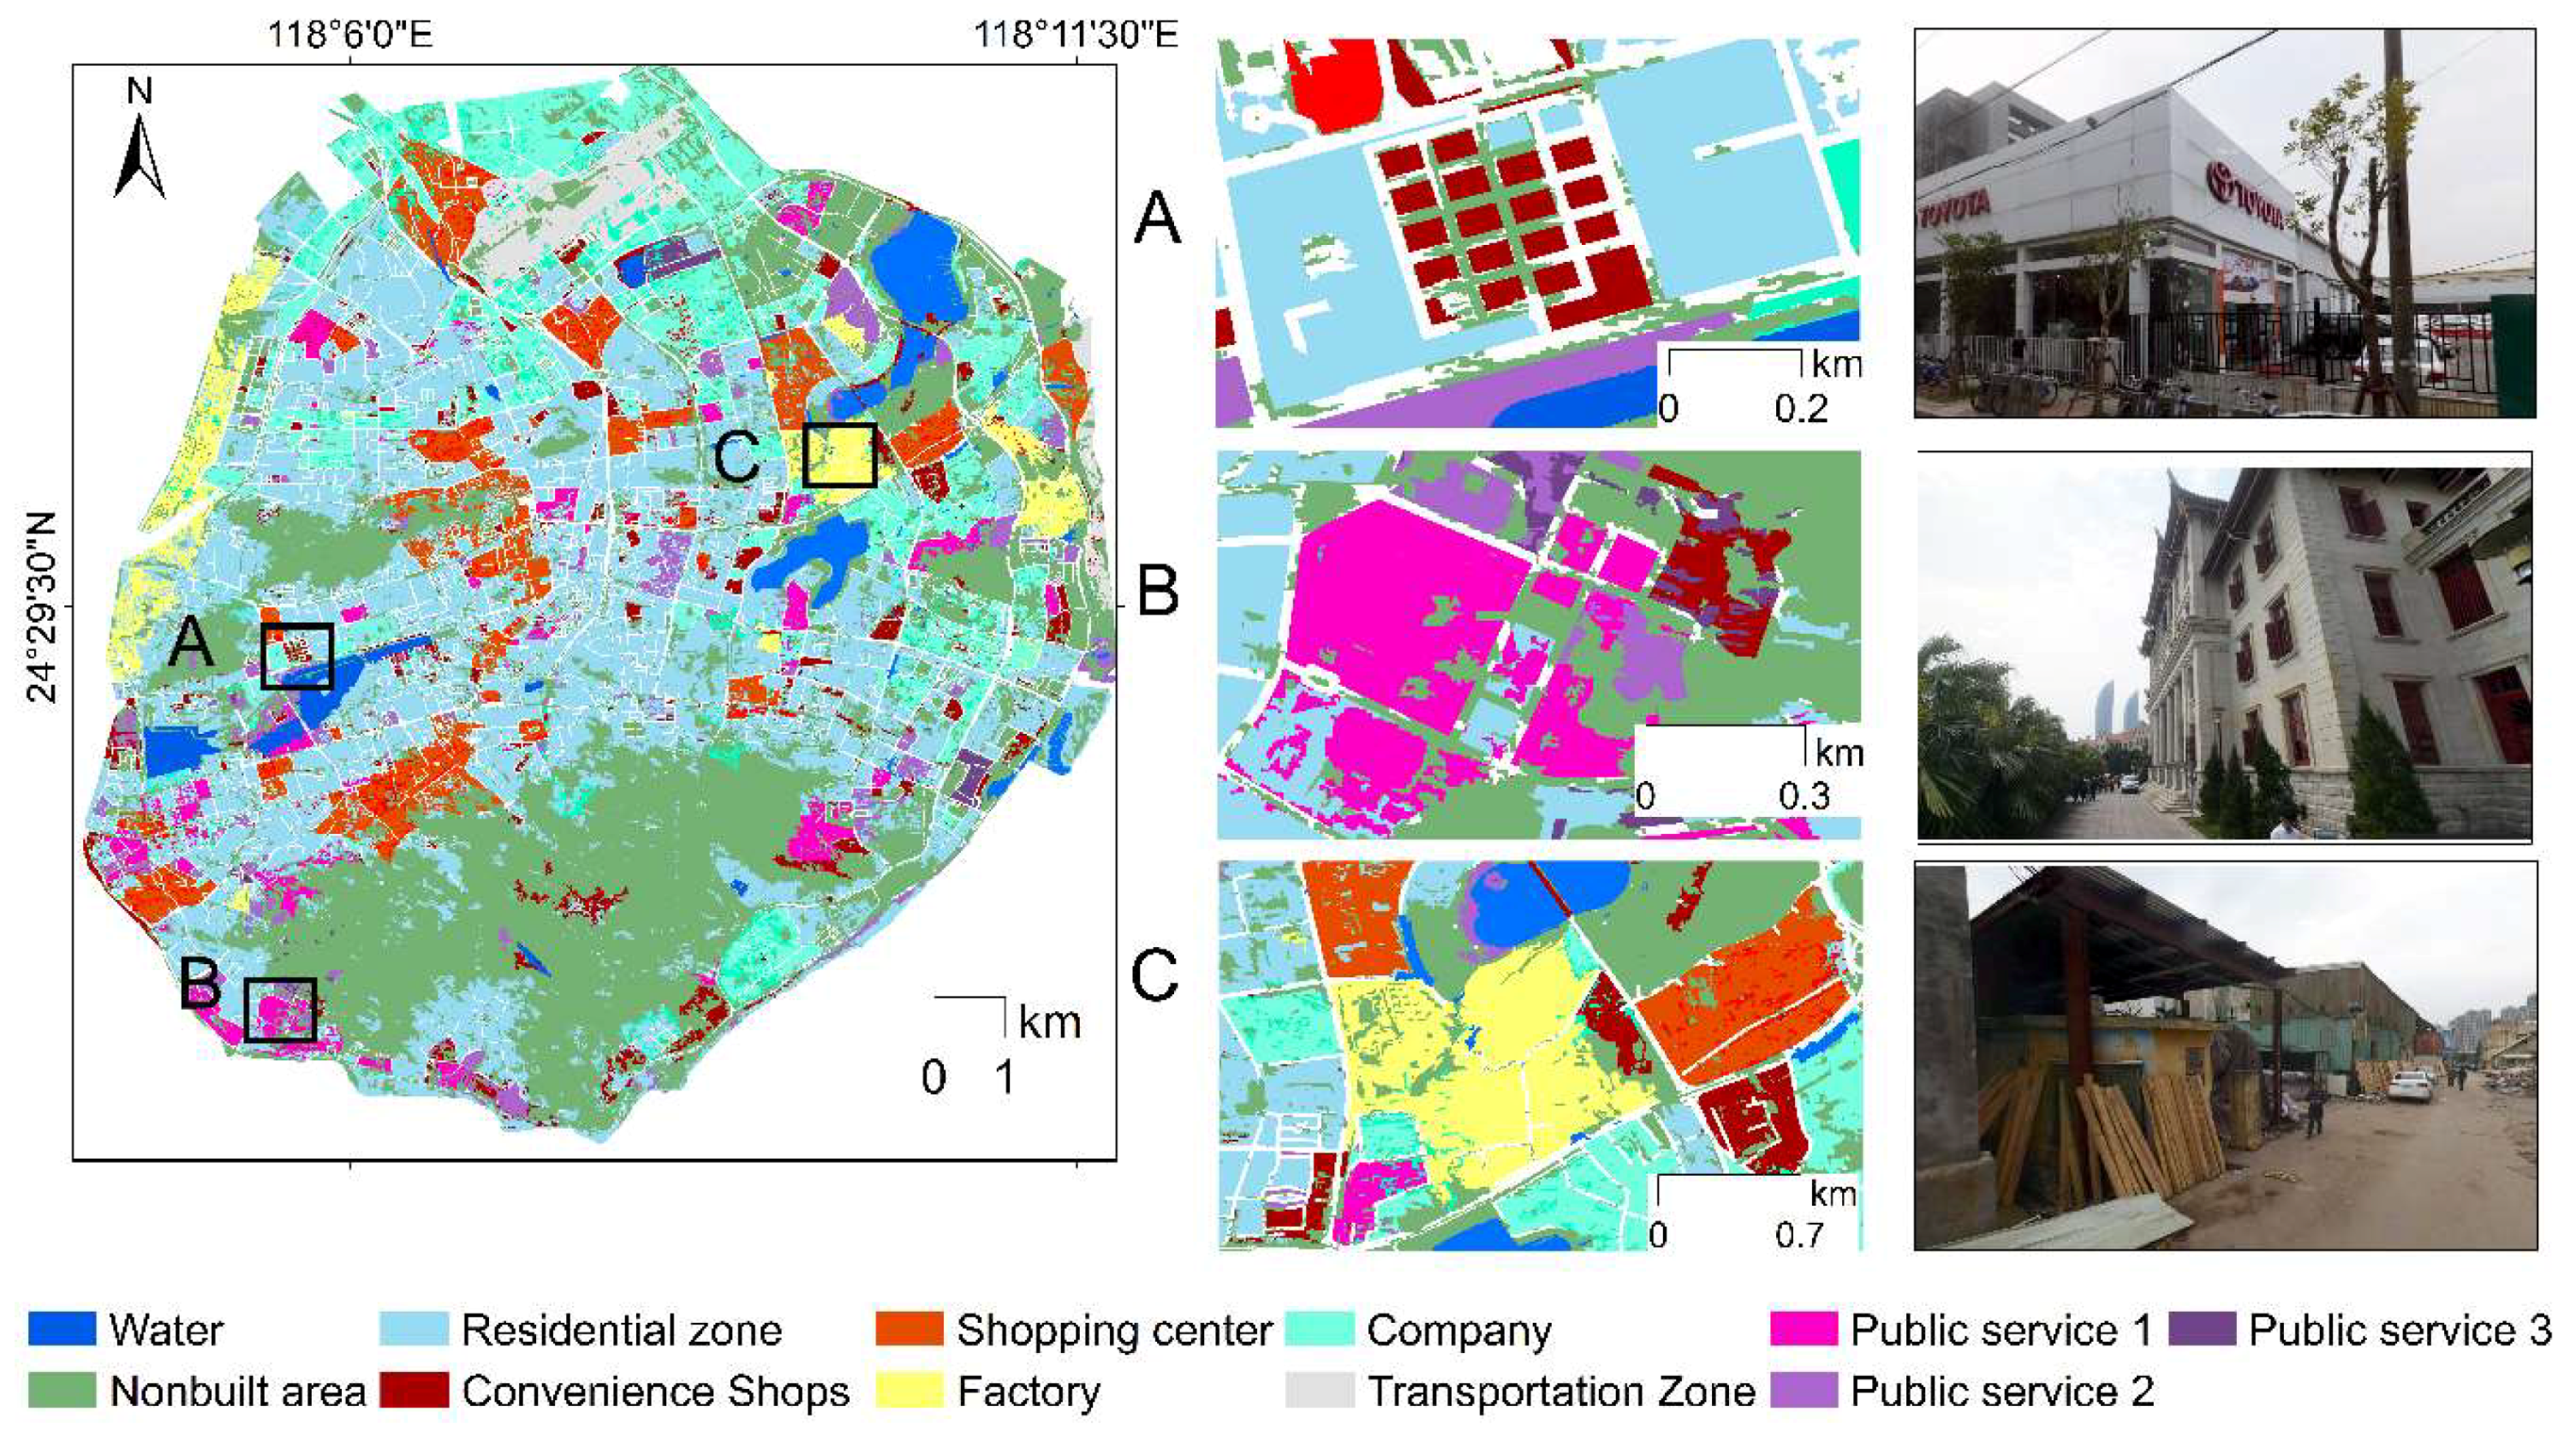
4.2. Segmentation, Functional Segmentation and Urban Functional Zones
4.3. Accuracy Assessment
4.4. The Pattern of Functional Zones
5. Discussion
5.1. Analysis of the Accuracy Measures
5.2. Other Methodological and Applied Considerations
6. Conclusions
Author Contributions
Funding
Conflicts of Interest
Code Availability
Appendix A

| Function | POI | |
|---|---|---|
| Residential zone | Commercial residence | |
| Residence community | ||
| Convenience shop zone | Restaurant | |
| Insurance company | ||
| Shopping service | ||
| Animal medical center | ||
| Life service | ||
| Car sales company | ||
| Car maintenance company | ||
| Car service | ||
| Motorcycle service | ||
| Financial insurance company | ||
| Bank | ||
| Security company | ||
| Sport service | ||
| hotel | ||
| Shopping center | Shopping mall/market | |
| factory | factory | |
| Company | Company in office building | |
| Public Service Zone | Public service 1 | Municipal government |
| University and college | ||
| Top three hospital | ||
| Public service 2 | Middle school | |
| Judicial organ | ||
| Medical care service | ||
| Second-class hospital | ||
| Social organization and government agency | ||
| Scenic zone | ||
| Public service 3 | Kindergarten | |
| Public learning service | ||
| Transportation zone | Airport | |
| Railway station | ||
| Non-built-up area | Agricultural land | |
| Water | ||
| Mountain or forest | ||
References
- Cohen, B. Urbanization in developing countries: Current trends, future projections, and key challenges for sustainability. Technol. Soc. 2006, 28, 63–80. [Google Scholar] [CrossRef]
- Mallach, A.; Haase, A.; Hattori, K. The shrinking city in comparative perspective: Contrasting dynamics and responses to urban shrinkage. Cities 2016, 69, 102–108. [Google Scholar] [CrossRef]
- Audirac, I. Shrinking cities: An unfit term for American urban policy? Cities 2017, 75, 12–19. [Google Scholar] [CrossRef]
- He, C.; Gao, B.; Huang, Q.; Ma, Q.; Dou, Y. Environmental degradation in the urban areas of China: Evidence from multi-source remote sensing data. Remote Sens. Environ. 2017, 193, 65–75. [Google Scholar] [CrossRef]
- Shin, H.B. Residential redevelopment and the entrepreneurial local state: The implications of Beijing’s shifting emphasis on urban redevelopment policies. Urban Stud. 2009, 46, 2815–2839. [Google Scholar] [CrossRef]
- Jiang, S.; Alves, A.; Rodrigues, F.; Ferreira, J.; Pereira, F.C. Mining point-of-interest data from social networks for urban land-use classification and disaggregation. Comput. Environ. Urban Syst. 2015, 53, 36–46. [Google Scholar] [CrossRef]
- Li, M.; Shen, Z.; Hao, X. Revealing the relationship between spatio-temporal distribution of population and urban function with social media data. GeoJournal 2016, 81, 919–935. [Google Scholar] [CrossRef]
- Huang, W.; Fan, H.; Qiu, Y.; Cheng, Z.; Xu, P.; Qian, Y. Causation mechanism analysis for haze pollution related to vehicle emission in Guangzhou, China by employing the fault tree approach. Chemosphere 2016, 151, 9–16. [Google Scholar] [CrossRef] [PubMed]
- Tonne, C.; Halonen, J.I.; Beevers, S.D.; Dajnak, D.; Gulliver, J.; Kelly, F.J.; Wilkinson, P.; Anderson, H.R. Long-term traffic air and noise pollution in relation to mortality and hospital readmission among myocardial infarction survivors. Int. J. Hyg. Environ. Health 2016, 219, 72–78. [Google Scholar] [CrossRef] [PubMed] [Green Version]
- Banzhaf, E.; Hofer, R. Monitoring urban structure types as spatial indicators with CIR Aerial Photographs for a more effective urban environmental management. IEEE J. Sel. Top. Appl. Earth Obs. Remote Sens. 2008, 1, 129–138. [Google Scholar] [CrossRef]
- Coulter, L.L.; Stow, D.A.; Tsai, Y.; Ibanez, N.; Shih, H.; Kerr, A.; Benza, M.; Weeks, J.R.; Mensah, F. Classification and assessment of land cover and land-use change in southern Ghana using dense stacks of Landsat 7 ETM+ imagery. Remote Sens. Environ. 2016, 184, 396–409. [Google Scholar] [CrossRef]
- Gómez, C.; White, J.C.; Wulder, M.A. Optical remotely sensed time series data for land cover classification: A review. ISPRS J. Photogramm. Remote Sens. 2016, 116, 55–72. [Google Scholar] [CrossRef]
- Pagliarella, M.C.; Sallustio, L.; Capobianco, G.; Conte, E.; Corona, P.; Fattorini, L.; Marchetti, M. From one-to two-phase sampling to reduce costs of remote sensing-based estimation of land-cover and land-use proportions and their changes. Remote Sens. Environ. 2016, 184, 410–417. [Google Scholar] [CrossRef]
- Fu, P.; Weng, Q. A time series analysis of urbanization induced land-use and land cover change and its impact on land surface temperature with Landsat imagery. Remote Sens. Environ. 2016, 175, 205–214. [Google Scholar] [CrossRef]
- Pei, T.; Sobolevsky, S.; Ratti, C.; Shaw, S.-L.; Li, T.; Zhou, C. A new insight into land-use classification based on aggregated mobile phone data. Int. J. Geogr. Inf. Sci. 2014, 28, 1988–2007. [Google Scholar] [CrossRef]
- Comber, A.J.; Brunsdon, C.F.; Farmer, C.J.Q. Community detection in spatial networks: inferring land-use from a planar graph of land cover objects. Int. J. Appl. Earth Obs. Geoinf. 2012, 18, 274–282. [Google Scholar] [CrossRef]
- Li, M.; Stein, A.; Bijker, W.; Zhan, Q. Urban land-use extraction from Very High Resolution remote sensing imagery using a Bayesian network. ISPRS J. Photogramm. Remote Sens. 2016, 122, 192–205. [Google Scholar] [CrossRef]
- Pacifici, F.; Chini, M.; Emery, W.J. A neural network approach using multi-scale textural metrics from very high-resolution panchromatic imagery for urban land-use classification. Remote Sens. Environ. 2009, 113, 1276–1292. [Google Scholar] [CrossRef]
- Voltersen, M.; Berger, C.; Hese, S.; Schmullius, C. Object-based land cover mapping and comprehensive feature calculation for an automated derivation of urban structure types at block level. Remote Sens. Environ. 2014, 154, 192–201. [Google Scholar] [CrossRef]
- Benz, U.C.; Hofmann, P.; Willhauck, G.; Lingenfelder, I.; Heynen, M. Multi-resolution, object-oriented fuzzy analysis of remote sensing data for GIS-ready information. ISPRS J. Photogramm. Remote Sens. 2004, 58, 239–258. [Google Scholar] [CrossRef] [Green Version]
- Benediktsson, J.A.; Pesaresi, M.; Arnason, K. Classification and feature extraction for remote sensing images from urban areas based on morphological transformations. IEEE Trans. Geosci. Remote Sens. 2003, 41, 1940–1949. [Google Scholar] [CrossRef] [Green Version]
- Zhi, Y.; Li, H.; Wang, D.; Deng, M.; Wang, S.; Gao, J.; Duan, Z.; Liu, Y. Latent spatio-temporal activity structures: a new approach to inferring intra-urban functional regions via social media check-in data. Geo-Spat. Inf. Sci. 2016, 19, 94–105. [Google Scholar] [CrossRef]
- Zhan, Q.; Molenaar, M.; Tempfli, K. Hierarchical image object-based structural analysis toward urban land-use classification using high-resolution imagery and airborne LIDAR data. In Proceedings of the 3rd International Conference on Remote Sensing of Urban Areas, Istanbul, Turkey, 11–13 June 2002; pp. 11–13. [Google Scholar]
- van der Kwast, J.; van de Voorde, T.; Canters, F.; Uljee, I.; van Looy, S.; Engelen, G. Inferring urban land-use using the optimised spatial reclassification kernel. Environ. Model. Softw. 2011, 26, 1279–1288. [Google Scholar] [CrossRef]
- Cheriyadat, A.M. Unsupervised Feature Learning for Aerial Scene Classification. IEEE Trans. Geosci. Remote Sens. 2014, 52, 439–451. [Google Scholar] [CrossRef]
- Chen, S.; Tian, Y. Pyramid of spatial relatons for scene-level land-use classification. IEEE Trans. Geosci. Remote Sens. 2015, 53, 1947–1957. [Google Scholar] [CrossRef]
- Zhao, B.; Zhong, Y.; Zhang, L. A spectral-structural bag-of-features scene classifier for very high spatial resolution remote sensing imagery. ISPRS J. Photogramm. Remote Sens. 2016, 116, 73–85. [Google Scholar] [CrossRef]
- Liu, X.; Long, Y. Automated identification and characterization of parcels with OpenStreetMap and points of interest. Environ. Plan. B Plan. Des. 2016, 43, 341–360. [Google Scholar] [CrossRef]
- Over, M.; Schilling, A.; Neubauer, S.; Zipf, A. Generating web-based 3D City Models from OpenStreetMap: the current situation in Germany. Comput. Environ. Urban Syst. 2010, 34, 496–507. [Google Scholar] [CrossRef]
- Fang, W.; Xiaolu, G.A.O.; Zening, X.U. Identification and classification of urban commercial districts at block scale. Geogr. Res. 2015, 34, 1125–1134. [Google Scholar]
- Louail, T.; Lenormand, M.; Ros, O.G.C.; Picornell, M.; Herranz, R.; Frias-Martinez, E.; Ramasco, J.J.; Barthelemy, M. From mobile phone data to the spatial structure of cities. Sci. Rep. 2014, 4, 5276. [Google Scholar] [CrossRef] [PubMed] [Green Version]
- Kang, C.; Gao, S.; Lin, X.; Xiao, Y.; Yuan, Y.; Liu, Y.; Ma, X. Analyzing and geo-visualizing individual human mobility patterns using mobile call records. In Proceedings of the 2010 18th International Conference on Geoinformatics, Beijing, China, 18–20 June 2010; pp. 1–7. [Google Scholar]
- Lee, R.; Wakamiya, S.; Sumiya, K. Discovery of unusual regional social activities using geo-tagged microblogs. World Wide Web 2011, 14, 321–349. [Google Scholar] [CrossRef]
- Yuan, J.; Zheng, Y.; Xie, X. Discovering regions of different functions in a city using human mobility and POIs. In Proceedings of the 18th ACM SIGKDD International Conference on Knowledge Discovery and Data Mining, Beijing, China, 12–16 August 2012; pp. 186–194. [Google Scholar] [CrossRef]
- Yuan, N.J.; Zheng, Y.; Xie, X.; Wang, Y.; Zheng, K.; Xiong, H. Discovering urban functional zones using latent activity trajectories. IEEE Trans. Knowl. Data Eng. 2015, 27, 712–725. [Google Scholar] [CrossRef]
- Long, Y.; Thill, J.C. Combining smart card data and household travel survey to analyze jobs-housing relationships in Beijing. Comput. Environ. Urban Syst. 2015, 53, 19–35. [Google Scholar] [CrossRef]
- Liu, X.; He, J.; Yao, Y.; Zhang, J.; Liang, H.; Wang, H.; Hong, Y. Classifying urban land-use by integrating remote sensing and social media data. Int. J. Geogr. Inf. Sci. 2017, 31, 1675–1696. [Google Scholar] [CrossRef]
- Yao, Y.; Li, X.; Liu, X.; Liu, P.; Liang, Z.; Zhang, J.; Mai, K. Sensing spatial distribution of urban land-use by integrating points-of-interest and Google Word2Vec model. Int. J. Geogr. Inf. Sci. 2017, 31, 825–848. [Google Scholar] [CrossRef]
- Hu, T.; Yang, J.; Li, X.; Gong, P. Mapping urban land-use by using landsat images and open social data. Remote Sens. 2016, 8, 151. [Google Scholar] [CrossRef]
- Zhang, Y.; Li, Q.; Huang, H.; Wu, W.; Du, X.; Wang, H. The combined use of remote sensing and social sensing data in fine-grained urban land use mapping: A case study in Beijing, China. Remote Sens. 2017, 9, 865. [Google Scholar] [CrossRef]
- Li, X.; Lin, T.; Zhang, G.; Xiao, L.; Zhao, Q.; Cui, S. Dynamic analysis of urban spatial expansion and its determinants in Xiamen Island. J. Geogr. Sci. 2011, 21, 503–520. [Google Scholar] [CrossRef]
- Shen, G.; Xu, B.; Jin, Y.; Chen, S.; Zhang, W.; Guo, J.; Liu, H.; Zhang, Y.; Yang, X. Monitoring wind farms occupying grasslands based on remote-sensing data from China’s GF-2 HD satellite—A case study of Jiuquan city, Gansu province, China. Resour. Conserv. Recycl. 2017, 121, 128–136. [Google Scholar] [CrossRef]
- Samardžić-Petrović, M.; Dragićević, S.; Kovačević, M.; Bajat, B. Modeling urban land use changes using support vector machines. Trans. GIS 2016, 20, 718–734. [Google Scholar] [CrossRef]
- Baatz, M.; Schäpe, A. Multiresolution segmentation: an optimization approach for high quality multi-scale image segmentation. J. Photogramm. Remote Sens. 2000, 58, 12–23. [Google Scholar]
- Yu, W.; Zhou, W.; Qian, Y.; Yan, J. A new approach for land cover classification and change analysis: Integrating backdating and an object-based method. Remote Sens. Environ. 2016, 177, 37–47. [Google Scholar] [CrossRef] [Green Version]
- Zhou, W.; Troy, A. An object-oriented approach for analysing and characterizing urban landscape at the parcel level. Int. J. Remote Sens. 2008, 29, 3119–3135. [Google Scholar] [CrossRef]
- Musa, H.D.; Yacob, M.R.; Abdullah, A.M.; Ishak, M.Y. Delphi method of developing environmental well-being indicators for the evaluation of urban sustainability in Malaysia. Procedia Environ. Sci. 2015, 30, 244–249. [Google Scholar] [CrossRef]
- Taleai, M.; Mansourian, A. Using Delphi-AHP method to survey major factors causing urban plan implementation failure. J. Appl. Sci. 2008, 8, 2746–2751. [Google Scholar] [CrossRef]
- Le Pira, M.; Inturri, G.; Ignaccolo, M.; Pluchino, A. Modelling consensus building in Delphi practices for participated transport planning. Transp. Res. Procedia 2015, 25, 3729–3739. [Google Scholar] [CrossRef]
- Linstone, H.A.; Turoff, M. Delphi: A brief look backward and forward. Technol. Forecast. Soc. Chang. 2011, 78, 1712–1719. [Google Scholar] [CrossRef]
- Baraldi, A.; Bruzzone, L.; Blonda, P. Quality assessment of classification and cluster maps without ground truth knowledge. IEEE Trans. Geosci. Remote Sens 2005, 43, 857–873. [Google Scholar] [CrossRef]
- Whiteside, T.G.; Boggs, G.S.; Maier, S.W. Comparing object-based and pixel-based classifications for mapping savannas. Int. J. Appl. Earth Obs. Geoinf. 2011, 13, 884–893. [Google Scholar] [CrossRef]
- Mesev, V. Fusion of point-based postal data with IKONOS imagery. Inf. Fusion 2007, 8, 157–167. [Google Scholar] [CrossRef]
- Sohn, G.; Dowman, I. Data fusion of high-resolution satellite imagery and LiDAR data for automatic building extraction. ISPRS J. Photogramm. Remote Sens. 2007, 62, 43–63. [Google Scholar] [CrossRef]


| Indicators | Previous Judgment | First Round | Second Round | Result of Priority |
|---|---|---|---|---|
| Transportation Zone | 2 | 2 | 1 | 1 |
| Shopping Center | 1 | 1 | 2 | 2 |
| Public Service Zone 1 | 3 | 4 | 3 | 3 |
| Residence | 5 | 3 | 4 | 4 |
| Factory | 6 | 5 | 6 | 5 |
| Company | 4 | 6 | 5 | 6 |
| Public Service Zone 2 | 7 | 7 | 7 | 7 |
| Public Service Zone 3 | 8 | 8 | 8 | 8 |
| Convenience Shop | 9 | 9 | 9 | 9 |
| Indicators | Previous Judgment | First Round | Second Round | Result of Score |
|---|---|---|---|---|
| Transportation Zone | 1 | 1 | 1 | 1 |
| Shopping Center | 1 | 1 | 1 | 1 |
| Public Service Zone 1 | 0.3 | 0.62 | 0.4 | 0.55 |
| Residence | 0.2 | 0.2 | 0.43 | 0.34 |
| Factory | 0.1 | 0.05 | 0.1 | 0.06 |
| Company | 0.1 | 0.04 | 0.02 | 0.024 |
| Public Service Zone 2 | 0.15 | 0.01 | 0.03 | 0.015 |
| Public Service Zone 3 | 0.1 | 0.02 | 0.01 | 0.01 |
| Convenience Shop | 0.05 | 0.06 | 0.01 | 0.001 |
| Classified Data | Reference Data | |||||||||
|---|---|---|---|---|---|---|---|---|---|---|
| Residence | Convenience Shops | Shopping Center | Factory | Company | Transportation | PS1 | PS2 | PS3 | UA | |
| Residence | 218 | 87 | 1 | 14 | 9 | 0 | 0 | 2 | 16 | 63% |
| Convenience shops | 5 | 100 | 0 | 0 | 2 | 0 | 1 | 4 | 25 | 73% |
| Shopping center | 12 | 0 | 36 | 0 | 3 | 0 | 0 | 0 | 0 | 71% |
| Factory | 2 | 0 | 0 | 180 | 0 | 0 | 0 | 6 | 7 | 92% |
| Company | 7 | 0 | 0 | 0 | 80 | 1 | 2 | 7 | 3 | 80% |
| Transportation | 0 | 0 | 2 | 0 | 0 | 18 | 0 | 0 | 0 | 90% |
| PS1 | 0 | 0 | 0 | 0 | 1 | 2 | 45 | 0 | 4 | 87% |
| PS2 | 2 | 4 | 2 | 0 | 1 | 0 | 2 | 97 | 0 | 89% |
| PS3 | 5 | 9 | 1 | 0 | 0 | 0 | 0 | 2 | 141 | 89% |
| Total | 255 | 200 | 40 | 50 | 100 | 20 | 50 | 120 | 200 | |
| PA | 87% | 50% | 85% | 93% | 83% | 86% | 90% | 82% | 72% | |
| Functional Zone | Area (km2) | Proportion |
|---|---|---|
| Residence | 27.5 | 36.1% |
| Convenience shops | 5.2 | 6.8% |
| Shopping center | 9.74 | 12.8% |
| Factory | 4.1 | 5.3% |
| Company | 15.6 | 20.5% |
| Transportation | 1.9 | 2.5% |
| Public Service | 12.1 | 15.9% |
© 2018 by the authors. Licensee MDPI, Basel, Switzerland. This article is an open access article distributed under the terms and conditions of the Creative Commons Attribution (CC BY) license (http://creativecommons.org/licenses/by/4.0/).
Share and Cite
Song, J.; Lin, T.; Li, X.; Prishchepov, A.V. Mapping Urban Functional Zones by Integrating Very High Spatial Resolution Remote Sensing Imagery and Points of Interest: A Case Study of Xiamen, China. Remote Sens. 2018, 10, 1737. https://0-doi-org.brum.beds.ac.uk/10.3390/rs10111737
Song J, Lin T, Li X, Prishchepov AV. Mapping Urban Functional Zones by Integrating Very High Spatial Resolution Remote Sensing Imagery and Points of Interest: A Case Study of Xiamen, China. Remote Sensing. 2018; 10(11):1737. https://0-doi-org.brum.beds.ac.uk/10.3390/rs10111737
Chicago/Turabian StyleSong, Jinchao, Tao Lin, Xinhu Li, and Alexander V. Prishchepov. 2018. "Mapping Urban Functional Zones by Integrating Very High Spatial Resolution Remote Sensing Imagery and Points of Interest: A Case Study of Xiamen, China" Remote Sensing 10, no. 11: 1737. https://0-doi-org.brum.beds.ac.uk/10.3390/rs10111737