Building Extraction in Very High Resolution Imagery by Dense-Attention Networks
by
 , and
, and
Hui Yang
1,2, 
Penghai Wu
2,3,4,*,
Xuedong Yao
2,
Yanlan Wu
2,3,4,*,
Biao Wang
2,4 and
Yongyang Xu
5 1
School of Resource and Environmental Science, Wuhan University, Wuhan 430079, China
2
School of Resources and Environmental Engineering, Anhui University, Hefei 230601, China
3
Institute of Physical Science and Information Technology, Anhui University, Hefei 230601, China
4
Anhui Engineering Research Center for Geographical Information Intelligent Technology, Hefei 230601, China
5
Department of Information Engineering, China University of Geosciences, Wuhan 430074, China
*
Authors to whom correspondence should be addressed.
Remote Sens. 2018, 10(11), 1768; https://0-doi-org.brum.beds.ac.uk/10.3390/rs10111768
Submission received: 6 September 2018
/
Revised: 4 November 2018
/
Accepted: 6 November 2018
/
Published: 8 November 2018
(This article belongs to the Special Issue Remote Sensing based Building Extraction)
Abstract
:Building extraction from very high resolution (VHR) imagery plays an important role in urban planning, disaster management, navigation, updating geographic databases, and several other geospatial applications. Compared with the traditional building extraction approaches, deep learning networks have recently shown outstanding performance in this task by using both high-level and low-level feature maps. However, it is difficult to utilize different level features rationally with the present deep learning networks. To tackle this problem, a novel network based on DenseNets and the attention mechanism was proposed, called the dense-attention network (DAN). The DAN contains an encoder part and a decoder part which are separately composed of lightweight DenseNets and a spatial attention fusion module. The proposed encoder–decoder architecture can strengthen feature propagation and effectively bring higher-level feature information to suppress the low-level feature and noises. Experimental results based on public international society for photogrammetry and remote sensing (ISPRS) datasets with only red–green–blue (RGB) images demonstrated that the proposed DAN achieved a higher score (96.16% overall accuracy (OA), 92.56% F1 score, 90.56% mean intersection over union (MIOU), less training and response time and higher-quality value) when compared with other deep learning methods.
1. Introduction
Extracting 2D (two-dimensional) buildings footprints in very high resolution (VHR) imagery has many applications in navigation, urban planning, disaster management, and population estimation [1]. However, many complicated factors such as various scales, complex background (shadow, vegetation, water, and man-made non-building features), heterogeneity of roof, and rich topological appearances [2] make 2D building extraction from VHR images quite a challenging task.
Over the past decade, some methods have tried to extract buildings through VHR imagery, which applied different strategies such as new frameworks [3], new parameters [4], new indices [5], other related information [6], and some hybrid algorithms [7]. Based on the used data, building extraction methods can generally be divided into three categories: 2D (two-dimensional) information based, fused 2D–3D information based and 3D information based [8,9,10]. 2D information is mainly derived from images, including aerial images and space-borne images, while 3D information is mainly derived from airborne laser scanning technology, such as light detection and ranging (LiDAR) data [11,12,13]. To extract buildings from 2D information or/and 3D information, some feature extraction technologies have been developed, such as the handcrafted features-based traditional technologies and deep learning-based technologies. The traditional technologies use handcrafted features as a key feature for building extraction, which may contain spectral information or/and spatial information or/and geometrical information [14]. The performance of these technologies relies on the extraction of low-level hand-engineered local features. This limits the representative ability and restricts their performance. Therefore, the extraction of more representative high-level features is desirable, which plays a dominant role in building extraction. The deep learning technologies, as a new framework, have the ability to learn high-level hierarchical features from both 2D/3D information corresponding to the different levels of abstraction, making it dominant in the field of building extraction [15,16]. For extracting buildings, some promising convolutional neural network (CNN) approaches [17,18,19] and fully convolutional network (FCN) approaches [20,21] have been proposed. However, CNN and FCN only use high-level feature maps to perform pixel-classification; low-level feature maps with rich detailed information are discarded. As a result, CNN and FCN have very limited capacity to deal with small and complex buildings. In order to address this issue, reusing low-level feature maps has become a popular solution as these maps possess rich spatial information and fine-grained details. Some supervised semantic segmentation procedures based on excellent networks such as U-Net [22], DeconvNet [20], Segnet [23], and RefineNet [24] have also appeared.
Recently, an interesting network, called the Dense Networks (DenseNets), has been very popular, which was awarded the best paper in the IEEE conference on computer vision and pattern recognition (CVPR) 2017 [25]. The DenseNets are built from dense blocks and pooling operations, where each dense block is an iterative concatenation of previous feature maps. Several compelling advantages have been proven: they alleviate the vanishing-gradient problem, strengthen feature propagation, encourage feature reuse, and substantially reduce the number of parameters. Therefore, the advantages of DenseNets make them a very good fit for semantic segmentation as they naturally induce skip connections and multi-scale supervision. DenseNets are extended to fully convolutional DenseNets (FC-DenseNets) for semantic segmentation [26], which can improve the state-of-the-art performance in challenging urban scene understanding datasets, without additional post-processing, pretraining, or including temporal information. For instance, Li et al. extended the FC-DenseNets called multiple-feature reuse network (MFRN) to extract buildings from remote sensing data with a high accuracy [27].
However, over-using low-level features may introduce redundant information into the network and result in over-segmentation when the model tends to receive more information from lower layers [28]. How to rationally utilize different level feature remains an open research question. In this study, a novel network was proposed to effectively utilize both high-/low-level feature maps, based on DenseNets and an attention mechanism, called the dense-attention network (DAN). The visual attention refers to the fact that when human vision deals with images, people tend to select the most pertinent piece of information rather than using all available information. The nature of the attention mechanism is to pick the information that contributes a lot to the target from the source. The attention mechanism usually uses the higher-level semantic information to re-weight the low-level information to suppress the background and noises [29]. In the DAN, a spatial attention fusion module was designed to enhance useful low-level feature information and remove noise to avoid over-using low-level features. Therefore, when building multi-scale features in the skip-connection operations, higher-level feature information was used to suppress the low-level features and noises.
2. Related Works
2.1. Semantic Segmentation of Remote-Sensing Images
In essence, semantic segmentation algorithms assign a label to every pixel in an image. Semantic segmentation is the term more commonly used in computer vision and is becoming increasingly used in remote sensing. Semantic segmentation of remote-sensing images has numerous applications, such as land-cover classification, urban planning, natural hazard detection, and environment monitoring [30]. Building extraction from remote-sensing images is essentially a problem of segmenting semantic objects. Compared with ordinary digital images, remote-sensing images, especially very high resolution, have different characteristics, which bring challenges for semantic segmentation purposes, such as complex backgrounds, intricate spatial details and limited spectral resolution. Hence, an effective feature representation and mining is a matter of great importance to a semantic segmentation system for very high resolution remote-sensing images.
There has been a vast literature focusing on segmenting remotely sensed images into desired objects. Traditional methods, such as watershed, mean shift, clustering method, active contours, and Markov random field model, have been widely used to produce segments for remotely sensed images [31]. One of the common drawbacks is that their performance heavily relies on handcrafted feature selection, which is hard to optimize. More recently, deep learning approaches have achieved great success in semantic segmentation on both remotely sensed images and other images [31]. State-of-the-art approaches for semantic image segmentation are built on convolutional networks [27,31]. The convolution network is usually a pre-trained deep convolutional neural network (DCNN) designed to classify images from, VGG-16 [32], ResNet [33], Deeplab-V3 [34] and DenseNet [25]. For each network, features at different levels need to be extracted and jointly combined to fulfill the segmentation task. High-level and abstract features are more suitable for the semantic segmentation of large and confused objects, while small objects benefit from low-level and raw features. Basically, successful networks should have the ability to integrate low- and high-level features for semantic segmentation.
2.2. Attention Mechanism
An attention mechanism is an effective tool to extract the most useful information of the input signal [35]. An attention mechanism is achieved by using the filter function (e.g., a softmax or sigmoid) and sequential techniques. The attention mechanism has recently been widely used in image captioning [36,37], image classification [34] and visual question answering [38,39], image recognition [40], and other fields [41,42]. In these applications, they used the filter function to activate the gathered top information to weight the activations channel-wisely or spatially and introduce feedback connections. For example, Wang et al. used a soft mask structure to generate attention-aware features [33], where attention-awareness is to use image segmentation to capture the visual attention focus area. Hu et al. designed a squeeze-and-excitation block to recalibrate channel-wise features [43]. Wang et al. built an entropy control module to select low-feature maps for semantic segmentation [28]. Li et al. introduced a global attention upsample module to guide the integration low- and high-level features in semantic segmentation [44]. Studies have shown the attention mechanism can strengthen some neurons that featured by the target, and improve their performance. Therefore, when designing networks of the building extraction of remote-sensing images, an attention mechanism module was built to integrate low- and high-level features for semantic segmentation, and avoid over-using low-level features.
3. Methods
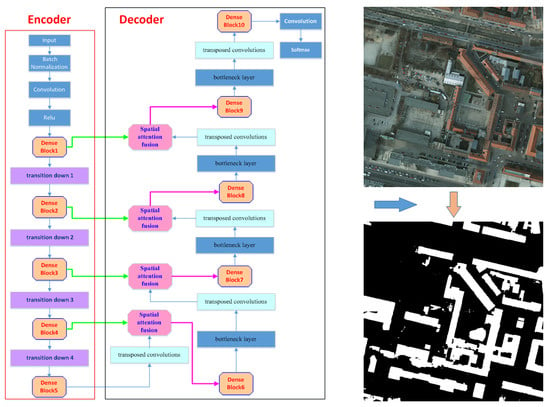
The encoder–decoder architecture [22,23,24,45,46] is widely used in semantic segmentation based on deep learning. The encoder part is mainly used to extract multi-scale features of the input data. The decoder part aims to recovers the spatial resolution of feature maps and to extract target objects using these feature maps. Inspired by the architecture, building the semantic segmentation model (named DAN) proposed in this paper also adopted an encoder–decoder architecture, and its overall architecture is shown in Figure 1. In the encoder part, lightweight DenseNets are used to extract the feature maps from inputs; while in the decoder part, a spatial attention fusion module is used to guide the low-feature maps to help high-level features recover the detail of images.
3.1. Lightweight DenseNets
DenseNets have a high demand for graphics processing unit (GPU) memory [47]. In order to reduce the GPU memory consumption, a lightweight DenseNets was designed. In DenseNets, to encourage the reuse of features and facilitate gradient propagation, there is a direct connection between any two layers. In other words, the feature maps of all preceding layers will be directly passed to all the behind layers as the input of the layer. Suppose the transformation function of L layer is HL(.) and the output is XL, the transformation of each layer of DenseNets is as shown in Equation (1):
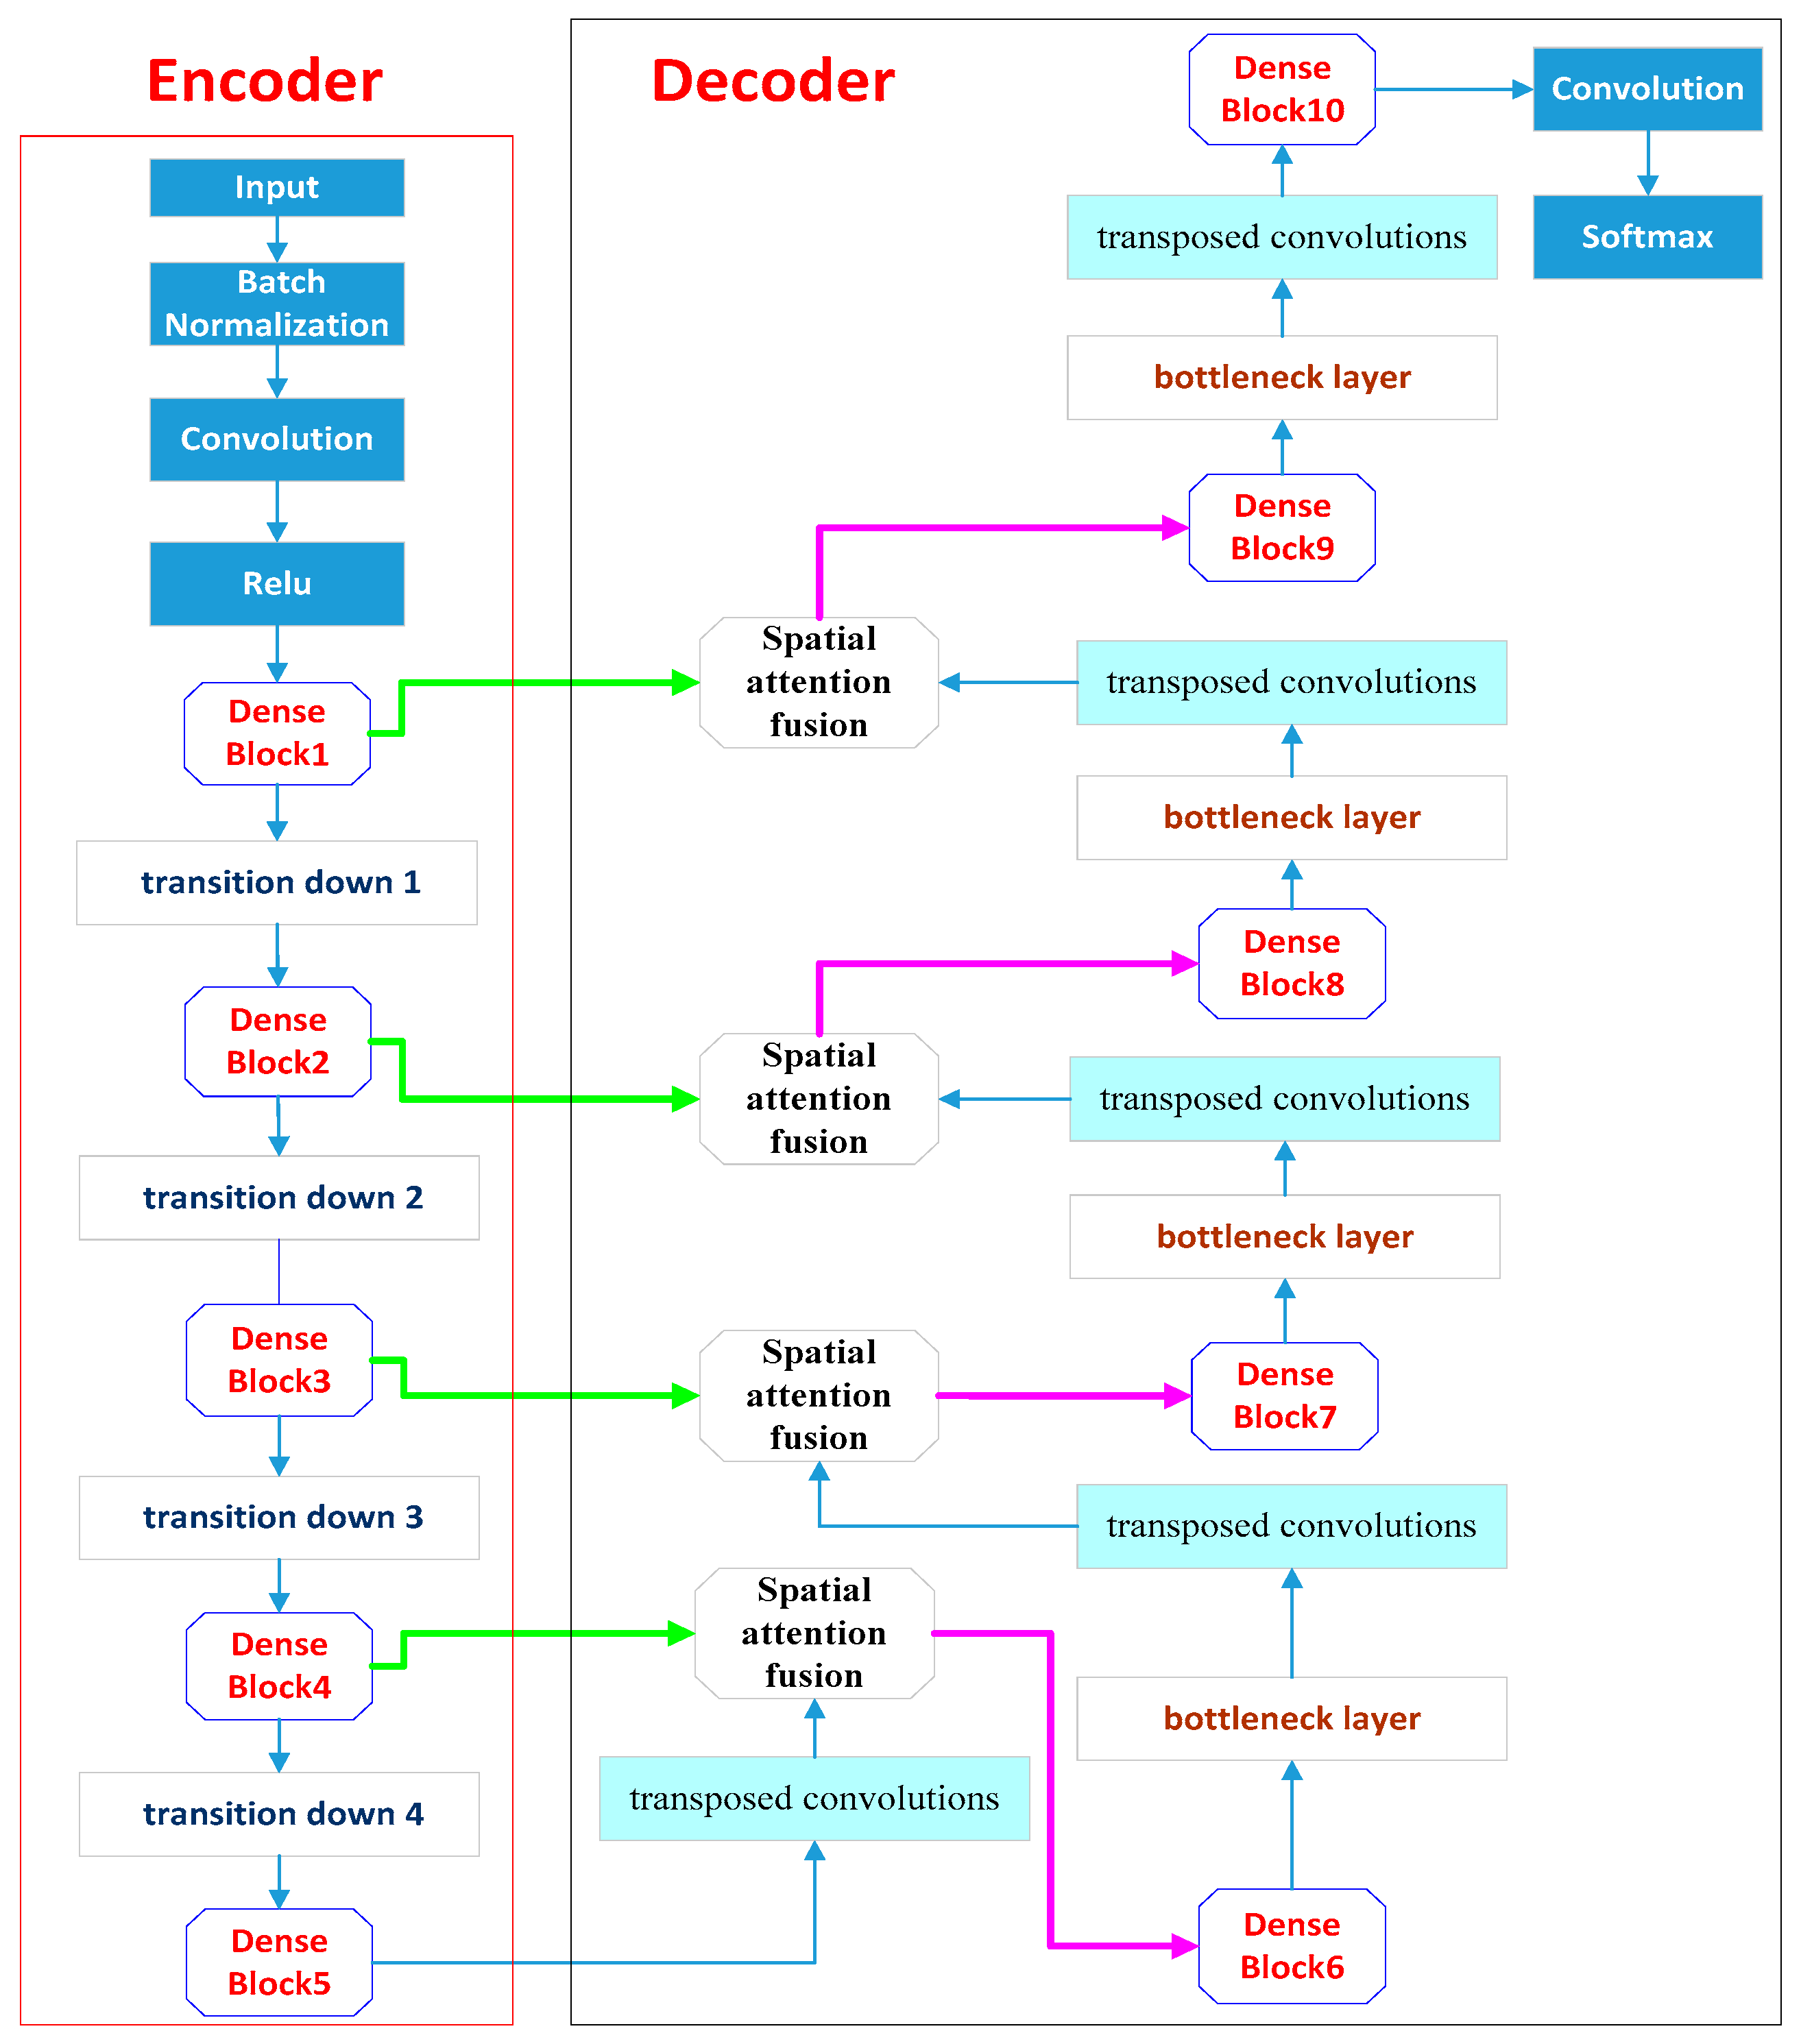
where HL(.) is a combination of three operations: Batch Normalization–ReLU–Convolution (3 × 3). […] is the concatenation of the feature maps, and the output dimension of HL(.) is K. K is called the growth rate, which controls the number of channels of the feature map of the networks. These layers with the same spatial resolution are called dense blocks. The transition down is located between dense blocks, which is used for down-sampling. It consists of a 1 × 1 convolutional layer followed by a dropout layer and a 2 × 2 average pooling layer. The dense block is an iterative concatenation of a previous feature map. Therefore, the lightweight DenseNets architecture was built from one input convolution layer, five dense blocks, and four transition downs. Figure 2 shows the lightweight DenseNets architecture.
3.2. Spatial Attention Fusion Module
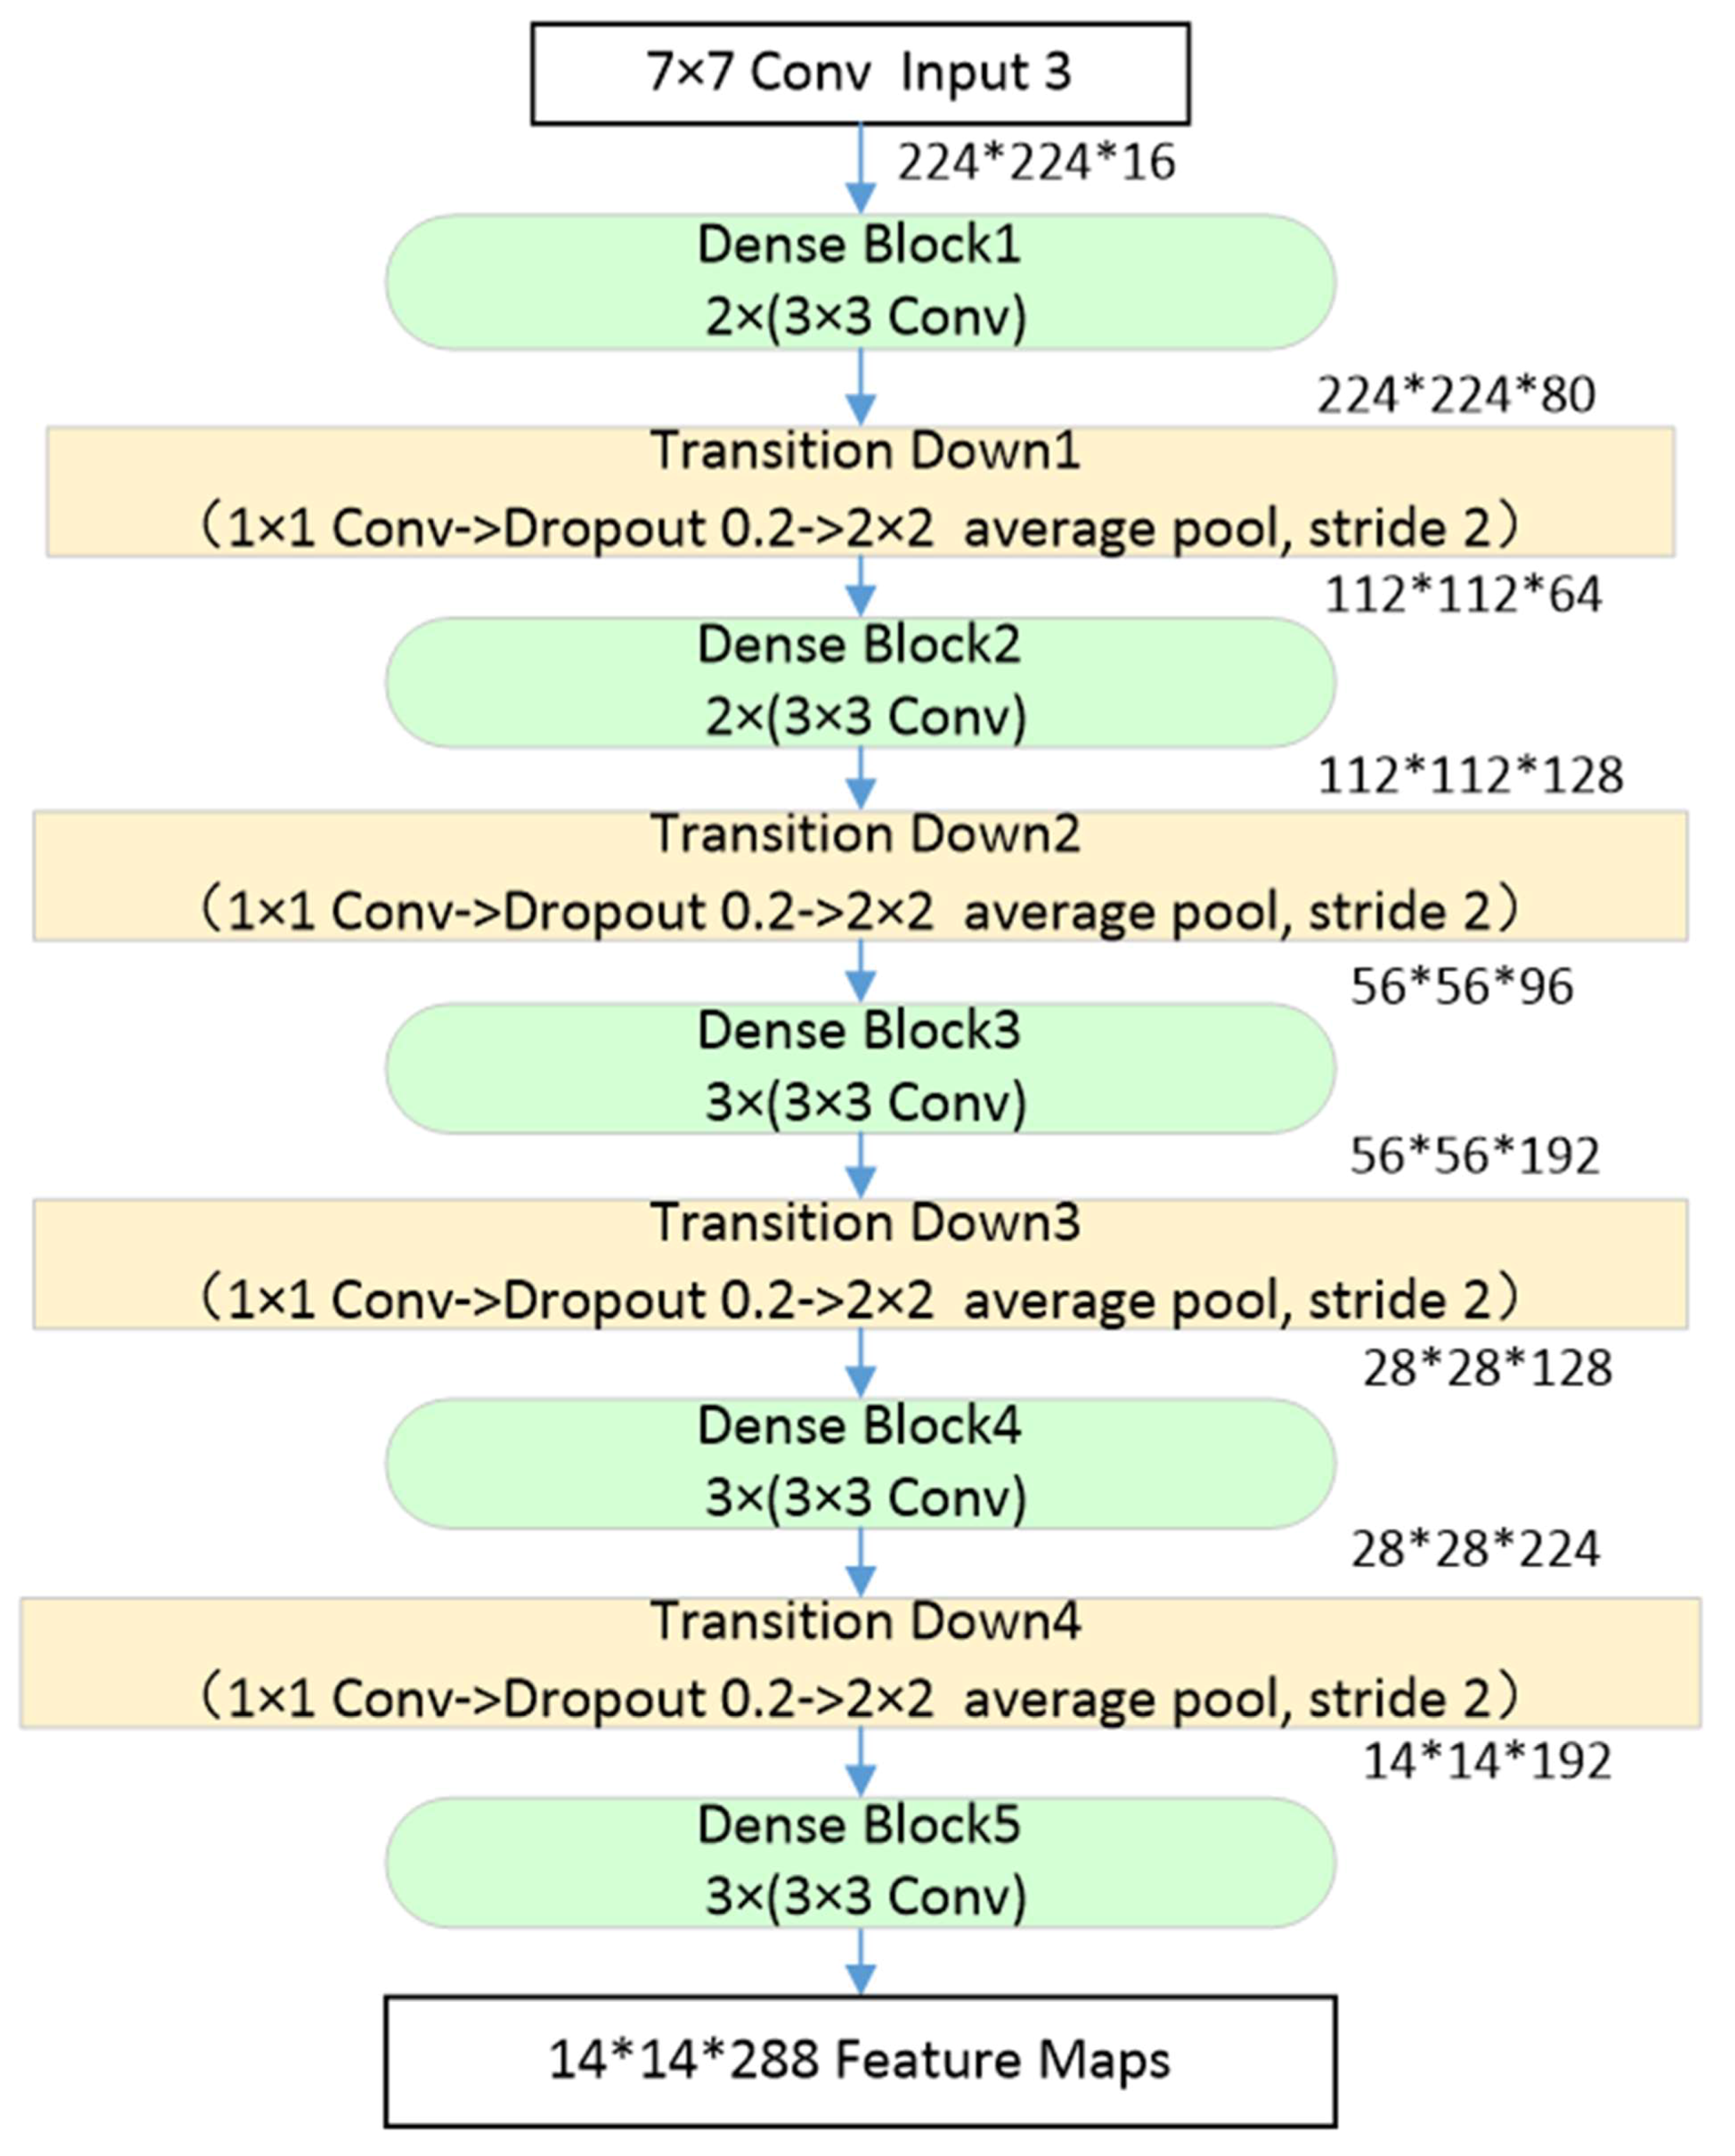
The common encoder–decoder networks mainly use different scales of feature maps to help decoders gradually recover the object details information. The skip connection of U-Nets is a common way to help decoders recover object details information from the encoder path by reusing feature maps. However, this way will result in over-using low-level features and cause over-segmentation [28]. The attention mechanism can weight lower-level information using higher-level visual information. Inspired by the attention mechanism, a spatial attention fusion module was designed to enhance useful low-level feature information and remove noise to avoid over-using low-level features. In the spatial attention fusion module, first, the high-level features are activated by a sigmoid layer, the output of the activation normalizes to [0,1] and is used as the weight of low-level features. Then, the high-level features activation output is multiplied by low-level features to obtain the weighted low-level feature. Finally, the high-level features and weighted low-level information are added as the input of the dense block to gradually recover the object details information. The architecture of the spatial attention features fusion module is shown in Figure 3.
3.3. The Architecture’s Decoder Part
As can be seen from Figure 1, in addition to the spatial attention features fusion modules and the transposed convolutions, the decoder path also contained five dense blocks and four bottleneck layers. Dense Block 6–8 contain three “conv” layers, respectively. Dense Block 9–10 contained two “conv” layers, respectively. The growth rate for these dense blocks was k = 32. Bottleneck layers were used to reduce the number of input feature-maps, which was built from a 1 × 1 convolutional layer followed by a dropout layer (drop rate: 0.2), In the four bottleneck layers, the output channels of bottleneck layers 1–2 were 256, and the output channels of bottleneck layers 3–4 were 128. The strides of transposed convolutions were equal to 2.
4. Experiments
In this section, the effectiveness of the proposed scheme for building extraction in very high resolution remote-sensing images was investigated. All networks were trained and tested with Tensorflow on GPU (TITAN X).
4.1. Training Details
4.1.1. Dataset
The proposed method was evaluated on the ISPRS 2D semantic labeling contest (Potsdam), which is an open benchmark dataset, which can be downloaded from the ISPRS official website (http://www2.isprs.org/commissions/comm3/wg4/2d-sem-label-potsdam.html). This dataset contains 38 very high-resolution true orthophoto (TOP) tiles extracted from a large TOP mosaic. ISPRS only provides 24 labeled images for training, while the remaining 14 tiles are unreleased. In this study, five of the labeled images were randomly used as the validation set and the remaining labeled images as the training models. Each tile contained around 6000 × 6000 pixels with a resolution of 5 cm, which made small details visible. The ground truth contained six of the most common land cover classes including impervious surfaces, buildings, low vegetation, trees, cars, and clutter/background.
4.1.2. Dataset Preprocessing
Given the limited memory of the GPU and obtaining more training samples, images of an average size of 6000 × 6000 were split into smaller patches in sizes of 224 × 224, 448 × 448, and 512 × 512. Thus, 14,339 patches of three sizes for training the networks can be obtained. However, to aid in testing, the size of the evaluation data was set as 3000 × 3000. So, a total of 20 images can be obtained for evaluation. Moreover, according to the defined red–green–blue (RGB) values of the six land cover classes, required objects can be extracted such as (0, 0, 255), which means the building type.
4.1.3. Implementation Details
For an individual network, the network was trained with an initial learning rate of 0.01. To ensure an outstanding learning result, a manual adjustment of the learning rate was made according to the speed of the training convergence, and will be about 0.00001 at last. There were 500 epochs during the training and each epoch had 1000 samples. As Adam is an adaptive optimizer with implementation simple, high computational efficiency and low memory requirement, which is used as the optimizer to optimize the network when adjusting parameters like weights, biases, and so on. To contribute to the geoscience community, the implementation code, the trained network, labeled images, and test images will release in open-source format and can be publicly accessed via GitHub (https://github.com/shenhuqiji/DAN).
4.1.4. Evaluation
Pixel- and object-based metrics are used in this study. While the latter quantifies the number of buildings and offers a quick assessment, the former is based on the number of pixels within the extracted buildings and provides a more rigorous evaluation [48]. In pixel-based evaluation, overall accuracy (OA), F1 score, and mean intersection over union (MIOU) were used to assess the quantitative performance. The F1 score is calculated by:
where,
where tp, fp, and fn are true positive, false positive, and false negative, respectively. These values can be calculated by the pixel-based confusion matrices per tile, or an accumulated confusion matrix. Overall accuracy is the normalization of the trace from the confusion matrix, and IoU is an average value of the intersection of the prediction and ground truth regions over their union, as follows. Then the MIOU can be computed by averaging the IoU of all classes.
In object-based evaluation, completeness, correctness, and quality values were used to assess the quantitative performance. Completeness is known as detection rate or producer’s accuracy, and correctness is known as user’s accuracy [48]. The quality values is calculated by:
4.2. Extraction Results
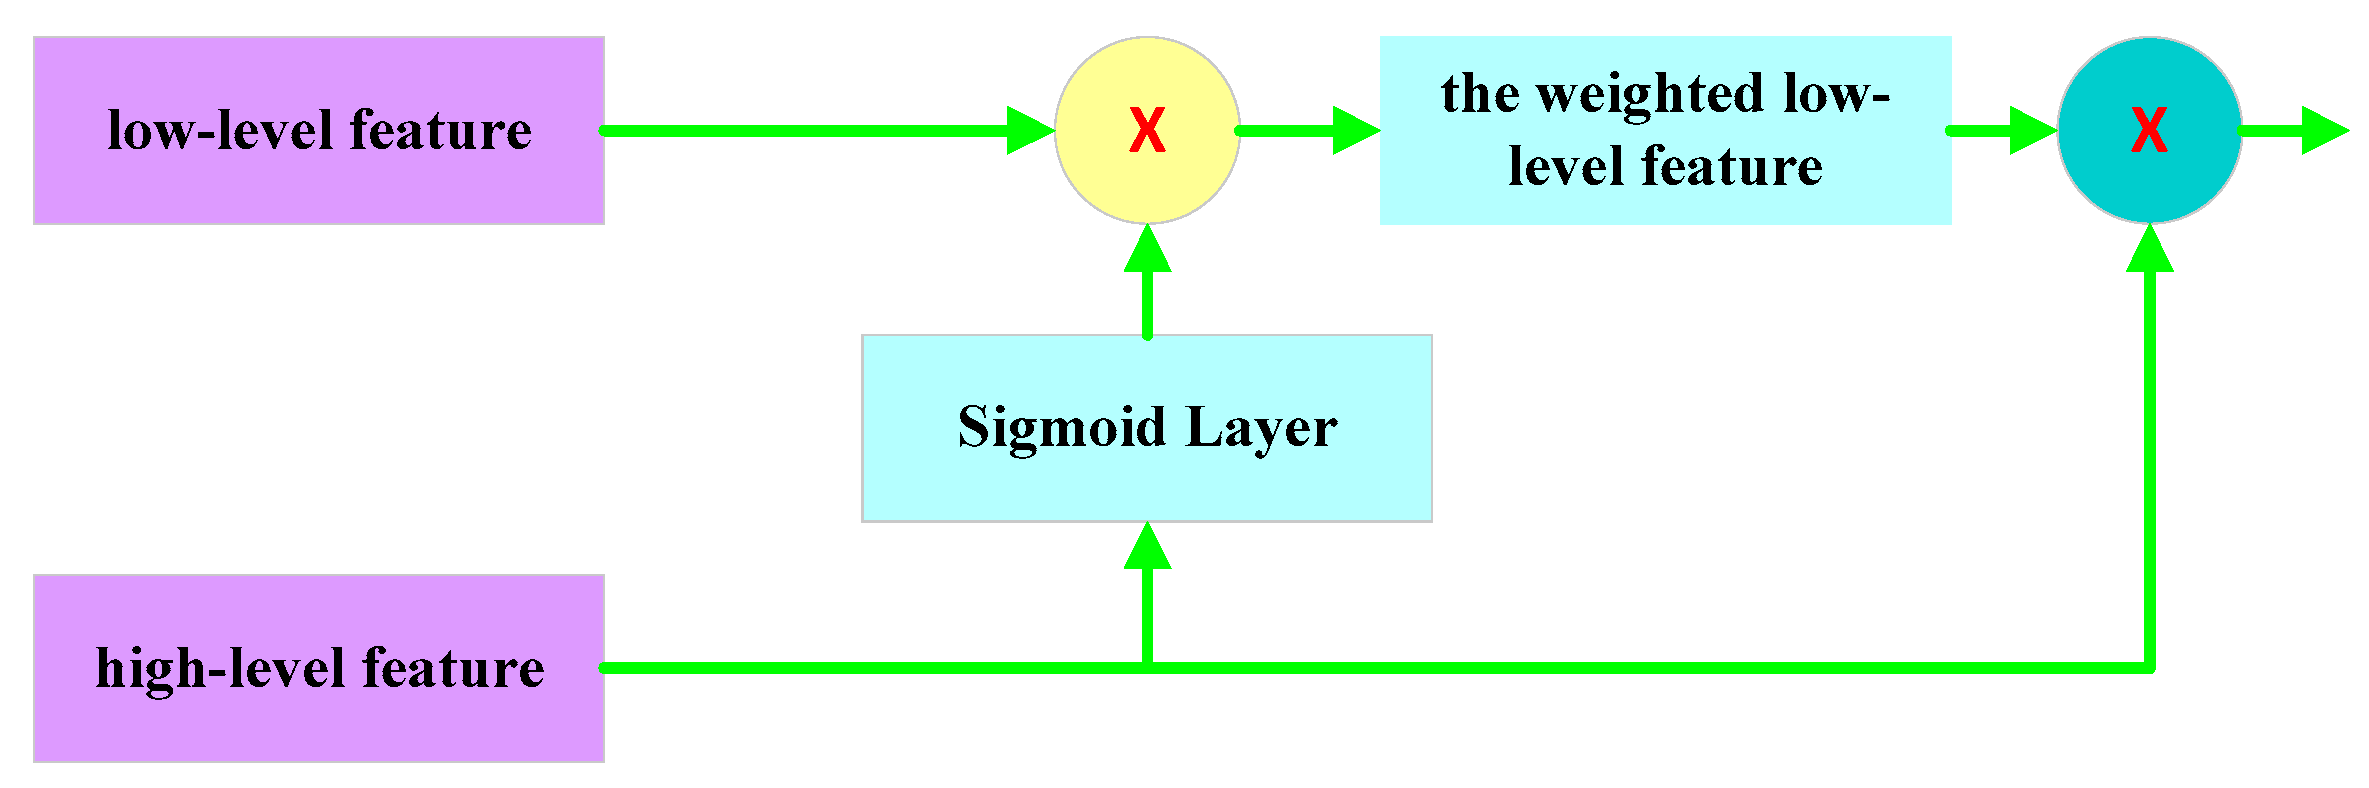
After 500,000 iterations, our best model achieved state-of-the-art results on the datasets (Table 1). Note that all of the results are listed based on the RGB images without any pre-processing and post-processing. The changing accuracies and losses of the datasets with the increasing epochs are shown in Figure 4. The architecture reached high scores (96.16% OA, 92.56% F1 score, 90.56% MIOU, 0.9521 Precision and 0.9066 recall) for all five validation datasets, which indicated the proposed dense-attention network performed well on the buildings. Furthermore, dataset 2 and dataset 5 obtained the highest accuracy and the lowest accuracy for the OA, respectively (97.21% vs. 94.39%). Visual inspection and comparison of building extraction maps were performed for the two datasets. The original images, ground truth, and prediction results of the dataset 2 and dataset 5 are listed in Figure 5. Although the extraction result of dataset 5 was the worst of the five validation datasets, the prediction of Figure 5e was also close to the ground truth of Figure 5f.
Moreover, the object-based evaluation results were also given in Table 2. Overall, these values from object-based evaluation are lower than the pixel-based results. Furthermore, dataset 2 and dataset 1 obtained the highest accuracy and the lowest accuracy for the quality value, respectively (0.8267 vs. 0.55), which indicate there are some differences in pixel- and object-based metrics.
4.3. Comparisons with Related Networks
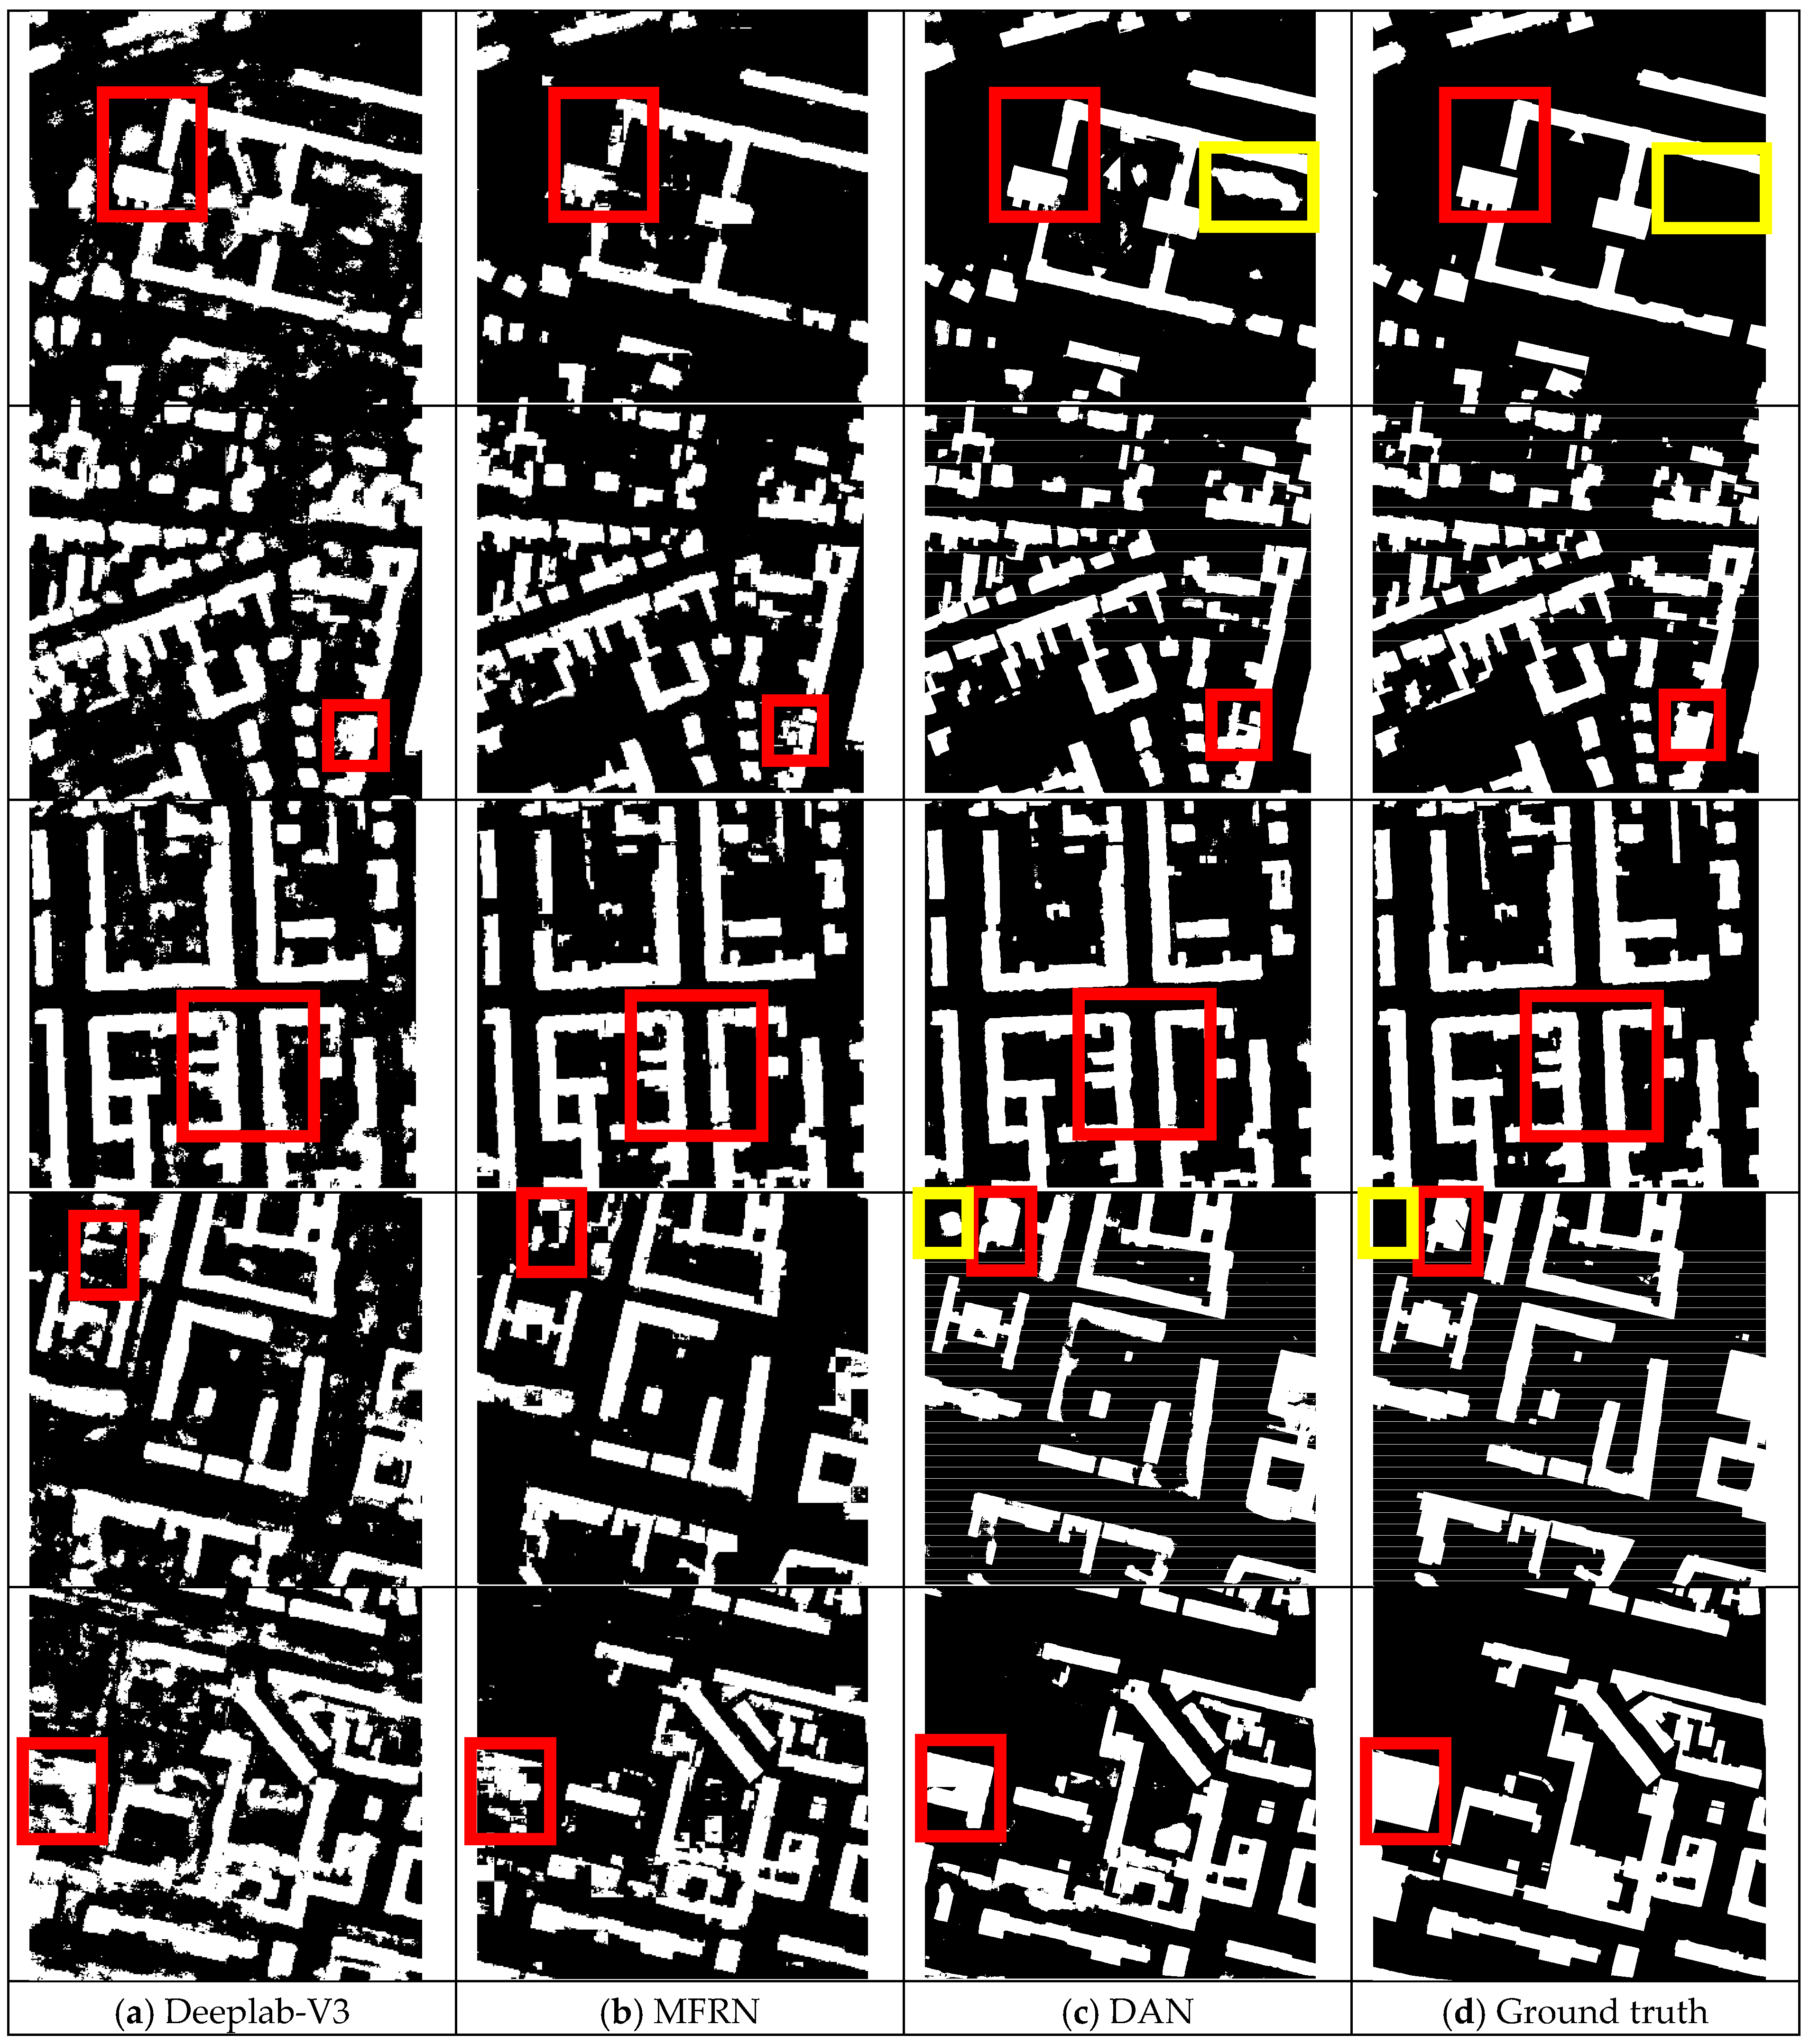
To show the effectiveness of the proposed network, comparisons were performed against two recent state-of-the-art building extraction methods, as showed in Figure 6. Note that the two methods were implemented and tested on the same experimental datasets (RGB images) of the ISPRS 2D semantic-labeling contest (Potsdam). In order to compare the test results, the same training datasets with corresponding stable loss and test datasets were used for the Deeplab-V3 [34], MFRN [27], and the proposed DAN. Due to lack of spatial attention fusion module, some low-level features are over-used and result in over-segmentation, which bring trivial and fragmentary buildings for the five validation datasets from the Deeplab-V3 and MFRN networks (see red boxes in Figure 6a,b). The results have improved markedly from the proposed DAN network in red boxes of Figure 6c. This finding suggests that the spatial attention mechanism can significantly improve the performance of a DCNN-based method. In order to quantitatively compare the proposed DAN network with the Deeplab-V3 and MFRN networks, the average OA, F1 score, MIOU, training time (TT) and recognition time (RT) of the three networks are listed in Table 3. The MFRN and the proposed DAN clearly outperforms the Deeplab-V3 by about 5% in the OA, about 8% in the F1 score and about 10% in the MIOU, respectively. In addition, although the proposed DAN network produced a minor improvement compared with the very new MFRN network, the DAN network used less layer fully convolutional DenseNet. Actually, a 56-layer fully convolutional DenseNet is concluded in MFRN, while the DAN use only a 24-layer fully convolutional DenseNet. More layers means that MFRN will take more time to train and test. From Table 3, the training time (TT) and recognition time (RT) of the three network are listed. The proposed DAN outperforms again the MFRN and Deeplab-V3 with less time (TT: 42.1 h < 51.4 h < 86.7 h, RT: 77.6 s < 85 s < 88.8 s). Therefore, compared with the very new MFRN network, another advantage of DAN is its high efficiency. Overall, although there exist a litter false classified buildings (see yellow boxes in Figure 6c,d), the proposed DAN network can achieve a better performance to extract buildings from VHR remote-sensing images without any other processing.
Similarly, object-based evaluation results of the proposed DAN network with the Deeplab-V3 and MFRN networks on Potsdam datasets using the completeness, correctness and quality metrics are listed in Table 4. From the metrics of completeness, there are no distinct differences for the three networks, while the scores of correctness and quality metrics from DAN are better than that from the other networks. Although the scores from object-based evaluation are lower than that from the pixel-based results for the three networks, the DAN still obtain the highest scores. Therefore, the results from both the pixel-based and the object-based evaluation system again shows that the proposed DAN network can achieve a better performance.
5. Discussion
Extracting 2D buildings footprints in VHR imagery has wide applications in navigation, urban planning, disaster management, and population estimation. It is necessary to develop techniques to extract 2D buildings information. Considering the limitations of the existing extraction methods, this study proposes a dense-attention network (DAN) to extract 2D building in VHR images. This study has examined in detail the theoretical basis of the proposed method and compared it with other deep learning-based approaches using ISPRS 2D semantic labeling contest datasets. In general, some groups or blocks of 2D buildings can be extracted in their entirety from the proposed DAN network, while the Deeplab-V3 and MFRN often bring trivial and fragmentary buildings. The extracted 2D buildings footprints were evaluated against the ground truth (label data). The experiments indicated that the proposed DAN achieved a higher score than Deeplab-V3 and MFRN on both accuracy and efficiency.
The primary reason for the superior performance of DAN is that different-level features are rationally utilized by combining the DenseNets and a spatial attention fusion module. The DenseNets had been proven the superiority in extracting the feature maps from inputs. The DAN network based on DenseNet also has these capability. In addition, the common encoder–decoder networks mainly use skip connection to help decoders gradually recover the object details. Then, the acquired low-level feature maps in the early layer are less discriminating. Such feature maps are fused with the higher-level feature maps by skip connection may increase the ambiguity of the final result. This will result in over-using low-level features and cause over-segmentation. The attention mechanism can weight lower level information using higher-level visual information to suppress the background and noises. Therefore, a spatial attention fusion module based on the attention mechanism can better guide the low-feature maps to help high-level features recover details of the images and reduce the over-segmentation.
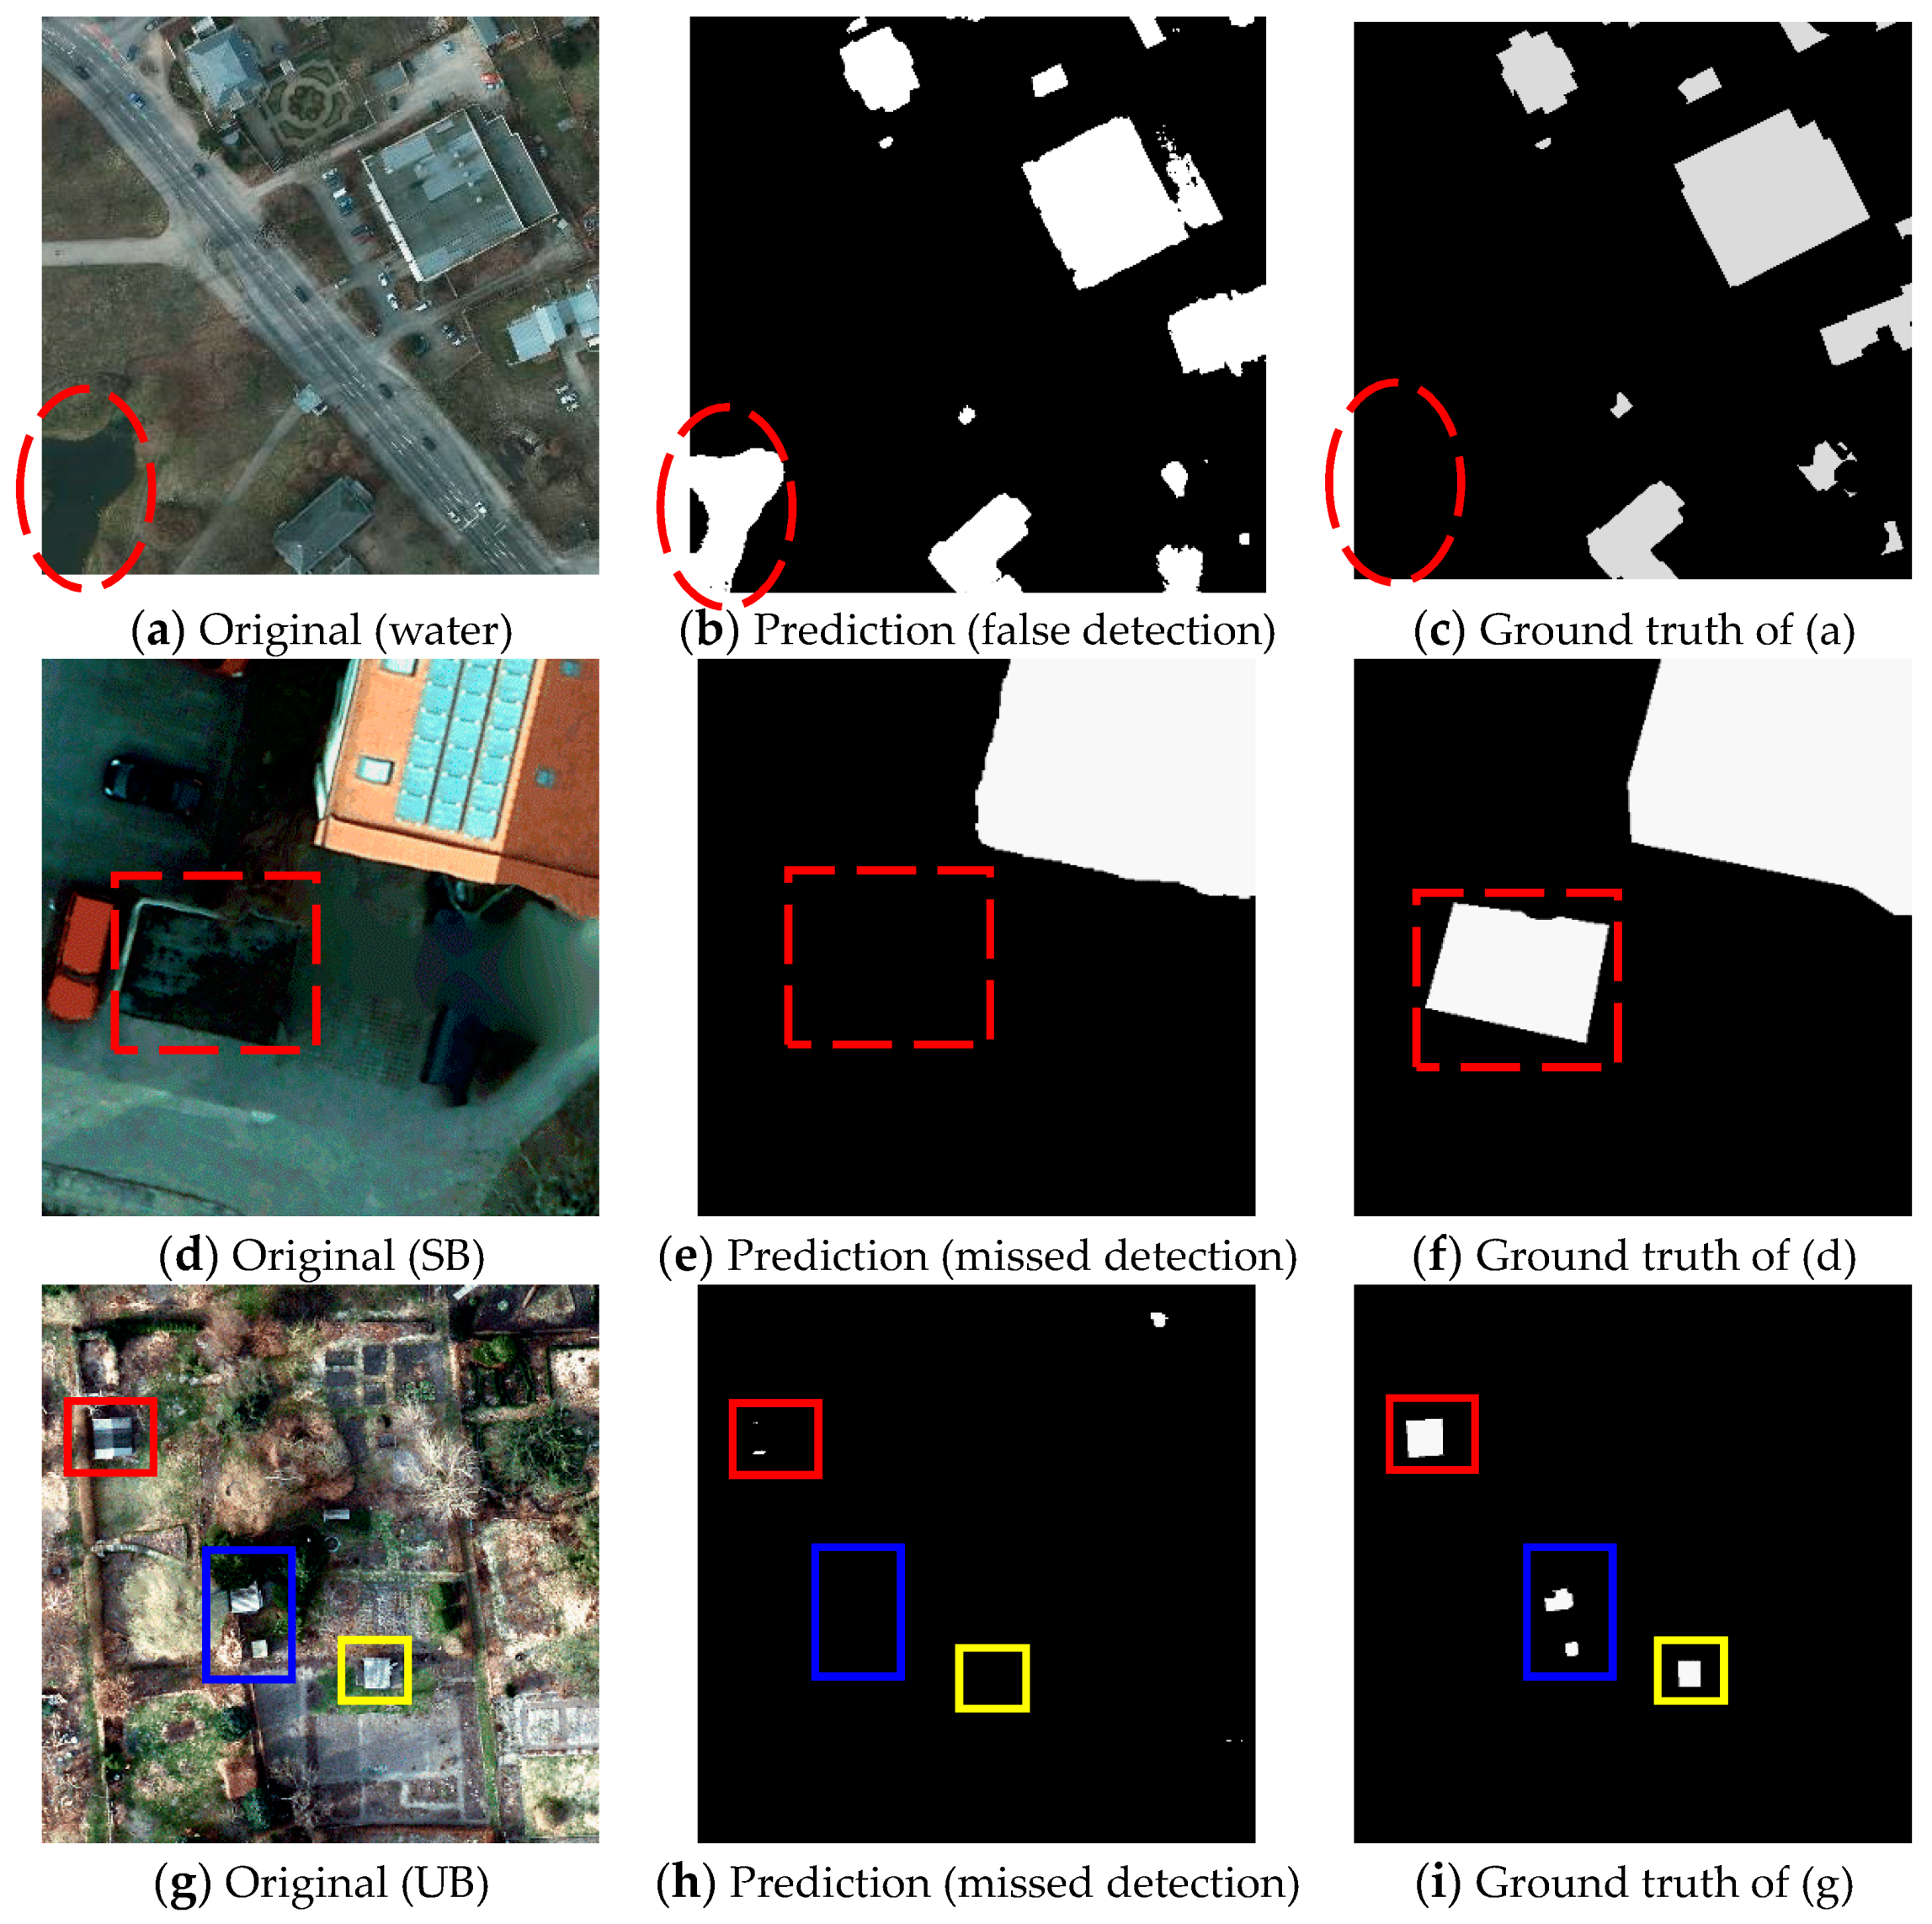
However, it should be noted that the accuracy of building extraction in VHR images could be affected by some factors, as can be seen from Figure 7:
- Complex background. Although water, bare, and sparse vegetation are in the minority in some test samples, they were also detected as buildings because of the similar hue to the foreground object (building), see Figure 6c,d (yellow boxes). The complex background may cause precision to be lower than recall, see the evaluation result of dataset 1 in Table 1. In addition, the water was not included into the above six land cover classes, which makes it difficult to fully learn the characteristics of the complex background, see Figure 7a–c. The misclassification may be a main limitation of the proposed DAN.
- Special buildings (SB). In some training samples, the characteristics (such as color, texture, and material) of a few buildings’ roofs were quite different from most buildings. Moreover, the shape of some buildings that were covered by trees could not be detected precisely, and some blurry and irregular boundaries were hardly classified. Therefore, it was hard to detect these buildings, see Figure 7d–f.
- Unremarkable buildings (UB). In most training samples, when compared to the background, the foreground objects were very distinct. However, in some of the test samples, a few images were covered with large amounts of bare and sparse vegetation, and small-sized buildings. These small-sized buildings were displayed in patchy distributions and were even hard to detect with the naked eye, which added to the difficulty of detection, see Figure 7g–i.
To weaken the effects of the above factors, some more optimized deep learning networks were required to improve the efficiency and accuracy of building extraction for special buildings and unremarkable buildings. Furthermore, other attempts such as pre-processing or post-processing methods also play an important role in distinguishing complex backgrounds in building extraction. For pre-processing, edge-enhancing techniques may be introduced to increase the differences among objects, which leads to better performance during classification. For example, the water may not be detected as a building if the digital surface model (DSM), normalized difference vegetation index (NDVI), or normalized difference water index (NDWI) are used to enhance the edge. Post-processing methods are often used at the end of the chosen deep learning network classifier for further reducing the noise (false classified buildings) and to sharpen the boundary of the buildings. For example, the conditional random field and guided filters have proven to be a very effective post-processing way to optimize the classification results and further improve the efficiency and accuracy of building extraction [49]. Moreover, recent work on data fusion of multi-modal remote-sensing data also might help improve the accuracy of building extraction, as proposed in Audebert et al. [50]. However, the objective of this study was to propose a novel network for 2D building extraction in VHR (only RGB) images without any other processing or data fusion strategies. The pre-processing or post-processing methods can improve the efficiency and accuracy of building extraction, which will be further addressed in our future work.
6. Conclusions
In this paper, a dense-attention network (DAN) was proposed for 2D building extraction in VHR images. The dense-attention network contained an encoder part and a decoder part, which can guide message passing between high- and low-feature maps. As the encoder part, lightweight DenseNets were used to extract the feature maps from inputs; while the decoder part, named the spatial attention fusion module, was used to guide the low-feature maps to help high-level features recover details of the images. Therefore, the DAN can effectively help in integrating useful features, and weakening the noises and background. Experiments were carried out on VHR imageries from the ISPRS dataset. Six land classes could be extracted successfully using the DAN and the results showed the effectiveness and feasibility of the proposed network in improving the performance of the building extraction. The DAN was compared with two recent networks such as the Deeplab-V3 and MFRN, which had the potential to perform better in terms of OA, MIOU, F1 score, TT and RT (pixel-based) and quality metrics (object-based). However, the extraction accuracy was affected by complex background, special buildings, and unremarkable buildings. These problems may be overcome by combining more optimized deep neural networks and pre-processing or post-processing methods, which can reduce errors and omissions. Instead of separately treating the network and pre-/post-processing methods, both of them will be considered simultaneously for higher accuracy and efficiency.
Author Contributions
P.W. and H.Y. designed the experiments; Y.W. and B.W. contributed analysis tools; X.Y. and Y.X. performed the experiments; P.W. and H.Y. wrote the paper. All authors have read and approved the final manuscript.
Funding
This research was funded by the National Natural Science Foundation of China (grant number 41501376, 41571400), Natural Science Foundation of Anhui Province (grant number 1608085MD83), the Key Laboratory of Earth Observation and Geospatial Information Science of NASG (grant number 201805), the Science Research Project of Anhui Education Department (grant number KJ2018A0007) and the open fund for Discipline Construction, Institute of Physical Science and Information Technology, Anhui University.
Acknowledgments
The authors thank the ISPRS for making the Potsdam datasets available and organizing the semantic labeling challenge. The authors also thank Jian Liang (Wuhan University) and Xinxin Zhou (Anhui University) for providing the code of MFRN and data pre-processing, respectively, and the anonymous reviewers and the external editor for providing valuable suggestion and comments, which have greatly improved this paper.
Conflicts of Interest
The authors declare no conflict of interest.
References
- Ghanea, M.; Moallem, P.; Momeni, M. Building extraction from high-resolution satellite images in urban areas: Recent methods and strategies against significant challenges. Int. J. Remote Sens. 2016, 37, 5234–5248. [Google Scholar] [CrossRef]
- Ok, A.O. Automated detection of buildings from single vhr multispectral images using shadow information and graph cuts. ISPRS J. Photogramm. Remote Sens. 2013, 86, 21–40. [Google Scholar] [CrossRef]
- Zhang, L.; Zhang, L.; Du, B. Deep learning for remote sensing data: A technical tutorial on the state of the art. IEEE Geosci. Remote Sens. Mag. 2016, 4, 22–40. [Google Scholar] [CrossRef]
- Ahmadi, S.; Zoej, M.J.V.; Ebadi, H.; Moghaddam, H.A.; Mohammadzadeh, A. Automatic urban building boundary extraction from high resolution aerial images using an innovative model of active contours. Int. J. Appl. Earth Obs. Geoinf. 2010, 12, 150–157. [Google Scholar] [CrossRef]
- Huang, X.; Zhang, L. A multidirectional and multiscale morphological index for automatic building extraction from multispectral geoeye-1 imagery. Photogramm. Eng. Remote Sens. 2011, 77, 721–732. [Google Scholar] [CrossRef]
- Jin, X.; Davis, C.H. Automated building extraction from high-resolution satellite imagery in urban areas using structural, contextual, and spectral information. EURASIP J. Appl. Signal Process. 2005, 14, 745309. [Google Scholar] [CrossRef]
- Ghanea, M.; Moallem, P.; Momeni, M. Automatic building extraction in dense urban areas through geoeye multispectral imagery. Int. J. Remote Sens. 2014, 35, 5094–5119. [Google Scholar] [CrossRef]
- Du, S.; Zhang, Y.; Zou, Z.; Xu, S.; He, X.; Chen, S. Automatic building extraction from LiDAR data fusion of point and grid-based features. ISPRS J. Photogramm. Remote Sens. 2017, 130, 294–307. [Google Scholar] [CrossRef]
- Campos-Taberner, M.; Romero-Soriano, A.; Gatta, C.; Camps-Valls, G.; Lagrange, A.; Saux, B.L.; Beaupere, A.; Boulch, A.; Chan-Hon-Tong, A.; Herbin, S.; et al. Processing of extremely high-resolution lidar and rgb data: Outcome of the 2015 ieee grss data fusion contest—Part A: 2-D contest. IEEE J. Sel. Top. Appl. Earth Obs. Remote Sens. 2017, 9, 5547–5559. [Google Scholar] [CrossRef]
- Vo, A.V.; Truong-Hong, L.; Laefer, D.F.; Tiede, D.; d’Oleire-Oltmanns, S.; Baraldi, A.; Shimoni, M.; Moser, G.; Tuia, D. Processing of extremely high resolution LiDAR and RGB data: Outcome of the 2015 IEEE GRSS data fusion contest—Part B: 3-D contest. IEEE J. Sel. Top. Appl. Earth Obs. Remote Sens. 2016, 9, 5560–5575. [Google Scholar] [CrossRef]
- Gilani, S.A.N.; Awrangjeb, M.; Lu, G. An automatic building extraction and regularisation technique using lidar point cloud data and orthoimage. Remote Sens. 2016, 8, 258. [Google Scholar] [CrossRef]
- Niemeyer, J.; Rottensteiner, F.; Soergel, U. Contextual classification of lidar data and building object detection in urban areas. ISPRS J. Photogramm. Remote Sens. 2014, 87, 152–165. [Google Scholar] [CrossRef]
- Aljumaily, H.; Laefer, D.F.; Cuadra, D. Urban point cloud mining based on density clustering and MapReduce. J. Comput. Civ. Eng. 2017, 31, 04017021. [Google Scholar] [CrossRef]
- Li, E.; Xu, S.; Meng, W.; Zhang, X. Building extraction from remotely sensed images by integrating saliency cue. IEEE J. Sel. Top. Appl. Earth Obs. Remote Sens. 2017, 10, 906–919. [Google Scholar] [CrossRef]
- Vakalopoulou, M.; Karantzalos, K.; Komodakis, N.; Paragios, N. In Building detection in very high resolution multispectral data with deep learning features. In Proceedings of the Geoscience and Remote Sensing Symposium, Milan, Italy, 26–31 July 2015; pp. 1873–1876. [Google Scholar]
- Sun, Y.; Zhang, X.; Zhao, X.; Xin, Q. Extracting Building Boundaries from High Resolution Optical Images and LiDAR Data by Integrating the Convolutional Neural Network and the Active Contour Model. Remote Sens. 2018, 10, 1459. [Google Scholar] [CrossRef]
- Alshehhi, R.; Marpu, P.R.; Wei, L.W.; Mura, M.D. Simultaneous extraction of roads and buildings in remote sensing imagery with convolutional neural networks. ISPRS J. Photogramm. Remote Sens. 2017, 130, 139–149. [Google Scholar] [CrossRef]
- Yang, H.L.; Yuan, J.; Lunga, D.; Laverdiere, M.; Rose, A.; Bhaduri, B. Building extraction at scale using convolutional neural network: Mapping of the united states. IEEE J. Sel. Top. Appl. Earth Obs. Remote Sens. 2018. [Google Scholar] [CrossRef]
- Saito, S.; Yamashita, T.; Aoki, Y. Multiple object extraction from aerial imagery with convolutional neural networks. Electron. Imaging 2016, 60. [Google Scholar] [CrossRef]
- Huang, Z.; Cheng, G.; Wang, H.; Li, H.; Shi, L.; Pan, C. Building extraction from multi-source remote sensing images via deep deconvolution neural networks. In Proceedings of the 2016 IEEE International Geoscience and Remote Sensing Symposium (IGARSS), Beijing, China, 10–15 July 2016; pp. 1835–1838. [Google Scholar]
- Bittner, K.; Cui, S.; Reinartz, P. Building extraction from remote sensing data using fully convolutional networks. In Proceedings of the International Archives of the Photogrammetry, Remote Sensing and Spatial Information Sciences, ISPRS Hannover Workshop, Hannover, Germany, 6–9 June 2017; pp. 481–486. [Google Scholar]
- Ronneberger, O.; Fischer, P.; Brox, T. U-Net: Convolutional networks for biomedical image segmentation. In Proceedings of the International Conference on Medical Image Computing and Computer-Assisted Intervention, Munich, Germany, 5–9 October 2015; pp. 234–241. [Google Scholar]
- Badrinarayanan, V.; Kendall, A.; Cipolla, R. Segnet: A deep convolutional encoder-decoder architecture for scene segmentation. arXiv, 2016; arXiv:1511.00561v3. [Google Scholar]
- Lin, G.; Milan, A.; Shen, C.; Reid, I. Refinenet: Multi-path refinement networks for high-resolution semantic segmentation. arXiv, 2016; arXiv:1611.06612. [Google Scholar]
- Huang, G.; Liu, Z.; Laurens, V.D.M.; Weinberger, K.Q. Densely connected convolutional networks. In Proceedings of the IEEE Conference on Computer Vision and Pattern Recognition (CVPR), Honolulu, HI, USA, 21–26 July 2017; pp. 2261–2269. [Google Scholar]
- Jégou, S.; Drozdzal, M.; Vazquez, D.; Romero, A.; Bengio, Y. The one hundred layers tiramisu: Fully convolutional densenets for semantic segmentation. In Proceedings of the IEEE Conference on Computer Vision and Pattern Recognition (CVPR), Honolulu, HI, USA, 21–26 July 2017; pp. 1175–1183. [Google Scholar]
- Li, L.; Liang, J.; Weng, M.; Zhu, H. A Multiple-Feature Reuse Network to Extract Buildings from Remote Sensing Imagery. Remote Sens. 2018, 10, 1350. [Google Scholar] [CrossRef]
- Wang, H.; Wang, Y.; Zhang, Q.; Xiang, S.; Pan, C. Gated convolutional neural network for semantic segmentation in high-resolution images. Remote Sens. 2017, 9, 446. [Google Scholar] [CrossRef]
- Yang, Y.; Zhong, Z.; Shen, T.; Lin, Z. Convolutional neural networks with alternately updated clique. In Proceedings of the IEEE Conference on Computer Vision and Pattern Recognition, Salt Lake City, UT, USA, 18–22 June 2018; pp. 2413–2422. [Google Scholar]
- Yu, B.; Yang, L.; Chen, F. Semantic segmentation for high spatial resolution remote sensing images based on convolution neural network and pyramid pooling module. IEEE J. Sel. Top. Appl. Earth Obs. Remote Sens. 2018, 11, 3252–3261. [Google Scholar] [CrossRef]
- Kemker, R.; Salvaggio, C.; Kanan, C. Algorithms for semantic segmentation of multispectral remote sensing imagery using deep learning. ISPRS J. Photogramm. Remote Sens. 2018. [Google Scholar] [CrossRef]
- Simonyan, K.; Zisserman, A. Very deep convolutional networks for large-scale image recognition. arXiv, 2014; arXiv:1409.1556. [Google Scholar]
- Wang, F.; Jiang, M.; Qian, C.; Yang, S.; Li, C.; Zhang, H.; Wang, X.; Tang, X. Residual attention network for image classification. In Proceedings of the IEEE Conference on Computer Vision and Pattern Recognition (CVPR), Honolulu, HI, USA, 21–26 July 2017; pp. 6450–6458. [Google Scholar]
- Chen, L.C.; Papandreou, G.; Schroff, F.; Adam, H. Rethinking atrous convolution for semantic image segmentation. arXiv, 2017; arXiv:1706.05587v3. [Google Scholar]
- Itti, L.; Koch, C. Computational modelling of visual attention. Nat. Rev. Neurosci. 2001, 2, 194–203. [Google Scholar] [CrossRef] [PubMed]
- Xu, K.; Ba, J.; Kiros, R.; Cho, K.; Courville, A.; Salakhutdinov, R.; Zemel, R.; Bengio, Y. Show, attend and tell: Neural image caption generation with visual attention. Cmputer Sci. 2015, arXiv:1502.03044. [Google Scholar]
- Chen, L.; Zhang, H.; Xiao, J.; Nie, L.; Shao, J.; Liu, W.; Chua, T.S. Sca-cnn: Spatial and channel-wise attention in convolutional networks for image captioning. In Proceedings of the IEEE Conference on Computer Vision and Pattern Recognition (CVPR), Honolulu, HI, USA, 21–26 July 2017; pp. 6298–6306. [Google Scholar]
- Yang, Z.; He, X.; Gao, J.; Deng, L.; Smola, A. Stacked attention networks for image question answering. In Proceedings of the IEEE Conference on Computer Vision and Pattern Recognition (CVPR), Las Vegas, NV, USA, 26 June–1 July 2016; pp. 21–29. [Google Scholar]
- Chen, K.; Wang, J.; Chen, L.C.; Gao, H.; Xu, W.; Nevatia, R. Abc-cnn: An attention based convolutional neural network for visual question answering. arXiv, 2015; arXiv:1511.05960v2. [Google Scholar]
- Fu, J.; Zheng, H.; Mei, T. Look closer to see better: Recurrent attention convolutional neural network for fine-grained image recognition. In Proceedings of the IEEE Conference on Computer Vision and Pattern Recognition (CVPR), Honolulu, HI, USA, 21–26 July 2017; pp. 4476–4484. [Google Scholar]
- Yao, L.; Torabi, A.; Cho, K.; Ballas, N.; Pal, C.; Larochelle, H.; Courville, A. Describing videos by exploiting temporal structure. In Proceedings of the 2015 IEEE International Conference on Computer Vision (ICCV), Santiago, Chile, 7–13 December 2015; pp. 4507–4515. [Google Scholar]
- Kuen, J.; Wang, Z.; Wang, G. Recurrent attentional networks for saliency detection. In Proceedings of the IEEE Conference on Computer Vision and Pattern Recognition (CVPR), Las Vegas, NV, USA, 26 June–1 July 2016; pp. 3668–3677. [Google Scholar]
- Hu, J.; Shen, L.; Sun, G. Squeeze-and-excitation networks. arXiv, 2018; arXiv:1709.01507v2. [Google Scholar]
- Li, H.; Xiong, P.; An, J.; Wang, L. Pyramid attention network for semantic segmentation. arXiv, 2018; arXiv:1805.10180v2. [Google Scholar]
- Yu, C.; Wang, J.; Peng, C.; Gao, C.; Yu, G.; Sang, N. Learning a discriminative feature network for semantic segmentation. In Proceedings of the IEEE Conference on Computer Vision and Pattern Recognition, Salt Lake City, UT, USA, 18–22 June 2018; pp. 1857–1866. [Google Scholar]
- Golnaz, G.; Fowlkes, C.C. Laplacian pyramid reconstruction and refinement for semantic segmentation. In Proceedings of the European Conference on Computer Vision (ECCV), Amsterdam, The Netherlands, 8–16 October 2016; pp. 519–534. [Google Scholar]
- Pleiss, G.; Chen, D.; Huang, G.; Li, T.; Laurens, V.D.M.; Weinberger, K.Q. Memory-efficient implementation of densenets. arXiv, 2017; arXiv:1707.06990v1. [Google Scholar]
- Awrangjeb, M.; Fraser, C.S. An Automatic and Threshold-Free Performance Evaluation System for Building Extraction Techniques from Airborne LIDAR Data. IEEE J. Sel. Top. Appl. Earth Obs. Remote Sens. 2014, 7, 4184–4198. [Google Scholar] [CrossRef]
- Xu, Y.; Wu, L.; Xie, Z.; Chen, Z. Building extraction in very high resolution remote sensing imagery using deep learning and guided filters. Remote Sens. 2018, 10, 144. [Google Scholar] [CrossRef]
- Audebert, N.; Saux, B.; Lefèvre, S. Beyond RGB: Very high resolution urban remote sensing with multimodal deep networks. ISPRS J. Photogramm. Remote Sens. 2018, 140, 20–32. [Google Scholar] [CrossRef] [Green Version]
Figure 1.
Diagram of overall architecture of dense-attention networks.

Figure 2.
The lightweight DenseNets architectures. The growth rate for all networks is k = 32. Note that each “conv” layer shown in the figure corresponds to the sequence Batch Normalization–ReLU–Convolution.
Figure 2.
The lightweight DenseNets architectures. The growth rate for all networks is k = 32. Note that each “conv” layer shown in the figure corresponds to the sequence Batch Normalization–ReLU–Convolution.

Figure 3.
The architecture of the spatial attention features fusion module.

Figure 4.
Plots showing the accuracy and loss of the dense-attention network (DAN) for training the datasets. The training accuracy (a) and the loss (b) changed with the increasing epochs.
Figure 4.
Plots showing the accuracy and loss of the dense-attention network (DAN) for training the datasets. The training accuracy (a) and the loss (b) changed with the increasing epochs.

Figure 5.
The worst results and the best results of the building extraction using the DAN. (a) represents the original RGB image of dataset 2; (b) represents the corresponding prediction from deep learning; (c) represents the corresponding ground truth. (d–f) are the original RGB image of dataset 5, prediction from deep learning, and the corresponding ground truth, respectively.

Figure 6.
The results of the building extraction from Deeplab-V3, multiple-feature reuse network (MFRN) and the proposed DAN.
Figure 6.
The results of the building extraction from Deeplab-V3, multiple-feature reuse network (MFRN) and the proposed DAN.

Figure 7.
Some factors caused false detection and missed detection in building extraction. (a) represents the original red–green–blue (RGB) image with water; (b) represents the corresponding prediction with false detection; (c) represents the corresponding ground truth. (d–f) and (g–i) are the original RGB image with special buildings and unremarkable buildings, corresponding prediction with missed detection, and the corresponding ground truth, respectively.


Table 1.
Pixel-based evaluation results of the average accuracy for the overall accuracy (OA), F1 score, mean intersection over union (MIOU), precision and recall for buildings on all validation datasets and on individual datasets, respectively.
Table 1.
Pixel-based evaluation results of the average accuracy for the overall accuracy (OA), F1 score, mean intersection over union (MIOU), precision and recall for buildings on all validation datasets and on individual datasets, respectively.
| Validation Datasets | OA (%) | F1 Score (%) | MIOU (%) | Precision | Recall |
|---|---|---|---|---|---|
| All five datasets | 96.16 | 92.56 | 90.56 | 0.9521 | 0.9066 |
| Only dataset 1 | 96.63 | 89.34 | 88.08 | 0.8573 | 0.9327 |
| Only dataset 2 | 97.21 | 95.05 | 93.38 | 0.9786 | 0.9240 |
| Only dataset 3 | 97.10 | 95.54 | 93.64 | 0.9878 | 0.9251 |
| Only dataset 4 | 95.92 | 92.45 | 90.26 | 0.9690 | 0.8839 |
| Only dataset 5 | 94.39 | 90.39 | 87.43 | 0.9342 | 0.8755 |
Table 2.
Object-based evaluation results on all validation datasets and on individual datasets using the completeness, Cm; correctness, Cr; quality metrics, Q; (Cm,2.5, Cr,2.5, and Q2.5 are for buildings over 2.5 m2), respectively.
Table 2.
Object-based evaluation results on all validation datasets and on individual datasets using the completeness, Cm; correctness, Cr; quality metrics, Q; (Cm,2.5, Cr,2.5, and Q2.5 are for buildings over 2.5 m2), respectively.
| Validate Data | tp | fn | fp | Cm,2.5 | Cr,2.5 | Q2.5 |
|---|---|---|---|---|---|---|
| All datasets | 159 | 30 | 32 | 0.8413 | 0.8325 | 0.7195 |
| Only dataset 1 | 22 | 4 | 14 | 0.8462 | 0.6111 | 0.55 |
| Only dataset 2 | 62 | 11 | 2 | 0.8493 | 0.9688 | 0.8267 |
| Only dataset 3 | 32 | 7 | 2 | 0.8205 | 0.9412 | 0.7805 |
| Only dataset 4 | 18 | 5 | 6 | 0.7826 | 0.75 | 0.6207 |
| Only dataset 5 | 25 | 3 | 8 | 0.8929 | 0.7576 | 0.6944 |
Table 3.
Compared with the results of the proposed network with other networks on Potsdam datasets using the average OA, F1 score, MIOU, training time (TT) and recognition time (RT). The RT is tested in datasets which include 20 images with a size in 3000 × 3000.
Table 3.
Compared with the results of the proposed network with other networks on Potsdam datasets using the average OA, F1 score, MIOU, training time (TT) and recognition time (RT). The RT is tested in datasets which include 20 images with a size in 3000 × 3000.
| OA (%) | F1 Score (%) | MIOU (%) | TT (h) | RT (s) | |
|---|---|---|---|---|---|
| Deeplab-V3 | 90.25 | 83.36 | 79.37 | 86.7 | 88.8 |
| MFRN | 95.61 | 91.80 | 89.74 | 51.4 | 85.0 |
| DAN | 96.16 | 92.56 | 90.56 | 42.1 | 77.6 |
Table 4.
Object-based evaluation results of the proposed network with other networks on Potsdam datasets using the completeness, Cm; correctness, Cr; quality metrics, Q; (Cm,2.5, Cr,2.5, and Q2.5 are for buildings over 2.5 m2).
Table 4.
Object-based evaluation results of the proposed network with other networks on Potsdam datasets using the completeness, Cm; correctness, Cr; quality metrics, Q; (Cm,2.5, Cr,2.5, and Q2.5 are for buildings over 2.5 m2).
| tp | fn | fp | Cm,2.5 | Cr,2.5 | Q2.5 | |
|---|---|---|---|---|---|---|
| Deeplab-V3 | 168 | 21 | 392 | 0.8889 | 0.3 | 0.2892 |
| MFRN | 163 | 26 | 56 | 0.8624 | 0.7443 | 0.6653 |
| DAN | 159 | 30 | 32 | 0.8413 | 0.8325 | 0.7195 |
© 2018 by the authors. Licensee MDPI, Basel, Switzerland. This article is an open access article distributed under the terms and conditions of the Creative Commons Attribution (CC BY) license (http://creativecommons.org/licenses/by/4.0/).
Share and Cite
MDPI and ACS Style
Yang, H.; Wu, P.; Yao, X.; Wu, Y.; Wang, B.; Xu, Y. Building Extraction in Very High Resolution Imagery by Dense-Attention Networks. Remote Sens. 2018, 10, 1768. https://0-doi-org.brum.beds.ac.uk/10.3390/rs10111768
AMA Style
Yang H, Wu P, Yao X, Wu Y, Wang B, Xu Y. Building Extraction in Very High Resolution Imagery by Dense-Attention Networks. Remote Sensing. 2018; 10(11):1768. https://0-doi-org.brum.beds.ac.uk/10.3390/rs10111768
Chicago/Turabian StyleYang, Hui, Penghai Wu, Xuedong Yao, Yanlan Wu, Biao Wang, and Yongyang Xu. 2018. "Building Extraction in Very High Resolution Imagery by Dense-Attention Networks" Remote Sensing 10, no. 11: 1768. https://0-doi-org.brum.beds.ac.uk/10.3390/rs10111768
Note that from the first issue of 2016, this journal uses article numbers instead of page numbers. See further details here.