Exploring the Potential of High Resolution WorldView-3 Imagery for Estimating Yield of Mango


1
Agricultural Remote Sensing Team, Precision Agriculture Research Group, University of New England, Armidale, NSW 2350, Australia
2
Department of Primary Industry and Resources, Northern Territory Government; NT 0801, Australia
*
Author to whom correspondence should be addressed.
Remote Sens. 2018, 10(12), 1866; https://0-doi-org.brum.beds.ac.uk/10.3390/rs10121866
Submission received: 29 October 2018
/
Revised: 16 November 2018
/
Accepted: 20 November 2018
/
Published: 22 November 2018
(This article belongs to the Section Remote Sensing in Agriculture and Vegetation)
Abstract
:Pre-harvest yield estimation of mango fruit is important for the optimization of inputs and other resources on the farm. Current industry practice of visual counting the fruit on a small number of trees for yield forecasting can be highly inaccurate due to the spatial variability, especially if the trees selected do not represent the entire crop. Therefore, this study evaluated the potential of high resolution WorldView-3 (WV3) satellite imagery to estimate yield of mango by integrating both geometric (tree crown area) and optical (spectral vegetation indices) data using artificial neural network (ANN) model. WV3 images were acquired in 2016–2017 and 2017–2018 growing seasons at the early fruit stage from three orchards in Acacia Hills region, Northern Territory, Australia. Stratified sampling technique (SST) was applied to select 18 trees from each orchard and subsequently ground truthed for yield (kg·tree−1) and fruit number per tree. For each sampled tree, spectral reflectance data and tree crown area (TCA) was extracted from WV3 imagery. The TCA was identified as the most important predictor of both fruit yield (kg·tree−1) and fruit number, followed by NDVI red-edge band when all trees from three orchards in two growing seasons were combined. The results of all sampled trees from three orchards in two growing seasons using ANN model produced a strong correlation (R2 = 0.70 and 0.68 for total fruit yield (kg·tree−1) and fruit number respectively), which suggest that the model can be obtained to predict yield on a regional level. On orchard level also the ANN model produced a high correlation when both growing seasons were combined. However, the model developed in one season could not be applied in another season due to the influence of seasonal variation and canopy condition. Using the relationship derived from the measured yield parameters against combined VIs and TCA data, the total fruit yield (t·ha−1) and fruit number were estimated for each orchard, produced 7% under estimation to less than 1% over estimation. The accuracy of the findings showed the potential of WV3 imagery to better predict the yield parameters than the current practice across the mango industry as well as to quantify lost yield as a result of delayed harvest.

1. Introduction
Accurate pre-harvest yield estimation of high value fruit tree crops such as Mango (Mangifera indica) is of substantial benefit to industry as it allows growers to make more informed decisions on the optimizing of orchard inputs (e.g. irrigation water, fertilizers, pesticides etc.) and to plan the logistics related with harvest, transport, marketing and forward selling. Current industry practice of yield estimation is based on historical data and the manual counting of mangoes from a selected number of sample locations at the stone hardening stage of fruit development, about only six weeks prior to harvest [1]. However, this method often provides very inaccurate and inefficient estimation of yield over the whole orchard, since the number of fruits on each tree can be highly variable. Also this method can be labour intensive, with the limited sample size considered to be insufficient to achieve an accurate estimation of yield across the whole orchard [2].
Crop simulation models have been developed for a number of tree crops to estimate fruit number based on tree physiological parameters (i.e. tree canopy area, average fruit set density and number of fruits on a representative sample of trees). Winter [3] developed ‘Bavendorf’ crop estimation model to estimate number of fruits for apple and pear orchards, which was later evaluated by Köhne [4] to estimate the number of fruits in avocado orchards. However, the accuracy of this method depends on the number of sample trees and fruit set density (FSD) counts, which are time consuming, labour intensive and require experienced personnel for better estimation of fruit numbers. A ‘pheno-physiological model’ for avocado was developed by Whiley, et al. [5] to estimate different growth parameters including fruit set, fruit retention and yield using the physiological status of the tree in terms of vegetative (roots and shoots) and reproductive (flowers and fruits) organs. They identified an empirical relationship between the level of starch concentration in tree trunks prior to flowering and subsequent fruit yield. However, any adverse environmental or management conditions in between flowering and final fruit set can largely influence this relationship.
Numerous researchers also developed tree crop yield estimation model using different crop structural and biophysical parameters, such as, trunk cross sectional area (TCSA; cm2), canopy volume (m3), canopy leaf area (m2) and intercepted photosynthetically active radiation (PAR) [6,7,8,9]. Wright, Nichols and Embree [9] reported tree canopy volume as a better predictor for yield estimation, than the TCSA and canopy leaf area for apple trees. Reginato, De Cortázar, Robinson and Varela [6], while working on pear production, applied PAR to estimate yield and found a better correlation than TCSA. Viau, Jang, Payan and Devost [7] applied integrated LiDAR derived tree canopy area and airborne normalized difference vegetation index (NDVI) data to obtain information about crop conditions and yield of apple orchards. Although a reliable accuracy was achieved using the integrated model, exploration of tree height and other VIs from multispectral imagery was proposed to improve the precision of the model.
Several sensor technologies including light detection and ranging (LiDAR), thermal imaging, ultrasonic sensors and machine vision systems were investigated for last several years to estimate fruits of individual trees for a number of different fruit crops, such as citrus [10,11,12], apples [13,14,15,16], grapes [17,18], almonds [19] and mangoes [1,2,20]. In these studies, the focus lay mostly on the estimation of number of fruits, and not the overall yield (kg·ha−1) or the average fruit size (g) per tree, which are also very important parameters for on farm management and harvest segregation. The occlusion of fruit by branches, leaves and other similar fruits, variations in illumination conditions and thresholding errors were identified to be the main limitations of these techniques [20,21,22]. Moreover, the price and complexity associated with the acquisition and processing of image restrict its application on a large industrial scale.
Very high resolution satellite imagery offers as a time efficient and more convenient solution of mango yield parameter estimation on a large scale. Whilst prior literature has demonstrated the potential benefit of this technology for measuring yield in annual crops [23,24,25,26,27], the results for perennial fruit tree crops have revealed varying level of success, for example citrus [28,29], apples [30,31], pears [32], peach [33], olive [33], grapes [34,35], avocado [36,37], macadamia [37] among others. For mango, a limited number of satellite based remote sensing studies have been undertaken and their main objective was mostly limited to outlining the various mango orchards in a regional level [38,39].
There are various machine learning (ML) approaches have been used in developing remote sensing based models such as artificial neural networks (ANN), support vector machines (SVM), decision trees (DT), random forests (RF), etc [40,41,42]. Many authors have reported considerable advantages of ANN due to their ability to learn complex patterns, generalize in noisy environments and in the presence of incomplete or imprecise data, their capacity to incorporate a priori knowledge and realistic physical constraints into the analysis, and to incorporate different types of data into the analysis [43,44,45,46]. Moreover, ANN have been reported to perform more accurately for remote sensing data compared to other statistical and ML techniques in recent studies [43,47,48]. Therefore, ANN model was used to develop regression models in this study.
Recently, with the advent of 30 cm resolution panchromatic WV3 imagery, it is now conceivable to calculate tree crown area using geographic object based image analysis (GEOBIA) and canopy reflectance measured across eight band multispectral imagery. Improving the accuracy of yield parameter estimation with lower sampling effort is another important issue in fruit crop industry, which could potentially be achieved by segregating the orchards into clusters of trees with similar crop vigour or normalized difference vegetation index (NDVI) from WV3 imagery [36]. The aim of this paper is to evaluate WV3 imagery for the accurate forecasting of mango yield via the integration of tree crown area (TCA) and canopy reflectance properties of individual trees. The model was evaluated across three different mango orchards grown in the Acacia Hills region of the Northern Territory.
2. Materials and Methods
2.1. Study Area and Crop Status
The study was conducted in three commercial mango orchards in Acacia Hills, Northern Territory, Australia (Figure 1) for 2016–2017 and 2017–2018 seasons. The study area is located between longitudes 131.16°E and 131.19°E and latitudes 12.73°S and 12.76°S. The Acacia Hills region is characterized by a tropical climate with distinct ‘wet’ and ‘dry’ seasons. Mean annual rainfall is approximately 1435 mm (1980–2015) which mostly occurs during the wet season (November to April) and during these months humidity rises to over 80% daily. The dry season produces milder weather conditions with a low probability of rainfall and maximum humidity of 67–70% daily. The mean maximum temperature is 34.1°C, which does not vary greatly between the seasons with the maximum daily temperatures ranging between 31.3°C (June) and 37.5°C (October) (1980–2015) [49].
Acacia Hills is within the Greater Darwin Region which boasts ~ 50% of the NT mango production, with greater than 3,000 ha of mango. The trees in orchard 1, 2 and 3 were planted in 2011, 2010 and 2008 respectively on 3 × 8 m spacing. All orchards are commercially owned and managed. Flowering occurs between May to July and harvesting commences between September to late November. To facilitate orchard access, spraying, harvesting and other field operations, and to enhance light interception, trees in each orchard are mechanically pruned, a process that generally occurs postharvest in December each year. The orchards are irrigated using standard sprinkler irrigation system that supply 70 litre·hr−1. The trees receive 4–5 hours of water about 2 to 3 times per week in the dry season following flower initiation (approximately late April) through to fruit harvest (typically October).
2.2. Multispectral Remote Sensing Data
For this study, WV3 imagery (Digital Globe®) were captured on 23 October 2016 and 11 September 2017 over Acacia Hills to coincide with the fruit development stage (Stage 7) [50] of mango. WV3 imagery provides eight spectral bands at 1.24 m resolution in the spectral ranges of 397–454 nm (Coastal blue), 445–517 nm (Blue), 507–586 nm (Green), 580–629 nm (Yellow), 626–696 nm (Red), 698–749 nm (Red edge), 765–899 nm (NIR1) and 857-1039 nm (NIR2) and one panchromatic band (450–800 nm) at 0.31 m resolution [51]. Further details about the WV3 sensor is described on the website (https://www.digitalglobe.com/about/our-constellation) and in Kuester [52]. All imagery were acquired under cloud-free conditions and ‘at- sensor’ pixel digital numbers were converted to ‘Top of Atmosphere’ (TOA) spectral reflectance following the equation described in Kuester [52] and projected to WGS-84 UTM Zone 52S. The pan-sharpened WV3 imagery were sourced from Digital Globe® (https://www.digitalglobe.com/about/our-constellation). The panchromatic swaths were orthorectified using rational polynomial coefficients (RPCs) without XY control and the Shuttle Radar Topography Mission (SRTM) DEM resampled to 5m for Z control; tie points also collected on the overlap regions; processing performed in PCI GXL using cubic convolution resampling.
2.3. Sampling Trees
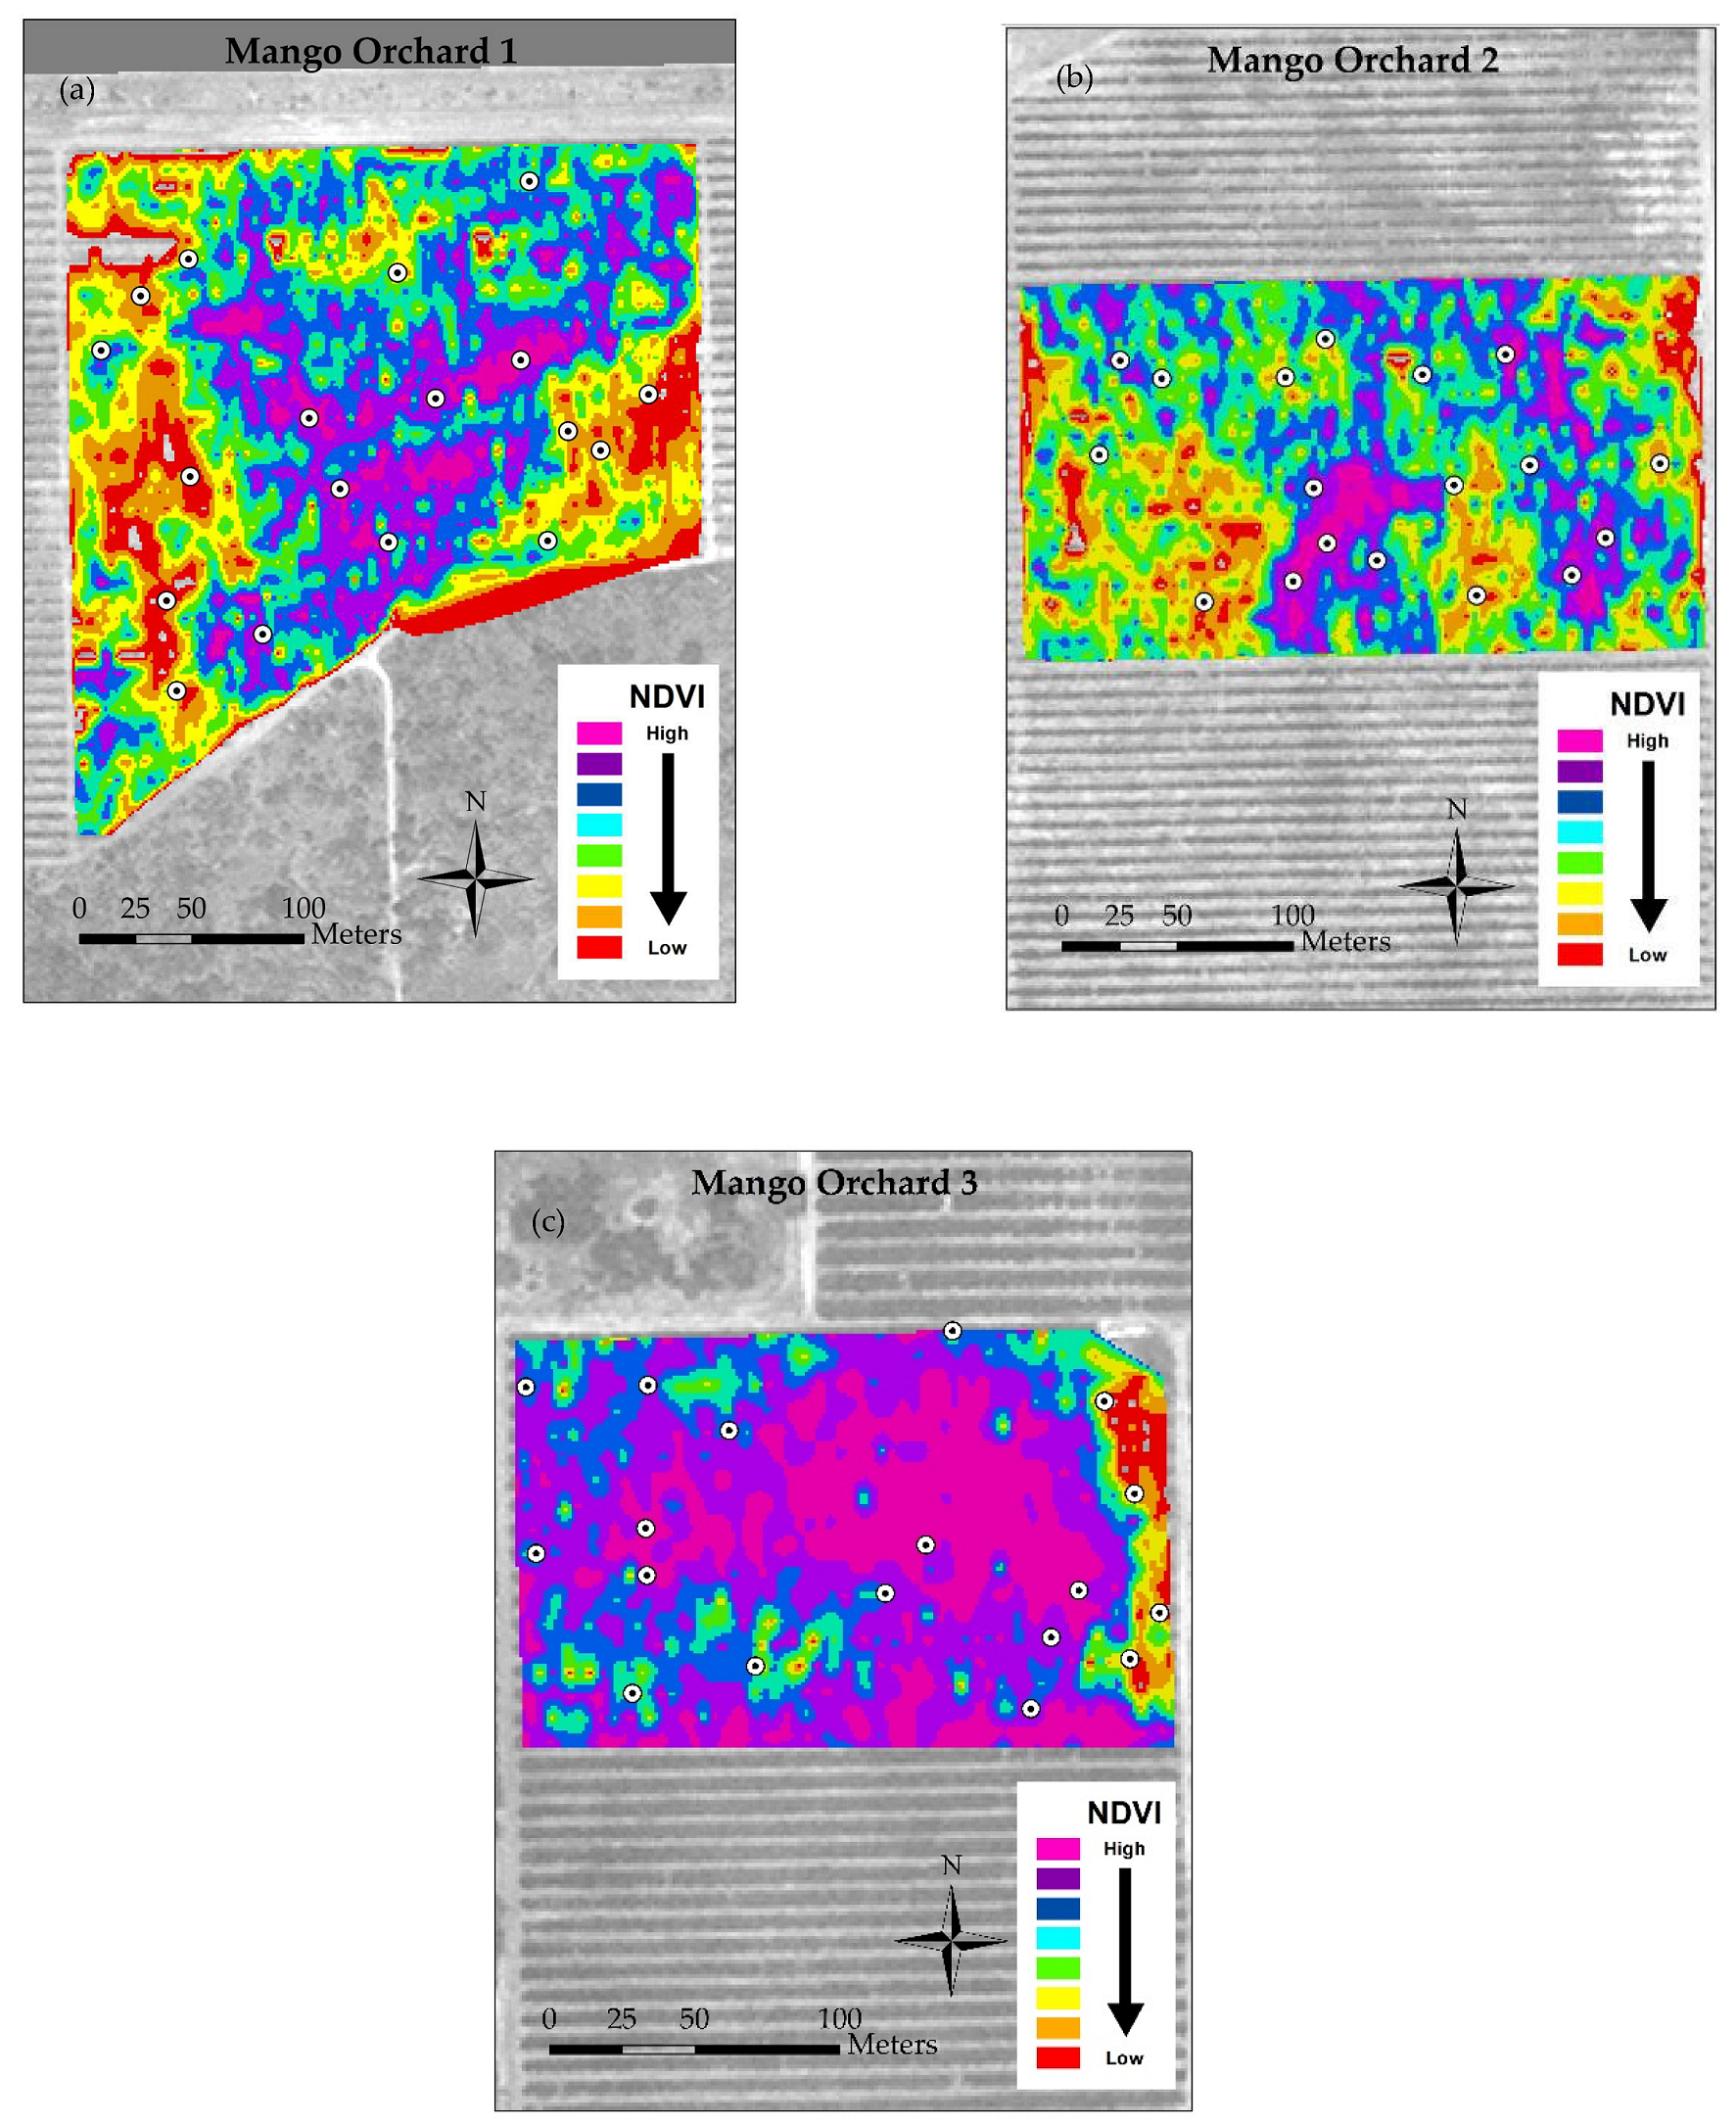
From the multispectral WV3 imagery, a Normalised Difference Vegetation Index (NDVI = (NIR1 − Red)/(NIR1 + Red)) was derived, followed by an unsupervised classification of the IsoData (eight classes) for each selected orchard (Figure 2). The rationale behind the eight classes was to separate the shadows and soil backgrounds from the tree canopy area and also to differentiate the variation in tree vigour (health and size) and consequently to guide where on-ground sampling is required to quantify the variablility in terms of yield and minimize the number of samples in each orchard [53]. Eighteen sampled trees (six replicate trees from high, medium and low NDVI regions) were selected from each orchard. The sampled tree locations were manually recorded by counting the row and tree number and also using a hand-held Trimble DGPS (Trimble, Sunnyvale, CA, USA). The exact centre of each sampled tree was also interpreted visually from the pan-sharpened WV3 imagery in ArcGIS to ensure the location of sampled tree on the imagery corresponded to that in the field.
2.4. Field Data Collection
The tree canopy diameter of 18 sampled trees were measured along the tree row and perpendicular to the tree row from vertical tree crown projection using a standard measuring tape. The average of two measured diameters (d) were used to calculate the area or TCA of each tree.
The manual harvesting of the 18 sampled trees occurred about two weeks prior to the commercial harvesting. All harvested fruit were counted and weighed providing a total number of fruit per tree and total yield per tree (kg·tree−1).
2.5. Extraction of Spectral Data and Tree Crown Area (TCA)
The point data of each sampled tree location recorded by DGPS was overlayed onto the pan-sharpened WV3 imagery using ArcGIS 10.4 (Environmental Systems Research Institute. Redlands, CA, USA). A 1.5 m radius buffer area (7.07 m2) was applied around each point, as this ensured pixels outside the average canopy area were not included. The points were adjusted to exclude shadows or non-canopy related understory, if present within 1.5 m radius buffer zone of any point. An open source software ‘Starspan GUI’ (available at: https://github.com/Ecotrust/starspan) [54] was used to extract the 8 band spectral information for each tree canopy area of interest (AOI) from the non-pan-sharpened multispectral imagery. From the extracted data, 18 structural and pigment based VIs specific to crop biomass and yield parameters were derived and regressed against total fruit weight (kg·tree−1) and fruit number. The name of VIs are NDVI red-edge, TCARI, SIPI, CB SIPI, R/RENDVI, R/N2NDVI, GNDVI, MSR, RVI, N1NDVI, N2NDVI, RENDVI1, RENDVI2, RDVI1, RDVI2, TDVI1, TDVI2 and NLI. The detailed of the 18 VIs can be found in previous work elsewhere [36]. The VI with highest coefficient of determination and lowest root mean squares error (RMSE) to the measured parameter was identified for each orchard.
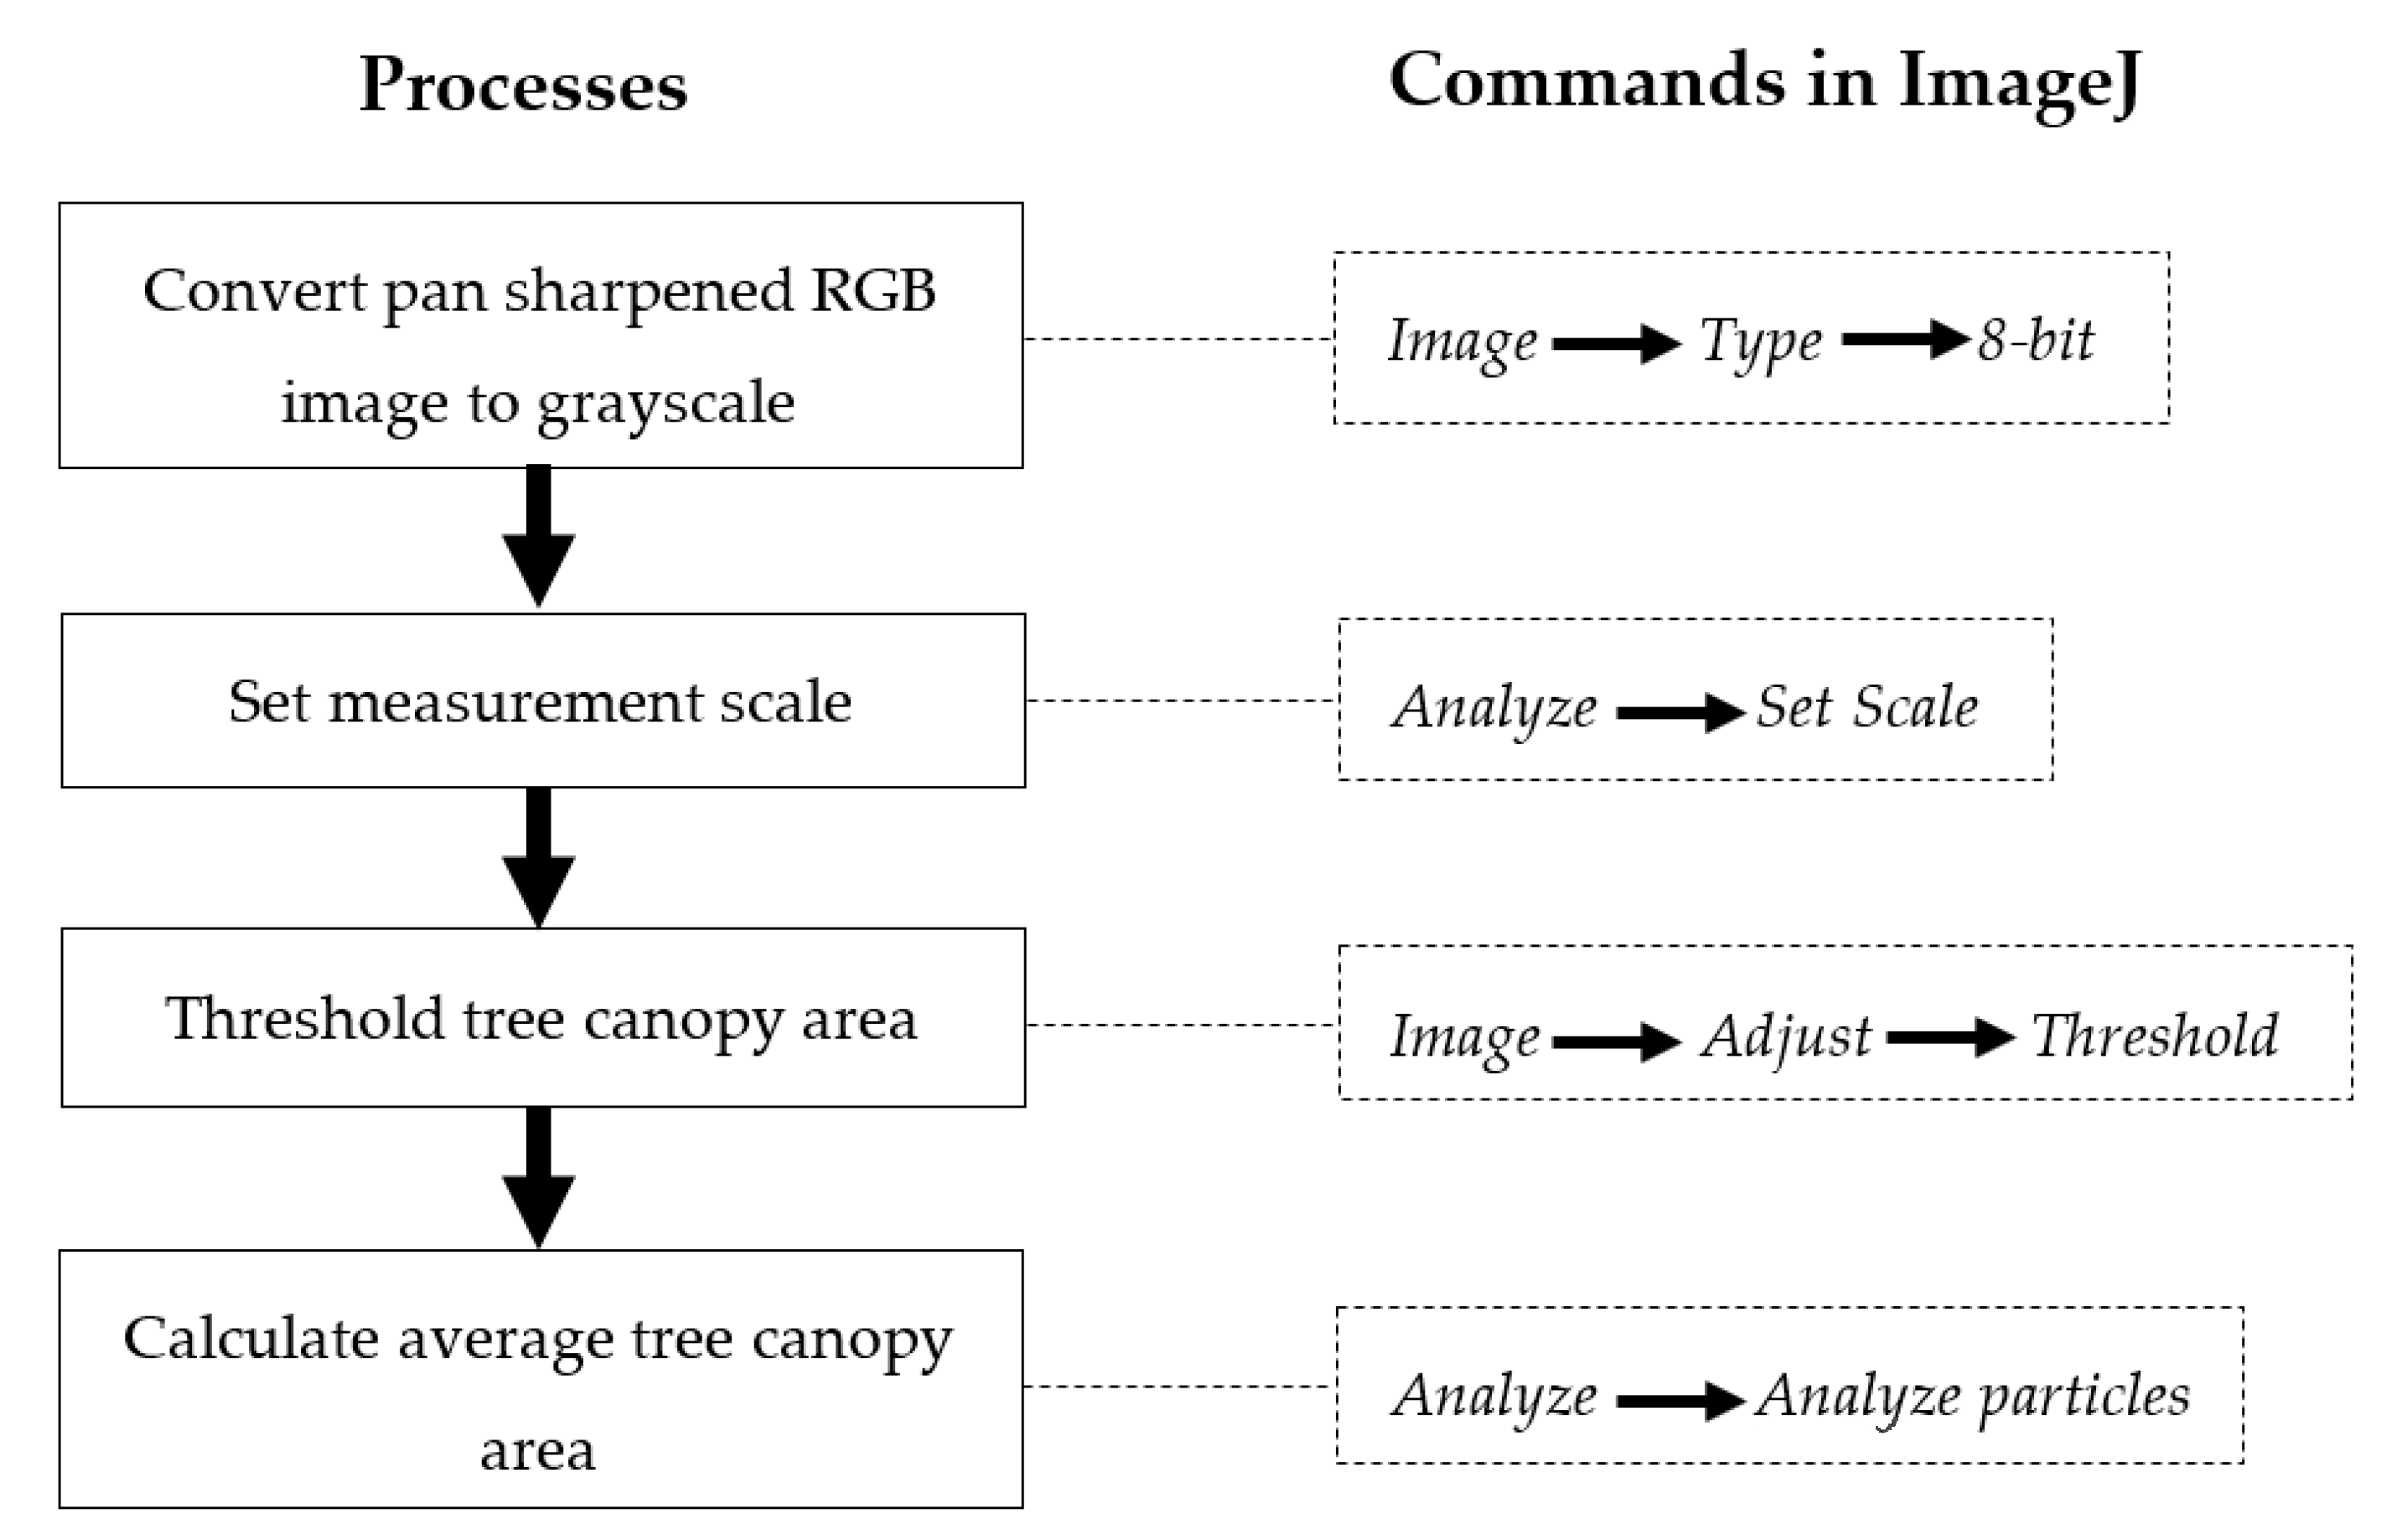
With the high resolution (0.31 m) pan-sharpened WV3 imagery, tree crown area (TCA) delineation method was also applied to mango orchards in Acacia Hills, Northern Territory. The tree crown area of each sampled tree was determined manually by onscreen digitization/segmentation of the canopies in ArcGIS 10.4. The open access image processing software (ImageJ; http://rsbweb.nih.gov/ij/) was used to develop a process (Figure 3) for extracting average TCA from whole orchard. Thresholding approach was applied for the segmentation of TCA. The processes and the commands followed in ImageJ software to extract TCA on individual tree level was shown in Figure 3. However, in some cases when the effect of shadows and background noise is too high to allow image processing, pre-segmentation processing was applied using another open access image editing software (GIMP 2.10.6; http://www.gimp.org) to clearly visualize the tree canopy.
2.6. Machine Learning Algorithms and Other Data Analysis Techniques
Simple linear machine learning (ML) algorithm was applied to develop regression model between field measured TCA and pan-sharpened WV3 derived TCA. The data were splitted into training and test set as 3:1 ratio and validated using test set.
To develop regression models of total yield per tree (kg·tree−1) and fruit number per tree with 18 VIs combined with TCA data, ANN analysis was performed in R 3.5.0 statistical software [55]. The packages used for the analysis were ‘caTools’ [56] (splitting data into training and test set), ‘neuralnet’ [57] and ‘H2O [58] (parameter tuning and ANN analysis). The data were splitted into training and test set as 7:3 ratio. The ANN algorithm adopted in this study was a nonlinear layered feed forward model with standard back propagation, which uses an iterative gradient descent training procedure [59]. The neurons selected for hidden layers were 10 in the first hidden layers and 5 in the second hidden layers, since it produced the highest accuracy in the model. The model was validated using the average spectral reflectance data extracted from the pixels of tree canopy within whole orchard.
A multivariate stepwise linear regression analysis technique was applied to select optimal number of VIs out of eighteen and then biplot was applied to visualize the relationship among yield parameters and VIs, to determine the best VIs out of eighteen to generate yield (kg·tree−1) and fruit number maps using ArcGIS 10.4. Once identified, regression analysis was performed to determine the VI with strongest relationship with yield (kg·tree−1) and fruit number per tree using the statistical software R [55]. The RMSE was calculated using Equation (1) below.
The rationale behind the selection of only one VI out of 18 was to allow yield parameter maps of individual orchard to be derived and subsequently provided to the farmers for supporting logistical planning of their field operations [36]. Although more complex statistical methods such as partial least square regression (PLSR) has been used for identifying the optimal VIs in previous studies, Yi, et al. [60] reported that once the prediction model is simplified, selecting the most important variable did not perform differently to one another. To determine whether there is any significant difference between 2016–2017 and 2017–2018 growing seasons, Analysis of covariance (ANCOVA) was also performed in R [55].
2.7. Prediction of Orchard Level Yield and Generating Yield Maps
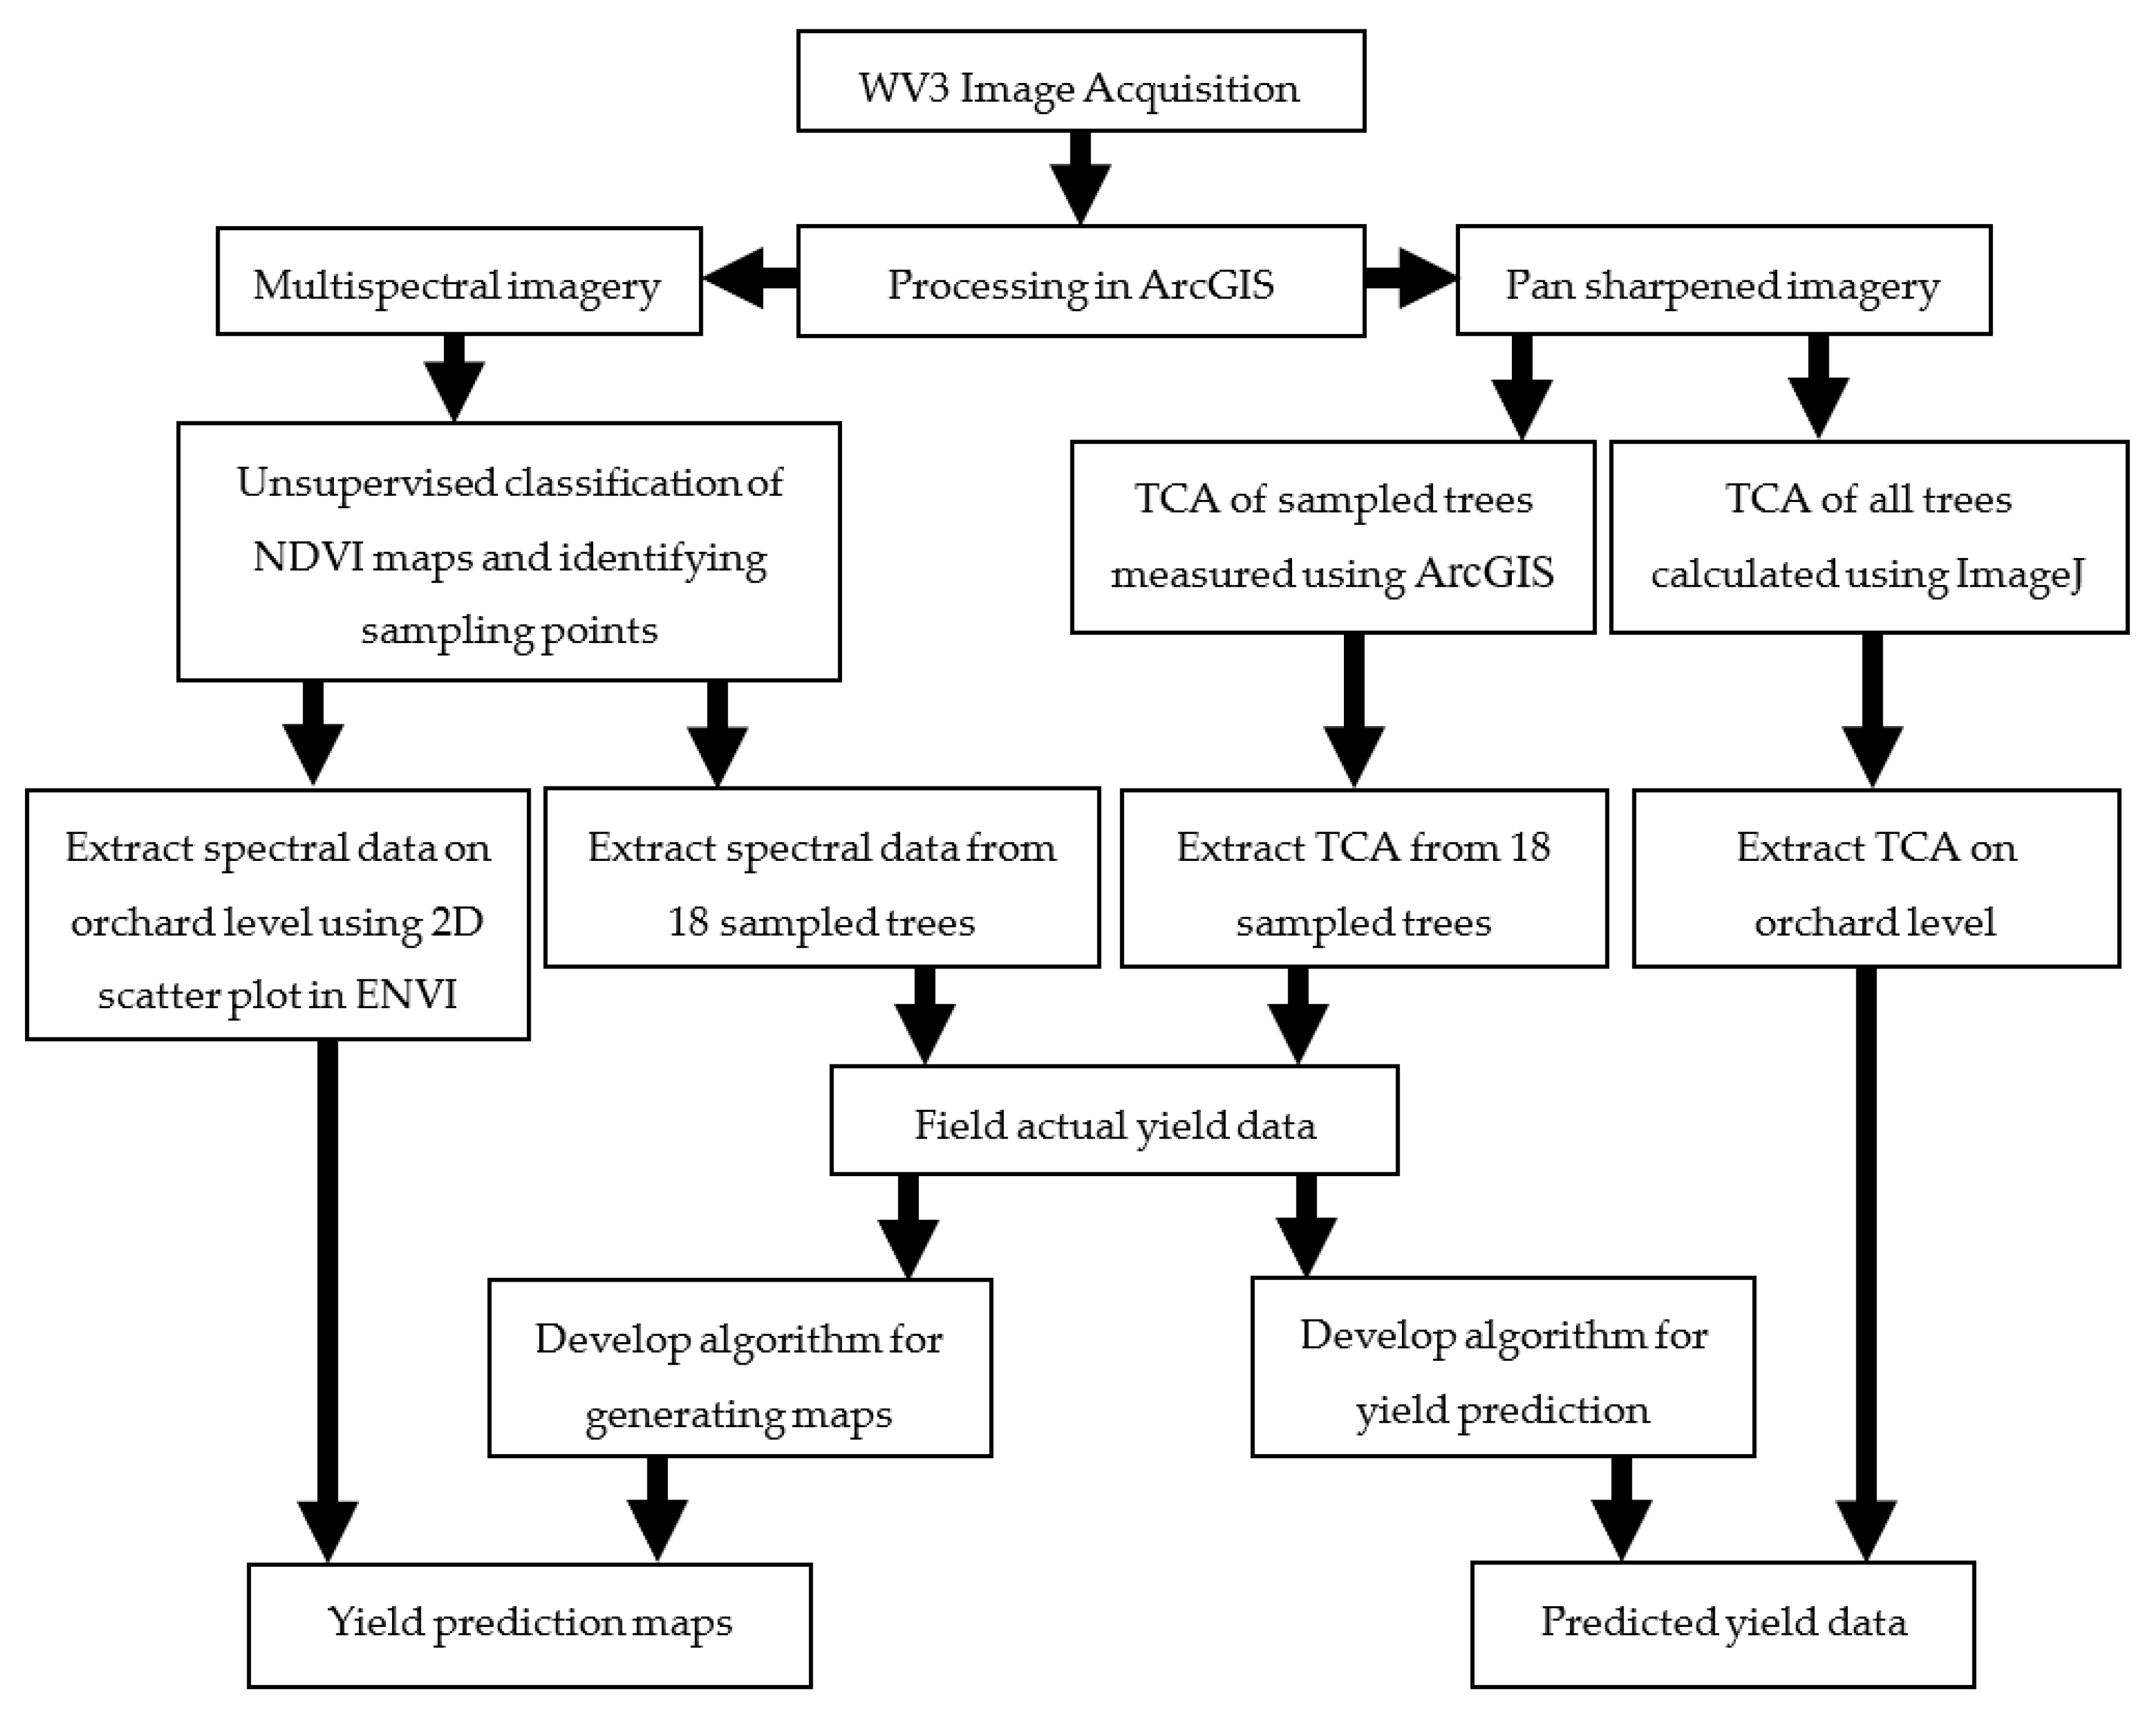
ANN algorithms derived from the relationships between the yield parameters of selected 18 trees and the combined VIs with the TCA data for each orchard were applied to all trees growing within the respective orchards. The pixels specific to the tree canopies only were selected, whilst all other non-canopy related pixel information (i.e., inter-row vegetation, soil, shading etc.) were removed. To achieve this a 2D scatter plot (Red versus NIR1) was created using 2D scatter tool in ENVI version 5.4 (Exelis Visual Information Slutions, Boulder, Colorado). The average TCA for each orchard was calculated using the ImageJ software. The algorithm developed using ANN between the yield parameter and the combined VIs and TCA data for each respective orchard was then applied to the average pixels value and average TCA for all trees to calculate the units of the respective yield parameter. The process used is described in the Flowchart below (Figure 4). The tree numbers per orchard and the area of each orchard were provided by the corresponding growers.
For the derivation of yield maps for each individual orchard, all canopy specific pixels were converted into the optimal VI map and then converted into the units of respective yield parameters using band math function in ENVI version 5.4 (Exelis Visual Information Slutions, Boulder, Colorado).
3. Results
3.1. VIs for Estimating Yield Parameters
A multivariate stepwise regression analysis and biplot was applied to determine the best VIs out of eighteen. The results of all orchards and the individual orchards for two years are presented in Table 1. The regression analysis was performed to determine the VI with highest coefficient of determination (R2) for each orchard across two years and for all three orchards in all years. NDVI red-edge produced highest correlation for all orchards using all years data with R2 = 0.26 for total fruit weight (kg·tree−1) and R2 = 0.30 for total fruit numbers. In general, when each orchard was analysed separately, they produced higher R2 values. For orchard 1, RDVI2 identified as the VI with highest correlation (R2 = 0.60 and 0.63 for total fruit weight (kg·tree−1) and fruit number respectively) and for orchard 2, RDVI1 showed highest correlation (R2 = 0.62 for total fruit weight (kg·tree−1) and R2 = 0.63 for fruit number respectively). For orchard 3, R/N2NDVI produced highest correlation (R2 = 0.56) with fruit weight (kg·tree−1) and SIPI showed highest correlation (R2 = 0.60). Overall different VIs performed better in different orchards mainly due to the difference in age of trees and management practices (i.e. irrigation, pruning, fertilizer application etc.), which leads to the variation of spectral reflectance characteristics in the tree canopy of different orchards.
3.2. Measurement of TCA
The simple linear ML algorithm was developed to determine the relationship between field measured TCA and pan-sharpened WV3 delineated TCA for three NT mango orchards in 2016–17 and 2017–18 growing seasons. The correlation of test set data (n = 36) is shown in Figure 5. A strong correlation was achieved with R2 = 0.92 and RMSE = 1.3 m2. The slight offset of the linear relationship, compared to the 1:1 line indicated that the TCA measured from small trees were underestimated and the large trees were overestimated, a result that may be attributed to the influence of shadows and soil backgrounds.
3.3. Models of Yield Parameters with combined VIs and TCA
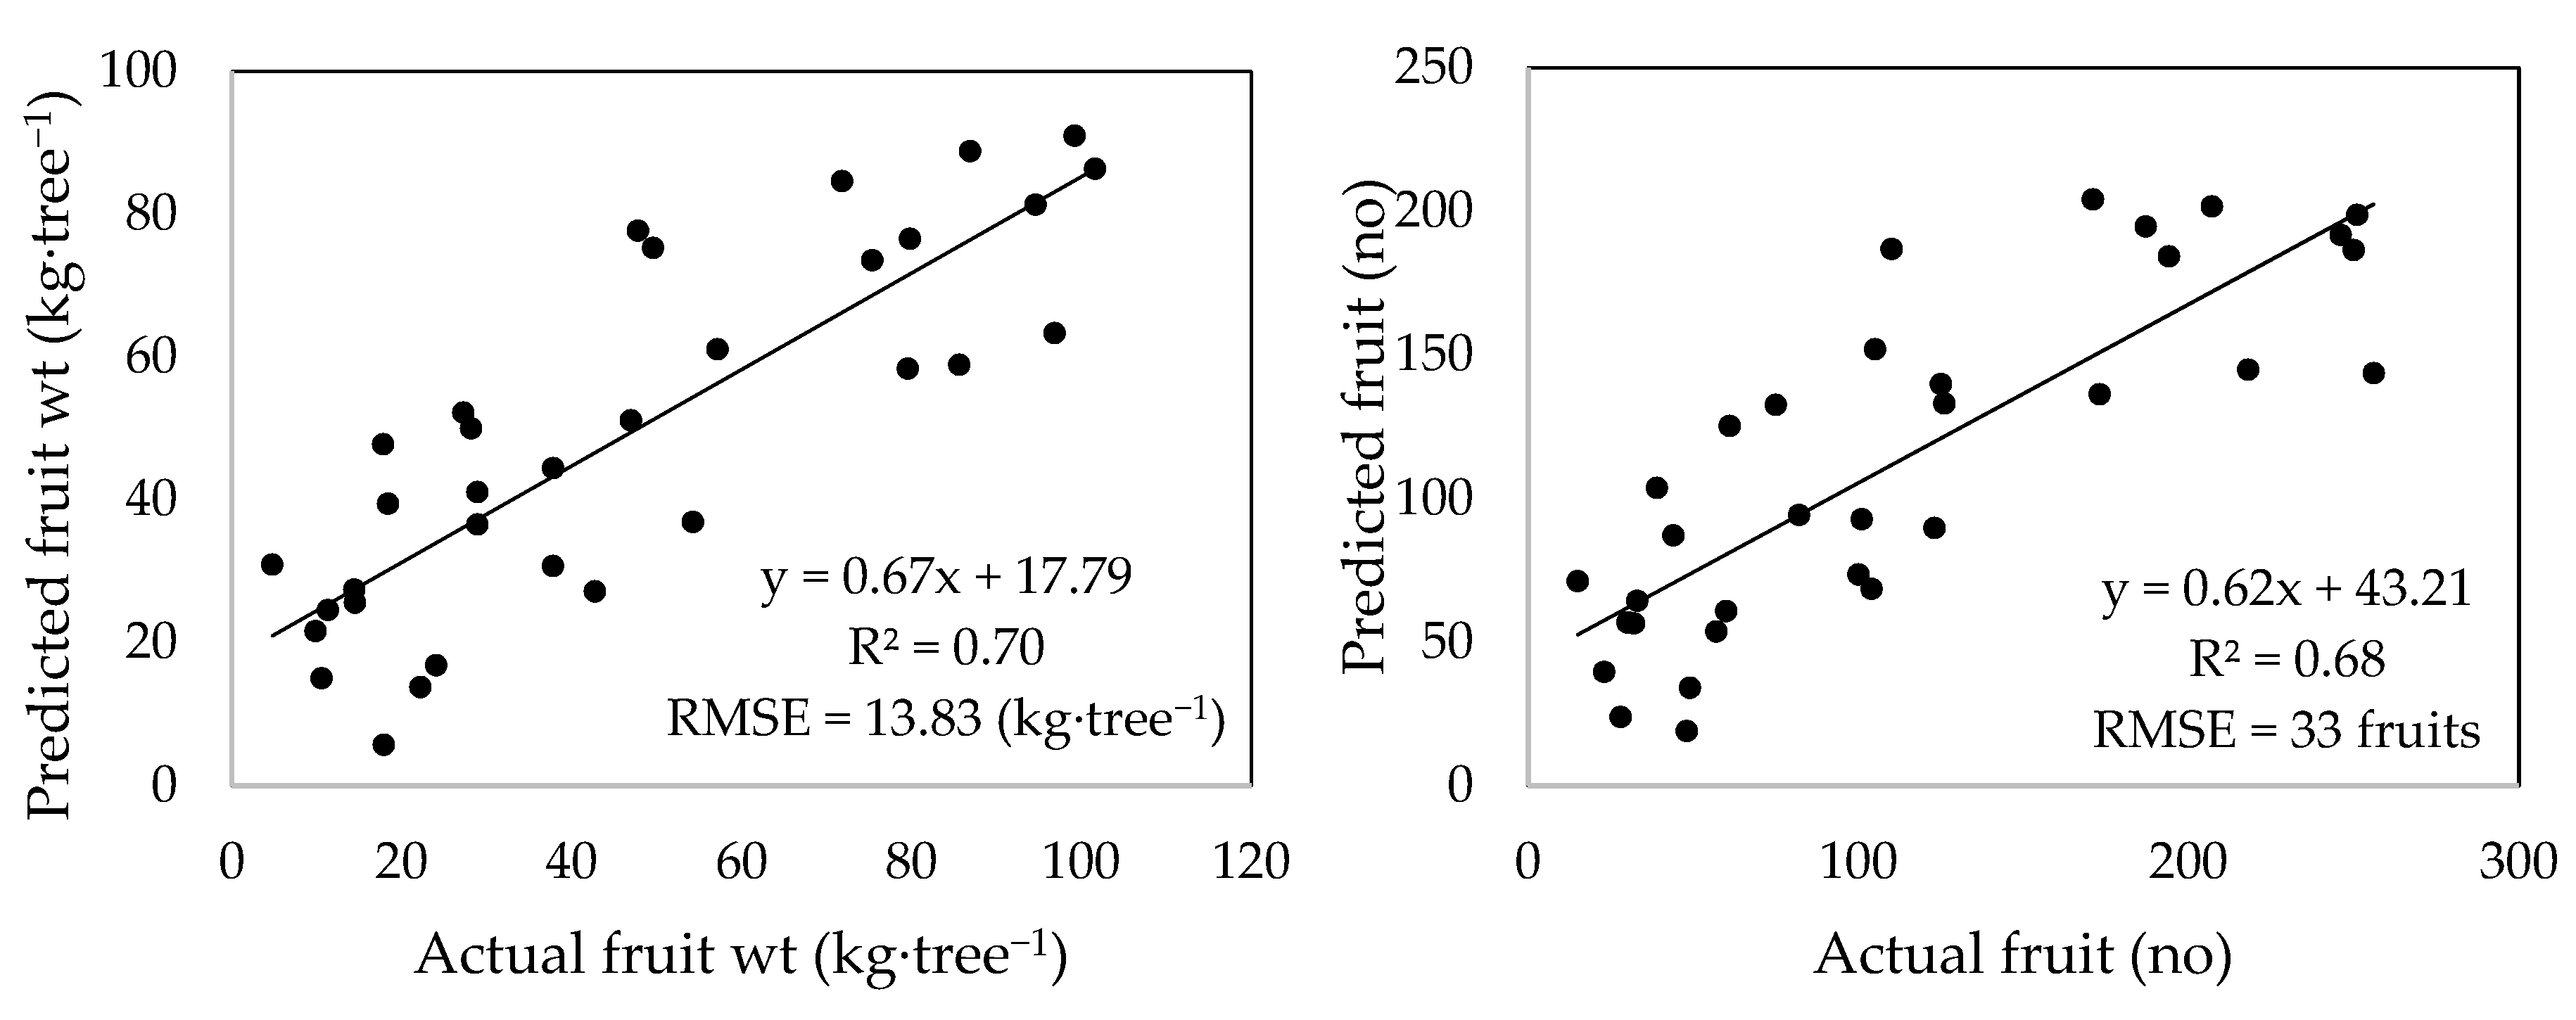
By combining TCA with VIs in ANN model a strong correlation was achieved for both total fruit weight (R2 = 0.91, RMSE = 8.8 (kg·tree−1)) and total fruit number per tree (R2 = 0.96, RMSE = 17 fruits) using training set data (n = 75). In Figure 6, the test set data from 3 orchards for 2 years were presented (n = 33). The correlation achieved using test set data for total fruit weight (kg·tree−1) was R2 = 0.70 with RMSE = 13.83 kg·tree−1 and for total fruit number was R2 = 0.68 with RMSE = 33 fruits only. ANCOVA analysis was also performed between 2016–17 and 2017–18 growing seasons, which showed no significant difference between the slopes and intercepts of total fruit weight (kg·tree−1) (F-value = 0.02 and p = 0.89 for slopes and F-value = 1.10 and p = 0.3 for intercepts respectively) and fruit number (F-value = 1.08 and p = 0.30 for slopes and F-value = 1.58 and p = 0.20 for intercepts respectively). This indicates that a generalized liner model could be developed for these three mango orchards using more years of data.
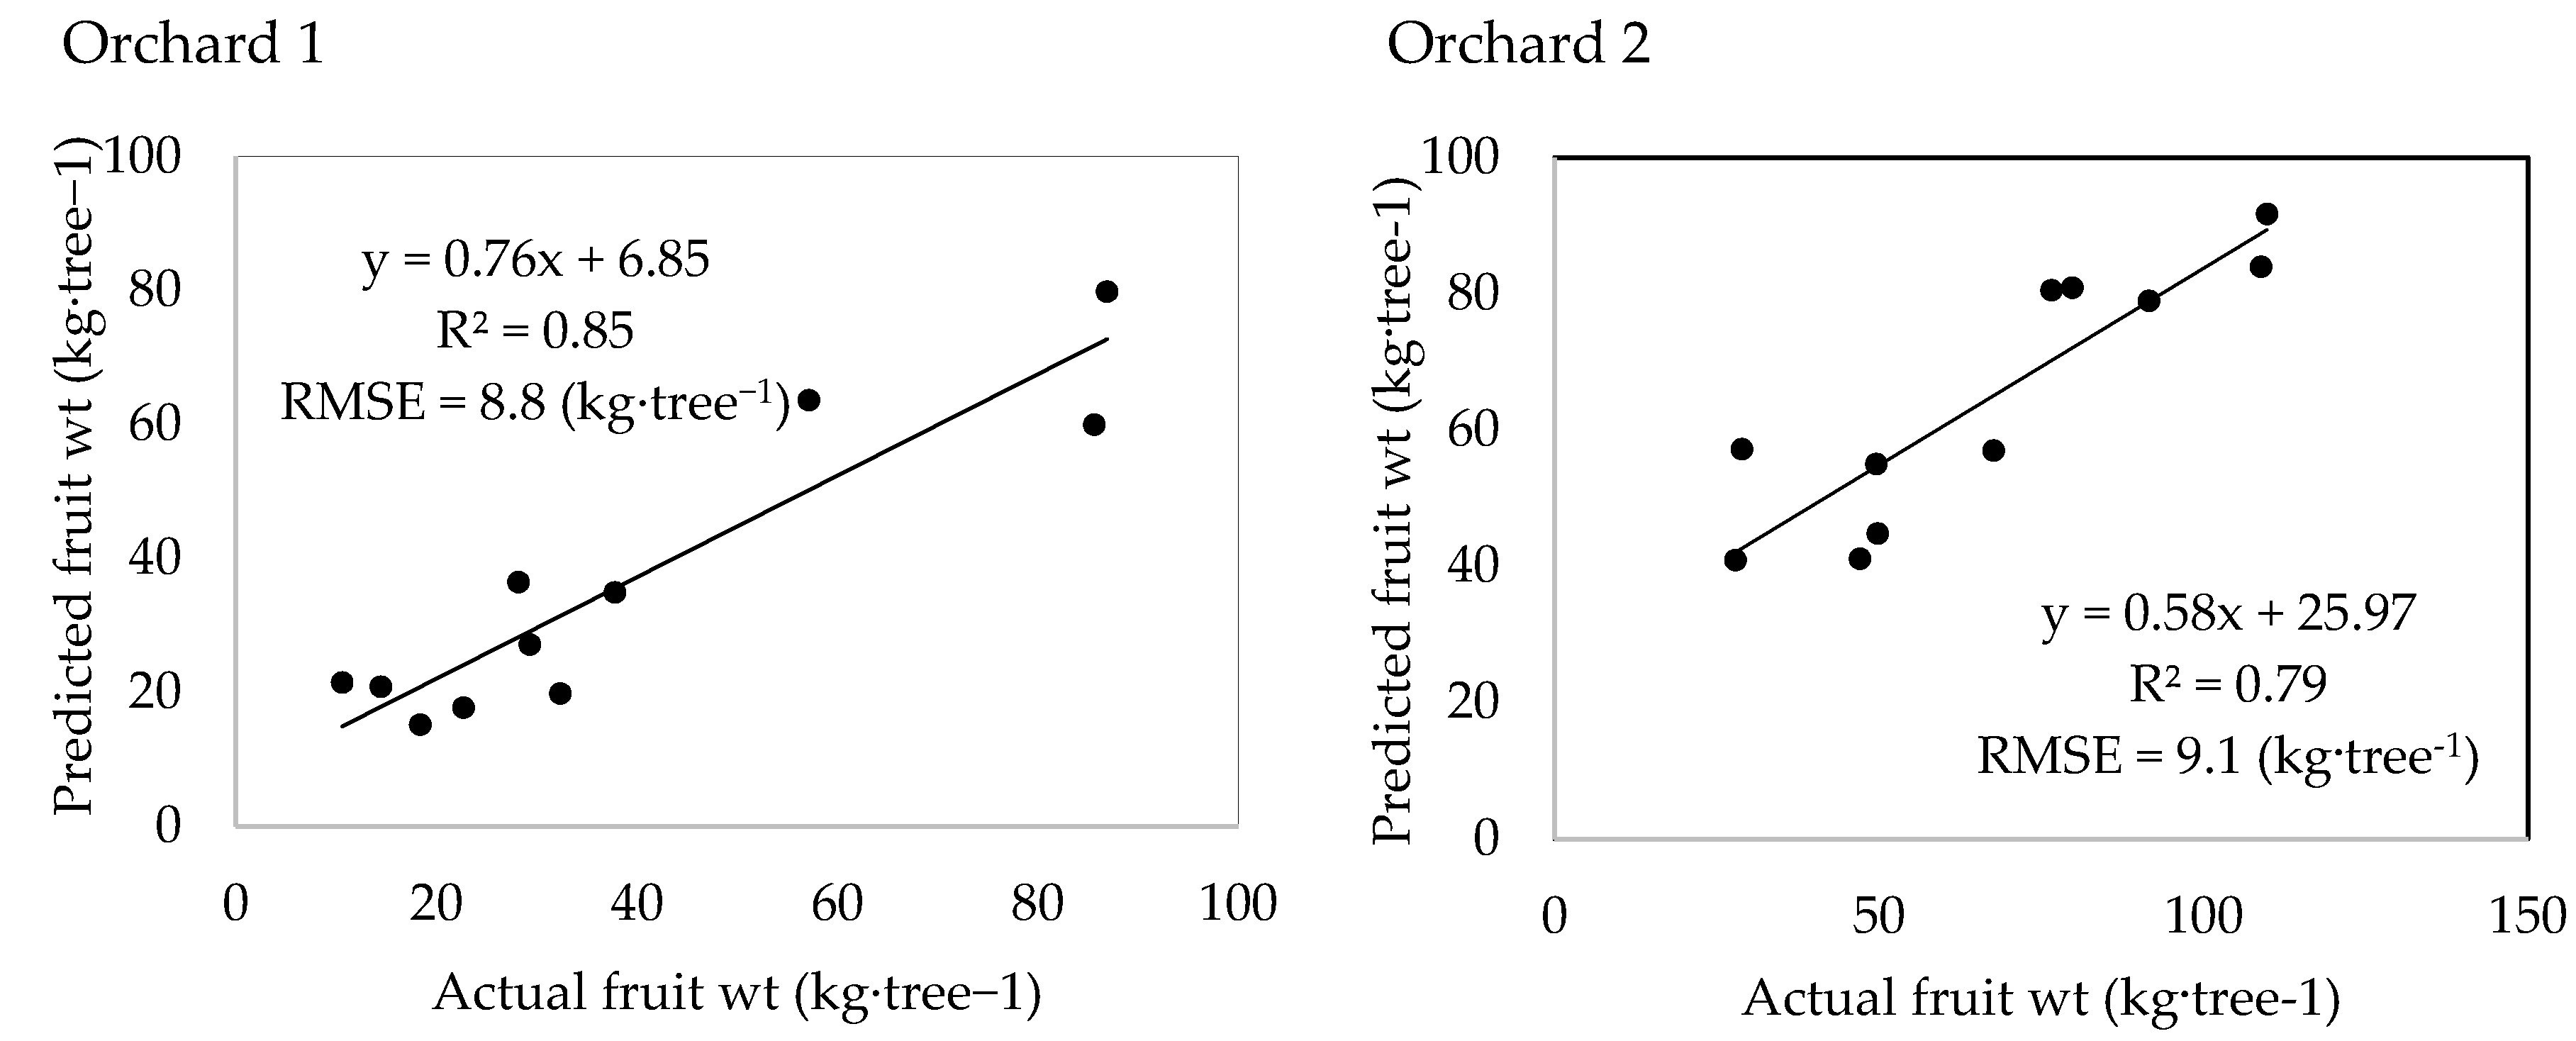
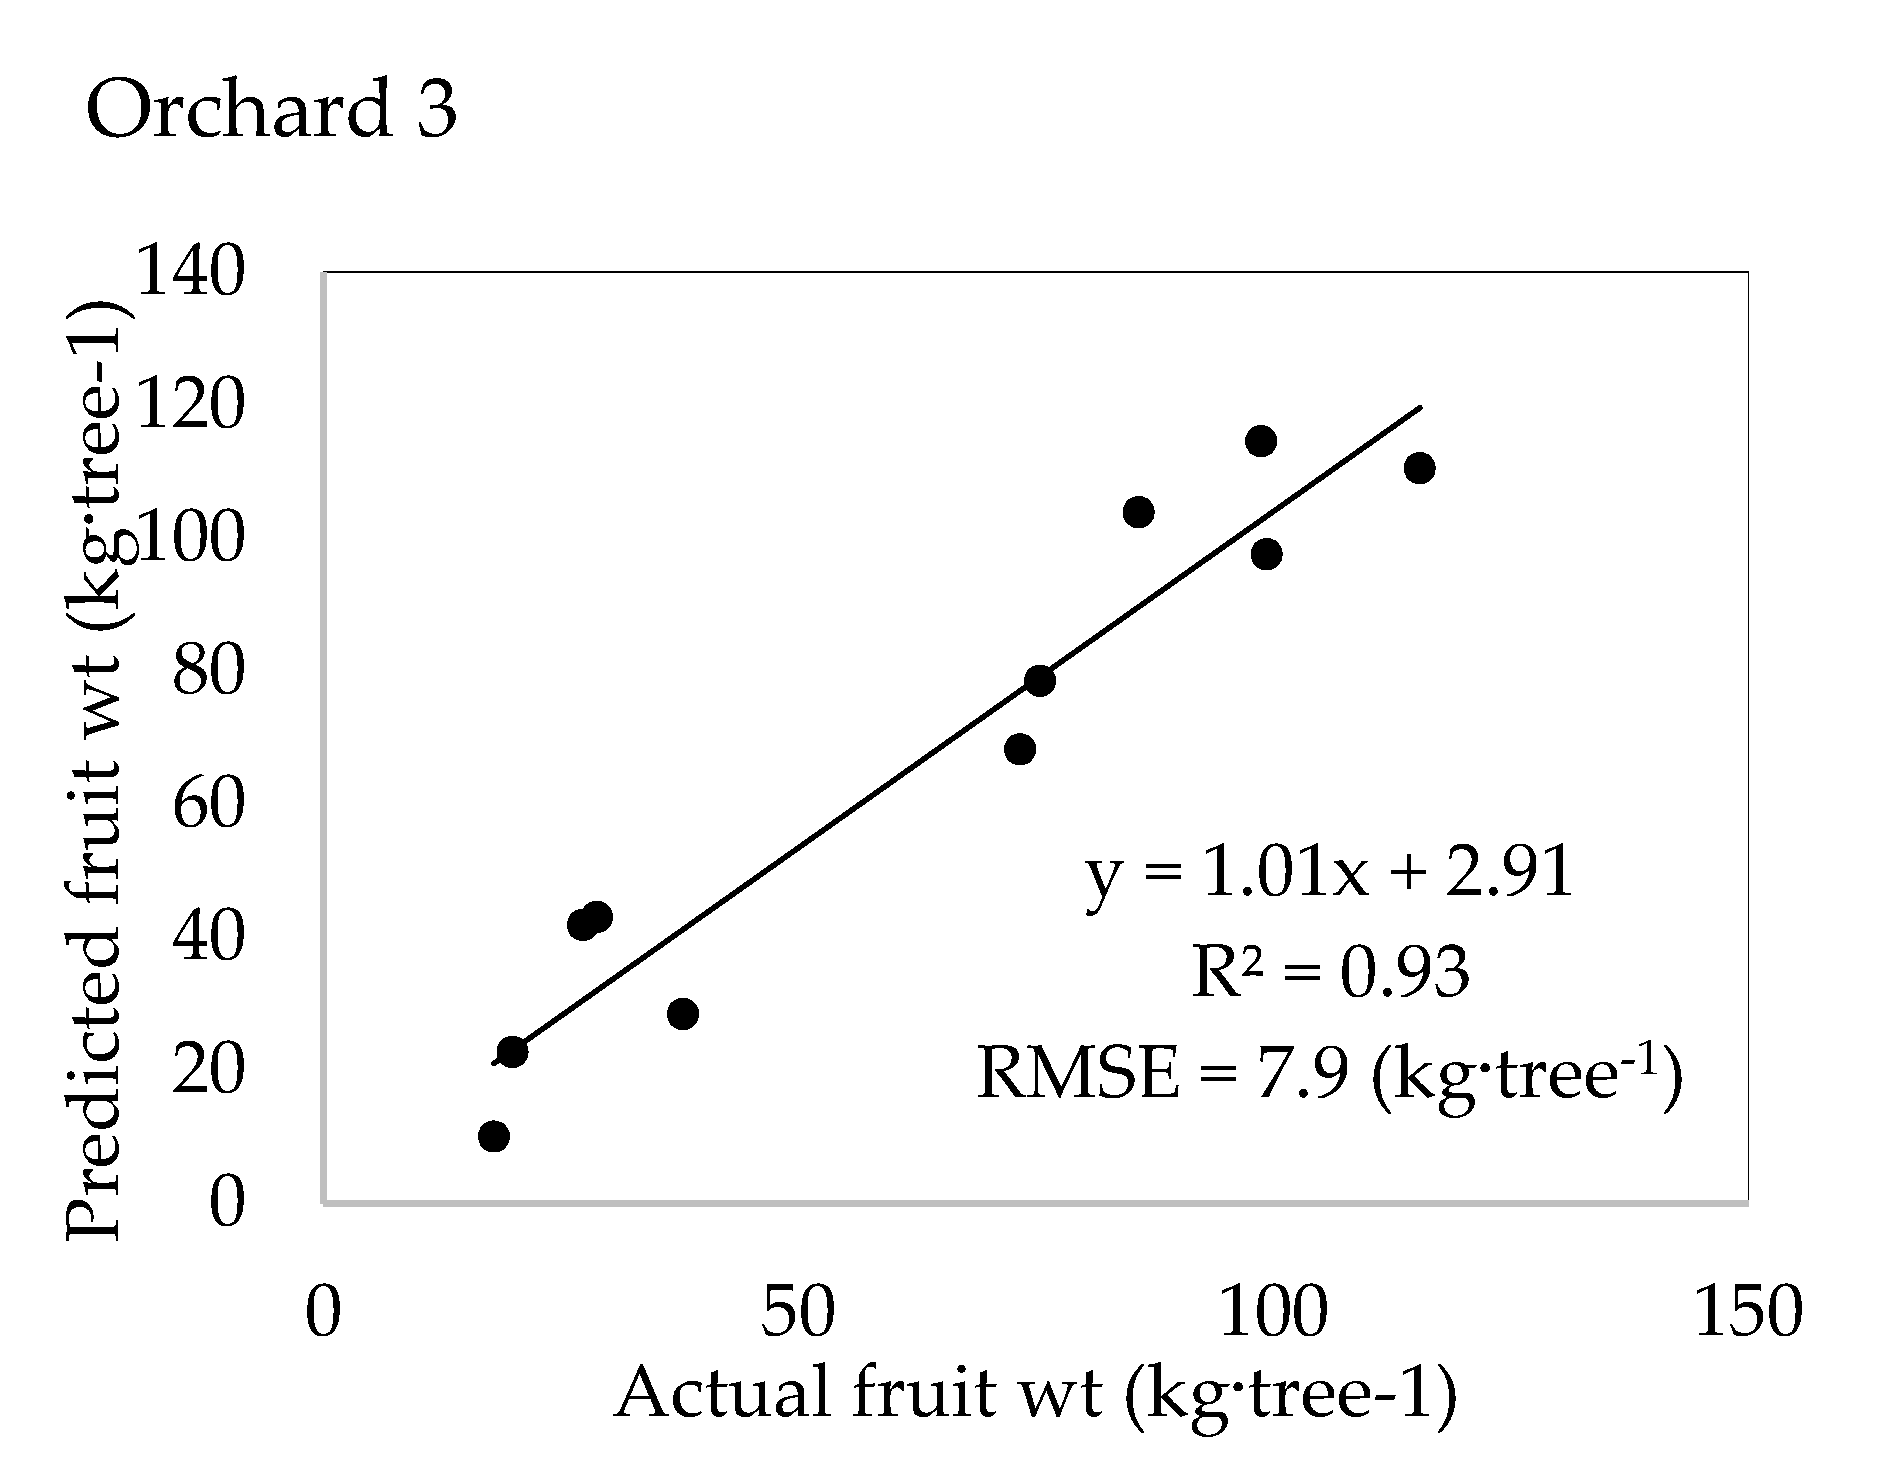
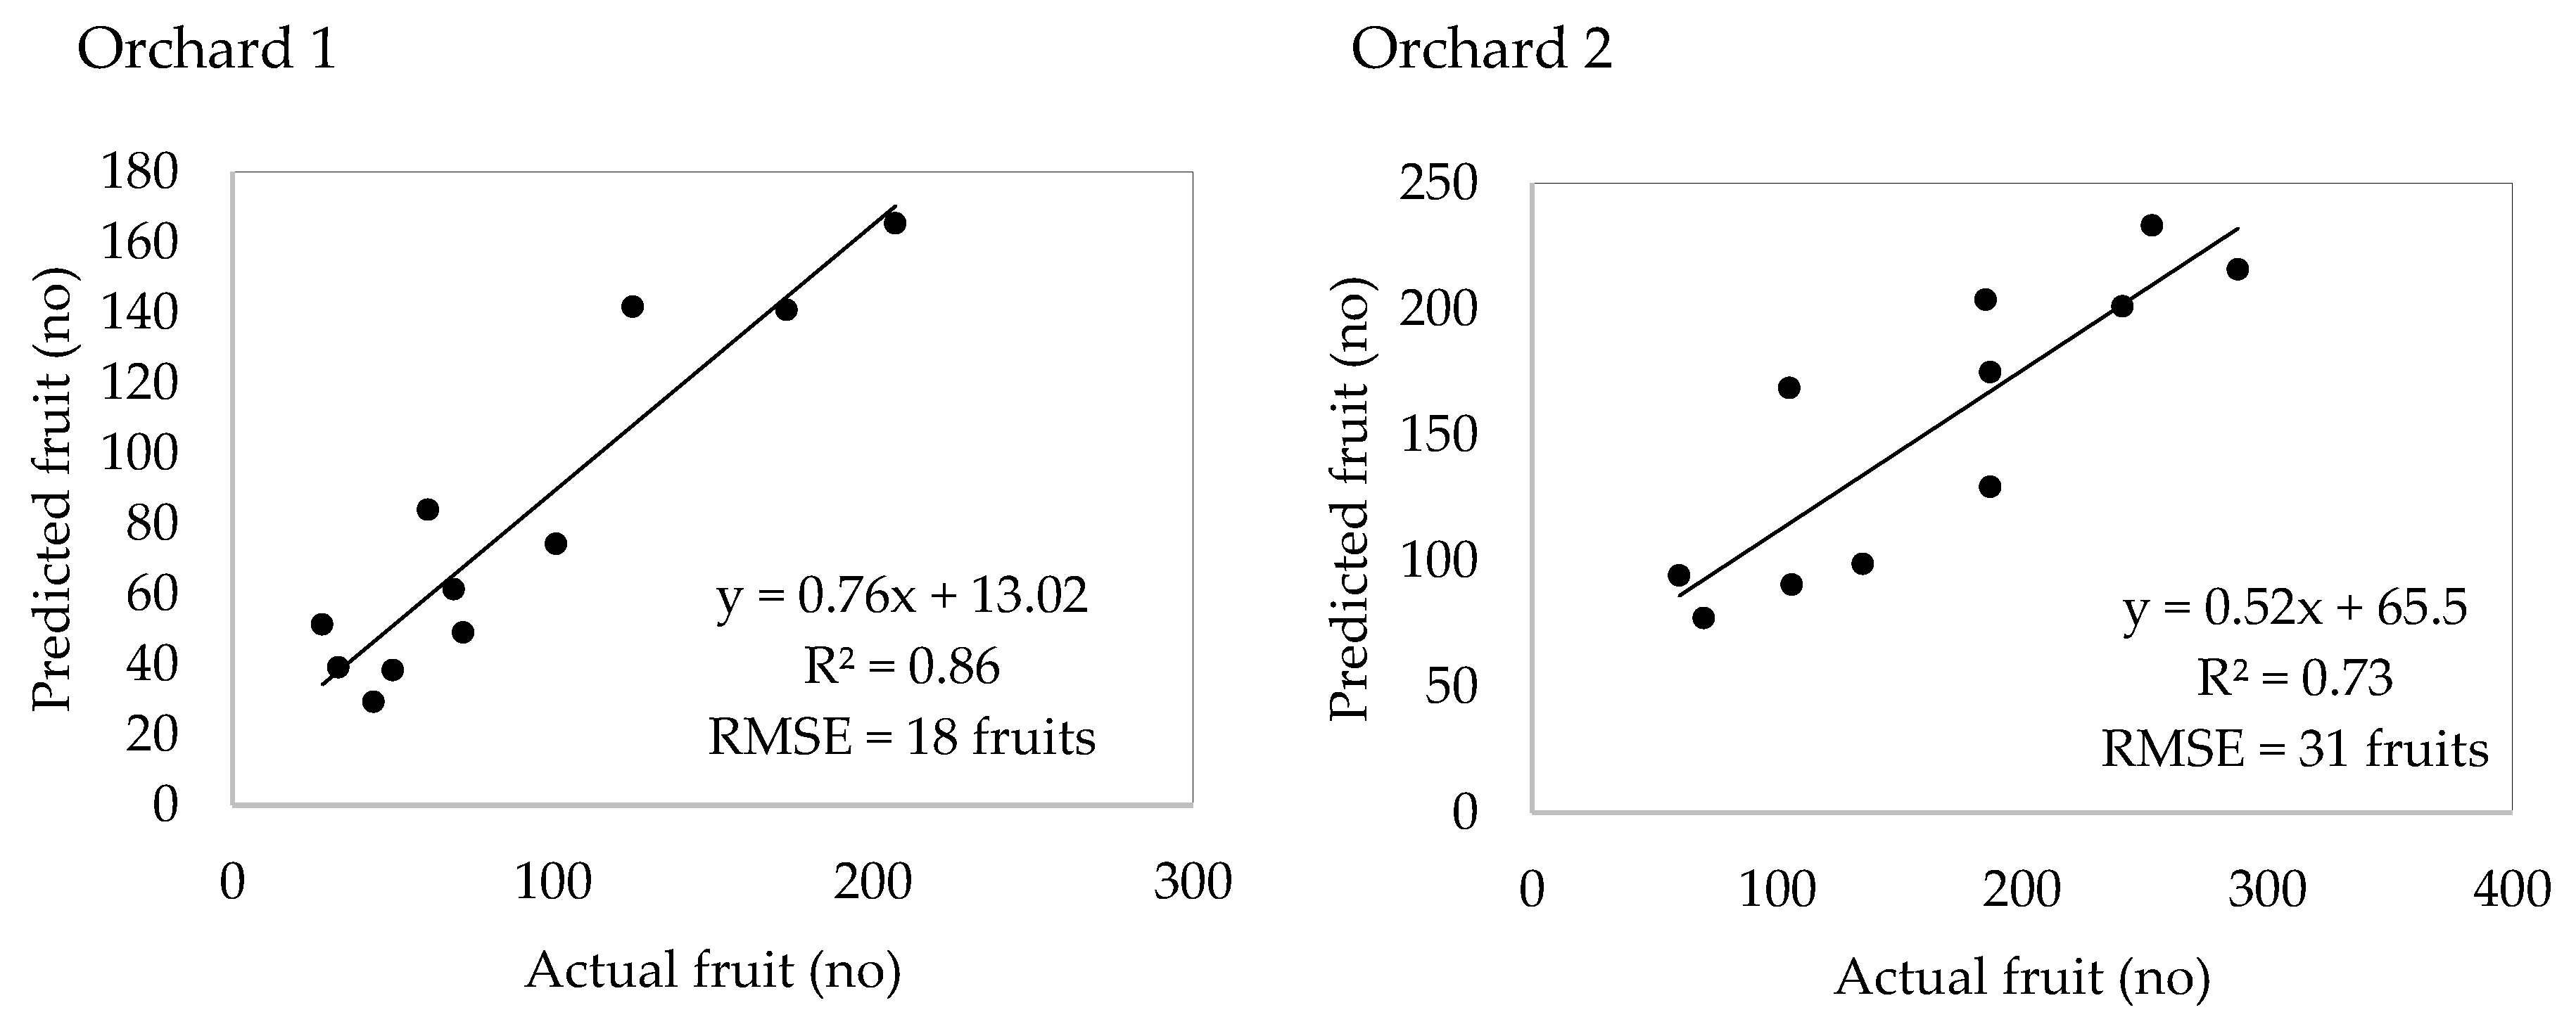
Scatter-plots identifying the relationship between actual and ANN model predicted fruit weight (kg·tree−1) for each individual tree for three different mango orchards in two growing seasons for test set data (n = 11) were provided in Figure 7. Whilst a good correlation was found for all three orchards across both sampled years (Figure 7), splitting the data into 2016–17 and 2017–18 as training and test set produced R2 = 0.57 with RMSE = 16.55 (kg·tree−1), R2 = 0.26 with RMSE = 58.6 (kg·tree−1), R2 = 0.27 with RMSE = 47.6 (kg·tree−1) for orchard 1, 2 and 3 respectively. Splitting the data of two growing seasons (2016–17 and 2017–2018) as training and test set, compared to combined two seasons data, clearly indicated an obvious influence of growing location and seasonal variation on three orchards. The highest correlation was achieved in orchard 3 with R2 = 0.93 and RMSE = 7.9 kg·tree−1. In other orchards in two years period also a good correlation was observed with lowest R2 = 0.79 and RMSE = 9.1 kg·tree−1 in orchard 2. ANCOVA analysis for orchard 1 and orchard 3 showed a significant difference in both slopes and intercepts between two seasons (F = 10.5, p = 0.0028 for slopes and F = 10.9, p = 0.0024 for intercepts in orchard 1 and F = 51.4, p ≈ 0 for slopes and F = 5.72, p = 0.023 for intercepts in orchard 3 respectively). In orchard 2, there was no significant differences was found for slopes between two seasons (F = 0.09, p = 0.77) however, the difference in the intercepts (F = 16.7, p = 0.00026) was significant.
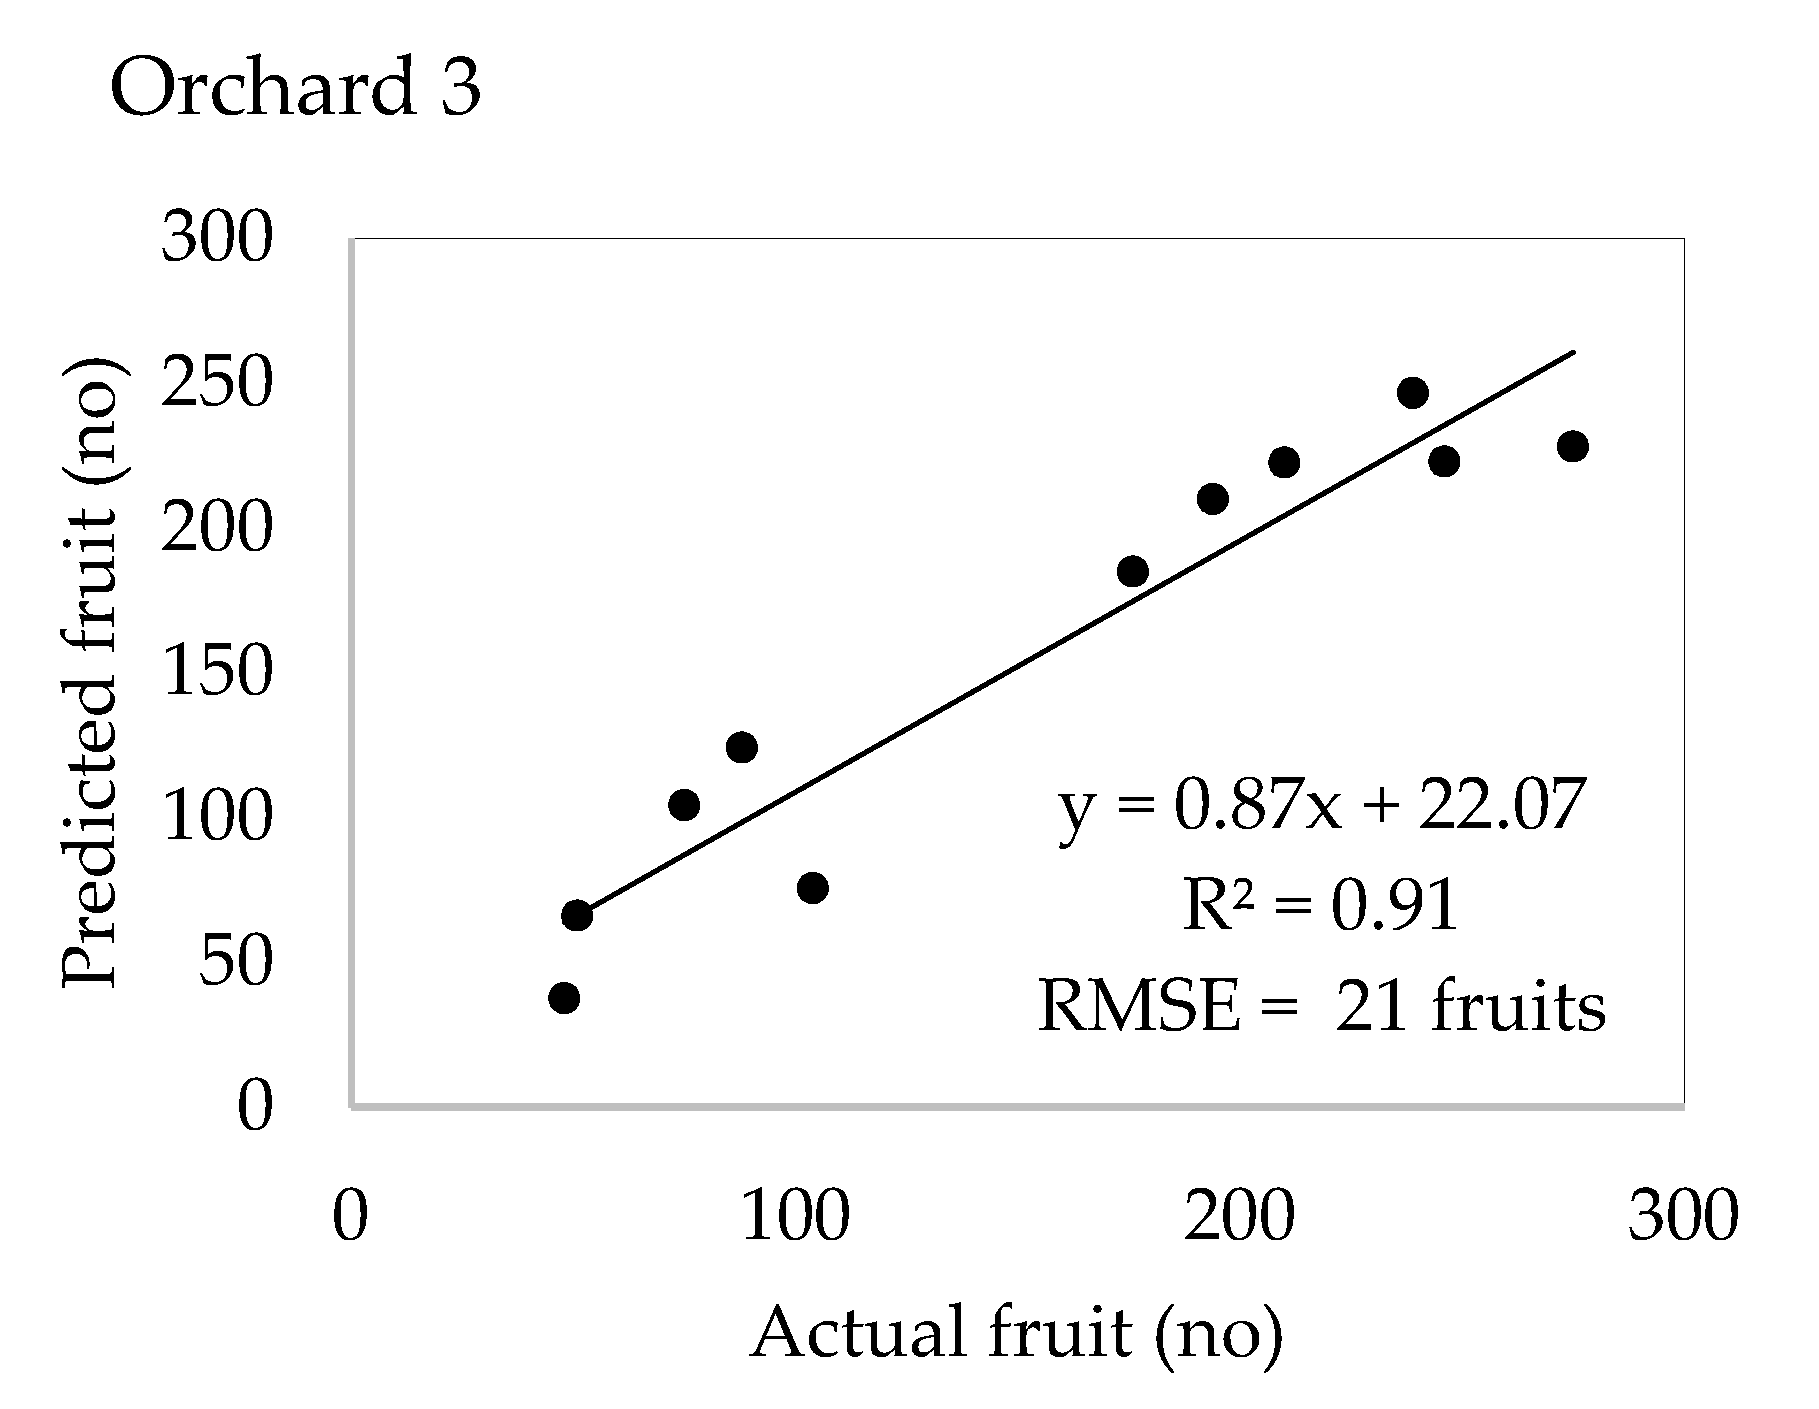
For total number of fruits, the scatter-plots between actual and ANN model predicted test set data (n = 11) were also derived for three different mango orchards in two growing seasons (Figure 8). A strong correlation was found for total fruit numbers in all three orchards across both years. Whilst a good correlation was found for all three orchards across both sampled years (Figure 7), splitting the data into 2016–2017 and 2017–2018 as training and test set produced R2 = 0.41 with RMSE = 53 fruits, R2 = 0.23 with RMSE = 69 fruits, R2 = 0.54 with RMSE = 48 fruits for orchard 1, 2 and 3 respectively. Splitting the data of two growing seasons (2016–17 and 2017–18) as training and test set, compared to combined two seasons data, again indicated an obvious influence of growing location and seasonal variation on three orchards. The highest correlation was achieved in orchard 3with R2 = 0.91 and RMSE = 21 fruits. In other orchards also, a good correlation was observed with lowest R2 = 0.73 and RMSE = 31 fruits in orchard 2. ANCOVA analysis for orchard 1 and orchard 3 showed a significant difference in both slopes and intercepts between two seasons (F = 11.8, p = 0.0016 for slopes and F = 12.4, p = 0.0013 for intercepts in orchard 1 and F = 26.7, p ≈ 0 for slopes and F = 7.02, p = 0.012 for intercepts in orchard 3 respectively). In orchard 2, there was no significant differences was found for slopes between two seasons (F = 0.05, p = 0.82) however, a significant difference was observed in the intercepts (F = 24.3, p ≈ 0).
3.4. Accuracy of Orchard Level Yield Maps
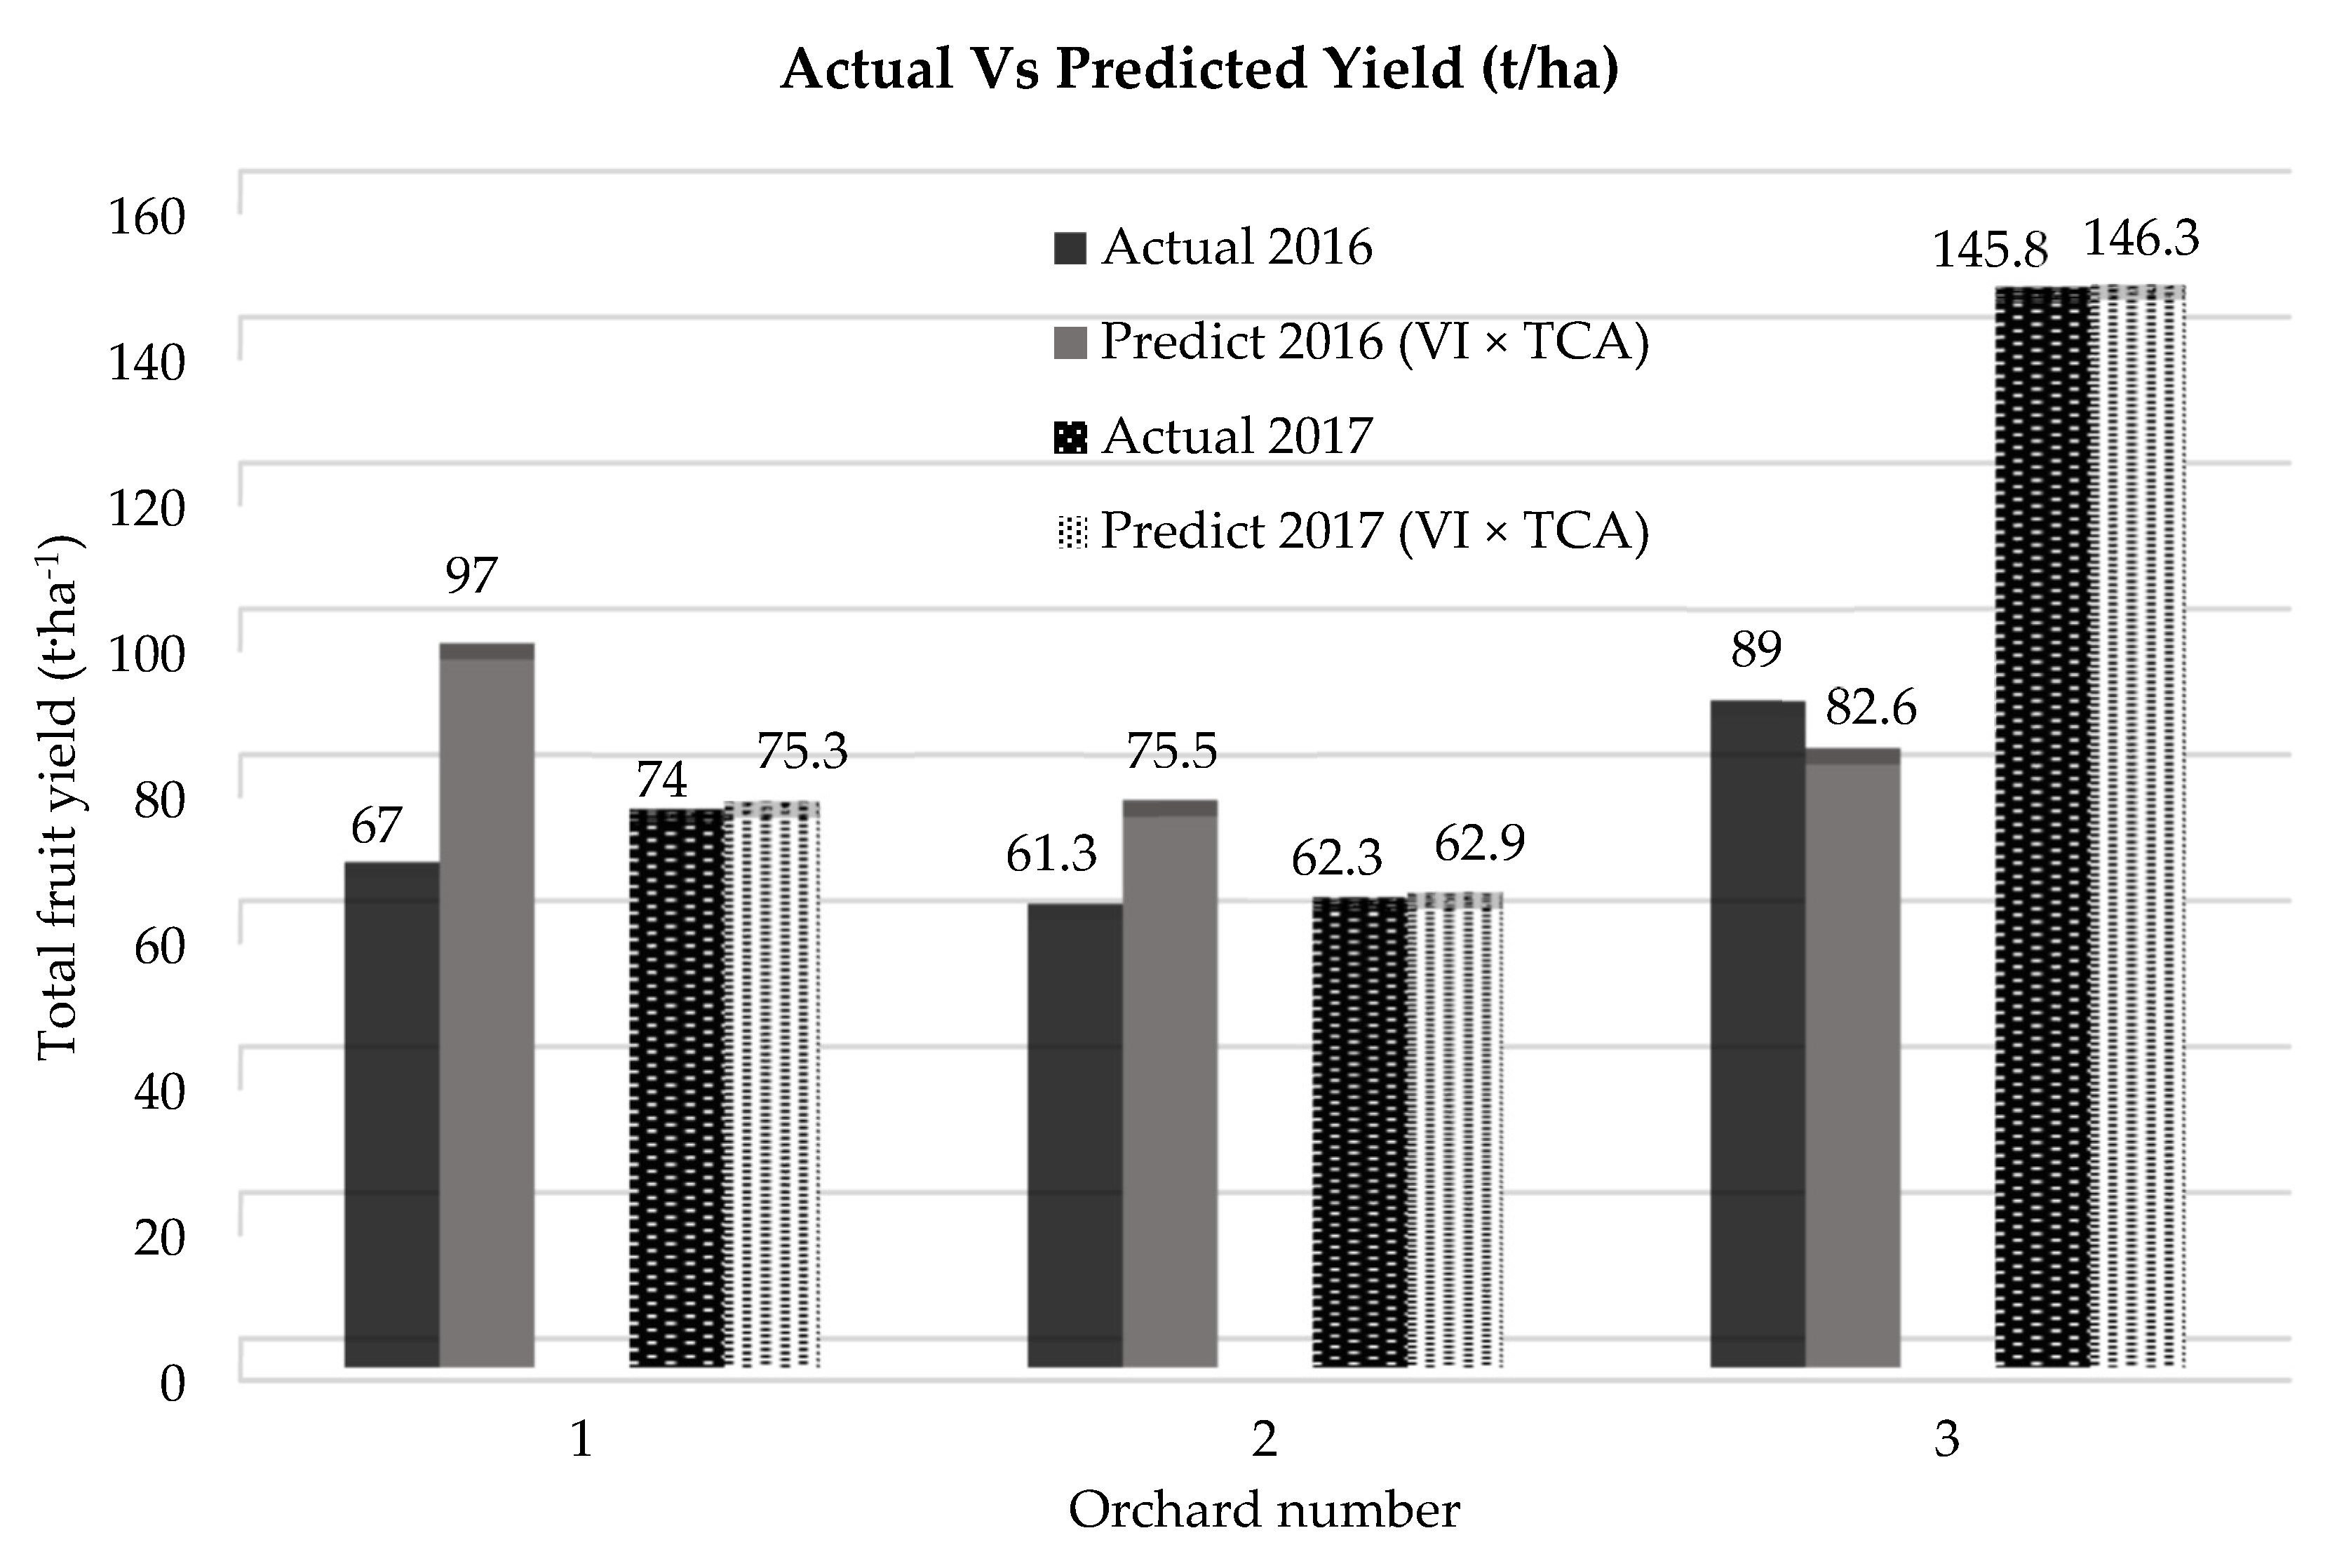
In order to extrapolate the measured yield of the selected trees to the entire orchard, the process described in the Flow chart (Figure 4) was employed for the 2016–2017 and 2017–2018 harvest seasons. Estimations of total fruit weight (t·ha−1) were compared against commercially harvested yield for each orchard (Figure 9). The results demonstrate that for all orchards the predicted yield derived from the remotely sensed imagery, calibrated with the in-field sampling of strategically located trees, was much closer to actual yield, with the exception of orchards 1 and 2 in 2016–2017 season. These orchards were not completely picked due to resource constraints brought on by a delayed harvest and therefore a considerable portion of the fruit were left on the trees or on the ground. For the other orchards the error varied from −7% to less than 1% across the two years.
3.5. Orchard Level Yield Maps
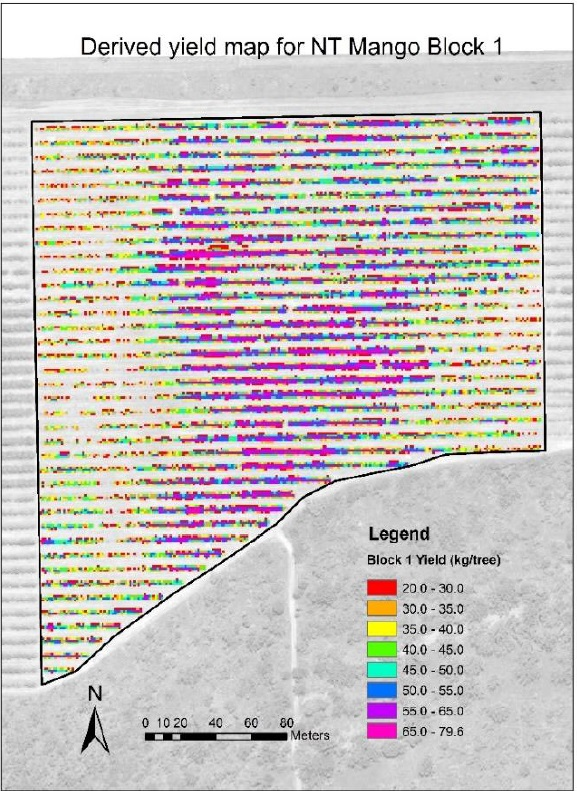
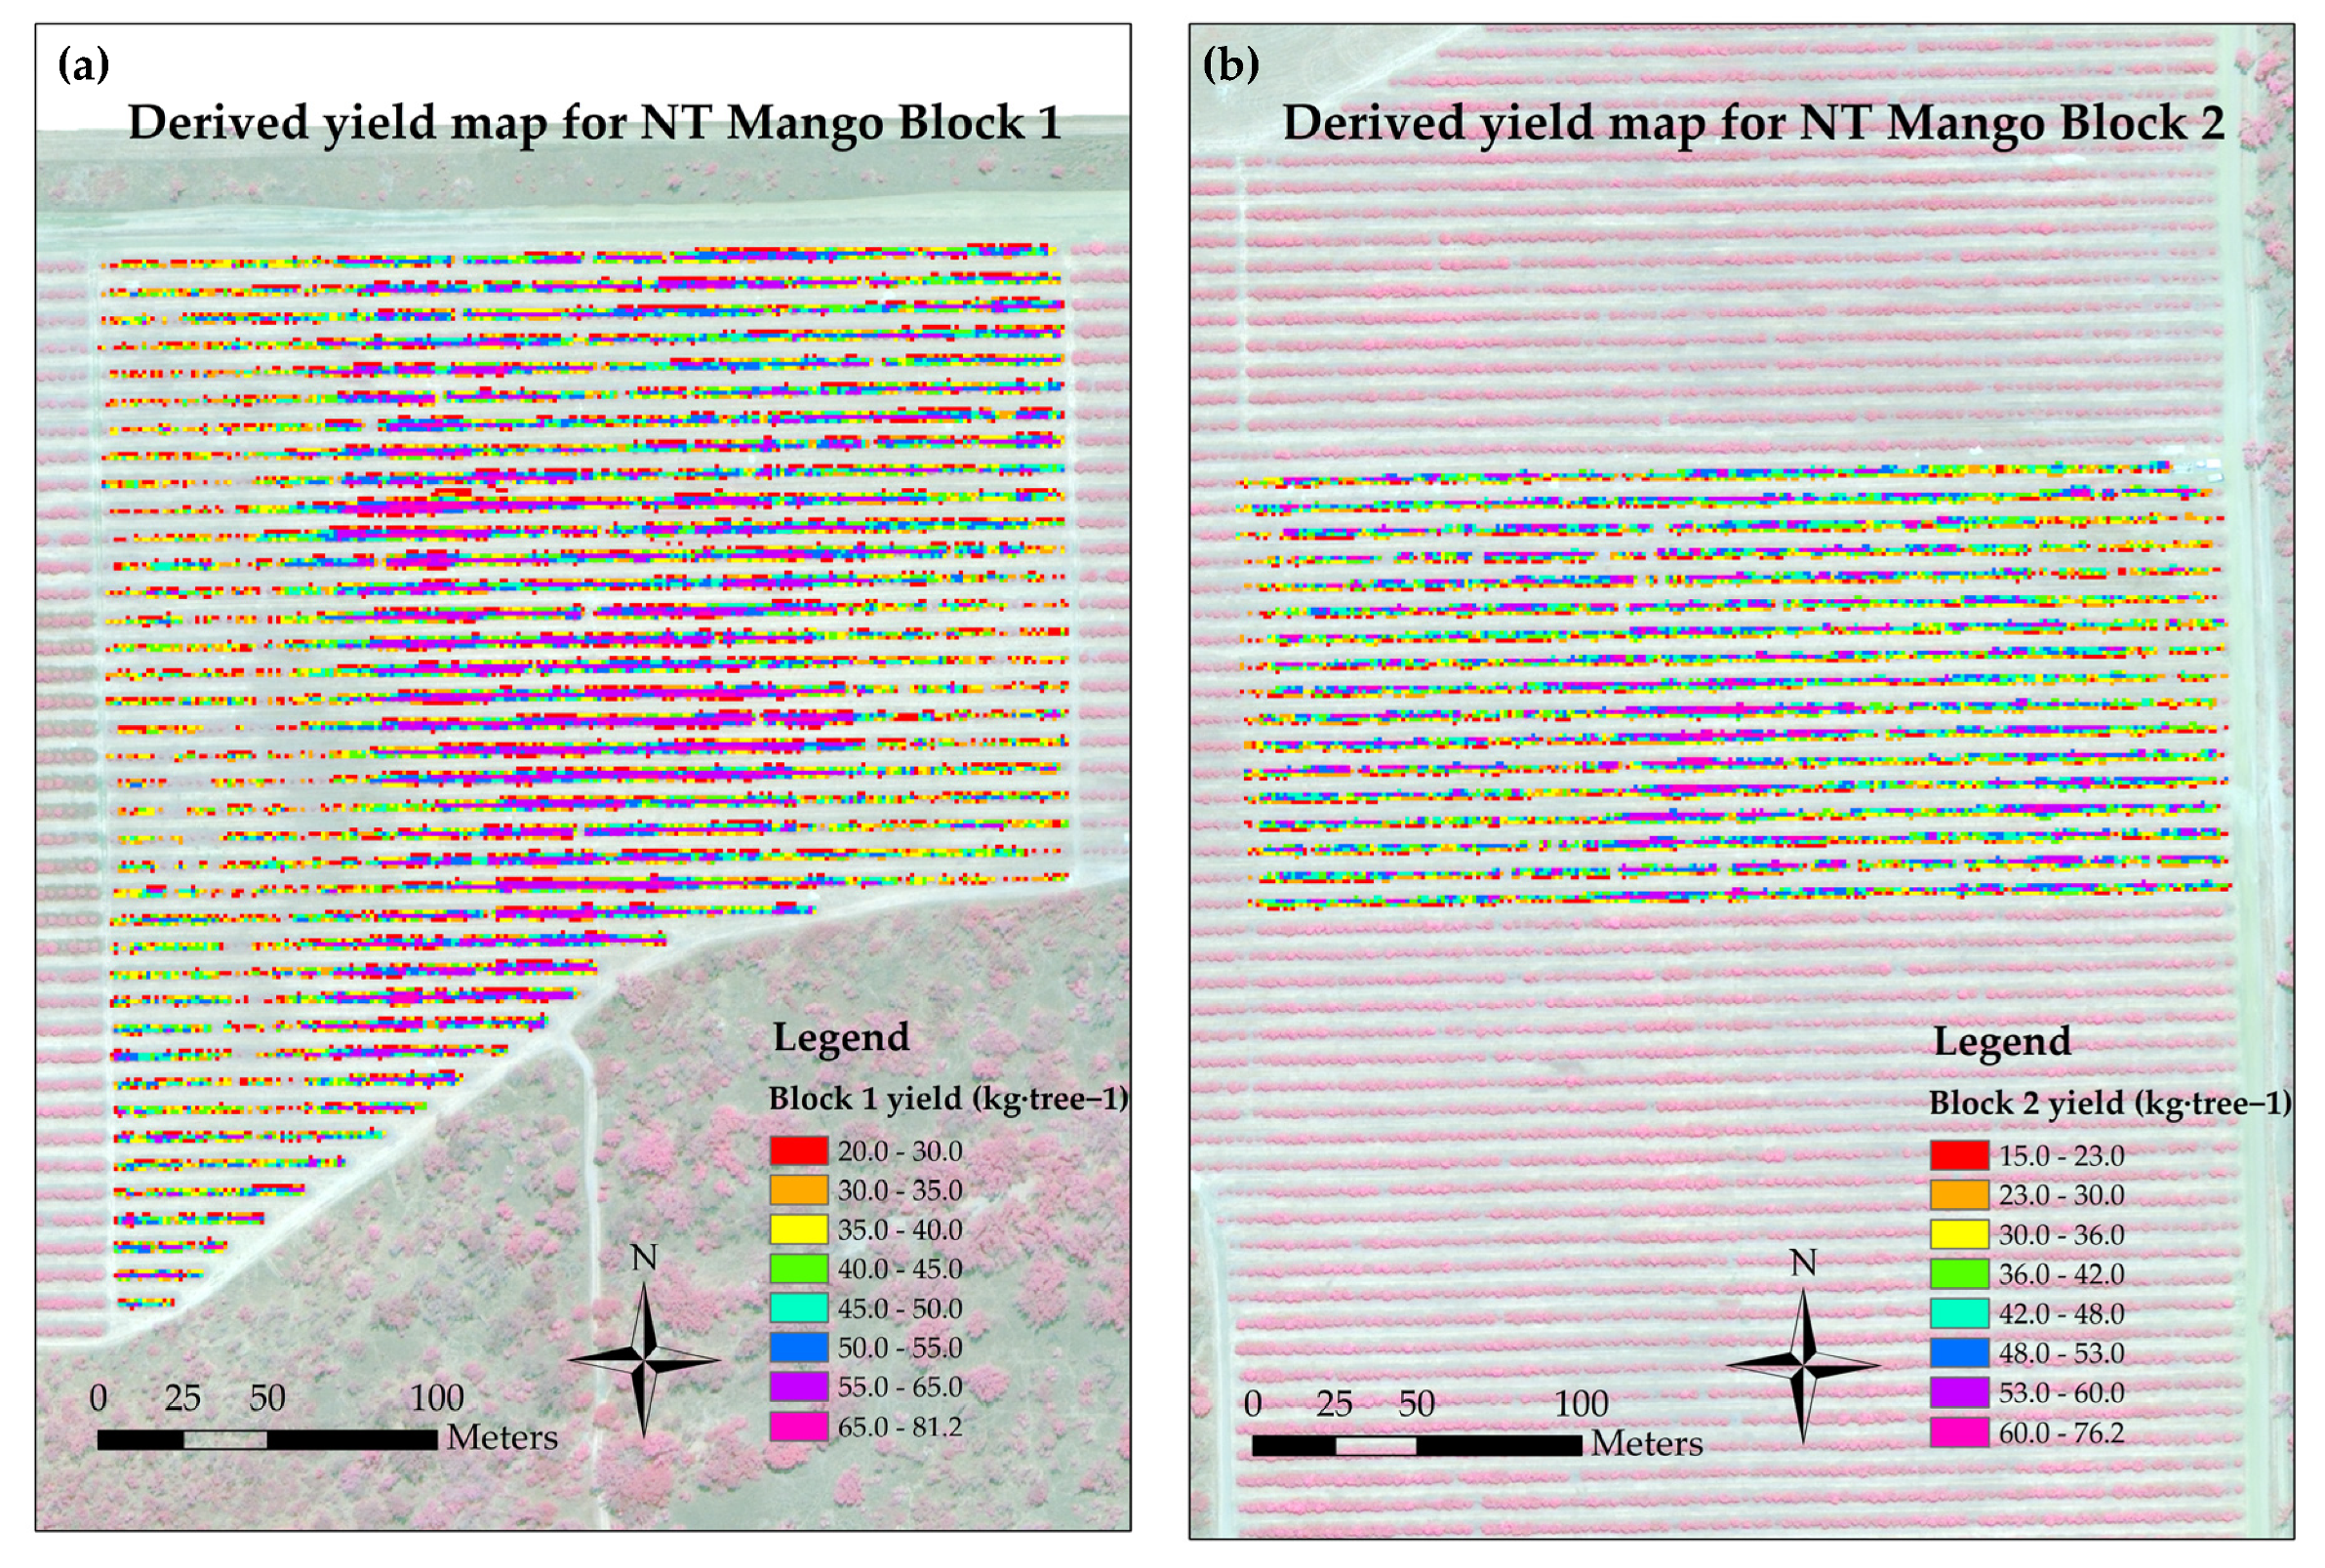
Using the relationship developed between the optimal VIs to total fruit yield (kg·tree−1) and fruit number, maps for these parameters were derived for each orchard. The yield maps of Orchard 1 and 2 in 2017–2018 season are shown as an example in Figure 10.
4. Discussion
The results from this study indicate the potential of high resolution WV3 imagery for accurately mapping fruit yield (kg·tree−1) and fruit number across multiple mango orchards and seasons in the Acacia Hills region, Northern Territory, Australia. The R-squared values achieved using ANN algorithm for the data of all orchards and all years against VIs combined with TCA produced good correlations for both total fruit yield (kg/tree) and total fruit number. The ANCOVA analysis showed that a general regression line can be fitted for combined data in all three orchards in two years. Therefore, the model can be applied to predict yield on a regional level. However, better correlations were observed when the data were analysed separately at the individual orchard level. This suggest that the relationship across all orchards between yield and canopy reflectance values are not consistent and therefore a single ‘generic’ algorithm is not suitable for orchard level yield prediction. Previous research also identified a similar issues for avocado [36], apple and pear crops [61], which is likely due to varying seasonal weather conditions, tree age, orchard management, soil type, availability of pollinators etc. Moreover, the relationships between yield and VIs are different for each growing season and for each orchard. Therefore, it is important to use targeted field sampling during each growing season to calibrate the relationship between yield parameters and the VIs derived from WV3 imagery.
Although several studies have reported the identification and extraction of TCA for large trees using pan-sharpened QuickBird imagery (0.6 m spatial resolution) [62,63], airborne images and LIDAR (Light Detection And Ranging) for fruit tree crops (i.e. olive, apple) [7,64], the measurement of TCA using pan-sharpened WV imagery is a novel addition in satellite based remote sensing industry [65,66]. The strong correlation using machine learning simple linear regression between field measured and pan-sharpened WV3 measured TCA for three different mango orchards for two years exhibited the potential of using WV3 imagery for determining TCA with higher accuracy.
Strong correlations were achieved using ANN algorithm for both total fruit weight (kg·tree−1) and fruit number from three orchards, with no significant difference observed between two years. However, the scenario on individual orchard level suggest that the correlation on each orchard was not consistent for every year. The results from ANCOVA analysis also showed significant difference between the correlations of yield parameters with VIs combined with TCA in two years data. Therefore, it is obvious that targeted field sampling during each growing season is required to calibrate the relationship between yield parameters and combined VIs data with TCA.
Prediction of total fruit yield (t·ha−1) on orchard level using ANN model was found to be consistently closer to the actual yield (t·ha−1). The accuracy of prediction for orchard 1 and 2 in 2016–17 season is lower due to delayed harvest. For all other orchards, across the two growing seasons, the prediction accuracy varied from an under estimation of 7% to a less than 1% over estimation. The orchard level yield maps of total fruit weight (t·ha−1) and fruit numbers provide significant benefits to growers as they clearly define the spatial variation of yield across whole orchards, indicate the location of abiotic and biotic constraints and therefore support the adoption of targeted remediation to maximise productivity.
This study was conducted only in Acacia Hills region in Australia for two years. Therefore, further research with more years of data are required to investigate how VIs combined with TCA relate to yield parameters of mango crops in other regions.
5. Conclusions
The results from this study indicate the potential of high resolution multispectral satellite imagery (WV3) coupled with targeted field sampling to accurately estimate the fruit yield (kg·tree−1) and fruit number across three mango orchards in Acacia Hills, Northern Territory, Australia. Although the relationship between canopy reflectance properties (VIs) with total fruit yield (kg·tree−1) and fruit number for all three orchards in two growing seasons produced poor results, a strong relationship was obtained when TCA was combined with VIs data. This result suggest that the TCA measured from pan-sharpened WV3 imagery has great potential to improve the accuracy of yield parameter estimation of mango crops. The higher R-squared values on orchard level algorithm indicates the influence of growing location (i.e. climate, soil type etc.) and crop management practices (i.e. irrigation, pruning, fertilizer application etc.) in different orchards. The accuracy of the prediction on whole orchard level yield parameters are encouraging and offer great benefit to mango growers for maximising productivity. The robustness of this methodology can be further improved by adding other mango growing locations and years with different varieties.
Author Contributions
M.M.R. conceived and designed the experiments; M.M.R. analysed the data; M.M.R., A.R. and M.B. wrote the paper.
Funding
This research was funded by Australian Government Department of Agriculture and Water Resources as part of its Rural R&D for Profit program and Horticulture Innovation Australia Ltd., grant number ST15002 (Multi-scale Monitoring Tools for Managing Australian Tree Crops).
Acknowledgments
The authors of this paper would like to acknowledge the Australian Government Department of Agriculture and Water Resources as part of its Rural R&D for Profit program and Horticulture Innovation Australia Ltd. (grants ST15002) for funding this research. We would like to recognize the support from mango producers and Department of Primary Industry and Resources staff and students who contributed to the field campaigns; including Martina Matzner, Tou Saramat Ruchkaew, Nicholas Anderson, Constancio Asis, Marije ten Napel, Alan Niscioli, Paige Richter, Dallas Anson and Maddison Clonann.
Conflicts of Interest
The authors declare no conflict of interest.
References
- Payne, A.; Walsh, K.; Subedi, P.; Jarvis, D. Estimating mango crop yield using image analysis using fruit at ‘stone hardening’ stage and night time imaging. Comput. Electron. Agric. 2014, 100, 160–167. [Google Scholar] [CrossRef]
- Payne, A.B.; Walsh, K.B.; Subedi, P.P.; Jarvis, D. Estimation of mango crop yield using image analysis—Segmentation method. Comput. Electron. Agric. 2013, 91, 57–64. [Google Scholar] [CrossRef]
- Winter, F. A Simulation Model for Studying the Efficiency of Apple and Pear Orchards/Ein Simulationsmodell zur Untersuchung der Wirtschaftlichkeit von Apfel-und Birnenanlagen. Gartenbauwissenschaft 1976, 26–34. [Google Scholar]
- Köhne, S. Yield estimation based on measureable parameters. S. Afr. Avocado Growers’ Assoc. Yearb. 1985, 8, 103. [Google Scholar]
- Whiley, A.W.; Saranah, J.B.; Wolstenholme, B.N. Pheno-physiological modelling in avocado-an aid in research planning. In Proceedings of the World Avocado Congress III, Tel Aviv, Israel, 22–27 October 1995; pp. 71–75. [Google Scholar]
- Reginato, G.; De Cortázar, G.; Robinson, T.; Varela, J. Crop load expressed in terms of intercepted photosynthetically-active radiation can be used as a covariate to compare peach tree performance. J. Horticult. Sci. Biotechnol. 2007, 82, 715–720. [Google Scholar] [CrossRef]
- Viau, A.A.; Jang, J.-D.; Payan, V.; Devost, A. The use of airborne LIDAR and multispectral sensors for orchard trees inventory and characterization. FRUTIC 2005, 5, 12–16. [Google Scholar]
- Best, S.; Salazar, F.; Bastias, R.; Leon, L. Crop-load estimation model to optimize yield-Quality ratio in apple orchards, Malus Domestic Borkh, var. Royal Gala. J. Inf. Technol. Agric. 2008, 3, 11–18. [Google Scholar]
- Wright, H.; Nichols, D.; Embree, C. Evaluating the accountability of trunk size and canopy volume models for determining apple tree production potential across diverse management regimes. Acta Horticult. 2006. [Google Scholar] [CrossRef]
- Qiang, L.; Jianrong, C.; Bin, L.; Lie, D.; Yajing, Z. Identification of fruit and branch in natural scenes for citrus harvesting robot using machine vision and support vector machine. Int. J. Agric. Biol. Eng. 2014, 7, 115–121. [Google Scholar]
- Sengupta, S.; Lee, W.S. Identification and determination of the number of immature green citrus fruit in a canopy under different ambient light conditions. Biosyst. Eng. 2014, 117, 51–61. [Google Scholar] [CrossRef]
- Dorj, U.-O.; Lee, M.; Yun, S.-s. An yield estimation in citrus orchards via fruit detection and counting using image processing. Comput. Electron. Agric. 2017, 140, 103–112. [Google Scholar] [CrossRef]
- Zhou, R.; Damerow, L.; Sun, Y.; Blanke, M.M. Using colour features of cv.‘Gala’apple fruits in an orchard in image processing to predict yield. Precis. Agric. 2012, 13, 568–580. [Google Scholar] [CrossRef]
- Aggelopoulou, A.; Bochtis, D.; Fountas, S.; Swain, K.C.; Gemtos, T.; Nanos, G. Yield prediction in apple orchards based on image processing. Precis. Agric. 2011, 12, 448–456. [Google Scholar] [CrossRef]
- Bargoti, S.; Underwood, J.P. Image segmentation for fruit detection and yield estimation in apple orchards. J. Field Robot. 2017, 34, 1039–1060. [Google Scholar] [CrossRef]
- Wang, Q.; Nuske, S.; Bergerman, M.; Singh, S. Automated Crop Yield Estimation for Apple Orchards. In Experimental Robotics: The 13th International Symposium on Experimental Robotics; Desai, P.J., Dudek, G., Khatib, O., Kumar, V., Eds.; Springer International Publishing: Heidelberg, Germany, 2013; pp. 745–758. [Google Scholar] [CrossRef]
- Nuske, S.; Wilshusen, K.; Achar, S.; Yoder, L.; Narasimhan, S.; Singh, S. Automated visual yield estimation in vineyards. J. Field Robot. 2014, 31, 837–860. [Google Scholar] [CrossRef]
- Nuske, S.; Achar, S.; Bates, T.; Narasimhan, S.; Singh, S. Yield estimation in vineyards by visual grape detection. Proceedings of 2011 the IEEE/RSJ International Conference onIntelligent Robots and Systems (IROS), San Francisco, CA, USA, 25–30 September 2011; pp. 2352–2358. [Google Scholar]
- Underwood, J.P.; Hung, C.; Whelan, B.; Sukkarieh, S. Mapping almond orchard canopy volume, flowers, fruit and yield using LiDAR and vision sensors. Comput. Electron. Agric. 2016, 130, 83–96. [Google Scholar] [CrossRef]
- Stein, M.; Bargoti, S.; Underwood, J. Image Based Mango Fruit Detection, Localisation and Yield Estimation Using Multiple View Geometry. Sensors 2016, 16, 1915. [Google Scholar] [CrossRef] [PubMed]
- Sa, I.; Ge, Z.; Dayoub, F.; Upcroft, B.; Perez, T.; McCool, C. DeepFruits: A Fruit Detection System Using Deep Neural Networks. Sensors 2016, 16, 1222. [Google Scholar] [CrossRef] [PubMed]
- Gongal, A.; Amatya, S.; Karkee, M.; Zhang, Q.; Lewis, K. Sensors and systems for fruit detection and localization: A review. Comput. Electron. Agric. 2015, 116, 8–19. [Google Scholar] [CrossRef]
- Battude, M.; Al Bitar, A.; Morin, D.; Cros, J.; Huc, M.; Marais Sicre, C.; Le Dantec, V.; Demarez, V. Estimating maize biomass and yield over large areas using high spatial and temporal resolution Sentinel-2 like remote sensing data. Remote Sens. Environ. 2016, 184, 668–681. [Google Scholar] [CrossRef]
- Rahman, M.M.; Robson, A.J. A Novel Approach for Sugarcane Yield Prediction Using Landsat Time Series Imagery: A Case Study on Bundaberg Region. Adv. Remote Sens. 2016, 5, 93–102. [Google Scholar] [CrossRef]
- Robson, A.; Rahman, M.M.; Falzon, G.; Verma, N.K.; Johansen, K.; Robinson, N.; Lakshmanan, P.; Salter, B.; Skocaj, D. Evaluating remote sensing technologies for improved yield forecasting and for the measurement of foliar nitrogen concentration in sugarcane. Proceedings of 38th Australian Society of Sugar Cane Technologists, At Mackay, Queensland, Australia, 27–29 April 2016. [Google Scholar]
- Li, Y.; Zhou, Q.; Zhou, J.; Zhang, G.; Chen, C.; Wang, J. Assimilating remote sensing information into a coupled hydrology-crop growth model to estimate regional maize yield in arid regions. Ecol. Model. 2014, 291, 15–27. [Google Scholar] [CrossRef]
- Bognár, P.; Ferencz, C.; Pásztor, S.; Molnár, G.; Timár, G.; Hamar, D.; Lichtenberger, J.; Székely, B.; Steinbach, P.; Ferencz, O.E. Yield forecasting for wheat and corn in Hungary by satellite remote sensing. Int. J. Remote Sens. 2011, 32, 4759–4767. [Google Scholar] [CrossRef]
- Ye, X.; Sakai, K.; Asada, S.I.; Sasao, A. Inter-Relationships Between Canopy Features and Fruit Yield in Citrus as Detected by Airborne Multispectral Imagery. Trans. ASABE 2008, 51, 739–751. [Google Scholar] [CrossRef]
- Ye, X.; Sakai, K.; Manago, M.; Asada, S.-i.; Sasao, A. Prediction of citrus yield from airborne hyperspectral imagery. Precis. Agric. 2007, 8, 111–125. [Google Scholar] [CrossRef]
- Kumar, A.; Singh, K.N.; Lal, B.; Singh, R.D. Mapping of apple orchards using remote sensing techniques in cold desert of Himachal Pradesh, India. J. Indian Soc. Remote Sens. 2008, 36, 387–392. [Google Scholar] [CrossRef]
- Sharma, A.; Panigrahy, S. Apple orchard characterization using remote sensing and GIS in Shimla district of Himachal Pradesh. In Proceedings of the Remote Sensing and Photogrammetry Annual Conference, Newcastle Upon Tyne, UK, 11–14 September 2007; pp. 11–14. [Google Scholar]
- Van Beek, J.; Tits, L.; Somers, B.; Coppin, P. Stem water potential monitoring in pear orchards through WorldView-2 multispectral imagery. Remote Sens. 2013, 5, 6647–6666. [Google Scholar] [CrossRef]
- Sepulcre-Cantó, G.; Zarco-Tejada, P.; Jiménez-Muñoz, J.; Sobrino, J.; Soriano, M.; Fereres, E.; Vega, V.; Pastor, M. Monitoring yield and fruit quality parameters in open-canopy tree crops under water stress. Implications for ASTER. Remote Sens. Environ. 2007, 107, 455–470. [Google Scholar] [CrossRef]
- Hall, A.; Lamb, D.W.; Holzapfel, B.; Louis, J. Optical remote sensing applications in viticulture—A review. Aust. J. Grape Wine Res. 2002, 8, 36–47. [Google Scholar] [CrossRef]
- Serrano, L.; González-Flor, C.; Gorchs, G. Assessment of grape yield and composition using the reflectance based Water Index in Mediterranean rainfed vineyards. Remote Sens. Environ. 2012, 118, 249–258. [Google Scholar] [CrossRef] [Green Version]
- Robson, A.; Rahman, M.M.; Muir, J. Using Worldview Satellite Imagery to Map Yield in Avocado (Persea americana): A Case Study in Bundaberg, Australia. Remote Sens. 2017, 9, 1223. [Google Scholar] [CrossRef]
- Robson, A.; Rahman, M.M.; Muir, J.; Saint, A.; Simpson, C.; Searle, C. Evaluating satellite remote sensing as a method for measuring yield variability in Avocado and Macadamia tree crops. Adv. Anim.Biosci. 2017, 8, 498–504. [Google Scholar] [CrossRef]
- Gupta, P.; Sharma, R. Application of satellite remote sensing technique in delineation and hectarge estimation of mango orchards in parts of Uttar Pradesh, India. In Proceedings of the GIS Development, Uttar pradesh, India, 12–14 March 1990; pp. 1–3. [Google Scholar]
- Nagaraja, A. Predicting susceptible areas of mango malformation through remote sensing and GIS. Ph.D. Thesis, Indian Agricultural Research Institute, New Delhi, India, 2009. [Google Scholar]
- Zhu, Y.; Liu, K.; Liu, L.; Wang, S.; Liu, H. Retrieval of mangrove aboveground biomass at the individual species level with worldview-2 images. Remote Sens. 2015, 7, 12192–12214. [Google Scholar] [CrossRef]
- Yuan, H.; Yang, G.; Li, C.; Wang, Y.; Liu, J.; Yu, H.; Feng, H.; Xu, B.; Zhao, X.; Yang, X. Retrieving soybean leaf area index from unmanned aerial vehicle hyperspectral remote sensing: Analysis of RF, ANN, and SVM regression models. Remote Sens. 2017, 9, 309. [Google Scholar] [CrossRef]
- Mas, J.F.; Flores, J.J. The application of artificial neural networks to the analysis of remotely sensed data. Int. J. Remote Sens. 2008, 29, 617–663. [Google Scholar] [CrossRef]
- Raczko, E.; Zagajewski, B. Comparison of support vector machine, random forest and neural network classifiers for tree species classification on airborne hyperspectral APEX images. Eur. J. Remote Sens. 2017, 50, 144–154. [Google Scholar] [CrossRef]
- Lek, S.; Guégan, J.-F. Artificial neural networks as a tool in ecological modelling, an introduction. Ecol. Model. 1999, 120, 65–73. [Google Scholar] [CrossRef]
- Foody, G. Using prior knowledge in artificial neural network classification with a minimal training set. Remote Sens. 1995, 16, 301–312. [Google Scholar] [CrossRef]
- Carpenter, G.A.; Gopal, S.; Macomber, S.; Martens, S.; Woodcock, C.E. A neural network method for mixture estimation for vegetation mapping. Remote Sens. Environ. 1999, 70, 138–152. [Google Scholar] [CrossRef]
- Yue, J.; Feng, H.; Yang, G.; Li, Z. A Comparison of Regression Techniques for Estimation of Above-Ground Winter Wheat Biomass Using Near-Surface Spectroscopy. Remote Sens. 2018, 10, 66. [Google Scholar] [CrossRef]
- Hassan-Esfahani, L.; Torres-Rua, A.; Jensen, A.; McKee, M. Assessment of surface soil moisture using high-resolution multi-spectral imagery and artificial neural networks. Remote Sens. 2015, 7, 2627–2646. [Google Scholar] [CrossRef]
- BOM. Bureau of Meteorology. Available online: http://www.bom.gov.au/climate/averages/tables/cw_014938_All.shtml (accessed on 5 March 2018).
- Hernández Delgado, P.M.; Aranguren, M.; Reig, C.; Fernández Galván, D.; Mesejo, C.; Martínez Fuentes, A.; Galán Saúco, V.; Agustí, M. Phenological growth stages of mango (Mangifera indica L.) according to the BBCH scale. Sci. Horticult. 2011, 130, 536–540. [Google Scholar] [CrossRef]
- Digital Globe. WorldView 3 Datasheet. 2017. Available online: https://dg-cms-uploads-production.s3.amazonaws.com/uploads/document/file/95/DG2017_WorldView-3_DS.pdf (accessed on 22 March 2018).
- Kuester, M. Radiometric Use of WorldView-3 Imagery; DigitalGlobe: Longmont, CO, USA, 2016. [Google Scholar]
- Robson, A.J.; Petty, J.; Joyce, D.C.; Marques, J.R.; Hofman, P.J. High resolution remote sensing, GIS and Google Earth for avocado fruit quality mapping and tree number auditing. Proceedings of 29th International Horticultural Congress, Brisbane Convention and Exhibition Centre, Brisbane, Queensland, Australia, 17–22 August 2014. [Google Scholar]
- Rueda, C.A.; Greenberg, J.A.; Ustin, S.L. StarSpan: A Tool for Fast Selective Pixel Extraction from Remotely Sensed Data; Center for Spatial Technologies and Remote Sensing (CSTARS), University of California at Davis: Davis, CA, USA, 2005. [Google Scholar]
- R Development Core Team. R: A Language and Environment for Statistical Computing (Version 3.5); R Foundation for Statistical Computing: Vienna, Austria, 2018. [Google Scholar]
- Tuszynski, J.; Tuszynski, M.J. The caTools Package. 2007. Available online: https://cran.r-project.org/web/packages/caTools/caTools.pdf (accessed on 12 October 2018).
- Günther, F.; Fritsch, S. Neuralnet: Training of neural networks. R J. 2010, 2, 30–38. [Google Scholar]
- Candel, A.; Parmar, V.; LeDell, E.; Arora, A. Deep learning with H2O; H2O. ai Inc.: Mountain View, CA, USA, 2016. [Google Scholar]
- Rumelhart, D.E.; Hinton, G.E.; Williams, R.J. Learning representations by back-propagating errors. Nature 1986, 323, 533. [Google Scholar] [CrossRef]
- Yi, Q.; Jiapaer, G.; Chen, J.; Bao, A.; Wang, F. Different units of measurement of carotenoids estimation in cotton using hyperspectral indices and partial least square regression. ISPRS J. Photogramm. Remote Sens. 2014, 91, 72–84. [Google Scholar] [CrossRef]
- Lötze, E.; Bergh, O. Early prediction of harvest fruit size distribution of an apple and pear cultivar. Sci. Horticult. 2004, 101, 281–290. [Google Scholar] [CrossRef]
- Ozdemir, I. Estimating stem volume by tree crown area and tree shadow area extracted from pan-sharpened Quickbird imagery in open Crimean juniper forests. Int. J. Remote Sens. 2008, 29, 5643–5655. [Google Scholar] [CrossRef]
- Whiteside, T.; Ahmad, W. Estimating canopy cover from eucalypt dominant tropical savanna using the extraction of tree crowns from very high resolution imagery. In Proceedings of the GEOBIA, 2008—Pixels, Objects, Intelligence: Geographic Object Based Image Analysis for the 21st Century, Calgary, AB, Canada, 5–8 August 2008. [Google Scholar]
- Torres-Sánchez, J.; López-Granados, F.; Serrano, N.; Arquero, O.; Fernández-Escobar, R.; Peña, J. Characterizing olive tree geometric features using unmanned aerial vehicle (UAV) images. In Proceedings of the OLIVEBIOTEQ 2014, Amman, Jordan, 3–6 November 2014; p. 194. [Google Scholar]
- Chemura, A.; van Duren, I.; van Leeuwen, L.M. Determination of the age of oil palm from crown projection area detected from WorldView-2 multispectral remote sensing data: The case of Ejisu-Juaben district, Ghana. ISPRS J. Photogramm. Remote Sens. 2015, 100, 118–127. [Google Scholar] [CrossRef]
- Verma, N.K.; Lamb, D.W.; Reid, N.; Wilson, B. Comparison of canopy volume measurements of scattered eucalypt farm trees derived from high spatial resolution imagery and LiDAR. Remote Sens. 2016, 8, 388. [Google Scholar] [CrossRef]
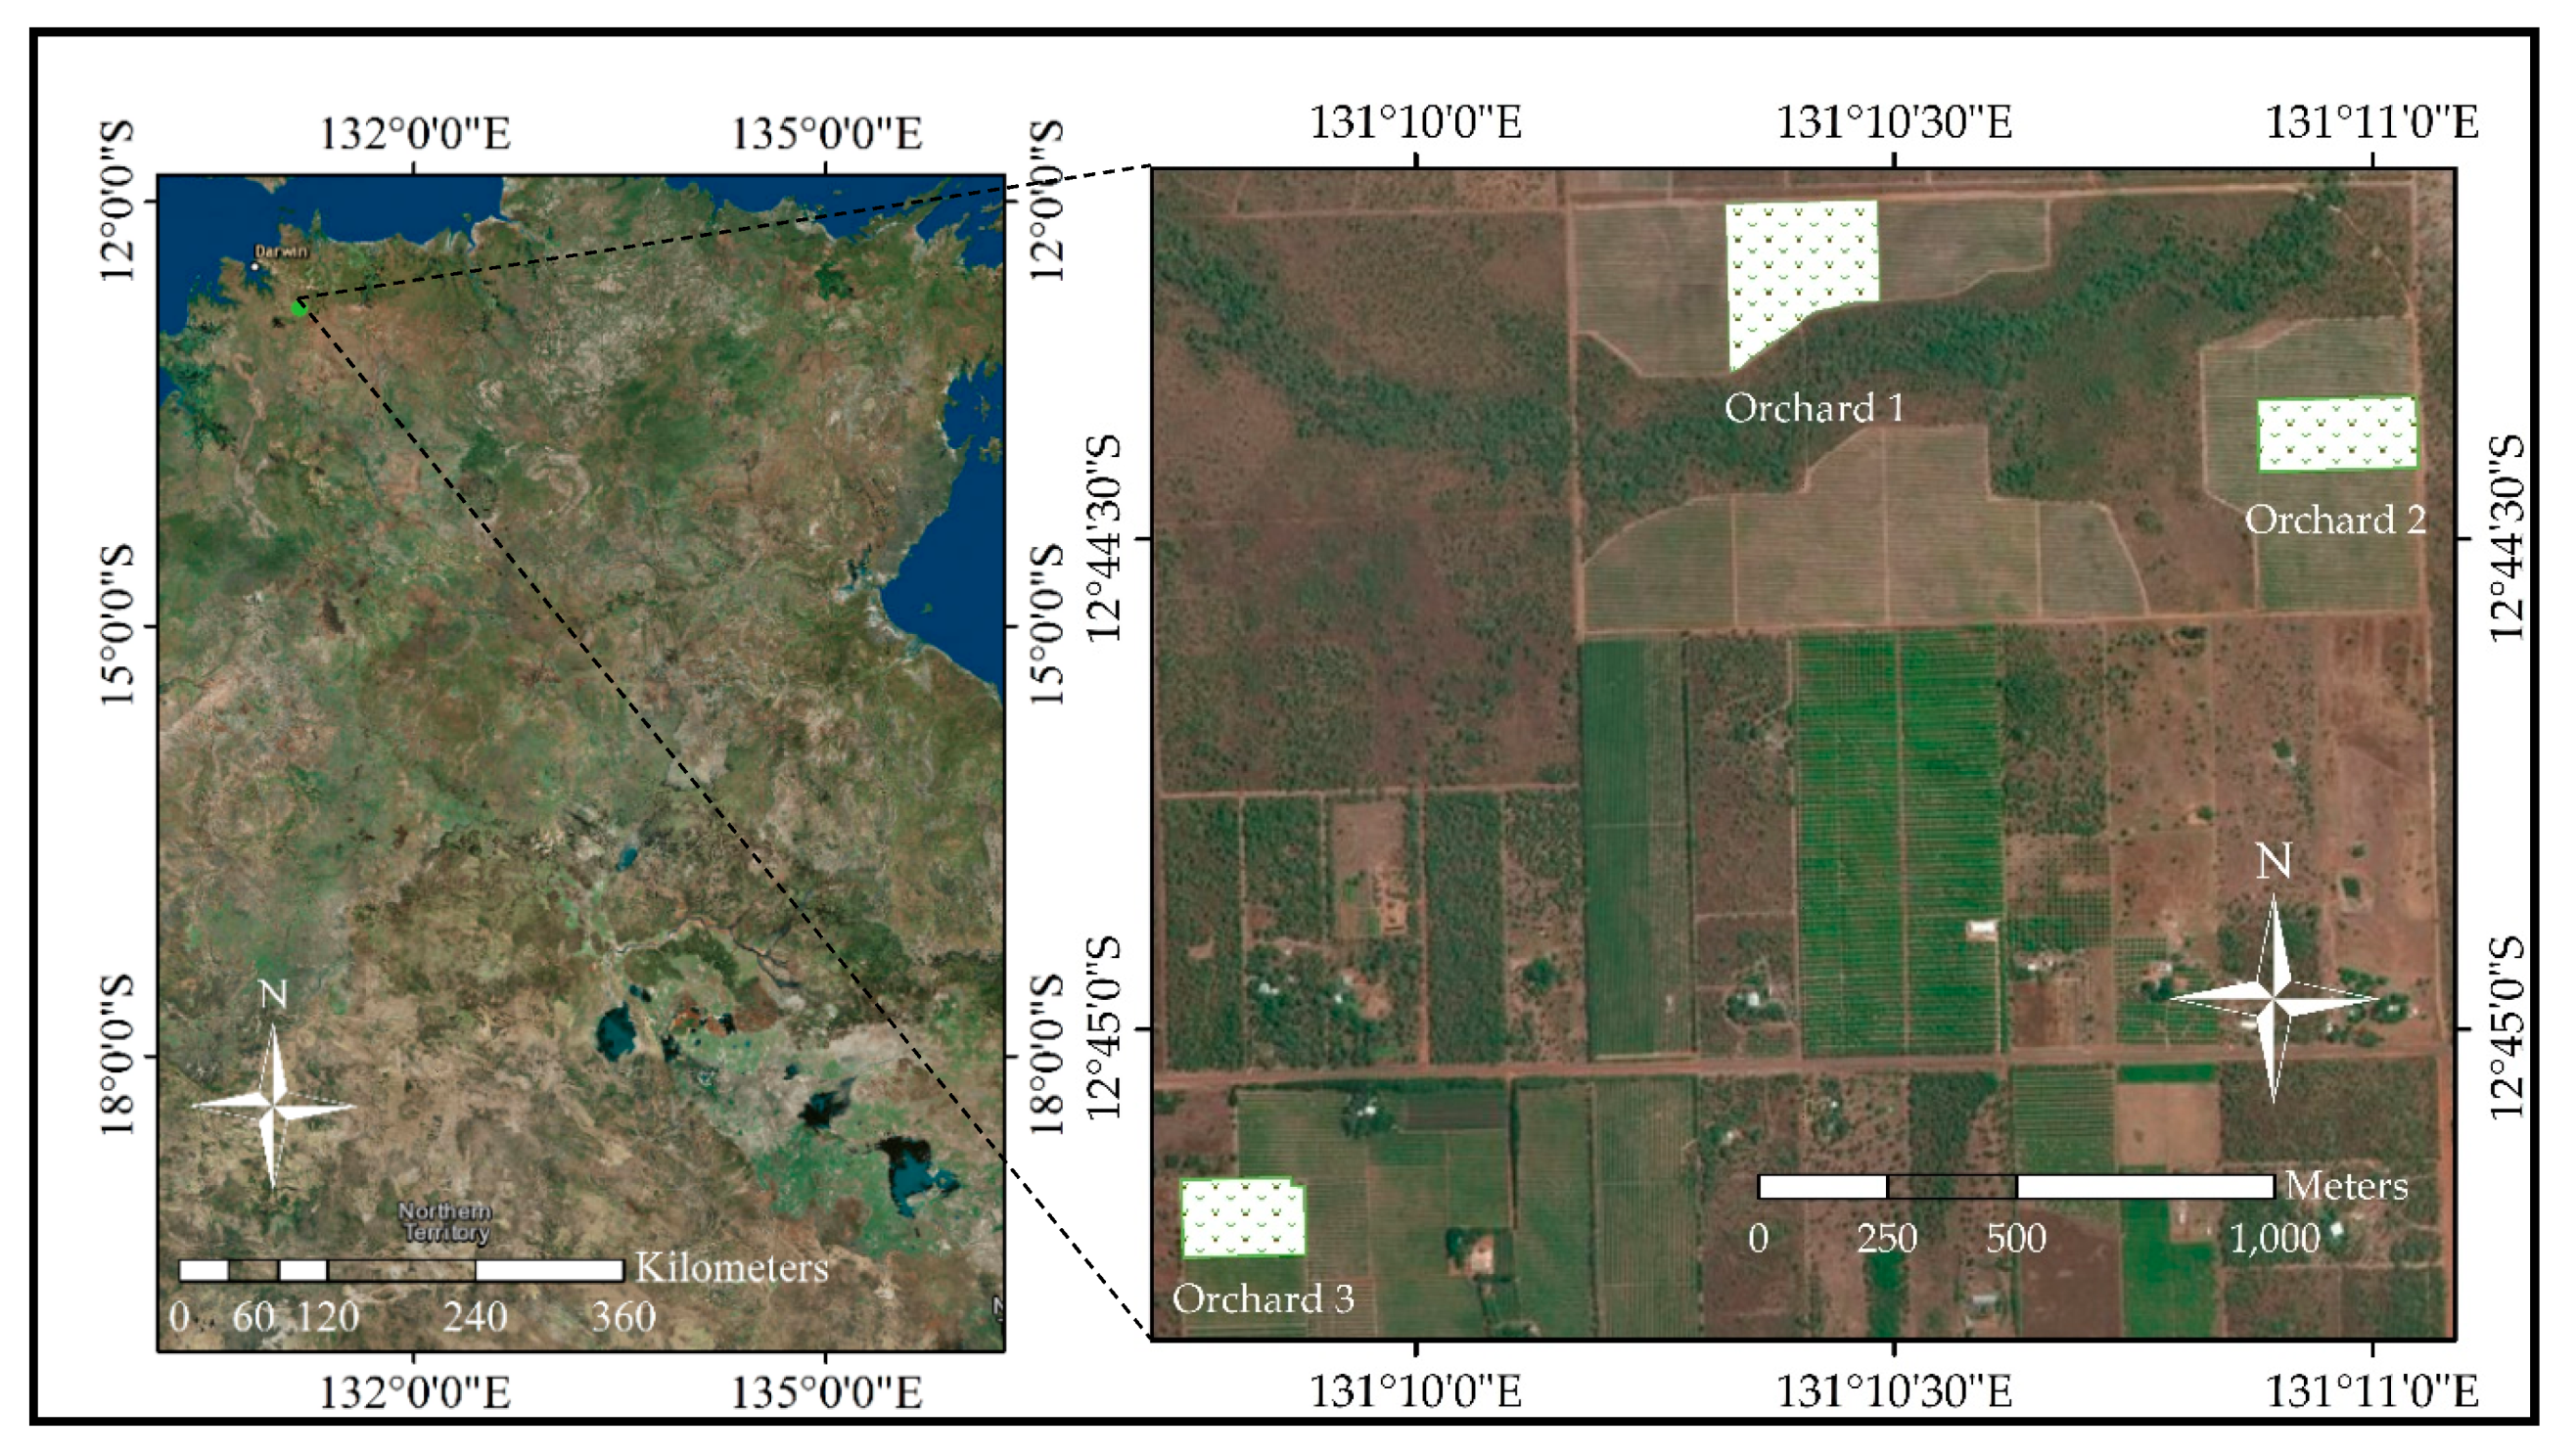
Figure 1.
Location of the three mango orchards in Acacia Hills, Northern Territory, Australia. Three orchards are given the name Orchard 1, Orchard 2 and Orchard 3.
Figure 1.
Location of the three mango orchards in Acacia Hills, Northern Territory, Australia. Three orchards are given the name Orchard 1, Orchard 2 and Orchard 3.

Figure 2.
Classified Normalised Difference Vegetation Index (NDVI) images of the three mango orchards (a) Orchard 1 (b) Orchard 2 and (c) Orchard 3 with sampling locations for the 2016–2017 season presented as white circles.
Figure 2.
Classified Normalised Difference Vegetation Index (NDVI) images of the three mango orchards (a) Orchard 1 (b) Orchard 2 and (c) Orchard 3 with sampling locations for the 2016–2017 season presented as white circles.

Figure 3.
The flowchart of TCA extraction process in ImageJ. Processes are shown in left and the commands in ImageJ software are shown in right.
Figure 3.
The flowchart of TCA extraction process in ImageJ. Processes are shown in left and the commands in ImageJ software are shown in right.

Figure 4.
The flowchart of developing algorithm and derivation of orchard level yield maps

Figure 5.
The relationship between field measured TCA and pan-sharpened WV3 delineated TCA with test set data. The solid line indicates the 1:1 relationship.
Figure 5.
The relationship between field measured TCA and pan-sharpened WV3 delineated TCA with test set data. The solid line indicates the 1:1 relationship.

Figure 6.
The correlation between actual and predicted total fruit weight (kg·tree−1) (Left) and fruit number with combined VIs and TCA from test set data (Right) (n = 33 from three orchards).
Figure 6.
The correlation between actual and predicted total fruit weight (kg·tree−1) (Left) and fruit number with combined VIs and TCA from test set data (Right) (n = 33 from three orchards).

Figure 7.
The correlation between actual and ANN model predicted total fruit weight (kg·tree−1) with combined VIs and TCA data for test set (n = 11) in Orchard 1, Orchard 2 and Orchard 3.
Figure 7.
The correlation between actual and ANN model predicted total fruit weight (kg·tree−1) with combined VIs and TCA data for test set (n = 11) in Orchard 1, Orchard 2 and Orchard 3.


Figure 8.
The correlation between actual and ANN model predicted total fruit number with combined VIs and TCA data for test set (n = 11) in Orchard 1, Orchard 2 and Orchard 3.
Figure 8.
The correlation between actual and ANN model predicted total fruit number with combined VIs and TCA data for test set (n = 11) in Orchard 1, Orchard 2 and Orchard 3.


Figure 9.
Comparison between the actual yield (t·ha−1) to that predicted from WV3 imagery for 2016–2017 (showed as 2016 in legend) and 2017–2018 (showed as 2017 in legend) seasons for three mango orchards in Northern Territory.
Figure 9.
Comparison between the actual yield (t·ha−1) to that predicted from WV3 imagery for 2016–2017 (showed as 2016 in legend) and 2017–2018 (showed as 2017 in legend) seasons for three mango orchards in Northern Territory.

Figure 10.
Classified yield maps derived from the best fit model using ANN for total fruit yield (kg·tree−1) for (a) Orchard 1 and (b) Orchard 2 in 2017–2018 growing season.
Figure 10.
Classified yield maps derived from the best fit model using ANN for total fruit yield (kg·tree−1) for (a) Orchard 1 and (b) Orchard 2 in 2017–2018 growing season.


Table 1.
Best vegetation indices (VIs) for all orchards and for each orchard separately for total fruit weight (kg·tree−1) and fruit number using multivariate stepwise regression and biplot.
Table 1.
Best vegetation indices (VIs) for all orchards and for each orchard separately for total fruit weight (kg·tree−1) and fruit number using multivariate stepwise regression and biplot.
| Orchards | Total Fruit Weight (kg·tree−1) | Total Fruit Number | |||||
|---|---|---|---|---|---|---|---|
| Best VI from Stepwise Regression and Biplot | Formula | R2 | Best VI from Stepwise Regression and Biplot | Formula | R2 | ||
| All orchards (2 years) | NDVI red-edge | 0.26 | NDVI red-edge | 0.30 | |||
| Orchard 1 (2 years) | RDVI2 | 0.60 | RDVI2 | 0.63 | |||
| Orchard 2 (2 years) | RDVI1 | 0.62 | RDVI1 | 0.63 | |||
| Orchard 3 (2 years) | R/N2NDVI | 0.56 | SIPI | 0.60 | |||
© 2018 by the authors. Licensee MDPI, Basel, Switzerland. This article is an open access article distributed under the terms and conditions of the Creative Commons Attribution (CC BY) license (http://creativecommons.org/licenses/by/4.0/).
Share and Cite
MDPI and ACS Style
Rahman, M.M.; Robson, A.; Bristow, M. Exploring the Potential of High Resolution WorldView-3 Imagery for Estimating Yield of Mango. Remote Sens. 2018, 10, 1866. https://0-doi-org.brum.beds.ac.uk/10.3390/rs10121866
AMA Style
Rahman MM, Robson A, Bristow M. Exploring the Potential of High Resolution WorldView-3 Imagery for Estimating Yield of Mango. Remote Sensing. 2018; 10(12):1866. https://0-doi-org.brum.beds.ac.uk/10.3390/rs10121866
Chicago/Turabian StyleRahman, Muhammad Moshiur, Andrew Robson, and Mila Bristow. 2018. "Exploring the Potential of High Resolution WorldView-3 Imagery for Estimating Yield of Mango" Remote Sensing 10, no. 12: 1866. https://0-doi-org.brum.beds.ac.uk/10.3390/rs10121866
Note that from the first issue of 2016, this journal uses article numbers instead of page numbers. See further details here.