Multi-Temporal Analysis of Forest Fire Probability Using Socio-Economic and Environmental Variables

 ,
,  ,
,  ,
, 
Abstract
:
1. Introduction
2. Materials and Methods
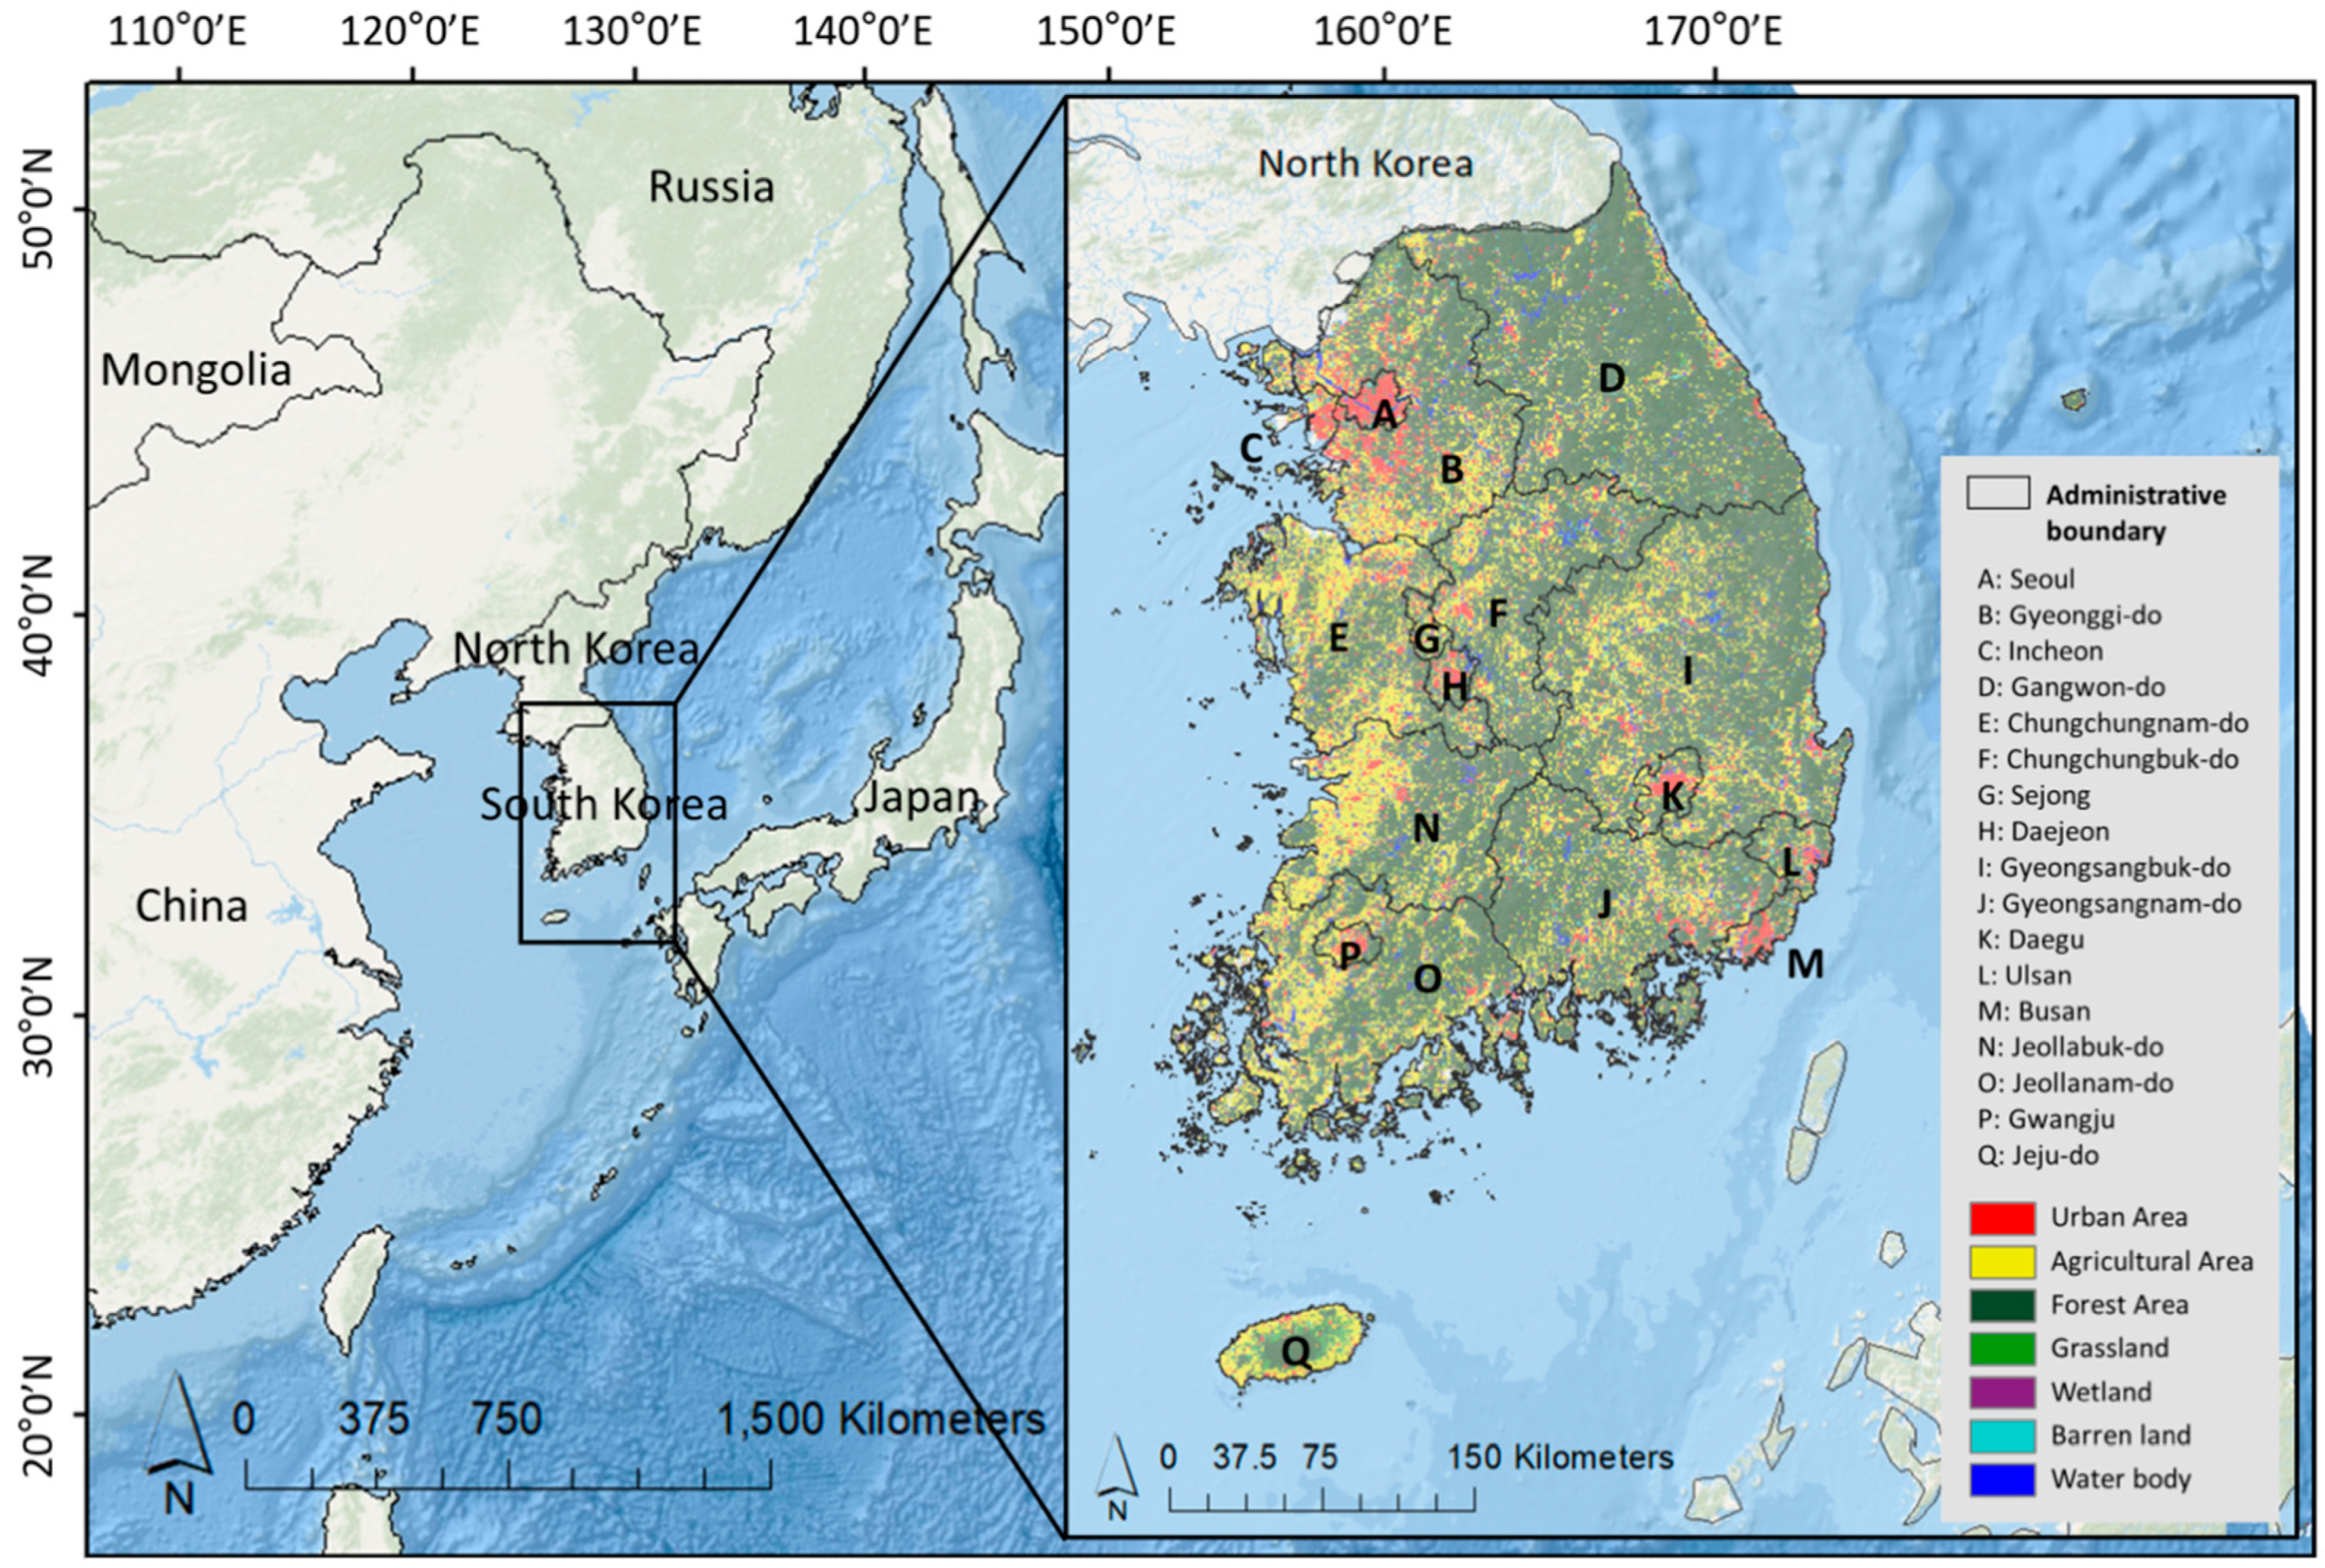
2.1. Study Site
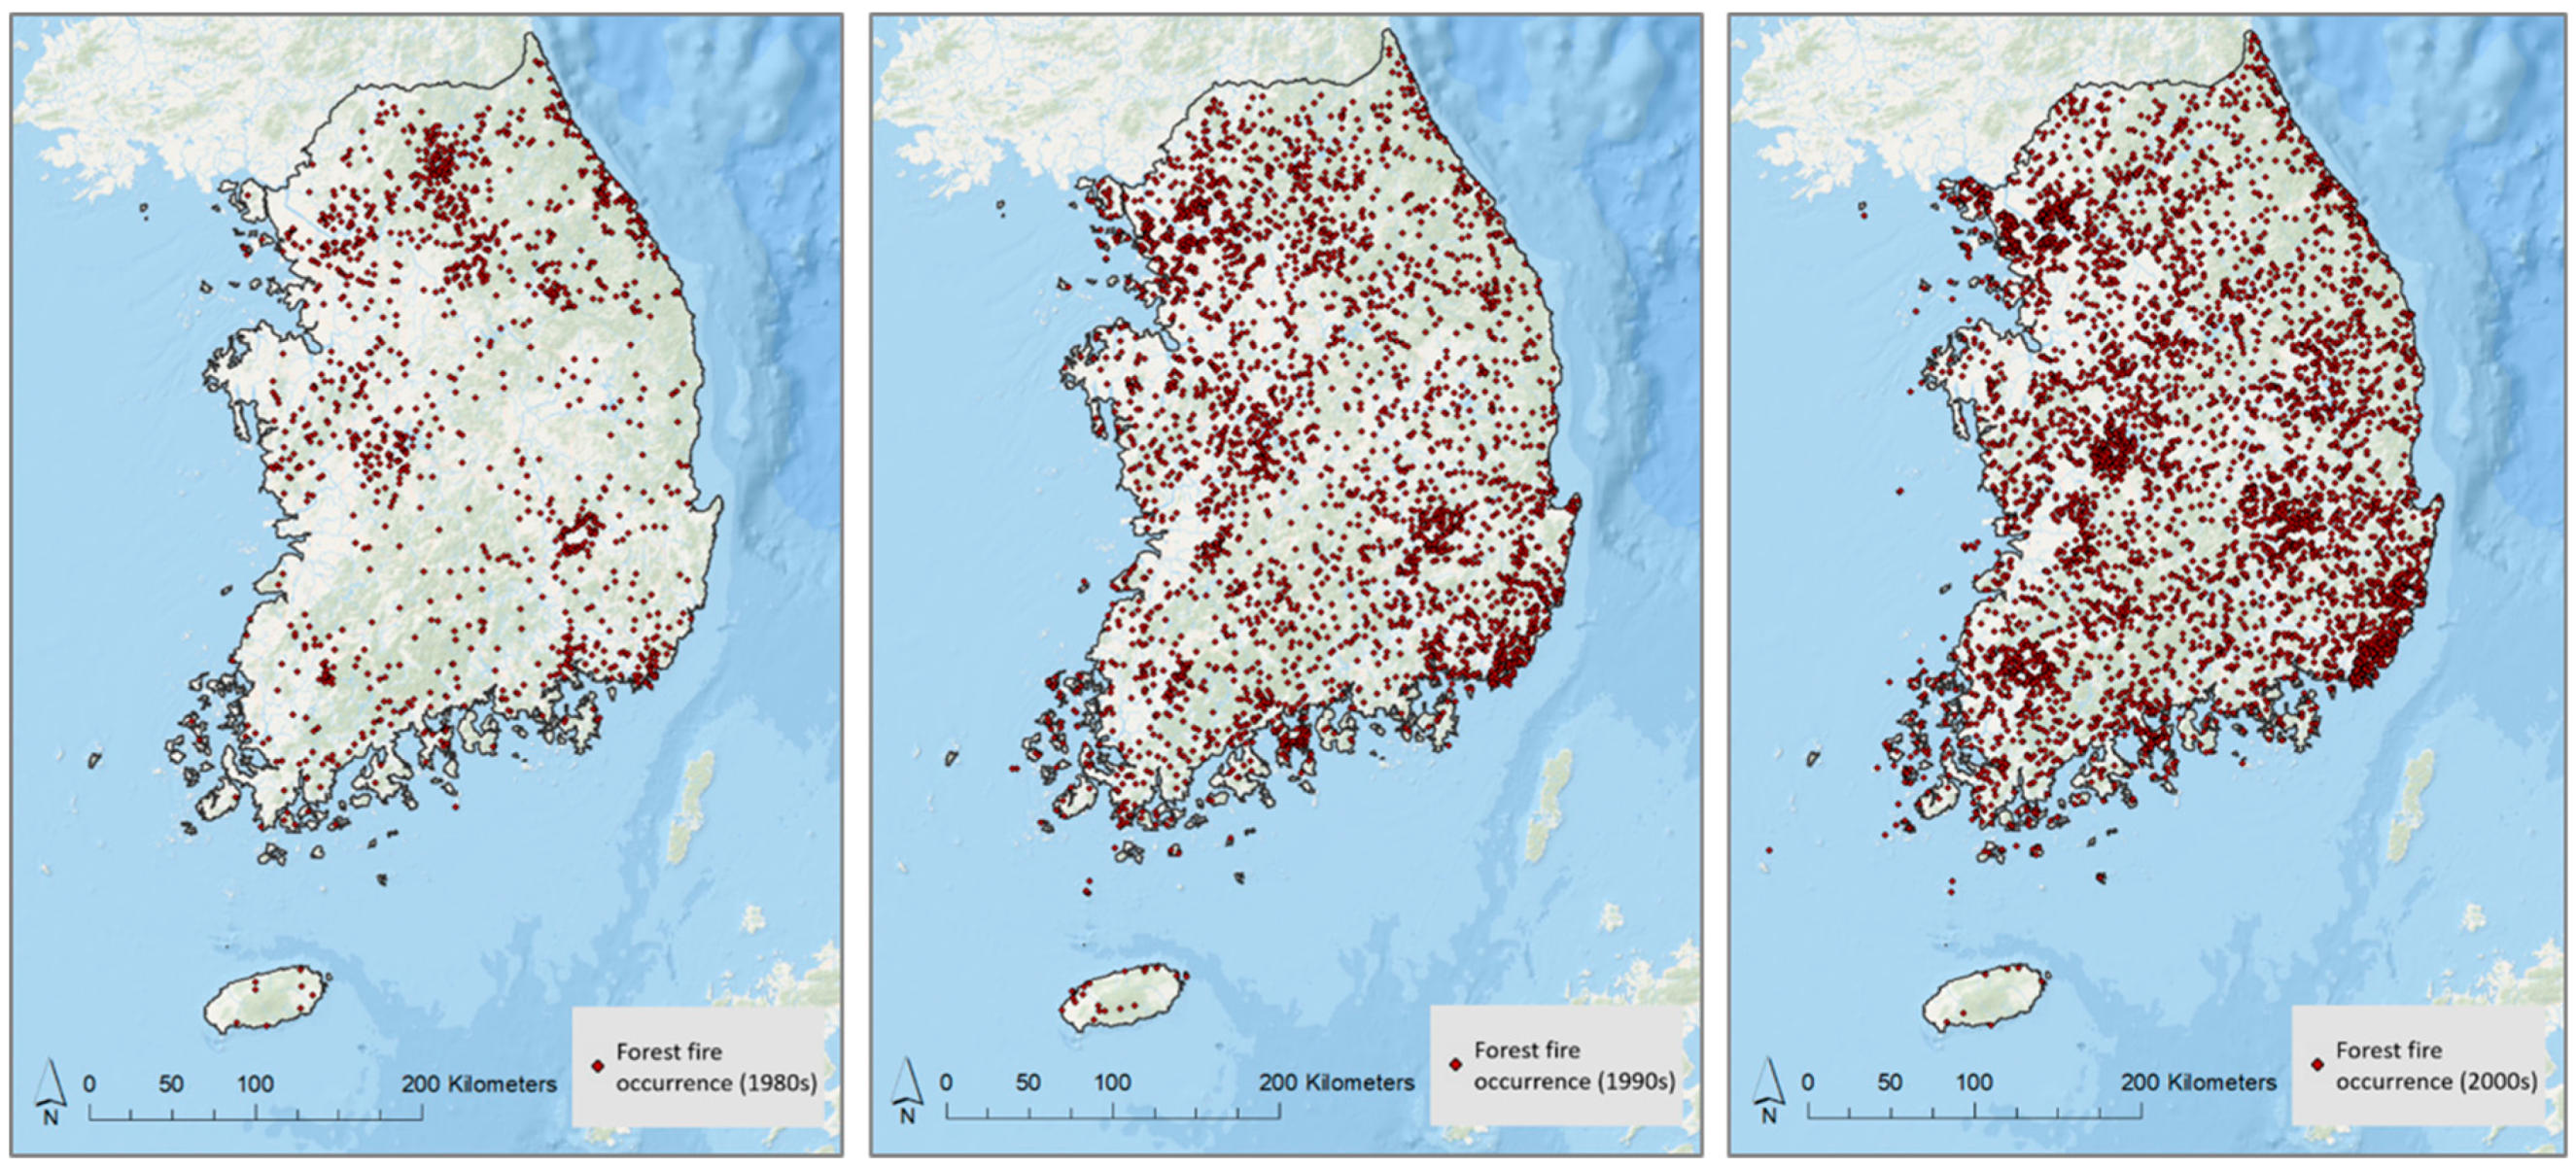
2.2. Forest Fire Occurrence Data
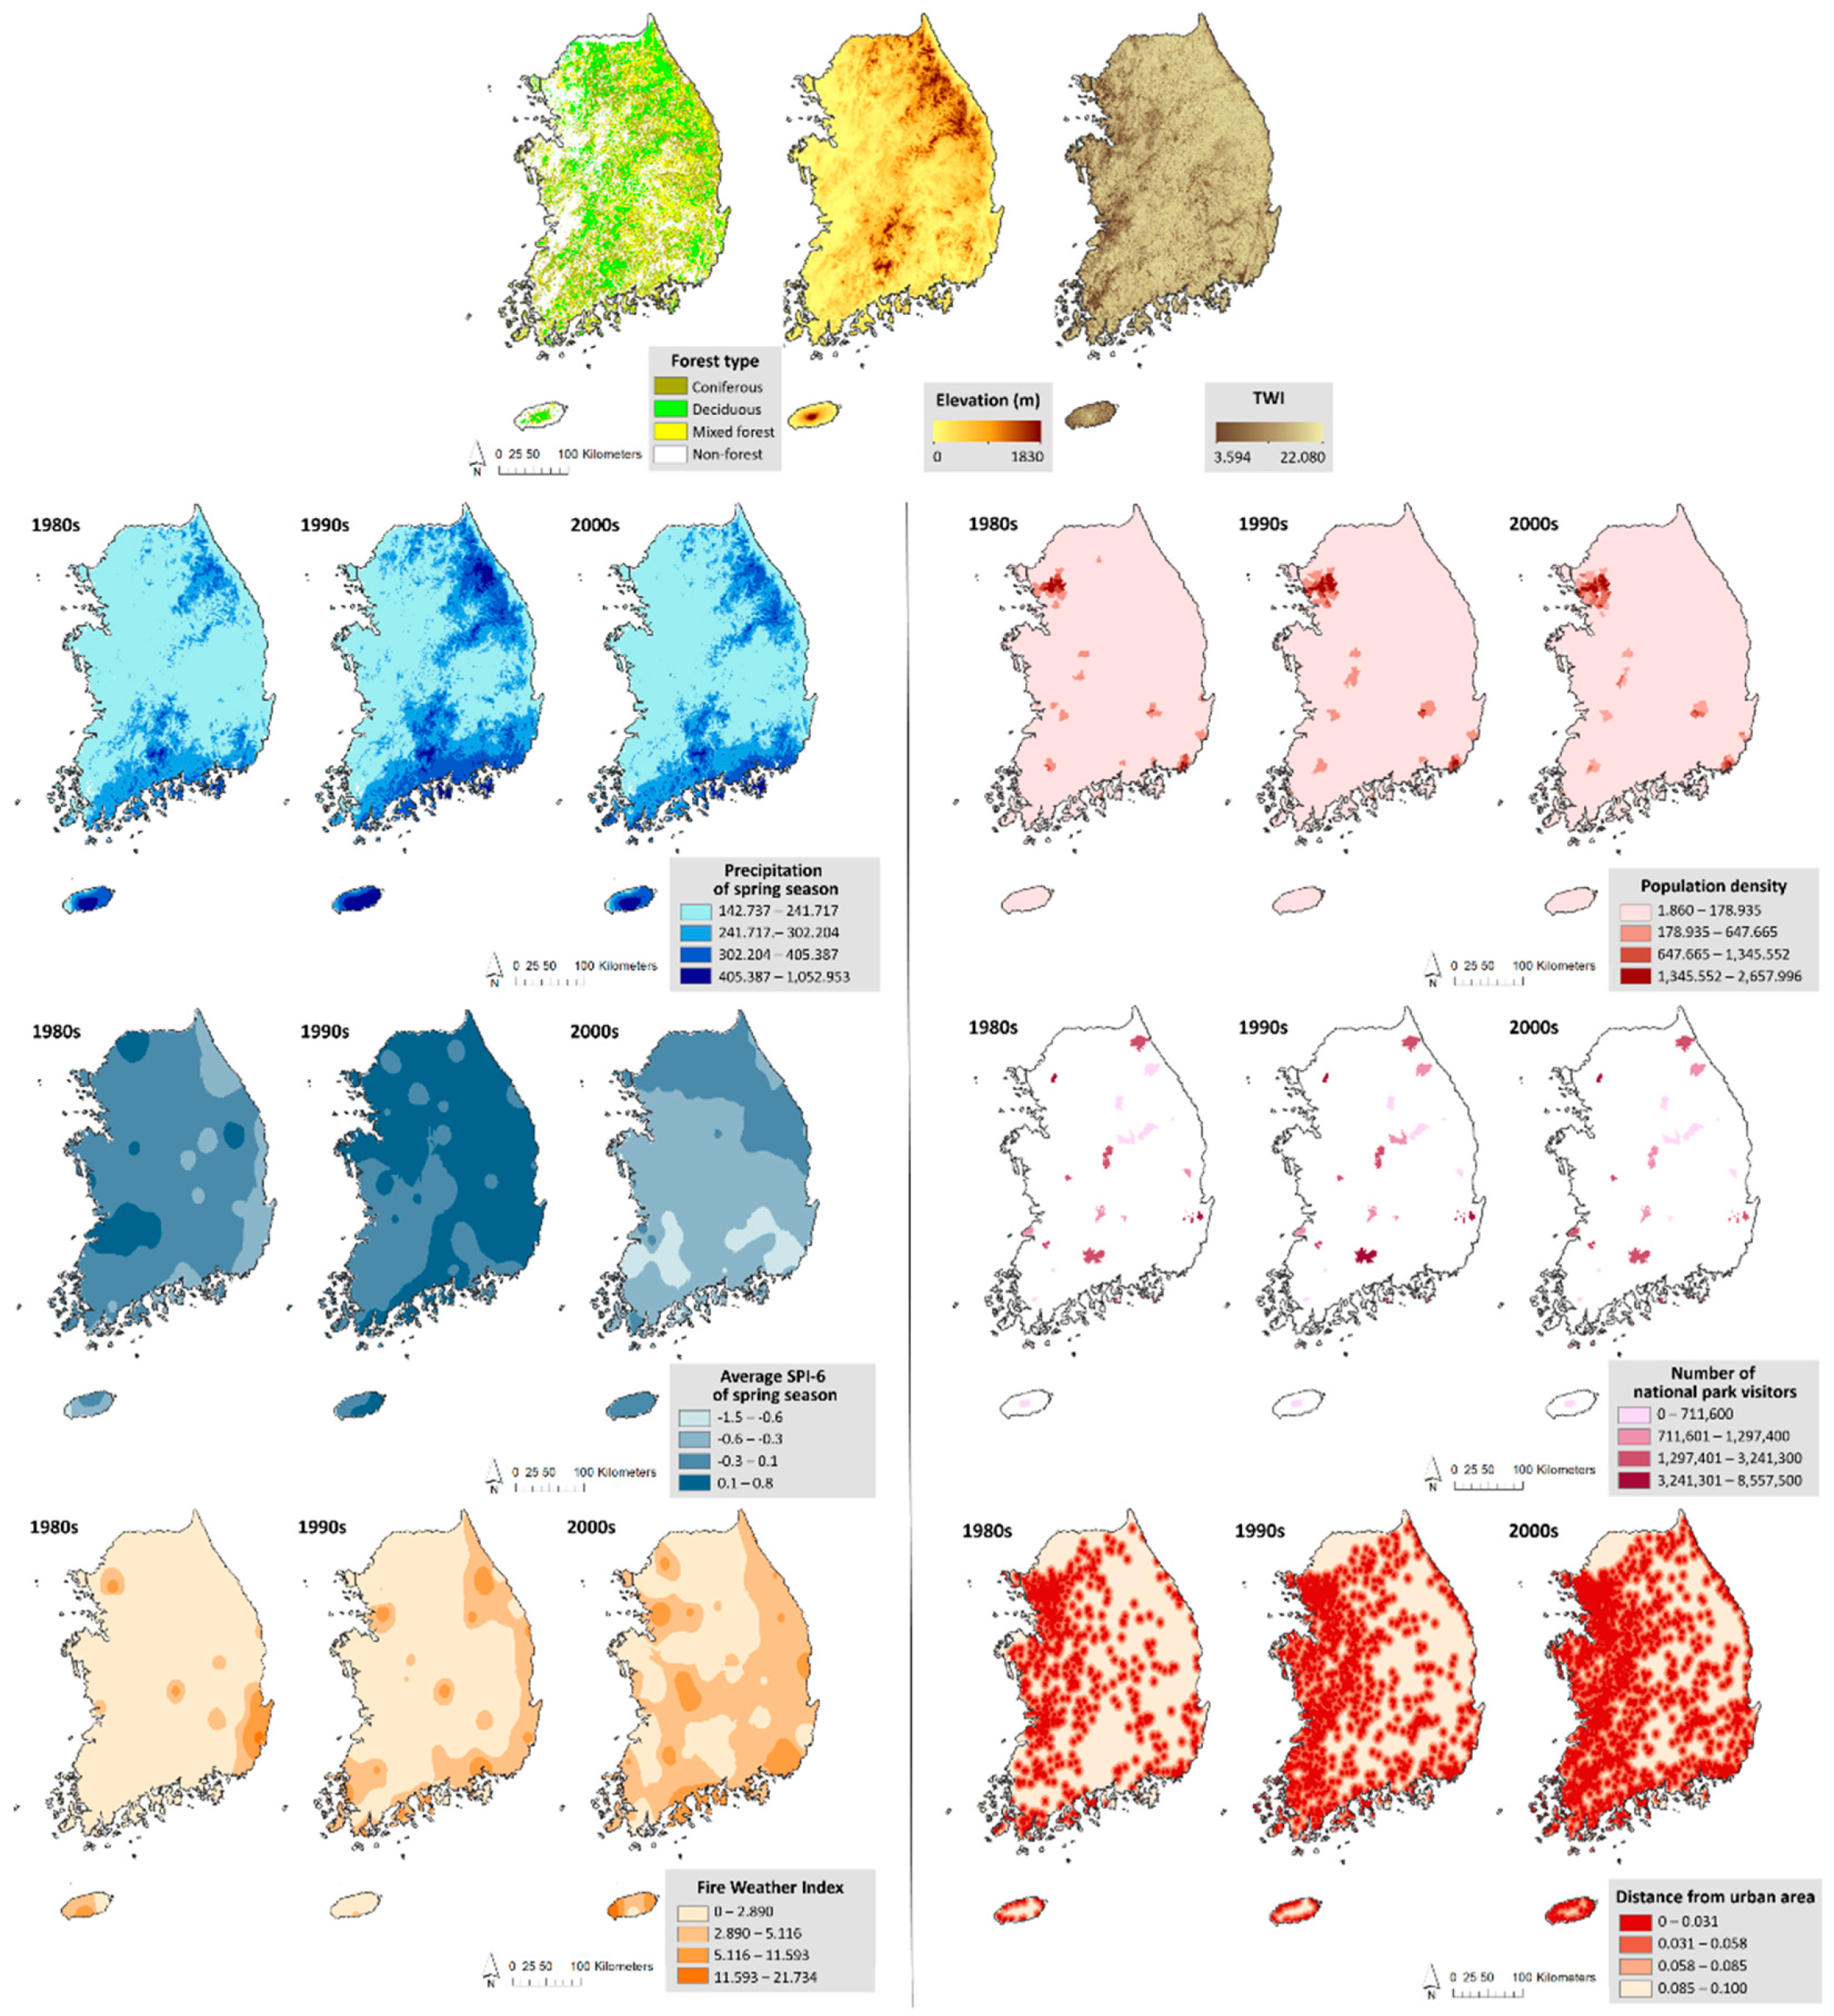
2.3. Socio-Economic and Environmental Factors
2.4. Maximum Entropy Model (Maxent)
2.5. Random Forest Model
2.6. Model Performance
3. Results
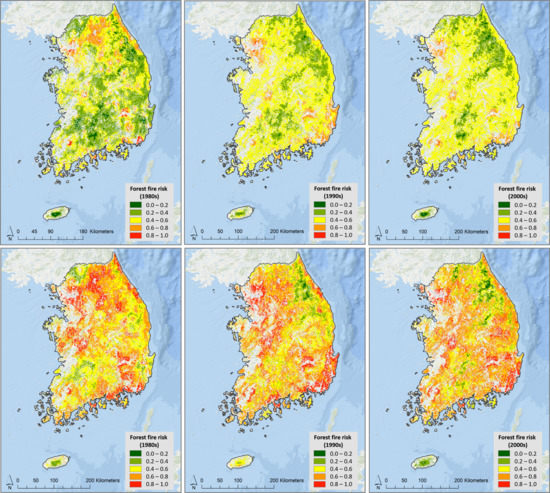
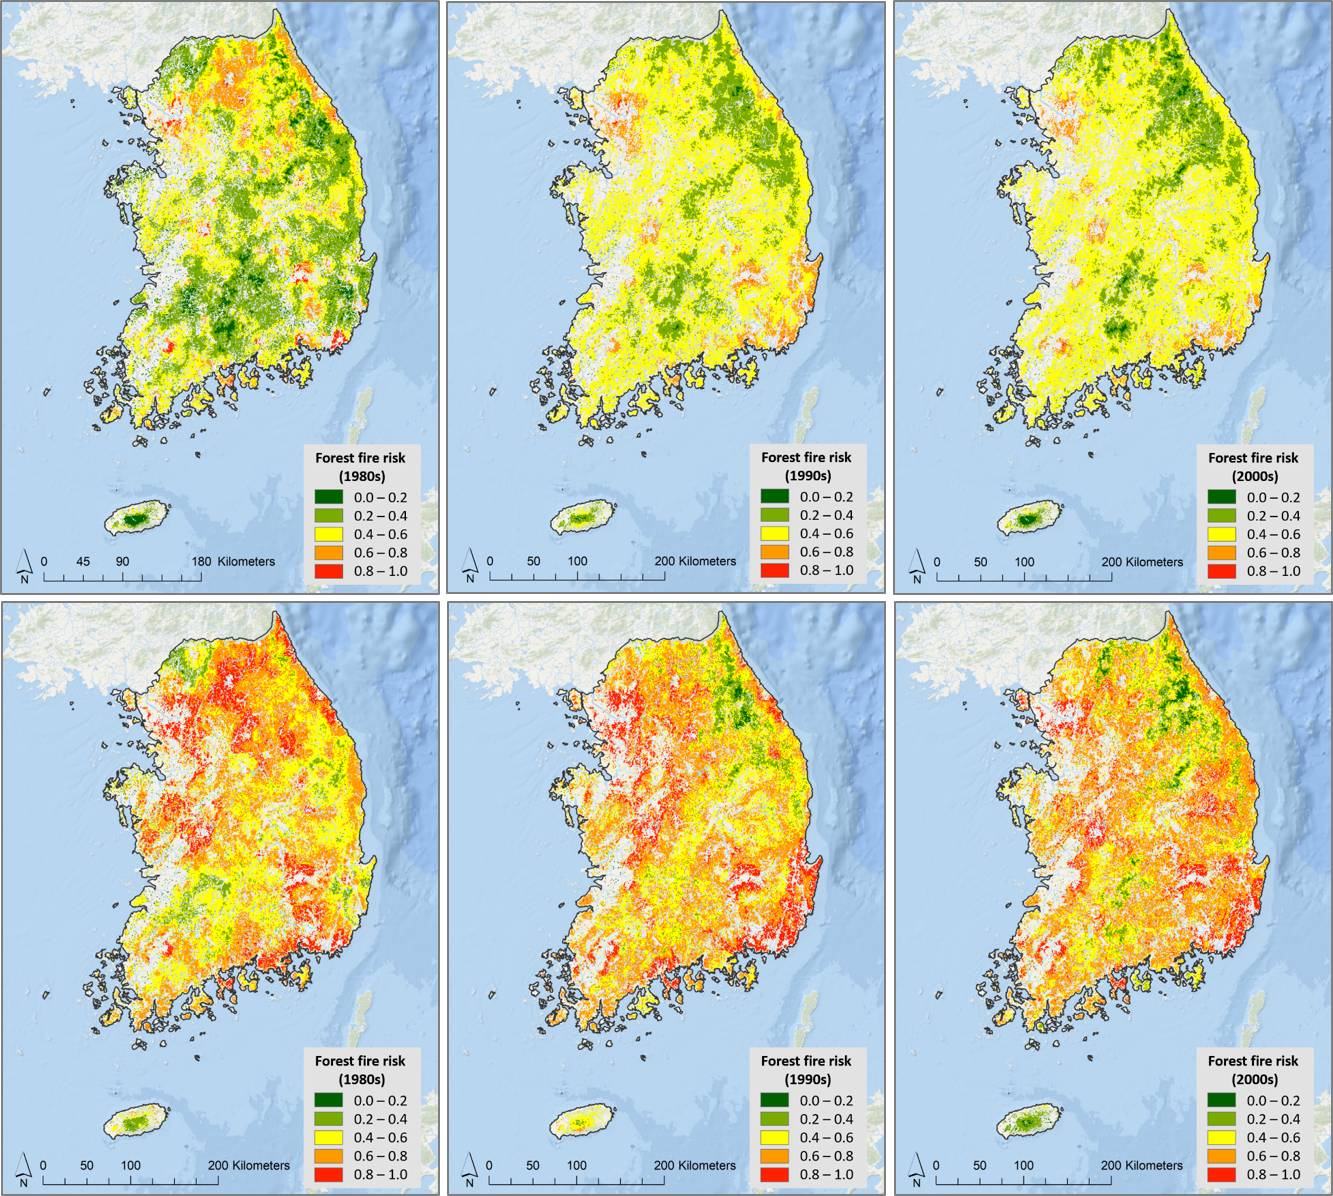
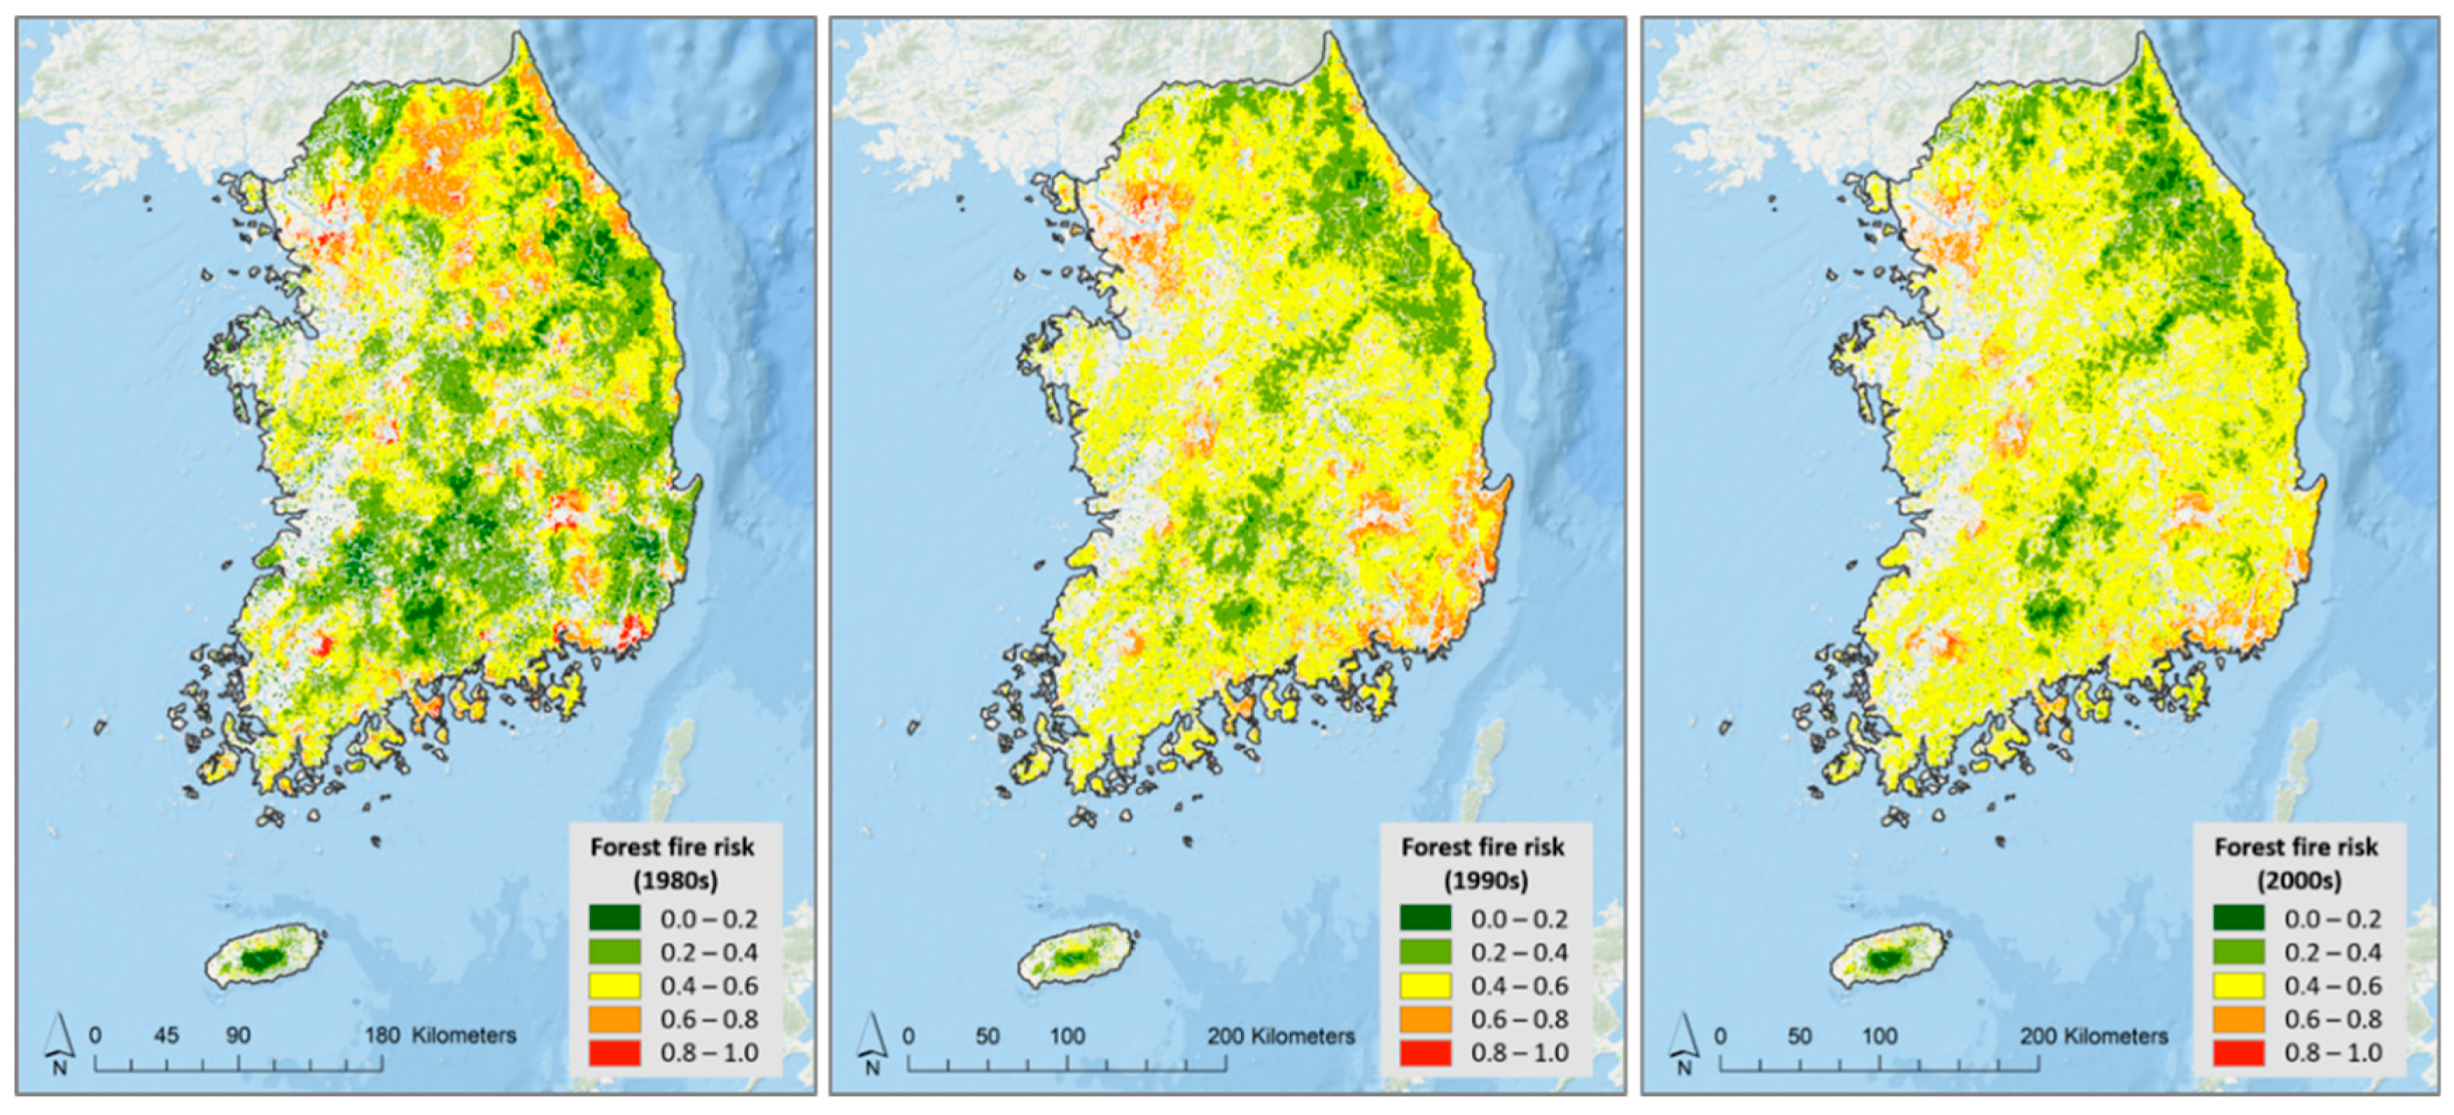
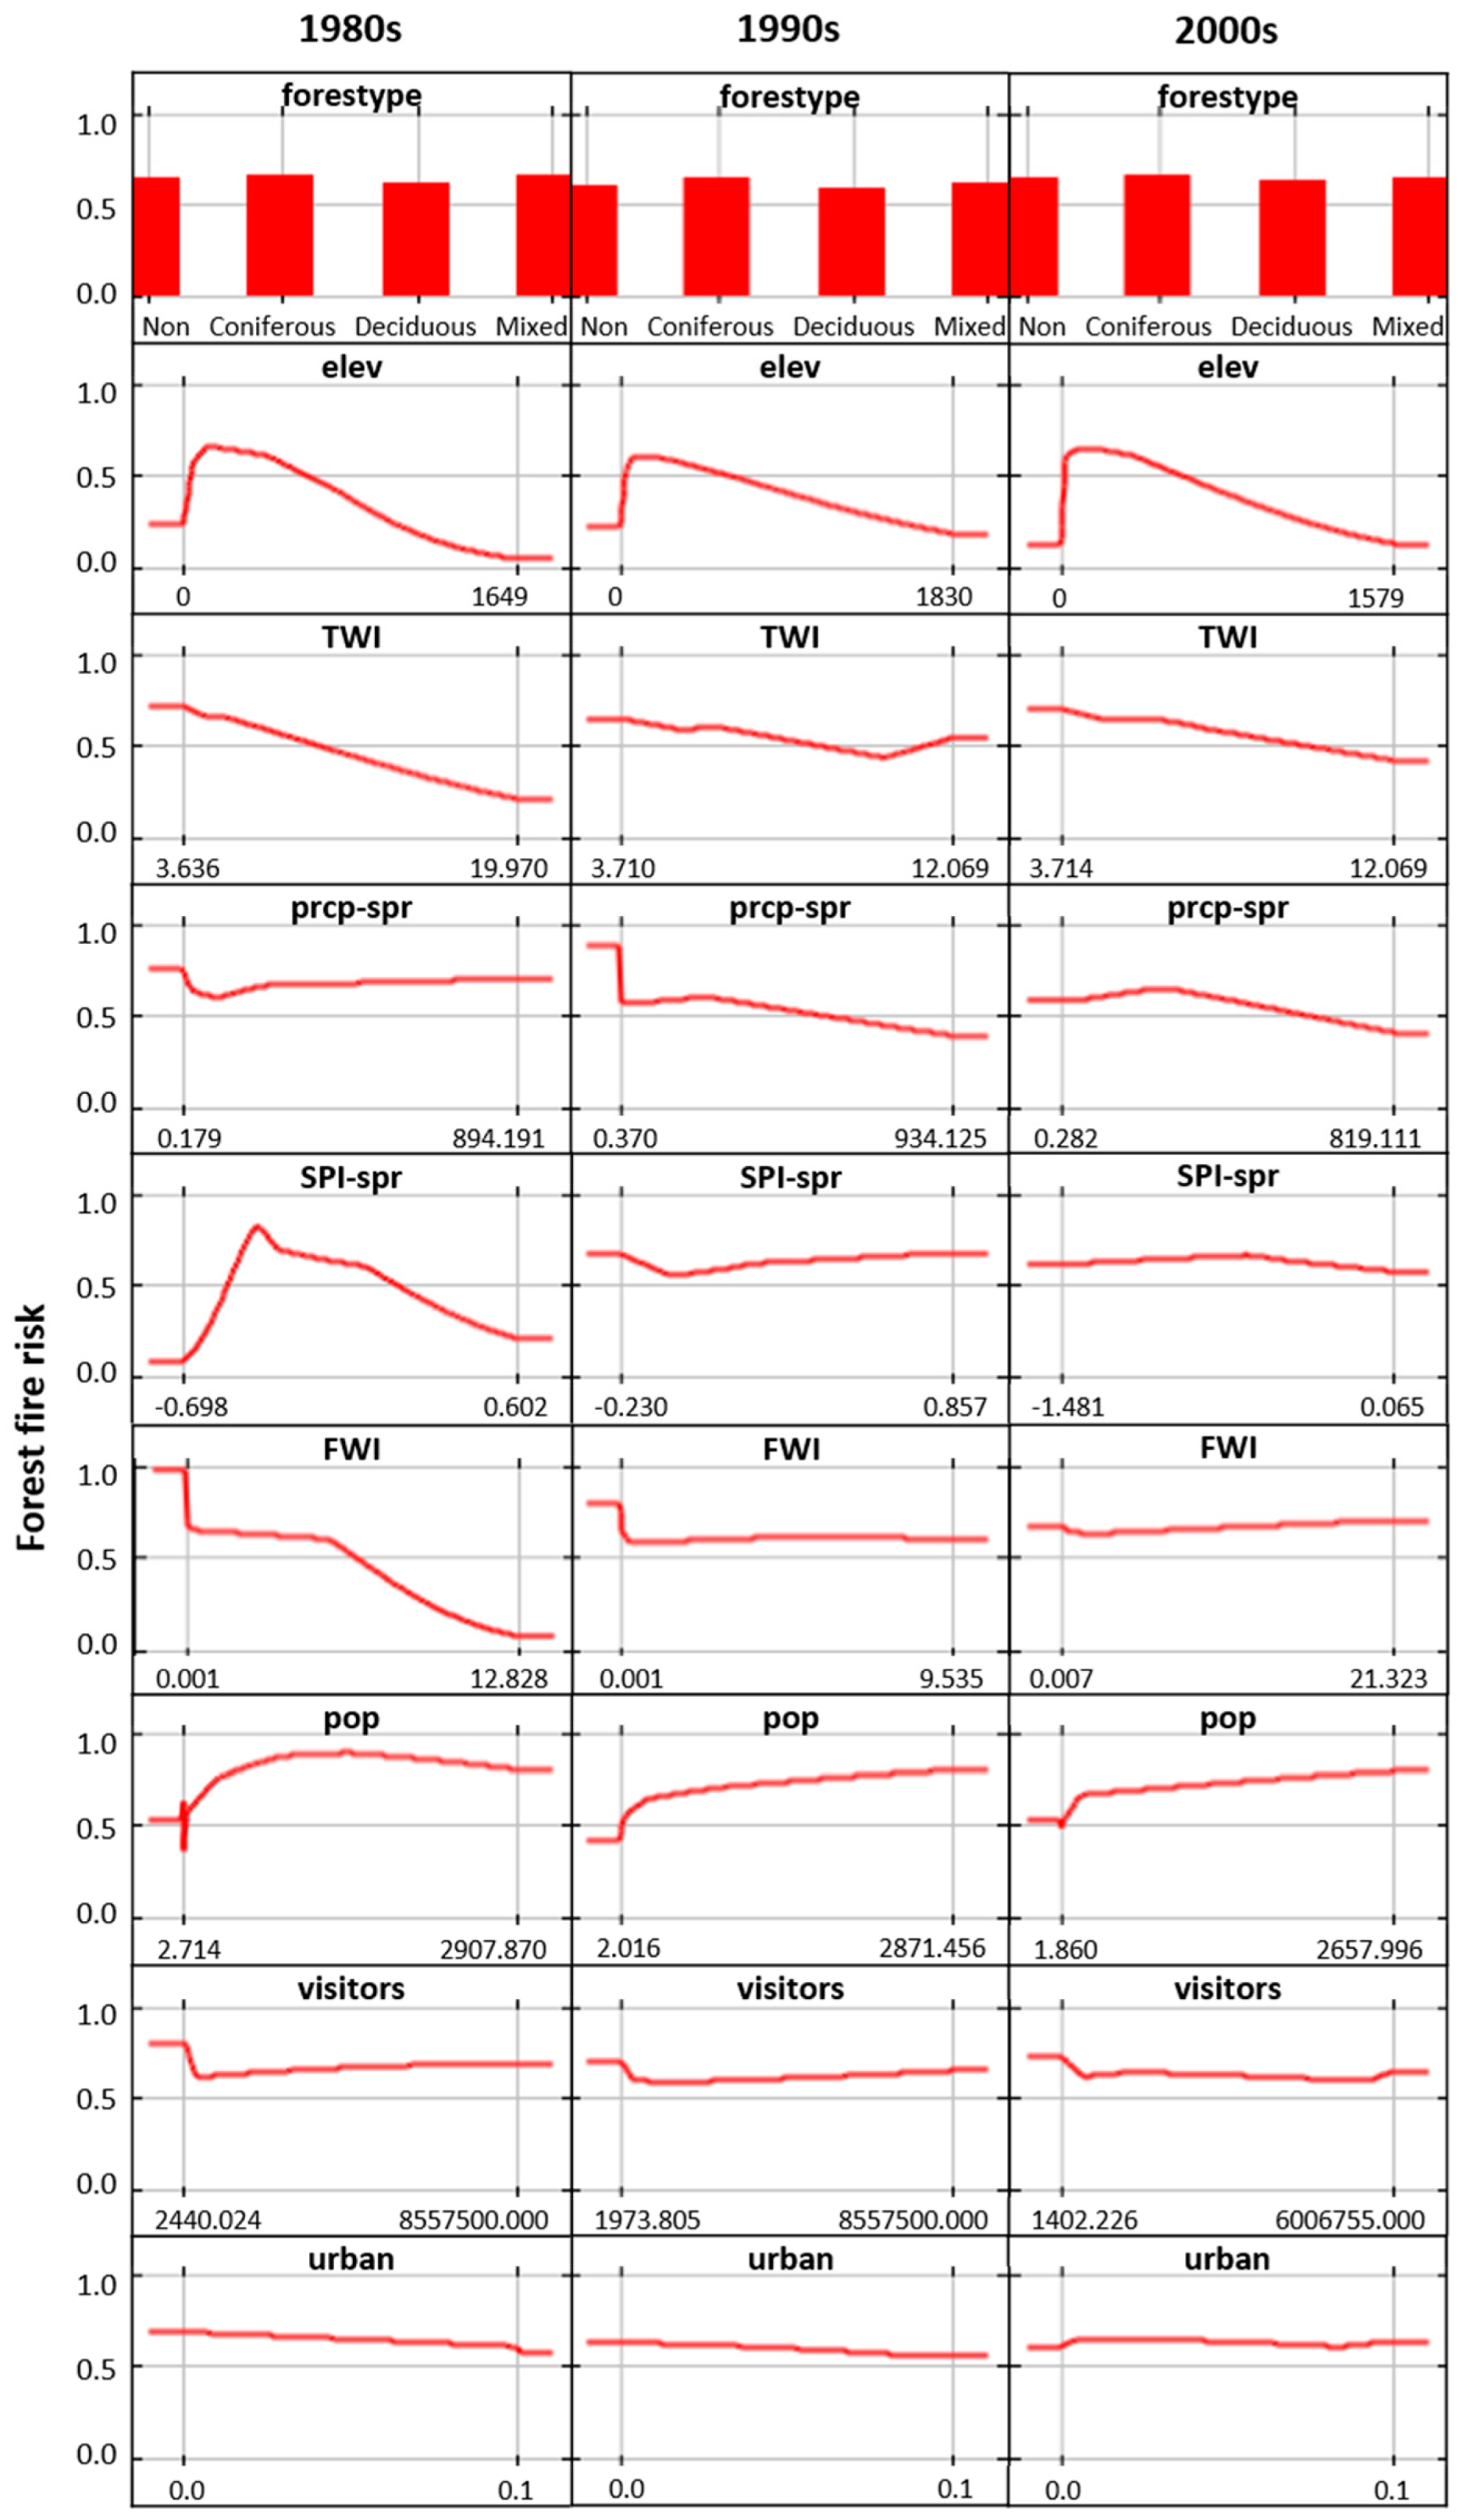
3.1. Maxent Results
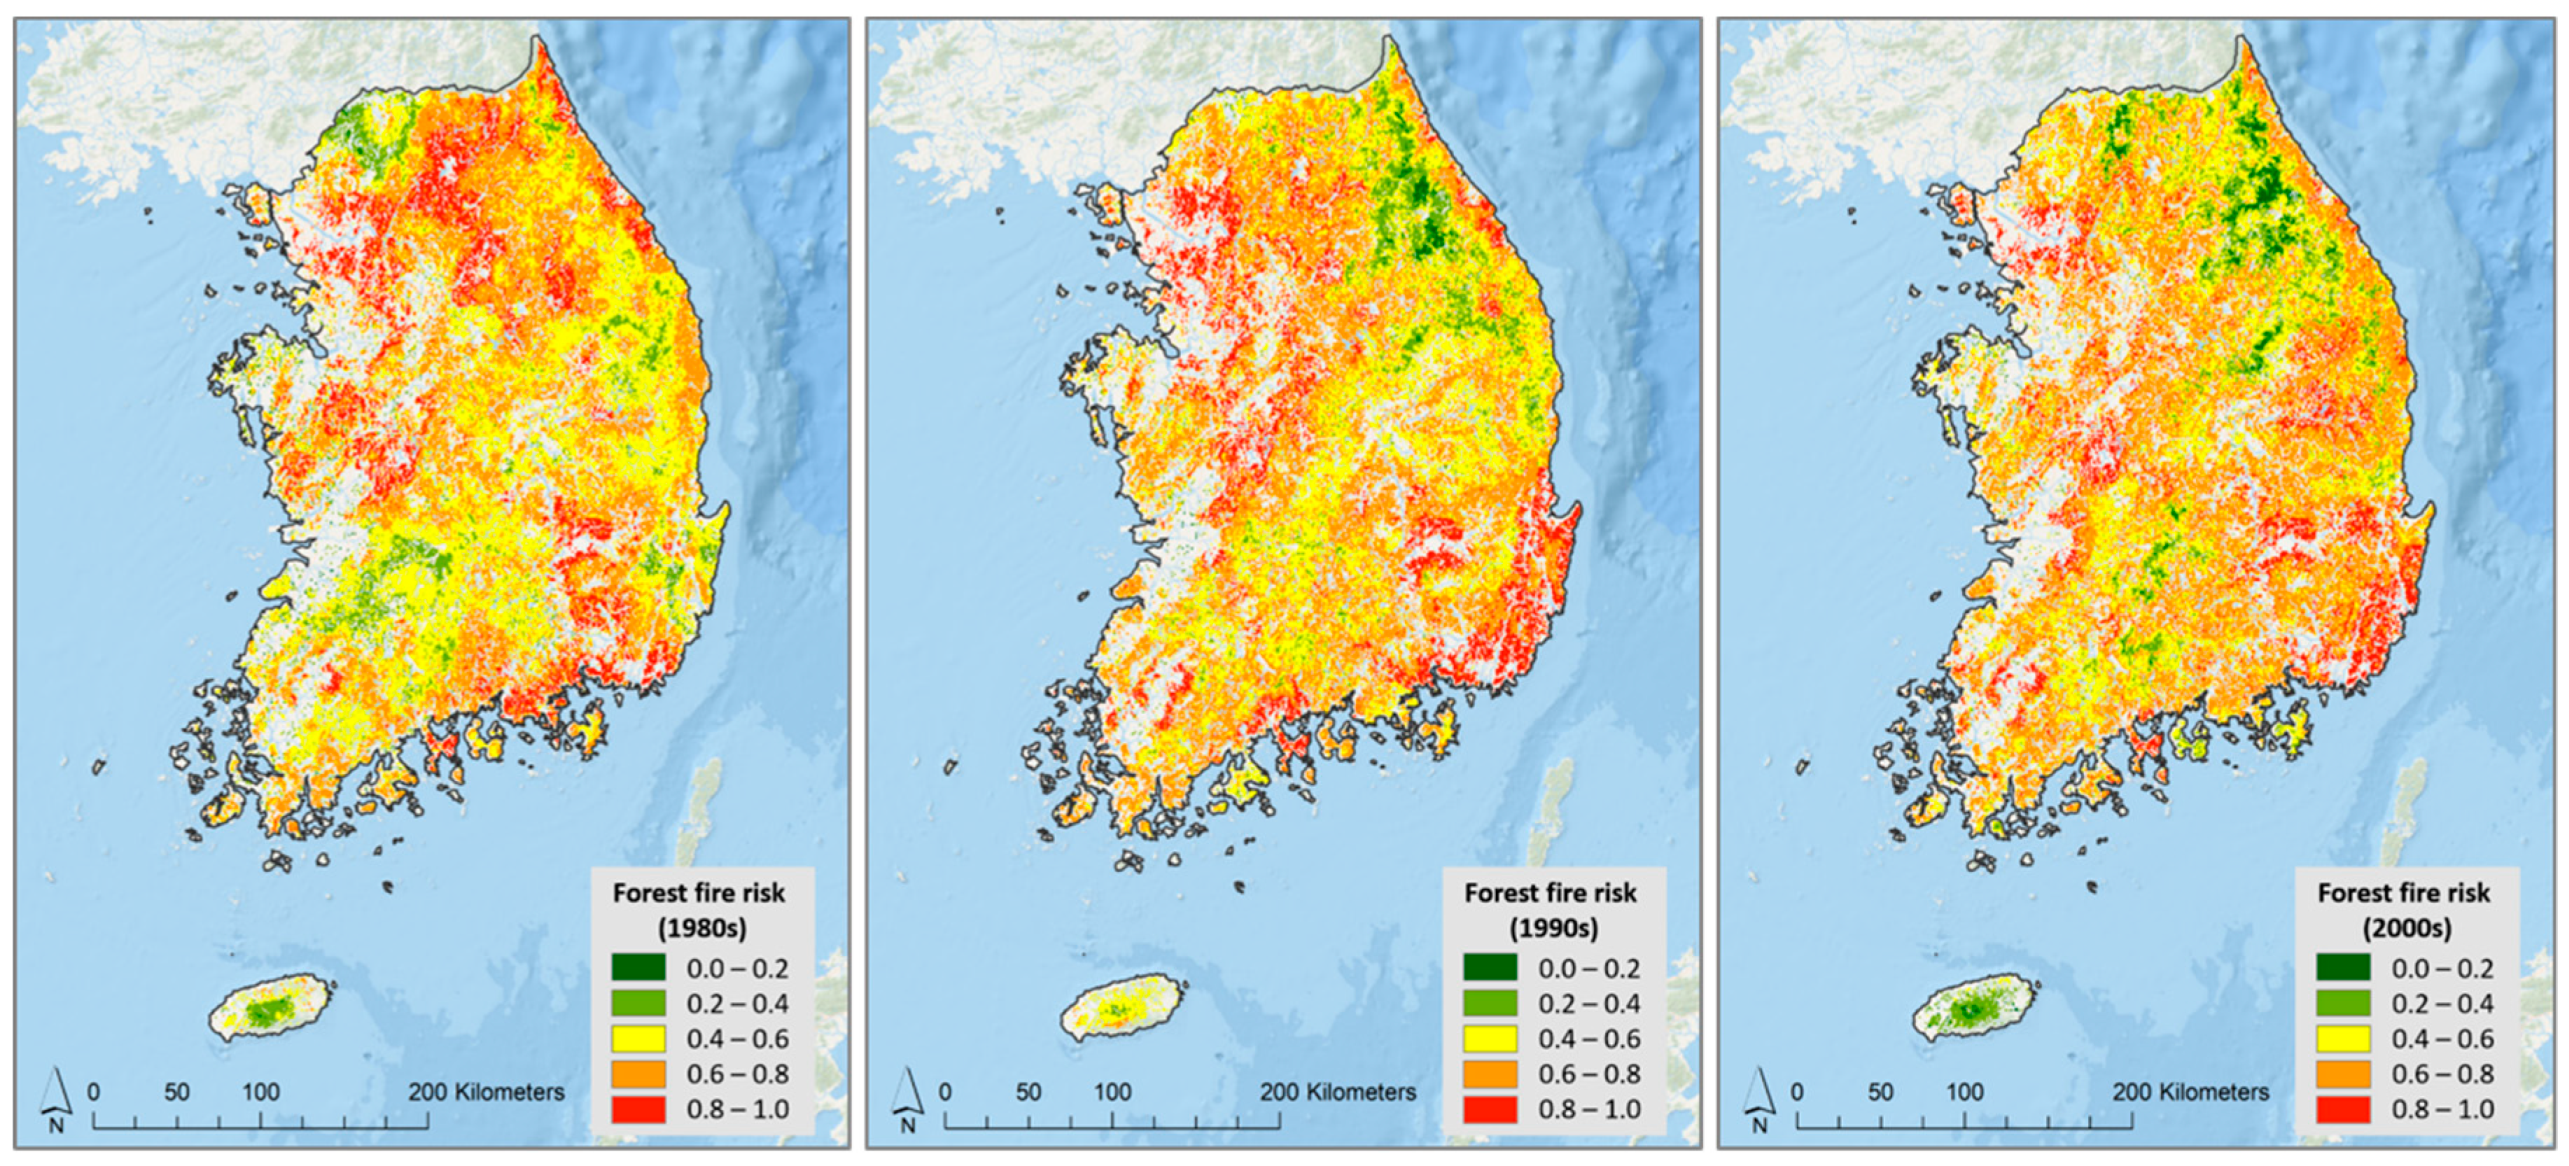
3.2. Random Forest Results
3.3. Comparison and Validation of the Models
4. Discussion
4.1. Impact of Socio-Economic and Environmental Drivers on Forest Fires
4.2. Machine Learning Models with Regard to Spatial Distribution and Accuracy
4.3. Limitations and Uncertainty
4.4. Towards Forest Fire Risk Reduction
5. Conclusions
Author Contributions
Funding
Acknowledgments
Conflicts of Interest
References
- Kwak, H.; Lee, W.K.; Saborowski, J.; Lee, S.Y.; Won, M.S.; Koo, K.S.; Lee, M.B.; Kim, S.N. Estimating the spatial pattern of human-caused forest fires using a generalized linear mixed model with spatial autocorrelation in South Korea. Int. J. Geogr. Inf. Sci. 2012, 26, 1589–1602. [Google Scholar] [CrossRef]
- Korea Forest Service. 2016 Forest Basic Statistics; Korea Forest Service: Daejeon, Korea, 2016. (In Korean)
- Lee, S.Y.; Chae, H.M.; Park, G.S.; Ohga, S. The potential impact of climate change on people-caused forest fire occurrence in South Korea. J. Fac. Agric. Kyushu Univ. 2012, 57, 17–25. [Google Scholar]
- Brown, A.A.; Davis, K.P. Forest Fire: Control and Use; McGraw-Hill: New York, NY, USA, 1973. [Google Scholar]
- Park, J.K.; Jung, W.S.; Kim, E.B.; Jeong, H.J. Study on Analysis of Meteorological Phenomenon effecting on Forest Fire. Proc. Korean Soc. Hazard Mitig. Conf. 2014, 19, 376. (In Korean) [Google Scholar]
- Korea Forest Service. 2016 Statistical Yearbook of Forest Fire; No. 11-1400000-000424-10; Korea Forest Service: Daejeon, Korea, 2017. (In Korean)
- Korea Forest Service. 2017 Statistical Yearbook of Forest Fire; No. 11-1400000-000424-10; Korea Forest Service: Daejeon, Korea, 2018. (In Korean)
- Bridges, B. The Seoul Olympics: Economic miracle meets the world. Int. J. Hist. Sport 2008, 25, 1939–1952. [Google Scholar] [CrossRef]
- Rii, H.U.; Ahn, J.S. Urbanization and its impact on Seoul, Korea. Urbanization. In East Asian and Habitat II; Chung-hua Institution for Economic Research: Taipei, Taiwan, 2002; pp. 83–100. [Google Scholar]
- Romero-Calcerrada, R.; Barrio-Parra, F.; Millington, J.D.A.; Novillo, C.J. Spatial modelling of socioeconomic data to understand patterns of human-caused wildfire ignition risk in the SW of Madrid (central Spain). Ecol. Modell. 2010, 221, 34–45. [Google Scholar] [CrossRef]
- Vilar, L.; Woolford, D.G.; Martell, D.L.; Martín, M.P. A model for predicting human-caused wildfire occurrence in the region of Madrid, Spain. Int. J. Wildland Fire 2010, 19, 325–337. [Google Scholar] [CrossRef]
- Forkel, M.; Dorigo, W.; Lasslop, G.; Teubner, I.; Chuvieco, E.; Thonicke, K. A data-driven approach to identify controls on global fire activity from satellite and climate observations (SOFIA V1). Geosci. Model Dev. 2017, 10, 4443–4476. [Google Scholar] [CrossRef] [Green Version]
- Aragao, L.E.O.C.; Malhi, Y.; Barbier, N.; Lima, A.; Shimabukuro, Y.; Anderson, L.; Saatchi, S. Interactions between rainfall, deforestation and fires during recent years in the Brazilian Amazonia. Philos. Trans. R. Soc. B 2008, 363, 1779–1785. [Google Scholar] [CrossRef] [Green Version]
- Syphard, A.D.; Radeloff, V.C.; Keuler, N.S.; Taylor, R.S.; Hawbaker, T.J.; Stewart, S.I.; Clayton, M.K. Predicting spatial patterns of fire on a southern California landscape. Int. J. Wildland Fire 2008, 17, 602–613. [Google Scholar] [CrossRef]
- Martínez, J.; Vega-Garcia, C.; Chuvieco, E. Human-caused wildfire risk rating for prevention planning in Spain. J. Environ. Manag. 2009, 90, 1241–1252. [Google Scholar] [CrossRef]
- Plucinski, M.P. The timing of vegetation fire occurrence in a human landscape. Fire Saf. J. 2014, 67, 42–52. [Google Scholar] [CrossRef]
- Costafreda-Aumedes, S.; Cosmas, C.; Vega-Garcia, C. Human-caused fire occurrence modelling in perspective: A review. Int. J. Wildland Fire 2017, 26, 983–998. [Google Scholar] [CrossRef]
- Costafreda-Aumedes, S.; Vega-Garcia, C.; Cosmas, C. Improving fire season definition by optimized temporal modelling of daily human-caused ignitions. J. Environ. Manag. 2018, 217, 90–99. [Google Scholar] [CrossRef] [PubMed]
- Bar Massada, A.B.; Syphard, A.D.; Stewart, S.I.; Radeloff, V.C. Wildfire ignition-distribution modelling: A comparative study in the Huron–Manistee National Forest, Michigan, USA. Int. J. Wildland Fire 2013, 22, 174–183. [Google Scholar] [CrossRef]
- Oliveira, S.; Oehler, F.; San-Miguel-Ayanz, J.; Camia, A.; Pereira, J.M. Modeling spatial patterns of fire occurrence in Mediterranean Europe using Multiple Regression and Random Forest. For. Ecol. Manag. 2012, 275, 117–129. [Google Scholar] [CrossRef]
- Vilar, L.; Gómez, I.; Martínez-Vega, J.; Echavarría, P.; Riaño, D.; Martín, M.P. Multitemporal modelling of socio-economic wildfire drivers in Central Spain between the 1980s and the 2000s: Comparing generalized linear models to machine learning algorithms. PLoS ONE 2016, 11, e0161344. [Google Scholar] [CrossRef] [PubMed]
- Hastie, T.; Tibshirani, R.; Friedman, J. Overview of supervised learning. In The Elements of Statistical Learning; Springer: New York, NY, USA, 2009; pp. 9–41. ISBN 978-0-387-84858-7. [Google Scholar]
- Elith, J.; Graham, C.H.; Anderson, R.P.; Dudík, M.; Ferrier, S.; Guisan, A.; Hijmans, R.J.; Huettmann, F.; Leathwick, J.R.; Lehmann, A.; et al. Novel methods improve prediction of species’ distributions from occurrence data. Ecography 2006, 29, 129–151. [Google Scholar] [CrossRef] [Green Version]
- Phillips, S.J.; Anderson, R.P.; Schapire, R.E. Maximum entropy modeling of species geographic distributions. Ecol. Model. 2006, 190, 231–259. [Google Scholar] [CrossRef]
- Parisien, M.A.; Moritz, M.A. Environmental controls on the distribution of wildfire at multiple spatial scales. Ecol. Monogr. 2009, 79, 127–154. [Google Scholar] [CrossRef]
- Renard, Q.; Pélissier, R.; Ramesh, B.R.; Kodandapani, N. Environmental susceptibility model for predicting forest fire occurrence in the Western Ghats of India. Int. J. Wildland Fire 2012, 21, 368–379. [Google Scholar] [CrossRef]
- Breiman, L. Random forests. Mach. Learn. 2001, 45, 5–32. [Google Scholar] [CrossRef]
- Archibald, S.; Roy, D.P.; van Wilgen, B.W.; Scholes, R.J. What limits fire? An examination of drivers of burnt area in Southern Africa. Glob. Chang. Biol. 2009, 15, 612–630. [Google Scholar] [CrossRef]
- Arpaci, A.; Malowerschnig, B.; Sass, O.; Vacik, H. Using multi variate data mining techniques for estimating fire susceptibility of Tyrolean forests. Appl. Geogr. 2014, 53, 258–270. [Google Scholar] [CrossRef]
- Rahmati, O.; Pourghasemi, H.R.; Melesse, A.M. Application of GIS-based data driven random forest and maximum entropy models for groundwater potential mapping: A case study at Mehran Region, Iran. Catena 2016, 137, 360–372. [Google Scholar] [CrossRef]
- Aldersley, A.; Murray, S.J.; Cornell, S.E. Global and regional analysis of climate and human drivers of wildfire. Sci. Total Environ. 2011, 409, 3472–3481. [Google Scholar] [CrossRef] [PubMed]
- Kim, G.S.; Lim, C.H.; Kim, S.J.; Lee, J.; Son, Y.; Lee, W.K. Effect of national-scale afforestation on forest water supply and soil loss in South Korea, 1971–2010. Sustainability 2017, 9, 1017. [Google Scholar] [CrossRef]
- Lee, J.; Lim, C.H.; Kim, G.S.; Markandya, A.; Chowdhury, S.; Kim, S.J.; Son, Y. Economic viability of the national-scale forestation program: The case of success in the Republic of Korea. Ecosyst. Serv. 2018, 29, 40–46. [Google Scholar] [CrossRef]
- Lee, H.W.; Tak, S.H.; Lee, S.H. Numerical experiment on the variation of atmospheric circulation because of wild fire. J. Environ. Sci. Int. 2013, 22, 173–185. [Google Scholar] [CrossRef]
- Campbell, J.L.; Harmon, M.E.; Mitchell, S.R. Can fuel-reduction treatments really increase forest carbon storage in the western US by reducing future fire emissions? Front. Ecol. Environ. 2012, 10, 83–90. [Google Scholar] [CrossRef]
- Moreira, F.; Vaz, P.; Catry, F.; Silva, J.S. Regional variations in wildfire susceptibility of land-cover types in Portugal: Implications for landscape management to minimize fire hazard. Int. J. Wildland Fire 2009, 18, 563–574. [Google Scholar] [CrossRef]
- Korea Forest Service. 2017 47th Forestry Statistical Yearbook; No. 11-1400000-000001-10; Korea Forest Service: Daejeon, Korea, 2017. (In Korean)
- Kim, Y.H.; Baik, J.J. Daily maximum urban heat island intensity in large cities of Korea. Theor. Appl. Climatol. 2004, 79, 151–164. [Google Scholar] [CrossRef]
- Kim, S.J.; Lim, C.H.; Lim, Y.J.; Moon, J.; Song, C.; Lee, W.K. Analyzing Climate Zones Using Hydro-Meteorological Observation Data in Andong Dam Watershed, South Korea. J. Clim. Chang. Res. 2016, 7, 269–282. (In Korean) [Google Scholar] [CrossRef]
- Kim, S.J.; Kim, M.; Lim, C.H.; Lee, W.K.; Kim, B.J. Applicability Analysis of FAO56 Penman-Monteith Methodology for Estimating Potential Evapotranspiration in Andong Dam Watershed Using Limited Meteorological Data. J. Clim. Chang. Res. 2017, 8, 125–143. (In Korean) [Google Scholar] [CrossRef]
- NIMS. Climate Change Over 100 Years on the Korean Peninsula; No. 11-1360620-000132-01; National Institute of Meteorological Science (NIMS): Seogwipo, Korea, 2018. (In Korean)
- Kolbek, J.; Srutek, M.; Box, E.E. (Eds.) Forest Vegetation of Northeast Asia; Springer Science & Business Media: Berlin, Germany, 2013; Volume 28, ISBN 978-94-017-0143-3. [Google Scholar]
- McKenzie, D.; Gedalof, Z.E.; Peterson, D.L.; Mote, P. Climatic change, wildfire, and conservation. Conserv. Biol. 2004, 18, 890–902. [Google Scholar] [CrossRef]
- Pourtaghi, Z.S.; Pourghasemi, H.R.; Aretano, R.; Semeraro, T. Investigation of general indicators influencing on forest fire and its susceptibility modeling using different data mining techniques. Ecol. Indic. 2016, 64, 72–84. [Google Scholar] [CrossRef]
- Pourtaghi, Z.S.; Pourghasemi, H.R.; Rossi, M. Forest fire susceptibility mapping in the Minudasht forests, Golestan province, Iran. Environ. Earth Sci. 2015, 73, 1515–1533. [Google Scholar] [CrossRef]
- Adeney, J.M.; Christensen, N.L., Jr.; Pimm, S.L. Reserves protect against deforestation fires in the Amazon. PLoS ONE 2009, 4, e5014. [Google Scholar] [CrossRef] [PubMed]
- Lee, B.; Ryu, G.; Kim, S.; Kim, K. Development of forest fire occurrence probability model using logistic regression. J. Korean For. Soc. 2012, 101, 1–6. (In Korean) [Google Scholar]
- Ruffault, J.; Mouillot, F. Contribution of human and biophysical factors to the spatial distribution of forest fire ignitions and large wildfires in a French Mediterranean region. Int. J. Wildland Fire 2017, 26, 498–508. [Google Scholar] [CrossRef]
- Moore, I.D.; Grayson, R.B.; Ladson, A.R. Digital terrain modelling: A review of hydrological, geomorphological, and biological applications. Hydrol. Process. 1991, 5, 3–30. [Google Scholar] [CrossRef]
- Nalder, I.A.; Wein, R.W. Spatial interpolation of climatic normals: Test of a new method in the Canadian boreal forest. Agric. For. Meteorol. 1998, 92, 211–225. [Google Scholar] [CrossRef]
- Yun, J.I.; Choi, J.Y.; Yoon, Y.K.; Chung, U. A spatial interpolation model for daily minimum temperature over mountainous regions. Korean J. Agric. For. Meteorol. 2000, 2, 175–182. (In Korean) [Google Scholar]
- McKee, T.B.; Doesken, N.J.; Kleist, J. The relationship of drought frequency and duration to time scales. In Proceedings of the 8th Conference on Applied Climatology, Anaheim, CA, USA, 17–22 January 1993; American Meteorological Society: Boston, MA, USA, 1993; Volume 17, No. 22. pp. 179–183. [Google Scholar]
- Ayala-Bizarro, I.; Zúñiga-Mendoza, J. SPIGA: Compute SPI Index Using the Methods Genetic Algorithm and Maximum Likelihood. R package version 1.0.0. 2016. Available online: https://CRAN.R-project.org/package=SPIGA (accessed on 25 September 2018).
- Roy, D.P.; Kumar, S.S. Multi-year MODIS active fire type classification over the Brazilian Tropical Moist Forest Biome. Int. J. Digit. Earth 2017, 10, 54–84. [Google Scholar] [CrossRef]
- Hirose, K.; Kim, C.K.; Kim, C.S.; Chang, B.W.; Igarashi, Y.; Aoyama, M. Wet and dry deposition patterns of plutonium in Daejeon, Korea. Sci. Total Environ. 2009, 332, 243–252. [Google Scholar] [CrossRef] [PubMed]
- Wang, X.; Cantin, A.; Parisien, M.A.; Wotton, M.; Anderson, K.; Flannigan, M. fwi.fbp: Fire Weather Index System and Fire Behaviour Prediction System Calculations. R package version 1.7. 2016. Available online: https://CRAN.R-project.org/package=fwi.fbp (accessed on 26 October 2018).
- Danielsson, P.E. Euclidean distance mapping. Comput. Graph. Image Process. 1980, 14, 227–248. [Google Scholar] [CrossRef] [Green Version]
- Syphard, A.D.; Keeley, J.E. Location, timing and extent of wildfire vary by cause of ignition. Int. J. Wildland Fire 2015, 24, 37–47. [Google Scholar] [CrossRef]
- West, A.M.; Kumar, S.; Jarnevich, C.S. Regional modeling of large wildfires under current and potential future climates in Colorado and Wyoming, USA. Clim. Change 2016, 134, 565–577. [Google Scholar] [CrossRef]
- Swets, J.A. Measuring the accuracy of diagnostic systems. Science 1988, 240, 1285–1293. [Google Scholar] [CrossRef]
- Proosdij, A.S.; Sosef, M.S.; Wieringa, J.J.; Raes, N. Minimum required number of specimen records to develop accurate species distribution models. Ecography 2016, 39, 542–552. [Google Scholar] [CrossRef]
- Jaynes, E.T. Information theory and statistical mechanics. Phys. Rev. 1957, 106, 620. [Google Scholar] [CrossRef]
- Deblauwe, V.; Barbier, N.; Couteron, P.; Lejeune, O.; Bogaert, J. The global biogeography of semi-arid periodic vegetation patterns. Glob. Ecol. Biogeogr. 2008, 17, 715–723. [Google Scholar] [CrossRef]
- Lim, C.H.; Yoo, S.; Choi, Y.; Jeon, S.W.; Son, Y.; Lee, W.K. Assessing Climate Change Impact on Forest Habitat Suitability and Diversity in the Korean Peninsula. Forest 2018, 9, 259. [Google Scholar] [CrossRef]
- Cutler, D.R.; Edwards, T.C., Jr.; Beard, K.H.; Cutler, A.; Hess, K.T.; Gibson, J.; Lawler, J.J. Random forests for classification in ecology. Ecology 2007, 88, 2783–2792. [Google Scholar] [CrossRef] [PubMed]
- Prasad, A.M.; Iverson, L.R.; Liaw, A. Newer classification and regression tree techniques: Bagging and random forests for ecological prediction. Ecosystems 2006, 9, 181–199. [Google Scholar] [CrossRef]
- Wiesmeier, M.; Barthold, F.; Blank, B.; Kögel-Knabner, I. Digital mapping of soil organic matter stocks using Random Forest modeling in a semi-arid steppe ecosystem. Plant Soil. 2011, 340, 7–24. [Google Scholar] [CrossRef]
- Calle, M.L.; Urrea, V. Letter to the editor: Stability of random forest importance measures. Brief. Bioinf. 2010, 12, 86–89. [Google Scholar] [CrossRef] [PubMed]
- Liaw, A.; Wiener, M. Classification and Regression by randomForest. R News 2002, 2, 18–22. [Google Scholar]
- Naimi, B.; Araujo, M.B. sdm: A reproducible and extensible R platform for species distribution modelling. Ecography 2016, 39, 368–375. [Google Scholar] [CrossRef]
- Tien Bui, D.; Le, K.T.T.; Nguyen, V.C.; Le, H.D.; Revhaug, I. Tropical forest fire susceptibility mapping at the Cat Ba national park area, Hai Phong City, Vietnam, using GIS-Based kernel logistic regression. Remote Sens. 2016, 8, 347. [Google Scholar] [CrossRef]
- Frattini, P.; Costa, G.; Carrara, A. Techiniques for evaluating performance of landslide susceptibility models. Eng. Geol. 2010, 111, 62–72. [Google Scholar] [CrossRef]
- Yesilnacar, E.K. The Application of Computational Intelligence to Landslide Susceptibility Mapping in Turkey. Ph.D. Thesis, Department of Geomatics, University of Melbourne, Melbourne, Australia, 2005. [Google Scholar]
- Tien Bui, D.; Bui, Q.P.; Pradhan, B.; Nampak, H.; Trinh, P.T. A hybrid artificial intelligence approach using GI-based neural-fuzzy inference system and particle swarm optimization for forest fire susceptibility modeling at a tropical area. Agric. For. Meteorol. 2017, 233, 32–44. [Google Scholar] [CrossRef]
- Ho-Sang, S. Characteristics of Urban Sprawl in Seoul Metropolitan Region: An Integration of Remote Sensing and GIS Approach. Korea Spat. Plan. Rev. 2004, 40, 53–69. (In Korean) [Google Scholar]
- Small, C.; Nicholls, R.J. A global analysis of human settlement in coastal zones. J. Coast. Res. 2003, 584–599. [Google Scholar] [CrossRef]
- Lee, S.W.; Lee, M.B.; Lee, Y.G.; Won, M.S.; Kim, J.J.; Hong, S.K. Relationship between landscape structure and burn severity at the landscape and class levels in Samchuck, South Korea. For. Ecol. Manag. 2009, 258, 1594–1604. [Google Scholar] [CrossRef]
- Lee, H.J.; Kim, E.J.; Lee, S.W. Examining Spatial Variation in the Effects of Japanese Red Pine (Pinus densiflora) on Burn Severity Using Geographically Weighted Regression. Sustainability 2017, 9, 804. [Google Scholar] [CrossRef]
- Lee, H.J.; Choi, Y.E.; Lee, S.W. Complex Relationships of the Effects of Topographic Characteristics and Susceptible Tree Cover on Burn Severity. Sustainability 2018, 10, 295. [Google Scholar] [CrossRef]
- Lim, C.H.; Kim, Y.S.; Won, M.; Kim, S.J.; Lee, W.K. Can satellite-based data substitute for surveyed data to predict the spatial probability of forest fire? A geostatistical approach to forest fire in the Republic of Korea. Geomat. Nat. Haz. Risk 2018, in press. [Google Scholar]
- Heckmann, T.; Gegg, K.; Gegg, A.; Becht, M. Sample size matters: Investigating the effect of sample size on a logistic regression susceptibility model for debris flows. Nat. Hazards Earth Syst. Sci. 2014, 14, 259–278. [Google Scholar] [CrossRef]
- Hernandez, P.A.; Franke, I.; Herzog, S.K.; Pacheco, V.; Paniagua, L.; Quintana, H.L.; Soto, A.; Swenson, J.J.; Tovar, C.; Valqui, T.H.; et al. Predicting distribution in poor-studied landscapes. Biodivers. Conserv. 2008, 17, 1353–1366. [Google Scholar] [CrossRef]
- Williams, J.N.; Seo, C.; Thorne, J.; Nelson, J.K.; Erwin, S.; O’Brien, J.M.; Schwartz, M.W. Using species distribution models to predict new occurrences for rare plants. Divers. Distrib. 2009, 15, 565–576. [Google Scholar] [CrossRef]
- Kim, K.; Koo, K.; Youn, H.J.; Lee, C.; Won, M.; Lee, B.D.; Woo, C.S.; Kim, S.; Lee, M.B. 2011 Forest Disaster White Paper; No. 11-1400377-000524-01; National Institute of Forest Science (NIFOS): Daejeon, Korea, 2012. (In Korean)
- Korea Forest Service. 2006 Comprehensive Measures to Prevent Forest Fires. 1st Year of Basic Plan for Prevention of Forest Fire; Korea Forest Service: Daejeon, Korea, 2006. (In Korean)
- Iliadis, L.S. A decision support system applying an integrated fuzzy model for long-term forest fire risk estimation. Environ. Model. Softw. 2005, 20, 613–621. [Google Scholar] [CrossRef]
- Miller, C.; Ager, A.A. A review of recent advances in risk analysis for wildfire management. Int. J. Wildland Fire 2013, 22, 1–14. [Google Scholar] [CrossRef]
- Chou, Y.H.; Minnich, R.A.; Chase, R.A. Mapping probability of fire occurrence in San Jacinto Mountains, California, USA. Environ. Manag. 1993, 17, 129–140. [Google Scholar] [CrossRef]
- Hirsch, K.; Kafka, V.; Tymstra, C.; McAlpine, R.; Hawkes, B.; Stegehuis, H.; Peck, K. Fire-smart forest management: A pragmatic approach to sustainable forest management in fire-dominated ecosystems. Forest Chron. 2001, 77, 357–363. [Google Scholar] [CrossRef] [Green Version]
- Millington, J.D. Wildfire risk mapping: Considering environmental change in space and time. J. Mediterr. Ecol. 2005, 6, 33. [Google Scholar]
- Ritchie, M.W.; Skinner, C.N.; Hamilton, T.A. Probability of tree survival after wildfire in an interior pine forest of northern California: Effects of thinning and prescribed fire. For. Ecol. Manag. 2007, 247, 200–208. [Google Scholar] [CrossRef]
- Hughes, R.; Mercer, D. Planning to reduce risk: The wildfire management overlay in Victoria, Australia. Geograph. Res. 2009, 47, 124–141. [Google Scholar] [CrossRef]
- Gill, A.M.; Stephens, S.L. Scientific and social challenges for the management of fire-prone wildland–urban interfaces. Environ. Res. Lett. 2009, 4, 034014. [Google Scholar] [CrossRef]
- Keane, R.E.; Drury, S.A.; Karau, E.C.; Hessburg, P.F.; Reynolds, K.M. A method for mapping fire hazard and risk across multiple scales and its application in fire management. Ecol. Model. 2010, 221, 2–18. [Google Scholar] [CrossRef]
- San-Miguel-Ayanz, J.; Moreno, J.M.; Camia, A. Analysis of large fires in European Mediterranean landscapes: Lessons learned and perspectives. For. Ecol. Manag. 2013, 294, 11–22. [Google Scholar] [CrossRef]


| Input Variable Acronym | Input Variable | Unit | Source |
|---|---|---|---|
| forestype | Forest type | - | Forest type map from the KFS 1 |
| elev | Elevation | m | Digital elevation model from the Ministry of Land, Infrastructure and Transport 2 |
| TWI | Topographic Wetness Index | - | Digital elevation model from the Ministry of Land, Infrastructure and Transport 2 |
| prcp-spr | Precipitation during spring | mm | Korea Meteorological Administration 3 |
| (the 1980s, 1990s, and 2000s) | |||
| SPI-spr | Average SPI-6 during spring | - | Korea Meteorological Administration 3 |
| (the 1980s, 1990s, and 2000s) | |||
| FWI | Fire Weather Index | - | Korea Meteorological Administration 3 |
| pop | Population density (1985, 1995, 2005) | people per km2 | Population census of Korean Statistical Information Service 4 |
| visitors | Number of national park visitors (the 1980s, 1990s, and 2000s) | Average people per year | Korea National Park Service 5 |
| urban | Distance from urban area (1980, 1990, 2000) | - | Land cover map from BIZ-GIS 6 |
| Input Variable | Percent Contribution | ||
|---|---|---|---|
| 1980s | 1990s | 2000s | |
| forestype | 1.9 | 3.1 | 1.8 |
| elev | 22.1 | 19.6 | 33.4 |
| TWI | 4.1 | 6.4 | 8.2 |
| prcp-spr | 1.4 | 1.2 | 1.3 |
| SPI-spr | 6.9 | 1.6 | 1.9 |
| FWI | 3.7 | 1.7 | 0.3 |
| pop | 43.8 | 54 | 48.7 |
| visitors | 1.4 | 5.5 | 2.3 |
| urban | 14.6 | 7 | 2.1 |
| Input Variable | Variable Importance | ||
|---|---|---|---|
| 1980s | 1990s | 2000s | |
| forestype | 0.0116 | 0.0125 | 0.0205 |
| elev | 0.1232 | 0.1721 | 0.1756 |
| TWI | 0.0831 | 0.1012 | 0.1417 |
| prcp-spr | 0.0680 | 0.0638 | 0.0709 |
| SPI-spr | 0.1583 | 0.0473 | 0.1479 |
| FWI | 0.0533 | 0.0949 | 0.0719 |
| pop | 0.1830 | 0.3050 | 0.2425 |
| visitors | 0.0516 | 0.0651 | 0.1102 |
| urban | 0.0587 | 0.1487 | 0.0676 |
© 2019 by the authors. Licensee MDPI, Basel, Switzerland. This article is an open access article distributed under the terms and conditions of the Creative Commons Attribution (CC BY) license (http://creativecommons.org/licenses/by/4.0/).
Share and Cite
Kim, S.J.; Lim, C.-H.; Kim, G.S.; Lee, J.; Geiger, T.; Rahmati, O.; Son, Y.; Lee, W.-K. Multi-Temporal Analysis of Forest Fire Probability Using Socio-Economic and Environmental Variables. Remote Sens. 2019, 11, 86. https://0-doi-org.brum.beds.ac.uk/10.3390/rs11010086
Kim SJ, Lim C-H, Kim GS, Lee J, Geiger T, Rahmati O, Son Y, Lee W-K. Multi-Temporal Analysis of Forest Fire Probability Using Socio-Economic and Environmental Variables. Remote Sensing. 2019; 11(1):86. https://0-doi-org.brum.beds.ac.uk/10.3390/rs11010086
Chicago/Turabian StyleKim, Sea Jin, Chul-Hee Lim, Gang Sun Kim, Jongyeol Lee, Tobias Geiger, Omid Rahmati, Yowhan Son, and Woo-Kyun Lee. 2019. "Multi-Temporal Analysis of Forest Fire Probability Using Socio-Economic and Environmental Variables" Remote Sensing 11, no. 1: 86. https://0-doi-org.brum.beds.ac.uk/10.3390/rs11010086