Article

Comprehensive In Situ Validation of Five Satellite Land Surface Temperature Data Sets over Multiple Stations and Years

1
Institute of Meteorology and Climate Research, Karlsruhe Institute of Technology (KIT), Hermann-von-Helmholtz-Platz 1, 76344 Eggenstein-Leopoldshafen, Germany
2
Department of Physics and Astronomy, University of Leicester, Leicester LE1 7RH, UK
3
Instituto Português do Mar e da Atmosfera (IPMA), Rua C ao Aeroporto, 1749-077 Lisboa, Portugal
4
Institute of Photogrammetry and Remote Sensing, Karlsruhe Institute of Technology (KIT), Kaiserstr. 12, 76131 Karlsruhe, Germany
*
Author to whom correspondence should be addressed.
Submission received: 1 February 2019 / Revised: 15 February 2019 / Accepted: 20 February 2019 / Published: 26 February 2019

Abstract

:
Global land surface temperature (LST) data derived from satellite-based infrared radiance measurements are highly valuable for various applications in climate research. While in situ validation of satellite LST data sets is a challenging task, it is needed to obtain quantitative information on their accuracy. In the standardised approach to multi-sensor validation presented here for the first time, LST data sets obtained with state-of-the-art retrieval algorithms from several sensors (AATSR, GOES, MODIS, and SEVIRI) are matched spatially and temporally with multiple years of in situ data from globally distributed stations representing various land cover types in a consistent manner. Commonality of treatment is essential for the approach: all satellite data sets are projected to the same spatial grid, and transformed into a common harmonized format, thereby allowing comparison with in situ data to be undertaken with the same methodology and data processing. The large data base of standardised satellite LST provided by the European Space Agency’s GlobTemperature project makes previously difficult to perform LST studies and applications more feasible and easier to implement. The satellite data sets are validated over either three or ten years, depending on data availability. Average accuracies over the whole time span are generally within ±2.0 K during night, and within ± 4.0 K during day. Time series analyses over individual stations reveal seasonal cycles. They stem, depending on the station, from surface anisotropy, topography, or heterogeneous land cover. The results demonstrate the maturity of the LST products, but also highlight the need to carefully consider their temporal and spatial properties when using them for scientific purposes.

Graphical Abstract

1. Introduction

Land surface temperature (LST) is the temperature of the Earth’s surface, also called skin temperature [1]. LST data sets are useful for various applications within climate research. This includes an improved understanding of the climatic effects of land use and land cover change [2], drought monitoring [3], detection of changes in land cover and energy balance [4], monitoring of heatwaves [5], estimation of evapotranspiration [6], or investigations of urban heat islands [7,8,9], and daily cycles of urban heat islands [10,11]. Furthermore, it is used as input for land surface models [12] and numerical weather prediction [1]. LST is usually retrieved from radiometric measurements in the infrared (IR) or microwave (MW) range, i.e., by remote sensing. Global coverage of LST data can be achieved by using satellite-based measurements.
LST is an essential climate variable (ECV) as specified by the Global Climate Observing System (GCOS) [13]. GCOS-identified ECVs are important variables to understand and predict the climate of the earth. To this end, the availability of long-term and quality controlled observations of ECVs is very important.
For a meaningful scientific use of satellite LST, information about the quality of the data sets has to be available. This can be obtained in several ways, including validation against in situ data, radiance-based validation, satellite-satellite intercomparisons, or time series analysis [14,15,16,17].
The aim of this work was to gain more information about the quality of several satellite data sets by validating them against in situ data. Specifically, LST data sets derived for several frequently used polar-orbiting and geostationary satellites are compared over two sets of in situ stations, which are located in areas with different land cover types. The in situ stations are: (1) the stations set up and maintained by Karlsruhe Institute of Technology (KIT), and (2) SURFRAD (Surface Radiation Budget Network) stations operated by the National Oceanic and Atmospheric Administration’s (NOAA’s) Office of Global Programs. Three and ten years of satellite LST data are validated over the KIT stations and the SURFRAD sites, respectively.
Validation against in situ data is recognised to be an essential way of validating satellite LST data, as it achieves the highest quality currently available [14], provides an independent measurement system, and is specific to local values of the quantity required allowing stringency of temporal collocation. In situ validation means that LST obtained from satellite measurements are directly compared to LST from ground measurements, and the absolute difference between both variables is investigated and analysed.
Previous papers validated one or at most two satellite datasets in a single exercise, e.g., [18,19,20,21]. This paper demonstrates the power of coincident, consistent validation of multiple sensors. All in situ, satellite, and matched in situ–satellite data files are in a common harmonized format, which makes the various validation results directly comparable to each other, as the validation procedure is done in the same way for all validations presented. Furthermore, conclusions on the performance of the single satellite data sets, as well as on the suitability of the in situ sites, can be drawn. Differences due to different spatial areas can also be ruled out in the validations presented here, as all satellite data sets are on the same spatial grid. This comparability is a big advantage of the study, since it allows users to choose between different LST data sets. It also benefits future validation studies, since the presented results and information on some frequently used sites can be directly compared to other validation results.
Primary LST in situ validation is a well-established procedure, which is conducted with thermal infrared radiometers viewing the surface from above. It has been used successfully for various satellite data sets over different regions and climatic zones. For example, [22] validated MSG/SEVIRI data over Gobabeb in the Namib desert, Namibia, which has a warm desert climate [18]. They found a monthly bias smaller than 1 K. Five months of LST data from Visible Infrared Imaging Radiometer Suite (VIIRS) were validated over the same station by [23], who report a larger bias of over 4 K, which was partially explained by an incorrect emissivity characterization. A validation of microwave LST data from the Advanced Microwave Scanning Radiometer-Earth Observing System (AMSR-E) by [24] over the same station yielded a root mean square error of about 2–3 K. Göttsche et al. [18] also validated MSG/SEVIRI data at two further stations in Africa, which are located in sub-tropical climate (Dahra, Senegal) and semi-desert climate (Kalahari Farm Heimat) for the period 2009–2014. They report biases up to 0.7 °C when excluding rainy seasons.
Validations were also performed over stations in moderate climate, e.g., in Evora, Portugal, which is located in an oak-tree forest. Large differences between satellite and in situ LST are described at this station by [25] for validation of Moderate Resolution Imaging Spectroradiometer (MODIS) data. These differences were considerably reduced when accounting for sunlit areas and areas shadowed by trees. They also report large differences between MODIS and SEVIRI LST due to the directional effects at the station. Ermida et al. [26] used a geometric model to account for the influence of shadows at Evora, which also resulted in reduced biases for SEVIRI LST and for MODIS LST. The bias is larger and more negative for MODIS LST, and also the standard deviation (STD), is larger for the MODIS validation. Six of the seven SURFRAD stations, which are located in different areas and climatic zones throughout the United States, are used by [19] to evaluate Aqua MODIS data from 2002–2007 with a spatial resolution of 1 km, and Advanced Spaceborne Thermal Emission and Reflection Radiometer (ASTER) data from 2000–2007 with a spatial resolution of 90 m. They report an average bias of −0.2 °C at night for MODIS and of 0.1 °C for ASTER. They disregarded daytime data because the in situ data lacked representativeness on the scale of the MODIS sensor. Pinker et al. [20] validated different algorithms of Geostationary Operational Environmental Satellites (GOES) LST data from 1996–2000 over SURFRAD sites, which resulted in considerably different and variable biases depending on the LST retrieval algorithm. Guillevic et al. [21] took in situ data from one SURFRAD site located in an agricultural region and report a bias of −0.3 K for VIIRS LST. Ten years of MODIS LST were validated by Li et al. [27] over six SURFRAD sites, resulting in a bias of −0.93 K. GOES-R LST were validated over one year over SURFRAD stations giving an average precision of 1.58 K [28]. Advanced Along Track Scanning Radiometer (AATSR) and MODIS LST data were validated by [29] over a marshy plain site with rice crops in Spain in summers from 2002–2004. They report biases smaller than 1 K. Measurements at a rice-field from 2002–2007 by Coll et al. [30] for AATSR LST data resulted in very small biases. ASTER LST were validated over an agricultural site in Spain, resulting in an accuracy of 1.5 K by Sobrino et al. [31].
Yu et al. [32] validated MODIS data for four months in 2012 in a region with mixed land cover types in China and report strong differences for daytime and night-time results, mainly due to heterogeneity effects during daytime. The GlobTemperature AATSR data used in this report have also been validated by [33] from 2007 to 2011 over Alpine meadow and homogeneous cropland in the Heihe River Basin, China. They report an averaged bias of 0.67 K for night-time data, with better agreement over the cropland site. GlobTemperature AATSR night-time LST data was also compared with in situ data over different surfaces on the Tibetan Plateau with a high correlation. In this study, the data was also harmonized with numerical output using a diurnal temperature cycle model [34]. Wan et al. [35] report a bias that generally is smaller than 1 K for validation of MODIS 2003 data over Lake Tahoe, USA.
Ideally, to investigate a satellite LST data set using in situ validation, one would want to assume that the in situ data represent “ground truth” and that any differences between both data sets stem only from discrepancies of the satellite data. Sources of satellite LST uncertainties can be measurement uncertainty, the retrieval algorithm, uncertainty in the atmospheric correction of the data, and inaccurate land cover classification or emissivities [36]. However, in reality also uncertainty in the in situ LST, as well as temporal or spatial mismatching, can lead to differences between both data sets. These sources of uncertainties need to be accounted for in the validation to interpret the quality of a satellite data set properly. In situ data sets have, as well as satellite LST data sets, an uncertainty stemming from the instrument with which the radiation is measured, and an uncertainty due to the land surface emissivity used to calculate in situ LST. For the validation, in situ point measurements are compared to measurements of a satellite, which observes a much larger area. If the area around the station is very heterogeneous, this can lead to large LST differences [32]. Spatial mismatching is mainly due to upscaling [37] and difficult to avoid completely in LST validation. Temporal mismatching between both data sets means that the time difference between the satellite data and the in situ data is too large, which is problematic due the dynamic nature of LST. Using in situ data with a small sampling interval, e.g., three minutes or less, allows this factor to be significantly reduced.
Validation results obtained for a single station alone can never be globally representative [37], since LST has a considerable dependency on surface material, vegetation cover, and topography. Most natural land covers are spatially quite heterogeneous [1,36], which is one reason why only few long-term stations worldwide exist that are suitable for in situ LST validation [37].
All satellite data sets used here were produced for the European Space Agency (ESA) in the framework of the GlobTemperature (GT) project (http://www.globtemperature.info/) under the Data User Element of ESA’s Fourth Earth Observation Envelope Programme (2013–2017), which aimed at promoting a wider uptake of satellite LST data sets by different user groups. The project established standards for satellite LST products, as well as for their consistent validation. Its satellite data sets have already been used successfully for various purposes before to compare GT infrared LST to microwave LST [38] and to results from a numerical weather prediction model [39], to estimate land heat fluxes [40], and as input into a coupled ocean and sea-ice model [41].

2. Data and Methods

An overview of the validated GT satellite data sets and the used validation stations for each data set is provided in Table 1.

2.1. GlobTemperature Satellite Data Sets

In order to ensure a systematic and smooth validation process, satellite extraction data sets in a standardised format and centred on the respective ground-based validation station were produced from level 2 versions of the data. Geostationary data from GT are available with an hourly resolution. Each dataset is briefly described below and more detailed information on the GT data sets can be found in [17,42]. Within the GT project, operational AATSR [43] and MODIS LST [35] data sets were also investigated, but for stringency the work presented here focusses on the comparison of the satellite data sets produced with GT algorithms. Daytime and night-time data points are separated based on solar zenith angles.

2.1.1. Advanced along Track Scanning Radiometer (AATSR)

AATSR is the third of a series of instruments (ATSR-1, ATSR-2, and AATSR). It was on board ESA’s sun-synchronous, polar orbiting satellite Envisat, which was launched in March 2002 and stopped operating in April 2012. The retrieval formulation for LST is a nadir-only, two-channel, split-window (SW) algorithm using globally robust coefficients based on realistic atmospheric profiles. Coefficients and uncertainties are based on biome classification, fractional vegetation, and across-track water vapour dependences. A semi-Bayesian cloud clearing scheme is used, and emissivity is calculated implicitly within the fractional vegetation dependent retrieval coefficients. Details on the GT AATSR product can be found in [42].

2.1.2. GlobTemperature MODIS Products (MOGSV and MYGSV)

The GlobTemperature MODIS products provide an analysed LST and uncertainties which are consistent with the biome-based approach used for the ATSRs (see above). It is similar in its level of depth in treating uncertainty. Otherwise, the GlobTemperature Level-2 MODIS LST algorithm (MOGSV_LST_2 and MYGSV_LST_2) is distinct from GT AATSR algorithm. It uses the generalized SW approach [44], similar to the split-window method used for AVHRR data, to estimate LST as a linear function of clear-sky TOA brightness temperatures. Further auxiliary information relevant for the LST retrieval is given, such as emissivity, which is based on the CIMMS Baseline Fit Emissivity Database, and quality control flags. A complete set of LST data files is available covering each of the entire Terra-MODIS and Aqua-MODIS missions, which run from March 2000 to December 2016. The temporal resolution of the Level-2 swath data are 5-min granules consistent with the MODIS operational Level-1b and Level-2 data, and relies on the operational LST cloud clearing.

2.1.3. Spinning Enhanced Visible and Infrared Imager (SEVIRI)

The Spinning Enhanced Visible and Infrared Imager (SEVIRI) is the main sensor on board Meteosat Second Generation (MSG), a series of 4 geostationary satellites operated by EUMETSAT. SEVIRI was designed to observe the Earth disk at longitude 0° with view zenith angles (SZA) ranging from 0° to 80° at a temporal sampling rate of 15 min. SEVIRI’s spectral characteristics and accuracy, with 12 channels covering the visible to the infrared, are unique among sensors on board geostationary platforms [45]. LST is retrieved using the same generalized SW algorithm [44] as for the GT MODIS product. Emissivity is estimated from the fraction of vegetation cover; a product also retrieved by SEVIRI and corresponds to five-day composites updated on a daily basis [37]. MSG satellite products have been developed and distributed since January 2005 by the Satellite Application Facility on Land Surface Analysis (LSA-SAF) [46]. The GlobTemperature SEVIRI data set (SEVIR_LST_2 V1.0) are available at an hourly resolution. SEVIR_LST_2 V1.0 data are a reformatted and re-projected version of the operational LSA-SAF LST product.

2.1.4. Geostationary Operational Environmental Satellite (GOES)

The Geostationary Operational Environmental Satellites (GOES) series is operated by NOAA/NESDIS. It is taken directly from the Copernicus Global Land Service, which generates hourly GOES-East LST data. These data are available in near real time and off-line, and cover the GOES disk centred at longitude −75 with a spatial resolution of about 4 km at the sub-satellite point. For the period under analysis the operational imager (GOES-12 and GOES-13) consists of a five channel radiometer covering visible and infrared bands. It does not have two SW channels like the other sensors in this study, and therefore LST is not retrieved with the generalized split-window algorithm. The applied methodology, named “Dual-Algorithm”, is explained in [47]. It implies two LST algorithms, which are each used for night-time and daytime, respectively: a two-channel algorithm is applied to night-time observations, making use of one thermal infrared channel—around 11 μm—and one middle infrared channel, at around 3.9 μm; and a mono-channel algorithm is applied for daytime cases, using the available thermal infrared channel for atmospheric attenuation and surface emissivity. The middle-infrared is discarded for daytime cases to avoid the correction of solar radiation reflected by the surface [48]. GOES surface emissivity is built upon a global land cover product based on the International Geosphere-Biosphere Programme (IGBP) classification, being calculated according to a linear mixing with weighted sum of the land cover percentage times the emissivity of this surface type [47].

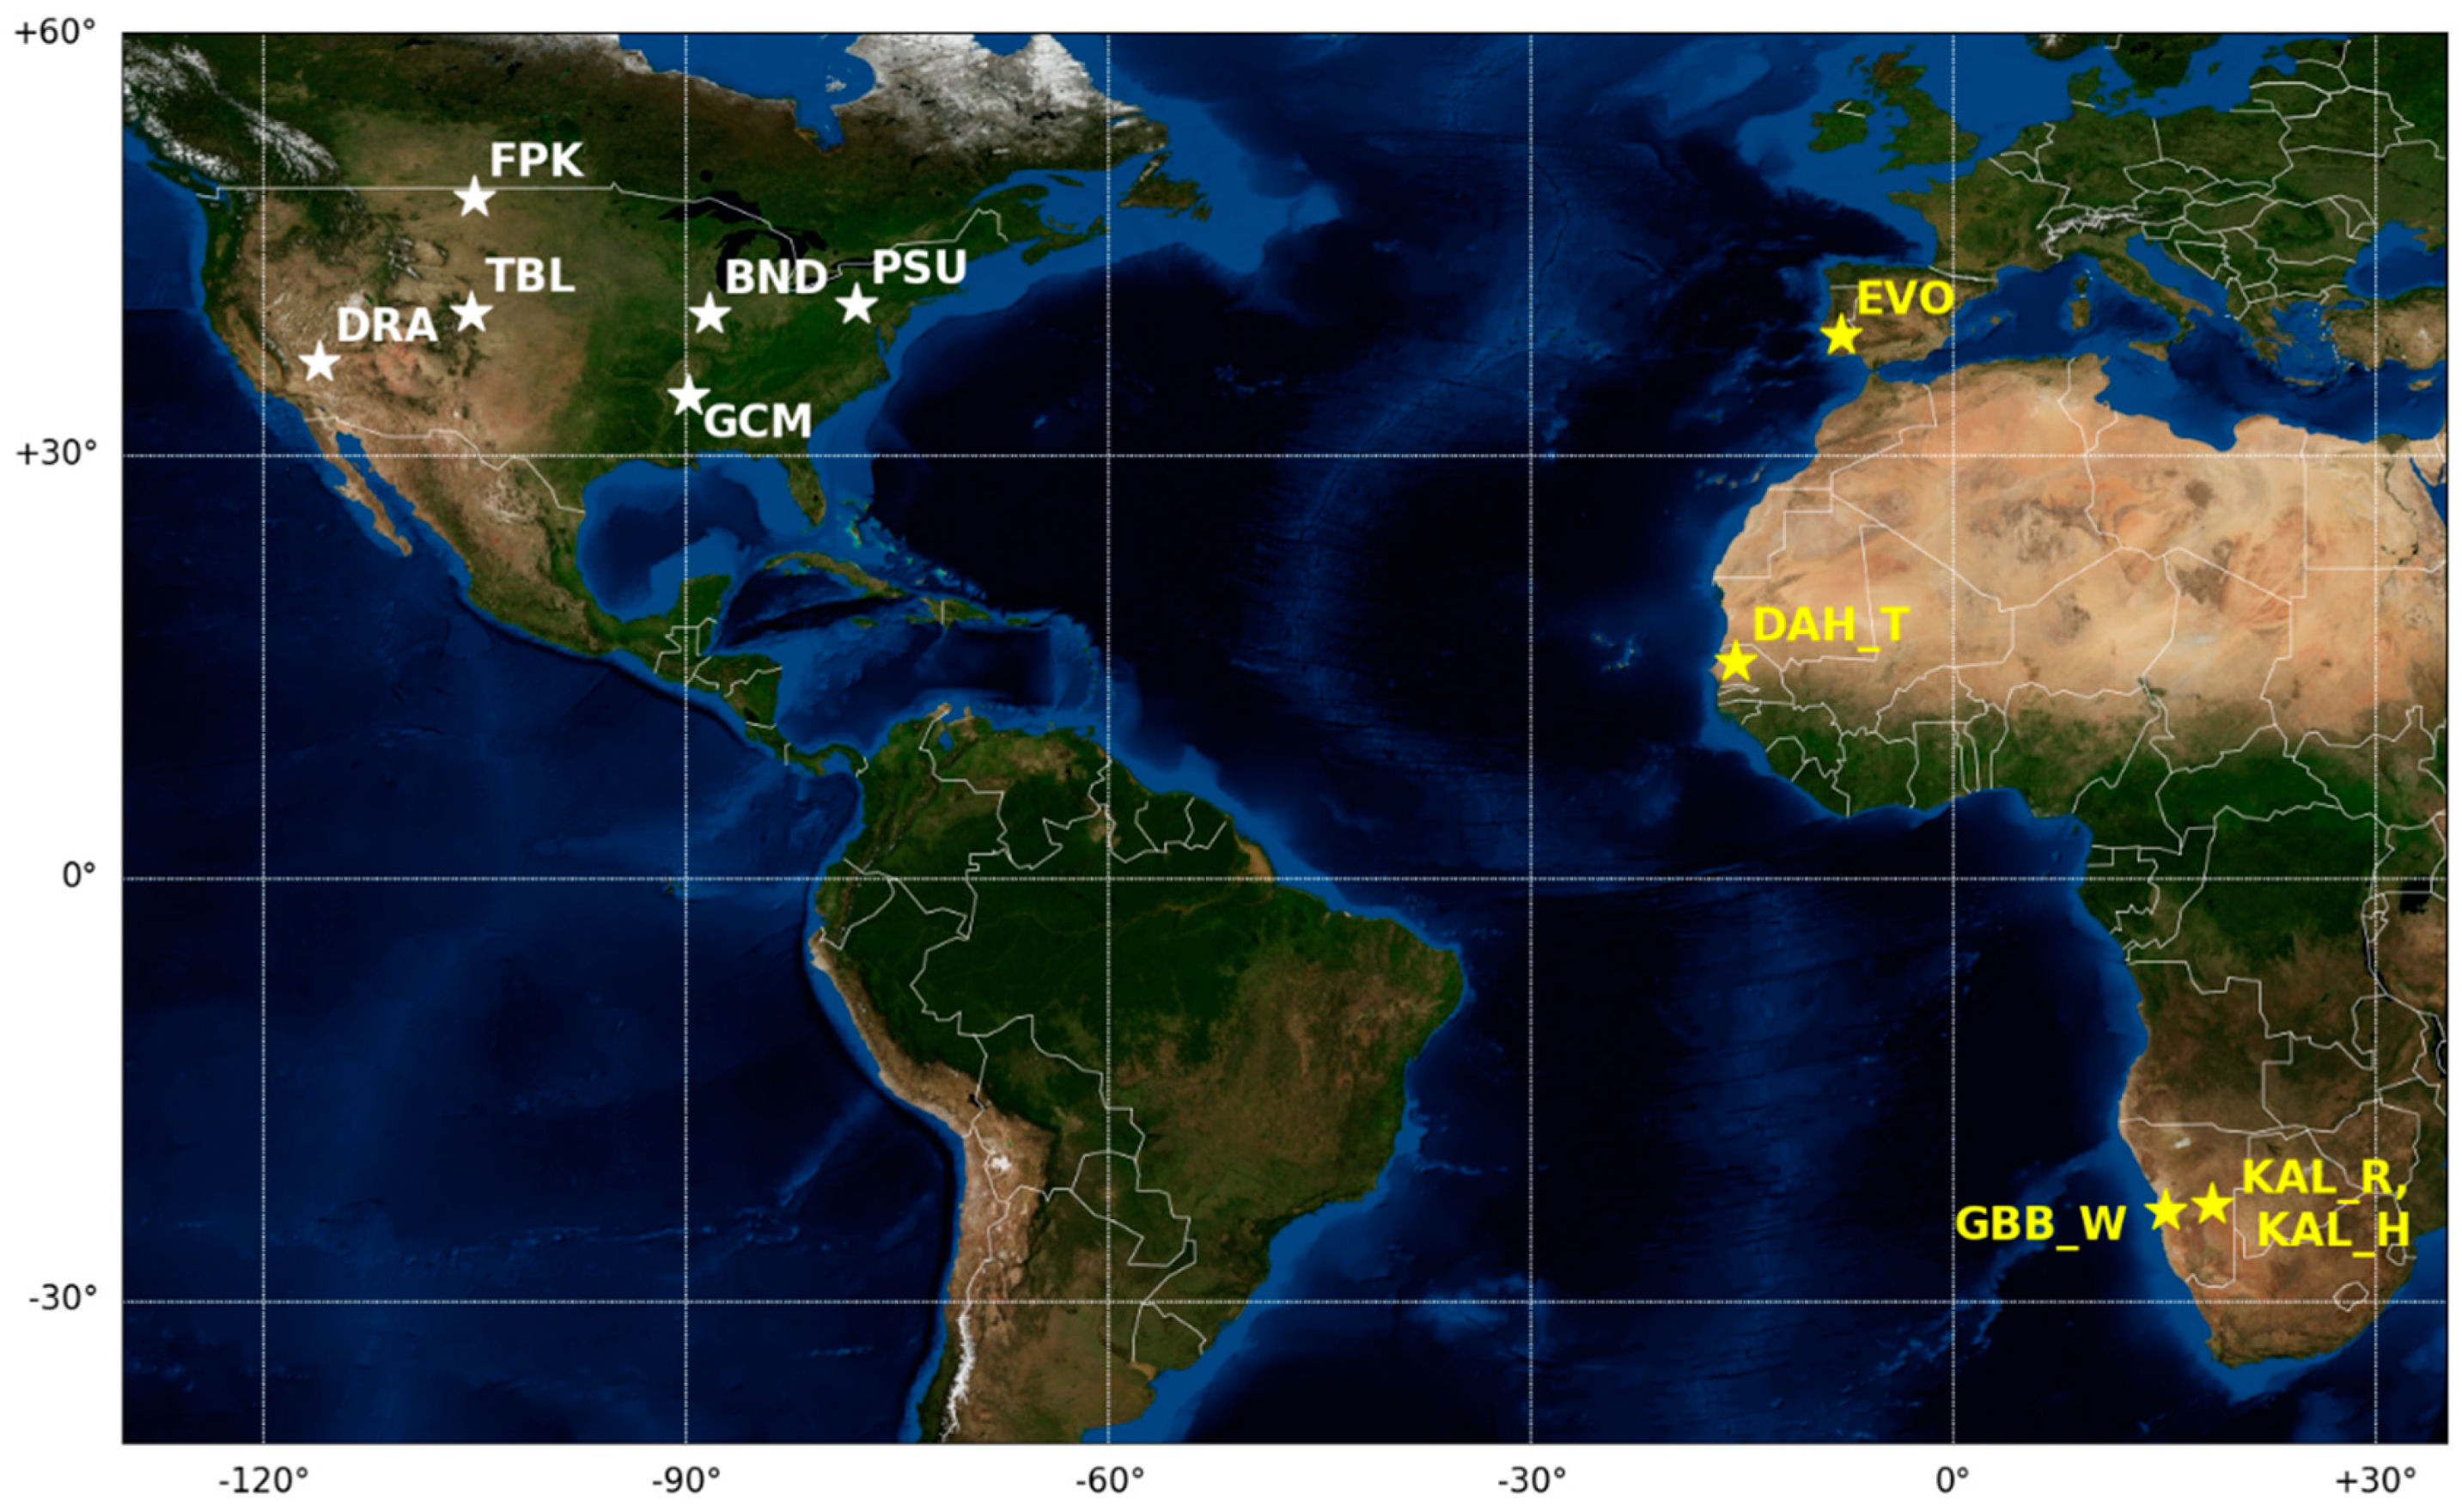
2.2. In Situ Stations

The in situ stations used are located in different regions worldwide, and cover different surface types and topographies. They are operated either by KIT or NOAA (SURFRAD stations). The station locations are shown in Figure 1, and a summary of their characteristics, locations, and surface types is provided in Table 2.

2.2.1. KIT Stations

The in situ stations run by KIT were specifically set up to enable continuous, long-term validation of satellite LST products. They are located in flat areas with homogeneous surface cover, so that errors due to spatial mismatching between satellite LST products and ground LST is minimal [50]. The stations are located in different climate zones, which allow analyses of LST products under different atmospheric conditions and over broad temperature ranges. The IR radiation at all KIT stations is measured with narrowband KT15.85 IIP (KT15) infrared radiometers, which record radiances between 9.6 µm and 11.5 µm with a sampling interval of 1 min. These instruments are self-calibrating, chopped precision radiometers that are checked annually in parallel runs with reference instruments. At all KIT sites, instruments measuring upwelling radiation and downwelling radiation for sky-correction are installed. After an initial calibration by the manufacturer (Heitronics Infrarot Messtechnik GmbH, Wiesbaden, Germany), approximately every two years a recalibration against a blackbody is performed. Several auxiliary meteorological parameters are also measured at the stations. The KT15 instrument expresses its results as brightness temperatures (BT) with an accuracy of ± 0.3 K over the investigated temperature range. For a detailed description on the measurement device and set up, see [18]. The measured BT values are converted to in situ LST using Planck’s law and a simplified radiative transfer equation of the surface (see [50]). A crucial part of this equation is the emissivity of the land surface, which needs to be determined before LST values can be retrieved [51,52].
Over GBB_W station, which is located in a hyper-arid and quasi-static site on the Namib gravel plains, a constant emissivity value is used for LST calculation, which for the KT15 radiometer was determined by [53] as 0.94 ± 0.015. Emissivities retrieved with a physical retrieval scheme and applied to the Infrared Atmospheric Sounder Interferometer (IASI) have been found to be in good agreement with in situ emissivities at GBB_W station [54]. At the other KIT sites, emissivities vary with seasons due to changing vegetation cover and soil moisture content. For these stations, the operational emissivity provided for SEVIRI ch10.8 by LSA-SAF is used, as it is spectrally similar to KT15 [53].
The uncertainty for the KIT LST values has been calculated as introduced in [18]. The calculations start from Planck’s law, which describes the relation between LST and surface-emitted radiances. Four sources of uncertainties were considered: random measurement uncertainty associated with: (1) surface and (2) sky brightness temperatures (see above), random uncertainty associated with (3) emissivity, and (4) a systematic uncertainty caused by a protective window in front of the KT15.85 IIP radiometer measuring sky brightness temperature. This window is necessary to protect the instrument from dirt and rain, but its transmissivity degrades with time. Based on these four individual uncertainties, a total random and a total systematic uncertainty is calculated, and used to obtain total uncertainty. For the year 2010 at GBB_W station, a median random uncertainty of 0.80 ± 0.12 K and a median systematic uncertainty of −0.08 ± 0.01 K was calculated. The main contributions to total uncertainty stem from the uncertainty in emissivity, whereas systematic uncertainty was shown to be negligible. For the KIT in situ data presented here, the in situ LST uncertainties are up to 1.2 K.

2.2.2. SURFRAD Stations

The stations were set up to investigate the surface radiation budget and are located throughout the USA, covering a variety of surface types. The six SURFRAD stations used here are namely Bondville (BND) Illinois, Table Mountain (TBL) Colorado, Desert Rock (DRA) Nevada, Fort Peck (FPK) Montana, Goodwin Creek (GCM) Mississippi, and Pennsylvania State University (PSU) Pennsylvania.
Upwelling and downwelling IR radiances are measured with pyrgeometers (Eppley Precision Infrared Radiometer) at all investigated SURFRAD stations. These instruments measure broadband radiances in the wavelength range from 4–50 µm with a spatial representativeness of around 70 m × 70 m [23]. They are exchanged annually with instruments previously calibrated in parallel runs with a reference instrument [55]. Standards at NOAA’s Field Test and Calibration Facility at Table Mountain are used to calibrate the instruments, which are traceable to world standards or equivalent.
The calculation of LST from SURFRAD radiance measurements differs from that at KIT stations, as the pyrgeometers used at the SURFRAD sites measure broadband radiances, and the associated broadband emissivities (BBE) have to be estimated first. BBE is determined in the following way: first, several emissivities at distinct values, i.e., monthly emissivity values at 8.3, 9.3, 10.8, and 12.1 µm, with a spatial resolution of 0.05° from the CIMMS Baseline Fit Emissivity Database (http://cimss.ssec.wisc.edu/iremis/, and [56]) are obtained. Second, these values are used as input to calculate BBE in the spectral range of 8 µm–13.5 µm following the linear equation given by [57], introduced for use with the CIMMS database.
Once BBE is determined, it is used to convert the measured upwelling and downwelling radiances to in situ LST using the Stefan-Boltzmann law (following [27]).
LST = R u ( 1 B B E ) R d δ s b 4
where R u is the upward radiation, R d the downward radiation, and δ s b the Stefan-Boltzmann constant.
For the calculation of the SURFRAD in situ LST uncertainty, several random uncertainty components are considered, namely:
  • uncertainty in upwelling measurements: ±5 Wm−2 [58]
  • uncertainty in downwelling measurements: ±5 Wm−2 [58]
  • BBE uncertainty: this contains the uncertainty from the single CIMMS emissivities and the linear regression for calculating BBE. For the former, Borbas et al. [59] state a standard deviation between 0.005 and 0.02 for the single wavelengths. For the latter, Cheng et al. [57] give a RMSE of 0.005. An overall emissivity uncertainty of 0.01 is obtained when performing error propagation with the upper uncertainty limit of the CIMMS emissivities (0.02) and the RMSE associated with the regression (0.005) as input.
The three single uncertainty components above are statistically independent and lead to an overall LST uncertainty of 0.6–2.0 K at the six considered stations. It should be noted that BBE uncertainty is only a minor contribution to the total LST uncertainty compared to the contribution of the measurement uncertainties.

2.2.3. Classification of Validation Stations and Sites

The results of the validation are strongly influenced by the homogeneity, land cover class, and orography of the area around the stations. Thus, the stations were classified according to land cover and climate. For some stations the first analysis resulted in unexpectedly high differences between satellite and in situ LST, or a strong yearly cycle. If the first validation results at certain stations lead to a change in the final validation scheme, this is explained below.
In the following, results are presented in terms of accuracy, which is defined, as in [60], as “the degree of conformity of the measurement of a quantity and an accepted value or the “true” value, based on [61]. Accuracies are described using the median accuracy (satellite LST—station LST) and robust standard deviation (STD), which is defined as 1.48 × median{|x − median(x)|}, as described in [62].
● Desert Station: GBB_W
GBB_W station is located on large and homogeneous gravel-plains of the Namib Desert in Namibia. The in situ data were spatially matched with satellite data over an area about 13 km east of the station to avoid the influence of different land cover types on the results, e.g., that of large sand dunes west of GBB_W. Performing measurements along a 40 km track, reference [63] showed that the GBB_W in situ LST is representative for an area of several 100 km2 around it. The comparison of several radiometers retrieving in situ LST at GBB_W station by [64] yielded resulting LST with RMSEs of about 0.5 K.
● Semi-desert stations: KAL_R and KAL_H
The stations are located in a homogeneous area in the Kalahari semi-desert, which is mainly covered by bushes and dry grass. The climate is hot and arid, with two rainy seasons, one from September to November and one from January to March. During the rainy seasons, fewer match-ups with in situ data are available and the problem of undetected clouds in the satellite data is enhanced.
● Subtropical station: DAH_T
DAH_T station in Dahra, Senegal, is exposed to a strong seasonal vegetation cycle, with a rainy season from about June to November. The area around this station is more diverse than for the other KIT stations. The land cover in a 0.05° × 0.05° area around DAH_T station consists of a mixture of croplands (about 50%), vegetation (about 35%), and forest (about 15%).
● Forest station: EVO
The land surface around EVO station south of Evora, Portugal, consists mainly of a mixture of grass and cork oak trees. As the tree crown cover fraction is about 33%, for daytime data pronounced directional effects are observed. They are mainly due to the diurnal variability of tree shadows.
● Rural station: BND
BND Station is located in an agricultural region in Illinois, USA. The land cover class of the station pixel is “Mosaic Cropland/Vegetation”.
Analyses of the monthly daytime difference between AATSR LST and in situ LST, averaged over the years 2003–2012, show a strong seasonal cycle with a pronounced increase in daytime differences from April to June and from September to October (Figure 2). This is probably caused by spatial mismatching, i.e., during these months the in situ measurements are not representative of the larger area around the station observed by the satellites. The likely reason for these deviations is harvesting—the station is located on a patch of grass, which is approximately 200 × 200 m large, while the surrounding area is made up of agricultural fields, where mainly corn is grown. In spring, before the crop starts growing, mainly bare soil is visible on the fields, and the LST difference between fields and the green grass at the station is large. The same applies in autumn, after the crop has been harvested and the fields are covered by little, desiccated vegetation. Therefore, daytime data at BND station are not representative for spatially coarse satellite LST, and only night-time data between November and May were considered for validation, thus minimising the influence from agricultural activities. A similar influence of crop growth or harvesting was observed by [27], who validated ten years of MODIS data over BND station.
● Shrubland station, located in a valley: DRA
DRA station is located in a valley in Nevada, USA. The land cover in an area of 0.05° × 0.05° around the station is highly homogeneous and classified as “closed to open shrubland”.
An analysis of the monthly median differences AATSR LST–in situ LST of the 5 × 5 pixels (0.05° × 0.05°) around DRA station was performed using daytime data to investigate the influence of orography on the validation results. An example for daytime differences in June 2010 is displayed in Figure 3, where a temperature gradient with a difference of more than 4.0 K between pixels NE and pixels SW of the station can be seen. Satellite LST is closer to in situ LST in the NE and larger than in situ LST in the SW. This gradient was observed in all months, with more positive differences between satellite and in situ LST in summer and more negative ones in winter. These differences point to an influence of local orography, which changes the retrieved satellite LST of each single pixel depending on sun angles and shadows. Daytime AATSR overpasses take place in the morning, when the sun illuminates the scene from the east. Due to the location in the valley, the pixels at longitudes further to the east than the station (located at longitude −116.02) cast more shadows in the morning, and thus have lower LST than pixels in the west.
For the LEO satellite data sets, it was decided to perform the validation using a 3 × 3 average around DRA station pixel instead of the usual 5 × 5 average, thereby excluding the pixels most affected by orography.
● Stations with mixed land covers: TBL, FPK, GCM, and PSU
TBL, FPK, GCM, and PSU are located in areas with more heterogeneous land covers. The mixture of land cover types found around these stations strongly influences the validation results.
The TBL station pixel contains a highly heterogeneous mixture of agricultural fields and a mountain slope (Figure 4). Since TBL station itself is located on top of Table Mountain, satellite LST from a pixel with a more homogeneous surface located directly over the mountain are used for validating the LEO data sets. Only one pixel is chosen to avoid the mountain edges.
FPK station is located in the Fort Peck Tribes Reservation in Montana, USA, and the land cover class of the station pixel is “Mosaic Cropland and Vegetation”. The area around the station consists of a small-scale mixture of forests, shrubland, and grassland, which is also reflected in the LCC of the pixels surrounding the station.
The analysis of the monthly median accuracies of AATSR LST data for years 2003–2012 of the 5 × 5 pixels around the station shows a strong seasonal cycle in the daytime data (Figure 5). The differences between satellite and in situ LST are strongest in the summer months, for which the satellite LST are considerably higher than the in situ LST. The in situ point measurements might not represent the satellite measurements during the summer months well, as FPK station is protected by a small fence enclosing an area of approximately 20 m × 30 m. The station is surrounded by grassland where bison herds graze, which, therefore, might lead to different phenological properties (e.g., grass length) inside and outside the fence. Due to the observed strong seasonal cycle, FPK daytime data are considered as unrepresentative and analyses are limited to night-time data only.
GCM station is located on grass in a rural pasture land in Mississippi. The land cover of the pixel around the station is classified as “closed broadleaved deciduous forest”. When looking at Google Earth imagery, a mixture of forest and grassland is found around the station.
PSU station is located next to agricultural fields in a broad Appalachian valley in Pennsylvania, and the land cover of the station pixel is classified as “Mosaic Cropland and Vegetation”. The land cover around PSU station is quite diverse and consists of a mixture of forests, fields, and settlements (Figure 6). As it was impossible to find a larger homogeneous area around the station, only the “station pixel” itself was used for validating LEO data sets.

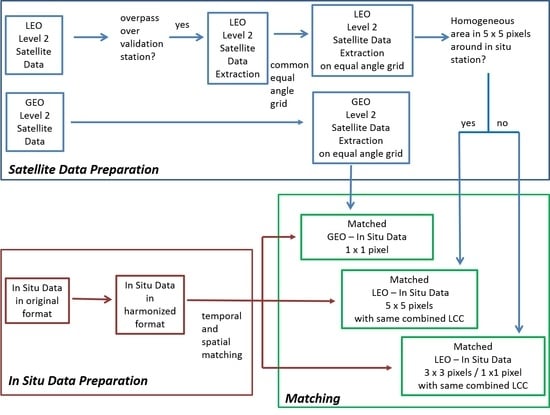
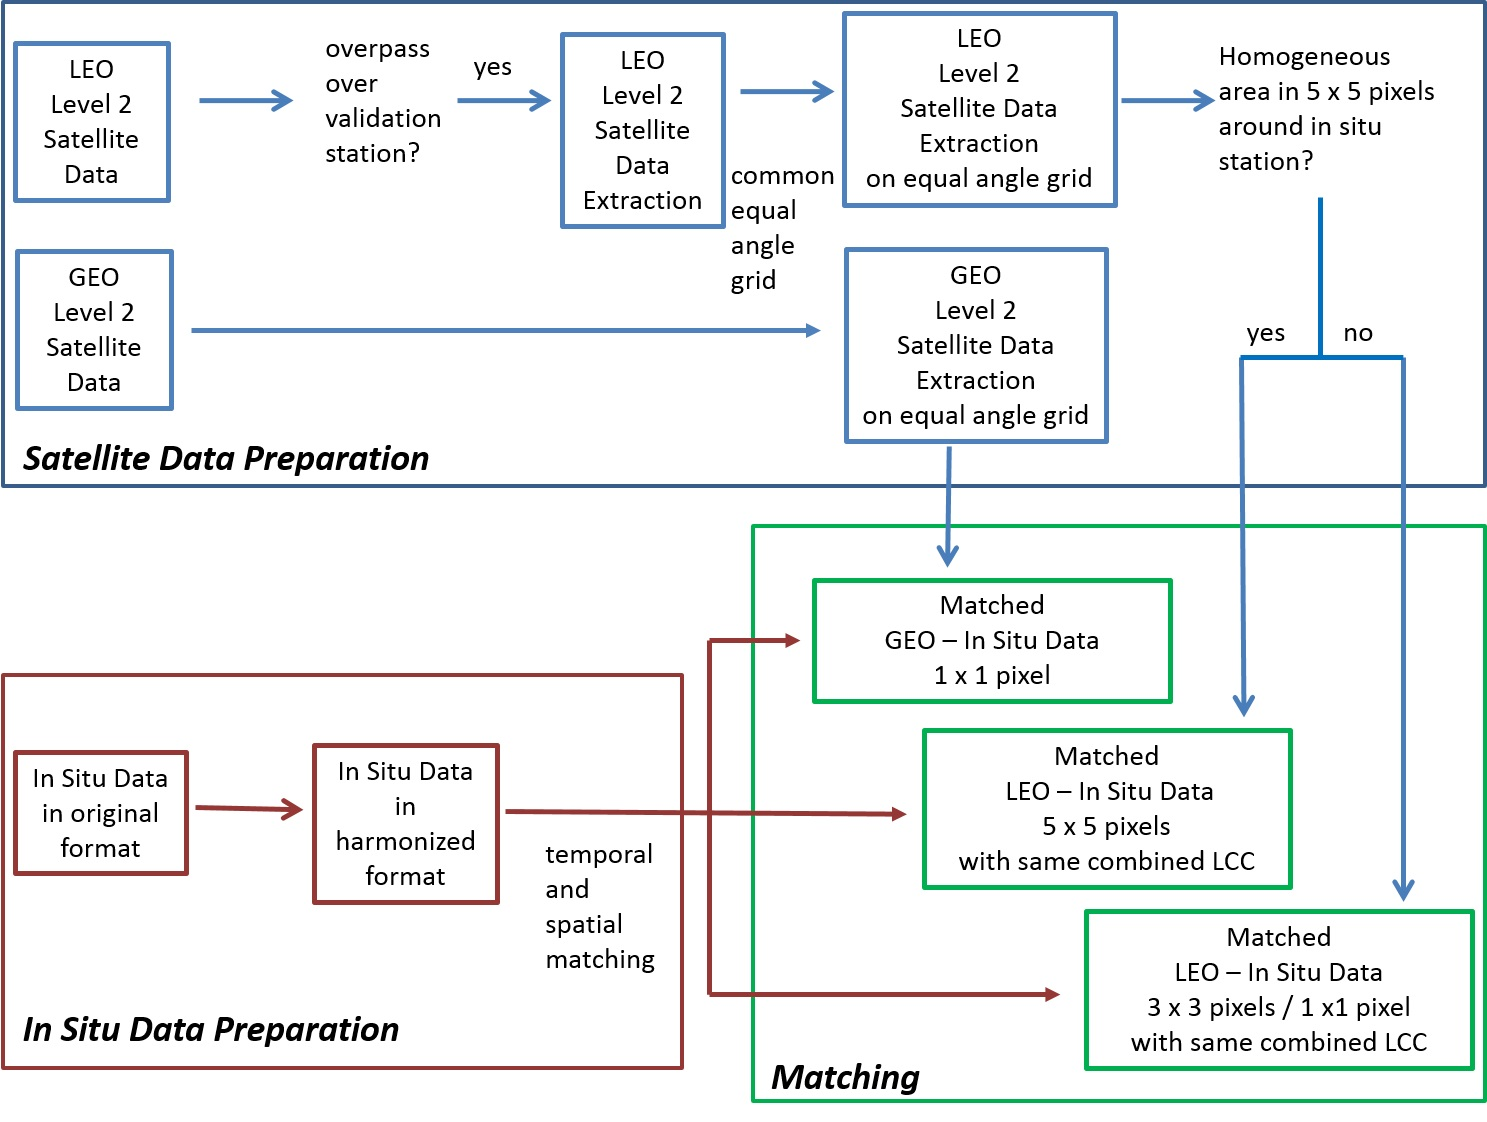
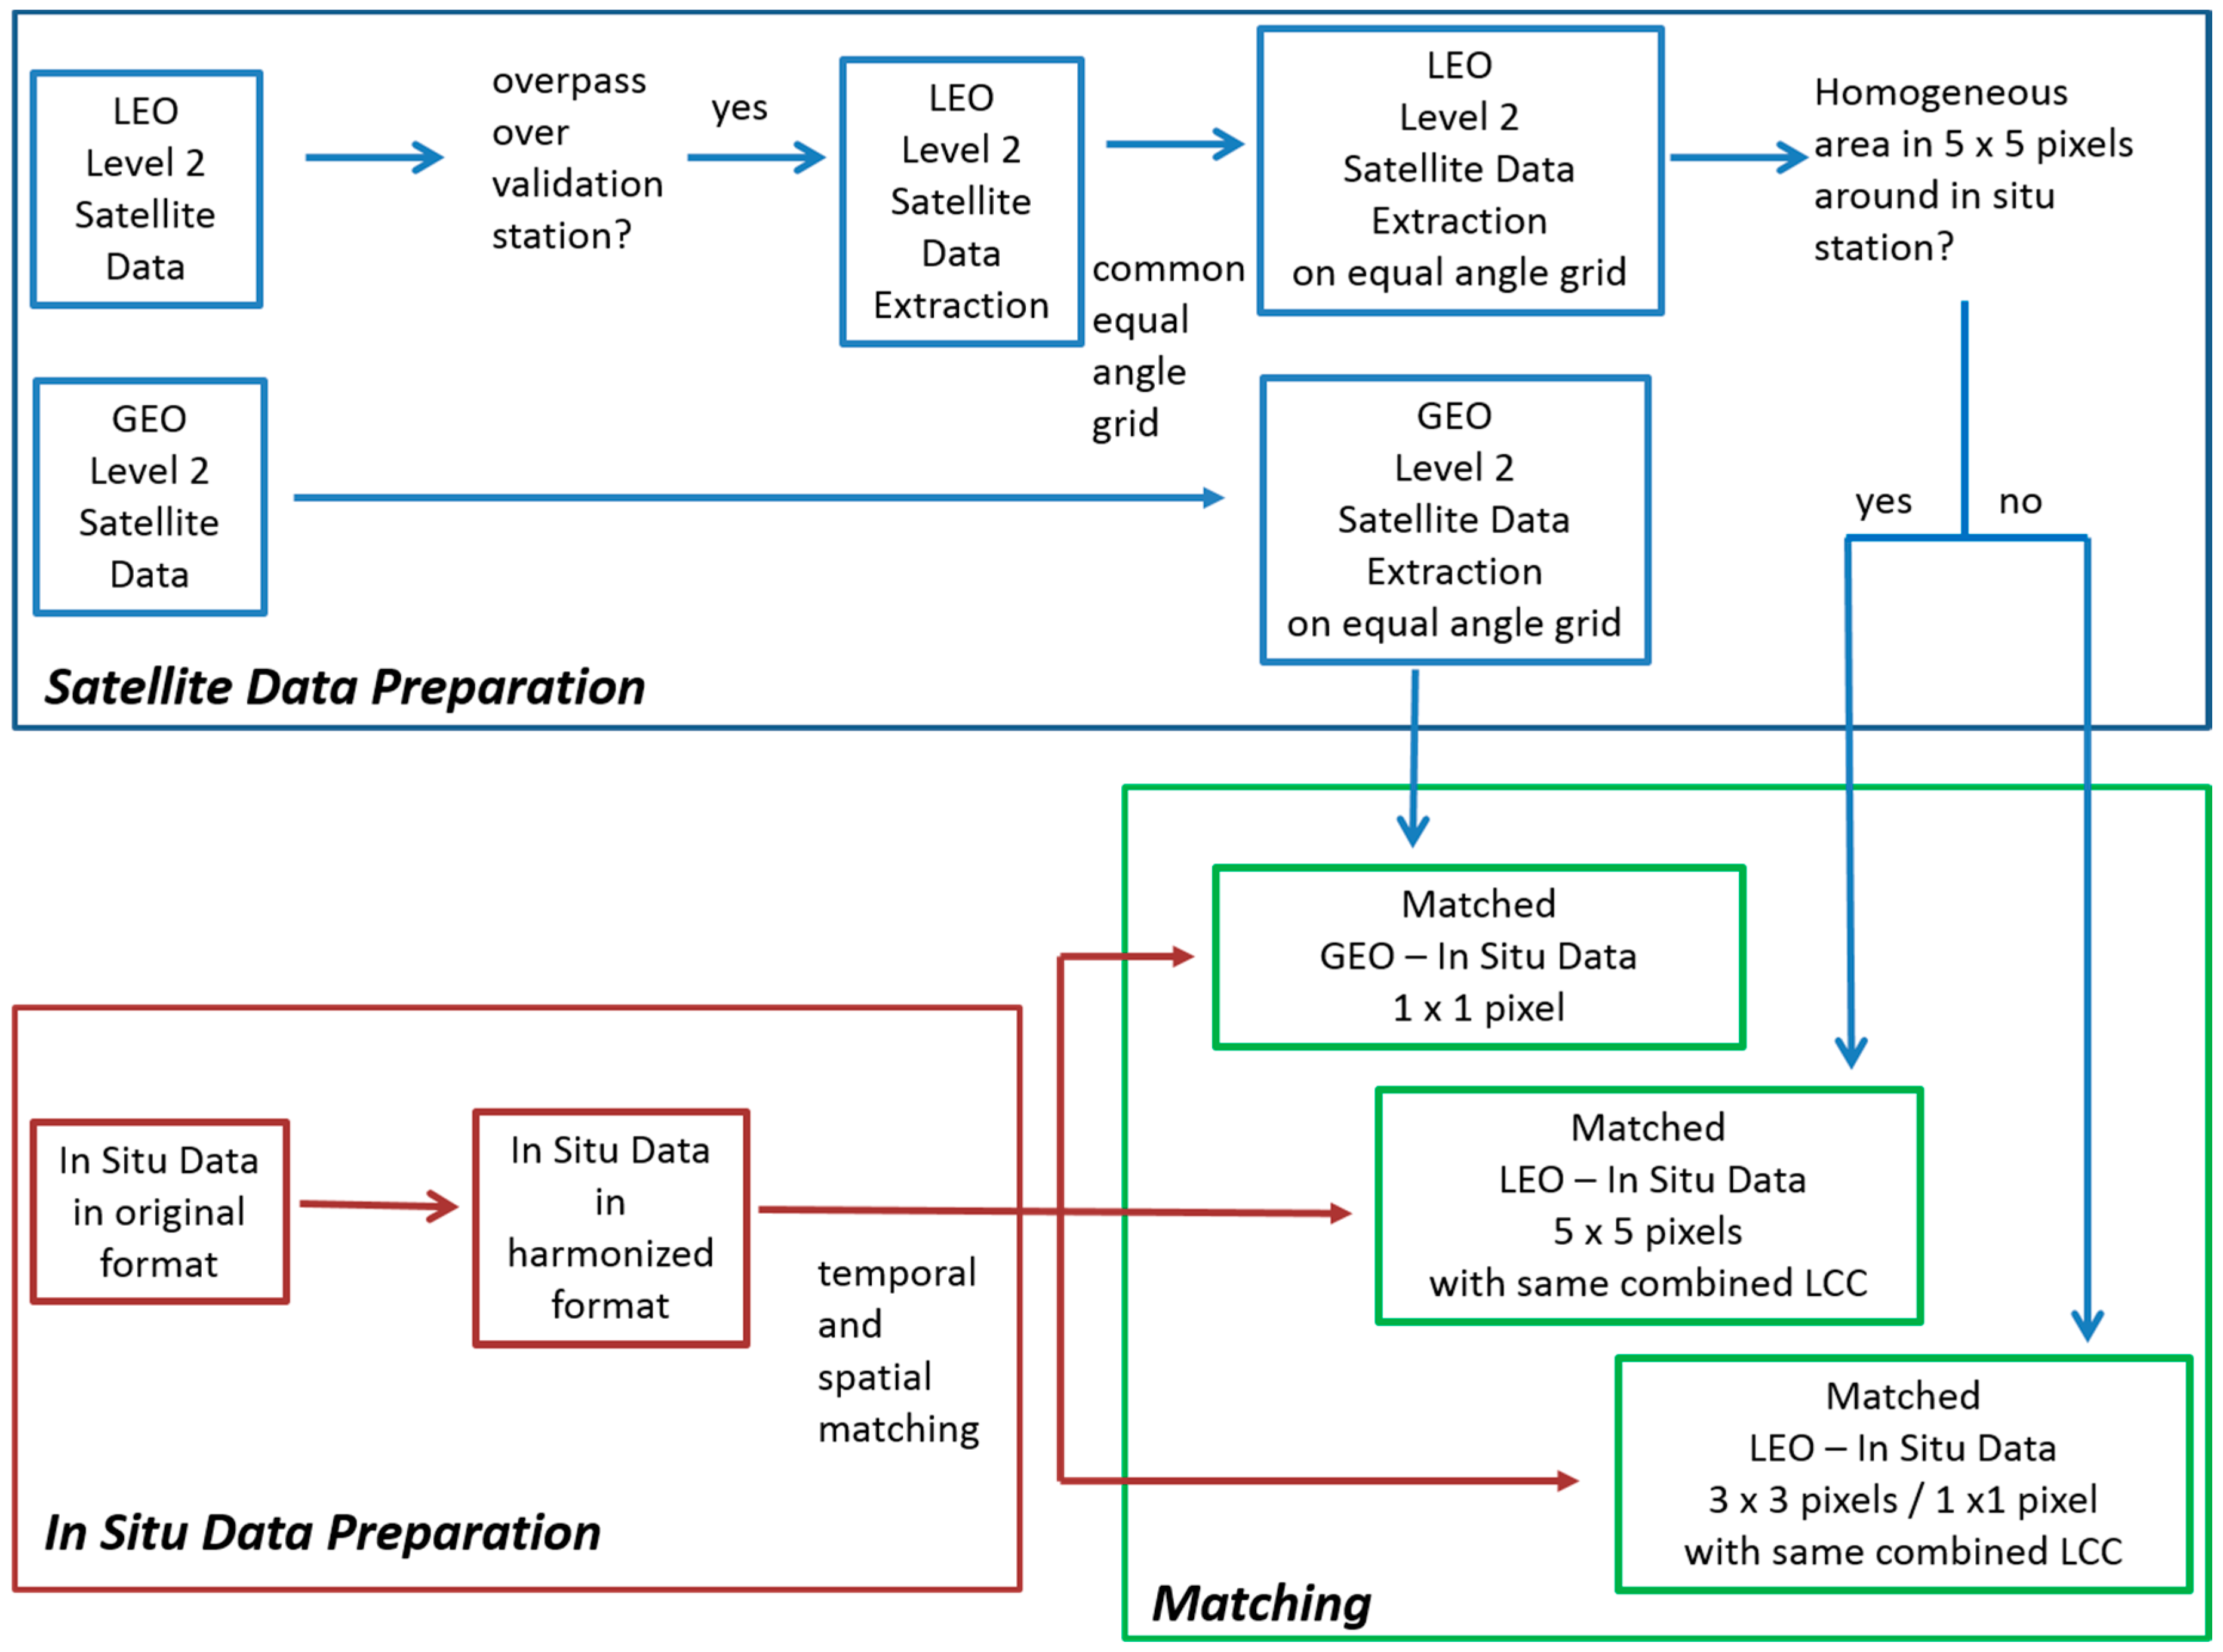
2.3. Comparison of In Situ and Satellite LST

Once satellite and in situ LST data sets are prepared in GT harmonized format, they need to be matched spatially and temporally before performing the validation. All satellite data sets were produced at level 2 in the same harmonized data format, which is a netCDF-4 format. It has three dimensions (time and two spatial coordinates) and several variables, including Julian date, latitude, longitude, LST, LST uncertainty, a quality flag, and satellite angles. Additional information describing the data can be stored in an auxiliary file, including channel descriptions, emissivity, and brightness temperatures. In the global meta data, information about the data product, references, the data producer, the data set developer, the sensor, as well as geographical and time information is stored [65]. The data sets are freely available via GT’s data portal (http://data.globtemperature.info/). Since all satellite, in situ, and matched satellite–in situ data sets were generated in a single harmonized format, difficulties due to differences in format or projection can be neglected at the comparison stage. Furthermore, the subsequent validations can be performed in the same way for all investigated data sets, which ensures that the obtained results are directly comparable to each other. Since all satellite data sets are on the same spatial grid, the influence of different spatial resolutions and area sizes is also minimised.
Suitable satellite LST extractions for each validation site centred on the coordinates of the in situ station need to be generated for the matching process. This extraction is performed analogously for each validation station, but varies between Low Earth Orbit (LEO) and Geostationary (GEO) satellite data sets. Given the nature of the GEO data sets, their extractions are done in the same way for each data point, because they always look on the same scene. For the LEO data sets, the process involves the following steps:
  • For each satellite orbit, it is determined whether the orbit overpasses the validation station;
  • For each overpass, an extract is saved.
All GEO and LEO extracts are re-projected onto a common equal angle grid with resolutions from 0.05° to 0.01°, depending on the available spatial resolution. The mandatory and optional data relevant to the LST retrieval is stored, following [65]. The matching process is schematically displayed in Figure 7.
Within the GT project, the standard was to validate all data on a 0.05° × 0.05° grid, thereby minimising difficulties due to heterogeneity in land cover. However, over particular SURFRAD stations, which are located in very heterogeneous surroundings or with non-negligible variation in topography, some exceptions from the above standard had to be allowed. For these stations, the LEO satellite data sets were validated over smaller areas of 0.03° × 0.03° or 0.01° × 0.01°, which is possible since the LEO data sets are available in a resolution of 0.01° × 0.01°, or over an area not centred on the coordinates of the in situ station. This approach was chosen to avoid problems due to spatial mismatching.
Since the GEO satellite data sets used here already have a spatial resolution of 0.05° × 0.05°, it would have been physically meaningless to resample them to a finer resolution. Therefore, for these data sets, spatial matching was always performed by simply extracting the “station pixel”, i.e., the pixel containing the in situ station (with the exception of GBB_W and TBL station, as explained above).
For the LEO data sets, all 25 pixels within a 0.05° × 0.05° area around the “station pixel” were considered in the validation. However, only those of these 25 pixels were averaged, which had the same “combined” land cover class (combined LCC) as the “station pixel”. Combined LCC are defined as in [66], where the 22 biome classes defined by the GLOBCOVER data set were reduced to ten classes according to their components and the surface geometry and structure. The resulting 10 classes are (1) Flooded vegetation/crops/grasslands, (2) Flooded forest/shrubland, (3) Croplands/grasslands, (4) Shrublands, (5) Broadleaved/needle-leaved deciduous forest, (6) Broadleaved/needle-leaved evergreen forest, (7) Urban area, (8) Bare rock, (9) Water, and (10) Snow and ice. The LCC values of the GT LEO data sets are from the ATSR Land Biome classification [42]. For the validation of the LEO data sets, the median of the LST of the considered pixels was used.
The uncertainty of the averaged LEO LST is calculated with the following formula:
AveragedUncertainty 2 = Σ ( ClearPixelUncertainty ) 2 NumberClearPixels + NumberCloudyPixels * VarianceClearPixels NumberClearPixels + NumberCloudyPixels
where ClearPixelUncertainty is the uncertainty from the LEO LST values for each pixel that is not flagged, NumberClearPixels and NumberCloudyPixels are the number of the clear and flagged pixels within the subset area, respectively, and VarianceClearPixels is the variance of all clear pixels used for averaging. This uncertainty is the sampling uncertainty for the matchup process, which quantifies the propagation of errors of the retrieval process. It indicates that there is a larger uncertainty attached to the matchups when there are cloudy pixels in the scene, since the second part of Equation (2) increases with the number of cloudy pixels. The resulting monthly satellite uncertainties are below 2 K for all satellite data used, with the exception of SEVIRI LST uncertainty over GBB_W and DAH_T station, where it is as high as 3.5 K. Reference [46] report that some of the regions within SEVIRI with lower LST accuracy (errors above 3 K) are (semi)arid areas where the uncertainty in surface emissivity is high, and where the extreme high temperatures further worsen the retrievals.
Furthermore, resulting data points from the averaged LEO pixels are only considered when at least 80% of the considered pixels in the 0.05° × 0.05° area around the station are flagged as clear. This rule intends to avoid undetected cloud edges, and is based on the assumption that the likelihood for this increases with the number of flagged pixels.
Temporal matching is performed in the same way for all data sets, i.e., two station measurements bracketing a satellite overpass are linearly interpolated to the overpass time. The in situ data at the KIT stations and at the SURFRAD stations from 2009 onwards are recorded at a sampling interval of 1 min, which leads to a maximum temporal difference of 30 sec with the matched satellite data. Before 2009, SURFRAD data have a temporal resolution of 3 min, which leads to a maximum temporal difference of 1.5 min with matched satellite data. Temporal data gaps due to missing or flagged in situ data that are larger than 3 min were disregarded. Due to the high temporal resolution, differences in satellite and in situ LST caused by temporal mismatching are negligible in the validations presented here.
The GT matchup files obtained for the various satellite products differ in temporal and spatial resolution. The length of the validated time series also differs due to the availability of the satellite and in situ data. Finally, the set of stations over which the satellite LST products were validated depends on the respective satellites, as geostationary satellites only observe part of the Earth’s surface.

3. Results

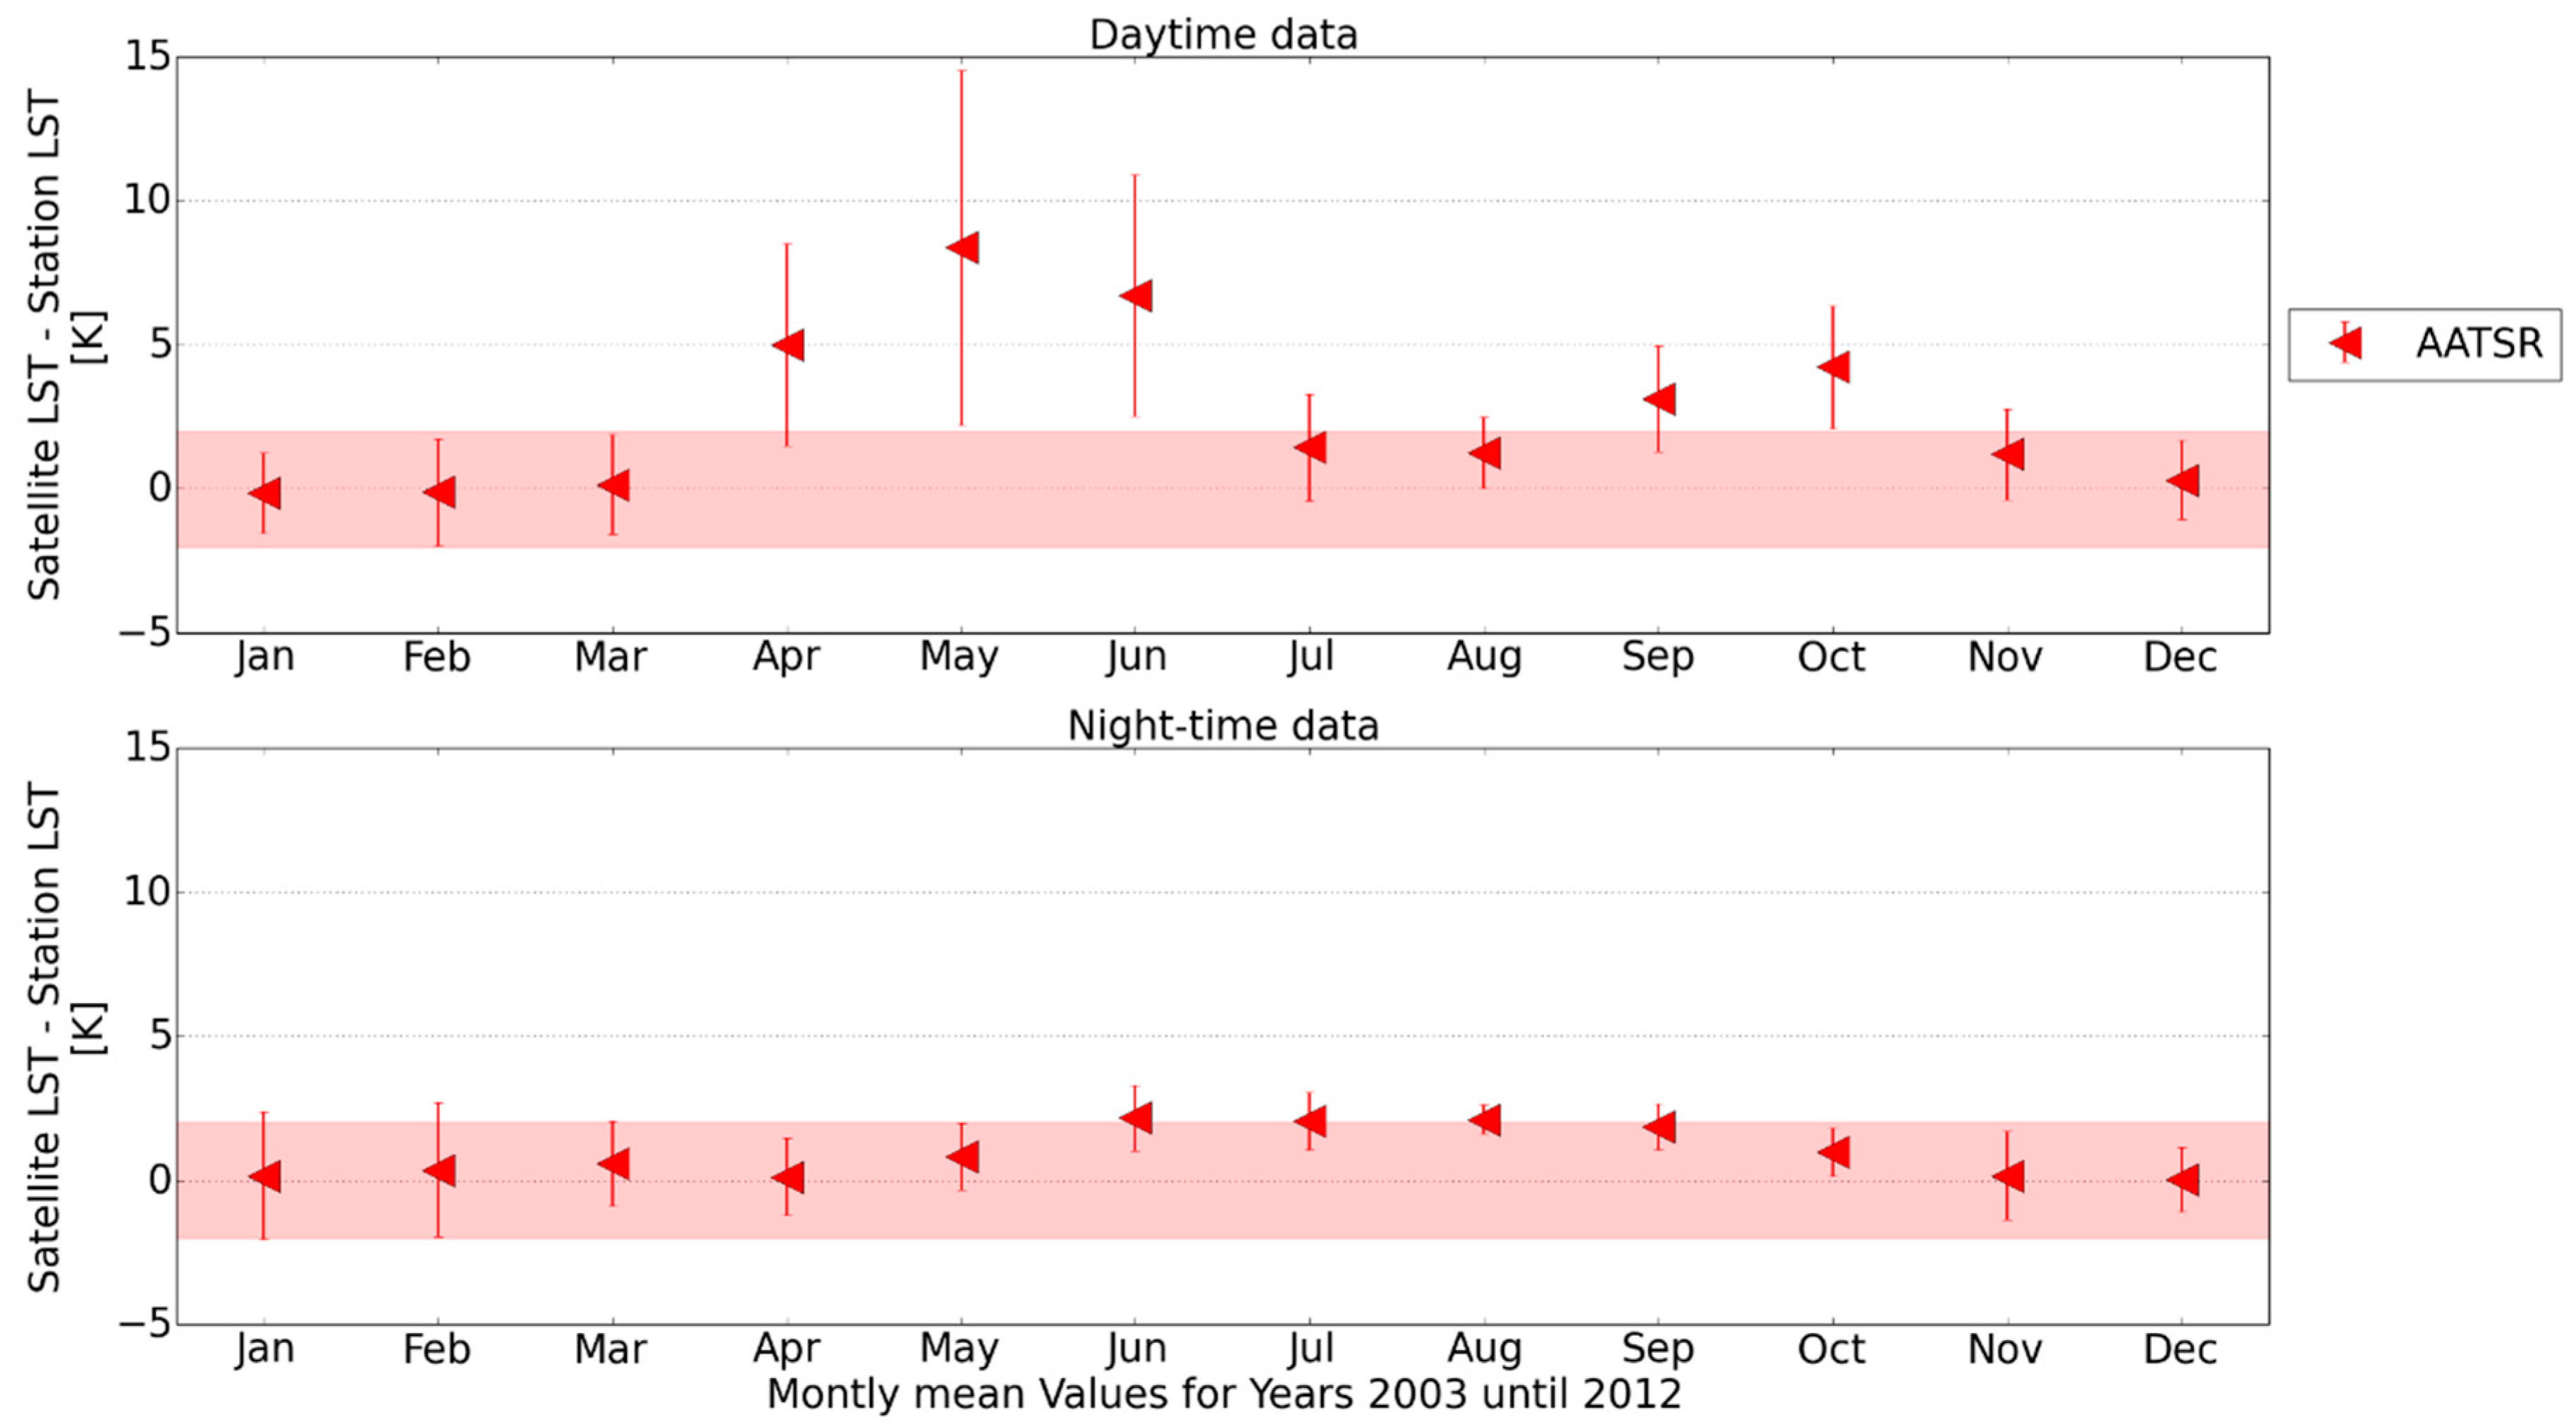
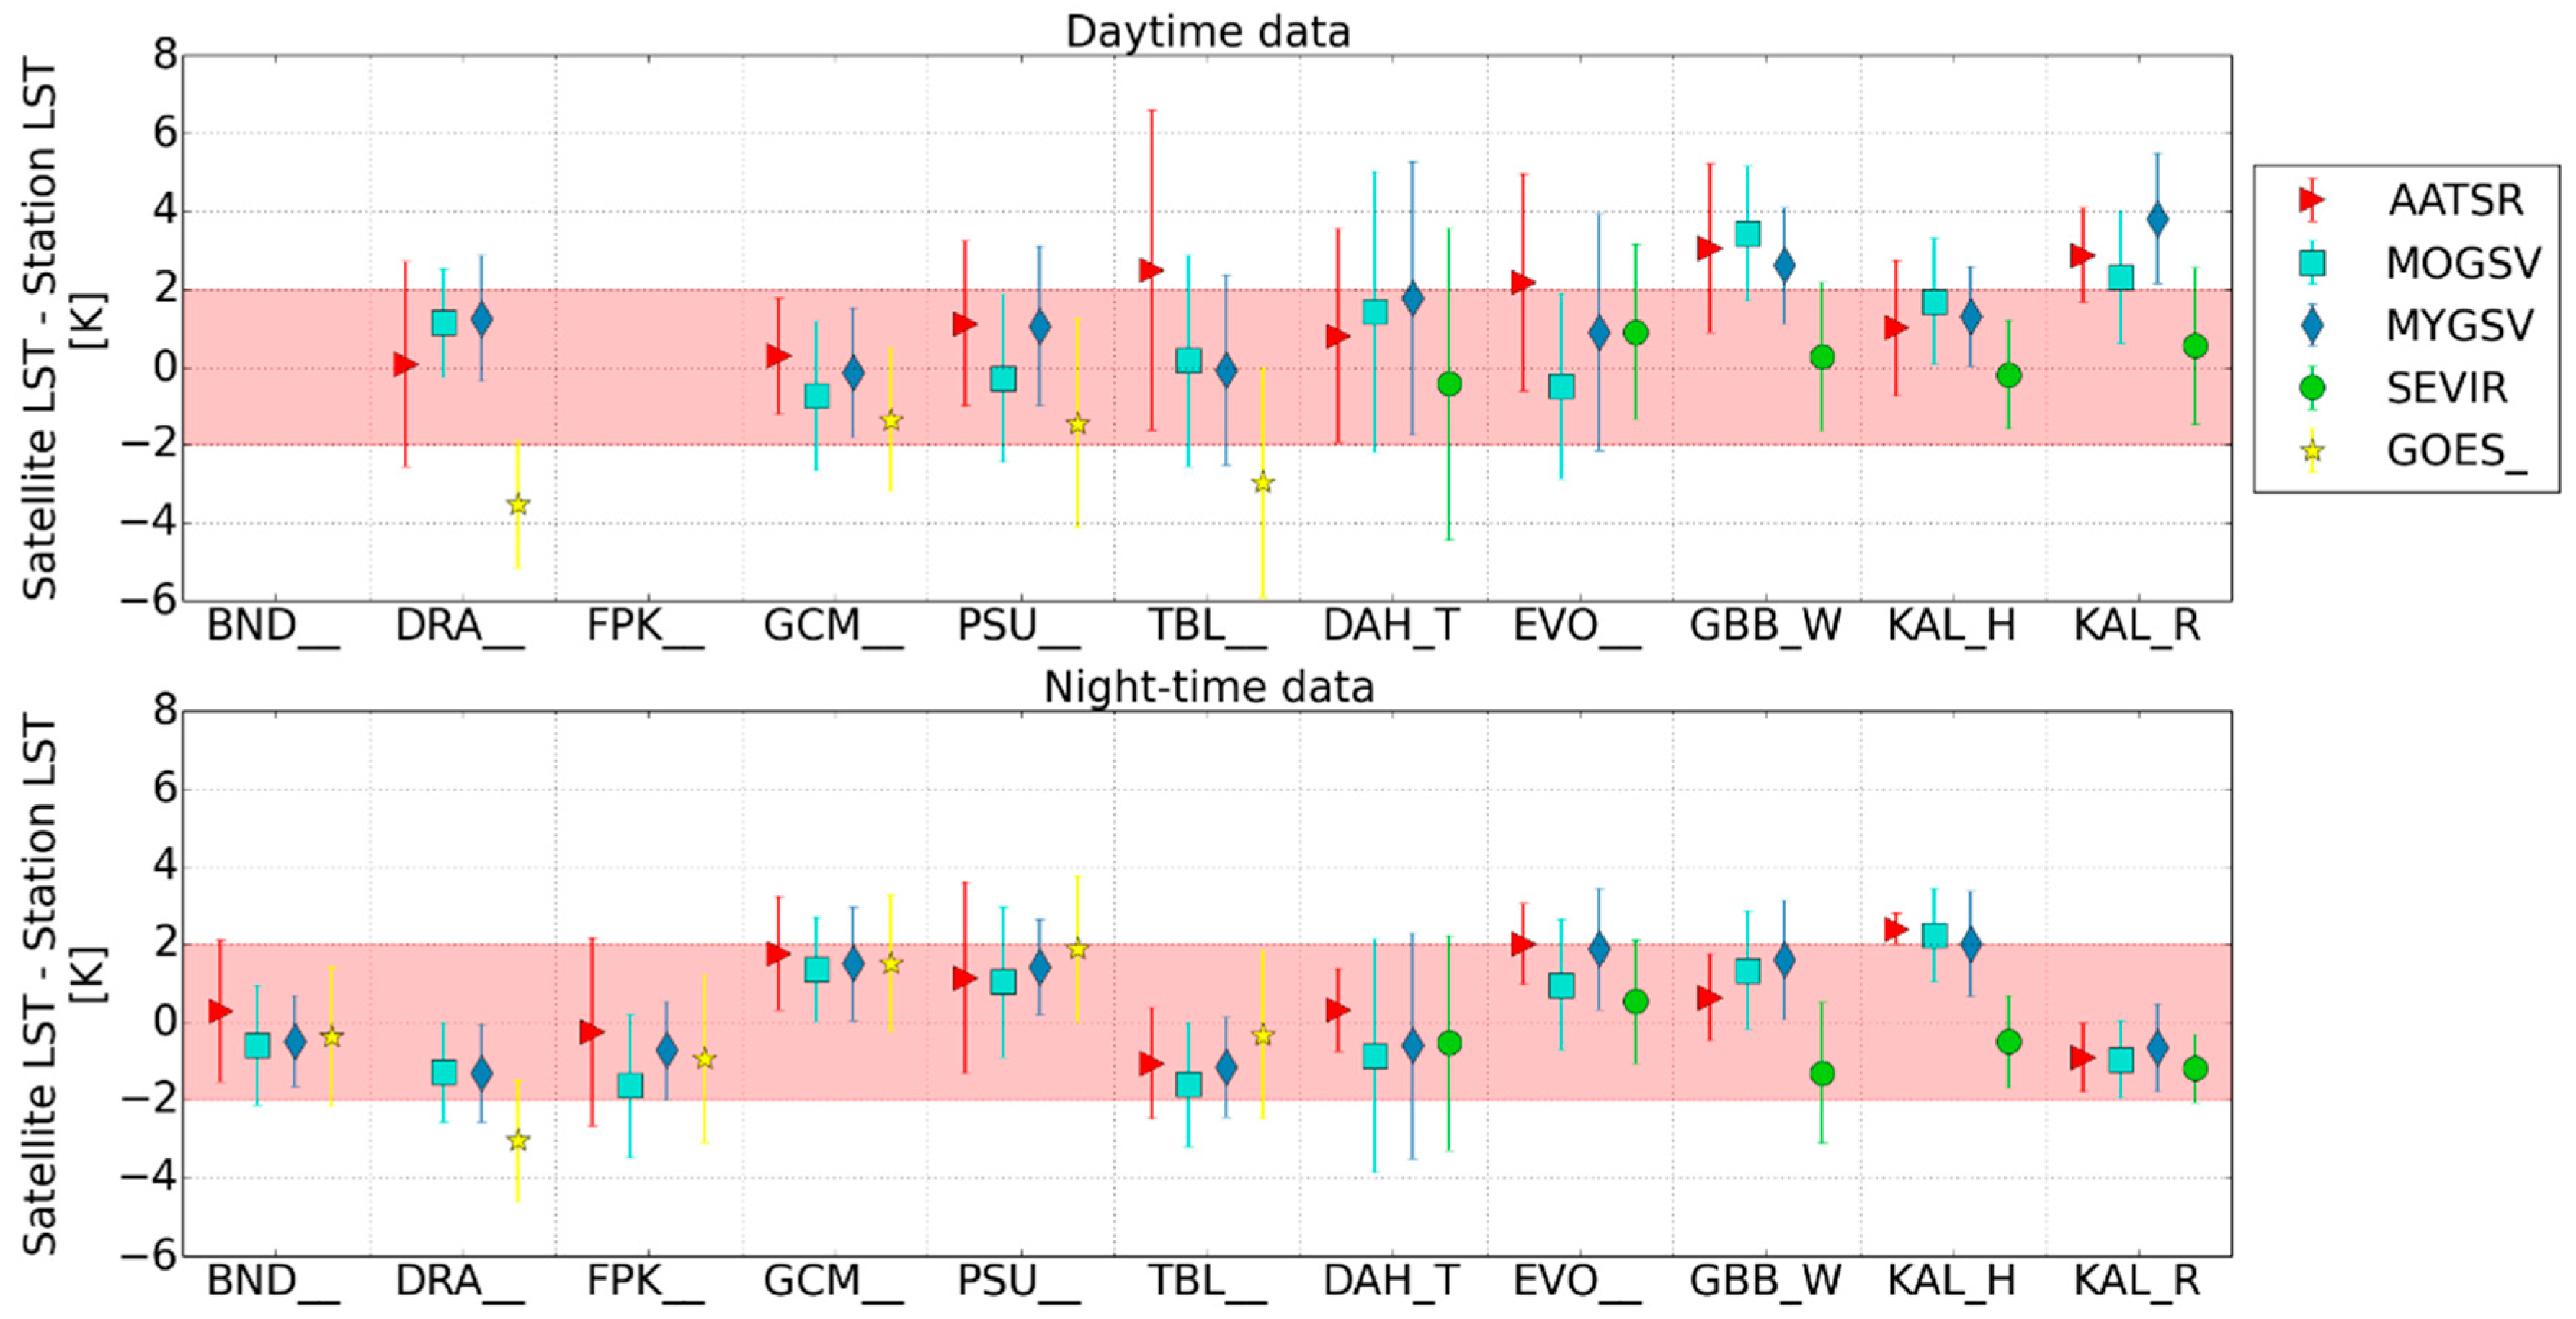
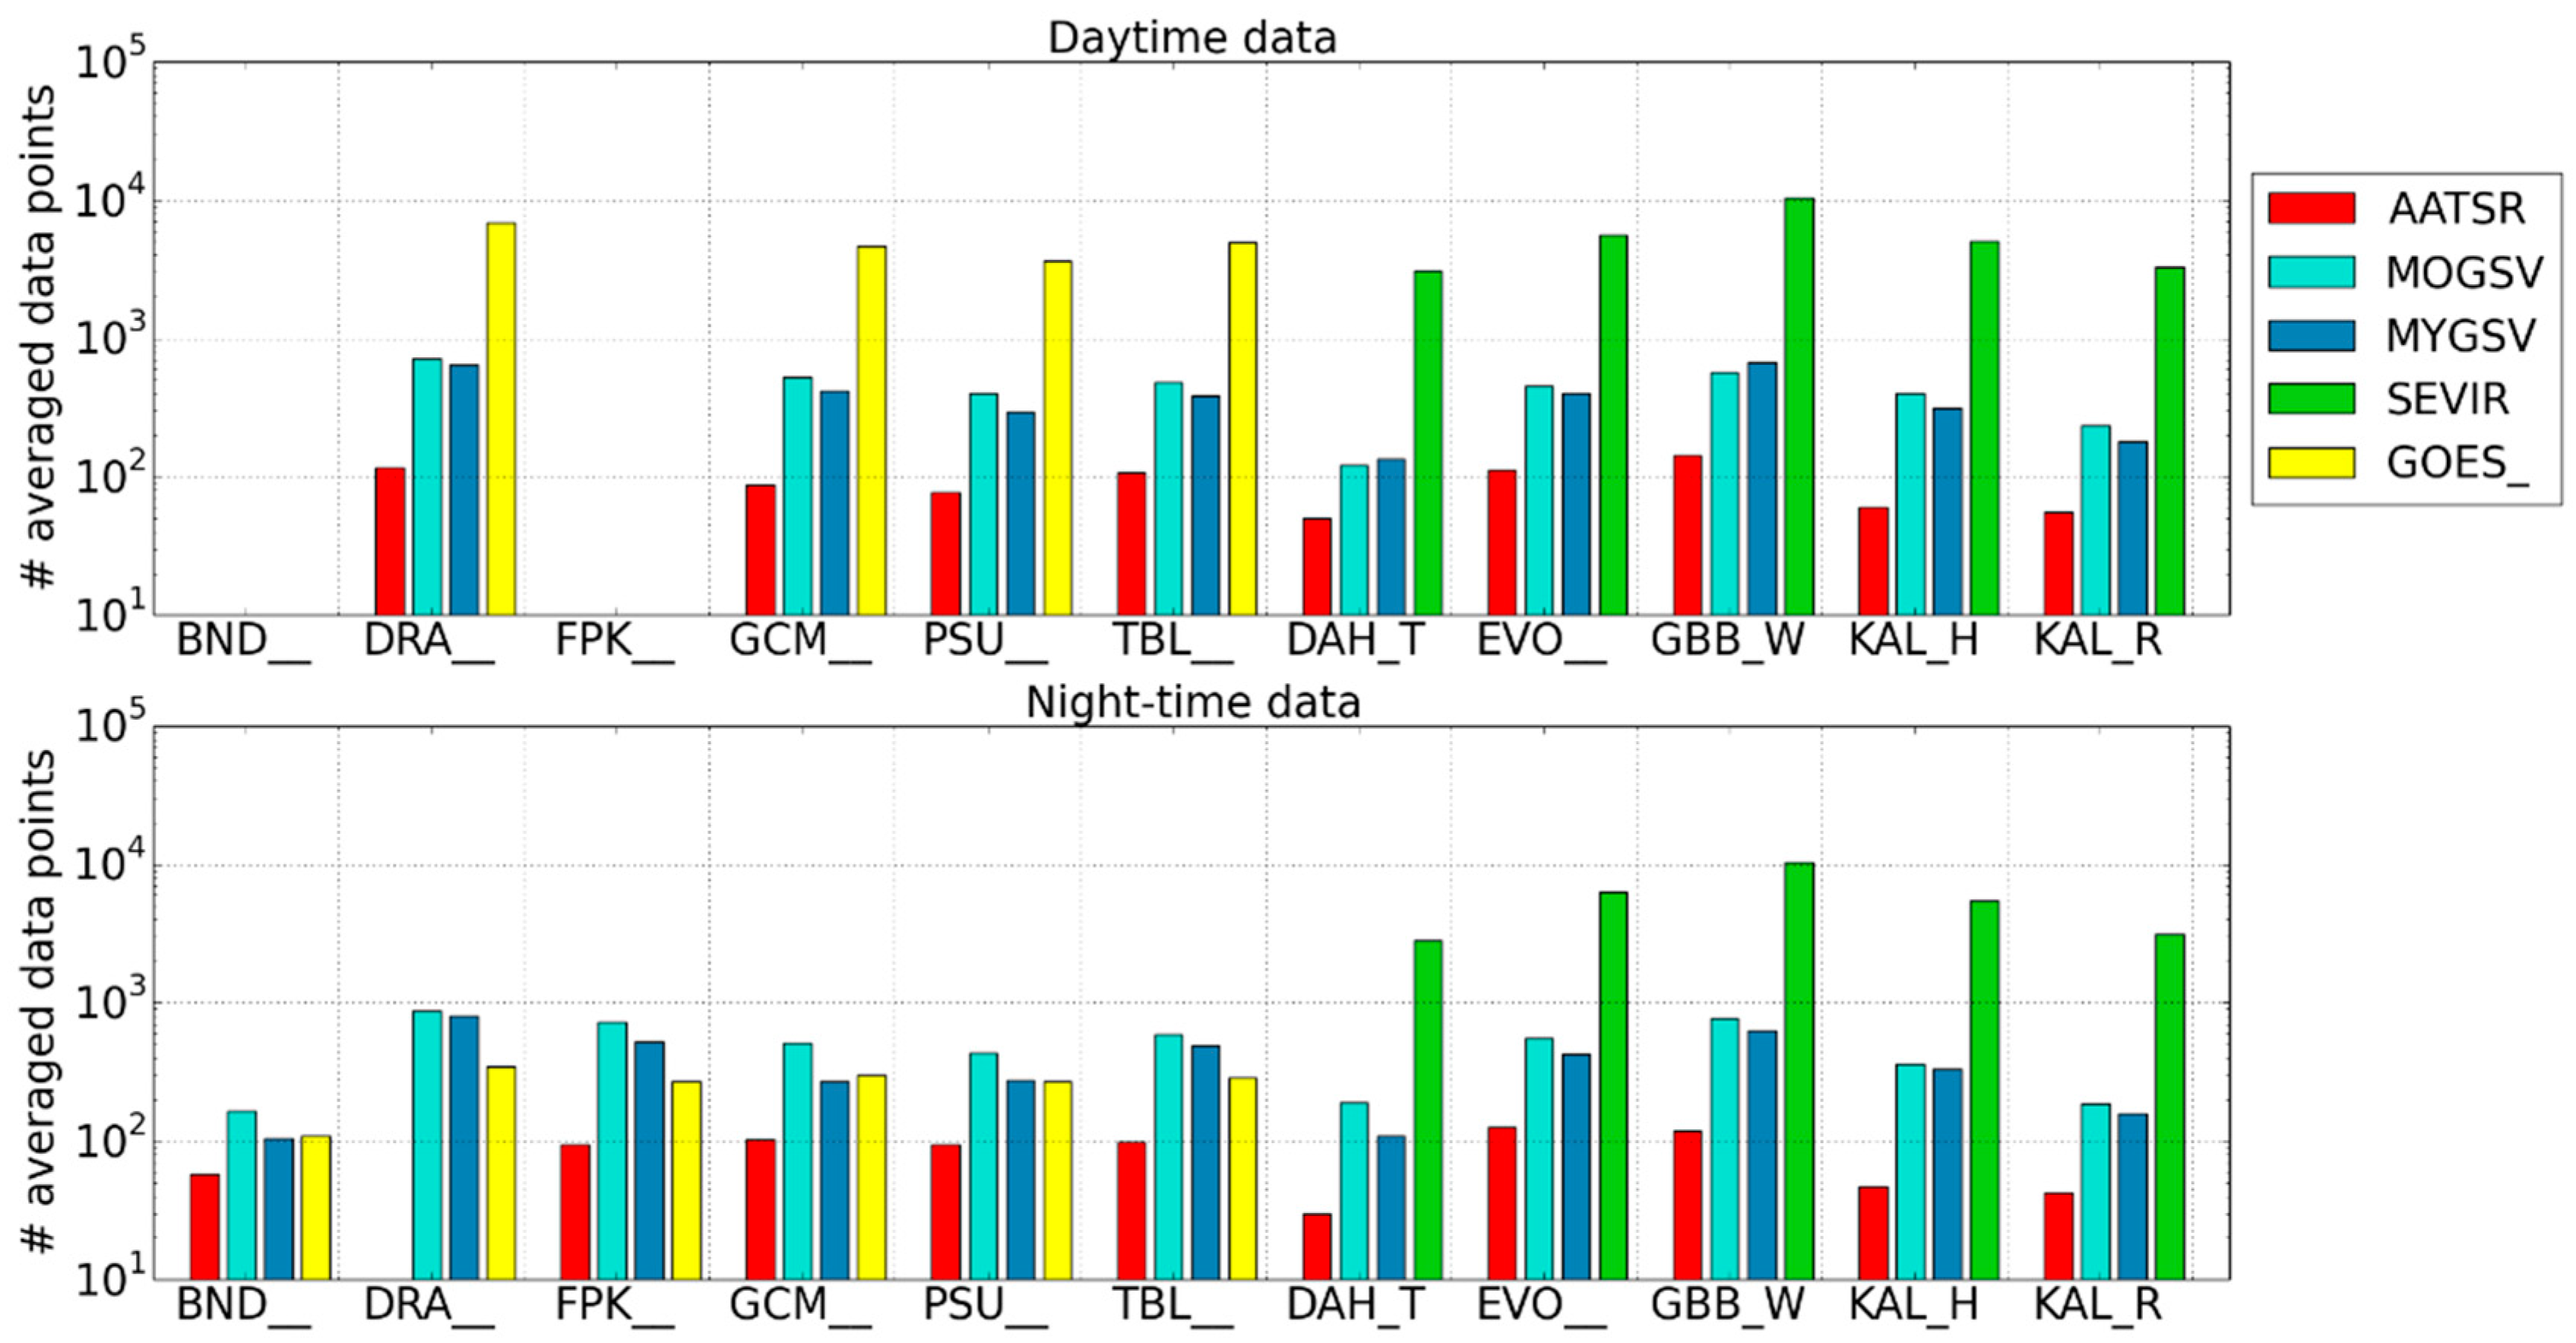
3.1. Validation Results for 2010–2012

All data sets were validated for the years 2010–2012. These years were chosen as all investigated satellite, and in situ data sets are available for this time period. A graphic overview of the accuracy of all validation pairs is presented in Figure 8. The upper plot shows the median accuracy at the different stations for the daytime data, the lower plot for the night-time data. The given error bars in this and in the following time series plots are the robust standard deviations, as defined above. Due to technical difficulties caused by overheating and theft, at DAH station only the period 2010–2011 is considered.
The deviations are often within 2.0 K (indicated by the red shadings in Figure 8), which is the target accuracy of the operational SEVIRI LST product of the LSA-SAF [22]. In general, as expected, the accuracies are higher during night, when shadows are absent and the influence of heterogeneous land covers is lower. In contrast, during daytime these factors often lead to increased differences between the in situ point measurements and the satellite measurements.
The GEO data sets from SEVIRI and GOES generally have lower LST values than the corresponding LEO data sets. The SEVIRI LST–in situ LST differences usually lay well within ±2.0 K, whereas the GOES differences tend to be more negative and exceed −2.0 K, especially at stations DRA and TBL. The areas around these two stations are rather heterogeneous, and the LEO data sets are, therefore, averaged over a smaller area than GEO data sets.
In this study, it was found that the results for daytime and night-time accuracies differ considerably from station to station, depending on such factors as orography, land cover, and surface homogeneity. Therefore, the time series for all stations are discussed in detail below, investigating the observed differences for each station separately.
As the accuracies displayed in Figure 8 are averaged over the entire investigated time span, even larger seasonal variations often average out. However, they are reflected in the STDs. The STDs display, similar to the accuracies, large differences between satellite and in situ data sets at individual stations. They range from close to 0 K (AATSR night-time accuracy, over KAL_H) to over 4.0 K (AATSR daytime accuracy over TBL, and MOGSV and SEVIRI daytime accuracy over DAH_T). At both stations, the reason for this is mainly a strong seasonal cycle. The STD of SEVIRI LST–in situ LST varies between stations; it is up to 4.0 K at DAH_T station during the day and below 2.5 K at the other stations. For GOES, STD is highest at TBL station during day, where it is up to 3.0 K. As the satellite and in situ uncertainties are below 2 K for the used data sets, STDs larger than 2 K indicate that some factors leading to differences between the data sets are not captured in their uncertainties for the particular validation. There are different reasons for such enlarged STDs depending on the station, which will be discussed in further detail below for the individual stations.
The numbers of matches available for the averaging are displayed in Figure 9. They influence the statistical significance on the calculated median values. For the LEO data sets, AATSR has the lowest number of matches with around 100 matches, while MOGSV and MYGSV have up to 1000 matches. The SEVIRI data set, which contains hourly data, has up to 10,000 matches. GOES has a similar number of matches during day, but considerably fewer during night, which is probably caused by the different retrieval method between day and night that leads to a very strict cloud clearing during night. The median, STD, and number of data points used are displayed in Table 3, Table 4 and Table 5 for the different sets of stations and validated years.

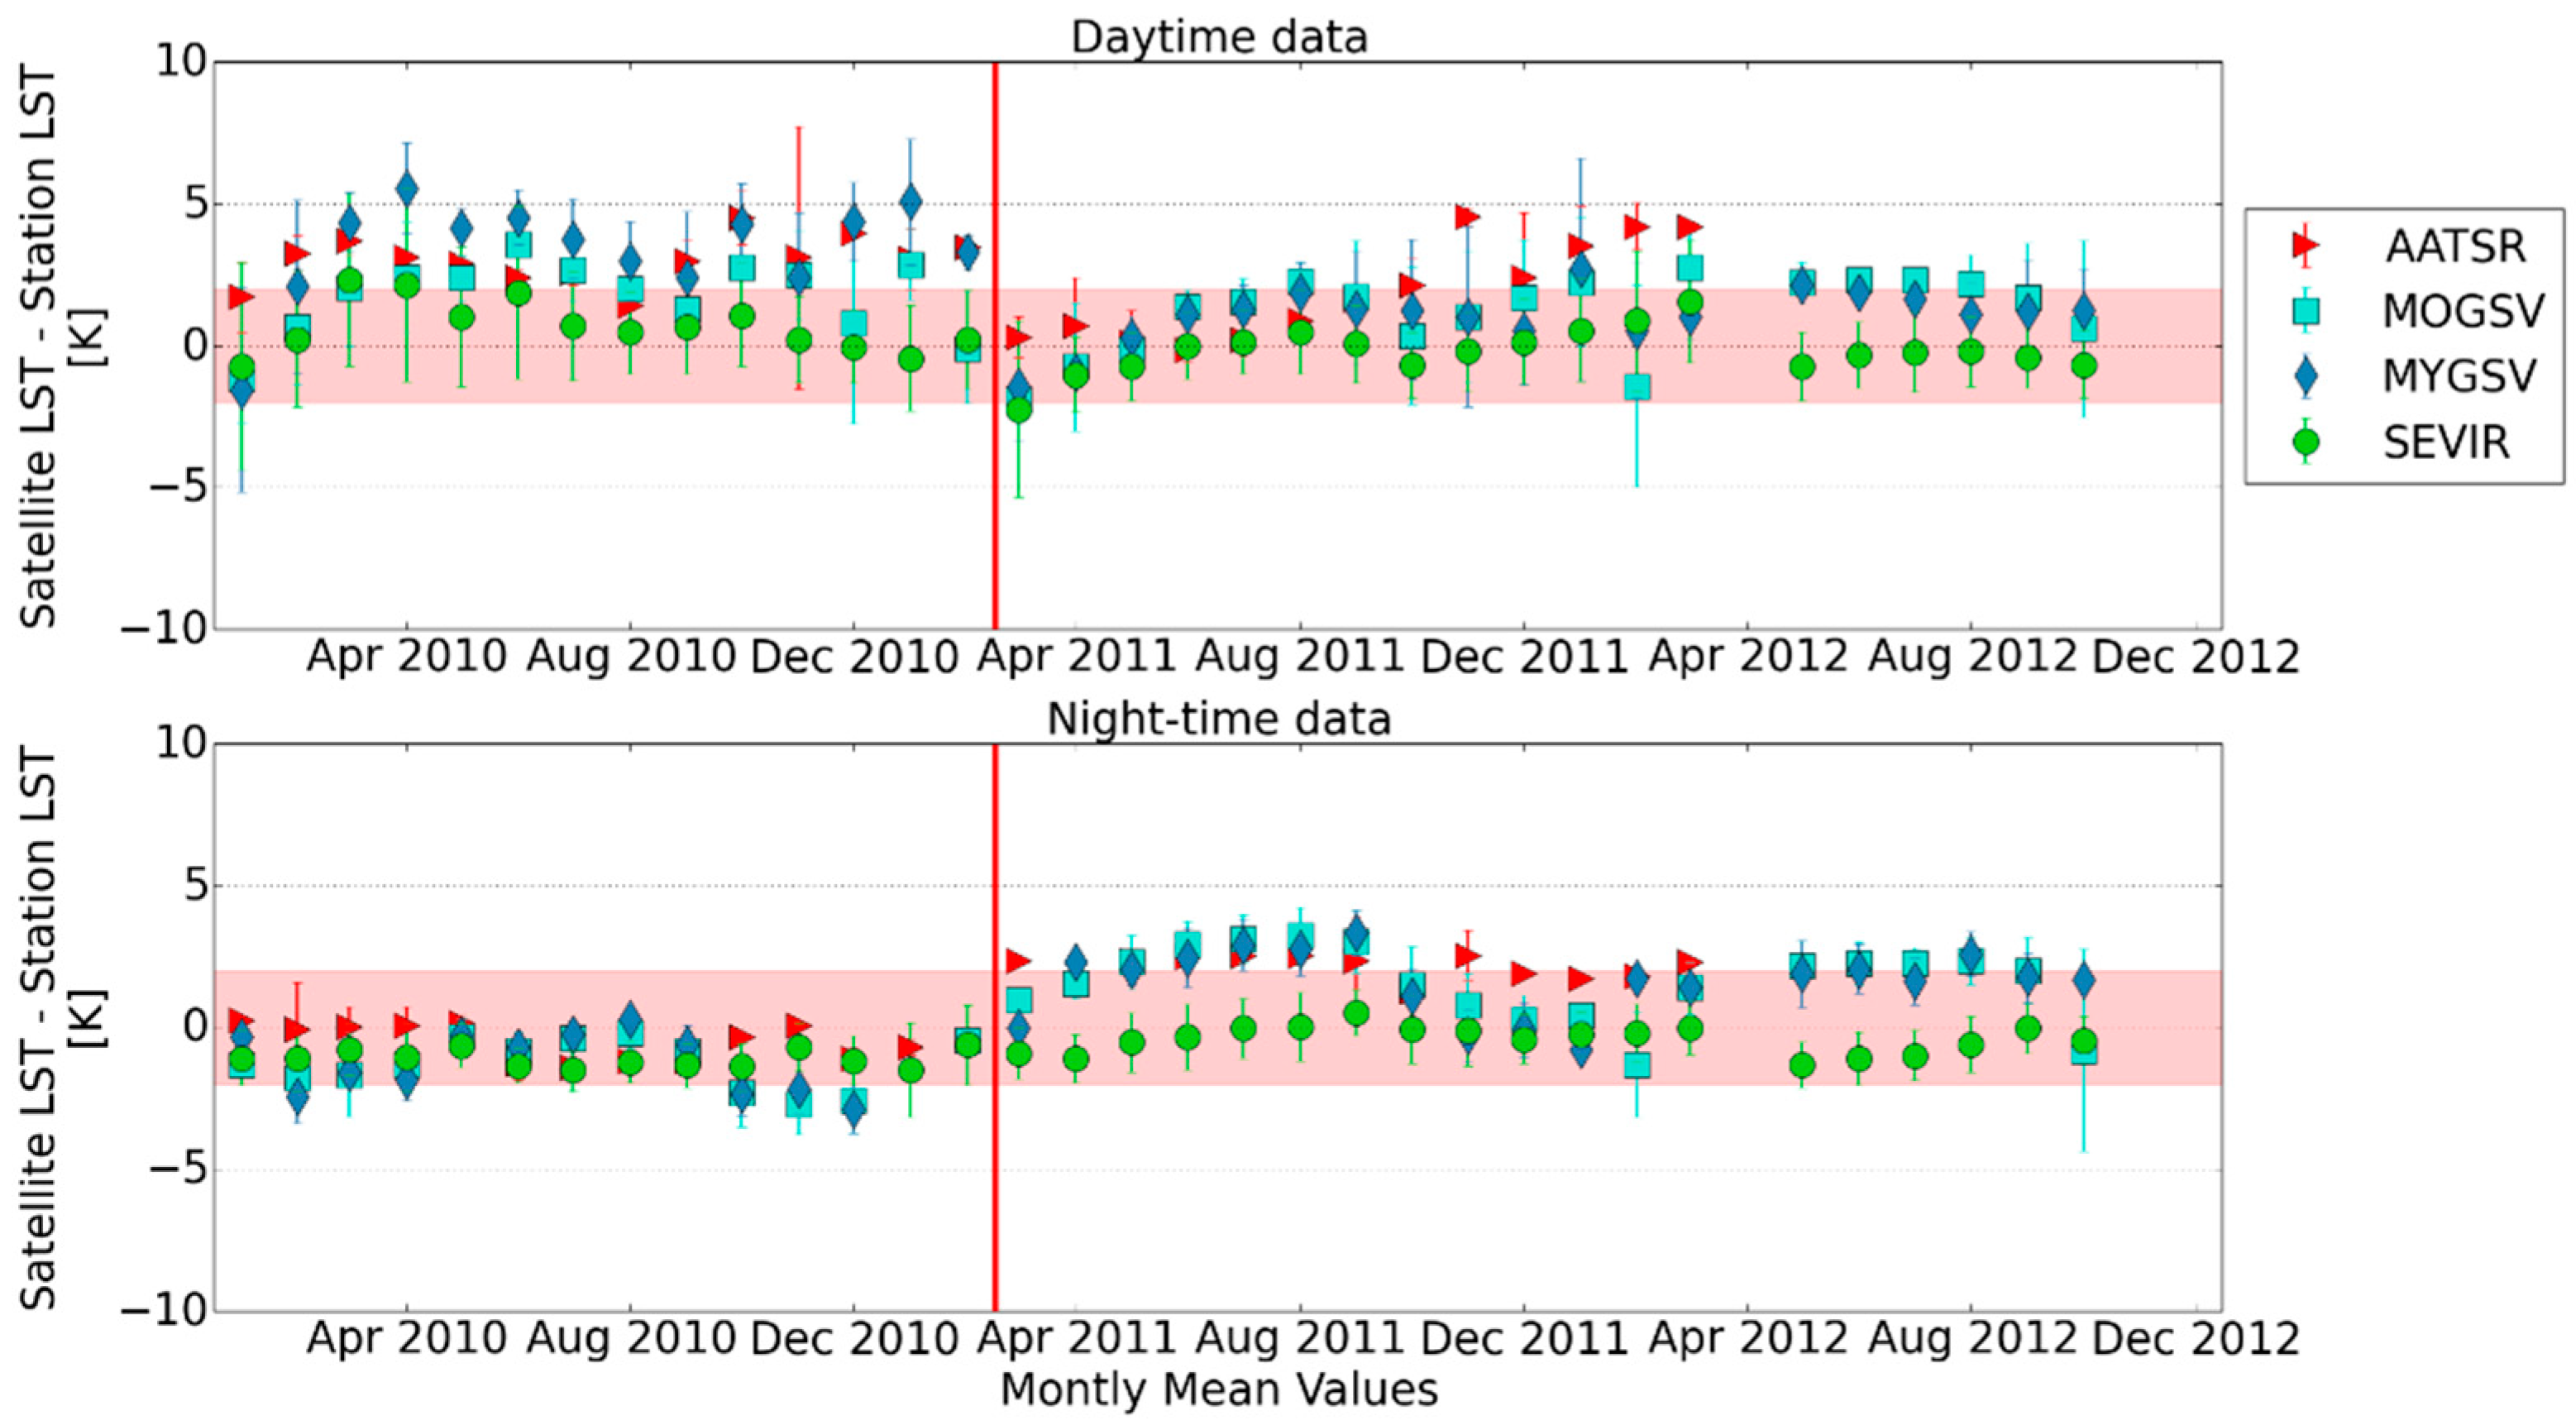
3.2. Time-Series Analyses

In the following, time series analyses of monthly validation results at individual stations are presented in order to investigate the observed differences between satellite and in situ data in more detail. The stations are grouped by land cover class.

3.2.1. Desert Station: GBB_W

Night-time and daytime monthly median accuracy for GBB_W station are shown in Figure 10. The LEO–in situ LST differences are, in general, more positive than the respective SEVIRI differences. At night all investigated satellite data sets are generally in good agreement with each other. The differences SEVIRI LST–in situ LST are most of the time within the ±2.0 K range. During the day, the differences for the LEO data sets often exceed + 2.0 K, especially in the summer months. The STD of the median accuracies of the whole investigated time span is highest for SEVIRI and AATSR during the day, but below 2.0 K for all data sets. The worse validation results of the LEO LST compared to the SEVIRI LST is suspected to be partially due to inaccurate emissivities. Whereas SEVIRI and KIT in situ LST data are retrieved with similar emissivities, the LEO data sets are retrieved with potentially quite different emissivity values [53].
There is an apparent shift for the SEVIRI LST from April 2011 onwards. After this date, night-time and daytime SEVIRI–in situ LST differences are more negative, although they stay mainly within ±2.0 K during day, and the absolute daytime differences decrease. This behaviour was not observed in an earlier analysis of operational LSA-SAF SEVIRI LST [18]. A possible explanation would be that the reprojection of SEVIRI pixels from their native grid to GT spatial grid resulted in different spatial matching.

3.2.2. Semi-Desert Stations: KAL_R and KAL_H

The in situ measurements in the Kalahari semi-desert in Namibia are taken from station KAL_R until February 2011, when the station had been relocated. Afterwards, the results shown in Figure 11 are for station KAL_H.
KAL_H has fewer large trees than KAL_R and is generally bushier, which reduces directional effects at daytime. This is reflected in the improved daytime accuracy for KAL_H compared to KAL_R, as can be seen in Figure 11. SEVIRI accuracies are most of the time well within the ±2.0 K range, and the SEVIRI STD of the median accuracies is below 2.0 K. The larger negative differences during rainy seasons are probably caused by the contamination of clouds in the satellite data.
There is an increase in the LEO night-time differences for the measurements at KAL_H, which is not observed in the SEVIRI data. As the in situ LST are retrieved using LSA-SAF SEVIRI emissivity as input, this observed lower performance for the LEO LST could be due to a difference in emissivity at KAL_H between the various satellite instruments. However, this could not be verified, since AATSR emissivity is not explicitly produced.

3.2.3. Subtropical Station: DAH_T

The monthly time series for night-time and daytime data are displayed in Figure 12. A strong seasonal cycle is seen in all data sets, which is caused by the strong vegetation cycle at the station [18]. During the rainy seasons the differences between satellite and in situ LST tend to be negative, which mainly reflect the high aerosol load and increased cloud contamination during this time. The increase of up to 8 K in STD during the rainy season also indicates a larger uncertainty in LST retrieval, which can be due to undetected clouds and is not captured adequately in the satellite uncertainties.

3.2.4. Forest Station: EVO

Monthly median accuracies over EVO are displayed in Figure 13 from January 2010 to May 2012. After that time, data are excluded from the validation due to known difficulties with the in situ measurements. A strong seasonal cycle can be seen in all satellite products, especially for daytime data. This is caused by directional effects associated with the cork oak trees at the validation site. The large negative monthly difference between night-time MOGSV and in situ LST in December 2010 is caused by cloud contamination in the satellite data. The median difference in this month is formed of ten data points, and several of them have very negative satellite–in situ differences. The high STD above 2 K for all satellite validations at this site reflects the influence of the directional effects, which is not reflected in the in situ and satellite uncertainties.

3.2.5. Rural Station: BND

At this station, only night-time accuracies are considered. For all investigated LST products, BND monthly night-time accuracies are generally within the ±2.0 K range, and the STD for all data sets is not larger than 2.0 K. However, some negative outliers for AATSR and GOES were observed, which are thought to be caused by undetected clouds during night, when cloud detection schemes tend to perform worse.

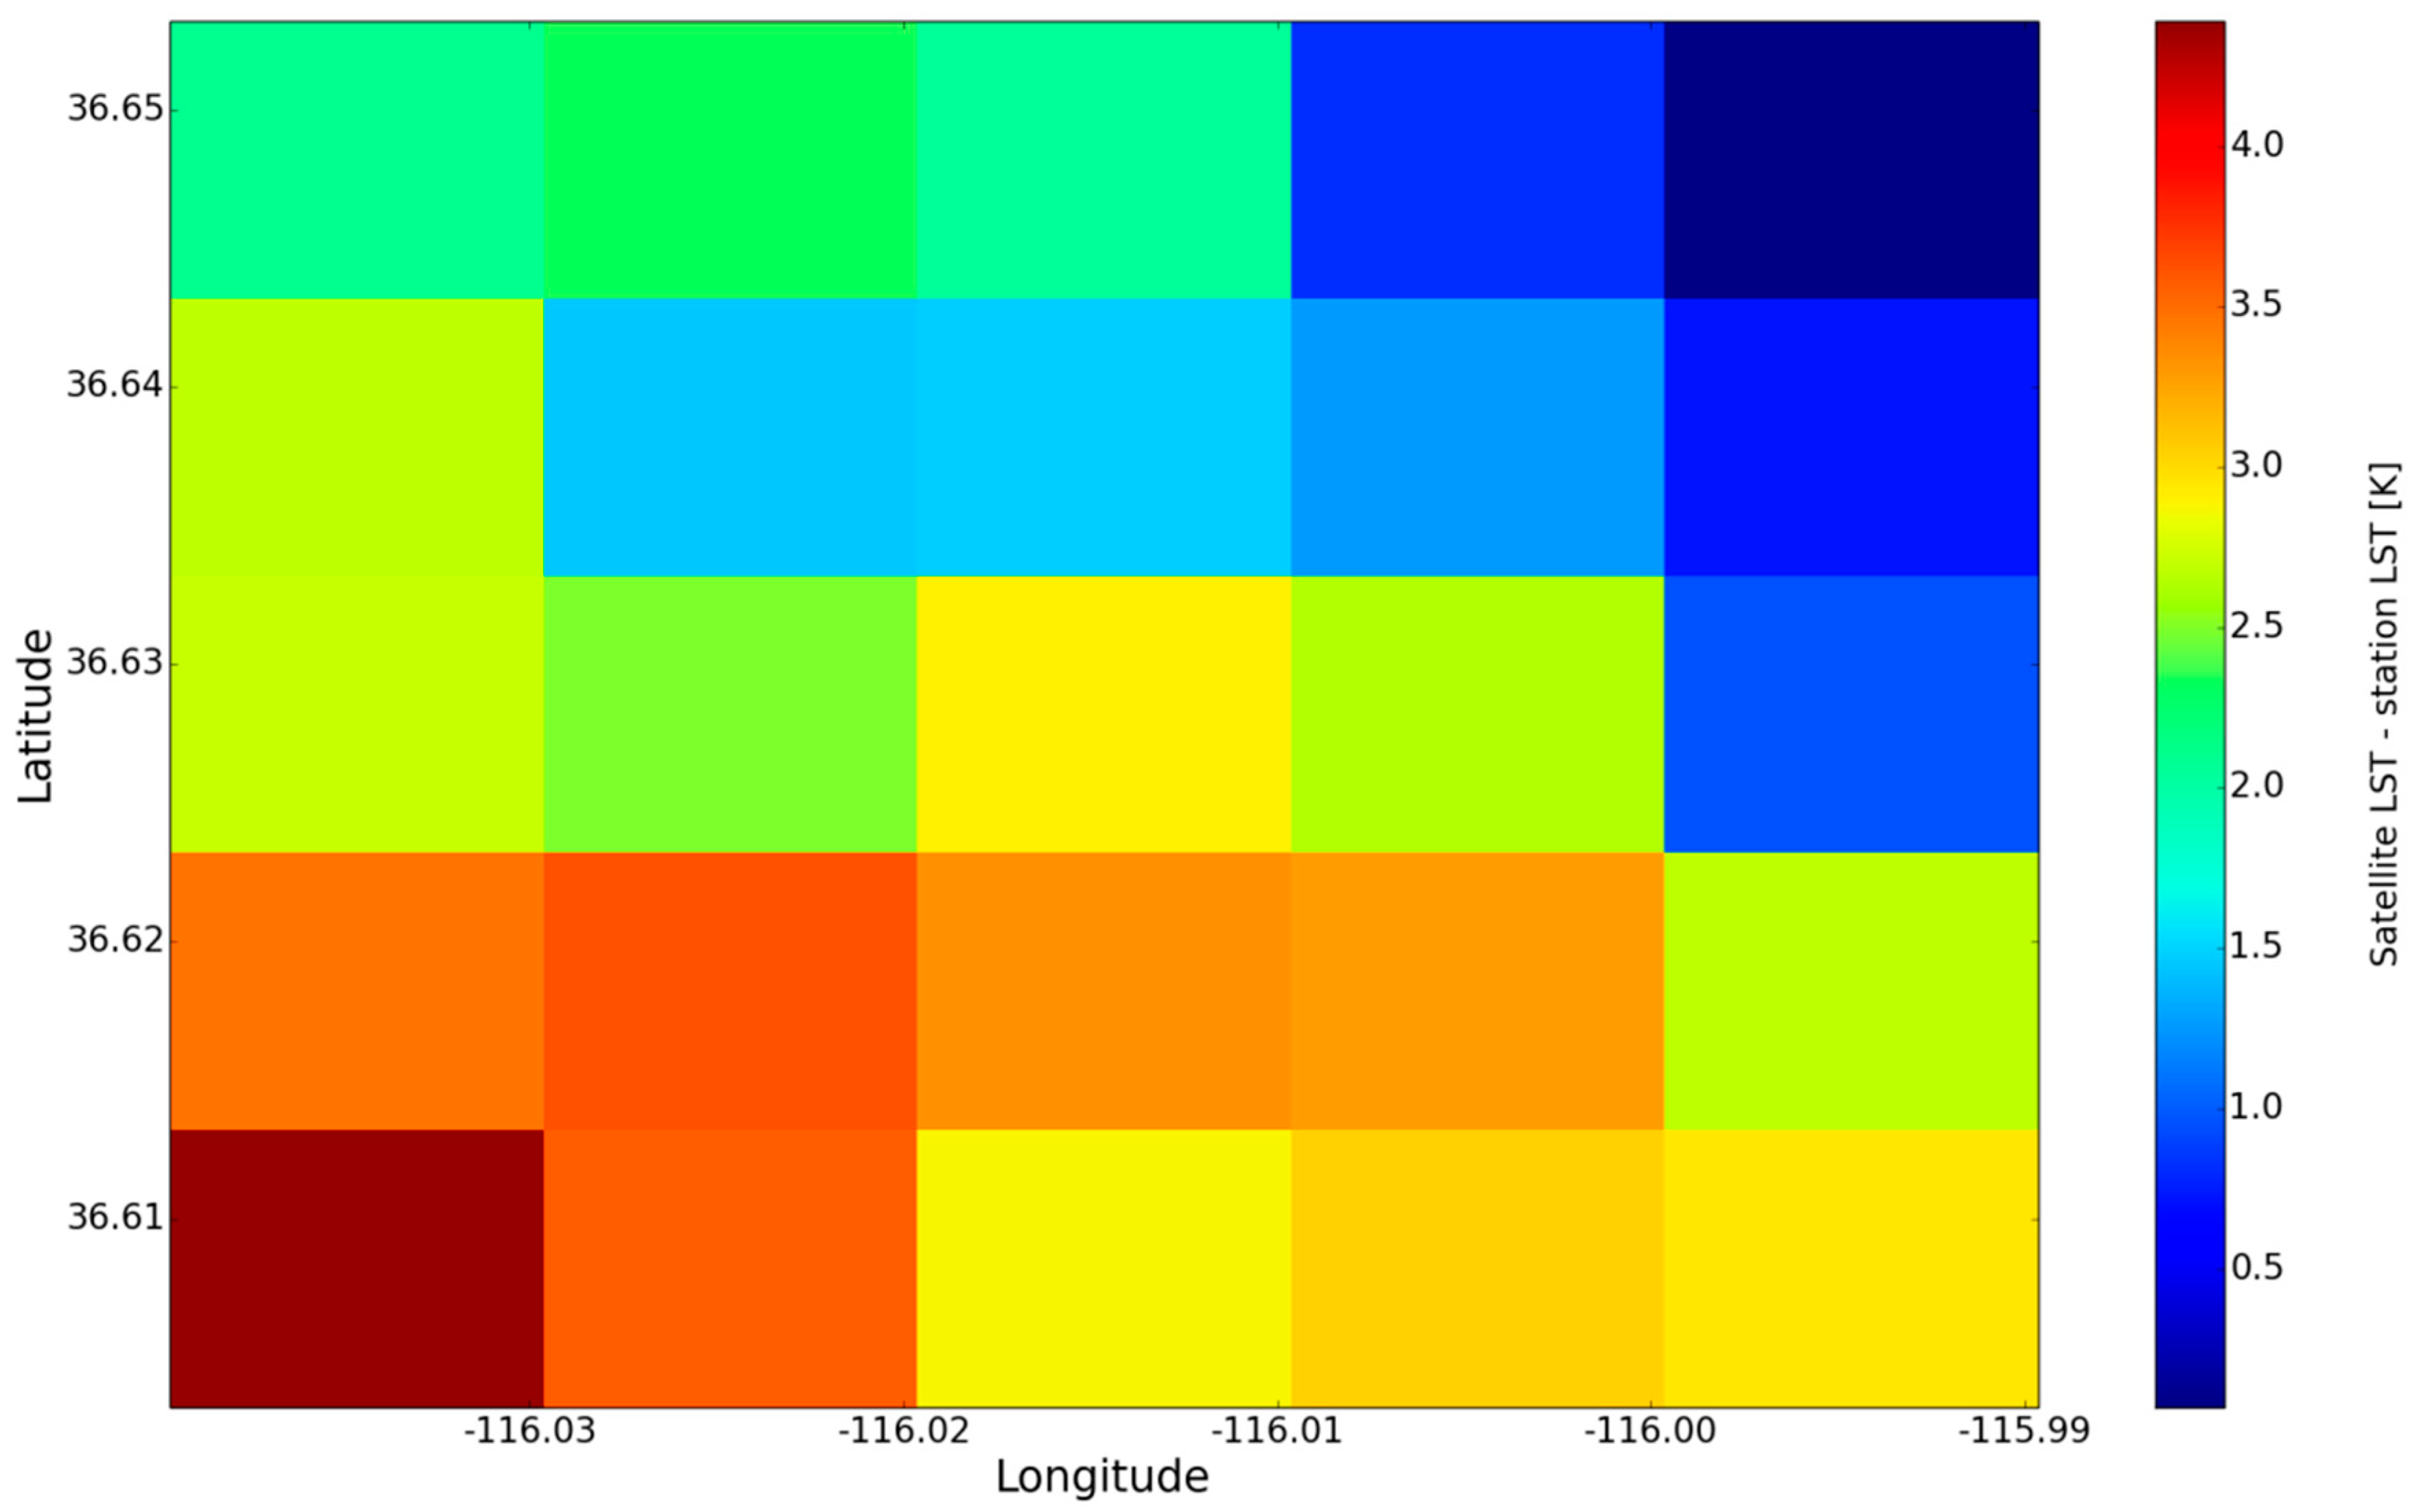
3.2.6. Shrubland Station, Located in a Valley: DRA

The monthly median accuracies over DRA station are displayed in Figure 14. The night-time data for MOGSV and MYGSV are mainly within the ±2.0 K range and do not show a distinct seasonal cycle, and the STD of the median accuracies is below 1.9 K. In contrast, the daytime LEO satellite LST–in situ LST differences exhibit a strong seasonal cycle. Ten years of MODIS data over SURFRAD stations were validated by [27], who also report a strong seasonal cycle over DRA station. For most of the months the negative differences observed between GOES LST and in situ LST exceed −2.0 K. In contrast to the LCC “shrubland” used to retrieve LEO LST, the LCC for calculating GOES LST is “cropland”. Thus, the larger negative differences observed for the GOES data set might be due to emissivity differences. There appears to be a step change in the MOGSV and MYGSV data between 2010 and 2011, after which the yearly cycle of the daytime LST differences is less pronounced. The reasons for this change are unknown and could not be directly traced to the in situ or the satellite data.
Since only a few night-time data points from measurements from AATSR were available, they were not analysed. The lack of data is thought to result from the conservative cloud detection in the AATSR algorithm.

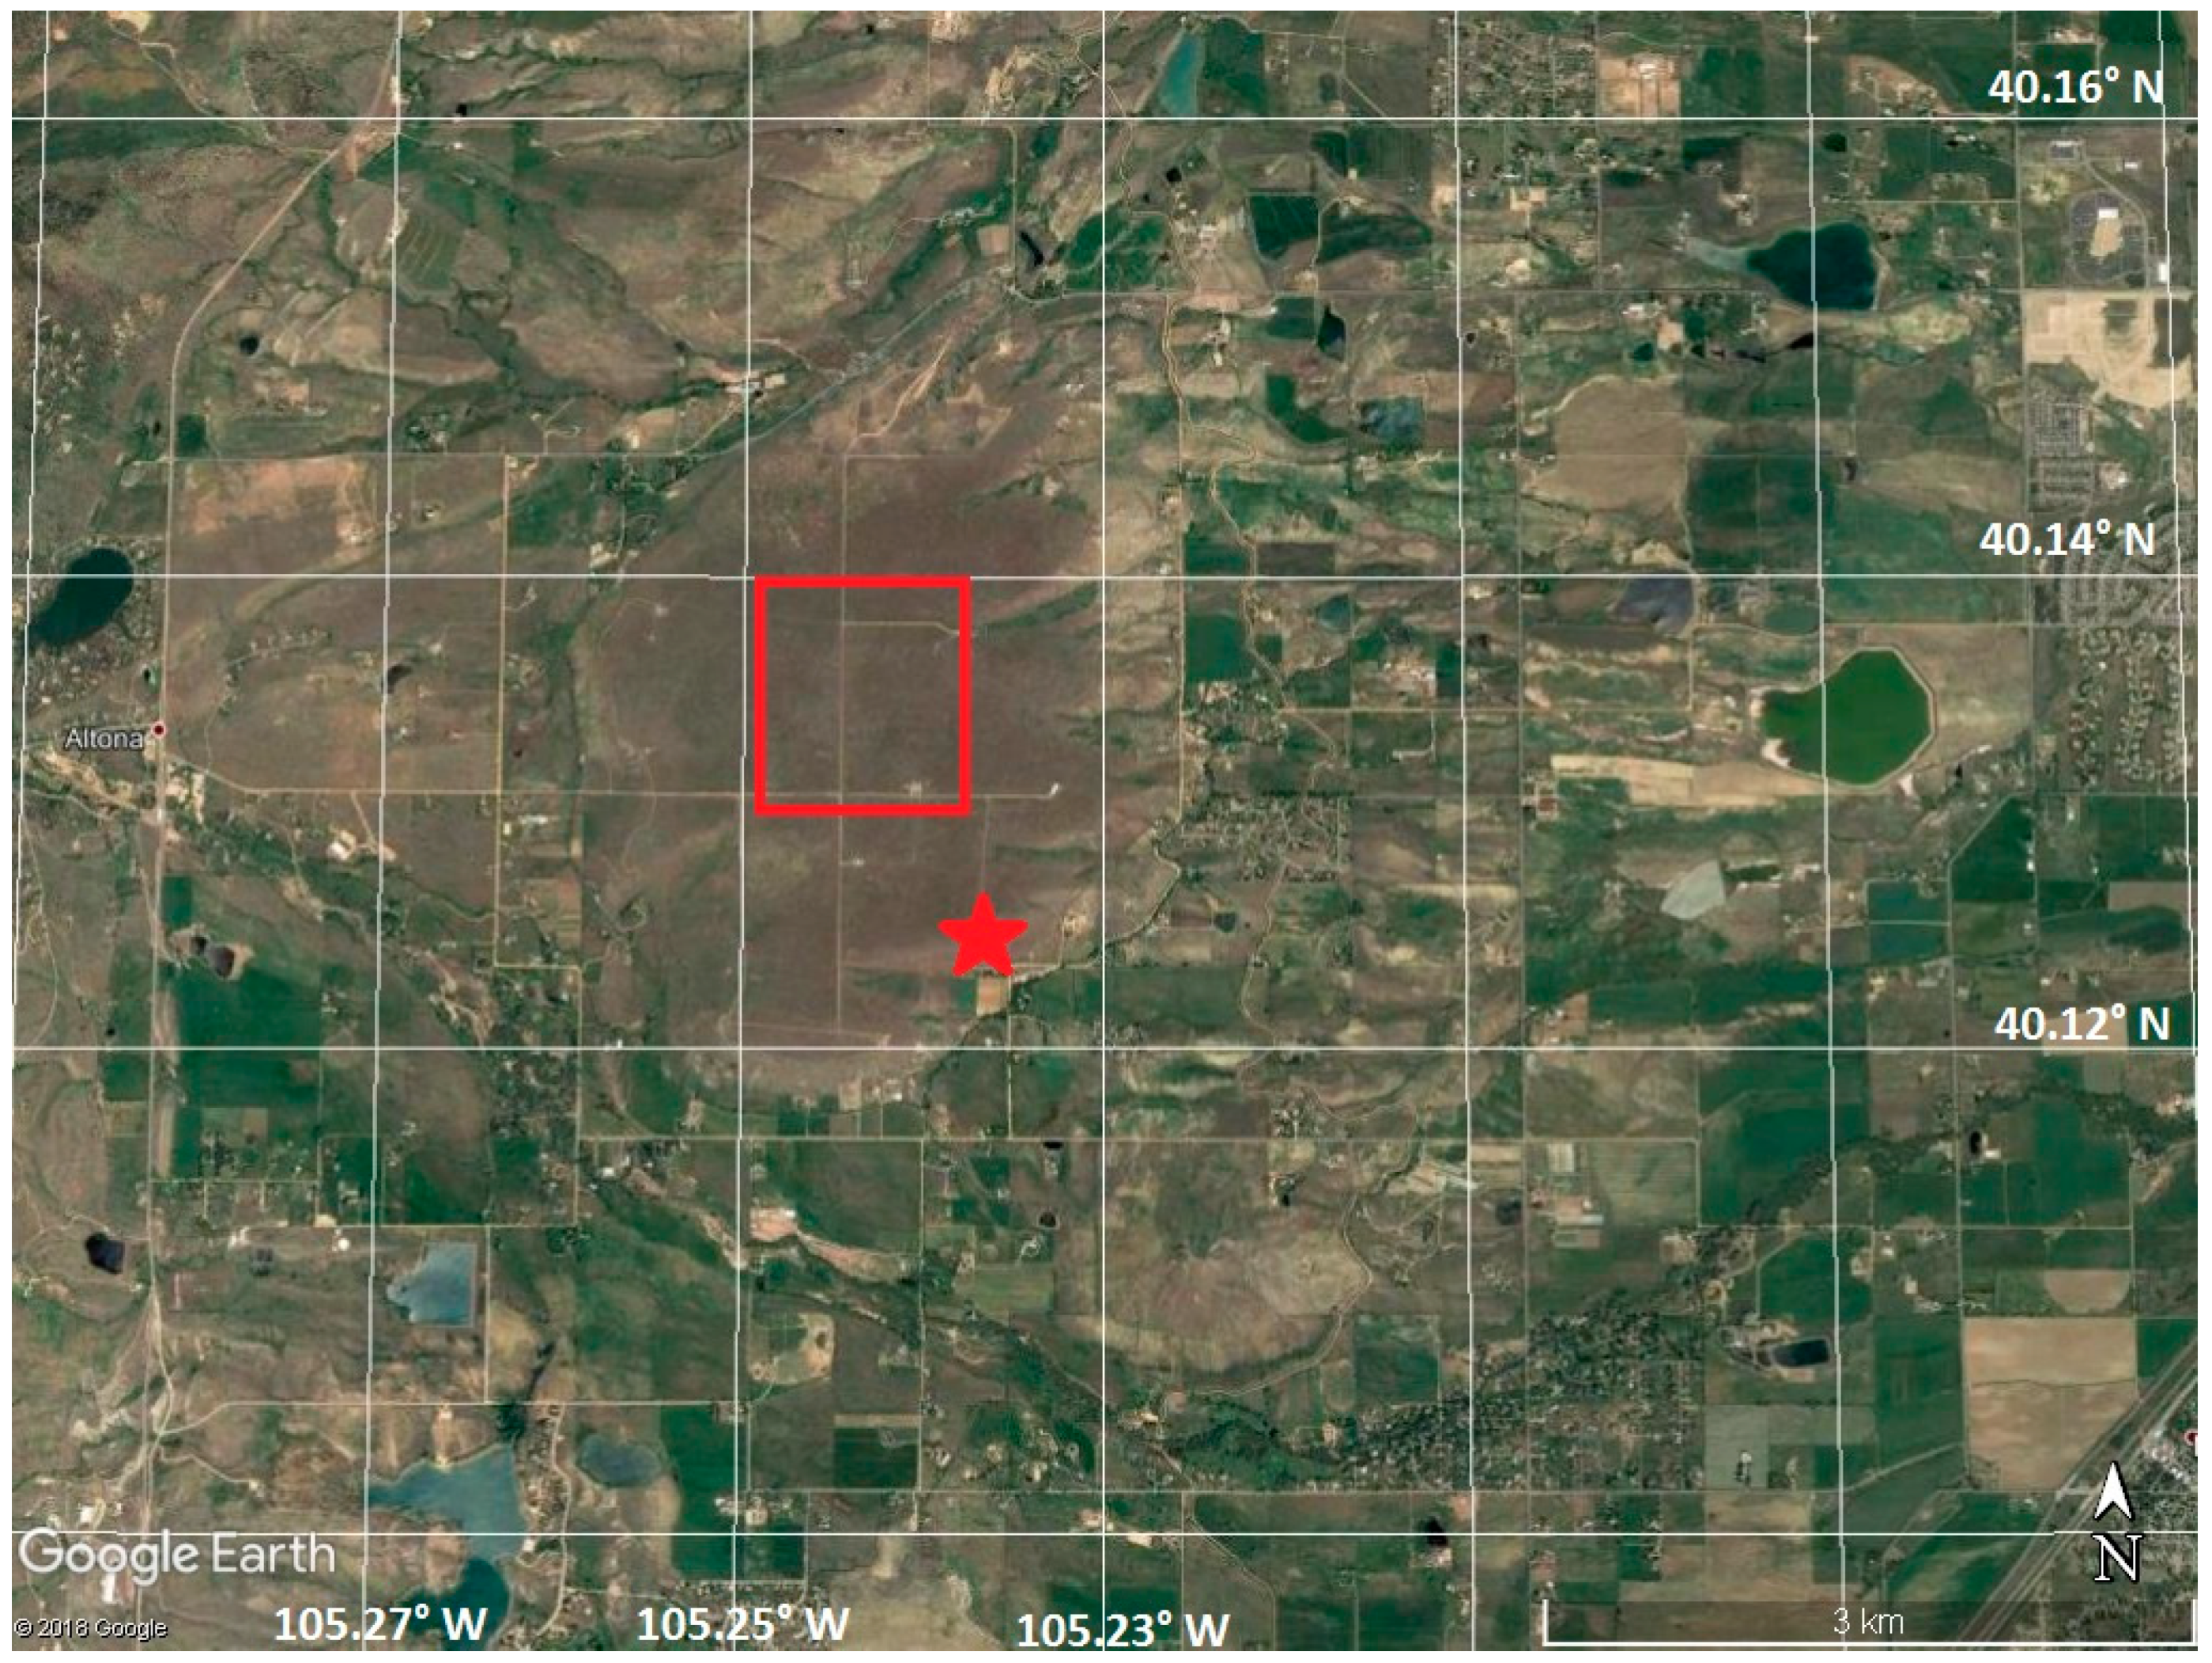
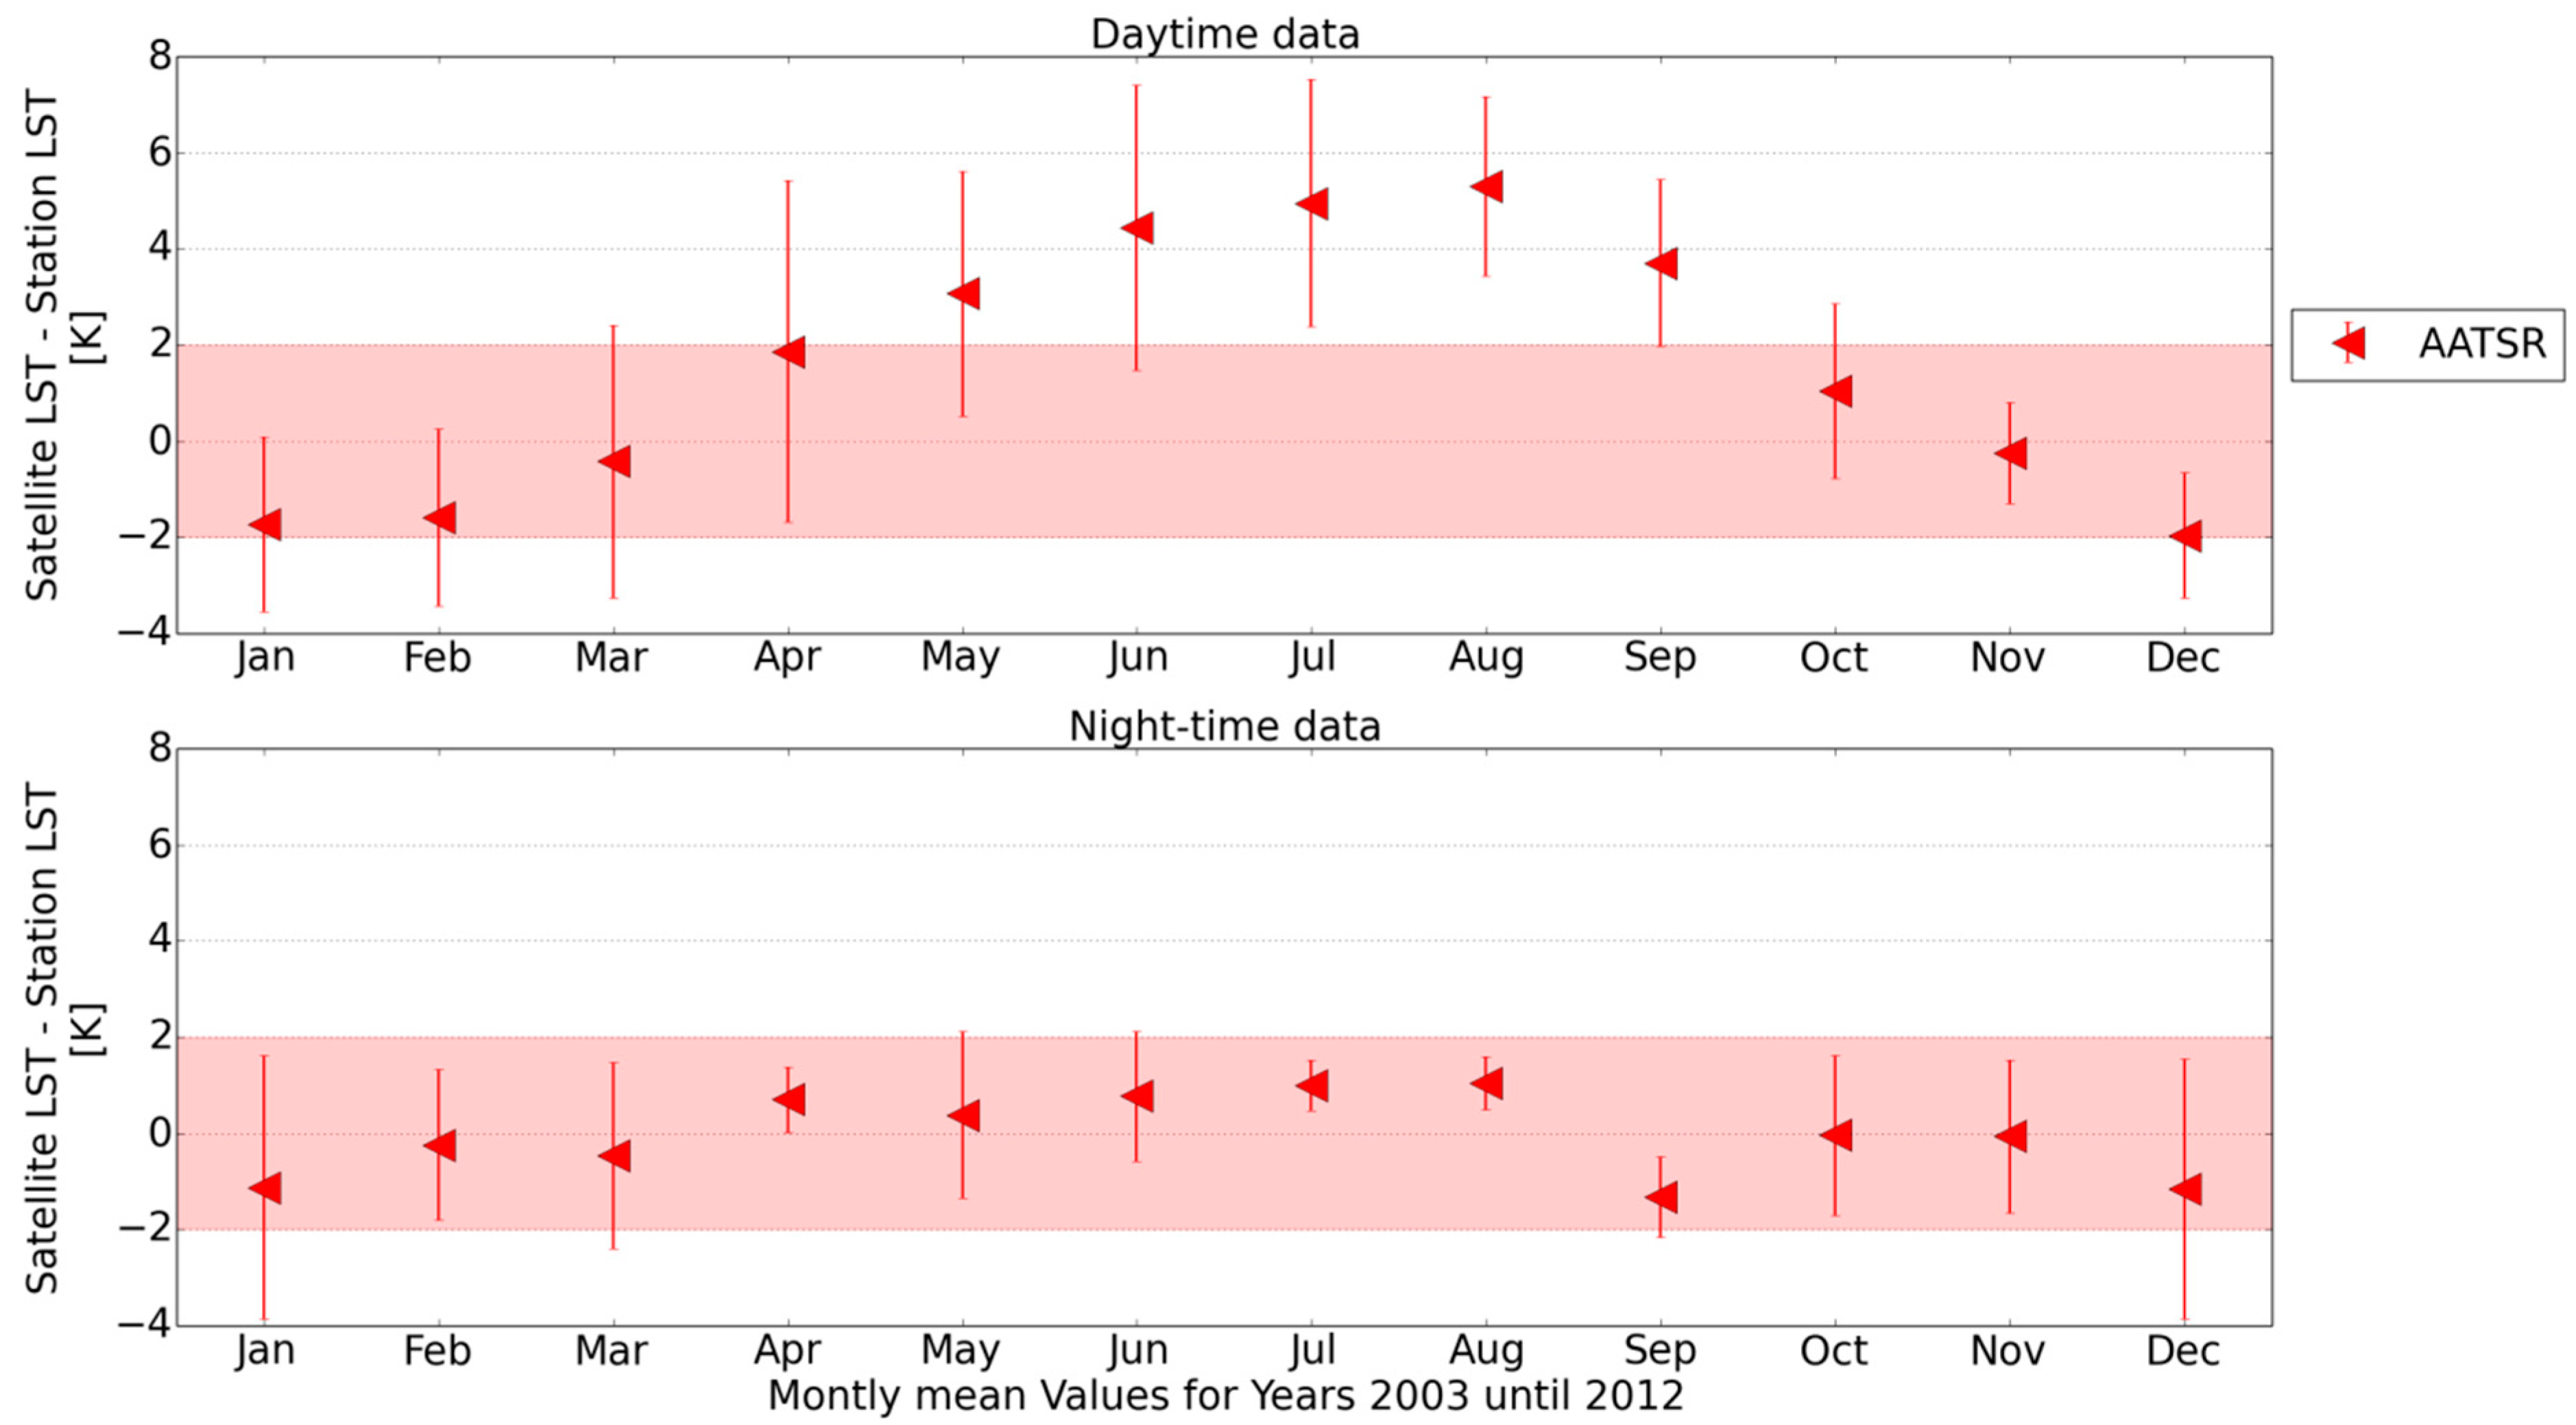
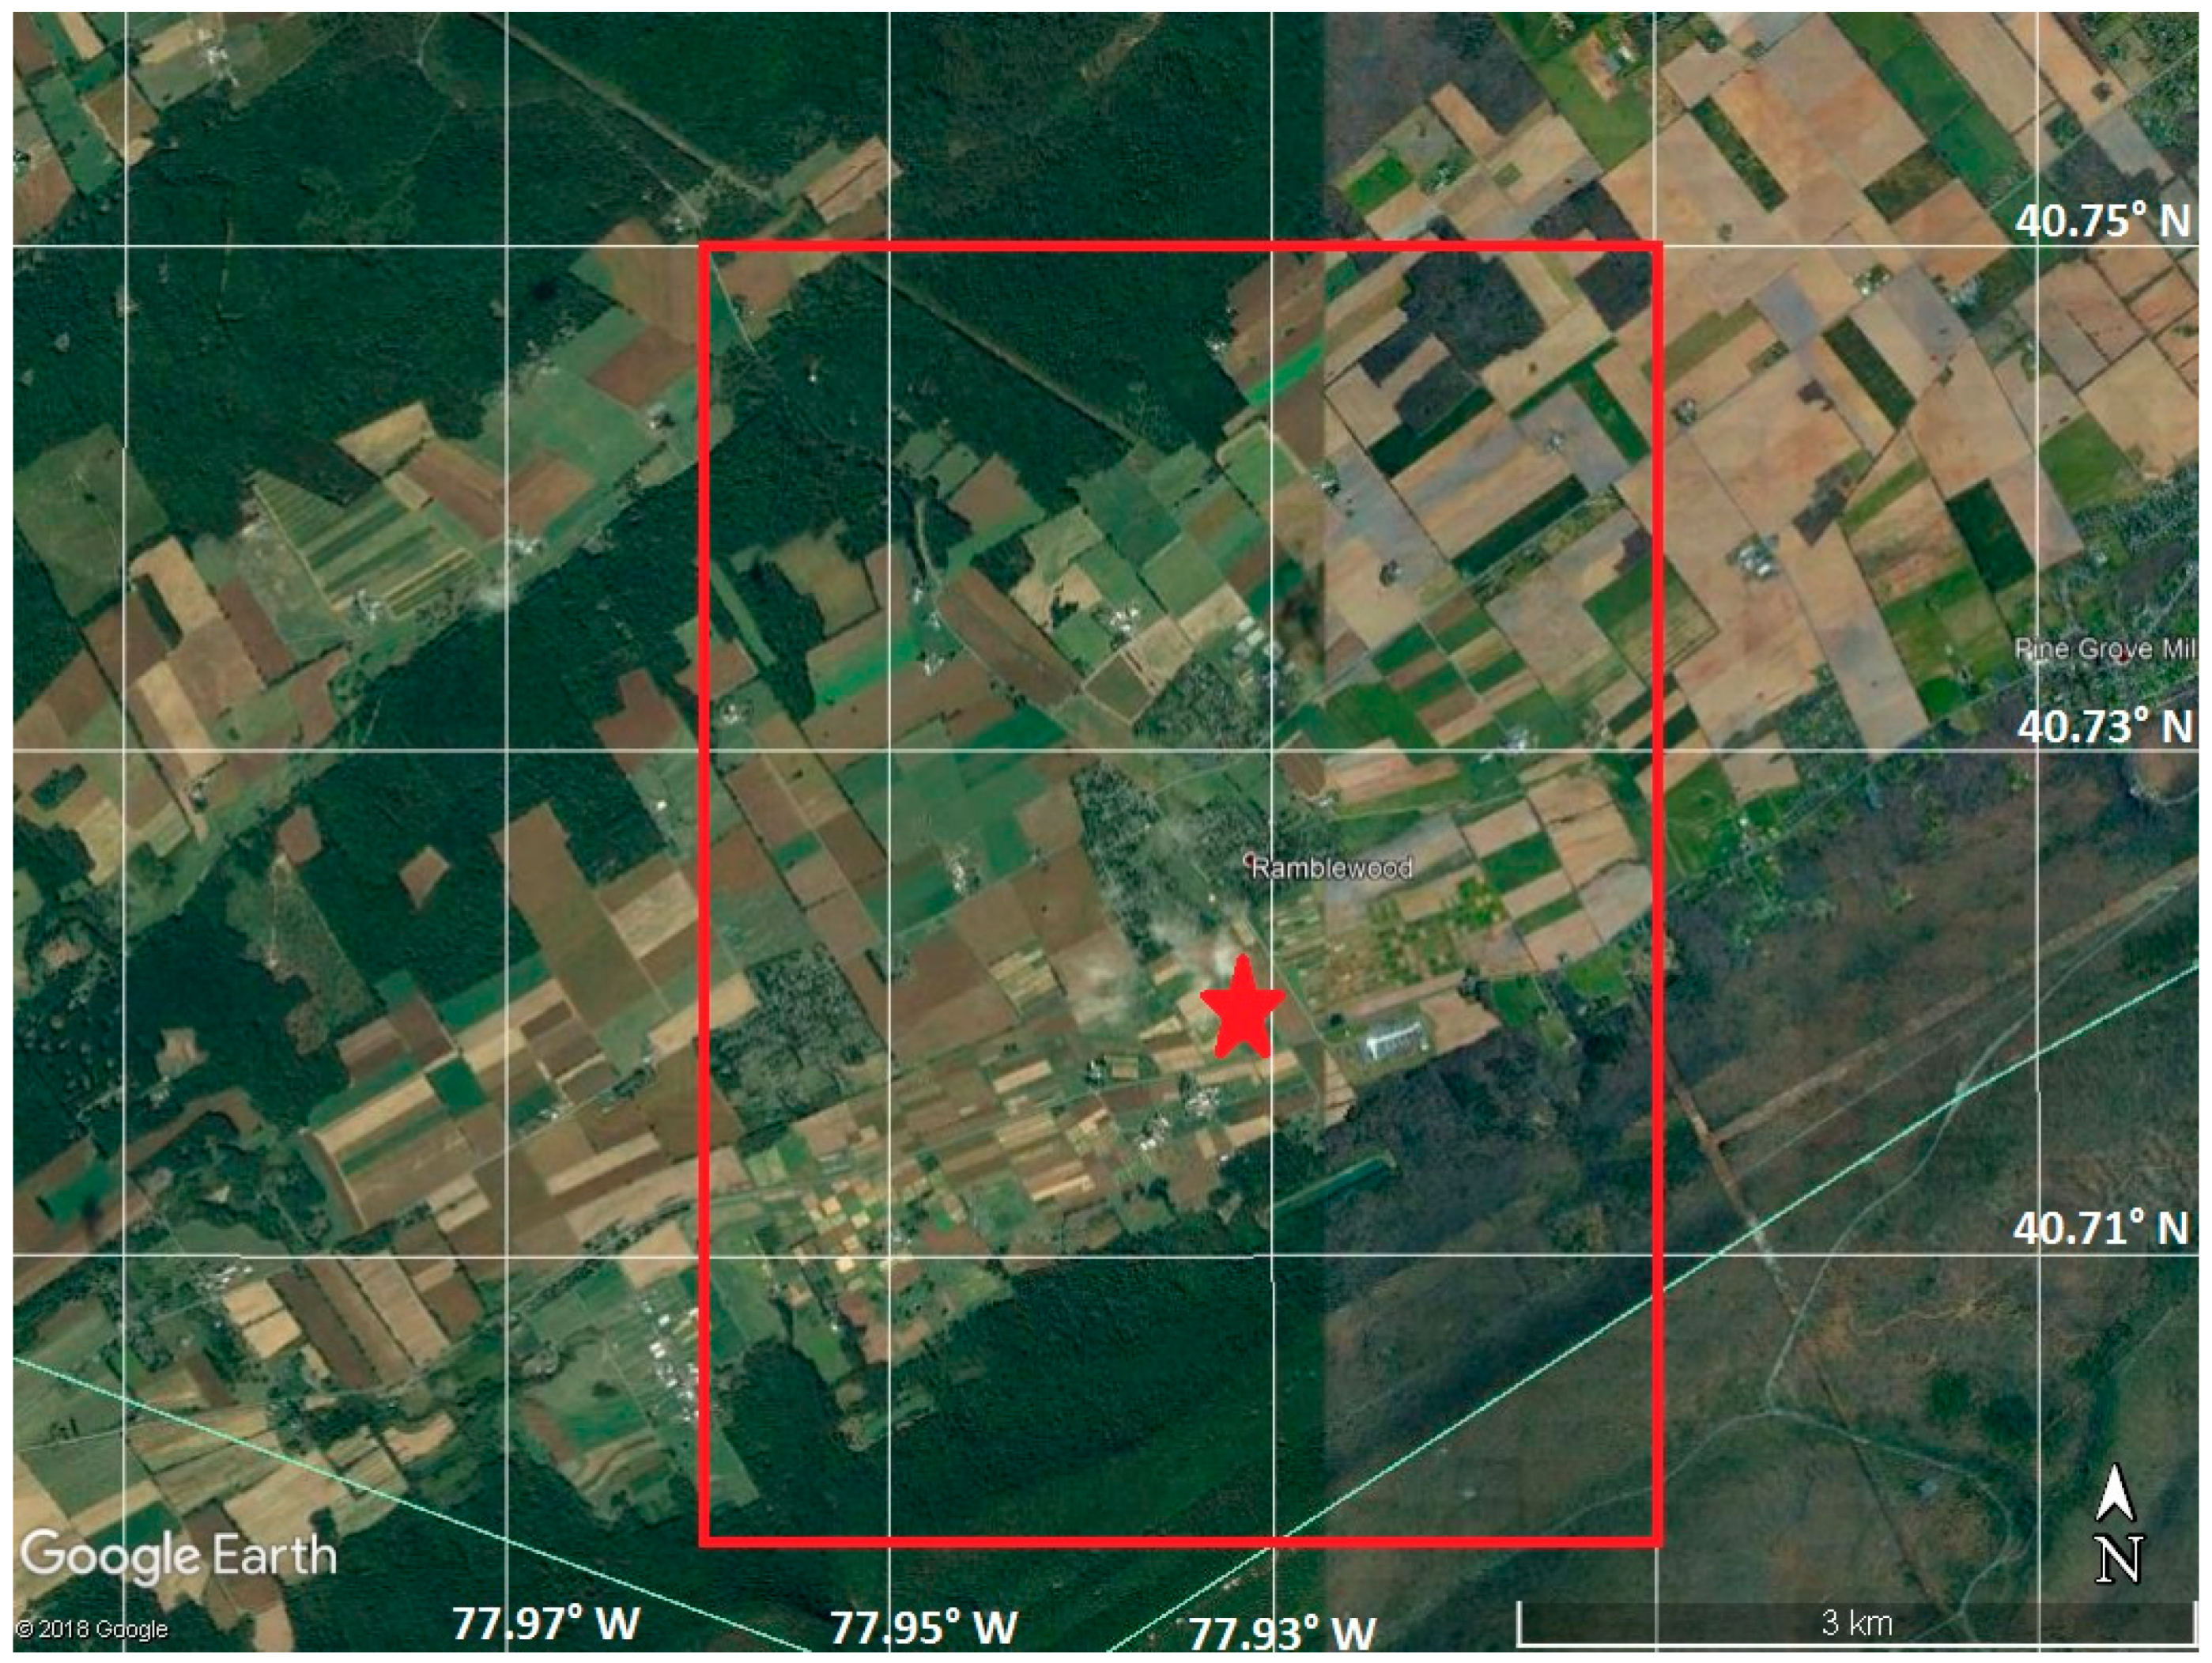
3.2.7. Stations with Mixed Land Cover: TBL, FPK, GCM, and PSU

The daytime accuracies at TBL station show a strong seasonal cycle (up to 8 K for AATSR LST–in situ LST in summer). The likely reason is an erroneous LCC, i.e., the mountain site is classified as “deciduous forest”, while photos clearly show grassland around the station. Thus, the assumed satellite emissivity and its seasonality might be incorrect. Night-time accuracies are considerably better and do not show a strong seasonal cycle. The STD is above 2 K for all validations during day at TBL station due to the heterogeneous land cover around it. This spatial mismatch is not covered in the satellite and in situ uncertainties.
Monthly median accuracies at FPK station are generally within the ±2.0 K range, with some larger negative outliers for the AATSR, MOGSV, and GOES data sets, which are thought to be caused by cloud contamination. The STD of the median accuracies is largest for AATSR, where it is up to 2.2 K, which is probably due to the heterogeneous land cover around the station.
The monthly median accuracies determined over GCM station are shown in Figure 15. The daytime accuracies do not display a strong seasonal cycle and are often within the ±2.0 K range. However, in contrast to the other stations, at GCM station the night-time differences between satellite and in situ LST are larger and more positive than the daytime accuracies. This may be explained by the fact that the wider area around GCM station, which is observed by the satellites, is mainly covered by forest, while the station is located on a patch of grass. During night, forests usually cool more slowly or stay warmer than grass, which, therefore, can explain the larger differences between the satellite and in situ LST values.
The time series of monthly median accuracies at PSU station display a strong seasonal cycle, with the largest positive differences in summer months. The STD during daytime is enhanced for all validated satellite data sets. This is thought to be linked to actual differences in the vegetation observed by satellite and in situ sensors, e.g., due to agricultural activities like tilling or harvesting on the fields surrounding the station. Therefore, the situation resembles that at BND station.

4. Discussion

Previous studies investigated the accuracies over several stations simultaneously, e.g., for the KIT sites this was done by [18], who validated 5 years of SEVIRI LST. They found a root-mean-square error of about 1.5 K excluding rainy seasons. In situ validations over several SURFRAD sites include the work by [23], who used two SURFRAD sites to validate VIIRS data, and report a median standard deviation of LST around 1.3 K. Ten years of MODIS LST data were validated over SURFRAD sites by [27], who found a mean difference of −0.93 K. Reference [28] validated GOES-R LST data for 2001 over six SURFRAD sites, reporting an average precision of 1.58 K over the investigated sites. Wang et al. [67] evaluated seven years of MODIS LST over six SURFRAD stations. They report an average difference between satellite and in situ LST of −0.2 °C at night. These results are in a similar range as the ones presented here, keeping in mind that these data sets are re-projected onto common grids, and therefore are not exactly equal to the source data, including different spatial resolutions. However, due to the large differences in land cover, homogeneity and orography around the individual stations, no overall median accuracies over all sites are presented in this work. Wang et al. [67] also report a considerable influence of heterogeneity around SURFRAD sites. Therefore they decided to use only night-time data, which was done in this work for SURFRAD stations BND and FPK.
The determined differences between satellite and in situ LST in this study vary considerably from station to station and between single satellite data sets. They can be attributed to different causes, which are uncertainty in satellite LST and in situ LST and upscaling issues. The influence of the temporal matching is negligible due to the high temporal resolution of the in situ data.
The differences between the satellite data sets themselves also vary between validations over different stations, which can be caused by different land cover classifications and emissivities or orography. The SEVIRI and KIT in situ data sets use the same emissivity as input, so this difference is ruled out for the SEVIRI validations over the KIT stations, where indeed SEVIRI LST have good accuracies. The emissivity of MODIS data sets MOGSV and MYGSV is based on the same data base as the emissivity used for obtaining SURFRAD in situ LST, but this is not reflected in better accuracies of MOGSV and MYGSV over these sites. Other differences between the satellite data sets appear to be more important at these sites.
The difference between satellite data sets is larger for daytime data than for night-time data, as expected. It is largest at station TBL, with accuracies ranging from −3 K (GOES_) to +2.5 K (AATSR). At this station, the land cover is highly heterogeneous and the station is located on top of a mountain surrounded by agricultural fields. The LEO sensors AATSR, MOGSV, and MYGSV were validated only over one pixel directly on the mountain to avoid mixing of these different landscapes, but this was impossible for the GEO satellites. This will affect the resulting satellite LST. Another cause for the observed differences at TBL station is an erroneous LCC that was used for retrieving AATSR LST over this site.
A tendency of the LEO data sets to overestimate in situ LST and of the GEO data sets to underestimate in situ LST was seen at most stations. This might be due to the differences in satellite LST retrieval algorithms or due to the different viewing geometries of the satellites. However, except GOES, all satellites use split-window algorithms, and therefore have similar approaches to atmospheric corrections.
Some monthly median satellite–in situ LST differences at several stations are strongly negative, i.e., satellite LST systematically underestimates in situ LST. These are thought to be caused by cloud contamination, when outliers are missed by the cloud clearing algorithm. This contamination occurs mostly around the edges of clouds, where pixel values are often close to threshold separating clear and cloudy scenes. Thus, improved cloud masking would help avoid these outliers. However, no matter how robust the cloud masking technique, it is hard to eliminate pixels near cloud edges, since these may underestimate “true” LST, but are still within the range of valid values. Furthermore, if the number of valid pixels is decreased due to clouds, the impact of a few undetected cloudy pixels increases and their too-low LST values can dominate the statistics.
The in situ data were obtained from two sets of stations that differ in their measurement techniques and the emissivity used to calculate LST. The SURFRAD stations are equipped with broadband-hemispherical sensors, which have a larger associated uncertainty than KIT’s narrow-band directional sensors.
An important reason for differences between satellite and in situ LST data is the upscaling of in situ data, because satellite measurements usually cover considerably larger areas than in situ point measurements, which may result in a lack of representativeness. This is very much dependent on the land cover and topography of each station, and therefore each station has to be examined individually. For example, at DRA station, the topography strongly affected satellite LST and reduced the station’s representativeness. Heterogeneous land cover affected the analysis negatively at several other stations (BND, PSU, and TBL). Therefore, the area used for validation at these stations was reduced for the LEO satellites to limit this effect. This approach makes LEO and GEO validation results less comparable to each other, but exploits the higher resolution of the LEO data sets. The strongest influence of LST anisotropy was found at KAL_R and EVO station, which are covered by bushes and trees. At EVO, an effect due to shadows was already found by [25] for daytime MODIS LST. The authors could reduce this effect drastically by accounting for geometrical differences. The use of a geometrical optical model over the same station by [26] resulted in a good agreement between SEVIRI LST, as well as MODIS LST, against modelled in situ LST.
Seasonal cycles were seen in most data sets. At two stations (BND, PSU) they were so strong that the daytime data were excluded from the analyses. Seasonal cycles affect LST in various ways, e.g., vegetation cycle can change land cover fractions and emissivity throughout the year. If this seasonal effect is not captured adequately in the emissivity of satellite or in situ data, it can cause additional LST differences between them. Also, the solar zenith angle varies with season and time of the day, changing the fractions of shadow and sunlit areas observed by satellites and in situ instruments. The importance of this influence depends on the land cover type and is least for flat and homogenous validation sites.
The entire individual uncertainties mentioned above are reflected in the STD of the averaged accuracies. If the STD is larger than the LST uncertainties, this indicates that some variables leading to differences in the LST values are not reflected in their uncertainties. The STD is higher than the single uncertainties for GOES and AATSR validation at FPK and PSU stations during night, and at DAH_T station during night for all satellites except for AATSR. During daytime, the STD is higher than the satellite and in situ uncertainties at DRA station for AATSR validation, and at PSU, TBL, DAH_T, and EVO stations for all satellite data sets. The reasons for these enhanced STD values differ between the individual stations. DAH_T station experiences strong seasonal cycles, including rainy seasons, which are usually accompanied by a strong increase in undetected clouds, and that is probably the cause to the enhanced STD. At DRA station, the enhancement is due to the orography, as the station is located in a valley. Heterogeneous land covers are causing larger STD values at stations TBL, PSU, and FPK, and the influence of shadowy and sunlit areas is dominant at EVO station.
One important aim of the work presented here was to investigate the usability of satellite LST data sets for scientific purposes. This was achieved by comparing several satellite data sets over validation sites with various land covers, and evaluating them on a common grid in the same harmonized data format. In order to make the different data sets consistent with each other, cloud-free LEO pixels were averaged to the same spatial grid as the GEO data sets. It was found that the data set quality depends very much on the chosen spatial region and investigated time period. Over surfaces with a heterogeneous land cover or with large topographic differences, satellite LST data are exposed to larger variations than over more homogeneous regions.

5. Conclusions

Results of a validation study of five satellite data sets against ten in situ stations covering up to ten years of data are presented. The satellite data include three data sets from Low Earth Orbit (LEO) satellites, namely AATSR, MOGSV, and MYGSV, and two data sets from Geostationary Earth Orbit (GEO) satellites, namely SEVIRI and GOES. All investigated satellite data sets were developed within ESA’s GlobTemperature (GT) project and are on the same spatial grid. In situ data from five stations in Africa and Europe operated by KIT and from six SURFRAD stations in the USA operated by NOAA were used for validation. The stations represent different land cover types, including agricultural regions, desert, semi-desert, forest, pasture, shrubland, and mixtures of several surface types. All data sets are available in the same GT harmonized format. Thus, all validations presented here could be carried out using the same approach, thereby making the results comparable to each other.
The results were analysed for each station individually, and median accuracies (satellite LST–in situ LST) for daytime and night-time are presented. Temporal averaging was performed for the years 2010–2012 for all, and for 2003–2012 for the SURFRAD stations only, due to their larger temporal availability.
Over the years 2010–2012, the presented median accuracies of the individual stations are often within ±2.0 K during the night, with larger differences for some stations during the day. Differences between GOES LST and in situ LST tend to be more negative, whereas SEVIRI LST is well within the ±2.0 K range over the KIT stations. The three LEO data sets tend to have more positive differences between satellite and in situ data. For high temperatures, this is most pronounced in the AATSR data set.
Monthly median accuracies were analysed for each investigated station, showing that the results vary from station to station, depending on land cover and orography around the station.
It was shown that night-time data generally agree better with in situ LST and have smaller standard deviations (STD) than daytime data. The night-time STD is often within 2.0 K from the median, and in all cases smaller than 3.0 K. Daytime accuracies exhibit larger daily and seasonal cycles, which were observed in most data sets. This results in larger variations, which is reflected in a larger STD.
Future validation studies would benefit from further high quality, globally distributed in situ sites in homogeneous regions. However, it is very challenging to find areas that are sufficiently homogeneous for meaningful match-ups between satellite and in situ LST. Further progress with respect to the LST validation work presented here could also stem from a more detailed investigation into the different causes for the variations between the single satellite LST data sets based on a comparison of the differences of the individual components included in each LST algorithms. Over some stations, improvements on the emissivity or orographic correction might decrease the difference between satellite and in situ LST, while at others an improved cloud clearing might be worthwhile. A full, quantitative study of all uncertainty components involved in the validation process could help to further explore reasons for differences between satellite and in situ LST data sets. Finally, a larger data base of satellite LST products for comparisons could also help to elaborate the outcomes of the study further.

Author Contributions

M.A.M. derived the in situ LST, matched them to the satellite LST, and analysed the data. She wrote the original draft of the manuscript and is responsible for the description of the procedures used to obtain the in situ LST. D.G. provided the LEO satellite LST data sets and wrote the sections about their description. A.C.P. provided the GEO satellite LST data sets and wrote the sections about their description. F.-M.G. is in charge of the KIT stations, performed in situ measurements there, and contributed to the sections describing the stations. J.C. provided advice on result interpretation and visualization, and contributed to manuscript editing. J.J.R. provided strategic direction from a Glob Temperature perspective, advice on interpretation of satellite data sets, review and consolidation of the statistical analysis and conclusions, and scientific manuscript editing.

Funding

This study has been funded by the European Space Agency (ESA) Data User Element (DUE) GlobTemperature project (http://data.globtemperature.info).

Acknowledgments

This work is funded by the European Space Agency within the framework of the GlobTemperature project under the Data User Element of ESA’s Fourth Earth Observation Envelope Programme (2013–2017). This article has been funded through the Open Access Publishing Fund of Karlsruhe Institute of Technology.

Conflicts of Interest

The authors declare no conflict of interest. The funders had no role in the design of the study; in the collection, analyses, or interpretation of data; in the writing of the manuscript, or in the decision to publish the results.

References

  1. Dash, P.; Goettsche, F.M.; Olesen, F.S.; Fischer, H. Land surface temperature and emissivity estimation from passive sensor data: Theory and practice-current trends. Int. J. Remote Sens. 2002, 23, 2563–2594. [Google Scholar] [CrossRef]
  2. Mallick, J.; Singh, C.K.; Shashtri, S.; Rahman, A.; Mukherjee, S. Land surface emissivity retrieval based on moisture index from LANDSAT TM satellite data over heterogeneous surfaces of Delhi city. Int. J. Appl. Earth Obs. 2012, 19, 348–358. [Google Scholar] [CrossRef]
  3. Rhee, J.; Im, J.; Carbone, G.J. Monitoring agricultural drought for arid and humid regions using multi-sensor remote sensing data. Remote Sens. Environ. 2010, 114, 2875–2887. [Google Scholar] [CrossRef]
  4. Mildrexler, D.J.; Zhao, M.; Running, S.W. A global comparison between station air temperatures and MODIS land surface temperatures reveals the cooling role of forests. J. Geophys. Res. 2011, 116. [Google Scholar] [CrossRef] [Green Version]
  5. Dousset, B.; Gourmelon, F.; Laaidi, K.; Zeghnoun, A.; Giraudet, E.; Bretin, P.; Mauri, E.; Vandentorren, S. Satellite monitoring of summer heat waves in the Paris metropolitan area. Int. J. Climatol. 2011, 31, 313–323. [Google Scholar] [CrossRef]
  6. Li, Z.; Jia, L.; Lu, J. On Uncertainties of the Priestley-Taylor/LST-Fc Feature Space Method to Estimate Evapotranspiration: Case Study in an Arid/Semiarid Region in Northwest China. Remote Sens. 2015, 7, 447–466. [Google Scholar] [CrossRef]
  7. Weng, Q. Thermal infrared remote sensing for urban climate and environmental studies: Methods and applications and trends. ISPRS J. Photogramm. Remote Sens. 2009, 64, 335–344. [Google Scholar] [CrossRef]
  8. Liu, L.; Zhang, Y. Urban Heat Island Analysis Using the Landsat TM Data and ASTER Data: A Case Study in Hong Kong. Remote Sens. 2011, 3, 1535–1552. [Google Scholar] [CrossRef] [Green Version]
  9. Lai, J.; Zhan, W.; Huang, F.; Voogt, J.; Bechtel, B.; Allen, M.; Peng, S.; Hong, F.; Liu, Y.; Du, P. Identification of typical diurnal patterns for clear-sky climatology of surface urban heat islands. Remote Sens. Environ. 2018, 217, 203–220. [Google Scholar] [CrossRef]
  10. Nichol, J.E. Remote sensing of urban heat islands by day and night. Photogramm. Eng. Remote Sens. 2005, 71, 613–621. [Google Scholar] [CrossRef]
  11. Mallick, J.; Rahman, A.; Singh, C.K. Modeling urban heat islands in heterogeneous land surface and its correlation with impervious surface area by using night-time ASTER satellite data in highly urbanizing city, Delhi-India. Adv. Space Res. 2013, 52, 639–655. [Google Scholar] [CrossRef]
  12. Reichle, R.H.; Kumar, S.V.; Mahanama, S.P.P.; Koster, R.D.; Liu, Q. Assimilation of Satellite-Derived Skin Temperature Observations into Land Surface Models. J. Hydrometeorol. 2010, 11, 1103–1122. [Google Scholar] [CrossRef] [Green Version]
  13. GCOS. The Global Observing System for Climate: Implementation Needs, GCOS-200/GOOS-214. Implementation Plan. 2016. Available online: https://library.wmo.int/doc_num.php?explnum_id=3417 (accessed on 22 February 2019).
  14. Schneider, P.; Ghent, D.; Corlett, G.; Prata, F.; Remedios, J. AATSR Validation: LST Validation Protocol. ESA Report, Contract No.: 9054/05/NL/FF, European Space Agency (ESA). 2012. UL-NILU-ESA-LST-LVP Issue 1 Revision 0. Available online: http://lst.nilu.no/Portals/73/Docs/Reports/UL-NILU-ESA-LST-LVP-Issue1-Rev0-1604212.pdf (accessed on 2 February 2019).
  15. Guillevic, P.; Göttsche, F.; Nickeson, J.; Hulley, G.; Ghent, D.; Yu, Y.; Trigo, I.; Hook, S.; Sobrino, J.; Remedios, J.; et al. Land Surface Temperature Product Validation Best Practice Protocol, Version 1.0. 2017. Available online: http://ceos.org/document_management/Working_Groups/WGCV/CEOS_LST_PROTOCOL_Oct2017_v1.0.0.pdf (accessed on 22 February 2019).
  16. Martin, M.; Göttsche, F.M.; Ghent, D.; Trent, T.; Dodd, E.; Pires, A.; Trigo, I.; Prigent, C.; Jimenez, C. ESA DUE GlobTemperature Project: Satellite LST Intercomparison Report. Technical Report. ESA, 2016. Available online: http://www.globtemperature.info/index.php/public-documentation/deliverables-1/121-intercomparison-report-del-13/file (accessed on 22 February 2019).
  17. Martin, M.; Göttsche, F.M. ESA DUE GlobTemperature Project: Satellite LST Validation Report. Technical Report. ESA, 2016. Available online: http://www.globtemperature.info/index.php/public-documentation/deliverables-1/117-validation-report-del12/file (accessed on 22 February 2019).
  18. Göttsche, F.M.; Olesen, F.S.; Trigo, I.; Bork-Unkelbach, A.; Martin, M. Long Term Validation of Land Surface Temperature Retrieved from MSG/SEVIRI with Continuous in-Situ Measurements in Africa. Remote Sens. 2016, 8, 410. [Google Scholar] [CrossRef]
  19. Wang, K.; Liang, S. Evaluation of ASTER and MODIS land surface temperature and emissivity products using long-term surface longwave radiation observations at SURFRAD sites. Remote Sens. Environ. 2009, 113, 1556–1565. [Google Scholar] [CrossRef]
  20. Pinker, R.T.; Sun, D.; Hung, M.P.; Li, C.; Basara, J.B. Evaluation of Satellite Estimates of Land Surface Temperature from GOES over the United States. J. Appl. Meteorol. Climatol. 2009, 48, 167–180. [Google Scholar] [CrossRef]
  21. Guillevic, P.C.; Privette, J.L.; Coudert, B.; Palecki, M.A.; Demarty, J.; Ottlé, C.; Augustine, J.A. Land Surface Temperature product validation using NOAA’s surface climate observation networks—Scaling methodology for the Visible Infrared Imager Radiometer Suite (VIIRS). Remote Sens. Environ. 2012, 124, 282–298. [Google Scholar] [CrossRef]
  22. Göttsche, F.M.; Olesen, F.S.; Bork-Unkelbach, A. Validation of land surface temperature derived from MSG/SEVIRI with in situ measurements at Gobabeb, Namibia. Int. J. Remote Sens. 2013, 34, 3069–3083. [Google Scholar] [CrossRef]
  23. Guillevic, P.C.; Biard, J.C.; Hulley, G.C.; Privette, J.L.; Hook, S.J.; Olioso, A.; Göttsche, F.M.; Radocinski, R.; Román, M.O.; Yu, Y.; et al. Validation of Land Surface Temperature products derived from the Visible Infrared Imaging Radiometer Suite (VIIRS) using ground-based and heritage satellite measurements. Remote Sens. Environ. 2014, 154, 19–37. [Google Scholar] [CrossRef]
  24. Zhou, J.; Zhang, X.; Zhan, W.; Gottsche, F.M.; Liu, S.; Olesen, F.S.; Hu, W.; Dai, F. A Thermal Sampling Depth Correction Method for Land Surface Temperature Estimation from Satellite Passive Microwave Observation over Barren Land. IEEE Trans. Geosci. Remote Sens. 2017, 55, 4743–4756. [Google Scholar] [CrossRef]
  25. Guillevic, P.C.; Bork-Unkelbach, A.; Gottsche, F.M.; Hulley, G.; Gastellu-Etchegorry, J.P.; Olesen, F.S.; Privette, J.L. Directional Viewing Effects on Satellite Land Surface Temperature Products over Sparse Vegetation Canopies—A Multisensor Analysis. IEEE Geosci. Remote Sens. Lett. 2013, 10, 1464–1468. [Google Scholar] [CrossRef]
  26. Ermida, S.L.; Trigo, I.F.; DaCamara, C.C.; Göttsche, F.M.; Olesen, F.S.; Hulley, G. Validation of remotely sensed surface temperature over an oak woodland landscape—The problem of viewing and illumination geometries. Remote Sens. Environ. 2014, 148, 16–27. [Google Scholar] [CrossRef]
  27. Li, S.; Yu, Y.; Sun, D.; Tarpley, D.; Zhan, X.; Chiu, L. Evaluation of 10 year AQUA/MODIS land surface temperature with SURFRAD observations. Int. J. Remote Sens. 2014, 35, 830–856. [Google Scholar] [CrossRef]
  28. Yu, Y.; Tarpley, D.; Privette, J.L.; Flynn, L.E.; Xu, H.; Chen, M.; Vinnikov, K.Y.; Sun, D.; Tian, Y. Validation of GOES-R Satellite Land Surface Temperature Algorithm Using SURFRAD Ground Measurements and Statistical Estimates of Error Properties. IEEE Trans. Geosci. Remote Sens. 2012, 50, 704–713. [Google Scholar] [CrossRef]
  29. Coll, C.; Caselles, V.; Valor, E.; Niclòs, R.; Sánchez, J.M.; Galve, J.M. Validation of Land Surface Temperatures Derived from Aatsr Data at the Valencia Test Site. In Proceedings of the MERIS (A)ATSR Workshop, Frascati, Italy, 26–30 September 2005. ESA SP-597. [Google Scholar]
  30. Coll, C.; Hook, S.; Galve, J. Land Surface Temperature from the Advanced along-Track Scanning Radiometer: Validation over Inland Waters and Vegetated Surfaces. IEEE Trans. Geosci. Remote Sens. 2009, 47, 350–360. [Google Scholar] [CrossRef]
  31. Sobrino, J.; Jimenez-Munoz, J.; Balick, L.; Gillespie, A.; Sabol, D.; Gustafson, W. Accuracy of ASTER Level-2 Thermal-Infrared Standard Products of an Agricultural Area in Spain. Remote Sens. Environ. 2007, 106, 146–153. [Google Scholar] [CrossRef]
  32. Yu, W.; Ma, M. Scale Mismatch between In Situ and Remote Sensing Observations of Land Surface Temperature: Implications for the Validation of Remote Sensing LST Products. IEEE Geosci. Remote Sens. Lett. 2015, 12, 497–501. [Google Scholar] [CrossRef]
  33. Ouyang, X.; Chen, D.; Duan, S.B.; Lei, Y.; Dou, Y.; Hu, G. Validation and Analysis of Long-Term AATSR Land Surface Temperature Product in the Heihe River Basin, China. Remote Sens. 2017, 9, 152. [Google Scholar] [CrossRef]
  34. Ouyang, X.; Chen, D.; Lei, Y. A Generalized Evaluation Scheme for Comparing Temperature Products from Satellite Observations, Numerical Weather Model, and Ground Measurements over the Tibetan Plateau. IEEE Trans. Geosci. Remote Sens. 2018, 56, 3876–3894. [Google Scholar] [CrossRef]
  35. Wan, Z. New refinements and validation of the MODIS Land-Surface Temperature/Emissivity products. Remote Sens. Environ. 2008, 112, 59–74. [Google Scholar] [CrossRef]
  36. Li, Z.L.; Tang, B.H.; Wu, H.; Ren, H.; Yan, G.; Wan, Z.; Trigo, I.F.; Sobrino, J.A. Satellite-derived land surface temperature: Current status and perspectives. Remote Sens. Environ. 2013, 131, 14–37. [Google Scholar] [CrossRef] [Green Version]
  37. Freitas, S.; Trigo, I.; Bioucas-Dias, J.; Gottsche, F.M. Quantifying the Uncertainty of Land Surface Temperature Retrievals From SEVIRI/Meteosat. IEEE Trans. Geosci. Remote Sens. 2010, 48, 523–534. [Google Scholar] [CrossRef] [Green Version]
  38. Ermida, S.L.; Jiménez, C.; Prigent, C.; Trigo, I.F.; DaCamara, C.C. Inversion of AMSR-E observations for land surface temperature estimation: 2. Global comparison with infrared satellite temperature. J. Geophys. Res. Atmos. 2017. [Google Scholar] [CrossRef]
  39. Candy, B.; Saunders, R.W.; Ghent, D.; Bulgin, C.E. The Impact of Satellite-Derived Land Surface Temperatures on Numerical Weather Prediction Analyses and Forecasts. J. Geophys. Res. Atmos. 2017, 122, 9783–9802. [Google Scholar] [CrossRef]
  40. Jiménez, C.; Michel, D.; Hirschi, M.; Ermida, S.; Prigent, C. Applying multiple land surface temperature products to derive heat fluxes over a grassland site. Remote Sens. Appl. Soc. Environ. 2017, 6, 15–24. [Google Scholar] [CrossRef]
  41. Rasmussen, T.A.S.; Høyer, J.L.; Ghent, D.; Bulgin, C.E.; Dybkjær, G.; Ribergaard, M.H.; Nielsen-Englyst, P.; Madsen, K.S. Impact of Assimilation of Sea-Ice Surface Temperatures on a Coupled Ocean and Sea-Ice Model. J. Geophys. Res. Ocean. 2018, 123, 2440–2460. [Google Scholar] [CrossRef] [Green Version]
  42. Ghent, D.J.; Corlett, G.K.; Göttsche, F.M.; Remedios, J.J. Global Land Surface Temperature from the Along-Track Scanning Radiometers. J. Geophys. Res. Atmos. 2017, 122, 12,167–12,193. [Google Scholar] [CrossRef]
  43. Prata, F. Land Surface Temperature Measurement from Space: AATSR Algorithm Theoretical Basis Document; Technical Report; CSIRO Atmospheric Research: Aspendale, Australia, 2002; Available online: http://citeseerx.ist.psu.edu/viewdoc/download?doi=10.1.1.142.3562&rep=rep1&type=pdf (accessed on 22 February 2019).
  44. Wan, Z.; Dozier, J. A Generalized Split-Window Algorithm for Retrieving Land-Surface Temperature from Space. IEEE Trans. Geosci. Remote Sens. 1996, 34, 892–905. [Google Scholar] [CrossRef]
  45. Trigo, I.F.; Monteiro, I.T.; Olesen, F.; Kabsch, E. An assessment of remotely sensed land surface temperature. J. Geophys. Res. 2008, 113, 1–12. [Google Scholar] [CrossRef]
  46. Trigo, I.F.; Dacamara, C.C.; Viterbo, P.; Roujean, J.L.; Olesen, F.; Barroso, C.; Camacho-de Coca, F.; Carrer, D.; Freitas, S.C.; Garcia-Haro, J.; et al. The Satellite Application Facility for Land Surface Analysis. Int. J. Remote Sens. 2011, 32, 2725–2744. [Google Scholar] [CrossRef]
  47. Sun, D.; Pinker, R.T. Estimation of land surface temperature from a Geostationary Operational Environmental Satellite (GOES-8). J. Geophys. Res. 2003, 108. [Google Scholar] [CrossRef] [Green Version]
  48. Freitas, S.C.; Trigo, I.F.; Macedo, J.; Barroso, C.; Silva, R.; Perdigão, R. Land surface temperature from multiple geostationary satellites. Int. J. Remote Sens. 2013, 34, 3051–3068. [Google Scholar] [CrossRef]
  49. Bork-Unkelbach, A. Extrapolation von in-situ Landoberflächentemperaturen auf Satellitenpixel. Ph.D. Thesis, Karlsruher Institut für Technologie, Karlsruhe, Germany, 2012. [Google Scholar]
  50. Guillevic, P.; Göttsche, F.; Nickeson, J.; Hulley, G.; Ghent, D.; Yu, Y.; Trigo, I.; Hook, S.; Sobrino, J.; Remedios, J.; et al. Land Surface Temperature Product Validation Best Practice Protocol, Version 1.1. 2018. Available online: https://lpvs.gsfc.nasa.gov/PDF/CEOS_LST_PROTOCOL_Feb2018_v1.1.0_light.pdf (accessed on 22 February 2019).
  51. Theocharous, E.; Fox, N.; Göttsche, F.; Høyer, J.L.; Wimmer, W.; Nightingale, T. Fiducial Reference Measurements for Validation of Surface Temperature from Satellites (FRM4STS). Technical Report 1—Procedures and Protocols for the Verification of TIR FRM Field Radiometers and Reference Blackbody Calibrators. Reference: OFE- D80-V1-Iss-2-Ver-1-FINAL DRAFT, ESA Contract No. 4000113848 15I-LG. Technical Report. ESA, 2016. Available online: http://www.frm4sts.org/wp-content/uploads/sites/3/2017/12/FRM4STS_D80-TR1_Final-Draft-2-0_28Jun16_v1-signed.pdf (accessed on 22 February 2019).
  52. Theocharous, E.; Barker Snook, I.; Fox, N.P. 2016 Comparison of IR Brightness Temperature Measurements in Support of Satellite Validation. Part 4: Land Surface Temperature Comparison of Radiation Thermometers. Technical Report. ESA, 2017. Available online: http://www.frm4sts.org/wp-content/uploads/sites/3/2017/12/FRM4STS_D100_TR-2_Part4_LST_22Sep17-signed.pdf (accessed on 22 February 2019).
  53. Göttsche, F.M.; Hulley, G.C. Validation of six satellite-retrieved land surface emissivity products over two land cover types in a hyper-arid region. Remote Sens. Environ. 2012, 124, 149–158. [Google Scholar] [CrossRef]
  54. Masiello, G.; Serio, C.; Venafra, S.; Liuzzi, G.; Poutier, L.; Göttsche, F.M. Physical Retrieval of Land Surface Emissivity Spectra from Hyper-Spectral Infrared Observations and Validation with In Situ Measurements. Remote Sens. 2018, 10, 976. [Google Scholar] [CrossRef]
  55. Augustine, J.A.; DeLuisi, J.J.; Long, C.N. SURFRAD—A National Surface Radiation Budget Network for Atmospheric Research. Bull. Am. Meteorol. Soc. 2000, 81, 2341–2357. [Google Scholar] [CrossRef] [Green Version]
  56. Seemann, S.W.; Borbas, E.E.; Knuteson, R.O.; Stephenson, G.R.; Huang, H.L. Development of a Global Infrared Land Surface Emissivity Database for Application to Clear Sky Sounding Retrievals from Multispectral Satellite Radiance Measurements. J. Appl. Meteorol. Climatol. 2008, 47, 108–123. [Google Scholar] [CrossRef]
  57. Cheng, J.; Liang, S.; Yao, Y.; Zhang, X. Estimating the Optimal Broadband Emissivity Spectral Range for Calculating Surface Longwave Net Radiation. IEEE Geosci. Remote Sens. Lett. 2013, 10, 401–405. [Google Scholar] [CrossRef]
  58. Augustine, J.A.; Dutton, E.G. Variability of the surface radiation budget over the United States from 1996 through 2011 from high-quality measurements. J. Geophys. Res. Atmos. 2013, 118, 43–53. [Google Scholar] [CrossRef] [Green Version]
  59. Borbas, E.E.; Ruston, B.C. The RTTOV UWiremis IR Land Surface Emissivity Module, Associate Scientist Mission Report; Mission no. AS09-04, Document NWPSAF-MO-VS-042, Version 1.0; Technical report, EUMETSAT Numerical Weather Prediction Satellite Applications Facility; Met Office: Exeter, UK, 2010.
  60. Ghent, D. Definition of a Common Nomenclature for LST (Technical Note). Technical Report. 2014. Available online: https://nwpsaf.eu/vs_reports/nwpsaf-mo-vs-042.pdf (accessed on 22 February 2019).
  61. JCGM. Evaluation of Measurement Data—Guide to the Expression of Uncertainty in Measurement. Technical Report JCGM 100, IEC BIPM, ILAC IFCC, and IUPAC ISO, Joint Committee for Guides in Metrology; 2008; GUM 1995 with Minor Corrections. Available online: https://ncc.nesdis.noaa.gov/documents/documentation/JCGM_100_2008_E.pdf (accessed on 22 February 2019).
  62. Pearson, R.K. Outliers in Process Modeling and Identification. IEEE Trans. Control Syst. Technol. 2002, 10, 55–63. [Google Scholar] [CrossRef]
  63. Göttsche, F.; Olesen, F.; Trigo, I.; Bork-Unkelbach, A. Validation of Land Surface Temperature Products with 5 Years of Permanent In-Situ Measurements in Different Climate Regions. EUMETSAT Meteorological Satellite Data Users’ Conference. 2013. Available online: https://www.researchgate.net/publication/261675804_VALIDATION_OF_LAND_SURFACE_TEMPERATURE_PRODUCTS_WITH_5_YEARS_OF_PERMANENT_IN-SITU_MEASUREMENTS_IN_4_DIFFERENT_CLIMATE_REGIONS (accessed on 22 February 2019).
  64. Göttsche, F.M.; Olesen, F.; Poutier, L.; Langlois, S.; Wimmer, W.; Garcia Santos, V.; Coll, C.; Niclos, R.; Arbelo, M.; Monchau, J.P. Report from the Field Inter-Comparison Experiment (FICE) for Land Surface Temperature. Technical Report. ESA, 2017. Available online: http://www.frm4sts.org/wp-content/uploads/sites/3/2018/10/FRM4STS_LST-FICE_report_v2017-11-20_signed.pdf (accessed on 22 February 2019).
  65. Ghent, D. GlobTemperature Project Technical Specification Document. Technical Report. ESA, 2016. Available online: http://www.globtemperature.info/index.php/public-documentation/deliverables-1/88-technical-specification-document-del-06/file (accessed on 22 February 2019).
  66. Caselles, E.; Valora, E.; Abadb, F.; Caselles, V. Automatic classification-based generation of thermal infrared land surface emissivity maps using AATSR data over Europe. Remote Sens. Environ. 2012, 124, 321–333. [Google Scholar] [CrossRef] [Green Version]
  67. Wang, K.; Liang, S. Global atmospheric downward longwave radiation over land surface under all-sky conditions from 1973 to 2008. J. Geophys. Res. 2009, 114, 1–12. [Google Scholar] [CrossRef]
Figure 1. Locations of the in situ stations used for LST validation. The white stars indicate Surface Radiation Budget Network (SURFRAD) stations, the yellow stars Karlsruhe Institute of Technology (KIT) stations.
Remotesensing 11 00479 g001
Figure 2. Monthly median accuracies (Advanced along Track Scanning Radiometer (AATSR) Land Surface Temperature (LST)–Station LST) over Bondville (BND) station for 2003–2012. The ranges shaded in red indicate the accuracy range of ±2.0 K, the symbols are the medians, and the error bars are the robust standard deviations (STDs).
Remotesensing 11 00479 g002
Figure 3. Median accuracies (Advanced Along Track Scanning Radiometer (AATSR) Land Surface Temperature (LST)–in situ LST) during daytime for June 2010 for the individual pixels in a 5 × 5 pixel area around DRA station, which is located on the pixel in the centre. Each pixel covers an area of 0.01° × 0.01°.
Remotesensing 11 00479 g003
Figure 4. Google Earth true-colour satellite image of Table Mountain. The inserted red star indicates the location of Table Mountain (TBL) station and the red rectangle gives the nominal position of the pixel used for validation. The white lines are lines of constant latitude or longitude.
Remotesensing 11 00479 g004
Figure 5. Monthly median accuracies (AATSR LST–Station LST) over FPK station for years 2003–2012. The ranges shaded in red indicate the accuracy range of ±2.0 K, the symbols are the medians, and the error bars are the robust STDs.
Remotesensing 11 00479 g005
Figure 6. Google Earth true-colour satellite image of the area around Pennsylvania State University (PSU) station. The inserted red star indicates the location of PSU station and the red rectangle gives the nominal position of the pixel used for validation. The white lines are lines of constant latitude or longitude.
Remotesensing 11 00479 g006
Figure 7. The matching process between satellite and in situ data.
Remotesensing 11 00479 g007
Figure 8. Validation results for the years 2010–2012. The upper plot shows the daytime accuracies, the lower one the night-time accuracies. The ranges shaded in red indicate the accuracy range of ±2.0 K and the error bars are the robust STDs. Bondville (BND) and Fort Peck (FPK) daytime data were excluded from the validation due to very strong seasonal cycles.
Remotesensing 11 00479 g008
Figure 9. Number of averaged data points used for the validation for years 2010–2012. The upper plot displays the daytime and the lower plot the night-time data. BND and FPK daytime data were excluded from the validations due to a very strong seasonal cycle.
Remotesensing 11 00479 g009
Figure 10. Monthly median accuracies (satellite LST–station LST) over GBB_W station for the years 2010–2012. The upper plot shows daytime and the lower night-time data. The ranges shaded in red indicate the ±2.0 K accuracy range.
Remotesensing 11 00479 g010
Figure 11. Monthly median accuracies (satellite LST–station LST) over KAL_R and KAL_H stations for the years 2010–2012. The upper plot shows daytime and the lower night-time data. The ranges shaded in red indicate the ±2.0 K accuracy range and the vertical red bar the time, when KAL_R was replaced by KAL_H in February 2011.
Remotesensing 11 00479 g011
Figure 12. Monthly median accuracies (satellite LST–station LST) over DAH_T station for the years 2010–2011. The upper plot shows daytime and the lower night-time data. The ranges shaded in red indicate the ±2.0 K accuracy range.
Remotesensing 11 00479 g012
Figure 13. Monthly median accuracies (satellite LST–station LST) over EVO station for the years 2010–2012. The upper plot shows daytime and the lower night-time data. The ranges shaded in red indicate the ±2.0 K accuracy range.
Remotesensing 11 00479 g013
Figure 14. Monthly median accuracies (satellite LST–station LST) over DRA station for the years 2003–2012. The upper plot shows daytime and the lower night-time data. The ranges shaded in red indicate the ±2.0 K accuracy range.
Remotesensing 11 00479 g014
Figure 15. Monthly median accuracies (satellite LST–station LST) over GCM station for the years 2003–2012. The upper plot shows daytime and the lower night-time data. The ranges shaded in red indicate the ±2.0 K accuracy range.
Remotesensing 11 00479 g015
Table 1. Investigated GlobTemperature satellite Land Surface Temperature (LST) products and corresponding validations.
Product IDSensorLatest VersionDataset CoverageSpatial ResolutionValidated over Stations from NetworkValidated YearsMatchup Spatial DimensionsMatchup Temporal Dimensions
AATSR_LST_2AATSR2.120/05/2002–08/04/20121 km at nadirKIT2010–20125 × 5;
0.01° cells
≤0.5 min
SURFRAD2003–20125 × 5/3 × 3/
1 × 1;
0.01° cells depending on station
≤1.5 min before 2009; ≤0.5 min since 2009
GOES__LST_2GOES-EAST1.001/01/2010–31/12/20140.05° × 0.05° equal angle latitude—longitude gridSURFRAD2010–20121 × 1;
0.05° cell
≤1.5 min before 2009; ≤0.5 min since 2009
MOGSV_LST_2; MYGSV_LST_2MODIS-Terra;
MODIS-Aqua
2.005/03/2000–31/12/2014 (Terra); 05/03/2000–04/07/2014 (Aqua)1 km at nadirKIT2010–20125 × 5;
0.01° cells
≤0.5 min
SURFRAD2003–20125 × 5/3 × 3/
1 × 1;
0.01° cells depending on station
≤1.5 min before 2009; ≤0.5 min since 2009
SEVIR_LST_2SEVIRI1.001/01/2007–31/12/20150.05° × 0.05° equal angle latitude—longitude gridKIT2010–20121 × 1;
0.05° cell
≤0.5 min
Table 2. Details on the in situ stations used for LST validation.
CodeNameNetworkGeographic Coordinates (Decimal Degrees, WGS 84)Elevation (m)Surface type (Fractional Coverage of End-Members for KIT Stations from [49])Validation Time Period
EVOEvora, PortugalKIT38.540244,
−8.003368
230Savannas, woody savanna;
32% tree, 68% grass
2010–2012
DAH_TDahra tree mast, SenegalKIT15.402336, −15.43274490Grassland;
96% grass, 4% tree
2010–2011
GBB_WGobabeb wind tower, NamibiaKIT−23.550956,
15.05138
406Bare ground;
75% gravel, 25% dry grass
2010–2012
KAL_RRust mijn Ziel (RMZ) Farm, Kalahari, NamibiaKIT−23.010532,
18.352897
1450Shrub land;
85% grass/soil, 15% tree
2010–2011
KAL_HFarm Heimat, Kalahari, NamibiaKIT−22.932827,
17.992137
1380Shrub land;
37% tree/bush, 63% grass
2011–2012
BNDBondville, Illinois, USASURF-RAD40.05155,
−88.37325
230Grassland2003–2012
TBLTable Mountain, Boulder, Colorado, USASURF-RAD40.12557,
−105.23775
1689Sparse grassland2003–2012
DRADesert Rock, Nevada, USASURF-RAD36.62320,
−116.01962
1007Arid shrub land2003–2012
FPKFort Peck, Montana, USASURF-RAD48.30798,
−105.10177
634Grassland2003–2012
GCMGoodwin Creek, Mississippi, USASURF-RAD34.2547,
−89.8729
98Grassland2003–2012
PSUPennsylvania State University, Pennsylvania, USASURF-RAD40.72033,
−77.93100
376Cropland2003–2012
Table 3. Median validation accuracy, STD, and number of data points (#) over the SURFRAD stations for all satellites, for the years 2010–2012.
SatellitesAATSRMOGSVMYGSVGOES_
Stations Median [K]STD [K]#Median [K]STD [K]#Median [K]STD [K]#Median [K]STD [K]#
BND__ *Day------------
Night0.301.8258−0.581.54165−0.491.18104−0.371.79108
DRA__Day0.082.631161.131.397141.251.60639−3.511.636822
Night---−1.281.28876−1.311.25802−3.041.55344
FPK__ *Day------------
Night−0.242.4294−1.631.84731−0.721.28525−0.942.12270
GCM__Day0.291.4887−0.731.91524−0.151.66419−1.351.824664
Night1.771.451031.361.345081.501.452671.521.74300
PSU__Day1.132.1178−0.282.134001.062.05296−1.442.673603
Night1.152.46951.041.934321.411.222761.881.89268
TBL__Day2.494.111070.162.71487−0.072.45388−2.962.954934
Night−1.051.4299−1.591.59594−1.161.29490−0.332.14286
Note: * only night-time data used due to a strong seasonal cycle during day.
Table 4. Median validation accuracy, STD, and number of data points (#) over the KIT stations, for all satellites, and for the years 2010–2012.
SatellitesAATSRMOGSVMYGSVSEVIR
Stations Median [K]STD [K]#Median [K]STD [K]#Median [K]STD [K]#Median [K]STD [K]#
DAH_T *Day0.812.74501.423.601211.783.50134−0.433.993069
Night0.331.0730−0.862.99190−0.592.90108−0.512.762801
EVO__Day2.182.77112−0.492.384580.903.053980.912.255580
Night2.011.041270.961.685591.881.554210.531.596239
GBB_WDay3.06 2.151423.431.735672.611.486740.261.9110347
Night0.651.121181.341.517661.611.54627−1.291.7910336
KAL_H **Day1.021.73601.691.604031.301.29312−0.191.395084
Night2.400.39472.231.203582.011.35329−0.481.195409
KAL_R **Day2.881.20552.311.712363.821.661800.562.003280
Night−0.900.8742−0.950.99188−0.651.12157−1.180.093155
Note: * only data from 2010–2011 included due to technical difficulties; ** the station KAL_H was replaced in February 2011 by the station KAL_R.
Table 5. Median validation accuracy, STD, and number of data points (#) over the SURFRAD stations for all satellites for the years 2003–2012.
SatellitesAATSRMOGSVMYGSV
Stations Median [K]STD [K]#Median [K]STD [K]#Median [K]STD [K]#
BND__ *Day---------
Night0.401.96207−0.291.79504−0.331.30271
DRA__Day0.832.675061.481.8525091.581.882239
Night---−0.921.232915−0.921.082736
FPK__ *Day---------
Night−0.212.03334−1.291.632317−0.411.421649
GCM__Day0.561.54347−0.731.981574−0.161.761308
Night2.141.133981.021.3216141.181.28783
PSU__Day1.162.61314−0.212.0512630.591.99983
Night1.052.594460.821.9715091.211.22888
TBL__Day2.484.365200.582.6715910.612.431265
Night−1.011.57387−1.551.531982−1.051.081455
Note: * only night-time data used due to a strong seasonal cycle during the day.

