Article

Integrating Remote Sensing, Machine Learning, and Citizen Science in Dutch Archaeological Prospection

by
Karsten Lambers
1,*,
Wouter B. Verschoof-van der Vaart
1,2 and
Quentin P. J. Bourgeois
1
1
Faculty of Archaeology, Leiden University, P.O. Box 9514, 2300 RA Leiden, The Netherlands
2
Data Science Research Programme (Leiden Centre of Data Science), Leiden University, P.O. Box 9505, 2300 RA Leiden, The Netherlands
*
Author to whom correspondence should be addressed.
Submission received: 1 March 2019 / Revised: 27 March 2019 / Accepted: 29 March 2019 / Published: 3 April 2019

Abstract

:
Although the history of automated archaeological object detection in remotely sensed data is short, progress and emerging trends are evident. Among them, the shift from rule-based approaches towards machine learning methods is, at the moment, the cause for high expectations, even though basic problems, such as the lack of suitable archaeological training data are only beginning to be addressed. In a case study in the central Netherlands, we are currently developing novel methods for multi-class archaeological object detection in LiDAR data based on convolutional neural networks (CNNs). This research is embedded in a long-term investigation of the prehistoric landscape of our study region. We here present an innovative integrated workflow that combines machine learning approaches to automated object detection in remotely sensed data with a two-tier citizen science project that allows us to generate and validate detections of hitherto unknown archaeological objects, thereby contributing to the creation of reliable, labeled archaeological training datasets. We motivate our methodological choices in the light of current trends in archaeological prospection, remote sensing, machine learning, and citizen science, and present the first results of the implementation of the workflow in our research area.

Graphical Abstract

1. Introduction

1.1. Remote Sensing in Archaeological Prospection

The importance of remote sensing as a data source for archaeological prospection has grown exponentially in recent years [1,2]. Remotely sensed data from terrestrial, aerial, and spaceborne sensors are today a key element of local and regional scale archaeological research, as well as heritage management [3]. A recent study from Scotland [4] even advocates the primary reliance on remotely sensed data as part of a national archaeological mapping strategy. This is in line with the growing importance of non-invasive research strategies that enable the preservation of archaeological heritage [5,6,7].
While most terrestrial [8] and some aerial [9,10] remotely sensed data used in archaeological prospection are generated specifically for archaeological purposes, most aerial and all spaceborne remotely sensed data are produced for either non-archaeological applications or for general purposes [11]. Consequently, a broad range of computational methods and tools for the analysis of remotely sensed data have been developed outside of archaeology [12,13], e.g., for object detection [14], a task akin to archaeological prospection (see Section 2.1). However, in archaeology, the acceptance and use of these computational approaches were initially limited, since archaeology tends to rely on its own domain-specific toolbox [15].
Archaeologists have used aerial photographs for decades to detect and map archaeological traces in the landscape [16]. Thus, they initially tended to apply familiar protocols of aerial photograph analysis and interpretation to new types of remotely sensed data, e.g., by visually observing and manually marking potential archaeological objects [17] in single-frame 2D images of a given landscape, one image at a time (In the field of Computer Vision the term ‘feature’ refers to the properties of an image, while an ‘object’ refers to real-world entities [17]). This human-scale approach has obvious limitations [18]: 1) It cannot handle the sheer quantity of available remotely sensed data, which is growing exponentially; 2) it does not do justice to the quality of remotely sensed data, the dimensionality and resolution of which is often beyond the processing capacity of the human visual system; and 3) the inherent biases of the traditional approach [16,19] are not overcome but rather reproduced on a larger scale.
Thus, after initial attempts in the 1990s that had little effect, in the mid-2000s, archaeologists started in earnest to develop computational approaches to remote sensing-based archaeological prospection (see references in Reference [20] and overview in Reference [21]). While the history of this endeavor is thus short, clear patterns and trends have emerged. Referring to research undertaken by ourselves and others, we here follow the useful classification by Chen and Han ([14]; Figure 1), who identify four main classes of object detection methods in (optical) remotely sensed data that are based on either Template Matching, Knowledge, (Geographic) Object-based Image Analysis ((GE)OBIA), or Machine Learning.

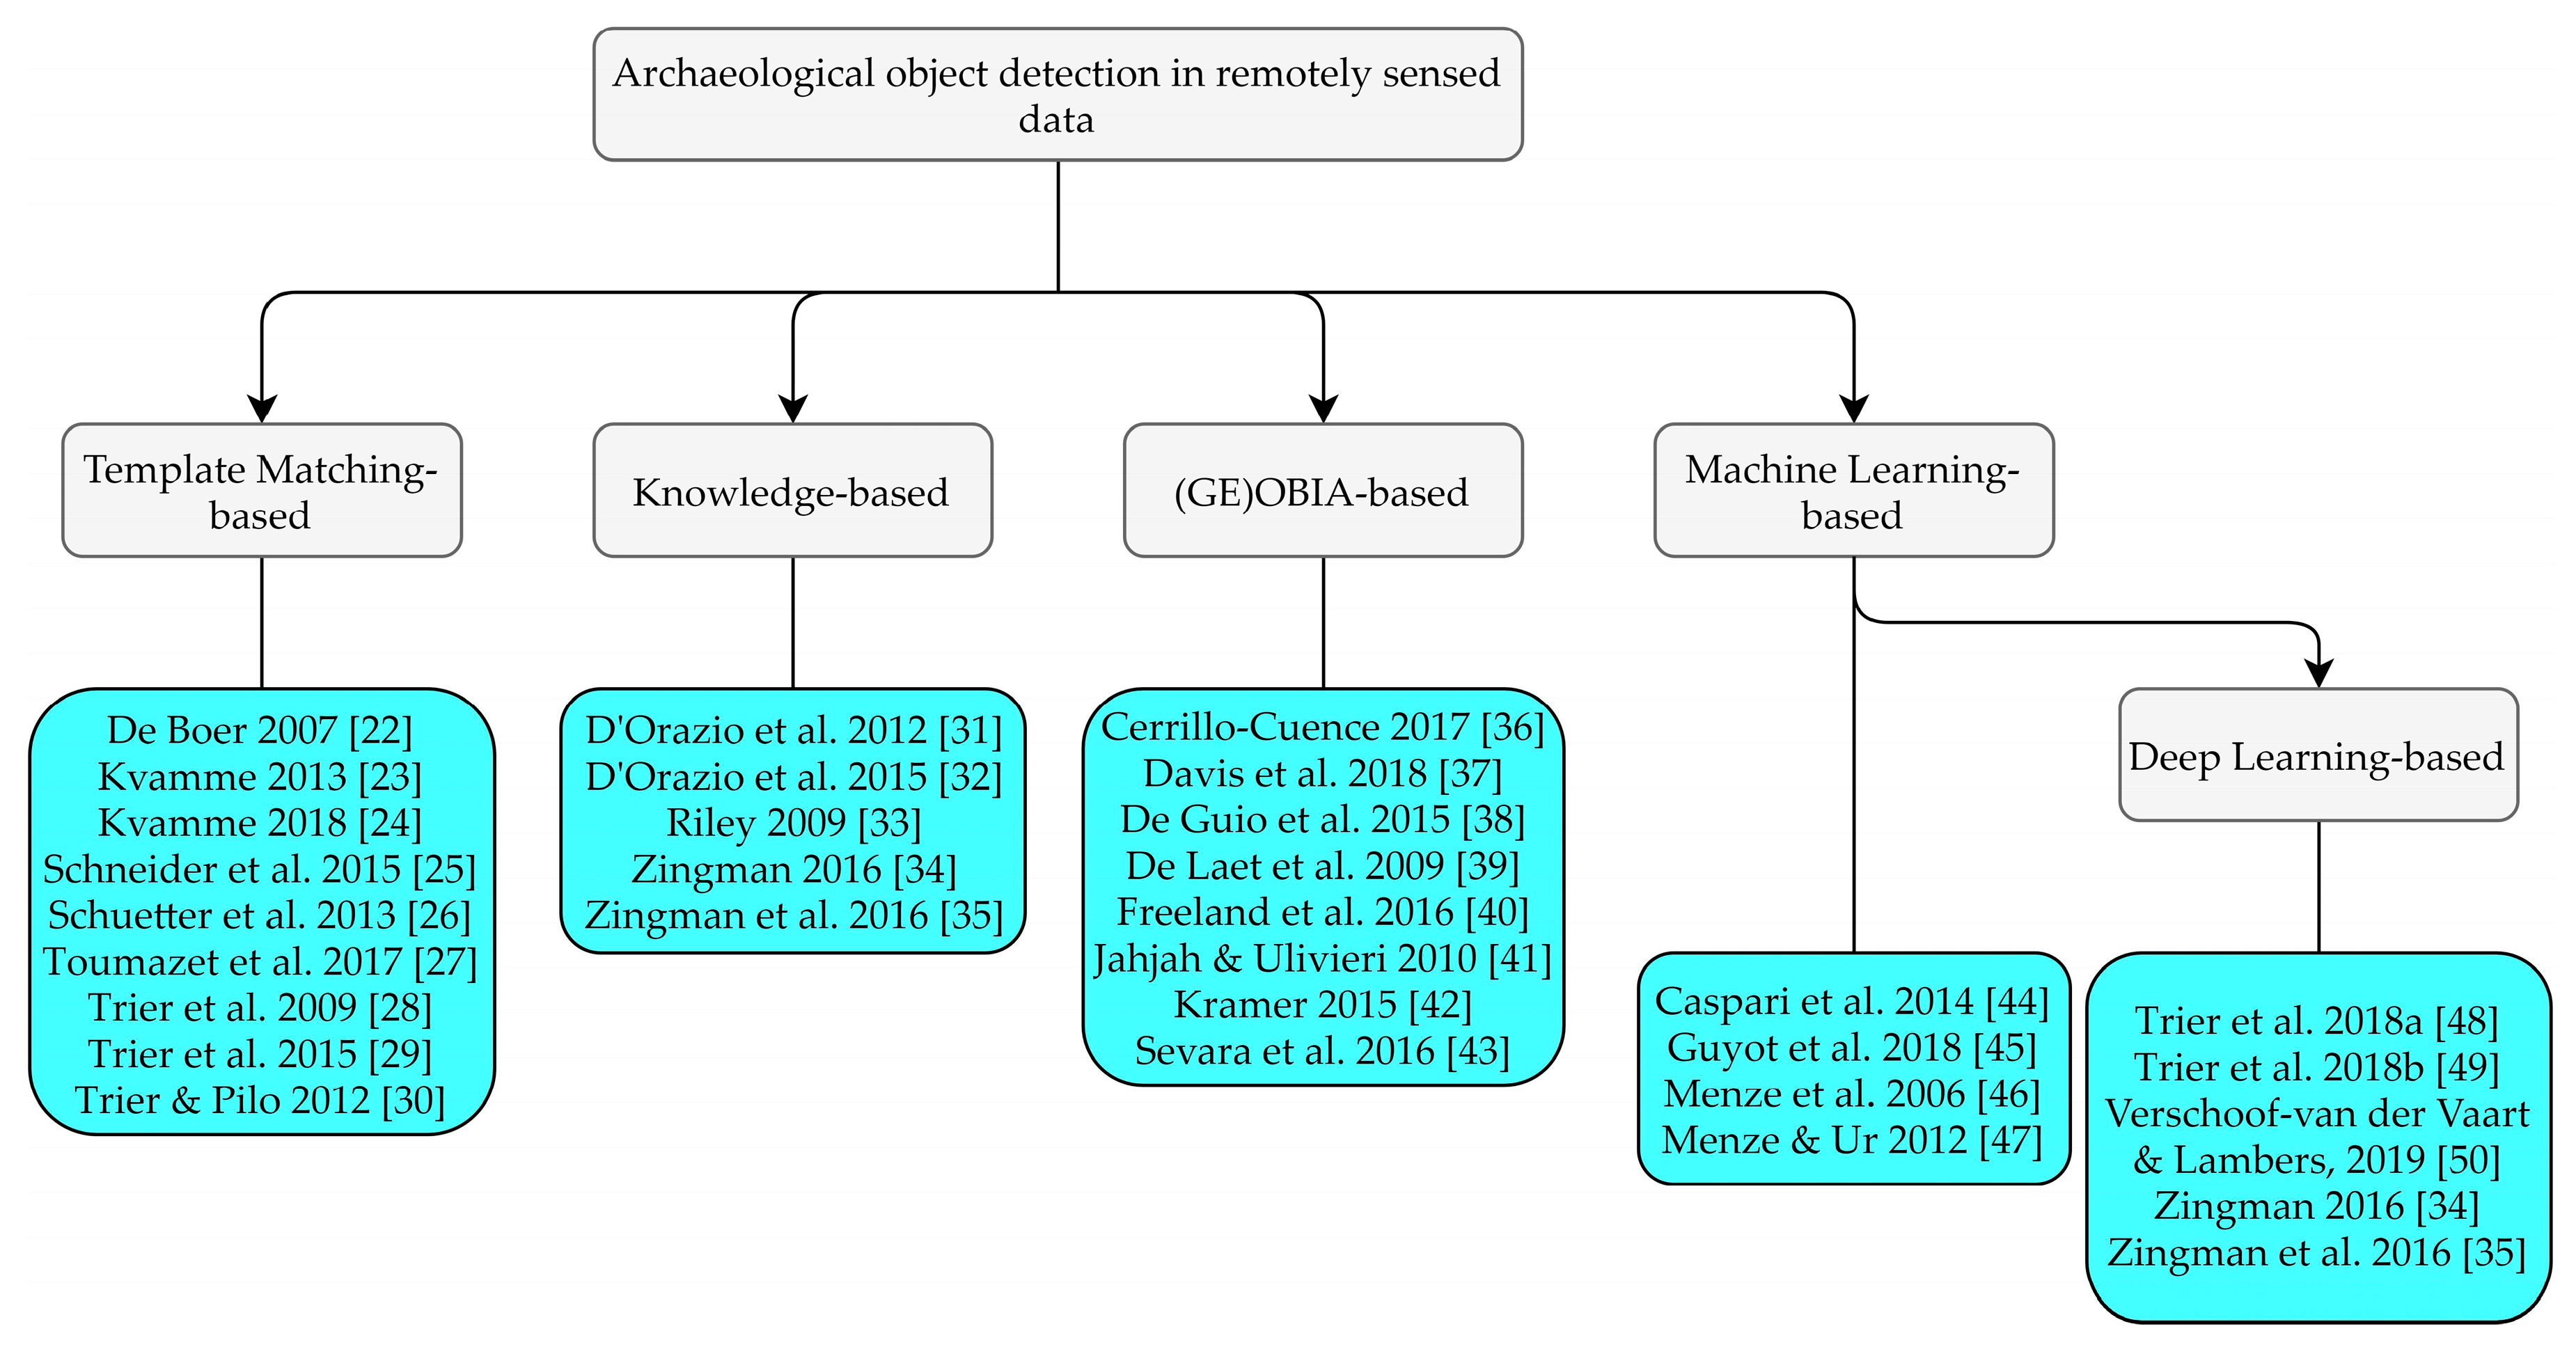
1.2. Archaeological Object Detection

In archaeological object detection, most available (custom) algorithms are based on Template Matching (e.g., [22,23,24,25,26,27,28,29,30]). Their continuous success is due to the fact that simple geometric shapes such as circles and rectangles are common in the archaeological record but rare in nature [23]. Knowledge-based algorithms (e.g., [31,32,33,34,35]) require detailed knowledge about the expected objects and their surroundings. They tend to be highly case-specific and are rarer in archaeology. (GE)OBIA-based approaches using image segmentation are more flexible and thus more common and have proven useful in various case studies (e.g., [36,37,38,39,40,41,42,43]). These first three classes of object detection methods (as opposed to the fourth class, machine learning, e.g., [44,45,46,47,48,49,50], see below) all build on explicit prior knowledge of the properties of the expected archaeological objects. They thus relate easily to common archaeological practice that relies on a detailed recording and study of the archaeological record informed, in large parts, by prior discoveries. However, multiple case studies using these ‘traditional’ methods have revealed complications with their implementation: 1) The often handcrafted algorithms are specialized in specific object categories and data sources, which restrict their use in different contexts and limits their usability in general for archaeological prospection; 2) templates and characteristic spatial attributes are often difficult to define for heterogeneous archaeological objects, especially if these have been ‘transformed’ by various natural and anthropogenic processes over time [45]; and 3) these approaches are predominantly complex algorithms that can require a high level of expertise, and are regularly dependent on expensive software. All this results in a limited user-friendly implementation (see also Reference [51]).
The fourth class of object detection methods defined by Chen and Han [14], machine learning, is a rather new approach in archaeological applications. It is conceptually different from the other classes in that it does not require any explicit knowledge of the properties of the expected objects or their surroundings, nor any rules for finding them. Rather, the computer learns from many known positive (and negative) instances of the expected object class(es) without making the relevant object properties explicit. Machine learning using Random Forests has been used in a number of archaeological case studies [44,45,46,47]. To date, the most frequently used algorithms within deep learning [52], a subfield of machine learning, are Convolutional Neural Networks (CNNs) [53]. In essence, a CNN is an image-classifier that is loosely inspired by the (human) visual cortex [51]. A deep convolutional neural network, from which the term deep learning is derived, consists of multiple layers that together comprise a feature extractor and classifier. The layers in a CNN are, in sequence: 1) An input layer, 2) a varying number of alternating convolutional and pooling layers, and 3) an output layer. In the convolutional layers, various filters (kernels) are used to convolve (add values of a pixel within an image to its neighboring pixels based on a certain filter) the image into feature maps. The subsequent pooling layer reduces the dimensions of these feature maps. After the last pooling layer, there are several fully-connected layers that look at which particular class the produced feature maps most strongly correlates to, assign class labels and compute probabilities of a given class being present in the input image [51,54].
Comparable to other machine learning approaches, a CNN learns to generalize from given examples (normally a large set of labeled images) rather than relying on a human programmer to formulate rules or set parameters. While this has led to discussions about the ‘black box problem’ [55], the favorable results of CNN applications have outweighed most skeptical voices. For example, since 2015, neural networks have consistently outperformed humans in visual object recognition tasks [56]. In particular, the opportunities offered by transfer learning (or domain adaption; [57]) have opened up the use of so-called pre-trained CNNs to many fields that, up to now, were restricted by the (small) size of available datasets, e.g., archaeology. CNNs have recently successfully been implemented in archaeology: On photographs and drawings [58], as well as on images from remote sensing surveys [34,35,48,49,50].
CNN-based machine learning thus seemed the most promising approach to analyze remotely sensed data of our research area in the central Netherlands for the purpose of archaeological prospection.

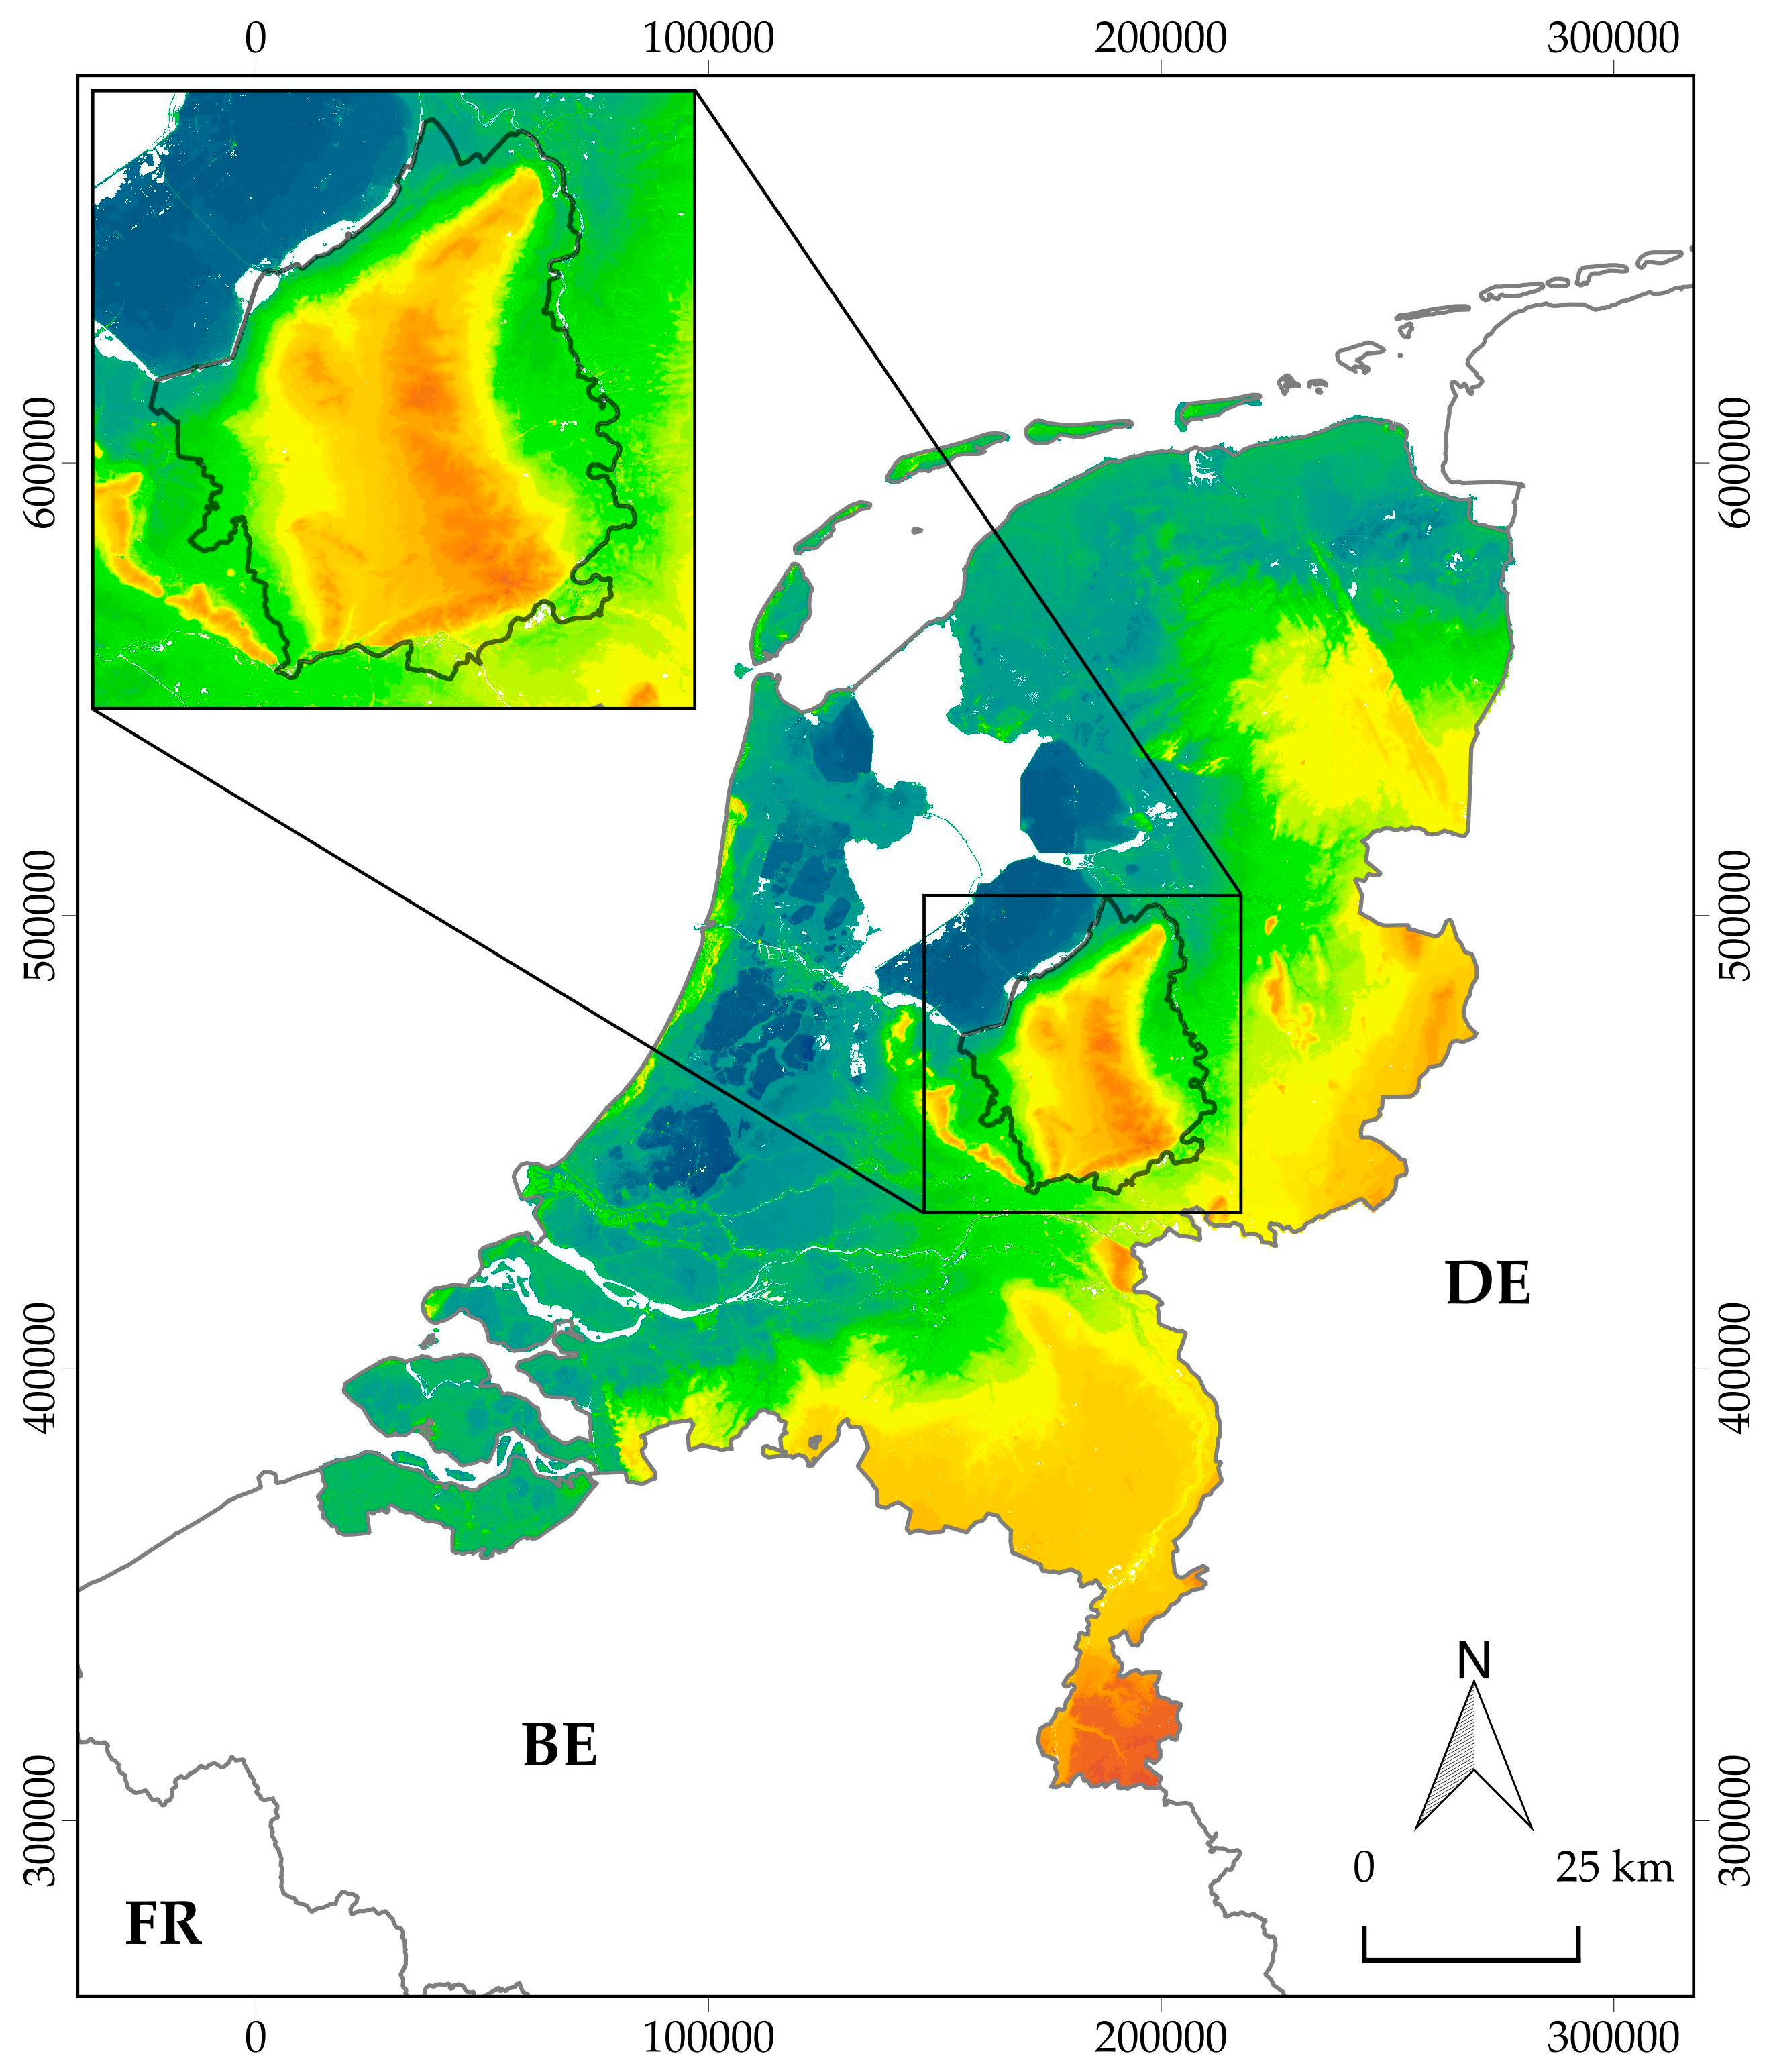
1.3. The Research Area and Current Research Strategy

The research area, known locally as the Veluwe, comprises a largely forested area of circa 1100 km2 (Figure 2). The Veluwe consists of ice-pushed ridges formed in the Saale glacial period (circa 350,000 to 130,000 years ago), which were subsequently partially covered with cover sand deposits during the Weichselian glacial period (circa 115,000 to 10,000 years ago) [59]. From the Neolithic through to the Middle Ages the Veluwe area was covered by forest and heath in varying proportions [60], and surrounded by marshes and river valleys. Significant deforestation of the area, due to extending agricultural areas and charcoal production, took place in the second half of the Middle Ages (circa 1000 to 1500 AD). This most likely caused the emergence of drift sand (aeolian sand; [59]). Large parts of the research area were reforested in the first half of the 20th century [61] and the majority of the still extant archaeological objects are now in heathland or under forest cover. Nowadays, the Veluwe holds one of the densest concentrations of known archaeological objects in The Netherlands, including barrows, Celtic fields, charcoal kilns, hollow roads, and landweren (border barriers). While the location of the archaeological objects under forest cover has almost certainly contributed to their present-day preservation, this also hinders the investigation of these objects and especially the survey of the surrounding landscape for potential new archaeological objects (see also Reference [62]).
Archaeological research on the Veluwe has mainly consisted of research-driven scientific studies, as opposed to development-driven commercial fieldwork. All this research involves, to a certain extent, the manual analysis of remotely sensed data. Recent research-driven excavations on the Veluwe have mainly focused on barrows (newly discovered in remotely sensed data) and their immediate surrounding landscape [64,65,66]. Recent large-scale surveys include the study of Celtic fields by Arnoldussen [67], the study of hollow ways and roads by Vletter and Van Lanen [68], and the research on barrow landscapes by Bourgeois [69]. The general research strategy in this area (and The Netherlands) consists of a stepped system of: 1) A desktop-survey; followed by 2) a field survey; and finally, 3) a (minimal) invasive survey, i.e., hand corings, test trenches, and excavations (Figure 3; see also Reference [70]). Recently, this research strategy has been successfully supplemented with geophysical surveys [71].

1.4. Outline of This Paper

In this paper, we propose an integrated approach, incorporating and combining the analysis of remotely sensed data using deep learning and methods from citizen science with ‘traditional’ research methods, in order to conduct a survey of archaeological objects based on multiple data sources. In the next Section 2 these new data sources and methods are introduced. In Section 3 the integrated approach is presented, followed by an ongoing case study that incorporates this innovative workflow in the research area (Figure 2). In Section 4 the integrated approach as a whole, as well as the new additions to the current research strategy are discussed, followed by conclusions in Section 5.

2. New Data Sources and Methods

2.1. Multi-Class Object Detection in Remotely Sensed Data Using Deep Learning

In order to explore the possibilities of convolutional neural networks for archaeological object detection in remotely sensed data on the Veluwe, a workflow called WODAN (Workflow for Object Detection of Archaeology in The Netherlands) was developed [50]. For the initial experiments 437.5 km2 of interpolated LiDAR data from the research area (Figure 2) was gathered (see [72,73] for information on LiDAR) (Interpolated LiDAR data of the entire Netherlands with a point density of 6–10 per m2 and a 50 cm resolution is available from the online repository PDOK [62] or the Actueel Hoogtebestand Nederland [73]). The data was visualized with the Simple Local Relief Model (see [74]) from the Relief Visualisation Toolbox [75]. This LiDAR visualization enhances the local detail, while suppressing the large-scale terrain relief, making it very suitable to represent various archaeological objects present in the research area (Figure 4; see also Reference [76]). The images were entered into a geographic information system (GIS) environment [77] and dissected into sub-images of 1000 by 600 pixels (500 by 300 m). Archaeological objects, discernable in the LiDAR data, were compared with the locations of known archaeological objects [50]. The (geo)information of these known archaeological objects was derived from a multitude of databases, including the Dutch national archaeological database ArchIS [78], the Dutch archaeological monument registry AMR [79], and the results of different large-scale surveys of the research area [67,68,69]. Sub-images containing known archaeological objects were labeled and the necessary metadata was created in order to use the images for our deep learning approach.
At the start of the development of WODAN, it was recognized that for archaeological prospection, obtaining the exact position of objects in the wider landscape (i.e., localizing) is as important as characterizing them (i.e., classifying, the typical task of a neural network). This combination of localizing and classifying–referred to as object detection in deep learning–is handled by a specialized type of neural networks, so called R-CNNs (Region-based CNNs or Regions with CNN features; [80]). These networks are able to localize and classify multiple objects within a larger image, as opposed to ‘normal’ CNNs that classify the entire input image [54]. The basic concept of the R-CNN model is: 1) To utilize the Selective Search algorithm [81] to produce object proposals; 2) to use a CNN to extract features for every object proposal; 3) to feed these features into a support vector machine (SVM) classifier to decide whether a proposal contains an object of interest; and finally, 4) to use a linear regressor to tighten the bounding box to fit the true dimensions of the object [80]. The successor of R-CNN (Fast R-CNN) improved on its predecessor by speeding up the feature extraction and classification step and by joining the CNN, SVM, and linear regressor into one CNN model [82]. Further improvements were made to speed up the object proposal step, resulting in the Faster R-CNN model [83]. The WODAN workflow therefore incorporates an adapted version of the Faster R-CNN model.
WODAN has been trained and tested on part of the research area (see Section 1.3) to detect barrows and Celtic fields in LiDAR images. The workflow served as a proof of concept, to demonstrate that by implementing deep learning techniques it was possible to create a multi-class detector for archaeological objects. WODAN (Figure 5) consists of three parts: A preprocessing part, an object detection part, and a post-processing part. For a comprehensive overview of WODAN see Reference [50]. The preprocessing part converts interpolated LiDAR data into input images that meet the requirements of the object detection model. In the second part, the actual object detection by the adapted Faster R-CNN model is performed. The post-processing part converts the results of the prior step into geographical vectors, directly usable in a GIS environment. This final step improves the usability of the object detection results for archaeological prospection.

2.2. Creation of (Training) Datasets

During the development of WODAN, two major challenges were encountered: The absence of large datasets with labeled archaeological objects and the presence of hitherto unknown archaeological objects that have to be validated within the datasets.
In order to successfully train Faster R-CNN—or any machine learning object detection model—training-, validation-, and testing datasets containing a large number of labeled archaeological objects are needed. Unfortunately, at the outset of the development of WODAN no such datasets were available, and therefore had to be created. This manual creation of the necessary datasets is a labor-intensive process, which is susceptible to bias, inaccuracies, and errors, largely depending on the (number of) interpreters or ‘taggers’ [84,85].
During the creation of the dataset it was noted that many images contained prospective archaeological objects that were previously unknown (Figure 4). At the moment of writing, 739 potential barrows (on average 1.7 new potential barrows per km2) and 415 potential charcoal kilns (on average 0.95 new potential charcoal kilns per km2) have been discovered in an area of 437.5 km2. Based on these numbers, a rough extrapolation can be made for the amount of new potential barrows and charcoal kilns in the entire research area (circa 1100 km2). We expect about 1750 new potential barrows (including the previously mentioned 739) and about 1000 new potential charcoal kilns (including the previously mentioned 415) in the research area. In this we have considered the amount of archaeology in ‘high potential’ zones, with an abundance of forest and/or heathland cover and therefore good preservation conditions, and ‘low potential’ zones, with large areas of agricultural- and/or builtup cover. Validating circa 2750 new potential archaeological objects would take more than six years of continuous (field)work, following the present-day research strategy (see Section 1.3), without any additional data analysis.
These challenges caused us to contemplate whether the systematic involvement of volunteers (i.e., citizen science) could possibly be an answer to the non-existence of large, labeled datasets, as well as the validation of newly discovered archaeological objects either during the creation of datasets or as the result of automated object detection methods.

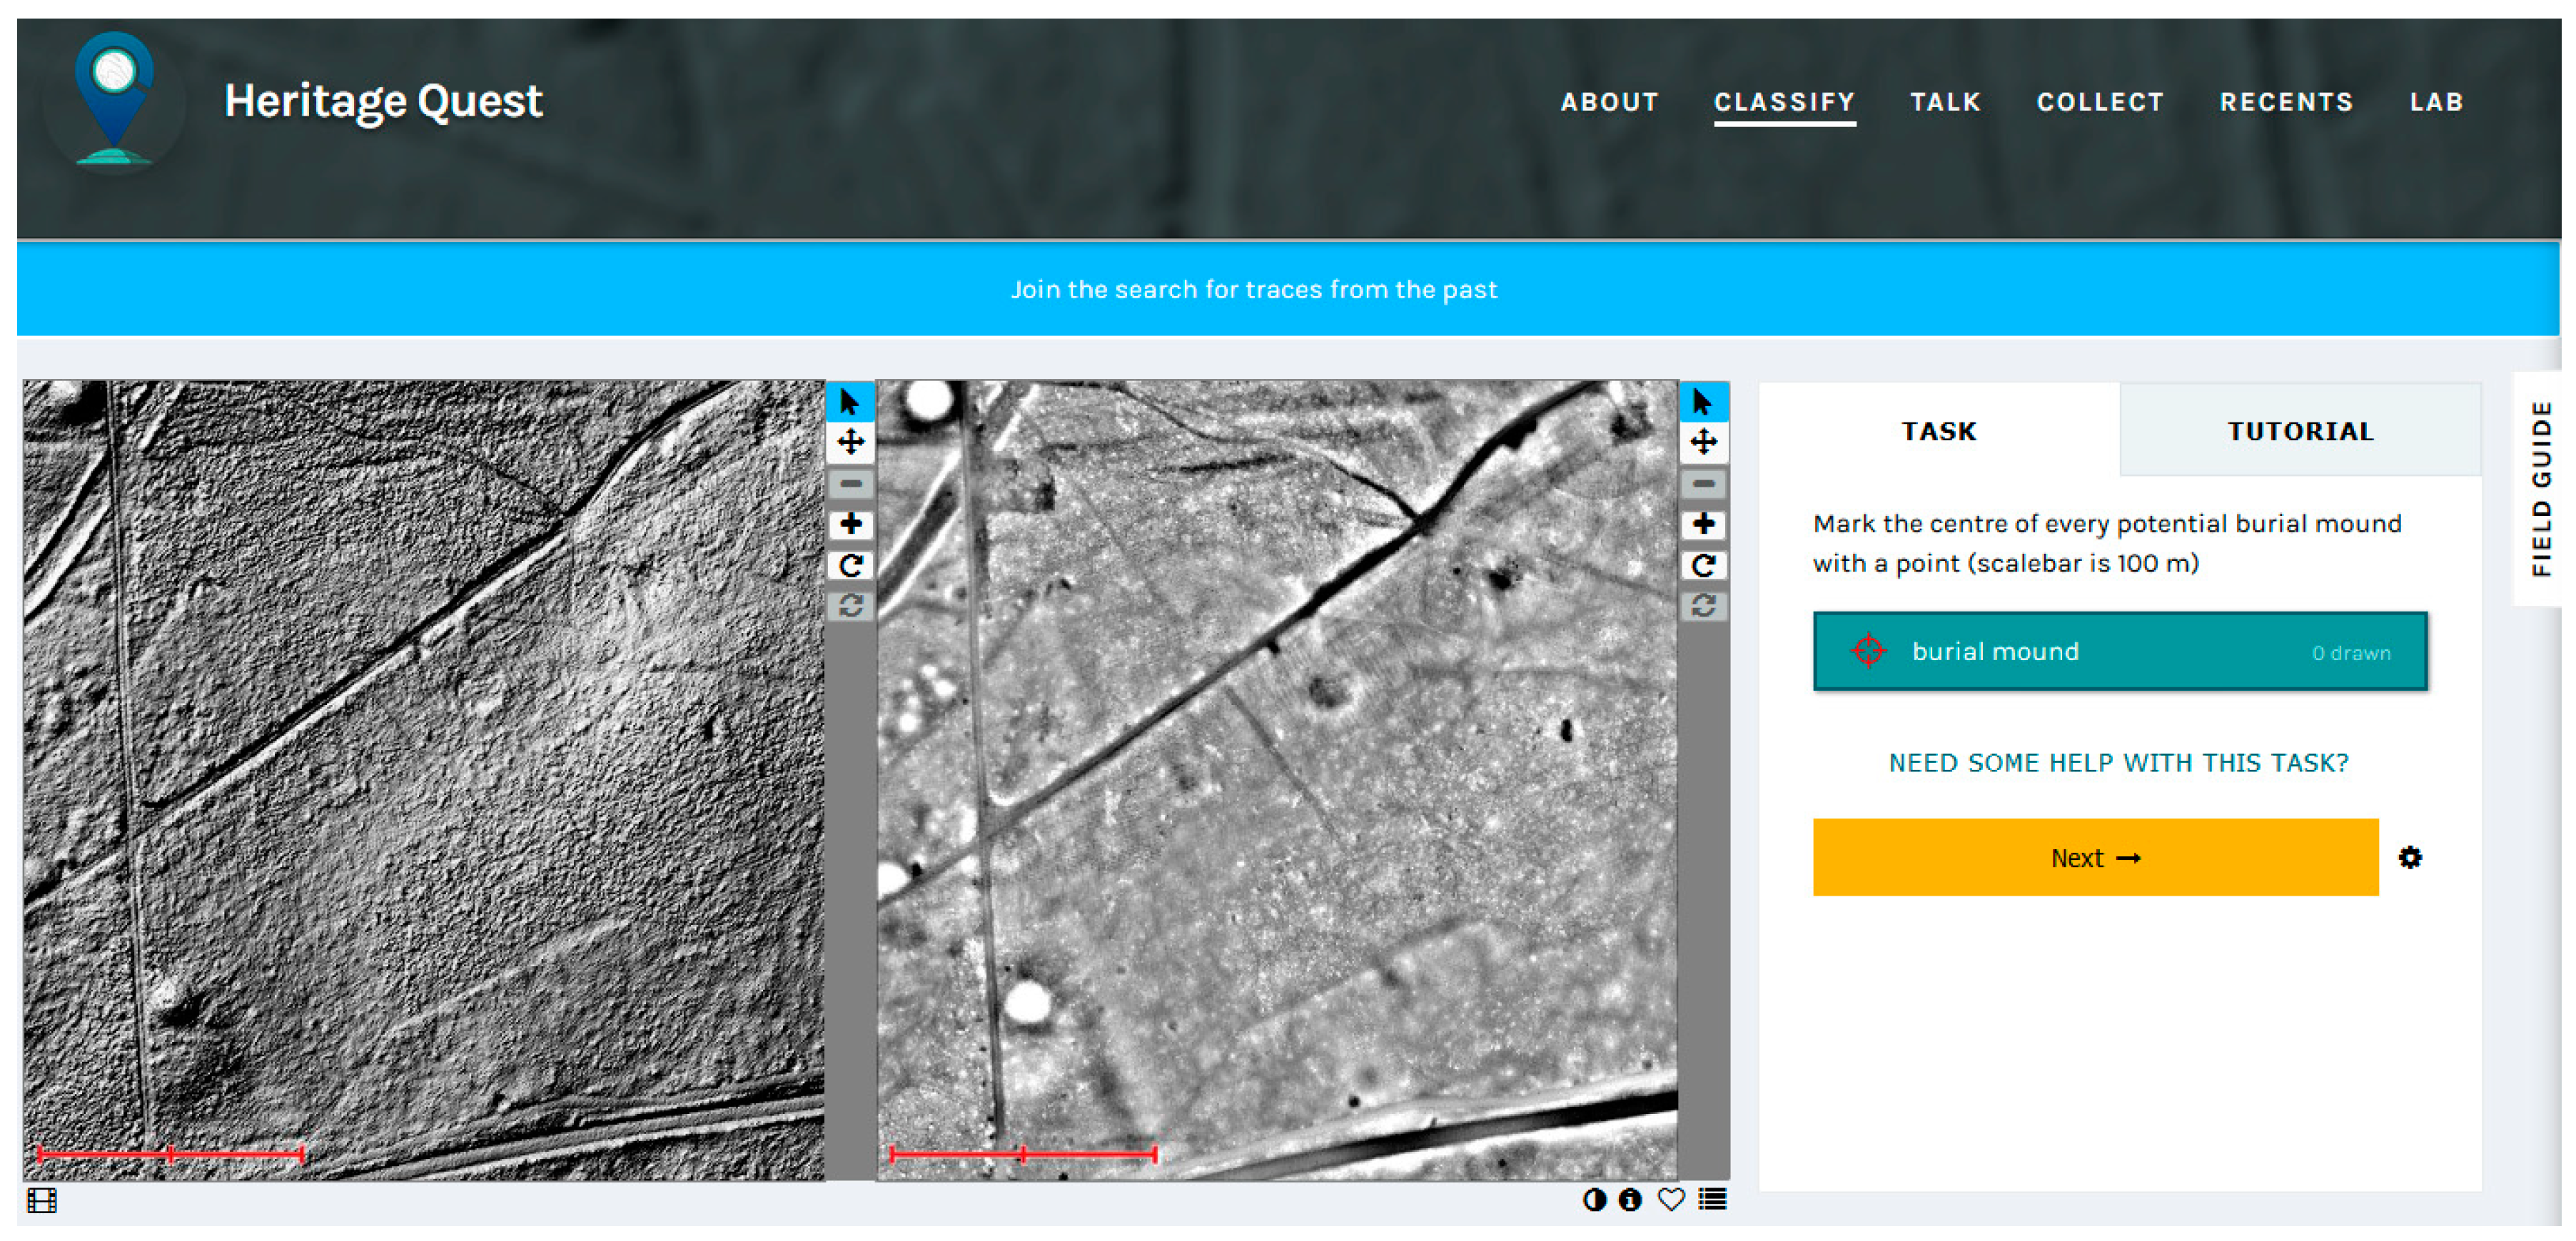
2.3. Citizen Science

The definition of citizen science can be very broad [86,87], but essentially it boils down to volunteer (non-professional) scientists, generally called citizen researchers [87], helping with a scientific inquiry. Within archaeology, this has long been a recurrent practice, especially during fieldwork where community engagement is prevalent [88]. However, directly involving citizens in the collection and/or interpretation of datasets, in order to cope with the so-called professional bottleneck [89], is less common.
In recent years a few large-scale online citizen science projects have been launched successfully within archaeology (e.g., [90,91]). One of the more successful projects is the crowdsourced search for Genghis Khan’s tomb by National Geographic [92]. Over 10,000 online volunteers contributed 30,000 hours (3.4 years), examining 6000 km2 of high-resolution satellite images of a region in Mongolia. This generated 2.3 million potential archaeological objects, including Bronze Age and Mongol period burial mounds, so-called “deer stone” megaliths, and ancient city fortifications. An example of a more small-scale project is the Cotswold Escarpment project, in which six volunteers examined LiDAR data of an area of 100 km2 in South West England and identified over 260 archaeological objects [93].
The success of some of these projects already highlights their potential for our current approach. However, online citizen science projects face specific challenges [94,95]. Previous research has shown that the majority of the contributions in such projects are made by a relatively small group of volunteers [94,95]. Thus, recruiting a critical mass of citizen researchers and ensuring they are kept engaged throughout the project is one of the biggest challenges such a project would face.
A further challenge, in particular related to archaeological projects, is that the quality of the contributions is difficult to assess (beforehand). The weeding out of false positives, especially in the case of the interpretation and classification of remotely sensed data, is a critical aspect [96]. In this respect, we envision that the results of machine learning approaches can be validated against the results of citizen science approaches and vice-versa. The feedback between these two datasets will inform us on the quality of both.
An added benefit of using citizen science in the interpretation of remotely sensed data, is that citizen researchers will also be able to detect objects they have not been instructed to detect [97]. Machine learning approaches can only detect objects similar to known ones of which enough examples are available, yet finding potential new types of archaeology requires a human perspective. For example, in the specific case of the Veluwe, already one potential Roman marching camp has been discovered by human interpreters. As the number of known Roman marching camps in The Netherlands (and continental Europe) is very low [98], finding these will require a human perspective.
Both the citizen science and machine learning datasets will generate specific locations where archaeological objects are expected. Gauging the quality of these predictions often requires field observations [70]. As highlighted above, the sheer number of expected archaeological objects makes such a fieldwork project a daunting task through regular means. Therefore, we aim to also combine this fieldwork with a citizen science approach, where citizen researchers can participate in a dedicated fieldwork campaign. Citizen researchers can easily take most of the initial steps needed to rule out false positives in the field. For example, in our Veluwe case study a simple visual inspection can quickly differentiate between a potential barrow or a stack of fodder next to a farm, both of which will generate the same pattern on a LiDAR image. Nevertheless, recognizing different object classes in the landscape and distinguishing archaeological objects from natural or modern ones is difficult and requires training and experience.
We argue that the combination and integration of all three approaches—machine learning-based object detection, citizen science-based online data interpretation and revision, and a citizen science fieldwork campaign—will provide an integrated approach that will be beneficial to all three elements. Finally, the added benefit of the citizen science approach is that it will help generate awareness and better protection of the archaeological relics in the area directly through the involvement of the citizen researchers [93].

3. Implementation and Results

Based on the results and challenges presented by automated object detection techniques, the opportunities offered by citizen science, and the current research strategy for validating new potential archaeological objects from remotely sensed data, we propose an innovative integrated workflow to generate datasets for machine learning approaches and to validate new potential archaeological objects. This integrated approach (Figure 6) incorporates the aforementioned new data sources and methods in the existing research strategy, with a clear focus on the participation of a wide range of different interest groups, including citizen researchers, data scientists, heritage managers, and academic researchers. In the following Section 3.1, the separate steps within the integrated approach are presented, followed by an overview of their implementation in our research area (Section 3.2).

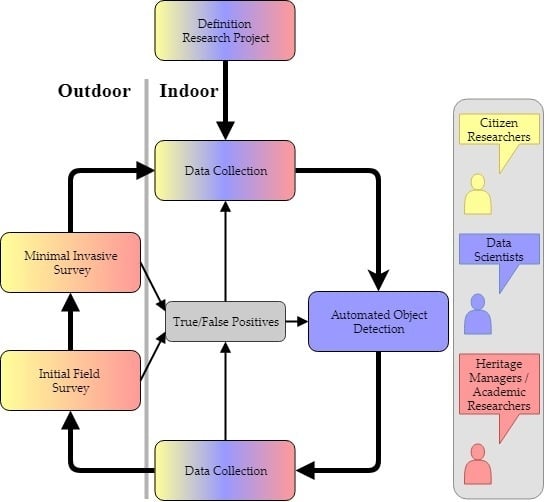
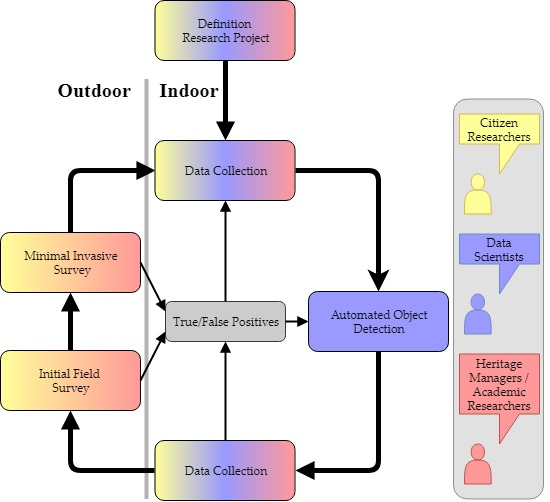
3.1. An Integrated Approach for Dataset Generation and Validation

The start of the integrated approach (Figure 6) lies in the definition of the overall research project, including a research area, a central research problem, and associated research questions. Our intention is that all above-mentioned groups can and should participate in the formulation of the research project. While the interests and questions may differ between these groups, they can all contribute to a common goal. For example, local citizen researchers might be interested in the history of their home region, data scientists in the development of accurate training datasets for machine learning methods, heritage managers in the exact location and preservation of archaeological objects within their region of influence, and academic researchers in (the physical residue of) social processes through time in a certain area. All these questions have in common that answering them requires the detection, localization and classification of archaeological objects in the defined research area.

3.1.1. Data Collection and Automated Object Detection Steps

Following the formulation of the specifics of the research project, a continuous, iterative process of data generation and validation starts. The first step in this process involves the collection of (remotely sensed and archaeological) data, predominantly to generate training datasets for the next step in the approach. This collection of data will be extended and updated constantly, based on the validation of detections later on in the process. It is presumed that new potential archaeological objects are discovered already during this step in the process, especially when new data sources are used or when the defined research area has not been extensively researched in the past (see Section 2.2). This step, as well as the subsequent desktop survey step, present opportunities for using online platforms to include and involve a wide audience of (citizen) researchers. Spreading the workload of data collection among a large group of individuals can prove to be a solution to the professional labor bottleneck encountered in training dataset generation [89].
The result of the first step is a substantial collection of data containing (geo)information about known and newly discovered archaeological objects. This training dataset can be used for automated object detection using deep learning or other machine learning approaches. Given enough training examples, deep learning approaches have proven to be able to localize and classify new examples of the archaeological object(s) in question (e.g., [49]). Therefore, just like the prior step in the process, these object detection schemes will generate detections of new potential archaeological objects.

3.1.2. Validation Steps

Following the data collection and automated object detection step, the new potential archaeological objects will be validated in three consecutive steps (Figure 6), closely following the current Dutch research strategy (see Section 1.3) of desktop survey, initial field survey, and minimal invasive survey. These validation steps can be conducted by different groups of citizen researchers in cooperation with or assisted by (local) heritage managers and/or academic researchers. A clear distinction can be made between the first step of the validation process, i.e., desktop survey, and the subsequent two steps, i.e., initial field survey and minimal invasive survey. The desktop survey is an indoor and digital activity that is not impeded by the distance between the citizen researcher and the research area. Therefore, this step can include a wide group of contributors on the national and even international level. On the other hand, the second and third validation steps have a distinct local and outdoor character. These steps involve the active participation of citizen researchers at the actual location of the detections. Thus, there may or may not be an overlap between the two groups of citizen researchers involved in the desktop and field surveys, respectively.
In the desktop survey the results of the prior steps (especially the automated object detection step) will first undergo a data quality control. Thereafter, the results are compared with digital (geo)information sources, such as historical, geo(morpho)logical, and topographic maps, (historical) aerial photographs, and other remotely sensed data. This will lead to the discernment of false positives. More importantly, this step can lead to new insights in the relation between certain archaeological object classes and particular topographic and/or geological parameters. This relational information can be used in subsequent iterations of the process.
In the initial field survey, the newly discovered potential archaeological objects will be investigated in the field. (Citizen) researchers will be asked to record a predefined set of characteristics such as dimensions, height, position in the landscape, etc. for every new potential archaeological object. This validation step will, in addition to identifying false positives, lead to the recognition of important parameters of the archaeological objects in question. Furthermore, by recording natural and anthropogenic disturbances to the archaeological object such as toppled trees, burrows, excavations, etc., a first indication can be gained on the preservation of the archaeological object and further steps can be undertaken by heritage managers to conserve the object.
The third and last validation step involves the investigation of new potential archaeological objects through minimal invasive techniques, such as hand corings or test trenches. This step is specifically to validate those new potential archaeological objects that could not be confirmed nor discarded in the two preceding validation steps.
The validation steps within the integrated approach lead to the determination of true and false positives, the determination of important parameters of the archaeological objects in question, and the identification of potential new data sources. These results will be used to update the data collection and automated object detection and can thus be exploited at a subsequent iteration of the process. This integrated approach will result in large reliable datasets, better automated object detection models that can rely on these large reliable datasets, a completer picture of the occurrence of the archaeological object classes within the research area, and more knowledge of the archaeological objects in question. This, in turn, will lead to new insights into the number, distribution, and state of preservation of the archaeological objects in question, and the potential for better preserving and monitoring of these objects, thus answering the different research questions of the different interest groups.

3.2. Case Study: Using the Integrated Approach in Studying Archaeological Landscapes on the Veluwe

The integrated approach to archaeological prospection proposed here (Figure 6) is currently being implemented in the research area (Figure 2), where it enables us to create and validate datasets of archaeological objects, namely three typical, abundantly present classes: Barrows, Celtic fields, and charcoal kilns (Figure 4). The citizen science elements of our project have been designed and are being conducted in collaboration with the regional heritage agency, Erfgoed Gelderland. The iterative nature of our approach leads to a continuous generation of data. We here present the results of the initial project phase.

3.2.1. Data Collection and Object Detection: The Zooniverse and WODAN

In order to analyze the LiDAR data, our primary data source, of the entire Veluwe, we use the Zooniverse, a web-based platform that offers opportunities for citizen science projects or ‘people-powered research’ [99]. The concept of the Zooniverse is that users do not need any specialized background, training, or expertise to participate in any project on that platform. In our Zooniverse project, named Heritage Quest [100] (Heritage Quest will officially belaunched on 10 May 2019 and be available online at Reference [100] from that date onwards), participants are asked to mark every potential barrow, Celtic field and charcoal kiln within a small LiDAR image of 300 m by 300 m (Figure 7). The participant has the option to switch between different LiDAR visualizations (currently shaded relief and Simple Local Relief Model; see Reference [76]) in order to assist them in their classification. In order to allow international citizen researchers to participate in the data collection step, the user interface of Heritage Quest is bilingual Dutch/English. Every individual LiDAR image will be classified by at least eight different users, therefore guaranteeing minimal inter-analyst variability and furthermore presenting possibilities to explore inter-rater agreement [101]. The monitoring of user engagement, feedback and online support will be provided by a dedicated staff member at our regional collaboration partner, Erfgoed Gelderland, who knows the study region first-hand.
The automated object detection workflow WODAN [50] will be used on the same areas as the Heritage Quest project. The results of both will be compared with each other (see Section 2.3).

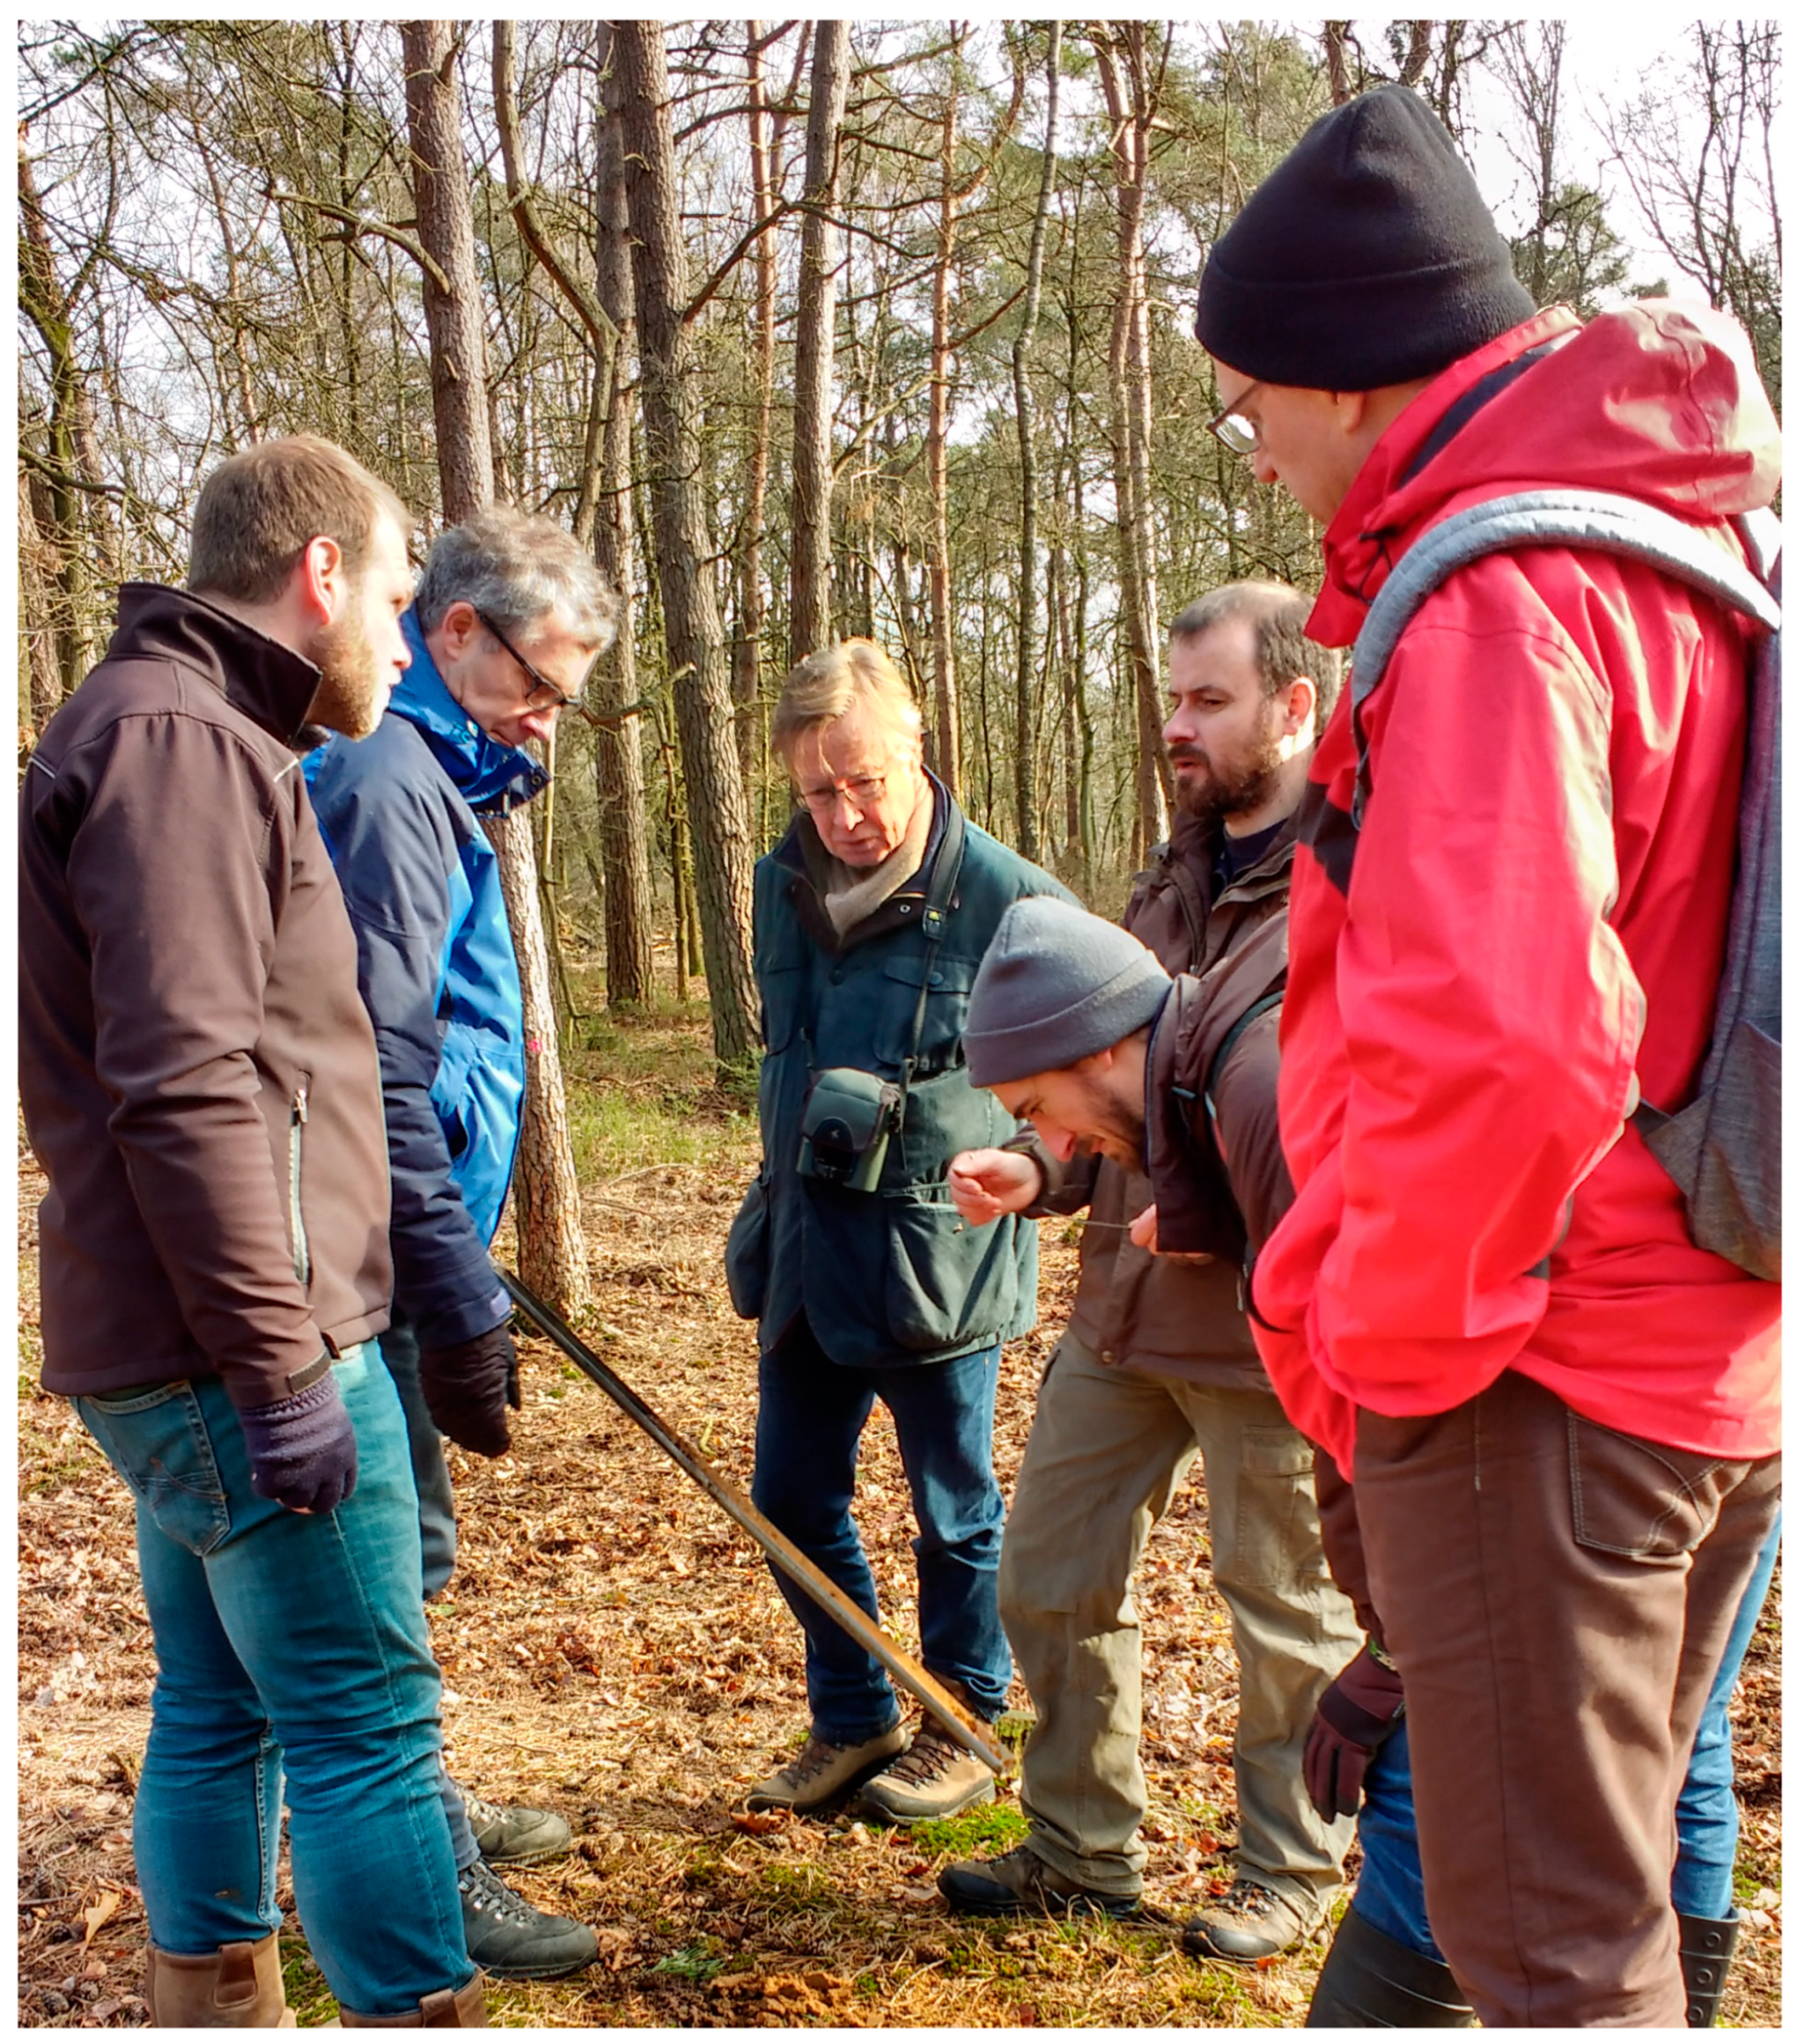
3.2.2. Validation: Field Expeditions and Coring Campaigns

The new potential archaeological objects, discovered in the previous steps of the project, will be validated by the cooperation between citizen researchers and heritage managers and/or academic researchers. The initial field surveys will focus on the validation of new potential barrows and charcoal kilns, as tests have shown that Celtic fields are too difficult to recognize under vegetation cover in the field. These investigations can be conducted individually, or in larger groups in so-called field expeditions, organized at regular intervals during the year. The initial field surveys will be guided by a mobile WebGIS application, which incorporates a simplified GIS environment and a digital survey form. This program guides the user to the location of new potential archaeological objects and offers the possibility to collect and register a set of predefined characteristics directly in the application. Apart from the documentation of these characteristics, it offers the possibility to record natural and anthropogenic disturbances.
It is recognized that the last validation step within the process, involving minimal invasive techniques, is a complex affair, which requires a certain degree of experience (see Section 2.3). Furthermore, invasive archaeological research is strictly regulated and restricted to ‘professional archaeologists’ by Dutch heritage laws [102]. Therefore, this step within the validation will be conducted by heritage managers and/or academic researchers assisted by citizen researchers and/or students in so-called coring campaigns. After successful test runs in early 2019 (Figure 8), both the field expeditions and the coring campaigns will take place in summer and autumn, building on previous collaboration with regional heritage managers and citizen researchers in the Veluwe project.
After the initial iteration of the process the results will be incorporated in the training dataset of WODAN, which will lead to an improved performance in subsequent iterations [50]. New archaeological object classes can be added and new areas can be explored. The end result of the project will be a large reliable dataset of different archaeological object classes, a better understanding of the occurrence, distribution, and preservation of these archaeological object classes, and the engagement of citizen researchers with the cultural heritage of the Veluwe.

4. Discussion

The integrated workflow that we introduce here and are currently employing in our Veluwe case study is a novel combination of methods from remote sensing, machine learning, and citizen science for the purpose of archaeological prospection. While these methods have been combined in different partial constellations in the past, our project on the Veluwe, although in its early stages, shows the benefits of a full integration.
Numerous studies in recent years have shown that a thorough analysis of remotely sensed data consistently leads to a significant increase in the number of potential archaeological objects in a given region (e.g., [4,46,93,103,104,105]). The quantity and complexity of—often high-resolution, multi-dimensional—remote sensing data requires an investment of labour far beyond traditional means. Apart from computational approaches, discussed below, this can either be achieved by having few people work on the task over a long period of time (e.g., [104]) or many people over a short period of time (e.g., [92,103]). In the latter case, those people are either trained project staff or citizen researchers. While trained staff can contribute to both object detection and validation [103], the employment of citizen researchers has so far been mostly limited to object detection [92,93]. As our workflow shows, citizen researchers can make important contributions on multiple levels (Figure 6): 1) In the research design step, by contributing their own research questions, 2) in the data collection step, detecting archaeological objects based on their own knowledge and/or training provided by heritage managers/academic researchers, and 3) in the data validation steps, by checking object detections made on remotely sensed data digitally and in the field. This is where we propose two related but separate citizen science projects: An online screening of remotely sensed data (our Heritage Quest project [100] on the Zooniverse) in which many citizen researchers on an international level can participate, and field observations in our research area by local citizen researchers, some of whom have collaborated with other archaeological projects on the Veluwe in the past. While there might be an overlap between the user populations of both projects, and we use one project to advertise the other, such an overlap is not required for the success of both projects.
Apart from the detection and validation of archaeological objects in our research area, both citizen science projects also contribute to the generation of large reliable training datasets of archaeological objects in remotely sensed data. These are required to improve our deep learning-based multi-class object detection workflow WODAN, but also other machine learning-based archaeological object detection methods can benefit from these. In fact, the generation of large training datasets is a prerequisite to make any machine learning approach work in archaeological contexts where reliable data is often sparse. Although strategies such as data augmentation [52] and transfer learning [57] have considerably lowered the required number of confirmed instances of archaeological objects for the training of deep learning-based algorithms, higher numbers will always improve their performance. The iterative nature of our integrated approach (Figure 6) ensures that any validation will feed directly into the training dataset, thus constantly improving the deep learning-based detection algorithm. We have started to exchange our training data with projects working in similar fields. Since most automation projects so far have been targeting a narrow range of typical, pervasive archaeological object classes such as barrows, charcoal kilns, mounds and pits (see Section 1), such an exchange is likely to lead to quick improvements of the different approaches. In the long run, we envision the creation of truly large archaeological training datasets that can be used in regular competitions not unlike the annual ImageNet challenges [106].
With this perspective in mind, we argue that deep learning and citizen science not only combine well, but depend on each other for the success of both. This has, in fact, been recently demonstrated by case studies in other domains, such as biology [107], medicine [108], and ecology [109], to name just a few. In archaeology, however, both approaches have so far been used alternatively instead of complementarily. Especially object validation has been left to trained project staff or professionals [4,103,110], in some cases explicitly favouring this option over any automation approach [103]. Our proposed workflow and its implementation in our Veluwe project shows that such a dichotomy between people-powered and computer-powered archaeological object detection does not exist and that we should indeed strive for an integration of both approaches.
In choosing CNN-based deep learning as a basis for our approach to archaeological object detection in the Veluwe project, we are aware of the criticism that this method faces (see Section 1 and discussion in Reference [111]). However, we are not just following the latest trends here but have based our decision on our own experience and learning curve in the field of automated archaeological object detection over more than a decade.
In the course of consecutive projects, the first author tested different approaches to automated archaeological object detection (e.g., Nasca geoglyphs in Peru [112,113] and livestock enclosures in the Alps [34,35,114]), moving from simple tools such as edge detectors to complex knowledge-based algorithms. While the detection results became more powerful and accurate over time, little efficiency was gained, and transferability was limited. Towards the end of our previous project we compared our custom detector of livestock enclosures with two common CNNs: AlexNet and VGG-f (see Reference [54]). The results were exciting and sobering at the same time. While our custom detector, hand-crafted over four years, performed best, the CNNs performed nearly as well after having been adapted to our case study within just a few weeks [34,35]. Thus, in terms of efficiency, common pre-trained neural networks clearly outperformed our custom algorithm. This—to our knowledge—first application of CNN-based deep learning approaches to archaeological object detection in remotely sensed data showed the great potential of transfer learning for archaeology, but also the necessity of a large training dataset.
In the present study, we are building on this experience and enhance the deep learning approach with a complementary citizen science approach, integrating them in an iterative workflow that yields benefits for both. In our Veluwe project, deep learning-based automated object detection already works, although there is clearly room for improvement [50]. Citizen science-based data collection and validation has been tested successfully and is likely to contribute to the project soon. A challenge here will be the retention of citizen researcher engagement during the project. Research has shown that regular feedback and support are necessary factors contributing to the success of long-term citizen science projects [94,95]. This will be true for the online desktop-based survey (Heritage Quest [100] on the Zooniverse), but will perhaps be even more critical for the dedicated fieldwork teams. As the recognition of archaeological objects is dependent on experience as well as training, the quality of the field inspections will be affected by the long-term engagement of the citizen researchers. In this respect, we will team up with national volunteer organizations such as the Archeologische Werkgroep Nederland (AWN) to provide training and information to prospective citizen researchers involved in fieldwork.

5. Conclusions

We have proposed an innovative integrated approach for archaeological object detection that draws on recent developments and own experiences in remote sensing, machine learning, and citizen science (Figure 6). This workflow is currently being employed in a long-standing investigation of the archaeological landscape of the Veluwe in the central Netherlands (Figure 2). In this case study, a key element of the integrated approach is a deep learning-based object detection workflow called WODAN [50], to our knowledge, the first functional multi-class detector of archaeological objects in remotely sensed data. In order to validate objects detected by WODAN and to add additional detections, we involve citizen researchers in different stages of the project, both through an online survey of remotely sensed data (Heritage Quest [100]), and through dedicated fieldwork. These field observations are then fed back into the training dataset of WODAN, which in turn produces more accurate object detections for the next validation step. Over time, this iterative process will lead to a reliable database of validated archaeological objects of recurrent, pervasive classes, providing an excellent basis for archaeological research, heritage management and regional historiography.
At the same time, and beyond the scope of our Veluwe project, this database constitutes a growing dataset of labeled archaeological objects that is much needed to train machine learning-based approaches to archaeological object detection in this project and elsewhere [111]. The three recurrent archaeological object classes currently targeted, namely barrows, Celtic fields, and charcoal kilns, are present in other parts of Europe as well. For example barrows/burial mounds and—functionally different but morphologically similar—other earthen mounds are even a constitutive element of the archaeological record of many regions of the world (e.g., [37,44,115]) and are probably one of the most pervasive archaeological object classes worldwide. Combining training data from different projects is likely to enhance the performance and transferability of multiple detection algorithms that are currently under development in different contexts across Europe and beyond. While this research has so far been mainly driven by archaeologists and data scientists, our integrated workflow shows the crucial role that citizen researchers can play in this research endeavour.

Author Contributions

Conceptualization, K.L., W.B.V.-v.d.V. and Q.P.J.B.; formal analysis, W.B.V.V; funding acquisition, K.L. and Q.P.J.B.; investigation, K.L., W.B.V.-v.d.V. and Q.P.J.B.; methodology, K.L., W.B.V.-v.d.V. and Q.P.J.B.; project administration, K.L. and Q.P.J.B.; resources, Q.P.J.B.; Software, W.B.V.-v.d.V.; visualization, W.B.V.-v.d.V. and Q.P.J.B.; writing—original draft, K.L., W.B.V.-v.d.V. and Q.P.J.B.; writing—review & editing, K.L., W.B.V.-v.d.V. and Q.P.J.B.

Funding

This research was partially funded by The Data Science Research Programme of Leiden University, The Netherlands Organisation for Scientific Research (NWO, project nr. 275-60-008), Lorentz Center (grant nr. 17071), Erfgoed Gelderland and the Province of Gelderland.

Acknowledgments

The workflow proposed in this paper was developed based on discussions at a workshop held in July 2018 at the Lorentz Center, Leiden University (http://www.lorentzcenter.nl/lc/web/2018/1027/info.php3?wsid=1027&venue=Snellius), which brought together the different interest groups mentioned in Figure 6. We thank the Lorentz Center team and Dave Cowley, our co-host, for their help in organizing this workshop, and all participants for their valuable contributions. We are also grateful to Eva Kaptijn and Roel Kramer at Erfgoed Gelderland, and Sigrid van Roode at Provincie Gelderland for their collaboration in developing and implementing the citizen science elements of our project.

Conflicts of Interest

The authors declare no conflict of interest.

References

  1. Bennett, R.; Cowley, C.; De Laet, V. The data explosion: Tackling the taboo of automatic feature recognition in airborne survey data. Antiquity 2014, 88, 896–905. [Google Scholar] [CrossRef]
  2. Bevan, A. The data deluge. Antiquity 2015, 89, 1473–1484. [Google Scholar] [CrossRef]
  3. Cowley, D. Remote Sensing for Archaeological Heritage Management; Europae Archaeologia Consilium: Brussels, Belgium, 2011; ISBN 9789639911208. [Google Scholar]
  4. Banaszek, Ł.; Cowley, D.C.; Middleton, M. Towards national archaeological mapping. Assessing source data and methodology—A case study from Scotland. Geosciences 2018, 8, 272. [Google Scholar] [CrossRef]
  5. Corsi, C.; Slapšak, B.; Vermeulen, F. Good Practice in Archaeological Diagnostics: Non-invasive Survey of Complex Archaeological Sites; Springer: Cham, Switzerland, 2013; ISBN 9783319017839. [Google Scholar]
  6. Doneus, M. Die hinterlassene Landschaft—Prospektion und Interpretation in der Landschaftsarchäologie; Austrian Academy of Sciences: Vienna, Austria, 2013; ISBN 9783700171973. [Google Scholar]
  7. Sarris, A. Best Practices of Geoinformatic Technologies for the Mapping of Archaeological Landscapes; Archaeopress: Oxford, UK, 2015; ISBN 9781784911621. [Google Scholar]
  8. Trinks, I.; Hinterleitner, A.; Neubauer, W.; Nau, E.; Löcker, K.; Wallner, M.; Gabler, M.; Filzwieser, R.; Wilding, J.; Schiel, H.; et al. Large-area high-resolution ground-penetrating radar measurements for archaeological prospection. Archaeol. Prospect. 2018, 25, 171–195. [Google Scholar] [CrossRef]
  9. Musson, C.; Palmer, R.; Campana, S. Flights into the Past: Aerial Photography, Photo Interpretation and Mapping for Archaeology; Aerial Archaeology Research Group and Universitätsbibliothek Heidelberg: Heidelberg, Germany, 2013; ISBN 9783000444791. Available online: http://nbn-resolving.de/urn:nbn:de:bsz:16-propylaeumdok-20096 (accessed on 26 February 2019).
  10. Verhoeven, G.J. Are we there yet? A review and assessment of archaeological passive airborne optical imaging approaches in the light of landscape archaeology. Geosciences 2017, 7, 86. [Google Scholar] [CrossRef]
  11. Lillesand, T.M.; Kiefer, R.W.; Chipman, J.W. Remote Sensing and Image Interpretation, 7th ed.; Wiley: Hoboken, NJ, USA, 2015; ISBN 9781118343289. [Google Scholar]
  12. Richards, J.A. Remote Sensing Digital Image Analysis, 5th ed.; Springer: Berlin/Heidelberg, Germany, 2013; ISBN 9783642300615. [Google Scholar]
  13. Jensen, J.R. Introductory Digital Image Processing: A Remote Sensing Perspective, 4th ed.; Pearson: Glenview, IL, USA, 2015; ISBN 9780134058160. [Google Scholar]
  14. Chen, G.; Han, J. A survey on object detection in optical remote sensing images. ISPRS J. Photogramm. Remote Sens. 2016, 117, 11–18. [Google Scholar] [CrossRef]
  15. De Laet, V.; Lambers, K. Archaeological prospecting using high-resolution digital satellite imagery: Recent advances and future prospects—A session held at the Computer Applications and Quantitative Methods in Archaeology (CAA) conference, Williamsburg, USA, March 2009. AARGnews—Newsl. Aer. Archaeol. Res. Group 2009, 39, 9–17. Available online: http://nbn-resolving.de/urn:nbn:de:bsz:352-opus-100818 (accessed on 26 February 2019).
  16. Brophy, K.; Cowley, D. From the Air: Understanding Aerial Archaeology; Tempus: Stroud, UK, 2005; ISBN 9780752431307. [Google Scholar]
  17. Traviglia, A.; Cowley, D.; Lambers, K. Finding common ground: Human and computer vision in archaeological prospection. AARGnews—Newsl. Aer. Archaeol. Res. Group 2016, 53, 11–24. Available online: http://hdl.handle.net/1887/43751 (accessed on 1 October 2018).
  18. Cowley, D.C. In with the new, out with the old? Auto-extraction for remote sensing archaeology. Proc. SPIE 2012, 8532, 853206. [Google Scholar] [CrossRef]
  19. Cowley, D.C. What do the patterns mean? Archaeological distributions and bias in survey data. In Digital Methods and Remote Sensing in Archaeology: Archaeology in the Age of Sensing; Forte, M., Campana, S., Eds.; Springer: Cham, Switzerland, 2016; pp. 147–170. ISBN 9783319406565. [Google Scholar]
  20. Lambers, K.; Traviglia, A. Automated detection in remote sensing archaeology: A reading list. AARGnews—Newsl. Aer. Archaeol. Res. Group 2016, 53, 25–29. Available online: http://hdl.handle.net/1887/43750 (accessed on 26 February 2019).
  21. Lambers, K. Airborne and spaceborne remote sensing and digital image analysis in archaeology. In Digital Geoarchaeology: New Techniques for Interdisciplinary Human-Environmental Research; Siart, C., Forbriger, M., Bubenzer, O., Eds.; Springer: Cham, Switzerland, 2018; pp. 109–122. ISBN 9783319253145. [Google Scholar]
  22. De Boer, A. Using pattern recognition to search LIDAR data for archaeological sites. In The World Is in Your Eyes: Proceedings of the XXXIII Computer Applications and Quantitative Methods in Archaeology Conference (March 2005—Tomar, Portugal); Figueiredo, A., Velho, G., Eds.; CAAPortugal: Tomar, Portugal, 2007; pp. 245–254. ISBN 97898995313. [Google Scholar]
  23. Kvamme, K.L. An examination of automated archaeological feature recognition in remotely sensed imagery. In Computational Approaches to Archaeological Spaces; Bevan, A., Lake, M., Eds.; Left Coast Press: Walnut Creek, CA, USA, 2013; pp. 53–68. ISBN 9781611323467. [Google Scholar]
  24. Kvamme, K.L. Experiments in the automatic detection of archaeological features in remotely sensed data from Great Plains villages, USA. In CAA2016: Oceans of Data. Proceedings of the 44th Conference on Computer Applications and Quantitative Methods in Archaeology; Matsumoto, M., Uleberg, E., Eds.; Archaeopress: Oxford, UK, 2018; pp. 173–184. ISBN 9781784917302. [Google Scholar]
  25. Schneider, A.; Takla, M.; Nicolay, A.; Raab, A.; Raab, T. A template-matching approach combining morphometric variables for automated mapping of charcoal kiln sites. Archaeol. Prospect. 2015, 22, 45–62. [Google Scholar] [CrossRef]
  26. Schuetter, J.; Goel, P.; McCorriston, J.; Park, J.; Senn, M.; Harrower, M. Autodetection of ancient Arabian tombs in high-resolution satellite imagery. Int. J. Remote Sens. 2013, 34, 6611–6635. [Google Scholar] [CrossRef]
  27. Toumazet, J.; Vautier, F.; Roussel, E.; Dousteyssier, B. Automatic detection of complex archaeological grazing structures using airborne laser scanning data. J. Archaeol. Sci. Rep. 2017, 12, 569–579. [Google Scholar] [CrossRef]
  28. Trier, Ø.D.; Larsen, S.; Solberg, R. Automatic detection of circular structures in high-resolution satellite images of agricultural land. Archaeol. Prospect. 2009, 16, 1–15. [Google Scholar] [CrossRef]
  29. Trier, Ø.D.; Zortea, M.; Tonning, C. Automatic detection of mound structures in airborne laser scanning data. J. Archaeol. Sci. Rep. 2015, 2, 69–79. [Google Scholar] [CrossRef]
  30. Trier, Ø.D.; Pilø, L.H. Automatic detection of pit structures in airborne laser scanning data. Archaeol. Prospect. 2012, 19, 103–121. [Google Scholar] [CrossRef]
  31. D’Orazio, T.; Palumbo, F.; Guaragnella, C. Archaeological trace extraction by a local directional active contour approach. Pattern Recognit. 2012, 45, 3427–3438. [Google Scholar] [CrossRef]
  32. D’Orazio, T.; Da Pelo, P.; Marani, R.; Guaragnella, C. Automated extraction of archaeological traces by a modified variance analysis. Remote Sens. 2015, 7, 3565–3587. [Google Scholar] [CrossRef]
  33. Riley, M.A. Automated Detection of Prehistoric Conical Burial Mounds from Lidar Bare-Earth Digital Elevation Models. Master’s Thesis, Northwest Missouri State University, Maryville, MO, USA, April 2009. [Google Scholar]
  34. Zingman, I. Semi-Automated Detection of Fragmented Rectangular Structures in High Resolution Remote Sensing Images with Application in Archaeology. Ph.D. Thesis, University of Konstanz, Konstanz, Germany, 7 October 2016. Available online: http://nbn-resolving.de/urn:nbn:de:bsz:352-0-386546 (accessed on 28 September 2018).
  35. Zingman, I.; Saupe, D.; Penatti, O.A.B.; Lambers, K. Detection of fragmented rectangular enclosures in very high resolution remote sensing images. IEEE Trans. Geosci. Remote Sens. 2016, 54, 4580–4593. [Google Scholar] [CrossRef]
  36. Cerrillo-Cuenca, E. An approach to the automatic surveying of prehistoric barrows through LiDAR. Quat. Int. 2017, 435, 135–145. [Google Scholar] [CrossRef]
  37. Davis, D.S.; Sanger, M.C.; Lipo, C.P. Automated mound detection using lidar and object-based image analysis in Beaufort County, South Carolina. Southeast. Archaeol. 2018, 38, 23–37. [Google Scholar] [CrossRef]
  38. De Guio, A.; Magnini, L.; Bettineschi, C. GeOBIA approaches to remote sensing of fossil landscapes: Two case studies from Northern Italy. In Across Space and Time: Papers from the 41st Conference on Computer Applications and Quantitative Methods in Archaeology, Perth, Australia, 25–28 March 2013; Traviglia, A., Ed.; Amsterdam University Press: Amsterdam, The Netherlands, 2015; pp. 45–53. ISBN 9789089647153. [Google Scholar]
  39. De Laet, V.; Paulissen, E.; Meuleman, K.; Waelkens, M. Effects of image characteristics on the identification and extraction of archaeological features from Ikonos-2 and Quickbird-2 imagery: Case study Sagalassos (southwest Turkey). Int. J. Remote Sens. 2009, 30, 5655–5668. [Google Scholar] [CrossRef]
  40. Freeland, T.; Heung, B.; Burley, D.V.; Clark, G.; Knudby, A. Automated feature extraction for prospection and analysis of monumental earthworks from aerial LiDAR in the Kingdom of Tonga. J. Archaeol. Sci. 2016, 69, 64–74. [Google Scholar] [CrossRef]
  41. Jahjah, M.; Ulivieri, C. Automatic archaeological feature extraction from satellite VHR images. Acta Astronaut. 2010, 66, 1302–1310. [Google Scholar] [CrossRef]
  42. Kramer, I.C. An Archaeological Reaction to the Remote Sensing Data Explosion. Reviewing the Research on Semi-automated Pattern Recognition and Assessing the Potential to Integrate Artificial Intelligence. Master’s Thesis, University of Southampton, Southampton, UK, 2015. [Google Scholar]
  43. Sevara, C.; Pregesbauer, M.; Doneus, M.; Verhoeven, G.; Trinks, I. Pixel versus object—A comparison of strategies for the semi-automated mapping of archaeological features using airborne laser scanning data. J. Archaeol. Sci. Rep. 2016, 5, 485–498. [Google Scholar] [CrossRef]
  44. Caspari, G.; Balz, T.; Gang, L.; Wang, X.; Liao, M. Application of Hough Forests for the detection of grave mounds in high-resolution satellite imagery. IEEE IGARSS 2014, 906–909. [Google Scholar] [CrossRef]
  45. Guyot, A.; Hubert-Moy, L.; Lorho, T. Detecting Neolithic burial mounds from LiDAR-derived elevation data using a multi-scale approach and machine learning techniques. Remote Sens. 2018, 10, 225. [Google Scholar] [CrossRef]
  46. Menze, B.H.; Ur, J.A.; Sherrat, A.G. Detection of ancient settlement mounds: Archaeological survey based on the SRTM terrain model. Photogramm. Eng. Remote Sens. 2006, 72, 321–327. [Google Scholar] [CrossRef]
  47. Menze, B.H.; Ur, J.A. Mapping patterns of long-term settlement in Northern Mesopotamia at a large scale. Proc. Natl. Acad. Sci. USA 2012, 109, 778–787. [Google Scholar] [CrossRef]
  48. Trier, Ø.D.; Cowley, D.C.; Waldeland, A.U. Using deep neural networks on airborne laser scanning data: Results from a case study of semi-automatic mapping of archaeological topography on Arran, Scotland. Archaeol. Prospect. 2018, 1–11. [Google Scholar] [CrossRef]
  49. Trier, Ø.D.; Salberg, A.-B.; Pilø, L.H. Semi-automatic mapping of charcoal kilns from airborne laser scanning data using deep learning. In CAA2016: Oceans of Data. Proceedings of the 44th Conference on Computer Applications and Quantitative Methods in Archaeology; Matsumoto, M., Uleberg, E., Eds.; Archaeopress: Oxford, UK, 2018; pp. 219–231. ISBN 9781784917302. [Google Scholar]
  50. Verschoof-van der Vaart, W.B.; Lambers, K. Learning to look at LiDAR. The use of R-CNN in the automated detection of archaeological objects in LiDAR data from The Netherlands. J. Comput. Appl. Archaeol. 2019, 2, 31–40. [Google Scholar] [CrossRef]
  51. Ball, J.E.; Anderson, D.T.; Chan, C.S. Comprehensive survey of deep learning in remote sensing: Theories, tools, and challenges for the community. J. Appl. Remote Sens. 2017, 11, 042609. [Google Scholar] [CrossRef]
  52. Goodfellow, I.; Bengio, Y.; Courville, A. Deep Learning; MIT: Cambridge, MA, USA, 2016; ISBN 9780262035613. [Google Scholar]
  53. Krizhevsky, A.; Sutskever, I.; Hinton, G.E. ImageNet classification with deep convolutional neural networks. Adv. Neural Inf. Process. Syst. 2012, 25, 1106–1114. [Google Scholar] [CrossRef]
  54. Guo, Y.; Liu, Y.; Oerlemans, A.; Lao, S.; Wu, S.; Lew, M.S. Deep learning for visual understanding: A review. Neurocomputing 2016, 187, 27–48. [Google Scholar] [CrossRef]
  55. Castelvecchi, D. Can we open the black box of AI? Nature 2016, 538, 20–23. [Google Scholar] [CrossRef] [PubMed] [Green Version]
  56. Shoham, Y.; Perrault, R.; Brynjolfsson, E.; Clark, J. Artificial Intelligence Index—2017 Annual Report. 2017. Available online: http://cdn.aiindex.org/2017-report.pdf (accessed on 28 September 2018).
  57. Razavian, A.S.; Azizpour, H.; Sullivan, J.; Carlsson, S. CNN features off-the-shelf: An astounding baseline for recognition. IEEE CVPRW 2014, 806–813. [Google Scholar] [CrossRef]
  58. Hohl, S. Neural Network Based Image Classification in the Context of Archaeology. Master’s Thesis, Hochschule für Technik und Wirtschaft Berlin, Berlin, Germany, 29 March 2016. [Google Scholar]
  59. Berendsen, H.J.A. De Vorming van het Land. Inleiding in de Geologie en de Geomorfologie, 4th ed.; Koninklijke van Gorcum: Assen, The Netherlands, 2004; ISBN 9023240758. [Google Scholar]
  60. Doorenbosch, M. Ancestral Heaths. Reconstructing the Barrow Landscape in the Central and Southern Netherlands, 2nd ed.; Sidestone Press: Leiden, The Netherlands, 2013; ISBN 9789088901928. [Google Scholar]
  61. Bleumink, H.; Neefjes, J. Kroondomein het Loo; Matrijs: Utrecht, The Netherlands, 2010; ISBN 9789053454138. [Google Scholar]
  62. Kenzler, H.; Lambers, K. Challenges and perspectives of woodland archaeology across Europe. In Concepts, Methods and Tools. Proceedings of the 42nd Annual Conference on Computer Applications and Quantitative Methods in Archaeology; Giligny, F., Djindjian, F., Costa, L., Moscati, P., Robert, S., Eds.; Archaeopress: Oxford, UK, 2015; pp. 73–80. ISBN 9781784911003. [Google Scholar]
  63. PDOK. Available online: https://www.pdok.nl/ (accessed on 22 February 2019).
  64. Fontijn, D.R.; Bourgeois, Q.P.J.; Louwen, A. Iron Age Echoes. Prehistoric Land Management and the Creation of a Funerary Landscape—The “Twin Barrows” at the Echoput in Apeldoorn; Sidestone Press: Leiden, The Netherlands, 2012; ISBN 9789088900730. [Google Scholar]
  65. Louwen, A.; Fontijn, D.R. Death Revisited. The Excavation of Three Bronze Age Barrows and Surrounding Landscape at Apeldoorn-Wieselseweg; Sidestone Press: Leiden, The Netherlands, 2019; in press; ISBN 9789088905803. [Google Scholar]
  66. Amkreutz, L.; Bourgeois, Q.; Schreurs, J.; Vossen, N. Verstopt op de Veluwe. Speuren naar een immens ritueel landschap uit de prehistorie. Archeol. Mag. 2017, 1, 16–20. Available online: https://www.academia.edu/31941676/Verstopt_op_de_Veluwe._Speuren_naar_een_immens_ritueel_landschap_uit_de_prehistorie?auto=download (accessed on 27 February 2019).
  67. Arnoldussen, S. The fields that outlived the Celts: The use-histories of later prehistoric field systems (Celtic Fields or Raatakkers) in The Netherlands. Proc. Prehist. Soc. 2018, 84, 303–327. [Google Scholar] [CrossRef]
  68. Vletter, W.F.; van Lanen, R.J. Finding vanished routes: Applying a multi-modelling approach on lost route and path networks in the Veluwe region, The Netherlands. Rural Landsc. Soc. Environ. Hist. 2018, 5, 1–19. [Google Scholar] [CrossRef]
  69. Bourgeois, Q. Monuments on the Horizon: The Formation of the Barrow Landscape throughout the 3rd and 2nd Millennium BC; Sidestone Press: Leiden, The Netherlands, 2013; ISBN 9789088901041. [Google Scholar]
  70. Lauwerier, R.C.G.M.; Eerden, M.C.; Groenewoudt, B.J.; Lascaris, M.A.; Rensink, E.; Smit, B.I.; Speleers, B.P.; van Doesburg, J. (Eds.) Knowledge for Informed Choices. Tools for More Effective and Efficient Selection of Valuable Archaeology in The Netherlands; Nederlandse Archeologische Rapporten 55; Cultural Heritage Agency of The Netherlands: Amersfoort, The Netherlands, 2017; ISBN 9789057992773. [Google Scholar]
  71. Lambers, L.; Fassbinder, J.W.E.; Lambers, K.; Bourgeois, Q. The Iron-Age burial mounds of Epe-Niersen, The Netherlands: Results from magnetometry in the range of ±1.0 nT. In Proceedings of the 12th International Conference of Archaeological Prospection, Bradford, UK, 12–16 September 2017; Jennings, B., Gaffney, C., Sparrow, T., Gaffney, S., Eds.; Archaeopress: Oxford, UK, 2017; pp. 132–134, ISBN 978 1784916770. [Google Scholar]
  72. Crutchley, S.; Crow, P. Using Airborne Lidar in Archaeological Survey: The Light Fantastic, 2nd ed.; Historic England: Swindon, UK, 2018; Available online: https://historicengland.org.uk/images-books/publications/using-airborne-lidar-in-archaeological-survey/ (accessed on 5 September 2018).
  73. Actueel Hoogtebestand Nederland (AHN). Available online: https://ahn.arcgisonline.nl/ahnviewer/ (accessed on 22 February 2019).
  74. Hesse, R. LiDAR-derived Local Relief Models—A new tool for archaeological prospection. Archaeol. Prospect. 2010, 17, 67–72. [Google Scholar] [CrossRef]
  75. Relief Visualisation Toolbox (RVT). Available online: https://iaps.zrc-sazu.si/en/rvt#v (accessed on 26 October 2018).
  76. Kokalj, Ž.; Hesse, R. Airborne Laser Scanning Raster Data Visualization: A Guide to Good Practice; Založba ZRC: Ljubljana, Slovenia, 2017; ISBN 9789612549848. [Google Scholar]
  77. QGIS Geographic Information System. Available online: https://qgis.org (accessed on 14 February 2019).
  78. Archeologisch Informatie Systeem (ArchIS). Available online: https://archis.cultureelerfgoed.nl/#/login (accessed on 13 November 2018).
  79. Archeologisch Monumenten Register (AMR). Available online: https://cultureelerfgoed.nl/monumentenregister (accessed on 13 November 2018).
  80. Girshick, R.; Donahue, J.; Darrell, T.; Malik, J. Rich feature hierarchies for accurate object detection and semantic segmentation. IEEE CVPR 2014, 580–587. [Google Scholar] [CrossRef]
  81. Uijlings, J.R.R.; van de Sande, K.E.A.; Gevers, T.; Smeulders, A.W.M. Selective search for object recognition. Int. J. Comput. Vis. 2013, 104, 154–171. [Google Scholar] [CrossRef]
  82. Girshick, R. Fast R-CNN. IEEE ICCV 2015. [Google Scholar] [CrossRef]
  83. Ren, S.; He, K.; Girshick, R.; Sun, J. Faster R-CNN: Towards real-time object detection with regional proposal networks. IEEE TPAMI 2017, 39, 1137–1149. [Google Scholar] [CrossRef] [PubMed]
  84. Quintus, S.; Day, S.S.; Smith, N.J. The efficacy and analytical importance of manual feature extraction using lidar datasets. Adv. Archaeol. Pract. 2017, 5, 351–364. [Google Scholar] [CrossRef]
  85. Sadr, K. The impact of coder reliability on reconstructing archaeological settlement patterns from satellite imagery: A case study from South Africa. Archaeol. Prospect. 2016, 23, 45–54. [Google Scholar] [CrossRef]
  86. Curtis, V. Online Citizen Science and the Widening of Academia: Distributed Engagement with Research and Knowledge Production; Palgrave Macmillan: Cham, Switzerland, 2018; ISBN 9783319776637. [Google Scholar]
  87. Eitzel, M.V.; Cappadonna, J.L.; Santos-Lang, C.; Duerr, R.E.; Virapongse, A.; West, S.E.; Kyba, C.C.M.; Bowser, A.; Cooper, C.B.; Sforzi, A.; et al. Citizen science terminology matters: Exploring key terms. Citiz. Sci. Theory Pract. 2017, 2, 1–20. [Google Scholar] [CrossRef]
  88. Van den Dries, M. Community archaeology in The Netherlands. J. Community Archaeol. Herit. 2014, 1, 68–88. [Google Scholar] [CrossRef]
  89. Smith, M.L. Citizen science in archaeology. Am. Antiq. 2014, 79, 749–762. [Google Scholar] [CrossRef]
  90. GlobalXplorer. Available online: https://www.globalxplorer.org/ (accessed on 22 February 2019).
  91. FossilFinder. Available online: http://fossilfinder.org/ (accessed on 22 February 2019).
  92. Lin, A.Y.-M.; Huynh, A.; Lanckriet, G.; Barrington, L. Crowdsourcing the unknown: The satellite search for Genghis Khan. PLoS ONE 2014, 9, e114046. [Google Scholar] [CrossRef] [PubMed]
  93. Duckers, G.L. Bridging the “geospatial divide” in archaeology: Community based interpretation of LiDAR data. Internet Archaeol. 2013, 35. [Google Scholar] [CrossRef]
  94. West, S.; Pateman, R. Recruiting and retaining participants in citizen science: What can be learned from the volunteering literature? Citiz. Sci. Theory Pract. 2016, 1, 15. [Google Scholar] [CrossRef]
  95. Wald, D.M.; Longo, J.; Dobell, A.R. Design principles for engaging and retaining virtual citizen scientists. Conserv. Biol. 2016, 30, 562–570. [Google Scholar] [CrossRef]
  96. Conrad, C.C.; Hilchey, K.G. A review of citizen science and community-based environmental monitoring: Issues and opportunities. Environ. Monit. Assess. 2011, 176, 273–291. [Google Scholar] [CrossRef]
  97. Lintott, C.J.; Schawinski, K.; Slosar, A.; Land, K.; Bamford, S.; Thomas, D.; Raddick, M.J.; Nichol, R.C.; Szalay, A.; Andreescu, D.; et al. Galaxy Zoo: Morphologies derived from visual inspection of galaxies from the Sloan Digital Sky Survey. Mon. Not. R. Astron. Soc. 2008, 389, 1179–1189. [Google Scholar] [CrossRef]
  98. Hulst, R.S. Het Romeins Marskamp bij Ermelo; Matrijs: Utrecht, The Netherlands, 2007; ISBN 9789053453315. [Google Scholar]
  99. The Zooniverse. Available online: https://www.zooniverse.org/ (accessed on 25 February 2019).
  100. Heritage Quest. Available online: https://www.zooniverse.org/projects/evakap/heritage-quest (accessed on 25 February 2019).
  101. Lyman, R.L.; Van Pool, T.L. Metric data in archaeology: A study of intra-analyst and inter-analyst variation. Am. Antiq. 2009, 74, 485–504. [Google Scholar] [CrossRef]
  102. Protocol 4003, Field Survey IVO (Soil). Available online: https://www.sikb.nl/doc/BRL4000/Protocol%204003%20Inventariserend%20VeldOnderzoek-lb%204_1.pdf (accessed on 19 February 2019).
  103. Casana, J. Regional-scale archaeological remote sensing in the age of big data: Automated site discovery vs. brute force methods. Adv. Archaeol. Pract. 2014, 2, 222–233. [Google Scholar] [CrossRef]
  104. Hesse, R. The changing picture of archaeological landscapes: Lidar prospection over very large areas as part of a cultural heritage strategy. In Interpreting Archaeological Topography: 3D Data, Visualisation and Observation; Opitz, R.S., Cowley, D.C., Eds.; Oxbow: Oxford, UK, 2013; pp. 171–183. ISBN 9781842175163. [Google Scholar]
  105. Risbøl, O. Cultivating the ‘wilderness’—How lidar can improve archaeological landscape understanding. In Interpreting Archaeological Topography: 3D Data, Visualisation and Observation; Opitz, R.S., Cowley, D.C., Eds.; Oxbow: Oxford, UK, 2013; pp. 51–62. ISBN 9781842175163. [Google Scholar]
  106. ImageNet Large Scale Visual Recognition Challenge (ILSVRC). Available online: http://www.image-net.org/challenges/LSVRC/ (accessed on 26 February 2019).
  107. Sullivan, D.P.; Winsnes, C.F.; Åkesson, L.; Hjelmare, M.; Wiking, M.; Schutten, R.; Campbell, L.; Leifsson, H.; Rhodes, S.; Nordgren, A.; et al. Deep learning is combined with massive-scale citizen science to improve large-scale image classification. Nat. Biotechnol. 2018, 36, 820–828. [Google Scholar] [CrossRef]
  108. Keshavan, A.; Yeatman, J.; Rokem, A. Combining Citizen Science and Deep Learning to Amplify Expertise in Neuroimaging. 2018. Available online: https://www.biorxiv.org/content/early/2018/07/06/363382.full.pdf (accessed on 26 February 2019).
  109. Willi, M.; Pitman, R.T.; Cardoso, A.W.; Locke, C.; Swanson, A.; Boyer, A.; Veldthuis, M.; Fortson, L. Identifying animal species in camera trap images using deep learning and citizen science. Methods Ecol. Evol. 2019, 10, 80–91. [Google Scholar] [CrossRef]
  110. Kermit, M.; Reksten, J.H.; Trier, Ø.D. Towards a national infrastructure for semi-automatic mapping of cultural heritage in Norway. In CAA2016: Oceans of Data. Proceedings of the 44th Conference on Computer Applications and Quantitative Methods in Archaeology; Matsumoto, M., Uleberg, E., Eds.; Archaeopress: Oxford, UK, 2018; pp. 159–172. ISBN 9781784917302. [Google Scholar]
  111. Opitz, R.; Herrmann, J. Recent trends and long-standing problems in archaeological remote sensing. J. Comput. Appl. Archaeol. 2018, 1, 19–41. [Google Scholar] [CrossRef]
  112. Lambers, K. The Geoglyphs of Palpa, Peru: Documentation, Analysis, and Interpretation; Linden Soft: Aichwald, Germany, 2006; ISBN 9783929290325. [Google Scholar]
  113. Sauerbier, M. GIS-Based Management and Analysis of the Geoglyphs in the Palpa Region; Institute of Geodesy and Photogrammetry, ETH Zurich: Zurich, Switzerland, 2009; ISBN 9783906467856. [Google Scholar]
  114. Lambers, K.; Zingman, I. Towards detection of archaeological objects in high-resolution remotely sensed images: The Silvretta case study. In Archaeology of the Digital Era, Volume II. e-Papers from the 40th Conference of Computer Applications and Quantitative Methods in Archaeology (CAA), Southampton, 26–30 March 2012; Earl, G., Sly, T., Chrysanthi, A., Murrieta-Flores, P., Papadopoulos, C., Romanowska, I., Wheatley, D., Eds.; Amsterdam University Press: Amsterdam, The Netherlands, 2013; pp. 781–791. ISBN 9789048527281. [Google Scholar]
  115. Evans, D. Airborne laser scanning as a method for exploring long-term socio-ecological dynamics in Cambodia. J. Archaeol. Sci. 2016, 74, 164–175. [Google Scholar] [CrossRef] [Green Version]
Figure 1. Classification of research on archaeological object detection in remotely sensed data, following Reference [14].
Remotesensing 11 00794 g001
Figure 2. The research area on a height model of The Netherlands (source of the background image and height model: Reference [63]; coordinates in Amersfoort/RD New, EPSG: 28992).
Remotesensing 11 00794 g002
Figure 3. Recent barrow excavation at Apeldoorn—Echoput (Source: Reference [64]).
Remotesensing 11 00794 g003
Figure 4. Sample of LiDAR data (source: Reference [63]; coordinates in Amersfoort/RD New, EPSG: 28992), visualized with Simple Local Relief Model, from the research area, showing a potential new barrow (red) and charcoal kilns (blue) amidst a Celtic field (white checkerboard pattern).
Remotesensing 11 00794 g004
Figure 5. Simplified representation of WODAN (Workflow for Object Detection of Archaeology in The Netherlands; for a comprehensive overview see Reference [50]).
Remotesensing 11 00794 g005
Figure 6. The integrated approach as proposed in this paper with colors depicting the involvement of different interest groups (see box on right).
Remotesensing 11 00794 g006
Figure 7. Classifying archaeological objects in LiDAR images in the Heritage Quest project [100].
Remotesensing 11 00794 g007
Figure 8. The validation of a new potential barrow through hand corings in early 2019, from left to right: R. Kramer (Erfgoed Gelderland), M. Wispelwey (Samenwerkingsverband Noord Veluwe), G. Scheltema (Archeologische Werkgroep Nederland), Q.P.J. Bourgeois (Leiden University), W.B. Verschoof-van der Vaart (Leiden University), and K. Lambers (Leiden University) (Photograph by E. Kaptijn (Erfgoed Gelderland)).
Remotesensing 11 00794 g008

