Case Report

An Agricultural Drought Index for Assessing Droughts Using a Water Balance Method: A Case Study in Jilin Province, Northeast China

1
College of Geo-exploration Science and Technology, Jilin University, Changchun 130026, China
2
British Geological Survey, Keyworth, Nottingham NG12 5GG, UK
*
Author to whom correspondence should be addressed.
Submission received: 25 February 2019 / Revised: 19 April 2019 / Accepted: 25 April 2019 / Published: 6 May 2019

Abstract

:
Drought, which causes the economic, social, and environmental losses, also threatens food security worldwide. In this study, we developed a vegetation-soil water deficit (VSWD) method to better assess agricultural droughts. The VSWD method considers precipitation, potential evapotranspiration (PET) and soil moisture. The soil moisture from different soil layers was compared with the in situ drought indices to select the appropriate depths for calculating soil moisture during growing seasons. The VSWD method and other indices for assessing the agricultural droughts, i.e., Scaled Drought Condition Index (SDCI), Vegetation Health Index (VHI) and Temperature Vegetation Dryness Index (TVDI), were compared with the in situ and multi-scales of Standardized Precipitation Evapotranspiration Index (SPEIs). The results show that the VSWD method has better performance than SDCI, VHI, and TVDI. Based on the drought events collected from field sampling, it is found that the VSWD method can better distinguish the severities of agricultural droughts than other indices mentioned here. Moreover, the performances of VSWD, SPEIs, SDCI and VHI in the major historical drought events recorded in the study area show that VSWD has generated the most sensible results than others. However, the limitation of the VSWD method is also discussed.

1. Introduction

Drought is considered as a devastating hazard that causes serious agricultural, ecological and socio-economic impacts worldwide [1,2,3,4]. Fundamentally, the drought can be defined as temporarily different levels of inadequate water supply relative to the long-term average conditions [5,6]. Although the damages of drought are well documented, there is no unified definition of droughts [7]. From different points of view, droughts have been divided into four categories, i.e., meteorological, agricultural, hydrological, and social and economic drought [2,3,7,8,9]. However, we focused on the agricultural droughts in this study.
Agricultural droughts are often associated with the shortage of precipitation and inadequate soil water supply [10,11,12,13]. For example, the occurrence of abnormal dry meteorological conditions leads to the destruction of water balance, thus causing the expansion of arid areas and the aggravation of droughts [14,15,16,17,18]. It is necessary to calculate the difference between the amount of water supply and demand for drought assessment. For example, over the last few decades, different index methods have been developed based on the different combinations of precipitation, soil moisture, temperature, and vegetation factors, to calculate different indices and assess the agricultural drought [19,20,21,22,23].
The earliest drought indices developed consider the long-term precipitation and temperature [24]. Precipitation is the main input in many indices, such as the Precipitation Percentile, Standardised Precipitation Index (SPI), and Precipitation Percent Normal [25,26,27,28,29,30]. The Standardised Precipitation-Evapotranspiration Index (SPEI) was developed by considering the climatic water balance and standardising the difference between precipitation (water supply) and potential evapotranspiration (water demand) [3,10,31,32]. Although SPEI has been widely recognised and used, it does not consider the water balance in the soils and cannot represent the real moisture deficit caused by the imbalance between water supply and demand in the soil system [23,32,33]. Generally, most of the existing drought assessment indices, which are statistical methods using the long-term difference between the precipitation and potential evapotranspiration (PET), cannot represent the processes that lead to the crop water shortage [10].
Since the soil moisture is closely linked to agricultural droughts, it has been used to conceptualise the available water for crops when developing agricultural drought indices [34]. For example, some agricultural drought indices define the drought event as the deviation of the soil water balance from the normal levels, e.g., the Palmer Drought Severity Index (PDSI), Crop Moisture Index (CMI) [14], and Self-Calibrating PDSI (SC-PDSI). The basis of the PDSI is the difference between the actual precipitation and the amount of the precipitation required for crop growth under suitable conditions [35]. Although the PDSI has been widely used, it is incomparable between different climate regions [36,37].
In the last few decades, more and more drought indices have been using remote sensing data [24], which provide useful information on the spatial and temporal distribution of droughts [2]. A series of indices extracted from remote sensing data have been established to monitor and evaluate the drought conditions, and most of these indices are based on long-term atmospheric and remote sensing data, including the vegetation information, e.g., Normalized Difference Vegetation Index (NDVI), Leaf Area Index (LAI) and Ratio Vegetation Index (RVI) [11]. Among those indices, the Vegetation Condition Index (VCI) [38,39], Temperature Condition Index (TCI) [40] have been used to monitor agricultural droughts. Some indices, such as the Vegetation Health Index (VHI) [1,38], have been developed by combining VCI and TCI using a linear weighted method, while some indices were developed to assess the agricultural drought based on the relationship between the vegetation indices (VIs) and land surface temperature (LST), such as the Temperature Vegetation Dryness Index (TVDI) [41] and Vegetation Supply Water Index (VSWI) [42]. With the increasing popularity of water series satellite data and global satellite based soil moisture data [11,43], the Precipitation Condition Index (PCI) and Soil Moisture Condition Index (SMCI) [44] were developed to evaluate agricultural droughts [7]. For example, the Scaled Drought Condition Index (SDCI) combines the PCI, TCI and VCI using empirical weights 0.5, 0.25 and 0.25, while the Synthesized Drought Index (SDI) was developed to assess the comprehensive drought by combining VCI, TCI and PCI based on the principal component method [2]. Based on the constrained optimisation method [7], the Optimised Vegetation Drought Index (OVDI) was developed to assess the agricultural droughts, by combining VCI, TCI, PCI and SMCI. Although these indices can qualitatively describe the severities of droughts by considering the factors of precipitation, the soil moisture, temperature and vegetation indices, they cannot clearly represent the physical mechanisms of drought development, such as the water supply and demand relationship between atmosphere, soil and vegetation [2,7,23,32,38,39]. Moreover, some of agricultural drought indices, such as the SWD index [45], Soil Water Deficit Index (SWDI) [46], and the Modified Soil Water Deficit Index (MSWDI) [33], consider the deficit of the soil moisture, but they either consider only soil water content, or just take into account the water supply and demand relationship between the soil water and PET [47,48].
Droughts, which are caused by multi-factors, such as precipitation, soil moisture and PET, should be assessed by considering the relevant factors/processes as much as possible when datasets required are available [49]. However, the existing agricultural droughts were assessed by considering either precipitation or soil moisture, or combining precipitation or soil moisture with PET. Therefore, it is necessary to develop a method to better assess agricultural droughts by considering precipitation, soil moisture and PET all together.
This study aims to develop a comprehensive agricultural drought index, named the Vegetation-Soil Water Deficit (VSWD), based on the water balance method, using multi-source remote sensing data, soil moisture datasets from Global Land Data Assimilation System-Noah-simulated (GLDAS-Noah) to better assess/monitor agricultural droughts. The VSWD method involves the parameters of precipitation, PET, and soil moisture derived from TRMM, Moderate Resolution Imaging Spectroradiometer (MODIS), and GLDAS. In order to test the performance of the VSWD method at the regional scale, VSWD and three other drought indices (SDCI, VHI and TVDI) were calculated and compared with the in situ index SPEI. The soil moisture at different depths was compared with the SPEI, PDSI and SC-PDSI to select the most reasonable data source for the VSWD method. Finally, the performances of VSWD, SPEIs, SDCI and VHI were evaluated and discussed using the major historical drought events recorded.

2. Materials and Method

2.1. Study Area

Jilin Province is located in the Northeast of China (40°52′–46°18′N, 121°38′–131°19′E) and covers an area of 187,400 Km2 (Figure 1a). The study area, which has a northwest-facing slope, is separated by the central Black Mountain into two major landforms, i.e., the eastern mountains, and plains at the central and western parts of Jilin Province (Figure 1b). The study area belongs to the typical temperate continental monsoon climate and has seasonal variations and regional differences in temperature, precipitation, wind and other meteorological conditions. The average annual precipitation of Jilin Province ranges from 400 mm to 1000 mm. The main crop type in the study area is the summer maize, of which the growth period is from May to September.
In the last decade, drought has been the most common natural disaster in Northeast China, leading to severe water shortages, ecological environment deterioration and adverse socio-economic impacts. More and more extreme drought events that happened during 2008–2016 have caused great agricultural losses [50,51,52,53].

2.2. Datasets

2.2.1. In Situ Reference Data and Drought Indices

The data of total monthly precipitation, sunshine hours and monthly mean temperature from 1961 to 2010 were downloaded from the data sharing service system of the National Meteorological Centre of China Meteorological Administration (NMCCMA). (http://cdc.cma.gov.cn/index.jsp). The weather data (May to September) during a ten-year period (2008–2017) from 26 weather stations (Figure 1b) were used in this study.
The indices of PDSI, SC-PDSI and SPEI were calculated in this study to help identify the best soil moisture data for developing VSWD and to evaluate the performance of the VSWD method. The PDSI is defined as the difference between the actual precipitation and ideal precipitation, which is calculated using the air temperature, runoff data and available water capacity (AWC) [14,32,35,54]. The PDSI, which has been applied to monitoring the long-term drought successfully using a water balance model, can reflect the changes of water demand [55]. The PDSI and SC-PDSI were calculated using the PDSI program developed by Wells [35].
The SPEI is defined as the difference between the precipitation and potential evapotranspiration (PET) [33]. In this study, the SPEI was calculated using the SPEI calculator developed by Beguería and Vicente Serrano [33], based on the monthly temperature and precipitation. Since the time scales of one-month (SPEI-1), three-months (SPEI-3) and six-months (SPEI-6) are generally adopted as references for evaluating the meteorological and agricultural droughts [56], we compared the VSWD method with SPEIs at three temporal scales conventionally in Section 3.3.

2.2.2. Remote Sensing Data

The Potential Evapotranspiration (PET)
The PET data from Aqua MODIS (Moderate Resolution Imaging Spectroradiometer) were used in this study. The eight-day product with the 1 km resolution (MYD16A2, collection v005) was obtained using the Wget tools for two tiles (h26v05, h27v05) covering the whole study area, and mosaicked and projected using the MODIS Re-projection Tool. The PET from May to September during 2008–2017 was adopted in this study (Figure 2a).
Precipitation
The Tropical Rainfall Measuring Mission (TRMM) is a joint mission built for the weather and climate research; and the monthly rainfall data were from the product TRMM 3B43 (Figure 2b). The data from 2008 to 2016 during the growth season (May to September) were obtained via the Wget tools from GES DISC (https://disc2.gesdisc.eosdis.nasa.gov/data/TRMM_L3/TRMM_3B43.7). The precipitation data was given as the monthly precipitation rate (mm/h) in the spatial resolution of 0.25° and 0.1°. In this study, we chose the spatial resolution of 0.25° to match that of the soil moisture products.

2.2.3. Soil Moisture

The GLDAS project, which combines the satellite data and ground-based measurements, takes advantage of the progressive land surface model and data assimilation technique to produce optimal fields for land surface conditions and fluxes (https://ldas.gsfc.nasa.gov/gldas/) [57]. The project has achieved a lot of meteorological data, parameter maps, and outputs, which includes 0.1° and 0.25° resolution simulations of the Noah, CLM, VIC, and Mosaic land surface models from 1979 to the present. GLDAS provides the soil moisture products in four layers: 0–10 cm, 10–40 cm, 40–100 cm, and 100–200 cm. Since the main crop in Jilin is the summer maize and 80% of the root distribution in the depth of 0–40 cm [58], we obtained the soil moisture datasets with 0–10 cm and 10–40 cm from the GLDAS 2.1 NOAH model with 0.25° × 0.25° between 2008–2016 during the growth season (May to September) (Figure 2c,d).

2.2.4. Field Drought Event Records

Drought event (disaster) records containing the information on the location and severity of the disaster were collected during the crop growth period in 2016 across the Jilin Province. We selected 95 points with detailed information on the disaster occurred to verify the effectiveness of VSWD (Figure 1b). The pictures of the field drought event data, which reveal the actual growth of the crop during the field investigation, demonstrate four severities of agricultural droughts, i.e., no drought, slightly affected, moderately affected, severely affected (Figure 3). The severities of the disaster at the sampling points were judged based on the assessment of agricultural experts. Prior to undertaking field sampling, we carefully designed the sampling plan based on the information on agricultural drought events, including the disaster locations and severities, provided by the local agricultural insurance companies. For example, sampling sites designed should cover different disaster severities in the Jilin Province.

2.3. Data Pre-Processing

Since the spatio-temporal scales of the three types of datasets are inconsistent and cannot be used directly, the TRMM data was converted to the monthly average precipitation (mm/month). The PET data extracted from the MODIS eight-day composite product were aggregated into monthly data based on the weight value of the eight-day product in the data-processing month. The unit of soil moisture product from GLDAS is kg/m2, it needs to be converted into soil water content using Equation (1). The spatial resolution of the soil moisture data from GLDAS, TRMM, MODIS and SBD were re-sampled to 1 km with the spatial projection of UTM 51 using the IDW interpolation method.
S = Raw   data ρ w a t e r
where S represents the soil water content, the unit is mm; Raw   data represents the soil moisture data extracted from the GLDAS product; where the unit is kg / m 2 , and ρ w a t e r is the density of water, the unit is g / cm 3 .

2.4. Methodology

2.4.1. Vegetation-Soil Water Deficit (VSWD)

The VSWD method developed in this study is different from other drought index methods in that it considers precipitation, soil moisture content and PET, which all play important roles in the occurrence of drought events. Theoretically, the VSWD method can produce more reasonable results by considering more factors; and the verification of the performance of VSWD is covered in the section of results and discussions.
In order to prove whether VSWD is effective in different humidity conditions, three regions of the study area were chosen, i.e., Baicheng (BC), Changchun (CC), and Yanbian (YB). From the northwest to the southeast of the Jilin province, the average annual cumulative precipitation (Figure 4a) vary from 384 mm to 926 mm, and the difference of the annual cumulative PET (Figure 4b) is as high as 100 mm approximately. Based on the data from 26 meteorological stations (1961–2008), the long-term difference between the precipitation and PET (Figure 4c) were calculated to help better understand the supply and demand relationship across the study area. The lack of precipitation and high PET have made the central and western parts of Jilin Province a region with frequent droughts (Figure 4b–d).
The values of VSWD from different regions vary greatly due to the climate differences between these areas, thus making it difficult to compare these VSWD values directly. Therefore, a long-term average VSWD value was introduced to calculate the deviation of the monthly VSWD value of a region from this long-term average value Equation (2):
VSWD = V S W D i j = 1 N VSWD j N
where V S W D i indicates the amount of water required to meet the demand of crop growth in the current month. The calculation of V S W D i is expressed in Equation (3). i represents the month number, which changes from May to September; j represents the year of studying and changes from 2008–2017; and N stands for the total number of calculation years (10 years in this study).
V S W D i = P i + ρ S i PET i
where P i represents the precipitation data in the current month extracted from TRMM; S i is the soil water content in the current month calculated with Equations (1) and (5); and PET i represents the potential evapotranspiration in the current month extracted from MOD16A2. ρ is the depletion factor, which is a function of the evaporation power of the atmosphere [59], representing the amount of water that the crops can extract from the soil before entering in stress. In this study, the current soil water content is treated as the total available water; and ρ can be calculated using Equation (4).
ρ = ρ F A O + 0.04   ( 5 E T c )
where   ρ F A O is the value of the depletion factor presented in Table 22 of the FAO 56 method [54]; E T c represents the actual evapotranspiration (mm/day). In this study, the E T c data were extracted from the actual evapotranspiration product ET of MODIS.

2.4.2. Selection of Soil Moisture

Soil water content data collected from the GLDAS soil water content products were stratified for different crop growth stages. The root depth of crops increases during crop growing seasons, thus changing the main root zones that crops can extract water from. However, it is difficult to determine the root depths in different months. But some evidence showed that although the maximum root depth of crops (maize that is the main crop in Jilin) can be up to 1–2 m during the whole growth period, eighty percent of the roots are distributed in the depth of 0–40 cm [58]. Therefore, the 0–40 cm soil was regarded as the major water source for crop growth. Since the GLDAS product provides the soil moisture in four layers, i.e., 0–10 cm, 10–40 cm, 40–100 cm, and 100–200 cm, the former two layers were used in this study to represent the available water in the top 40 cm soils. Moreover, when the root grows to a certain extent and its main water supply does not come from a single layer, it may not be accurate to simply use the water in the 0–10 cm or 10–40 cm soil layers as the soil water supply, so an extra soil layer (S0–40) was conceptualised using the average value of the 0–10 cm and 10–40 cm soil layers. In order to know the main water supply layer in different months, the soil water content of 0–10 cm, 10–40 cm, and the average weighted results of 0–10 cm and 10–40 cm were compared with the in situ drought indices, i.e., SPEIs, PDSI, SC-PDSI. The results have been shown in Table 1. According to the results, the suitable soil water contents of different soil depths in different months were chosen. Therefore, the soil water content can be calculated using Equation (5).
S i = { S May = S 0 10 S Jun Aug = ( S 0 10 + S 10 40 ) S Sep = S 10 40 / 2 = ( S 0 40 )
where S i represents the soil moisture content in different months; i represents the month number, which changes from May to September; S 0 10 and S 10 40 represent the soil water content of 0–10 cm and 10–40 cm layers from GLDAS; and S 0 40 represents the soil water content of a conceptualised soil layer calculated with the average value of S 0 10 and S 10 40 .

2.4.3. Statistical Metrics

To quantify and compare the performance of the VSWD with other drought indices and to help choose the appropriate depth of the soil moisture for different crop growing seasons, the statistical metrics were adopted for the evaluation. The Pearson correlation coefficient ( P X , Y ) was used to test the correlation between the drought indices (VSWD, SDCI, VHI) and SPEIs, and to test the correlation between the soil water and in situ drought indices at different depths in different months. The calculation formula of the Pearson correlation coefficient is as follows Equation (6):
P X , Y = C o v ( X , Y ) V a r ( X ) V a r ( Y )
where X , Y represent two variables for comparison; C o v represents the covariance of X and Y ; and V a r represents the variance of X or Y .

3. Results and Discussions

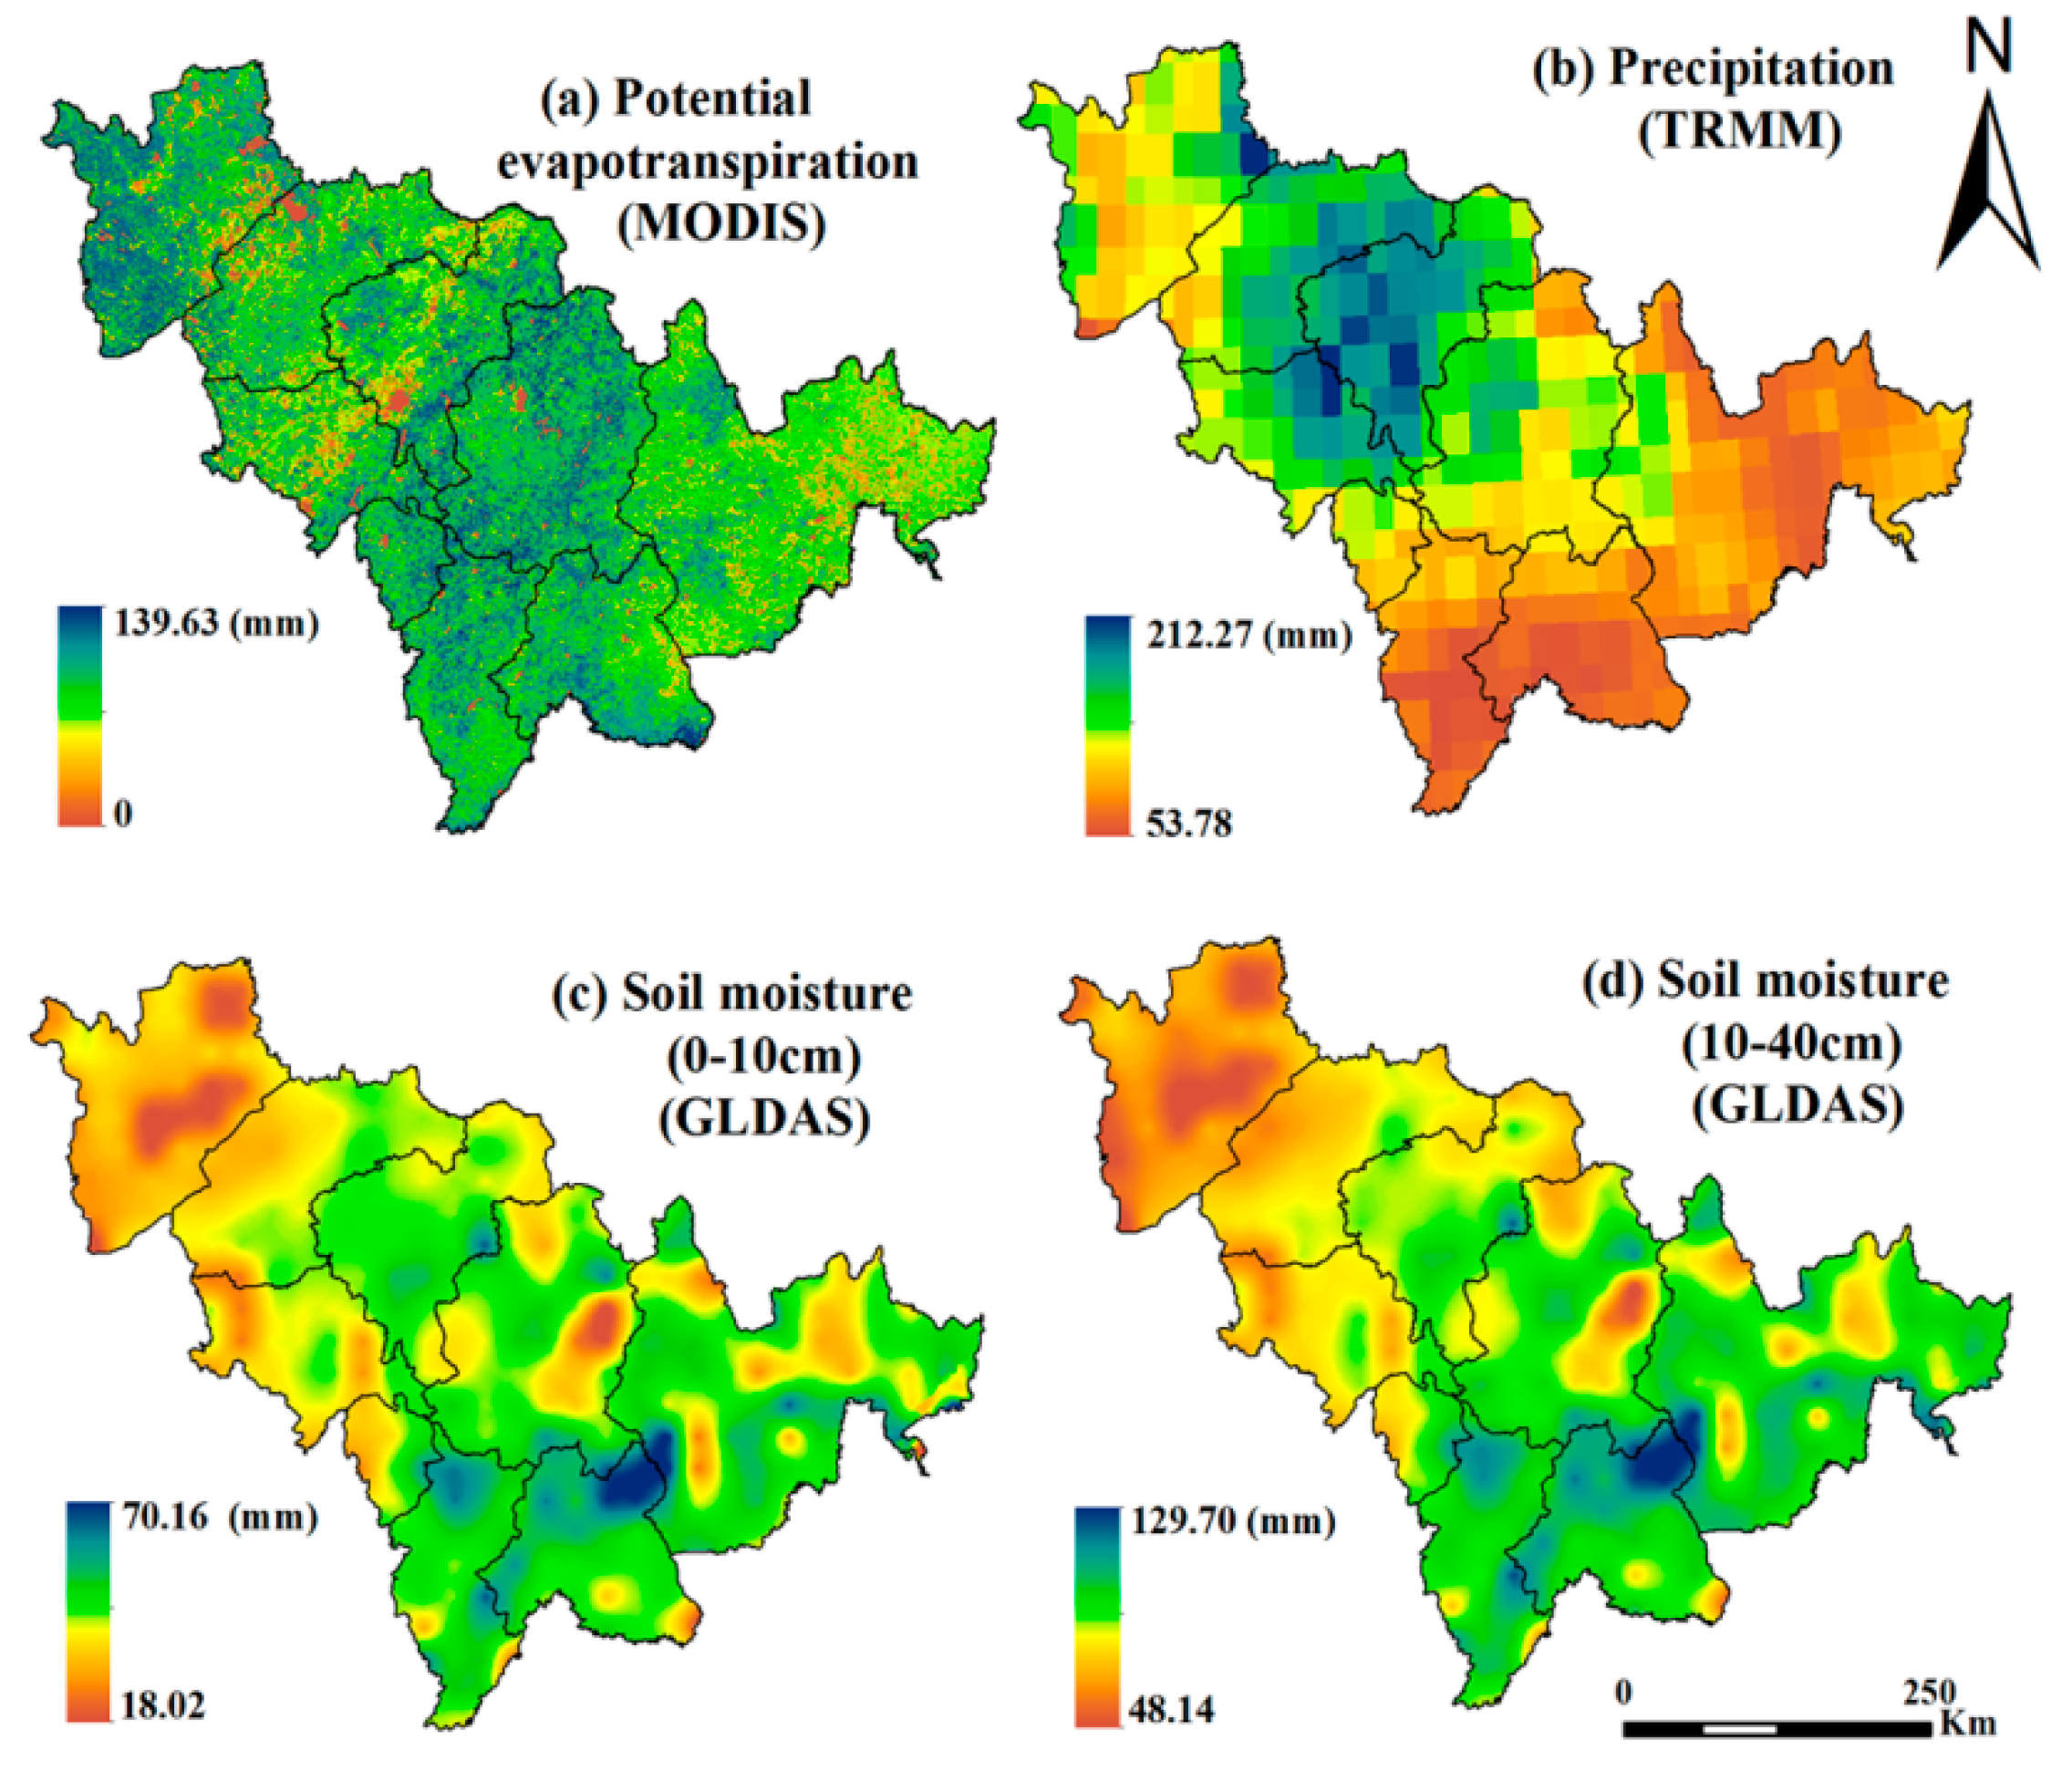
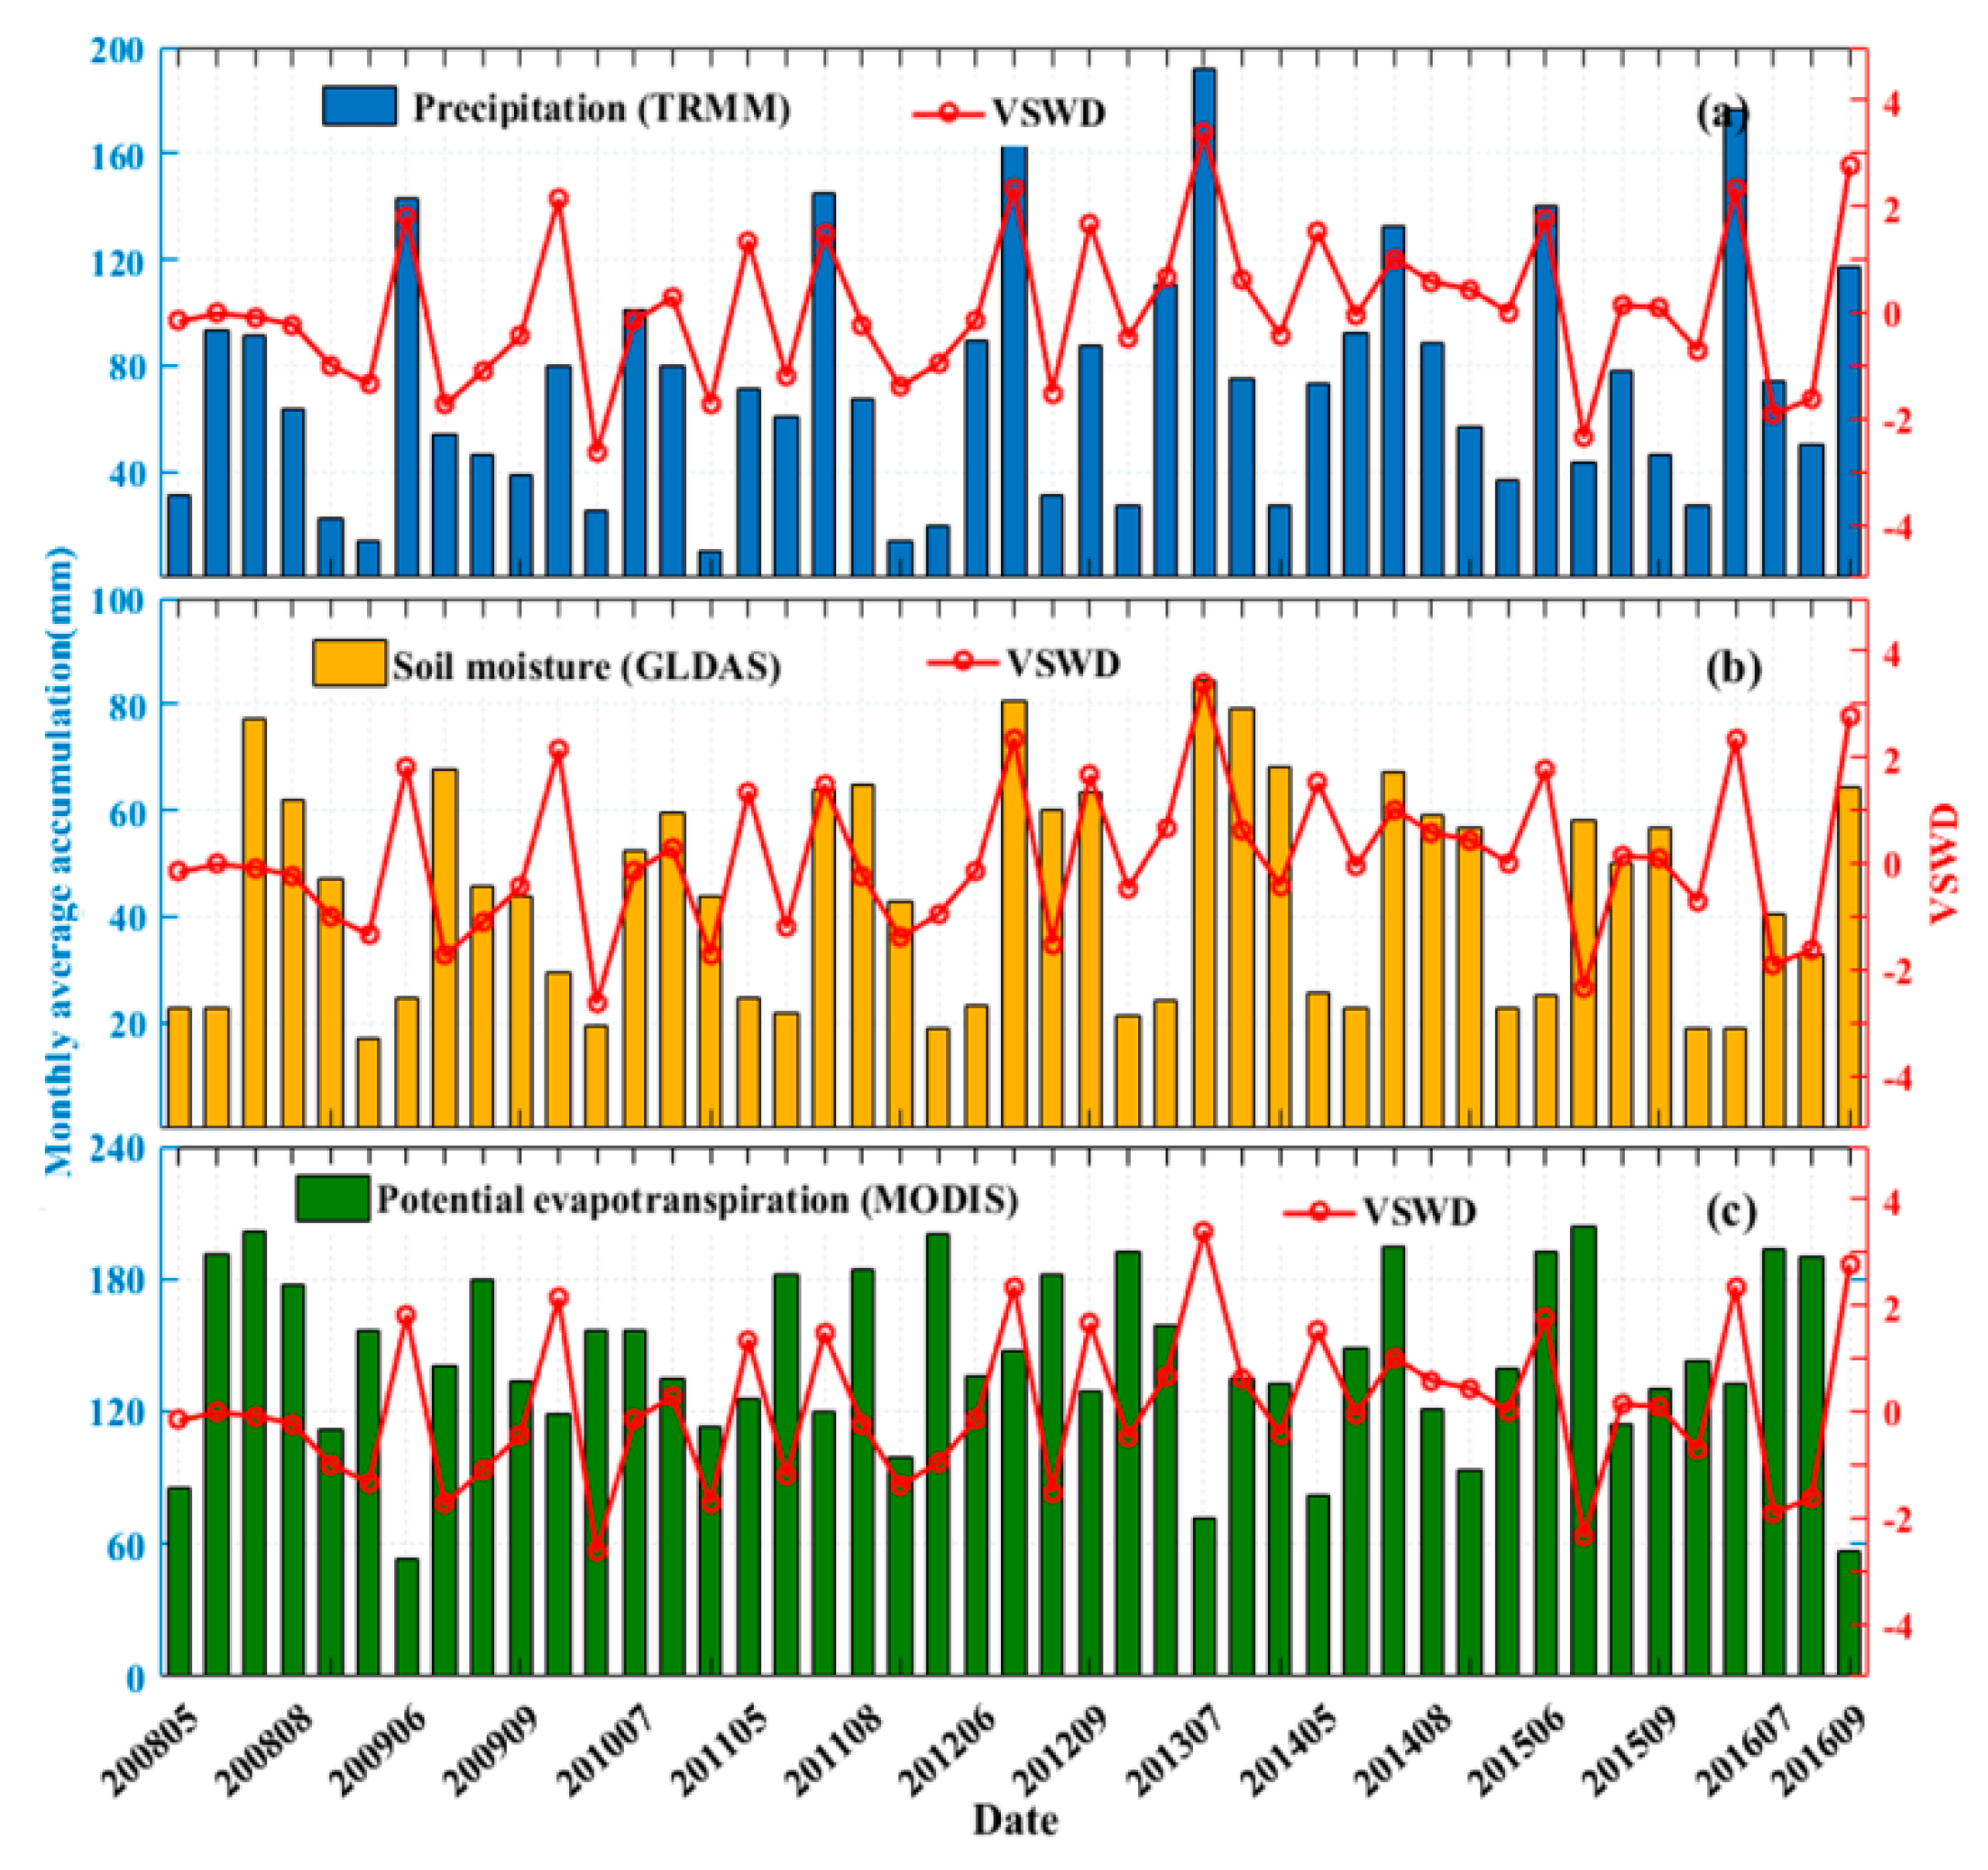
3.1. Spatio-Temporal Characterisation of Drought Using VSWD

The spatio-temporal distributions of droughts in the study area were compared and analysed (Figure 5, Figure 6 and Figure 7). The monthly time series of the VSWD values reflect the inter-annual variations of the vegetation-soil water deficits during the growth period from 2008 to 2016 at three regions (Figure 5). There is no significant law indicating when and where the drought happens, as it can occur at any time during the whole growth period due to its abruptness and uncertainty. There are certain differences among these drought indices in the occurrence, duration and extent of droughts in three regions. However, during a drought year, all indices show an obvious drought event in all three regions, such as August of 2009, June of 2010 and July of 2016. Additionally, there is always a crest followed by a trough, suggesting that droughts tend to occur after flooding. This may be because the soil moisture retention capacity declines when the surface vegetation is destroyed by floods, thus more likely leading to droughts [60,61].
Moreover, the VSWD values were compared with precipitation, soil moisture, and PET respectively (Figure 6). Regarding the significant drought event in June 2010, it can be found that the precipitation and soil moisture in that month were at low levels, but the PET was high. This means that it is difficult to satisfy the crop water demand, thereby leading to a drought event at that time. It is worth noting that there was no sign of drought in the month before June when the study area was in a relatively humid state though, indicating the uncertainty of the drought events. In the drought event in July 2015, the soil moisture was relatively higher than the average level, but the lack of precipitation and high water demand have led to the occurrence of drought. The occurrences of droughts in the two examples above indicate that the drought event is more related to the precipitation than the soil moisture and PET. However, the drought assessment cannot depend only on the precipitation or soil moisture; and it is necessary to calculate the relationship of the water supply and demand considering precipitation, PET and soil moisture all together to better assess the droughts.
The spatial distribution of the drought in Jilin evaluated by the VSWD method in 2016 is presented in Figure 7, which shows the evolution of the drought during the crop growth period. The southeast and northwest ends of the Jilin Province showed a small range of mild drought in May when crops are usually shown in the study area. This may be caused by the scarce precipitation during the first few months of 2016. Then, the range of drought expanded when the crops began to grow fast and their water demand increased in June. The droughts almost covered the whole Jilin Province during July and August; and this may be caused by insufficient precipitation, high evapotranspiration due to the rising temperature and the increasing crop water demand. In September, the drought situation was alleviated in the Jilin Province except for the northwest of Baicheng where the droughts continued.

3.2. Validating Indices Using Field Sampling Disaster Records

In this section, we verified the results of indices using the disaster records collected from the field sampling. Based on the locations and severities of disaster records, the values of VSWD, TVDI, SDCI and VHI were extracted at the drought event locations and then grouped under different drought severities to calculate the average value of each index for each group (Figure 8).
According to the methods of VSWD, SDCI, and VHI, smaller values indicate worse drought severities; and theoretically, their average indices at the ‘severe’ drought event should have the lowest value, while the average ‘no drought’ indices have the highest value. In contrast, higher TVDI values represent worse drought severities. Therefore, the downward trend of the index values in Figure 8 would be ideal for VSWD, SDCI and VHI, while TVDI should have an upward trend.
Figure 8 shows that only VSWD has an ideal index value trend, implying that this new method developed in this study can well distinguish drought severities. But this cannot be achieved by other indices. For example, the TVDI value for ‘mild’ drought events is even higher than ‘moderate’ ones, thereby indicating that the TVDI values should not be used to indicate the drought severities in the study area.

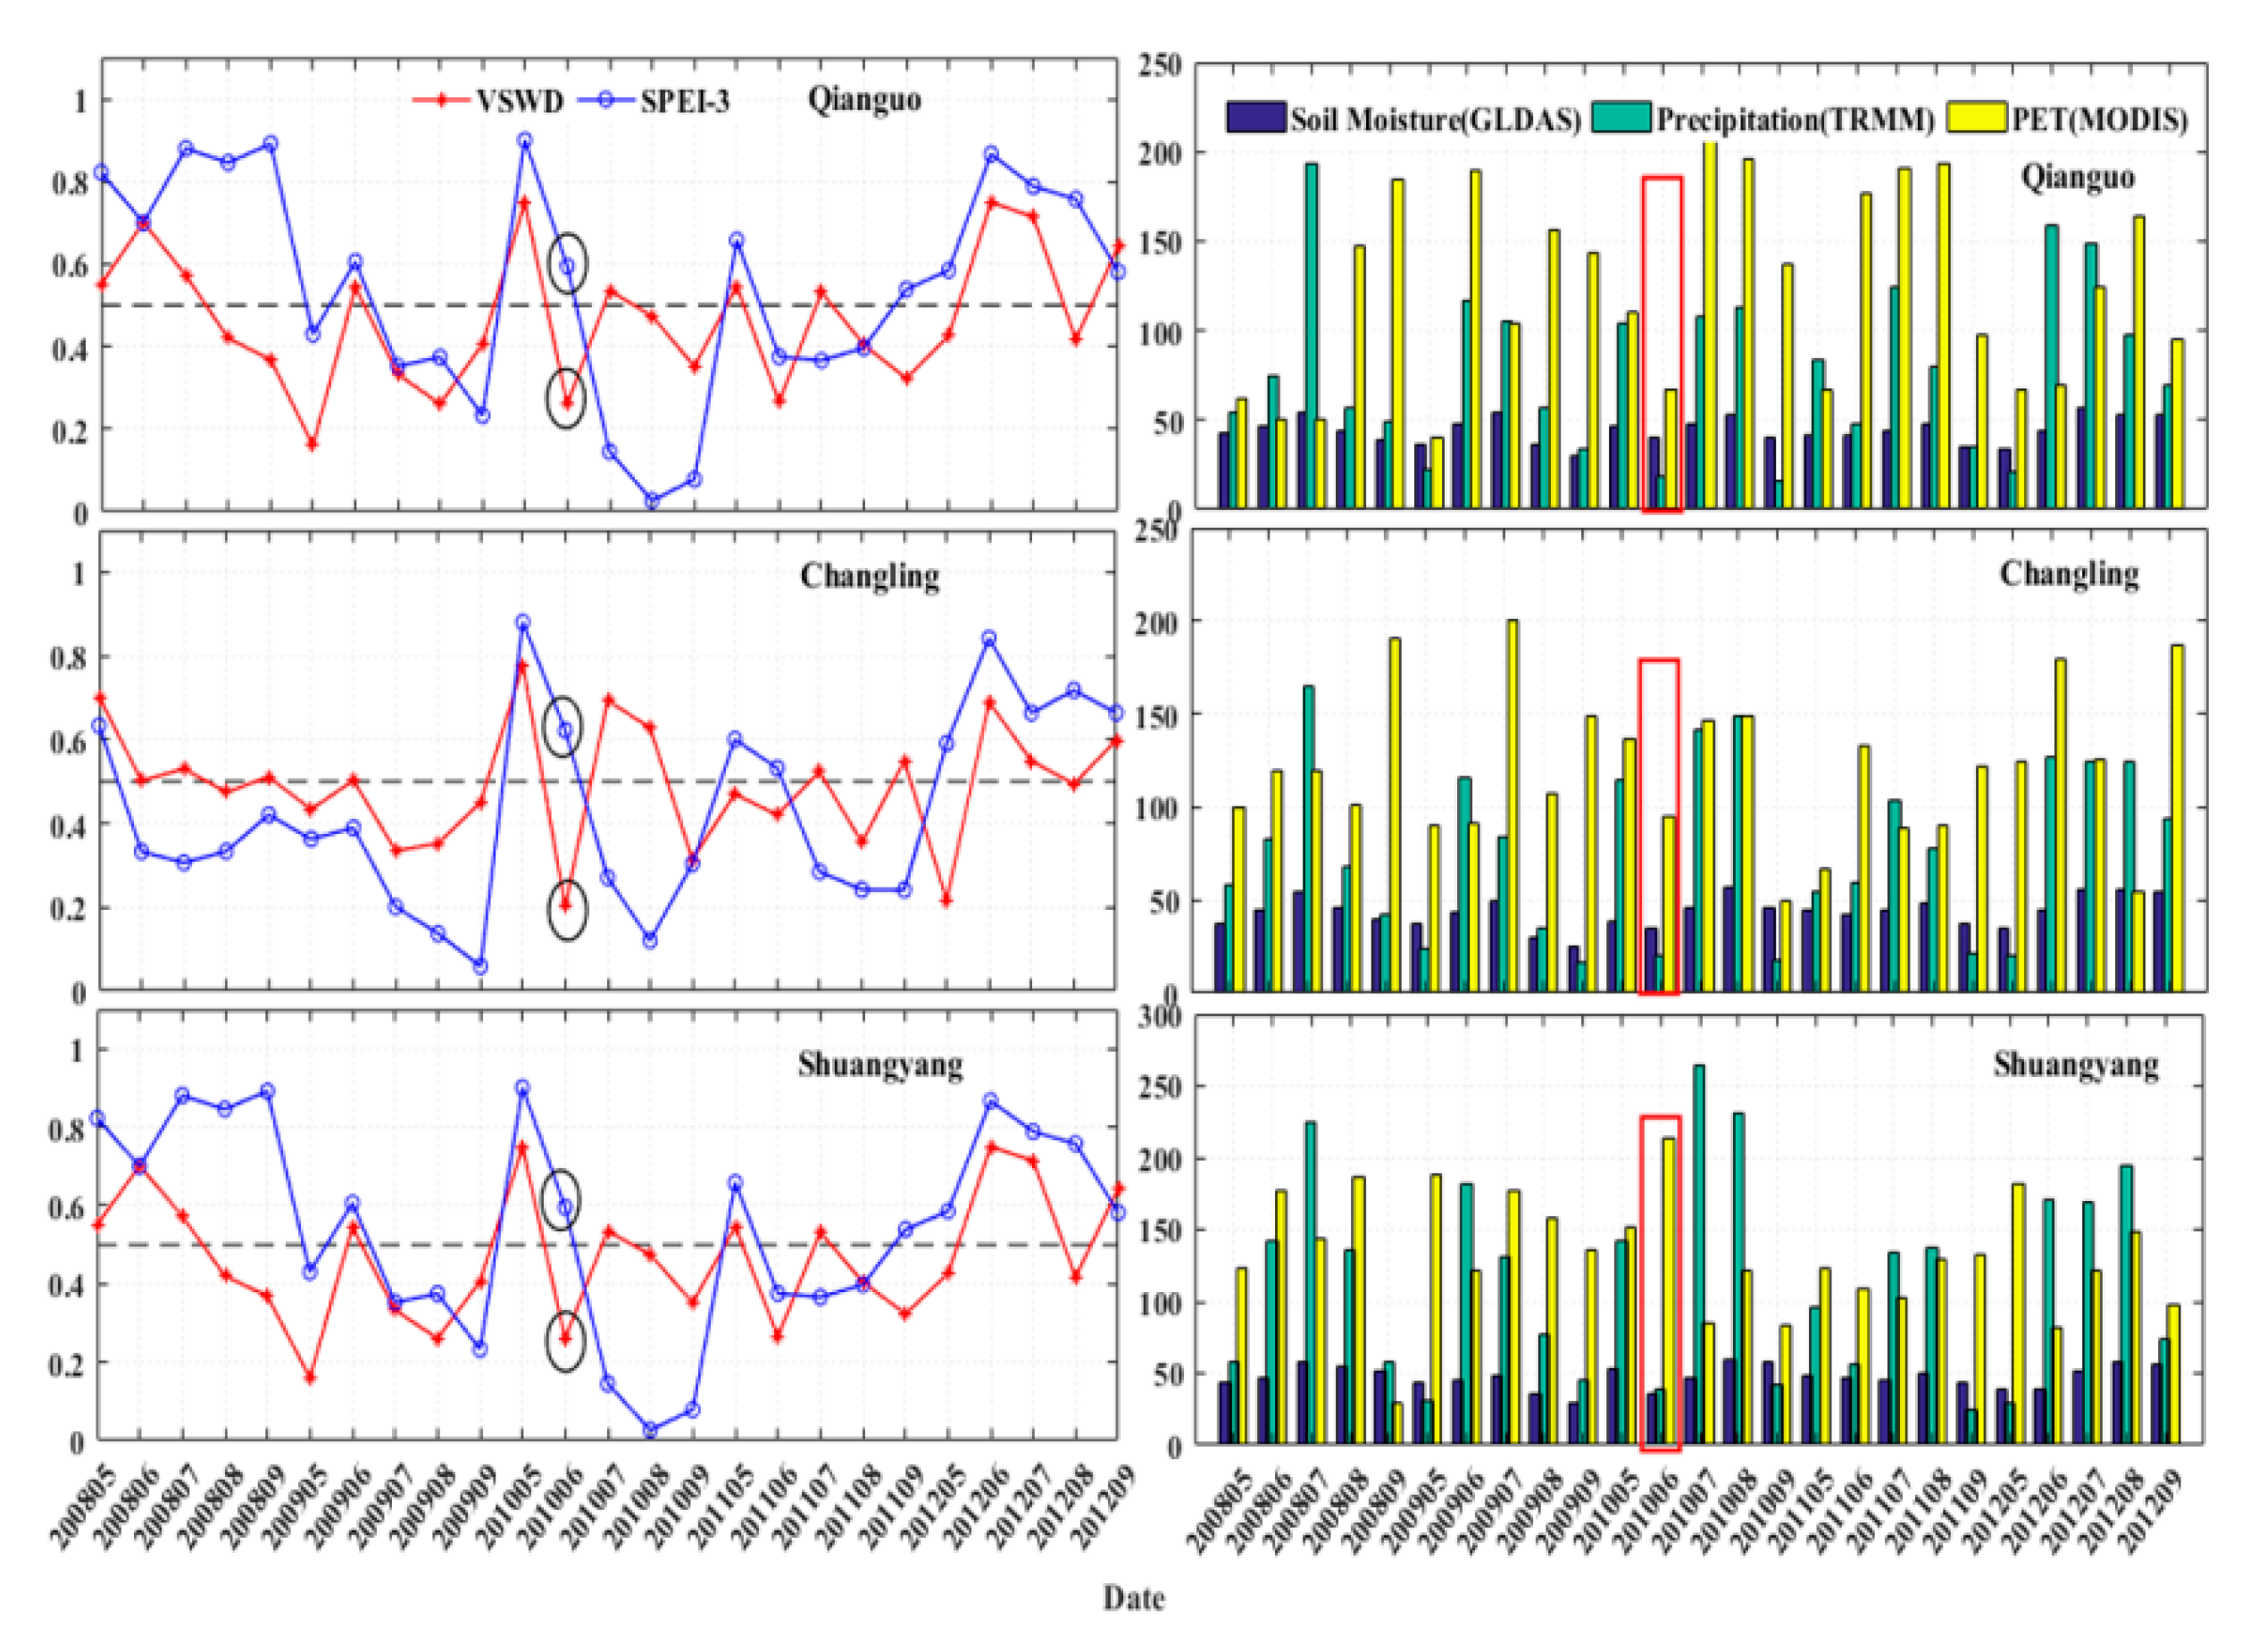
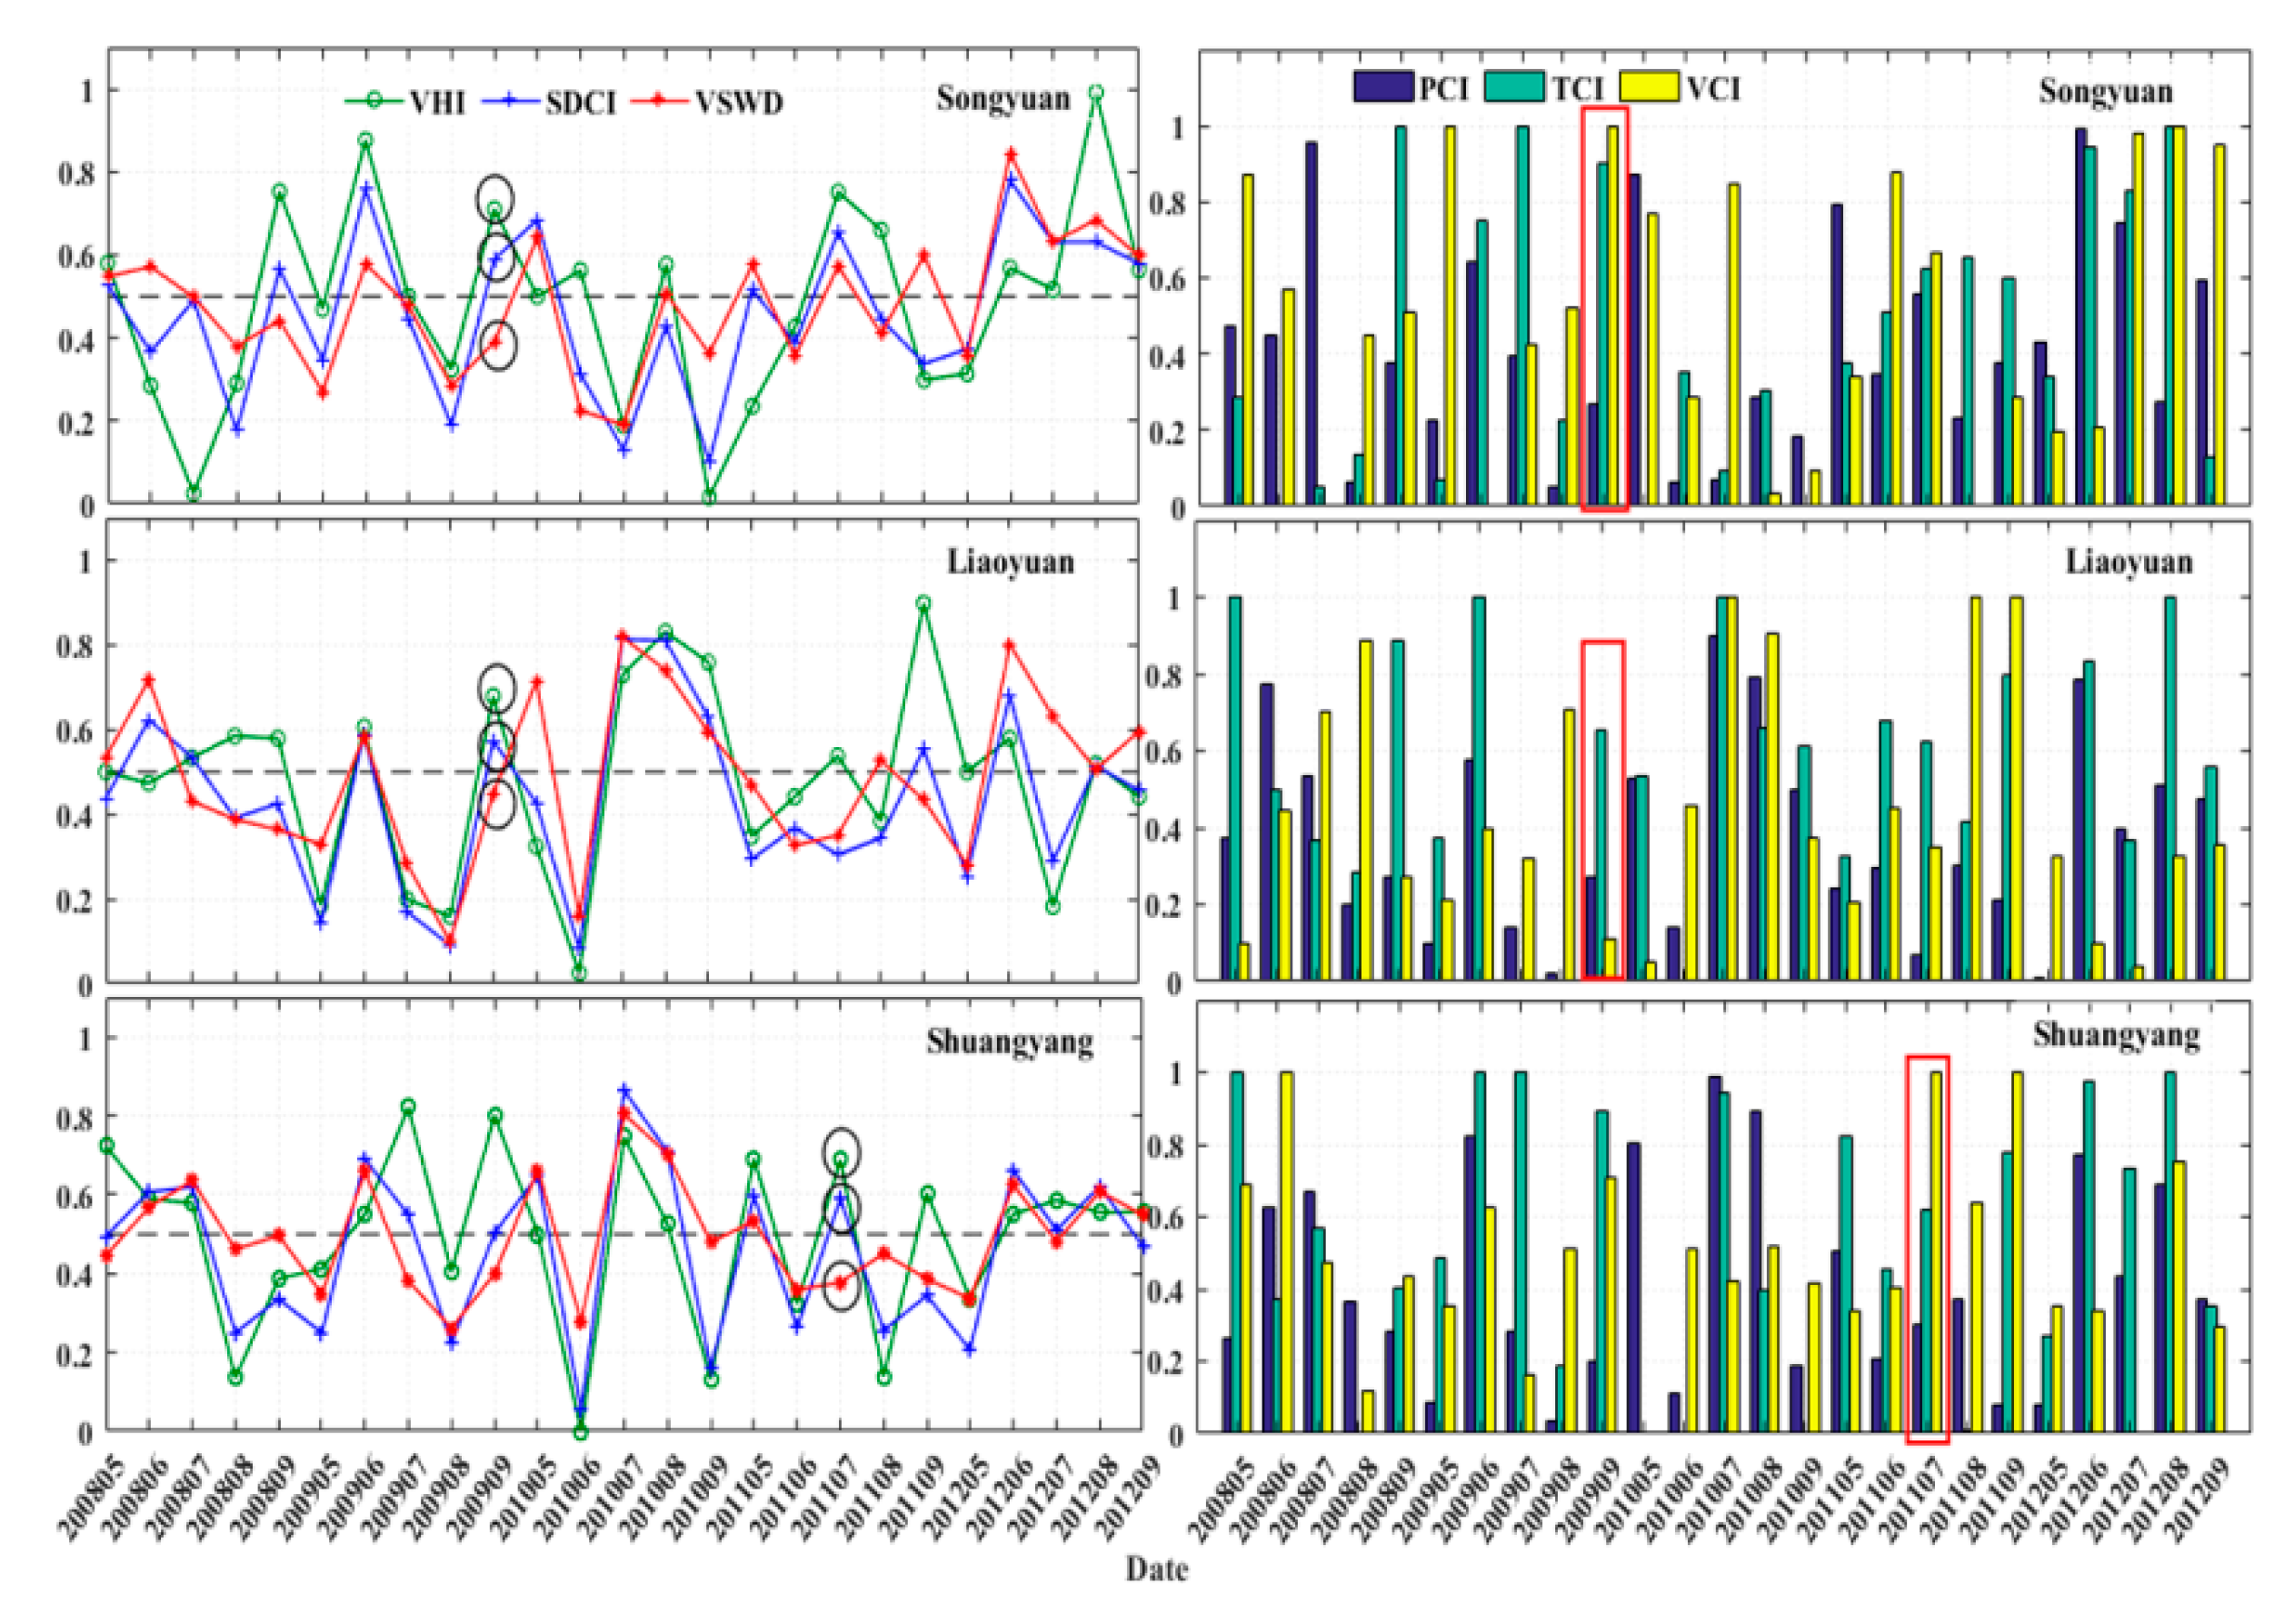
3.3. Comparison of VSWD with Other Drought Indices

In order to test the effectiveness of VSWD and the temporal consistency with other methods, the VSWD was compared against SPEIs from May to September of 2008–2016 period (Figure 5). Spatio-temporal drought distribution maps created from the different indices namely; SPEIs, VSWD, SDCI, and VHI as represented in Figure 7 were also compared. The Pearson correlation analysis was conducted, and the coefficients are shown in Table 2.
Figure 5 reveals similar patterns with minimum variations for VSWD and SPEIs in all three regions from 2008 to 2016. They are more comparable in extremely drought conditions. However, the drought events identified by VSWD and SPEIs have some differences in the start time, end time, duration, and severity. This might be due to the fact that SPEIs only consider precipitation and PET, while ignoring the process of soil moisture changes over time and state. The process of water storage and migration in soil systems is inevitable and provides crucial information necessary to understand the soil moisture status quo. Current soil water content depends on the water stored in the soils at the previous time steps, which affects the change of soil water content when precipitation occurs suddenly. For example, for SPEIs, when precipitation cannot meet the evapotranspiration demand, then drought occurs. However, when the soil water content can meet the basic water demand of crop growth, even if there is not enough precipitation the drought may not occur.
According to Figure 7 and Table 2, it was found that VSWD is more correlated to SPEIs than both VHI and SDCI. For example, the average Pearson correlation coefficients between VSWD and SPEIs in the different months are 0.791, 0.596, 0.774, 0.680 and 0.605 (p < 0.01) respectively, which are the best performance among the drought indices considered in this paper. However, the average Pearson correlation coefficients between VSWD and SPEIs are in the moderate range, probably due to the fact that VSWD considers the soil moisture content, which is not considered by SPEIs. Generally, there is a similar performance by these indices, as shown by the spatial trends of drought in Figure 7. Nevertheless, there are some differences in the start time, spatial extend and severity. For example, the droughts identified in May by VSWD, SDCI and SPEIs can be found to mainly cover the west and southeast areas, while no drought event was found at the western Jilin in the same month when VHI is used. Moreover, the results of SPEIs and VSWD show that droughts occurred during August in large areas of Jilin and started to ease in September. But both VHI and SDCI show that droughts across Jilin started in July and ended in September. The earlier start time of droughts identified by VHI and SDCI, are closely linked to temperature factors. This might be caused by the high temperature recorded in the study area in July. Precipitation does influence drought modalities as shown by the results of SPEIs and VSWD, soil moisture content information is also vital to enhance the drought detection process.

3.4. Performance of Drought Indices in the Major Drought Events

We downloaded the documented records of the major agricultural drought events in different regions of the Jilin Province from the China Drought Dataset (CDD), which contains disaster information reported by different regions (Table 3). Due to the limited number of drought records, we only obtained drought event data from nine regions (Songyuan, Qianguo, Changling, Nong’an, Yushu, Shuangyang, Liaoyuan, Tonghua, and Ji’an) during 2008–2011. These records from the nine regions listed in Table 1 were then used to compare with the VSWD results in the corresponding regions shown in Figure 9, which demonstrates the drought records using elliptical circles. It is shown that the drought events identified using the VSWD method generally correspond to the CDD drought events recorded, indicating the reliability and accuracy of the VSWD method.
In addition, we compared the results of VSWD and other indices in several drought events recorded to analyse the advantage of the VSWD method developed in this study. This was facilitated by normalising the results of VSWD and SPEI to a range of 0 and 1.
Since it is widely accepted that SPEI-3 is one of the best indices for assessing agricultural droughts [7,10,17,31,32,33], we compared the performances of VSWD and SPEI-3 in a major drought event in Qianguo, Changling and Songyuan during June 2010 (Figure 10). It shows that VSWD has successfully identified the agricultural drought event, whilst SPEI-3 has not performed well. Based on the plots on the right hand side of Figure 10, it was found that the precipitation and soil moisture were below the average level and less than the PET values (water demands of crops) in all three regions during June 2010, thus leading to this drought event. By considering the factors of precipitation, soil moisture, and PET all together, VSWD clearly identified the drought event. Although SPEI-3, which considers only precipitation and PET, represents the impacts of precipitation and PET in the previous two months on crop growth, it ignores the soil water factor and inevitably over-relies on precipitation, thereby partially explaining this result of the performance comparison.
Similarly, we also analysed the performances of VSWD, SDCI and VHI in the major drought event at Songyuan and Liaoyuan during September 2009, and the one at Shuangyang in July 2011 (Figure 11). The results demonstrate that VSWD has clearly identified the drought events in three regions, while VHI and SDCI have failed to do so. The plots on the right side of Figure 10 show that PCI (normalisation of precipitation) was lower than the average level, but VCI (normalisation of the NDVI) and TCI (normalisation of the LST) were higher than their average values, indicating the low possibility of drought occurrence in these drought events recorded. Since plants have the self-adaptive system that prevents their growth from immediately responding to water supply changes, it takes time to reflect the drought condition on vegetation indices. Therefore, VCI has limitations in identifying the occurrence of drought events. In addition, although the temperature represents the capability of evapotranspiration to some extent, it does not have a linear relationship with evapotranspiration. So the temperature is not a good indicator of the potential water demand for crop growth. This might explain why SDCI and VHI have failed to identify the drought events in Figure 11.
Therefore, the VSWD method developed in this study can improve the reliability of the agricultural drought assessment by considering precipitation, soil moisture and PET; and the VSWD results can be used to inform the risk of agricultural droughts and guide the agricultural irrigation by making the best use of precious water resources in the study area. The reliable agricultural drought assessment can also facilitate better field management and yield prediction, and benefit agricultural insurance companies.
Although VSWD has identified the drought event at Liaoyuan in September 2009, its value was in a rising phase similar to SDCI and VHI but at a lower speed. This might be caused by the limitation of VSWD. Like other drought index methods, VSWD cannot well represent the soil water processes, such as soil moisture change, and generation of runoff and groundwater recharge. Therefore, it is timely and necessary to develop new methods to effectively assess agricultural droughts based on process-based soil water models, and to better represent the water supply and demand relationships between atmosphere, soil and vegetation, thereby helping provide evidence of the main causes of agricultural droughts.

4. Conclusions and Outlooks

By considering precipitation, soil moisture content and PET all together, a new index method, named VSWD, was developed to better assess agricultural droughts. The analysis of the soil water content data and the indices of SPEIs show that the shallow soil water affects the agricultural droughts in the early stage of plant growth; and water will be extracted from deeper soil layers when the crop roots grow. Therefore, the soil water contents from variable soil depths were used in the VSWD to reflect the crop growing seasons.
This study shows that VSWD has a better performance than the indices of VSWD, SDCI, VHI, and TVDI when they were compared with the SPEIs. A series of analyses of the performances of these indices in the major historical drought events has demonstrated that VSWD can not only distinguish agricultural drought severities, but also generate the most sensible results in the study area than other indices mentioned here. Therefore, more reliable results generated using the VSWD method can help people better identify the risk of agricultural droughts, guide irrigation and manage fields.
Although the monthly results in this study can help people understand the risk of the droughts in each month, the higher temporal resolution is needed to inform people on the occurrence and development of droughts, and guide farmers to mitigate the droughts. Therefore, we can improve the method in the near future to be able to produce results with the ten-day or daily time step.
Moreover, VSWD, which is one of the index methods for assessing agricultural droughts, has limitations in representing the soil water processes. Therefore, process-based models are needed to better represent soil water processes, actual evapotranspiration in different crop growing seasons, runoff and groundwater recharge. This will make it possible to monitor the processes of drought development more accurately, thereby contributing to agricultural insurance, field management and yield prediction.

Author Contributions

Conceptualization, Y.C., L.W. and S.C.; Methodology, Y.C.; Software, Y.C.; Validation, Y.C., L.W.; Formal Analysis, Y.C.; Investigation, Y.C., B.Z., T.L. and Y.Y.; Resources, Y.C., B.Z. and S.C.; Data Curation, Y.C., B.Z., T.L. and Y.Y.; Writing-Original Draft Preparation, Y.C.; Writing-Review & Editing, Y.C., S.C. and L.W.; Visualization, Y.C. and L.W.; Supervision, S.C.; Project Administration, S.C.; Funding Acquisition, S.C.

Funding

This paper was supported by the three year action plan for nurturing and developing new industries in the northeastern region of the National Development and Reform Commission ([2016]512) funded by central government budget, Special construction plan for provincial and University, the program for JLU Science and Technology Innovative Research Team (JLUSTIRT, 2017TD-26) which is funded by the Fundamental Research Funds for the Central Universities, China, and the Changbai Mountain Scholars Program, Jilin Province, China.

Conflicts of Interest

The authors declare no conflict of interest.

References

  1. Kogan, F.N. Global drought watch from space. Bull. Am. Meteorol. Soc. 1997, 78, 621–636. [Google Scholar] [CrossRef]
  2. Du, L.; Tian, Q.; Yu, T.; Meng, Q.; Jancso, T.; Udvardy, P.; Huang, Y. A comprehensive drought monitoring method integrating MODIS and TRMM data. Int. J. Appl. Earth Obs. Geoinf. 2013, 23, 245–253. [Google Scholar] [CrossRef]
  3. Chang, K.Y.; Xu, L.; Starr, G.; Kyaw Tha Paw, U. A drought indice reflecting ecosystem responses to water availability: The Normalized Ecosystem Drought Index. Agric. For. Meteorol. 2018, 250–251, 102–117. [Google Scholar] [CrossRef]
  4. Yang, J.; Chang, J.; Wang, Y.; Li, Y.; Hu, H.; Chen, Y.; Huang, Q.; Yao, J. Comprehensive drought characteristics analysis based on a nonlinear multivariate drought index. J. Hydrol. 2018, 557, 651–667. [Google Scholar] [CrossRef]
  5. Woli, P.; Jones, J.W.; Ingram, K.T.; Fraisse, C.W. Agricultural Reference Index for Drought (ARID). Agron. J. 2012, 104, 287–300. [Google Scholar] [CrossRef] [Green Version]
  6. Carrão, H.; Russo, S.; Sepulcre-Canto, G.; Barbosa, P. An empirical standardized soil moisture index for agricultural drought assessment from remotely sensed data. Int. J. Appl. Earth Obs. Geoinf. 2016, 48, 74–84. [Google Scholar] [CrossRef] [Green Version]
  7. Hao, C.; Zhang, J.; Yao, F. Combination of multi-sensor remote sensing data for drought monitoring over Southwest China. Int. J. Appl. Earth Obs. Geoinf. 2015, 35, 270–283. [Google Scholar] [CrossRef]
  8. Wilhite, D.A.; Glantz, M.H. Understanding the drought phenomenon: The role of definitions. Water Int. 1985, 10, 111–120. [Google Scholar] [CrossRef]
  9. Heim, R.R. A Review of Twentieth-Century Drought Indices Used in the United States. Bull. Am. Meteorol. Soc. 2002, 83, 1149–1166. [Google Scholar] [CrossRef] [Green Version]
  10. Vicente-Serrano, S.M.; Lorenzo-Lacruz, J.; Beguería, S.; Lorenzo-Lacruz, J.; Camarero, J.J.; López-Moreno, J.I.; Azorin-Molina, C.; Revuelto, J.; Morán-Tejeda, E.; Sanchez-Lorenzo, A. Performance of drought indices for ecological, agricultural, and hydrological applications. Earth Interact. 2012, 16, 1–27. [Google Scholar] [CrossRef]
  11. Martínez-Fernández, J.; González-Zamora, A.; Sánchez, N.; Gumuzzio, A. A soilwater based index as a suitable agricultural drought indice. J. Hydrol. 2015, 522, 265–273. [Google Scholar] [CrossRef]
  12. Wu, J.; Chen, X.; Yao, H.; Gao, L.; Chen, Y.; Liu, M. Non-linear relationship of hydrological drought responding to meteorological drought and impact of a large reservoir. J. Hydrol. 2017, 551, 495–507. [Google Scholar] [CrossRef]
  13. Lai, C.; Zhong, R.; Wang, Z.; Wu, X.; Chen, X.; Wang, P.; Lian, Y. Monitoring hydrological drought using long-term satellite-based precipitation data. Sci. Total Environ. 2019, 649, 1198–1208. [Google Scholar] [CrossRef] [PubMed]
  14. Palmer, W. Metreological Drought; Weather Bureau, US Department of Commerce: Washington, DC, USA, 1965.
  15. Bayarjargal, Y.; Karnieli, A.; Bayasgalan, M.; Khudulmur, S.; Gandush, C.; Tucker, C.J. A comparative study of NOAA–AVHRR derived drought indices using change vector analysis. Remote Sens. Environ. 2006, 105, 9–22. [Google Scholar] [CrossRef]
  16. Misshra, A.K.; Singh, V.P. A review of drought concepts. J. Hydrol. 2010, 391, 202–216. [Google Scholar] [CrossRef]
  17. Zhao, H.; Xu, Z.; Zhao, J.; Huang, W. A drought rarity and evapotranspiration-based index as a suitable agricultural drought indice. Ecol. Indic. 2017, 82, 530–538. [Google Scholar] [CrossRef]
  18. Halwatura, D.; Mcintyre, N.; Lechner, A.M.; Arnold, S. Capability of meteorological drought indices for detecting soil moisture droughts. J. Hydrol. Reg. Stud. 2017, 12, 396–412. [Google Scholar] [CrossRef]
  19. Dracup, J.A. Drought monitoring. Stoch. Hydrol. Hydraul. 1991, 5, 261–266. [Google Scholar] [CrossRef]
  20. Vogt, J.V.; Niemeyer, S.; Fabricius, K.E. Drought monitoring from space. In Drought and Drought Mitigation in Europe; Vogt, J.V., Somma, F., Eds.; Advances in Natural and Technological Hazards Research, vol 14; Springer: Dordrecht, The Netherlands, 2000; pp. 167–183. [Google Scholar]
  21. Steinemann, A.C.; Hayes, M.H.; Cavalcanti, L.F.N. Drought indices and triggers. In Drought and Water Crises. Science, Technology and Management; Wilhite, D., Ed.; Taylor & Francis: Boca Raton, FL, USA, 2005; pp. 72–85. [Google Scholar]
  22. Kallis, G. Droughts. Annu. Rev. Env. Resour. 2008, 33, 85–118. [Google Scholar] [CrossRef]
  23. Zhang, L.; Jiao, W.; Zhang, H.; Huang, C.; Tonga, Q. Studying drought phenomena in the Continental United States in 2011 and 2012 using various drought indices. Remote Sens. Environ. 2017, 190, 96–106. [Google Scholar] [CrossRef]
  24. Qin, Y.; Yang, D. Comparative analysis of drought based on precipitation and soil moisture indices in Haihe basin of North China during the period of 1960–2010. J. Hydrol. 2015, 526, 55–67. [Google Scholar] [CrossRef]
  25. Gibbs, W.J.; Maher, J.V. Rainfall deciles as drought indicators. In Australian Bureau of Meteorology Bulletin; No. 48; Commonwealth of Australia: Melbourne, Australia, 1967. [Google Scholar]
  26. McKee, T.B.; Doesken, N.J.; Kleist, J. The relationship of drought frequency and duration to time scales. In Proceedings of the Eighth Conference on Applied Climatology of the American Meteorological Society, Boston, MA, USA, 17–22 January 1993; pp. 179–184. [Google Scholar]
  27. McKee, T.B.; Doesken, N.J.; Kleist, J. Drought monitoring with multiple timescales. In Proceedings of the Ninth Conference on Applied Climatology of the American Meteorological Society, Boston, MA, USA, 15–20 January 1995; pp. 233–236. [Google Scholar]
  28. Keyantash, J.A.; Dracup, J.A. An aggregate drought index: Assessing drought severity based on fluctuations in the hydrologic cycle and surface water storage. Water Resour. Res. 2004, 40. [Google Scholar] [CrossRef] [Green Version]
  29. Shukla, S.; Wood, A.W. Use of a standardized runoff index for characterizing hydrologic drought. Geophys. Res. Lett. 2008, 35. [Google Scholar] [CrossRef] [Green Version]
  30. Madadgar, S.; Moradkhani, H. Spatio-temporal drought forecasting within Bayesian networks. J. Hydrol. 2014, 512, 134–146. [Google Scholar] [CrossRef]
  31. Lorenzo-Lacruz, J.; Vicente-Serrano, S.M.; López-Moreno, J.I.; Beguería, S.; García-Ruiz, J.M.; Cuadrat, J.M. The impact of droughts and water management on various hydrological systems in the headwaters of the Tagus River (central Spain). J. Hydrol. 2010, 386, 13–26. [Google Scholar] [CrossRef] [Green Version]
  32. Tian, L.Y.; Yuan, S.S.; Quiring, S.M. Evaluation of six indices for monitoring agricultural drought in the south-central United States. Agric. For. Meteorol. 2018, 249, 107–119. [Google Scholar] [CrossRef]
  33. Vicente-Serrano, S.M.; Beguería, S.; López-Moreno, J.I. A multi-scalar drought index sensitiveto global warming: The standardized precipitation evapotranspiration index–SPEI. J. Clim. 2010, 23, 1696–1718. [Google Scholar] [CrossRef]
  34. Yang, H.; Wang, H.; Fu, G.; Yan, H.; Zhao, P. A modified soil water deficit index (MSWDI) for agricultural drought monitoring: Case study of Songnen Plain, China. Agric. Water Manag. 2017, 194, 125–138. [Google Scholar] [CrossRef]
  35. Wells, N.; Goddard, S. A self-calibrating Palmer drought severity index. J. Clim. 2004, 17, 2335–2351. [Google Scholar] [CrossRef]
  36. Wang, H.; Rogers, J.C.; Munroe, D.K. Commonly used drought indices as indicators of soil moisture in China. J. Hydrometeorol. 2015, 16, 1397–1408. [Google Scholar] [CrossRef]
  37. Deepthi, R.; Vijay, P.S.; Ashok, K.M. Multivariate drought index: An information theory based approach for integrated drought assessment. J. Hydrol. 2015, 526, 164–182. [Google Scholar]
  38. Kogan, F.N. Application of vegetation index and brightness temperature for drought detection. Adv. Space Res. 1995, 15, 91–100. [Google Scholar] [CrossRef]
  39. Kogan, F.N. Droughts of the late 1980s in the United States as derived from NOAA polar-orbiting satellite data. Bull. Am. Meteorol. Soc. 1995, 76, 655–668. [Google Scholar] [CrossRef]
  40. Bhuiyan, C.; Singh, R.P.; Kogan, F.N. Monitoring drought dynamics in the Aravalli region (India) using different indices based on ground and remote sensing data. Int. J. Appl. Earth Obs. Geoinf. 2006, 8, 289–302. [Google Scholar] [CrossRef]
  41. Sandholt, I.; Andersen, J.; Rasmussen, K. A simple interpretation of the surface tenperature/vegetation index space for assessment of soil moisture status. Remote Sens. Environ. 2002, 79, 213–224. [Google Scholar] [CrossRef]
  42. Rebel, K.T.; de Jeu, R.A.M.; Ciais, P.; Viovy, N.; Piao, S.L.; Kiely, G.; Dolman, A.J. A global analysis of soil moisture derived from satellite observations and a land surface model. Hydrol. Earth Syst. Sci. 2012, 16, 833–847. [Google Scholar] [CrossRef] [Green Version]
  43. McVicar, T.R.; Jupp, D.L.B. The current and potential operational uses of remote sensing to aid decisions on drought exceptional circumstances in Australia: A review. Agric. Syst. 1998, 3, 399–468. [Google Scholar] [CrossRef]
  44. Hollinger, S.E.; Isard, S.A.; Welford, M.R. A New Soil Moisture Drought Index for predicting crop Yields. In Proceedings of the Eighth Conference on Applied Climatology, Anaheim, CA, USA, 17–22 January 1993; American Meteorological Society: Boston, MA, USA, 1993; pp. 187–190. [Google Scholar]
  45. Torres, G.M.; Lollato, R.P.; Ochsner, T.E. Comparison of drought probability assessments based on atmospheric water deficit and soil water deficit. Agron. J. 2013, 105, 428–436. [Google Scholar] [CrossRef]
  46. Keshavarz, M.R.; Vazifedoust, M.; Alizadeh, A. Drought monitoring using asoil wetness deficit index (SWDI) derived from MODIS satellite data. Agric. Water Manag. 2014, 132, 37–45. [Google Scholar] [CrossRef]
  47. Rhee, J.; Im, J.; Carbone, G.J. Monitoring agricultural drought for arid and humid regions using multi-sensor remote sensing data. Remote Sens. Environ. 2010, 114, 2875–2887. [Google Scholar] [CrossRef]
  48. Zhang, A.; Jia, G. Monitoring meteorological drought in semiarid regions usingmulti-sensor microwave remote sensing data. Remote Sens. Environ. 2013, 134, 12–23. [Google Scholar] [CrossRef]
  49. Ghulam, A.; Qin, Q.; Teyip, T.; Li, Z.L. Modified perpendicular drought index (mpdi): A real-time drought monitoring method. ISPRS J Photogramm. Remote Sens. 2017, 62, 150–164. [Google Scholar] [CrossRef]
  50. Zhang, Q.; Yu, H.; Sun, P.; Singh, V.P.; Shi, P. Multisource data based agricultural drought monitoring and agricultural loss in China. Glob. Planet Chang. 2019, 172, 298–306. [Google Scholar] [CrossRef]
  51. Yang, G.Y.; Shao, W.W.; Wang, H.; Han, D.M. Drought Evolution Characteristics and Attribution Analysis in Northeast China. Procedia Eng. 2016, 154, 749–756. [Google Scholar] [CrossRef]
  52. Cong, D.M.; Zhao, S.H.; Chen, C.; Duan, Z. Characterization of droughts during 2001–2014 based on remote sensing: A case study of Northeast China. Ecol. Inform. 2017, 39, 56–67. [Google Scholar] [CrossRef]
  53. Guo, E.L.; Liu, X.P.; Zhang, J.Q.; Wang, Y.F.; Wang, C.L.; Wang, R.; Li, D.J. Assessing spatiotemporal variation of drought and its impact on maize yield in Northeast China. J. Hydrol. 2017, 553, 231–247. [Google Scholar] [CrossRef]
  54. Zargar, A.; Sadiq, R.; Naser, B.; Khan, F.I. A review of drought indices. Environ. Rev. 2011, 19, 333–349. [Google Scholar] [CrossRef]
  55. Dai, A.G.; National Center for Atmospheric Research Staff (Eds.) The Climate Data Guide: Palmer Drought Severity Index (PDSI). Available online: https://climatedataguide.ucar.edu/climate-data/palmer-drought-severity-index-pdsi (accessed on 12 July 2017).
  56. Rouault, M.; Richard, Y. Intensity and spatial extension of droughts at different time scale since 1921 in South Africa. In Proceedings of the EGS—AGU—EUG Joint Assembly, Nice, France, 6–11 April 2003. [Google Scholar]
  57. Rodell, M.; Houser, P.R.; Jambor, U.; Gottschalck, J.; Mitchell, K.; Meng, C.-J.; Arsenault, K.; Cosgrove, A.; Radakovich, J.; Bosilovich, M.; et al. The Global Land Data Assimilation System. Bull. Am. Meteorol. Soc. 2004, 85, 381–394. [Google Scholar] [CrossRef] [Green Version]
  58. Zhang, X.Y. Crop Roots and Soil Water Utilization; China Meteorological Press: Beijing, China, 1999; pp. 1–186. [Google Scholar]
  59. Allen, R.G.; Pereira, L.S.; Raes, D.; Smith, M. CropEvapotranspiration-Guidelines for Computing Crop Water Requirements-FAO Irrigation and Drainage Paper 56; FAO: Rome, Italy, 1998; p. 5109. [Google Scholar]
  60. Peng, Y.; Long, S.; Ma, J.; Song, J.; Liu, Z. Temporal-spatial variability in correlations of drought and flood during recent 500 years in Inner Mongolia, China. Sci. Total Environ. 2018, 633, 484–491. [Google Scholar] [CrossRef]
  61. Yang, T.; Wang, X.Y.; Zhao, C.Y.; Chen, X.; Yu, Z.B.; Shao, Q.X.; Xu, C.-Y.; Xia, J.; Wang, W. Changes of climate extremes in a typical arid zone: Observations and multimodel ensemble projections. J. Geophys. Res. 2011, 116, 19. [Google Scholar] [CrossRef]
Figure 1. The study area: (a) The location of Northeast China; (b) the Digital Elevation Model data (DEM), Sample points collected during August to September of 2016, and the meteorological stations of Jilin Province.
Remotesensing 11 01066 g001
Figure 2. An example from multiple sources of datasets in September of 2016: (a) Potential evapotranspiration from moderate resolution imaging spectroradiometer (MODIS); (b) precipitation from tropical rainfall measuring mission (TRMM); (c) soil moisture (0–10 cm); and (d) soil moisture (10–40 cm) from global land data assimilation system (GLDAS).
Remotesensing 11 01066 g002
Figure 3. Photos taken from field sampling during August to September of 2016, showing different severities of agricultural droughts: (a) No drought; (b) slightly affected; (c) moderately affected; and (d) severely affected.
Remotesensing 11 01066 g003
Figure 4. (a) Annual precipitation; (b) potential evapotranspiration (PET); (c) the long-term differences between the precipitation and PET (1961–2008); (d) the bar chart of the monthly average precipitation (PRE), potential evapotranspiration (PET), and differences between PRE and PET (PRE-PET) in Baicheng (BC), Changchun (CC), and Yanbian (YB).
Remotesensing 11 01066 g004
Figure 5. Time series of vegetation-soil water deficit (VSWD) and Standardized Precipitation Evapotranspiration Index (SPEIs) during growing seasons from 2008 to 2016 in Baicheng, Changchun and Yanbian.
Remotesensing 11 01066 g005
Figure 6. Comparing VSWD with (a) precipitation; (b) soil moisture; and (c) PET during growing seasons from 2008 to 2013.
Remotesensing 11 01066 g006
Figure 7. Spatio-temporal drought conditions in the Jilin province indicated by multiple drought indices during the growing season (May–September) of 2016.
Remotesensing 11 01066 g007
Figure 8. The average index value of VSWD, temperature vegetation dryness index (TVDI), scaled drought condition index (SDCI), and vegetation health index (VHI) for each drought severity.
Remotesensing 11 01066 g008
Figure 9. The validation of VSWD with the CDD (the red ellipse represents the records drought events from the China Drought Dataset).
Remotesensing 11 01066 g009
Figure 10. The performances of VSWD and the three-month standardized precipitation evapotranspiration index (SPEI-3) in the major drought event occurred in Qianguo, Changling and Songyuan during June 2010 (Black ellipse represents the drought event; red rectangle indicates precipitation, PET and soil moisture in June 2010).
Remotesensing 11 01066 g010
Figure 11. The performances of VSWD, VHI and SDCI in the major droughts event occurred in Songyuan and Liaoyuan (September 2009) and in Shuangyang (July 2011) (Black ellipse represents the drought events; red rectangle indicates PCI, TCI and VCI in the drought event months).
Remotesensing 11 01066 g011
Table 1. Correlation between water content of each soil layer and different in situ indices in different months.
MonSoil_LayerSPEI-1SPEI-3SPEI-6PDSISC-PDSIMean Correlation
MayS0–100.830.910.850.380.470.69
S0–400.670.790.860.440.480.65
S10–400.490.570.690.550.510.56
JunS0–100.260.100.200.140.330.21
S0–400.190.420.530.320.530.40
S10–400.020.260.380.140.350.23
JulS0–100.600.520.590.540.440.54
S0–400.560.550.600.520.490.54
S10–400.560.440.480.500.340.47
AugS0–100.290.450.690.570.520.50
S0–400.260.590.800.720.680.61
S10–400.040.630.700.700.740.56
SepS0–100.870.280.420.400.260.45
S0–400.830.480.570.630.460.59
S10–400.820.630.690.630.590.67
Table 2. Correlation coefficients r values between the VSWD, SDCI, VHI and in situ indices.
MonMethodBaichengChangchunYanbianMean
SPEI-1SPEI-3SPEI-6SPEI-1SPEI-3SPEI-6SPEI-1SPEI-3SPEI-6
MayVSWD0.8330.8850.8110.9440.8170.7810.6900.7770.5790.791
SDCI0.6950.5840.4970.9400.6940.6120.8880.5930.4250.659
VHI0.1160.3570.3810.5830.2120.0900.4310.026−0.1770.224
JunVSWD0.7680.2580.2650.8780.3050.2920.9540.8130.8290.596
SDCI0.590.1450.1960.9420.3190.3520.8890.6980.6330.529
VHI0.2580.0090.0660.8140.4050.4320.6490.5490.370.395
JulVSWD0.8610.8100.8460.9320.6940.7290.8290.5710.6930.774
SDCI0.6160.7530.7630.8080.6390.6720.6770.4970.4680.655
VHI0.2700.0120.0320.0540.0730.108−0.753−0.590−0.530−0.147
AugVSWD0.6250.2000.6410.9120.7770.8400.7570.6700.7010.680
SDCI0.1030.3670.4690.910.7410.780.7640.4980.6440.586
VHI0.0970.3810.3490.0740.076−0.098−0.038−0.150−0.0370.073
SepVSWD0.8520.1220.1770.8860.4280.6050.7080.7860.8840.605
SDCI0.7700.0060.0960.8420.2520.4020.8440.7540.8270.533
VHI0.4380.1080.0440.5480.1630.2370.3170.3630.4310.294
Table 3. Records of drought events from China Drought Dataset (CDD).
StationDrought Months (China Drought Disaster Dataset)
SY (Songyuan)200908200909
QG (Qianguo)200908201006
CL (Changling)200806200807200808200809
200905200906200907200908200909
201006201007201009
NA (Nong’an)200908
YS (Yushu)200908201006
SY (Shuangyang)200908201006201107
LY (Liaoyuan)200908200909
TH (Tonghua)200908
JA (Ji’an)200908

