1. Introduction
Currently, 55% of the world’s population reside in urban areas, and especially in low-income and lower-middle-income countries rapid urbanization is expected between now and 2050 [
1]. The Sustainable Development Goals (SDGs) [
2] and the Sendai Framework for Disaster Risk Reduction (SFDRR) [
3] both highlight the relevance and increasing need for up-to-date information on the spatial distribution of human settlements. For instance, humanitarian organizations cannot help people if they cannot find them. Consequently, reliable techniques to generate accurate data sets of human settlements at national, regional, and global scales are crucial in manifold domains such as disaster management, habitat and ecological system conservation, and public health monitoring.
Earth observation (EO) using satellites already provides data for a broad range of purposes such as disaster assessment, forestry or crop land monitoring, and land-use/land-cover classification. Recently, remote sensing technologies have been successfully employed to derive information on human settlements at regional to global scales. Accuracy and completeness of EO derived human settlement data sets have improved a lot in the last 15 years. Current data sets, which have been made available recently, include the Global Human Settlement Layer (GHSL) [
4], the Global Urban Footprint (GUF) data set [
5], and the High-Resolution Settlement Layer (HRSL) [
6]. However, these data sets still show great variations for different regions and geographic settings [
7]. Especially rural areas and non-solid building structures are still disregarded or under-represented in these data sets.
Several researchers highlight the potential of crowdsourcing to collect information on human settlements and to complement the data that is produced using satellite imagery [
8,
9,
10]. Additionally, humanitarian organizations start using new methods from Citizen Science and Volunteered Geographic Information (VGI), to gather information on the spatial distribution of human settlements [
11]. However, the quality and the reliability of those methods and resulting data sets remain major concerns, which are extensively discussed in current research [
12]. Spatial varying data quality and the lack of reference data with sufficient quality still constitute barriers in using VGI data in general and for humanitarian purposes or in disaster management in particular [
13].
The mapping of human settlements tends to be done either from an earth observation perspective or from a citizen science position. However, a tighter integration of both approaches has the potential to derive improved data sets that presumably outperform existing one [
8].
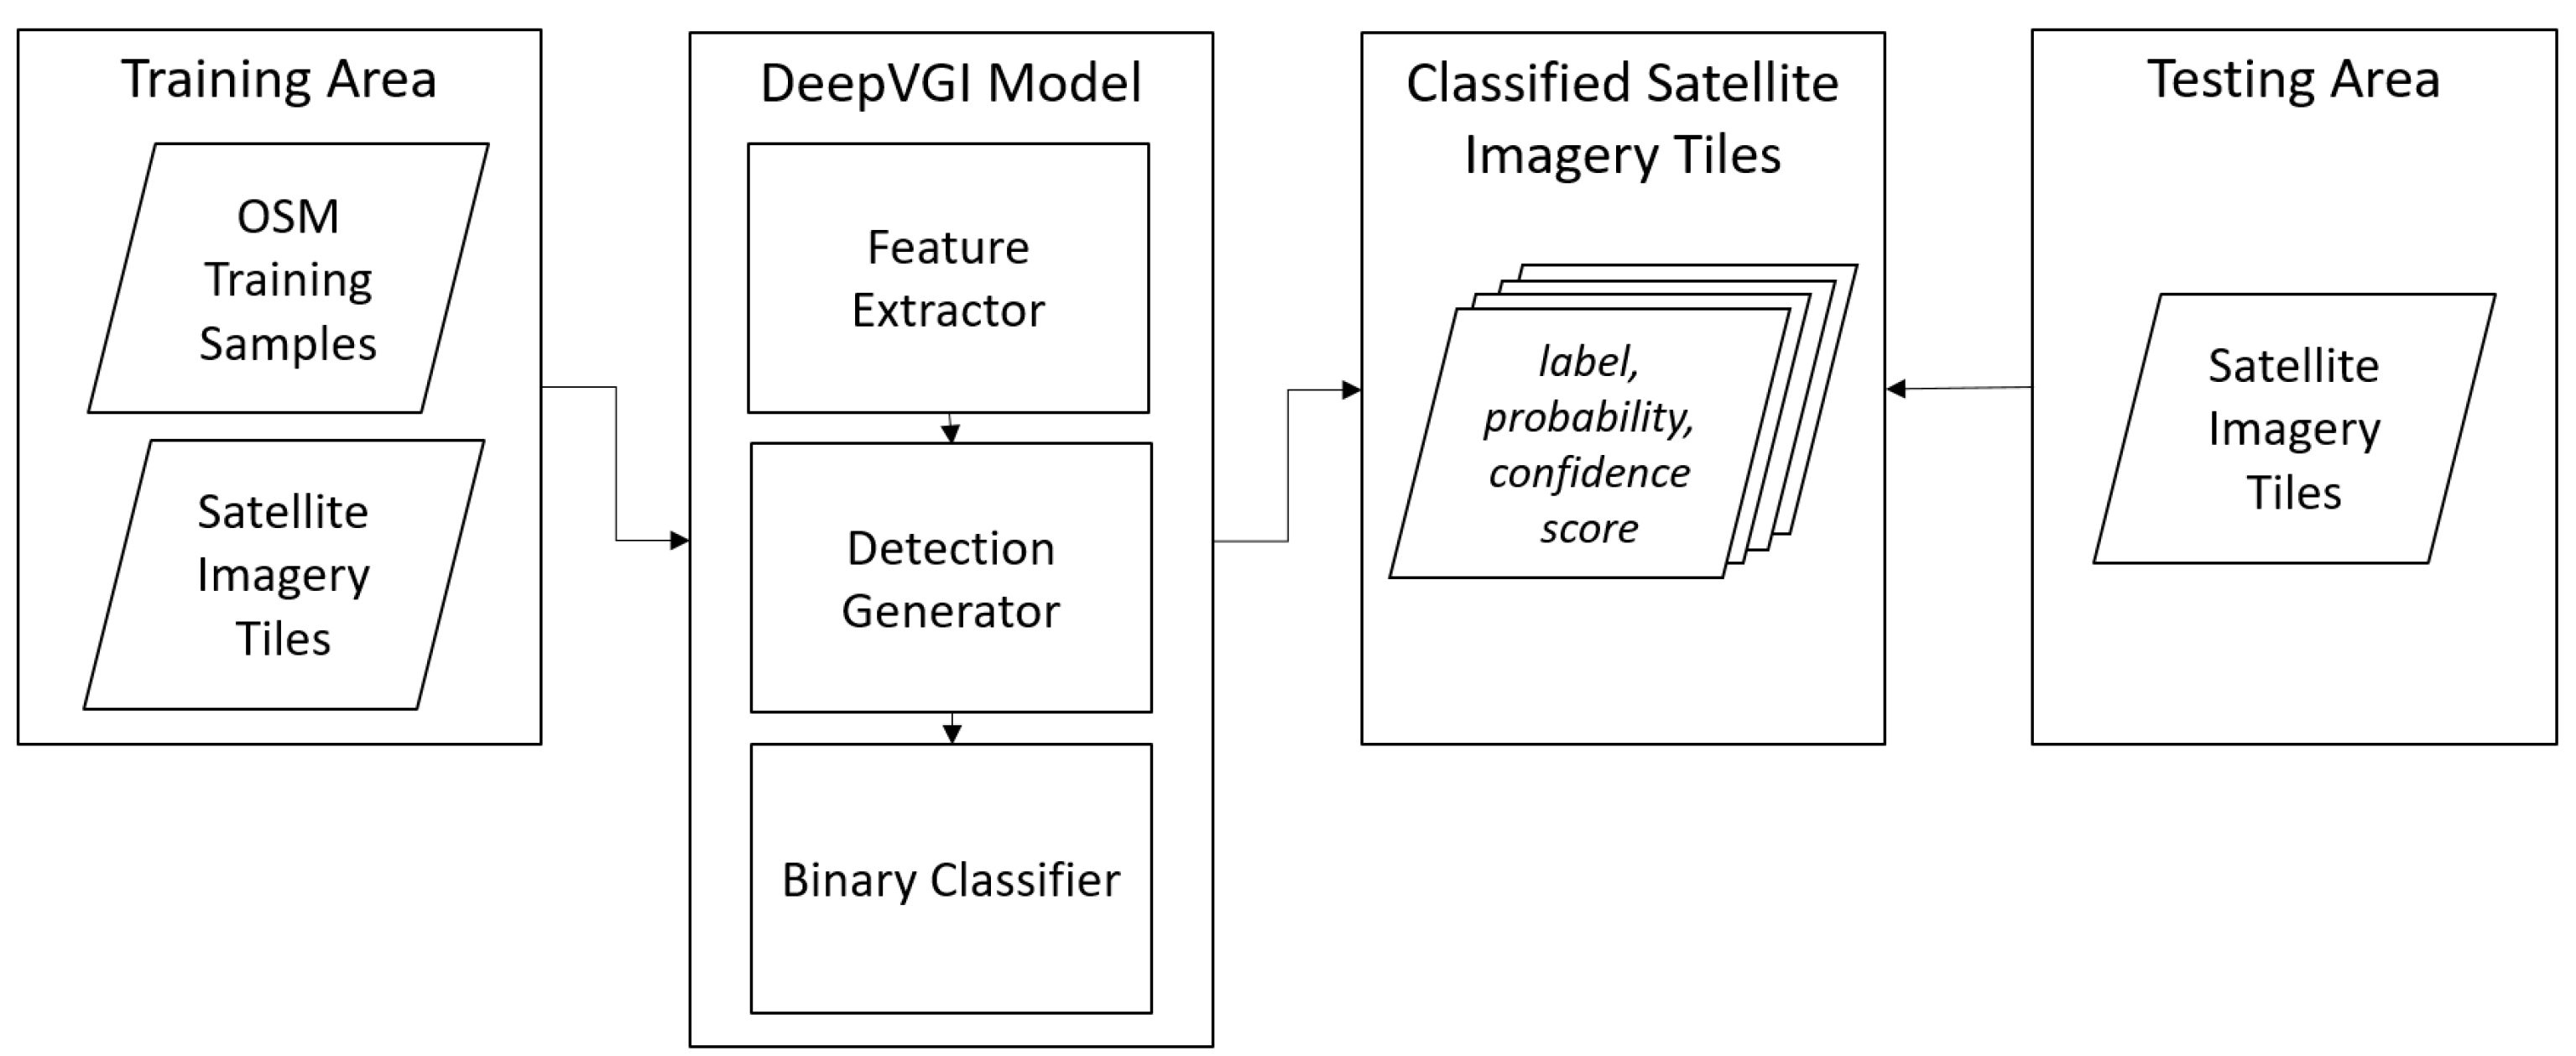
In this article, we present a novel workflow to overcome the scarce availability of accurate and up-to-date human settlement data sets (see
Figure 1). Our proposed workflow combines two methods: (1) object detection and classification using deep learning algorithms (DeepVGI [
14]) and (2) crowdsourced mapping of human settlements by volunteers (MapSwipe [
15]). To combine both methods we propose a task allocation strategy (3) that choses classification labels either from DeepVGI or MapSwipe. Moreover, we investigate whether our proposed methodology helps to produce better maps faster with respect to the following research questions.
RQ1: How good are crowdsourcing (MapSwipe) and deep learning (DeepVGI) with respect to generating human settlement maps in comparison to existing EO-based approaches?
RQ2: Which spatial and non-spatial characteristics of misclassifications are accompanied by applying the DeepVGI approach?
RQ3: What is the added value of the proposed task allocation strategy with respect to performance and effort?
The remainder of this paper is organized as follows:
Section 2 provides background information on techniques for deriving information on human settlements using either deep learning or crowdsourcing. The study areas and data sets are described in
Section 3. We present our overall methodology in
Section 4 and show results in
Section 5.
Section 6 discusses our findings and makes suggestions for future work, whereas
Section 7 draws conclusions.
2. Background: Mapping Human Settlements Using Crowdsourcing or Deep Neural Networks
Previous research shows the strengths and shortcomings of existing global settlement data products such as the Global Human Settlement Layer or the Global Urban Footprint data set [
7,
16]. In this section we review to what degree VGI and citizen science approaches and techniques based on deep learning have been applied to tackle the known challenges.
Citizen science projects and VGI tools are widely used to collect information on human settlements. The OpenStreetMap (OSM) platform played a central role in generating map data during several international disasters, e.g., after the 2010 Haiti earthquake [
17] and after the 2015 Nepal earthquake [
18]. Additionally, OpenStreetMap is used also in disaster preparedness and disaster risk reduction activities, for instance, by the organizations of the Missing Maps project [
11]. Regarding urban planning, Crooks et al. (2015) [
19] show how various user-generated data sets (GPS trajectories, social media data) enrich our understanding of urban form and function from a bottom up perspective.
The increased usage of VGI has been accompanied by discussions on the quality of data sets, which have not been produced by experts [
20,
21]. The research on VGI data quality reveals that spatial heterogeneity, e.g., regarding completeness of building footprints, remains a major challenge on different geographic scales [
13]. Fan et al. (2014) [
22] confirm a high completeness for building footprint features in an urban area in Munich, Germany. For crowdsourced classification of human settlements in Madagascar and South Sudan Herfort et al. (2017) [
15] conclude that disagreement between users is not randomly distributed in space but rather clustered, indicating that reliability of information varies spatially. Additionally, Comber et al. (2016) [
23] show for land cover mapping that the quality of VGI data sets is influenced by differences between user groups, which are a potential source of error and uncertainty.
In addition to the above VGI-related work, several authors have investigated the potential of deep learning technology in various satellite image processing tasks including human settlement mapping (see [
24] for a comprehensive overview). In Jean et al. (2016) [
25] a convolutional neural network is used to distinguish urban areas, non-urban area, roads, and water in optical satellite imagery for predicting poverty in Nigeria, Tanzania, Uganda, Malawi, and Rwanda. In Li et al. (2019) [
26], a pre-trained neural network is employed to estimate large scale OSM missing built-up areas in Tanzania. Regarding land cover mapping, several authors propose workflows based on deep neural networks with a focus on urban areas [
27,
28]. Furthermore, building footprint extraction based on deep learning has been a central research topic in recent years [
29,
30].
Although deep learning shows promising results with respect to object detection in images in general, analyzing data quality of geographic approaches (e.g., using geographic data sets such as satellite imagery and building footprints) remains a huge challenge. The transferability of deep learning models constitutes a key challenge towards global scale data products, e.g., for human settlements. For instance, Yuan et al. (2018) [
30] highlight difficulties in extracting footprints for buildings in rural areas which differed significantly from the footprints presented in the training set. Missing benchmark data sets tailored to remote sensing tasks make it difficult to compare the growing number of deep learning algorithms [
24]. Similar to the factors contributing to spatial heterogeneity of VGI data sets, deep learning approaches are vulnerable to changes in input factors such as atmospheric scattering conditions, intraclass variability, culture-dependent characteristics and a limited number of training samples [
24].
In addition to studies focusing either on deep learning or on VGI approaches in isolation to generate information on human settlements, some studies have successfully combined both approaches. A study by Gueguen et al. (2017) [
8] produces regional- and country-scale population distribution maps from very high-resolution satellite imagery based on the detection of village boundaries by a deep neural network and a crowdsourced validation of the results. The study reports benefits from combining the high recall of automated methods with the high precision of human validators. By combining data from multiple crowdsourcing projects in an active learning framework for convolutional neural networks Chen et al. (2018) [
31] address incompleteness and spatial heterogeneity of input training samples regarding road and building mapping. Their results show a promising avenue how deep learning can be used to improve VGI data. However, the small sample size used for validation hinders conclusions on the transferability of their findings. Vargas-Munoz et al. (2019) [
32] investigate the quality of OSM data in study sites in Zimbabwe and Tanzania using a deep learning approach. Their approach can detect missing building footprints and misalignment in the OSM data, but the validation data sets contain only 1000 buildings per site, which again casts doubts on the transferability of the proposed approach.
Previous work has shown how citizen science, VGI, and deep learning can contribute to improve large scale geographic data sets on human settlements. Those methods help to produce data sets desperately needed for monitoring urban growth, sustainable development, disaster risk reduction, and many other applications. Nevertheless, researchers have also revealed that spatial heterogeneity is a key issue, which needs to be addressed to understand and enhance data quality. Regarding VGI data sets, spatial heterogeneity is expressed by regional difference in data completeness and varying data quality due to diverging user experience. Considering deep learning approaches, spatial heterogeneity can be interpreted as the difficulty to transfer models from one region to another and to provide training samples which incorporate the geographic properties for all object structures or characteristics and regions.
We propose a workflow to combine the strengths of recent machine learning algorithms and crowdsourced data production by means of a confidence-based task allocation strategy. Our work is guided by the common hypothesis that humans rarely identify something as a building which is not a building, but tend to miss some objects. Furthermore, deep learning approaches will miss fewer buildings at the cost of detecting also several objects which are not buildings. By bringing together those two research streams we aim at producing human settlement data sets which are both more complete and precise.
4. Methodology
The workflow we propose in this paper addresses the challenge of combining deep learning and crowdsourcing to generate high-quality human settlement maps.
Section 4.1 explains the DeepVGI method to automatically classify satellite imagery tiles into “building” and “no building”.
Section 4.2 explains the data quality evaluation procedure. In
Section 4.3 we present the procedure to analyze spatial and non-spatial characteristics of misclassifications of the DeepVGI method. Finally,
Section 4.4 investigates the proposed task allocation strategy and how the combined use of MapSwipe and DeepVGI affects performance and volunteer efforts.
4.1. Data Preparation
We employed the DeepVGI method presented in
Figure 2 for classifying satellite imagery tiles into “no building” and “building” classes. The DeepVGI building detection model consisted of three parts: feature extraction, object detection and binary classification.
Based on Single Shot Detection (SSD) networks [
34] the model extracted heterogeneous features from either the base network or from extra layers. This enables SSD networks to better handle complex objects (such as buildings) of diverse scale and shape. For doing so, SSD networks apply the concept of tiling into default boxes so that specific feature maps learn to be responsive to particular scales of the objects [
34].
The object detection generated a set of predicted building bounding boxes together with the corresponding probability scores. The implementation of the SSD network was based on the programming language Python 3.6 and the deep learning library Tensorflow [
35]. For the initialization of the SSD parameters, a pre-trained network based on the Microsoft COCO data set [
36] has been employed, which reported a
(mean average precision) of 24. The maximum training epochs has been set to 60,000, and the initial learning rate is set to 0.0004 with a momentum of 0.9. The pre-trained network is available at the Tensorflow detection model zoo [
37].
The object detection generated up to 50 bounding boxes per tile; however, the majority of those bounding boxes did not represent buildings and were associated with very low probabilities. Since we were interested in a binary classification of a tile t into “no building” and “building” we only selected the highest bounding box score for each tile. From the training data set derived a classification threshold . Tiles with below were most probable to belong to the “no building” class. Vice-versa tiles with above were most probable to belong to the “building” class“. Based on we generated the label (“no building” and “building”) for each tile in the testing data set.
Finally, we derived a confidence score for each tile by computing the absolute difference between the binary threshold and (deep learning) probability . This was used as a proxy for how confident we can be in binary classification into either “building” or “no building”. Taking the absolute value eased the visual interpretation. However, situations where the highest bounding box score was lower than the threshold (potential false negatives) could not be distinguished from those where the bounding box score was higher than the threshold (potential false positives) from alone. Hence, the analysis of the confidence score provided insights into accuracy of the DeepVGI approach, but not towards its specificity or sensitivity.
To train the DeepVGI model, building footprint samples from OpenStreetMap and satellite imagery tiles from Microsoft Bing were employed. In our experiment, satellite imagery tiles were collected by requesting a tile map service (TMS) from Microsoft Bing at zoom level 18. This corresponded to a spatial resolution of the displayed image of roughly 0.6 m per pixel, as measured at the equator. The size of all image tiles was pixels.
4.2. Overall Performance Evaluation
We evaluated our method by investigating the quality of the produced results against the reference data (see
Section 3.2). Initially we derived the proportions of false negatives (
), false positives (
), true negatives (
), and true positives (
). To address the imbalance of building and no building labels in our study areas, we used the following metrics: specificity (
), sensitivity (
), and Matthews correlation coefficient (
). We further derive the accuracy (
). The statistics were computed as shown in Equation (
1) through Equation (
4).
,
and
are restricted between 0 and 1.
is in essence a correlation coefficient between the observed and predicted binary classification. It is bound between −1 and 1. For all statistics higher values indicate a better model fit [
38].
Whereas
was mainly used to compare the results with works of other authors,
gives a more reliable indicator on quality for imbalanced data sets [
38].
and
were used to investigate how well the analyzed methods identify positives (“building” class) and negatives (“no building” class). This provided insights on the strengths and weaknesses of each method. Other metrics commonly applied for machine learning performance assessment such as F1 score or precision were not considered since they are highly biased for imbalanced data sets [
38].
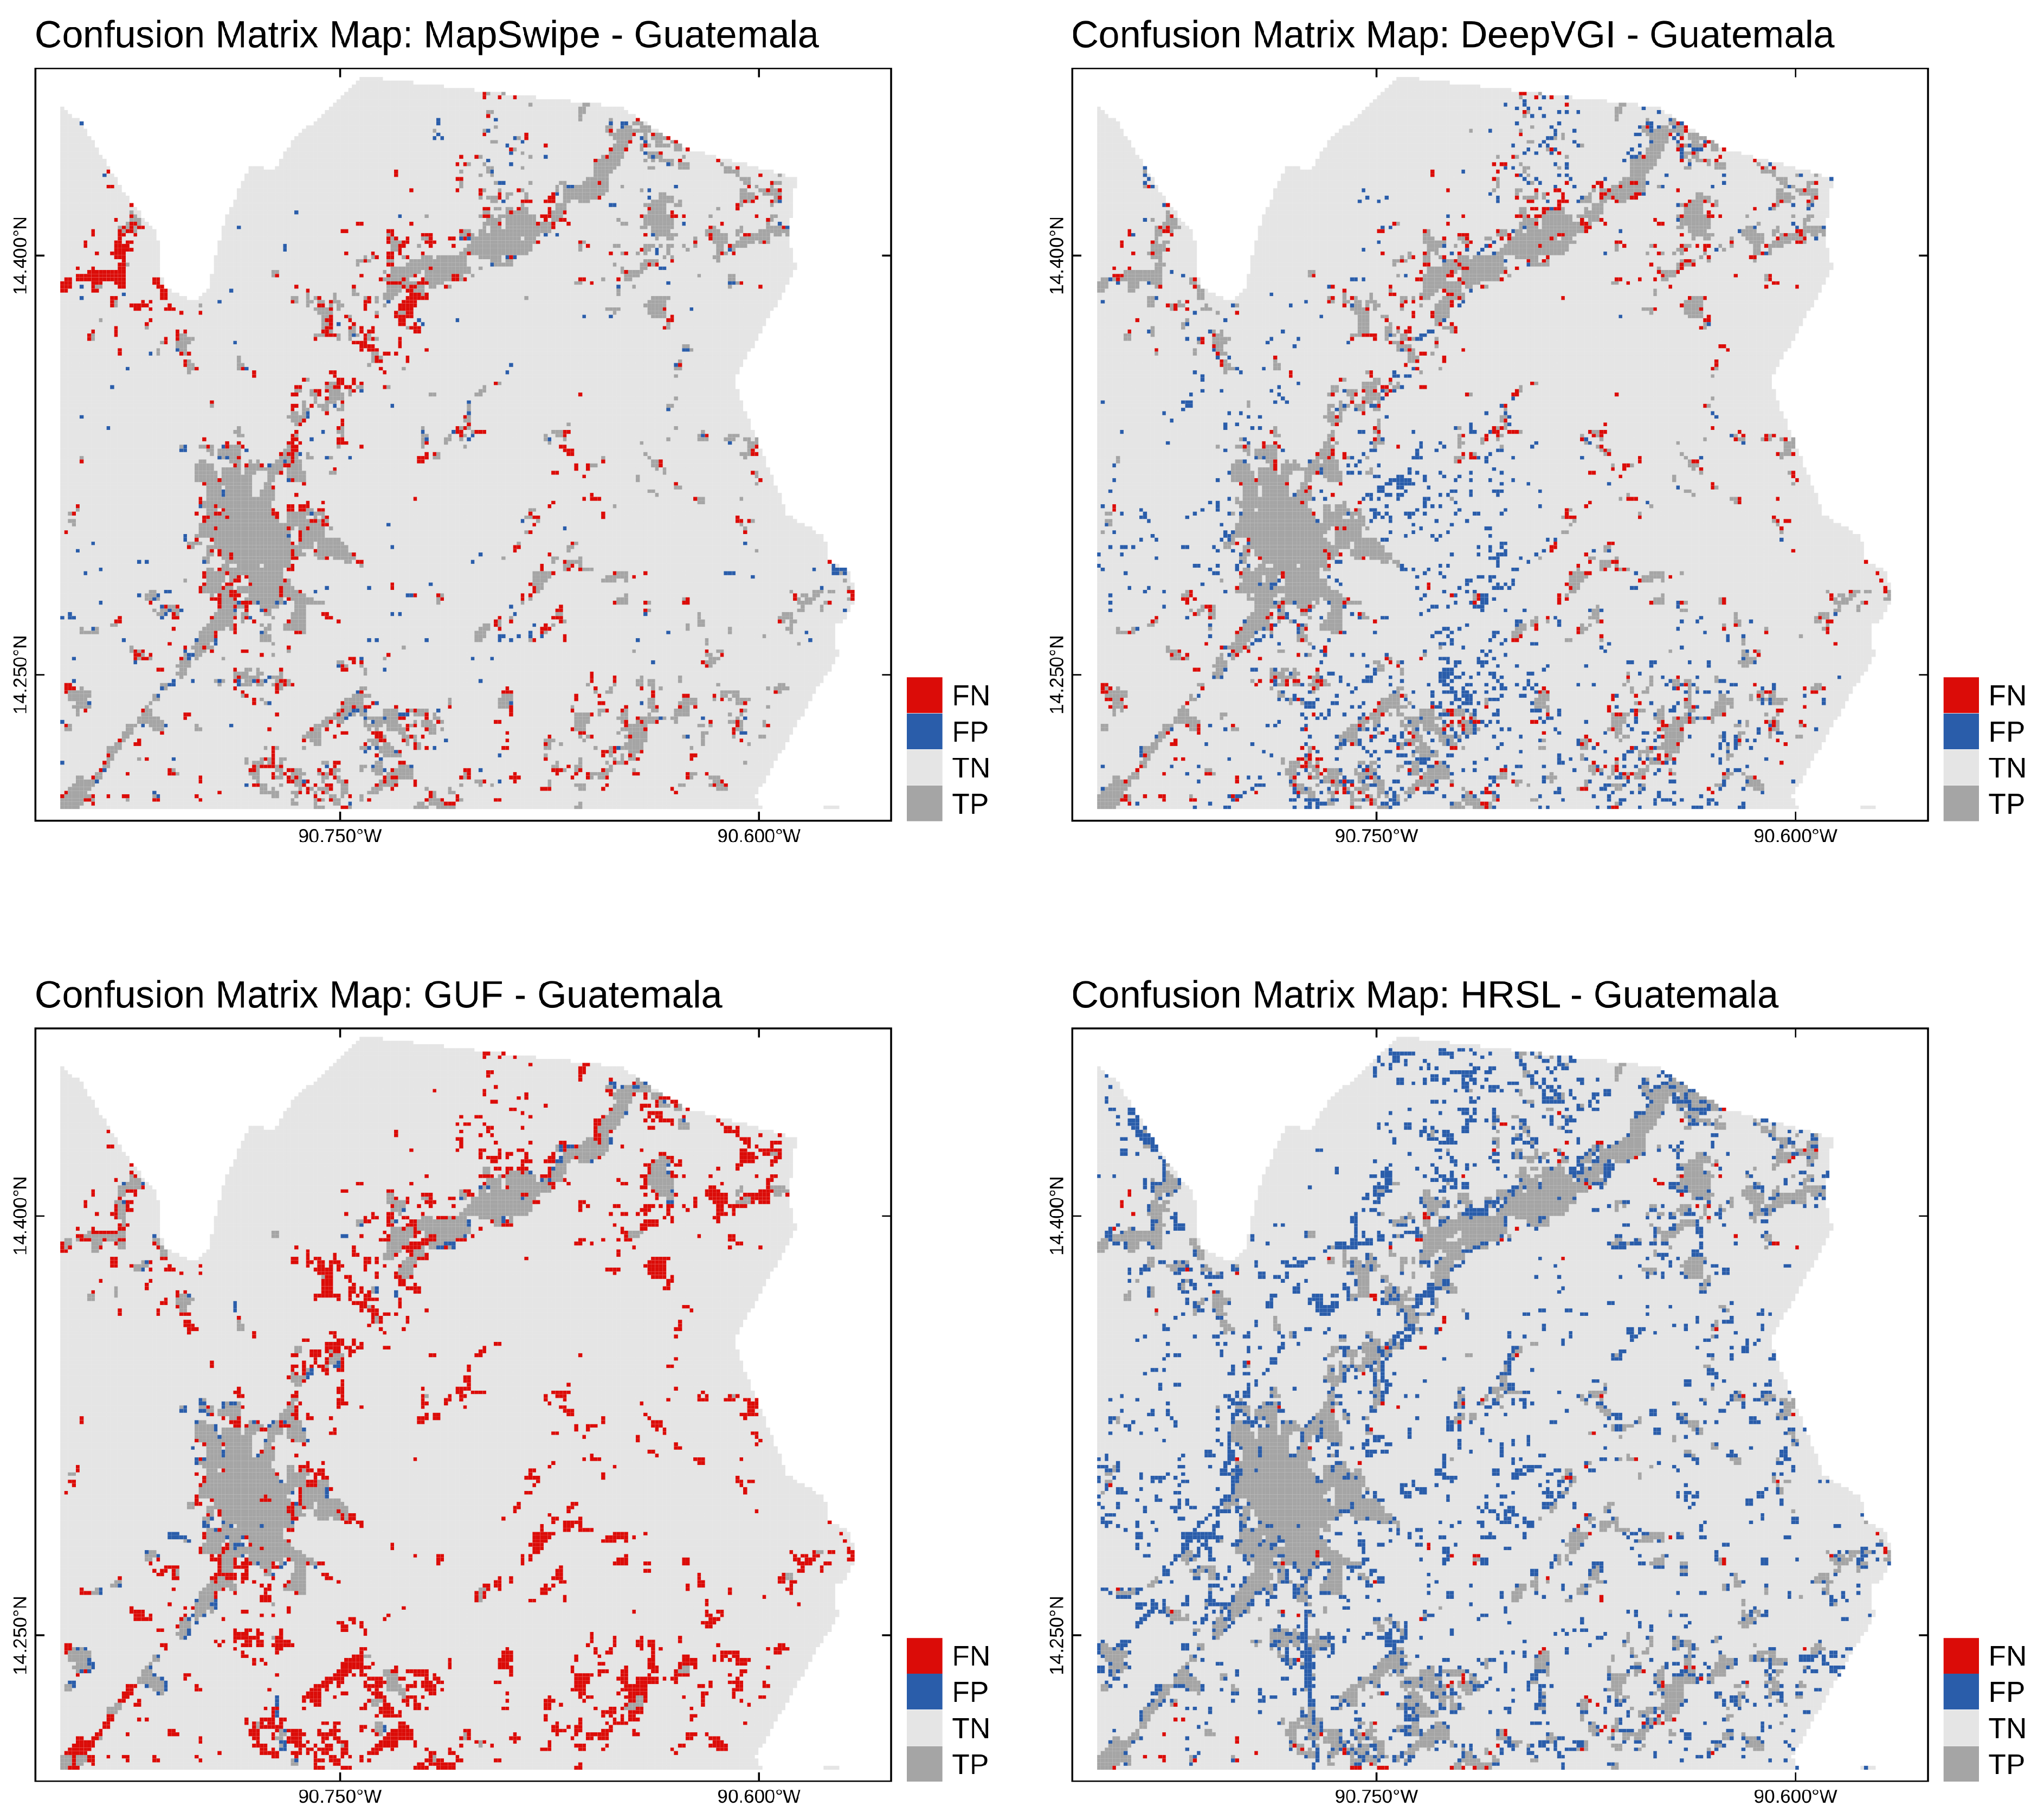
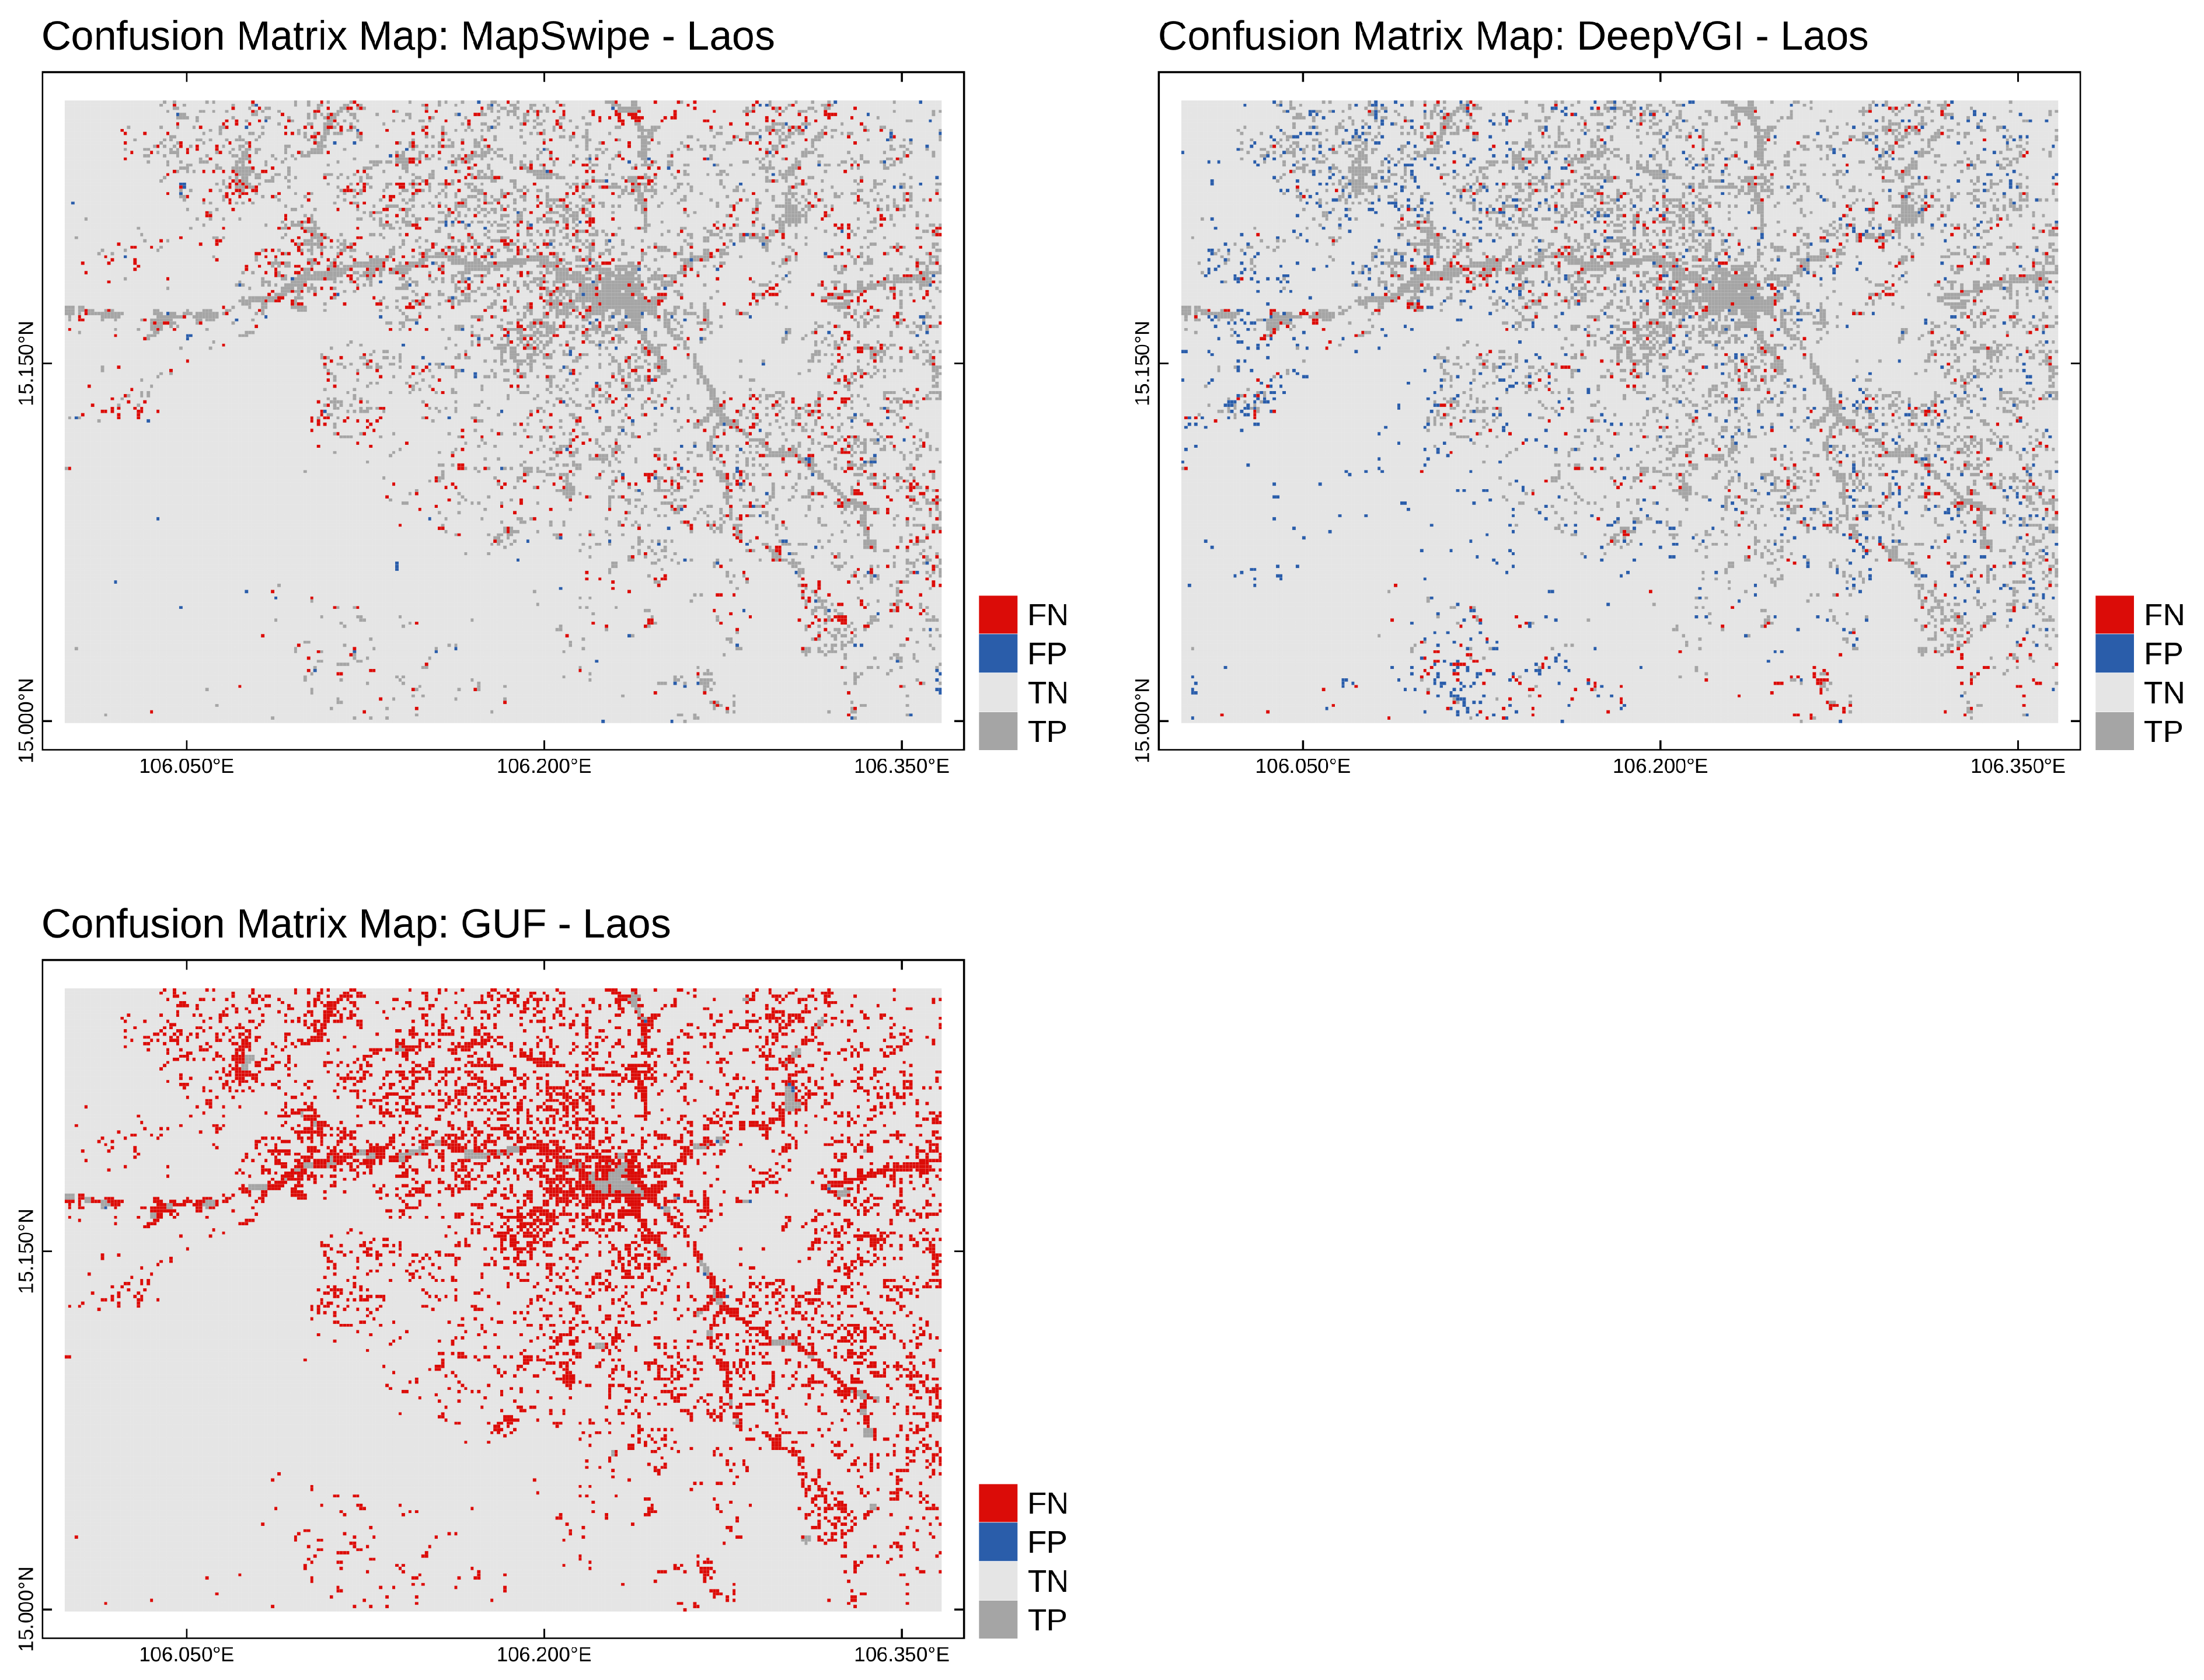
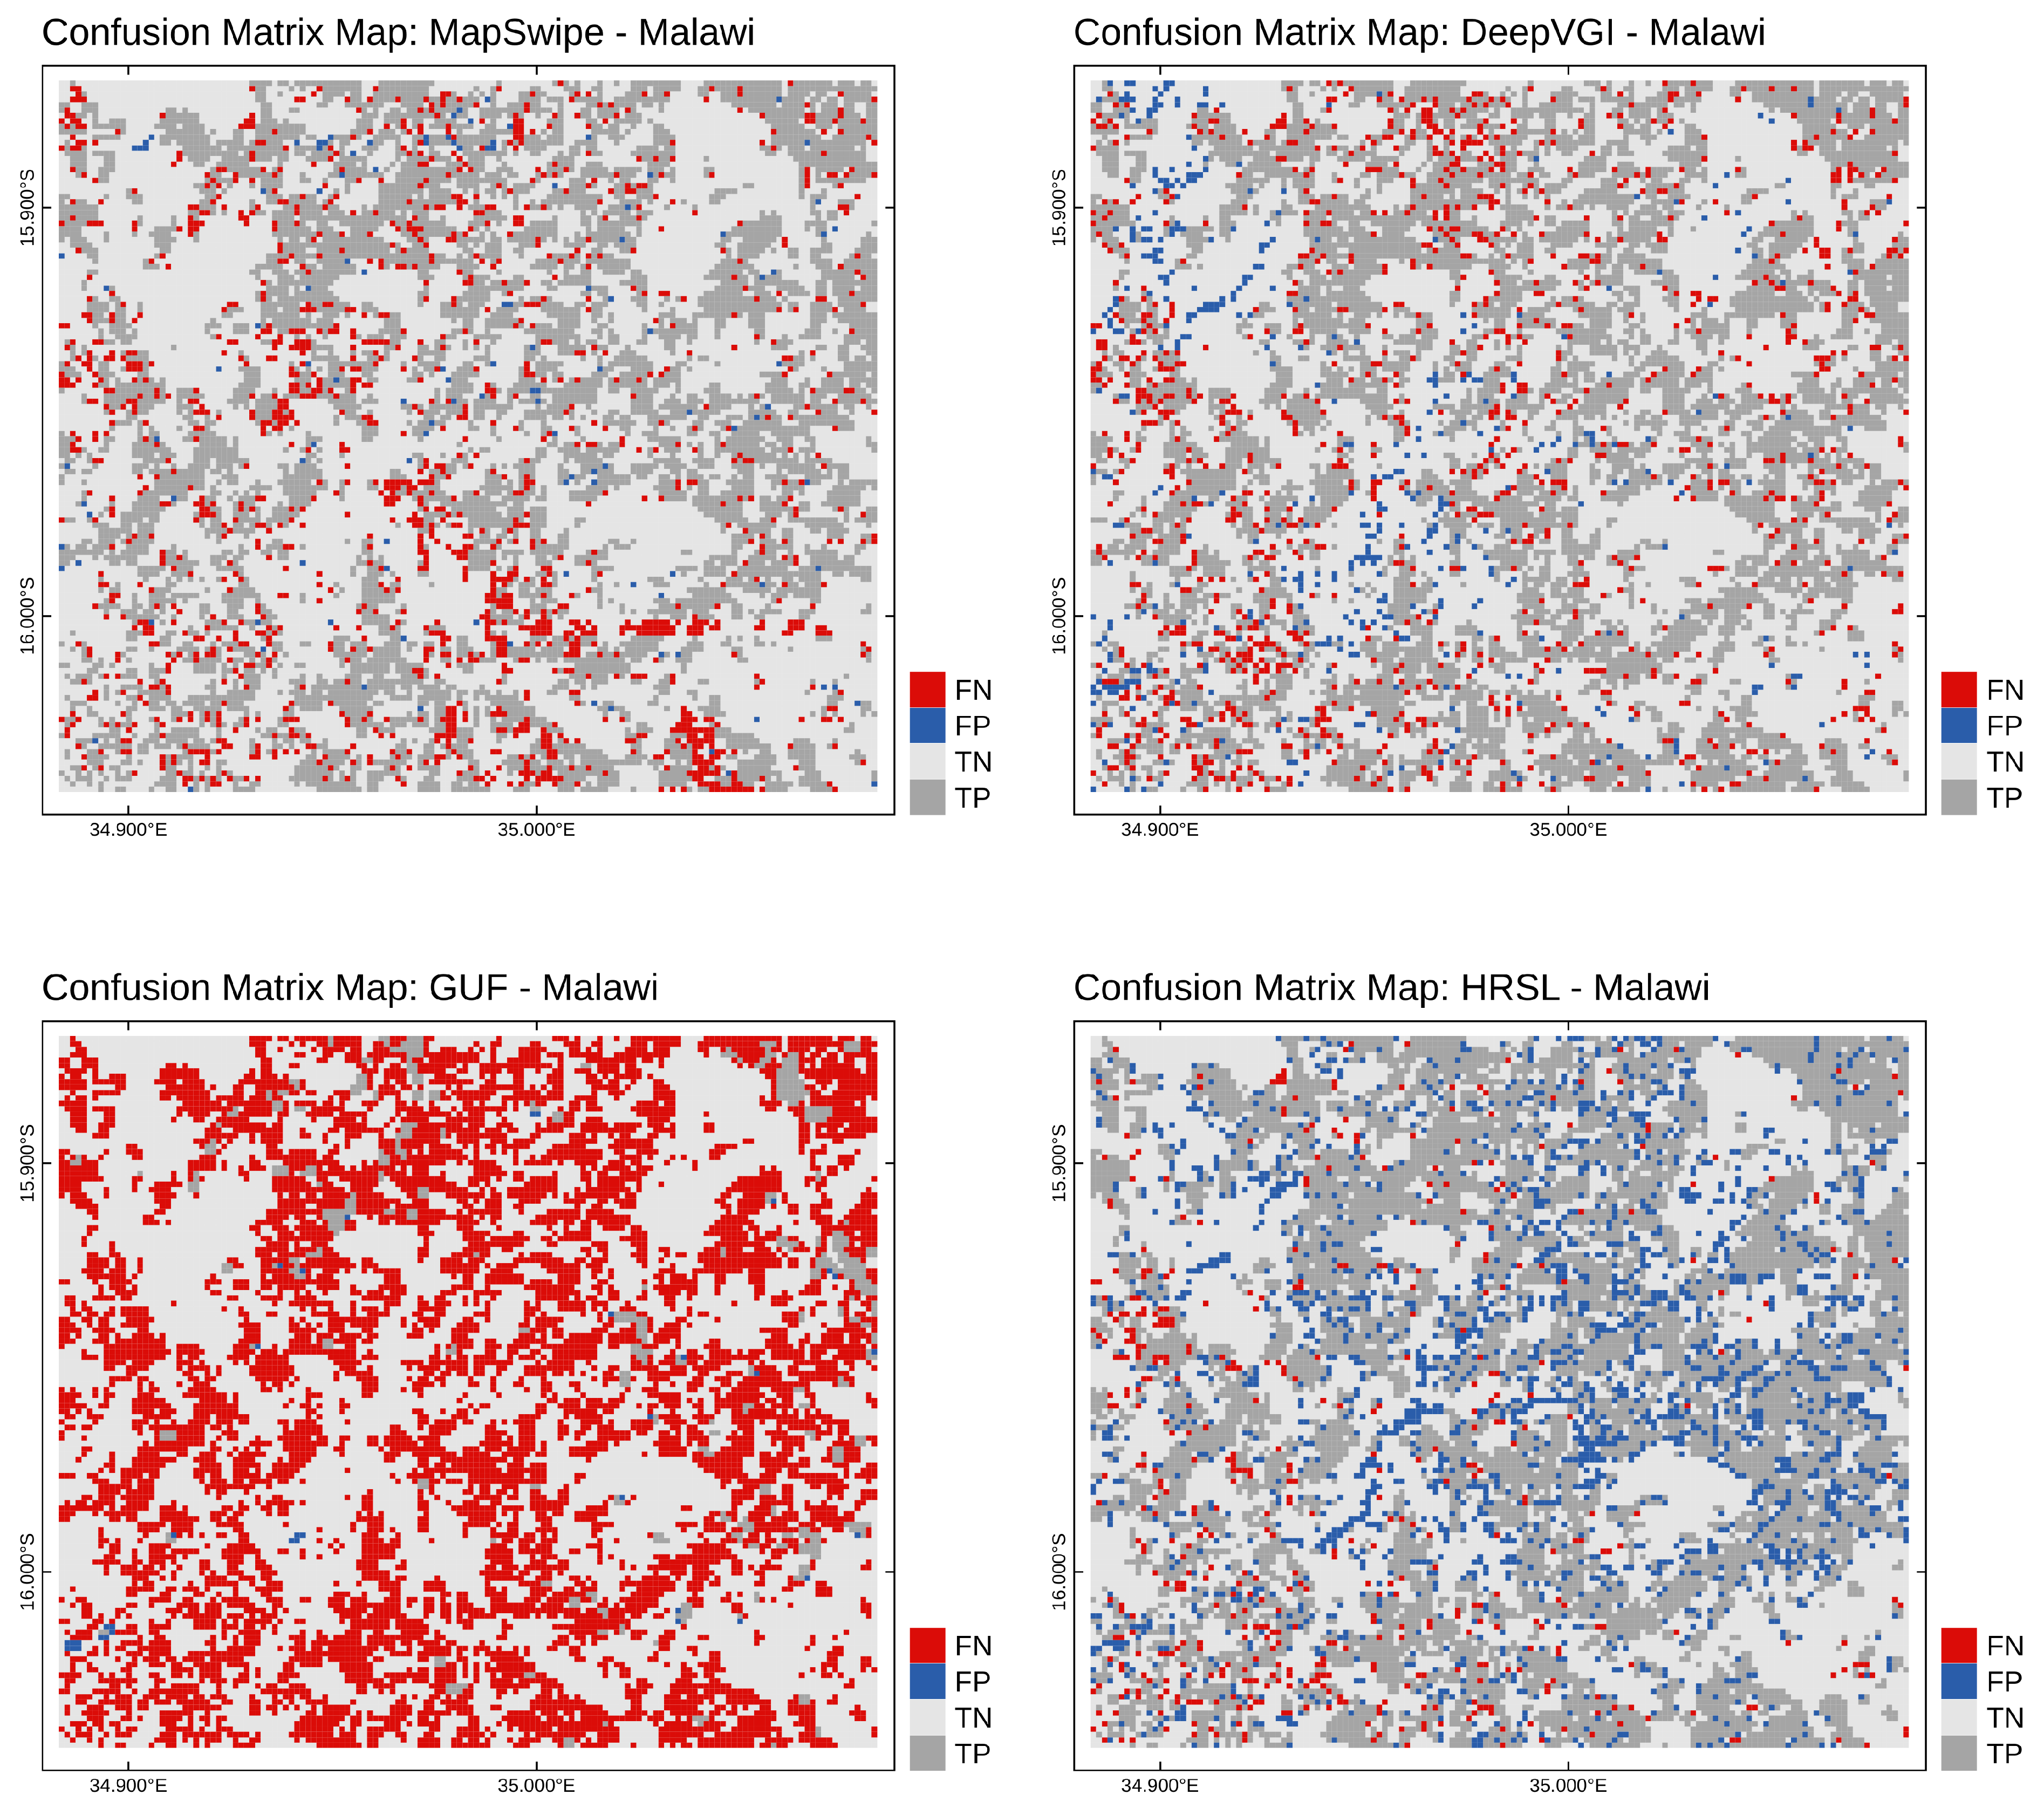
Additionally, we generated a map representation of the confusion matrix for each method and study site to spot spatial pattern in the false negatives and false positives.
4.3. Spatial and Non-Spatial Characteristics of Misclassifications
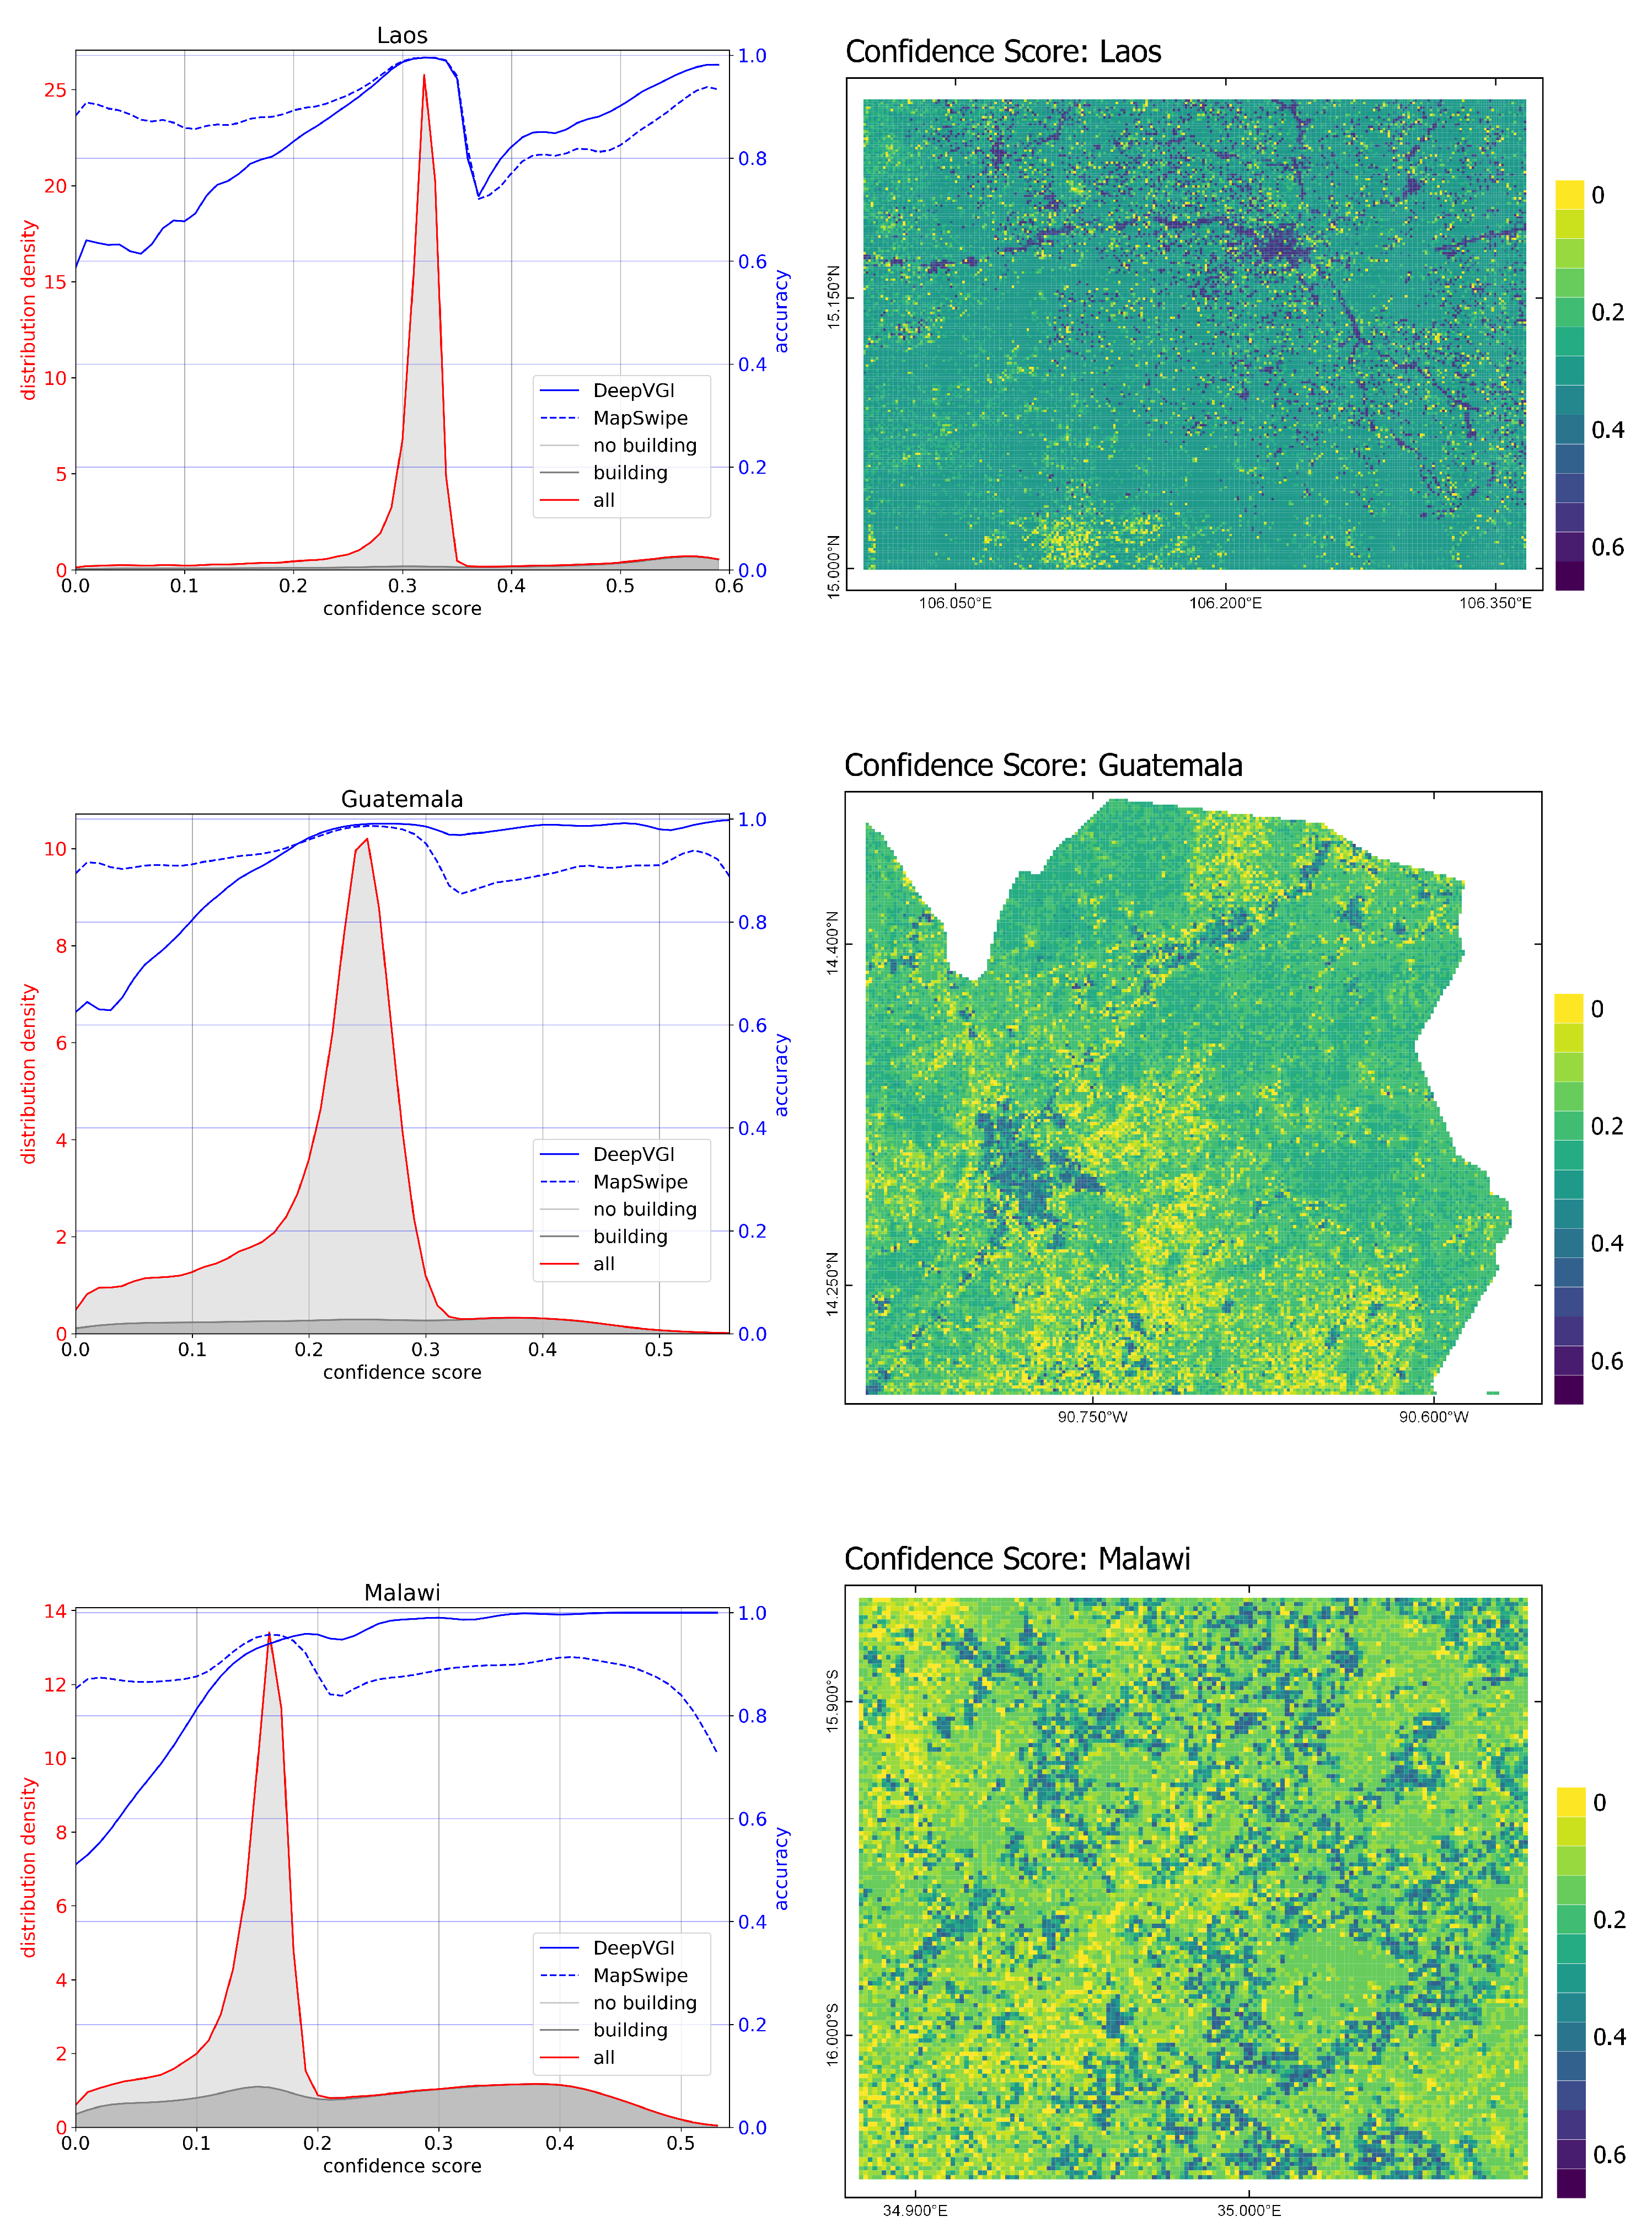
After investigating the overall performance of all methods, we conducted a detailed analysis of spatial and non-spatial characteristics of misclassifications of the DeepVGI approach. For doing so, we generated kernel density distribution plots of the confidence scores
for (a) all tiles, (b) “building” tiles and (c) “no building” tiles. The implementation of the kernel density functions was based on the programming language Python, version 3.6 and the scipy library, version 1.1.0 [
39]. The kernel bandwidth was set by applying Scott’s rule [
40]. We generated a map representation of the distribution of
to analyze the spatial characteristics of the confidence in the presence of buildings. This map should be interpreted together with the maps showing the distribution of false negatives and false positives.
Furthermore, we generated conditional density plots to visualize the conditional distribution of accuracy in respect to and to compare the performance of the DeepVGI and MapSwipe approaches.
We tested if tasks with lower
had a higher probability of being wrong by using a logistic regression model for the DeepVGI and MapSwipe approaches, using
as the predictor and
Y as the response.
Y was defined as “0” for wrong classifications (e.g., DeepVGI label and reference label were not the same) and “1” for correct classifications (e.g., DeepVGI label and reference label were the same). For the logistic regression we report on regression coefficient, standard error, significance, and McFadden’s pseudo-r-squared values [
41]. Those were computed based on the programming language Python 3.6 and the statsmodels library, version 0.9.0 [
42].
4.4. Performance of Task Allocation Strategy
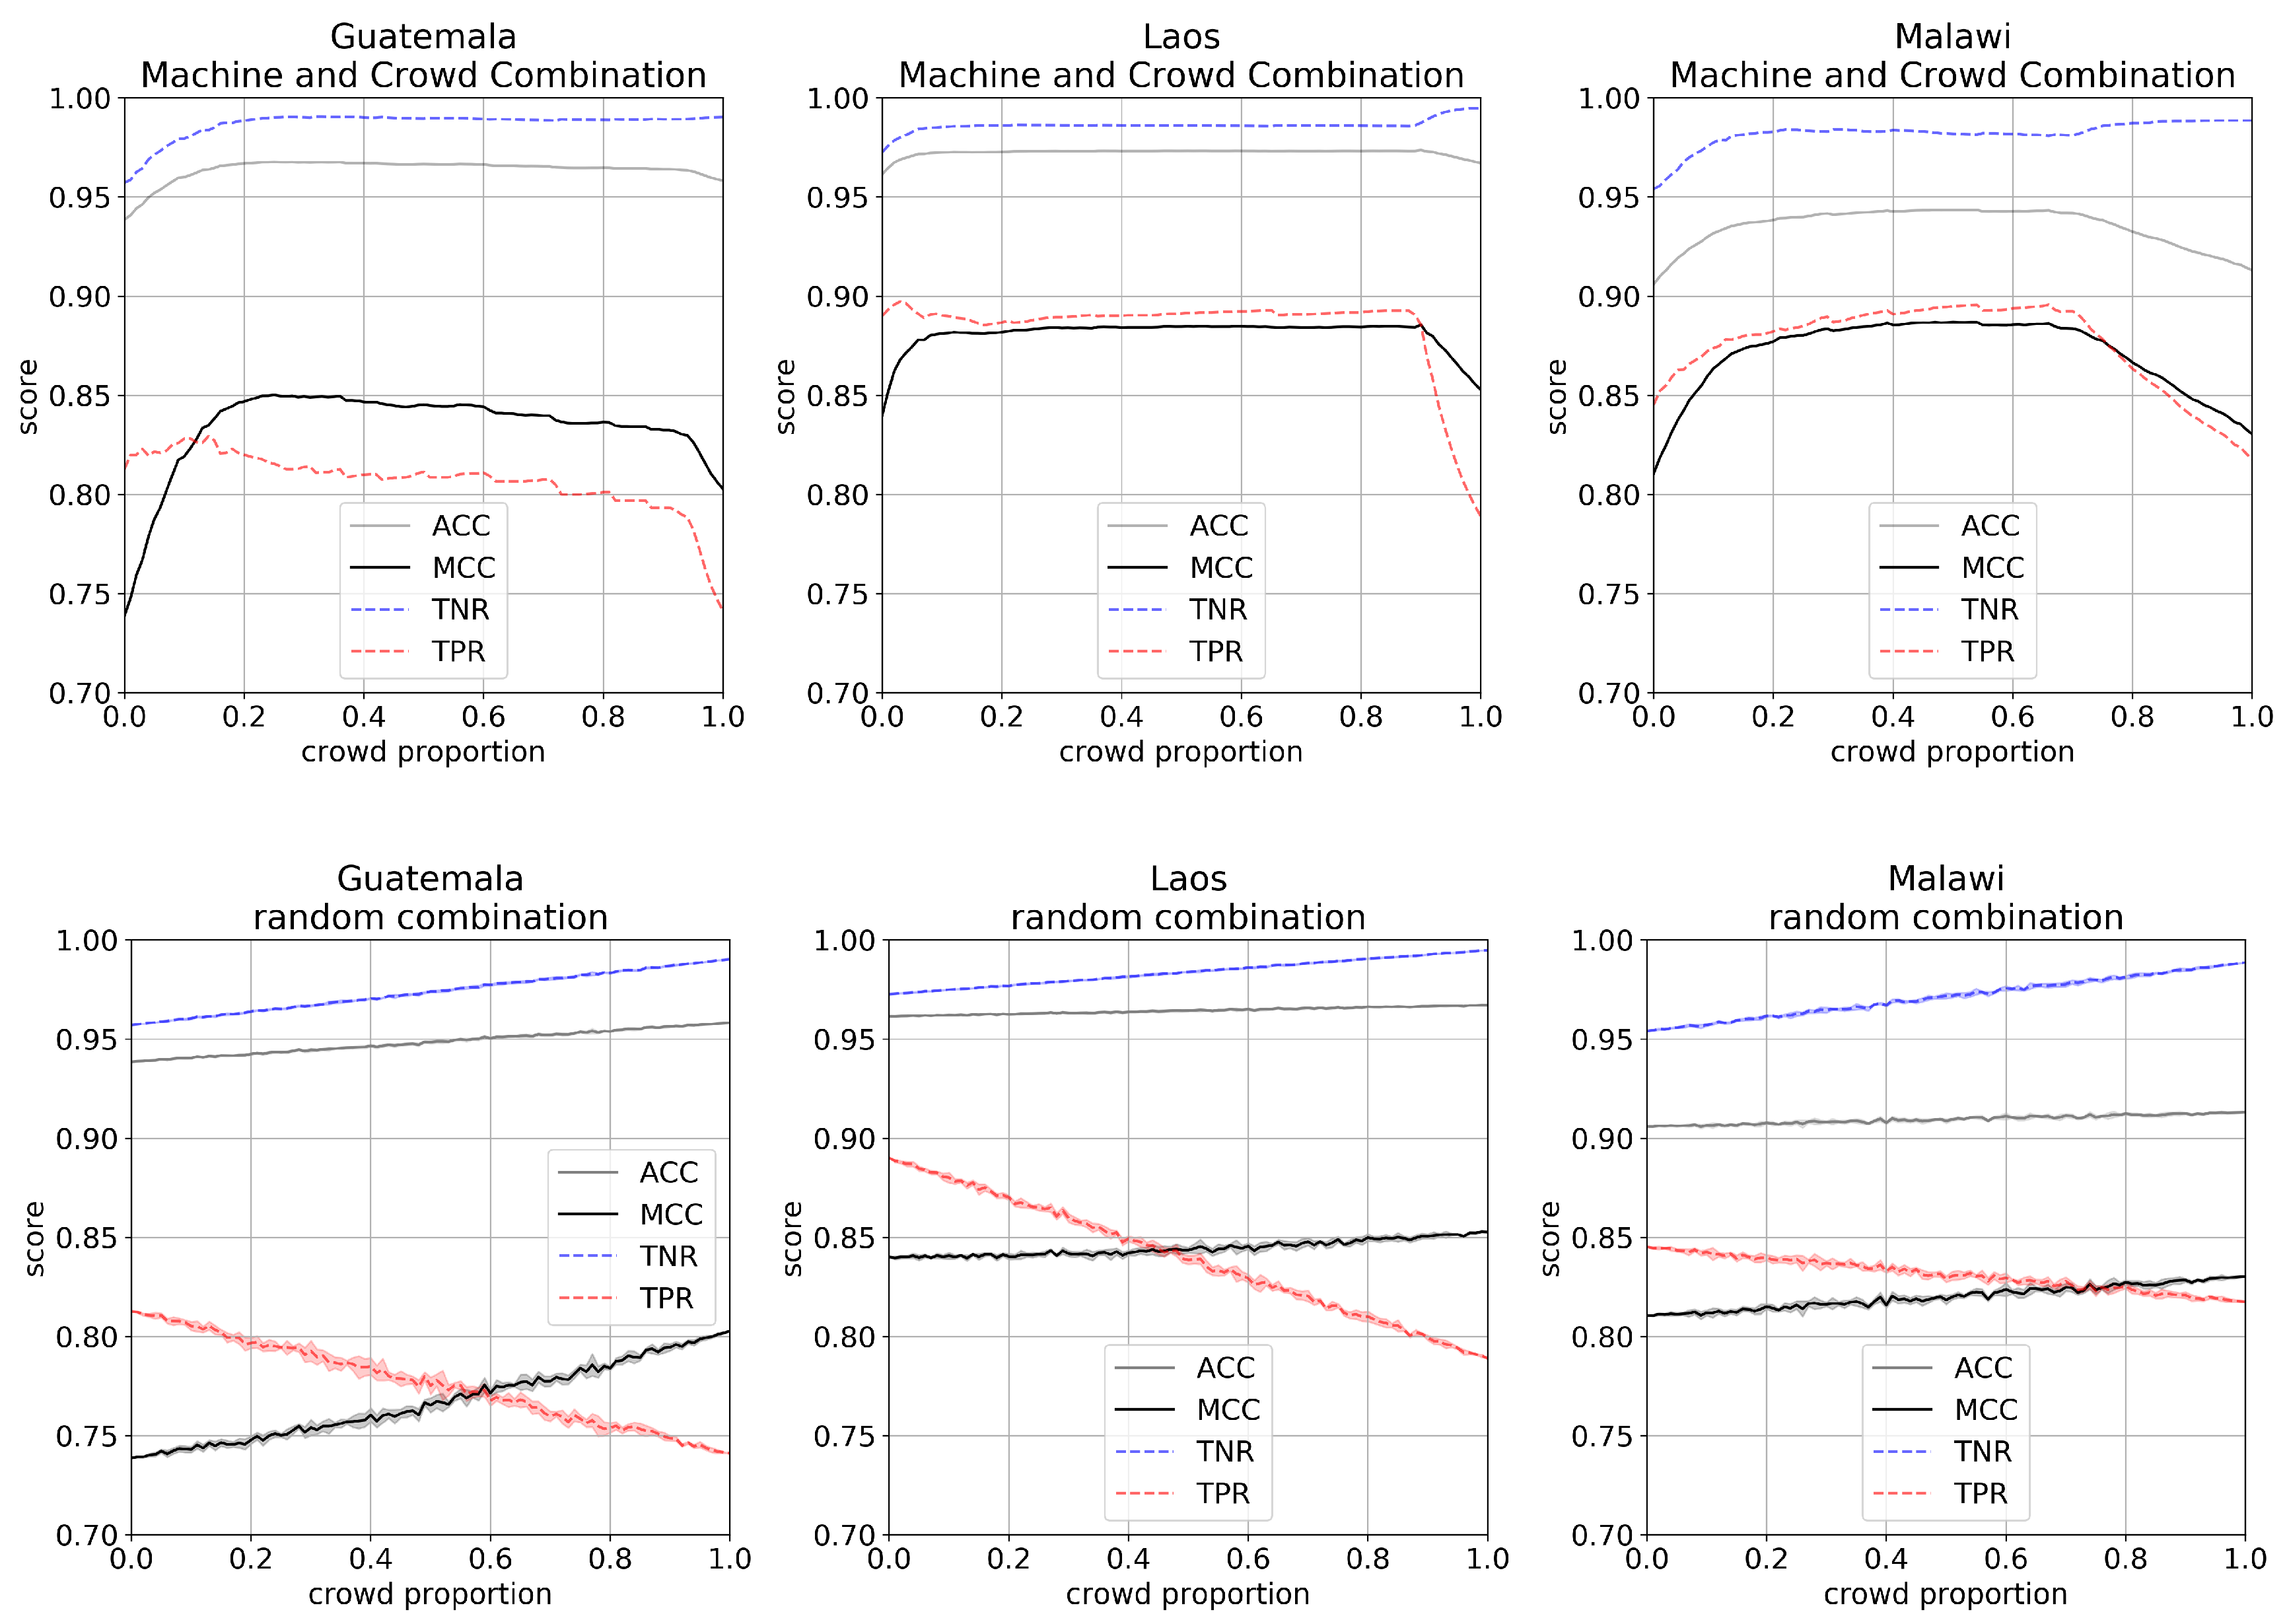
Finally, we proposed a task allocation strategy based on and compared the approach to a random allocation of tiles between DeepVGI and MapSwipe. The task allocation strategy defines for which tasks it is better to rely on results being produced by crowdsourcing and for which it is preferable to use the DeepVGI workflow. First, tiles were sorted ascending by . We generated the labels based on the fusion of both approaches by choosing a proportion of tiles which should be labeled by the crowd (we will refer to this as crowd proportion). For the remaining tiles we assigned the label of the DeepVGI method. Due to this design tiles with the lowest confidence were allocated to the crowd first.
We generated 100 set of the combined labels for each study site by choosing a crowd proportion
between [0,1] and adopting a step size of 0.01. For each
we further derived 250 random combinations of MapSwipe and DeepVGI. For each
we investigated the performance of both task allocation strategies in terms of accuracy
, Matthews correlation coefficient
, specificity
and sensitivity
(described in
Section 4.2). The results were visualized in a graph depicting performance in relation to the crowd proportion
.
6. Discussion
6.1. Overall Performance Evaluation
The crowdsourcing approach by MapSwipe generated the most accurate human settlement maps for all case study sites with Matthew’s correlation coefficient between 80% to 85%. As expressed by the differences in specificity and sensitivity between the MapSwipe approach and the DeepVGI approach, our results supported the common hypothesis that humans rarely identify something as a building which is not a building, but tend to miss buildings. In contrast, our results indicate that deep learning approaches tend to miss fewer buildings at the cost of also falsely detecting a range of objects which are not buildings. In comparison to GUF, crowdsourcing and deep learning-based approaches demonstrated an improvement in data quality for our case study sites.
The performance of MapSwipe seemed to be consistent with previous findings from Albuquerque et al. (2016) [
9], where an accuracy of 89%, a sensitivity of 73% and a precision of 89% are achieved for a very similar crowdsourced classification task for a study site in South Kivu (Democratic Republic of the Congo). For the case of automated village boundary detection Gueguen et al. (2017) [
8] report an average precision of around 70% and a sensitivity of around 84%. Yuan et al. (2018) [
30] compare a deep learning-based approach against GUF and GHSL for Kano city (Nigeria) and reach similar results. Their building extraction algorithm performs with a precision of 72% and a sensitivity of 70%. Their approach slightly improves the GUF, but significantly outperforms the Global Human Settlement Layer. Klotz et al. (2016) [
7] show that GUF and GHSL significantly increased the completeness and precision of global build-area maps in comparison to previous low-resolution products such as MOD500 or GLOBC. Nevertheless, the authors also point out quantifiable weaknesses in rural areas, which could be confirmed by our study results as well. Whereas the GUF was of moderate quality for the sub-urban Guatemala study site, its weakness for the rural study sites in Laos and Malawi was immense.
Nevertheless, our results also suffered from limitations in our data sets and methods applied. Due to the imbalance of “no building” and “building” tiles, the accuracy
reported was biased towards identifying “no building” tiles correctly. This imbalance was strong for Guatemala and Laos, but less pronounced for Malawi. Whereas
and
show no bias, Matthew’s correlation coefficient is biased as well (but not as strong as accuracy) [
38]. This reduces the comparability of our results with the findings from other studies with less imbalanced data.
In this study, we did not investigate the effects of the imbalance on the training procedure of the DeepVGI approach. Furthermore, we decided to use a very specific network architecture and pre-trained model (SSD based on COCO data set, see
Section 4.1). Our two-step approach (object detection first, then binary classification) also introduced further uncertainties. Whereas our results seemed to be consistent with the findings from other studies, further research is necessary to fully understand the impact of the data preparation on performance. For instance, Tiecke et al. (2017) [
6] present a computer vision method to create population maps from satellite imagery with a very high resolution and provide further insights on potential systematic errors. The authors highlight the problem related to repetitive errors, such as the misinterpretation of large rocks, boats, or mountain ridges as buildings. Analyzing the potential sources of systematic errors would be of great benefit for our study to understand spatial clusters of false positives. New advances in machine learning research might produce architectures and training data sets which suit better to the specific use case of mapping human settlements. To reduce uncertainties in our approach, future studies should compare different architectures and training data set characteristics also regarding imbalanced classes.
Uncertainties were also present for the results of the MapSwipe approach. Using majority aggregation to generate binary labels from the individual user classifications favored higher specificity
, whereas choosing another method might have promoted higher
. The drawbacks of majority agreement are well described by Salk et al. (2016) [
43]. The confusion matrix maps showed that wrong classifications were not randomly distributed, but revealed spatial pattern. For MapSwipe this has already been confirmed in Herfort et al. (2017) [
15]. For our study, this implies that individual user behavior, geographical characteristics of the surrounding of building features might be major causes of wrong classifications limiting the transferability of this approach. A more detailed analysis is necessary to understand the factors which drive the quality of crowdsourcing and its implications for human settlement maps.
Satellite imagery quality is another major concern for both crowdsourcing and deep learning approaches. Better satellite imagery (e.g., in terms of resolution), might strongly influence the performance of MapSwipe and DeepVGI. Our current study was limited to satellite imagery tiles at zoom level 18. For the regions analyzed in this study, satellite imagery tiles with a higher image resolution at zoom level 19 were not available from Bing Maps. Nevertheless, new earth observation satellites such as WorldView3 would potentially provide sufficient imagery data for this zoom level. The scarce availability of up-to-date satellite imagery, emphasizes another drawback of MapSwipe and DeepVGI: the quality of the human settlement maps is closely tied to the structures visible in the satellite images. In situations where settlement patterns change rapidly, e.g., due to forced displacement, on the ground data is irreplaceable unless up-to-date satellite data becomes available.
6.2. Spatial and Non-Spatial Characteristics of Misclassifications
Our analysis provided insights into the spatial and non-spatial characteristics of misclassified tiles of the DeepVGI method. For all study sites the conditional density plots and logistic regression analyses revealed a significant correlation between confidence score and accuracy. Additionally, the results showed no such correlation for the MapSwipe data set. This indicates that DeepVGI and MapSwipe tended to detect different tiles with different characteristics at varying accuracy. We interpreted this as potential complementary value of both approaches.
However, the limited explanatory power of accuracy for imbalanced data sets needs to be considered for our study (especially for Guatemala and Laos). Hence, the increase in accuracy mainly depicted the correlation between specificity
and confidence score. The design of the confidence score (using absolute values, see
Section 4.3) hampered the differentiation of false positives and false negatives. Whereas this simplification turned out to be beneficial for the logistic regression analysis, using a more sophisticated method, e.g., relying on a quadratic function, would have reduced the bias introduced due to class imbalance. Furthermore, higher confidence scores might be also related to the number of detected buildings per tile. In our approach, the confidence score was based only on the most probable building detection and did not consider multiple detections per tile. This approach increased uncertainties for tiles, for which only a few buildings were located, e.g., in rural areas.
The results of the logistic regression analysis highlighted that confidence score contributed to the probability of tiles being misclassified, but only to a minor fraction. For the case of land cover mapping with a focus on urban areas Kampffmeyer et al. (2016) [
27] provide similar findings and show that pixels with low uncertainty are more likely to be classified correctly. As in our study, areas of class boundaries were a cause of wrong classifications. However, our study showed as well that most misclassified tiles had a different cause not captured by our design. Our methods fell short especially in differentiating the confidence of “no building” classifications, which however constituted most tasks in our study areas.
Further research is needed to expand our understanding of the systematic errors underlying our approach. For example, we would investigate to what degree deep learning-based methods are able to map various building types, e.g., in relation to shape and size or to characteristics related to ethnic or social groups.
6.3. Combination of Crowdsourcing and Deep Learning
Combining the MapSwipe and DeepVGI methods using the confidence score-based task allocation strategy increased performance by around 3–5 percentage points measured by (compared to the MapSwipe-only approach). At the same time, the approach reduced the volunteer efforts to one fifth (labor reduction of 80 percentage points). Our results suggest that the task allocation strategy helped to exploit the complementary value of a sensitive method (DeepVGI) and a specific method (MapSwipe) and would improve the existing crowdsourcing approach MapSwipe uses.
For a similar set up but limited geographic scope Chen et al. (2018) [
31] show that a combination of results from machine learning and crowdsourcing can result in a labor reduction of 85 percentage points and achieves a similar accuracy. Gueguen et al. (2017) [
8] report similar findings regarding semi-supervised village boundary mapping and are able to improve the precision of automated data extraction by introducing a crowdsourced validation step.
The combination of crowdsourcing and deep learning showed promising results for our selected case studies, but limitations of the presented workflow must be considered. First, the individual performance of both methods might have a great impact on the performance of the combined approach. Our approach was able to improve results because of the complementary characteristics MapSwipe (high
) and DeepVGI (high
) hold. Due to the uncertainties of crowdsourcing and deep learning (discussed in
Section 6.1) these differences between the two methods might be less pronounced or even reversed in other regions.
Considering the needs of humanitarian organizations (e.g., getting information on human settlements for which no other data sets exist) our approach could be used in real applications. However, the current workflow was not able to provide a clear estimation which crowd proportion would generate optimal results beforehand. Project managers organizing humanitarian mapping campaigns would still need to adjust the proportion of tasks mapped by the crowd manually, e.g., in respect to the given time frame and complexity of the mapping task.
We tested the workflow for three rather diverse study sites, nevertheless a more detailed investigation of the influence of geographic characteristics is necessary. Quantifying the differences between the study sites (e.g., in respect to land cover) would be a first step towards contextualizing the results. Together with an analysis of the quality of the satellite imagery and quality of the crowdsourced classifications this would help to understand for which study site characteristics a combination might result in better data.
7. Conclusions
Human settlement maps produced by crowdsourcing (MapSwipe) or deep learning (DeepVGI) showed large overlaps and for most areas both methods generated results with a similar accuracy. In general, both methods outperformed existing EO-based products such as the Global Urban Footprint in terms of and . The proposed confidence score indicator helped to explain misclassified tiles of the DeepVGI method and revealed the complementary value of DeepVGI and MapSwipe. Combining crowdsourcing and deep learning by applying the proposed task allocation strategy facilitated the complementary values of both methods and provided a promising extension to the existing crowdsourcing approach MapSwipe incorporates.
Further research needs to validate these findings also for other study regions and various settlement types and shapes and contextual features such as vegetation and land use. The large amount of finished MapSwipe projects provides an obvious starting point for such an extended geographical analysis.
Our study focused on the binary classification of satellite imagery tiles to map human settlements. Due to the structure of the MapSwipe results, the analysis was limited to the tile level. Future research should overcome this drawback and investigate human settlement classifications at a more fine-grained resolution and/or move on to investigating automatically generated building footprint geometries. Initial research in this direction has been conducted by Vargas-Munoz et al. (2019) [
32]; however national and regional investigations are necessary.
Reaching the targets of the sustainable development, planning disaster responses more efficiently and reducing the vulnerability of people at risk before disasters occur will remain challenges for the upcoming decades. The proposed combined use of satellite data, deep learning technology and citizen-based observations showed great potential to contribute to those efforts and future applications should consider the lessons learned from this research. However, to take fully advantage of the new opportunities there is a need to further understand the technical and non-technical challenges that come with them. The presented approach might help to identify data quality issues during or immediately after an object has been mapped to provide real-time or near real-time feedback for mappers. However, understanding and communicating the quality of automatically generated results and ensuring that tools and data are open and accessible are the very basis for this.
Integrating machine learning techniques into existing crowdsourcing applications will also create an increased need for technical knowledge for project managers and data users. From the citizen science and VGI projects perspective, introducing these new techniques might also lead to an increased demand for experienced validators, which are already few in number, presently. Whereas we envision to use these new tools to improve overall data quality and availability, they also constitute a new potential source of bias introduced into data sets such as OpenStreetMap. This bias might also be caused by class imbalances, which were present also in our study.
Taking all this into account, our results endorsed that for the creation of human settlement maps, we should rely on automated approaches (e.g., machine learning) when possible, but rely on human skills (e.g., citizens science and crowdsourcing) when needed.


