Multi-Source Data Integration to Investigate a Deep-Seated Landslide Affecting a Bridge

 ,
,  ,
,  , ,
, ,
Abstract
:1. Introduction
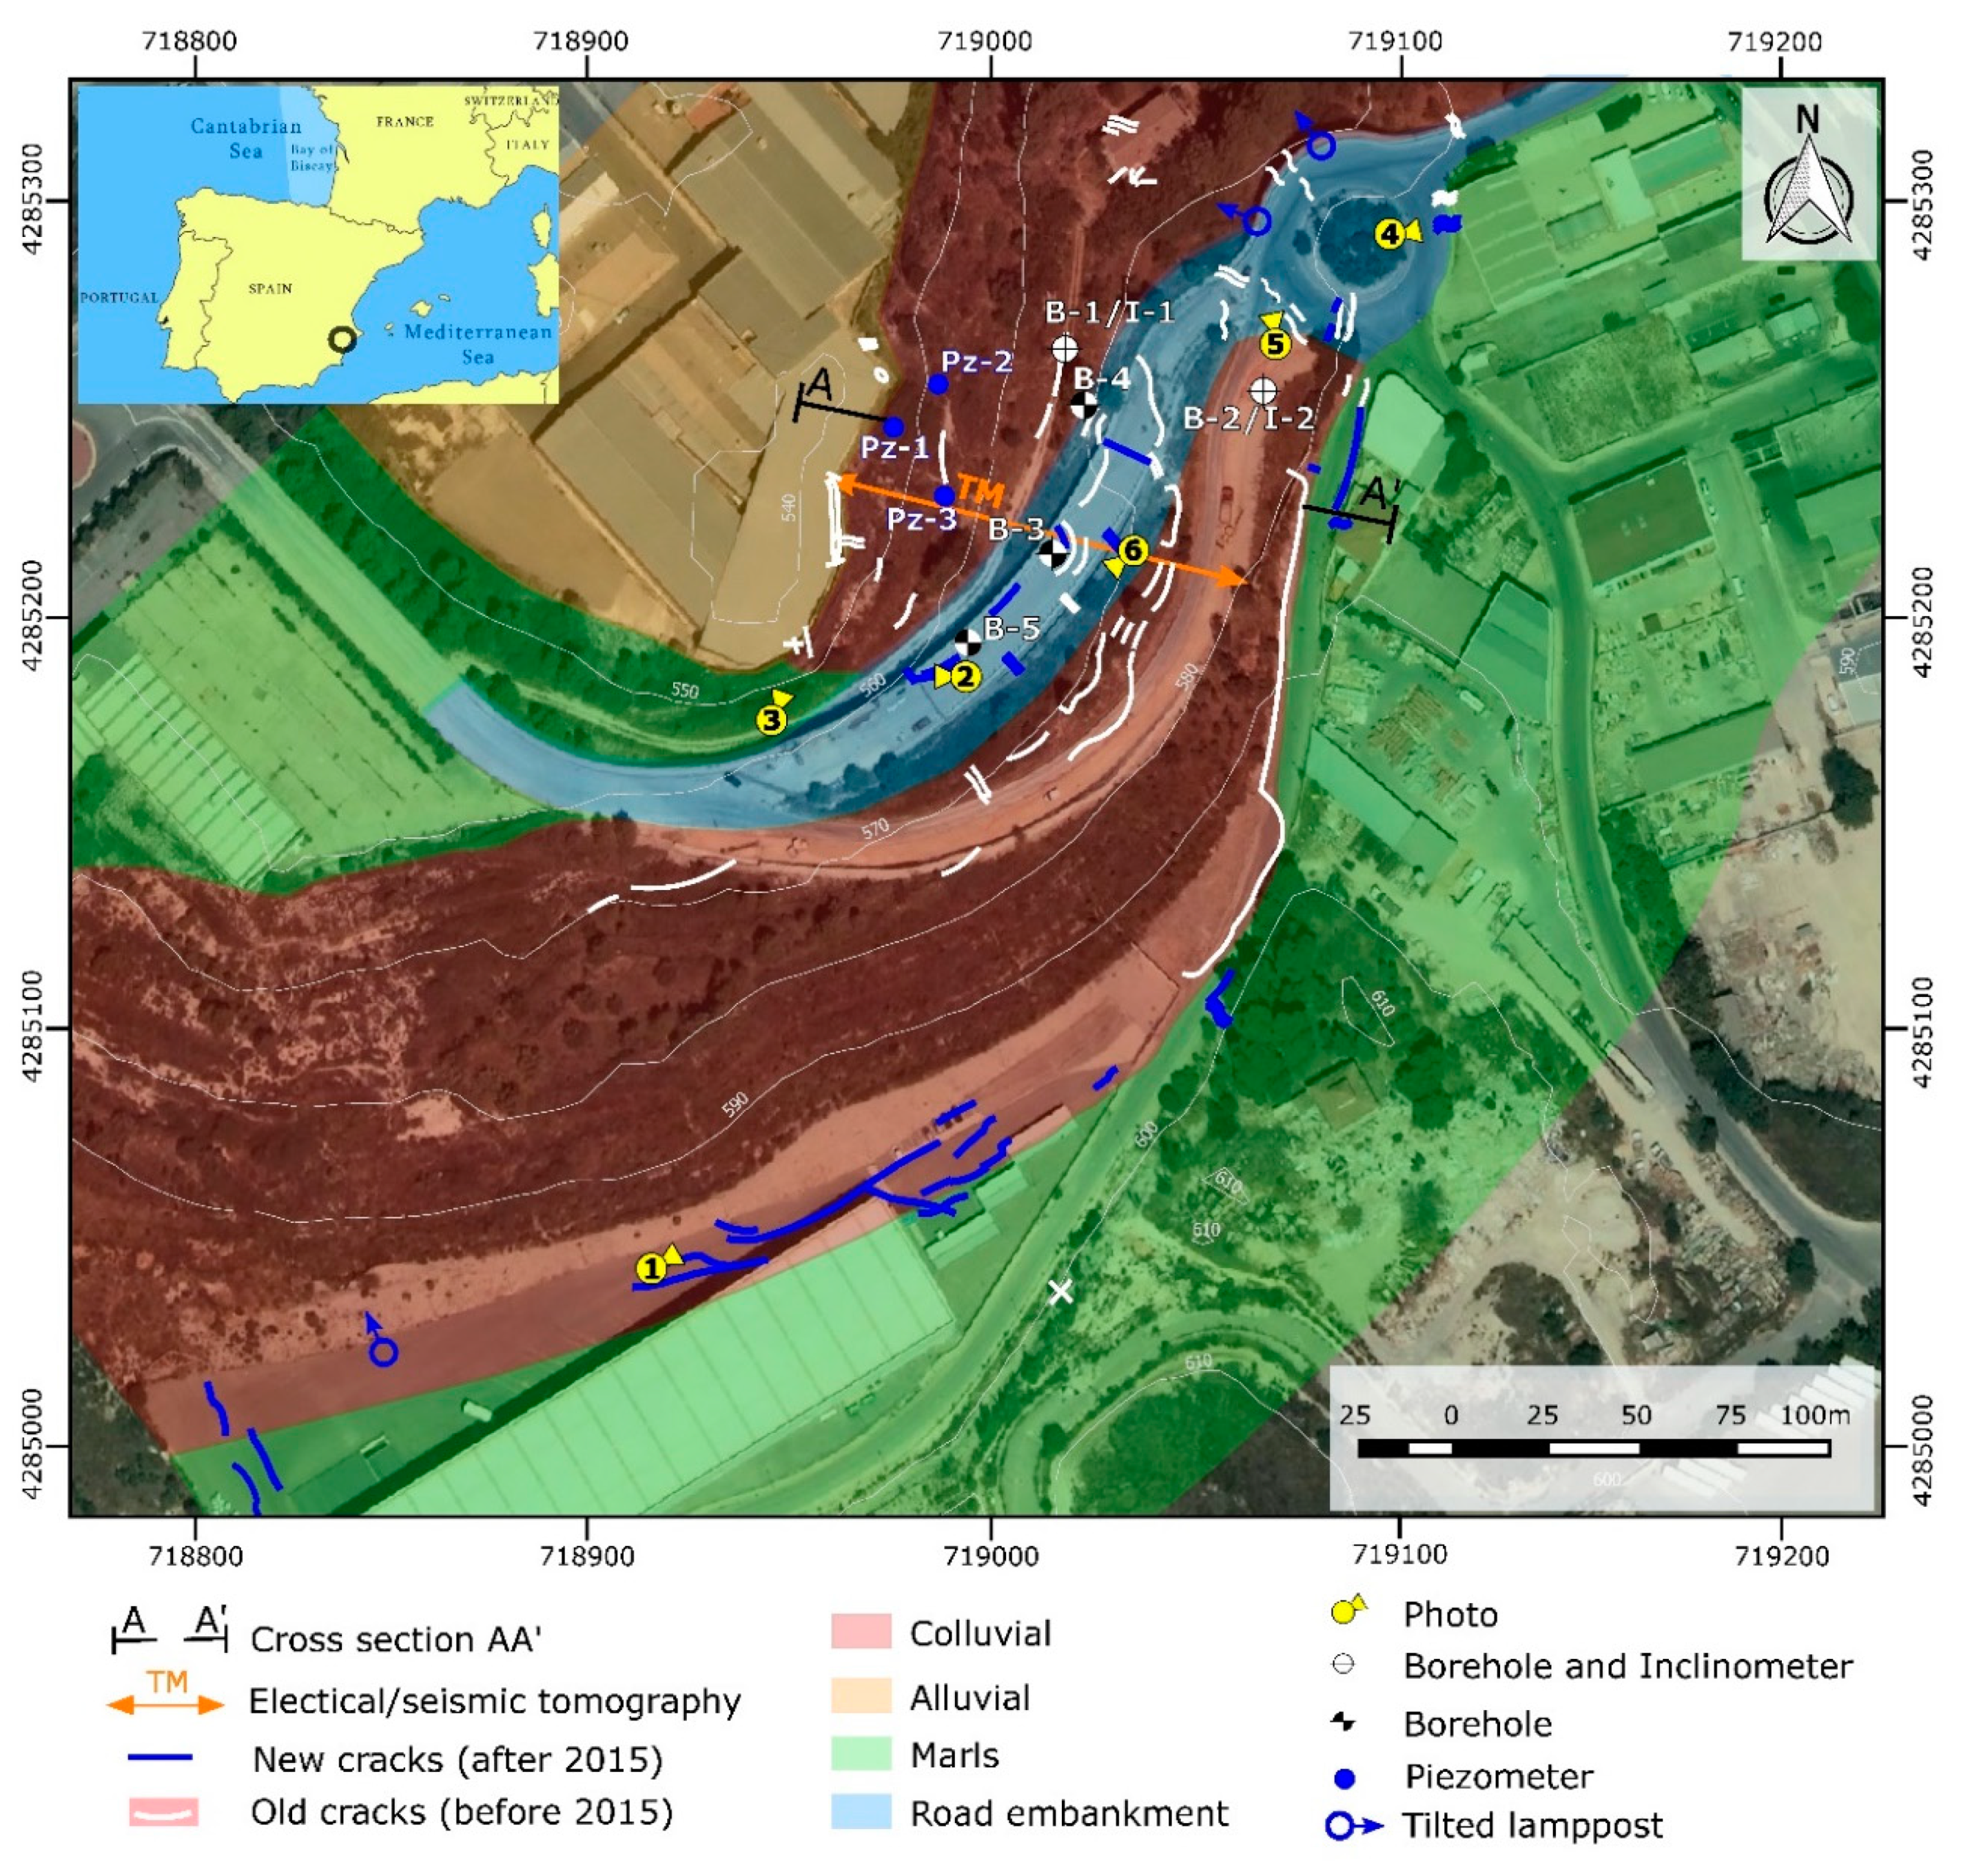
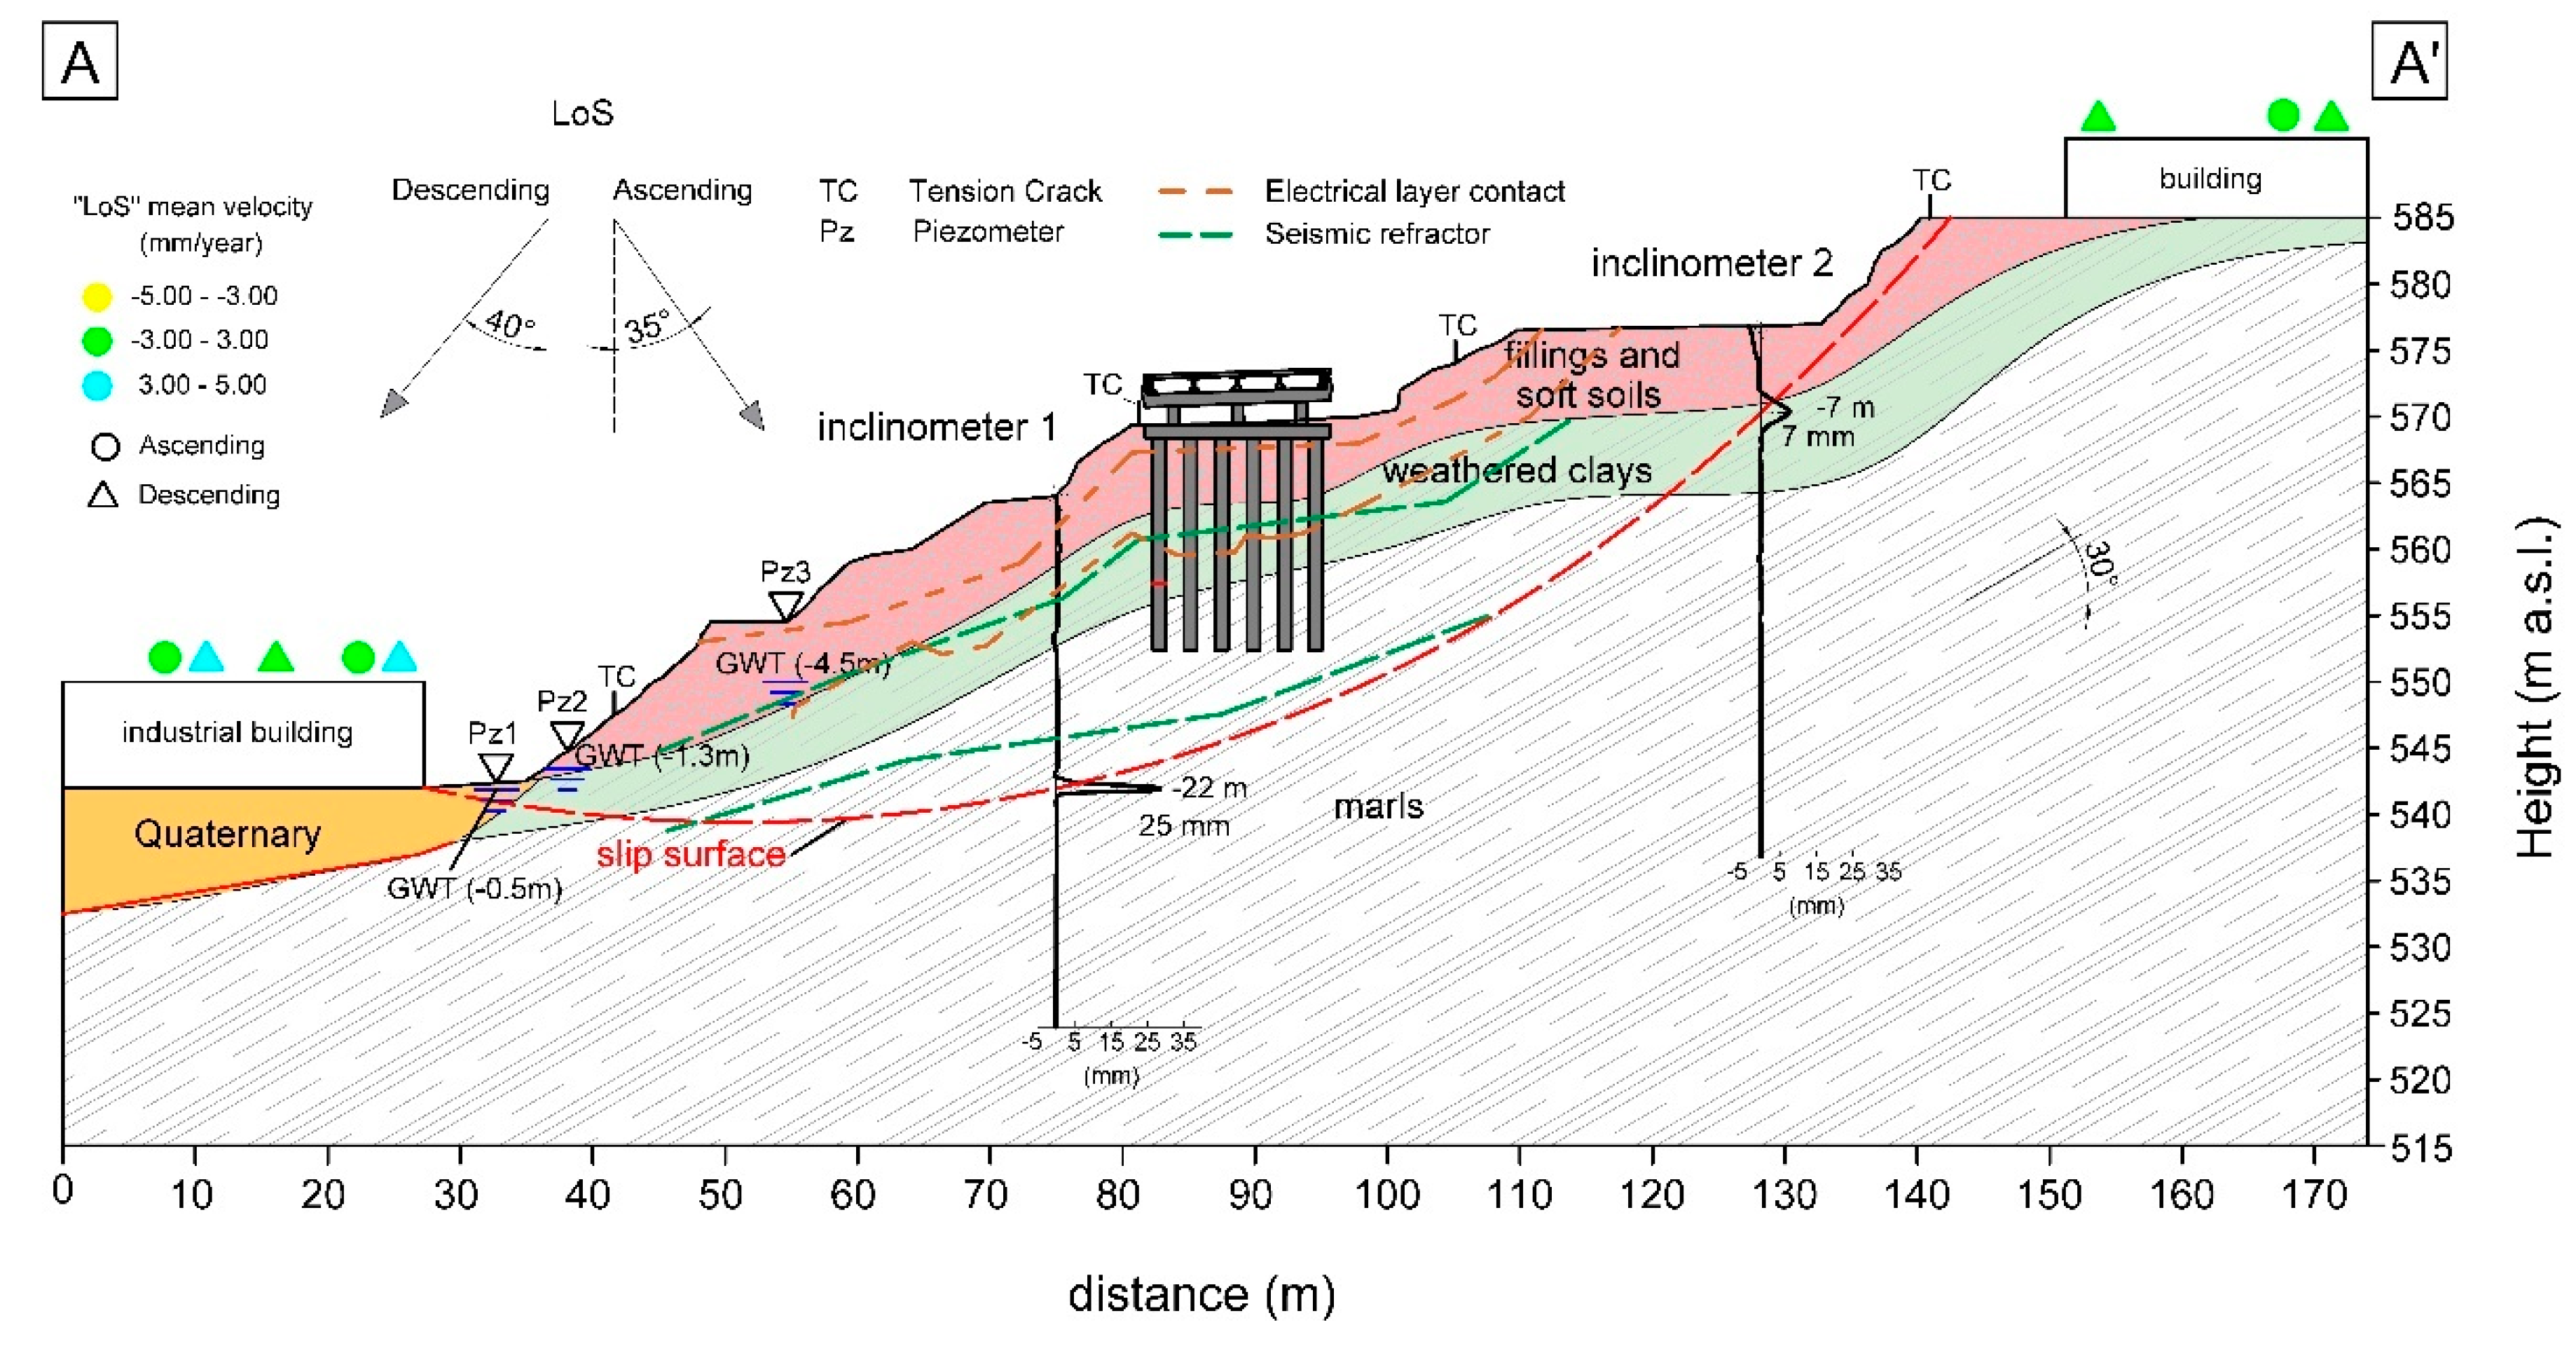
2. Geological Settings and History of the Slope
3. Methodology
3.1. Geological and Geotechnical Characterization
3.2. Geophysics Characterization
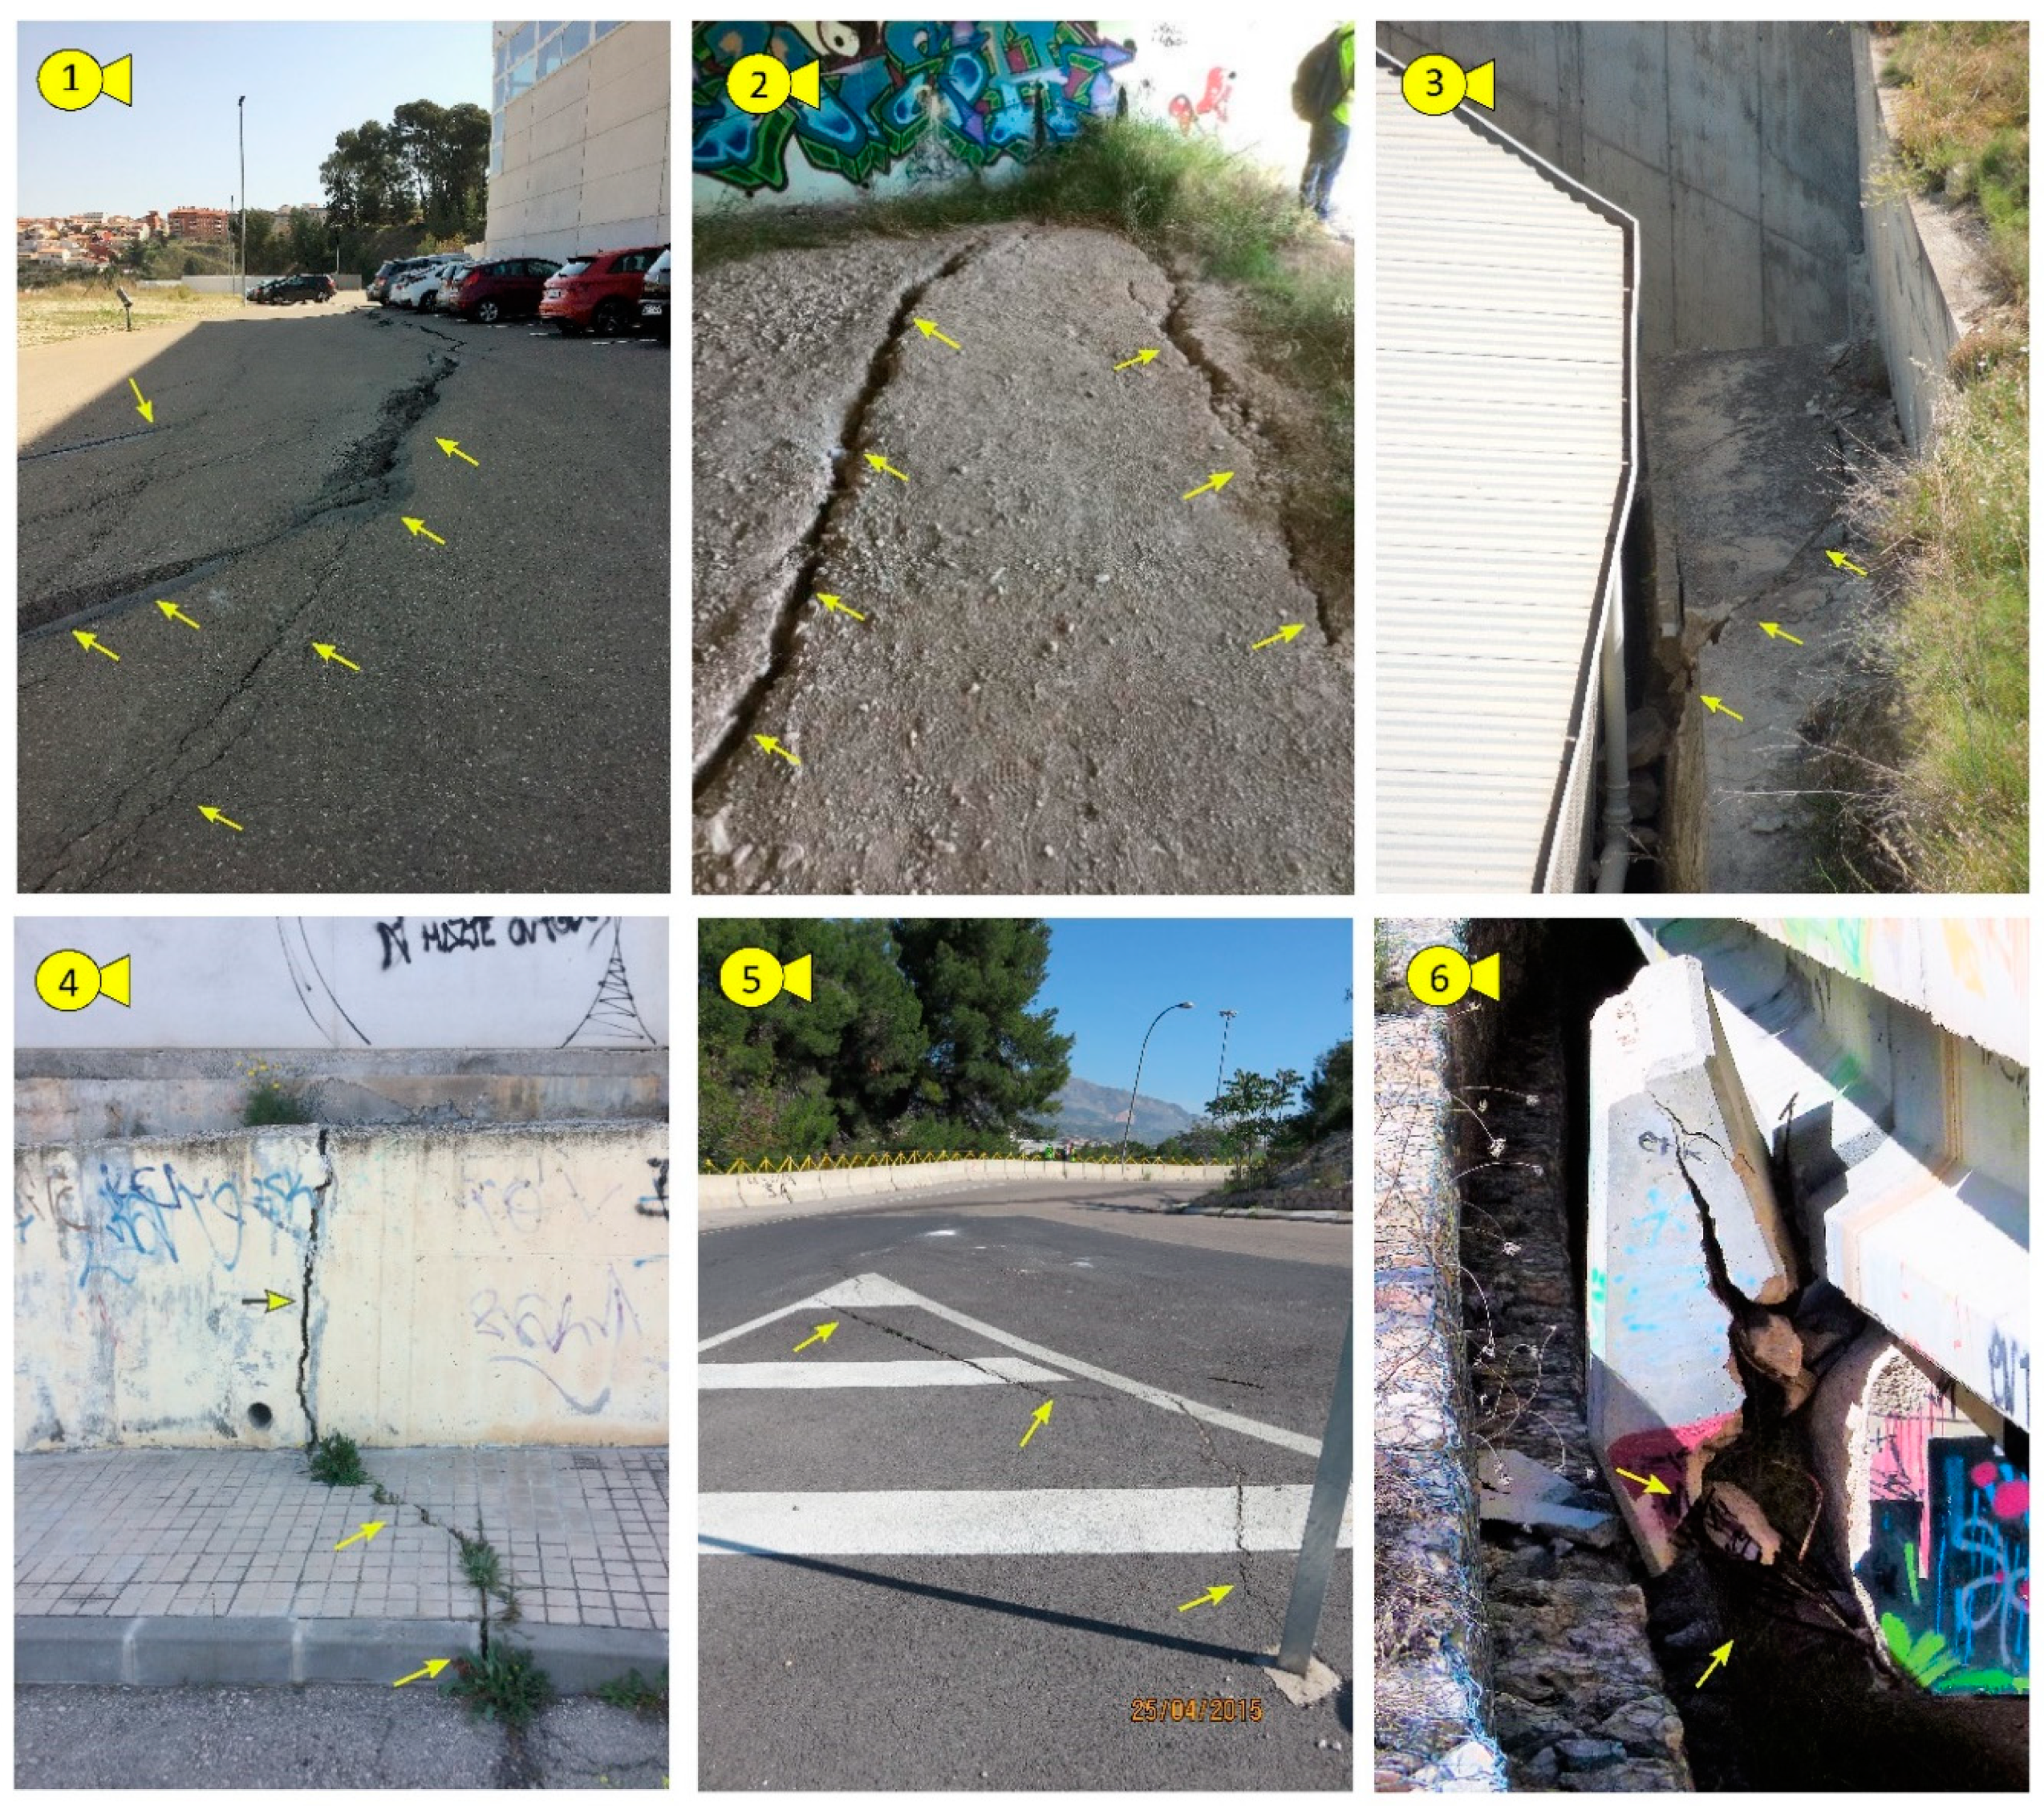
3.3. Damage Assessment
3.4. Monitoring
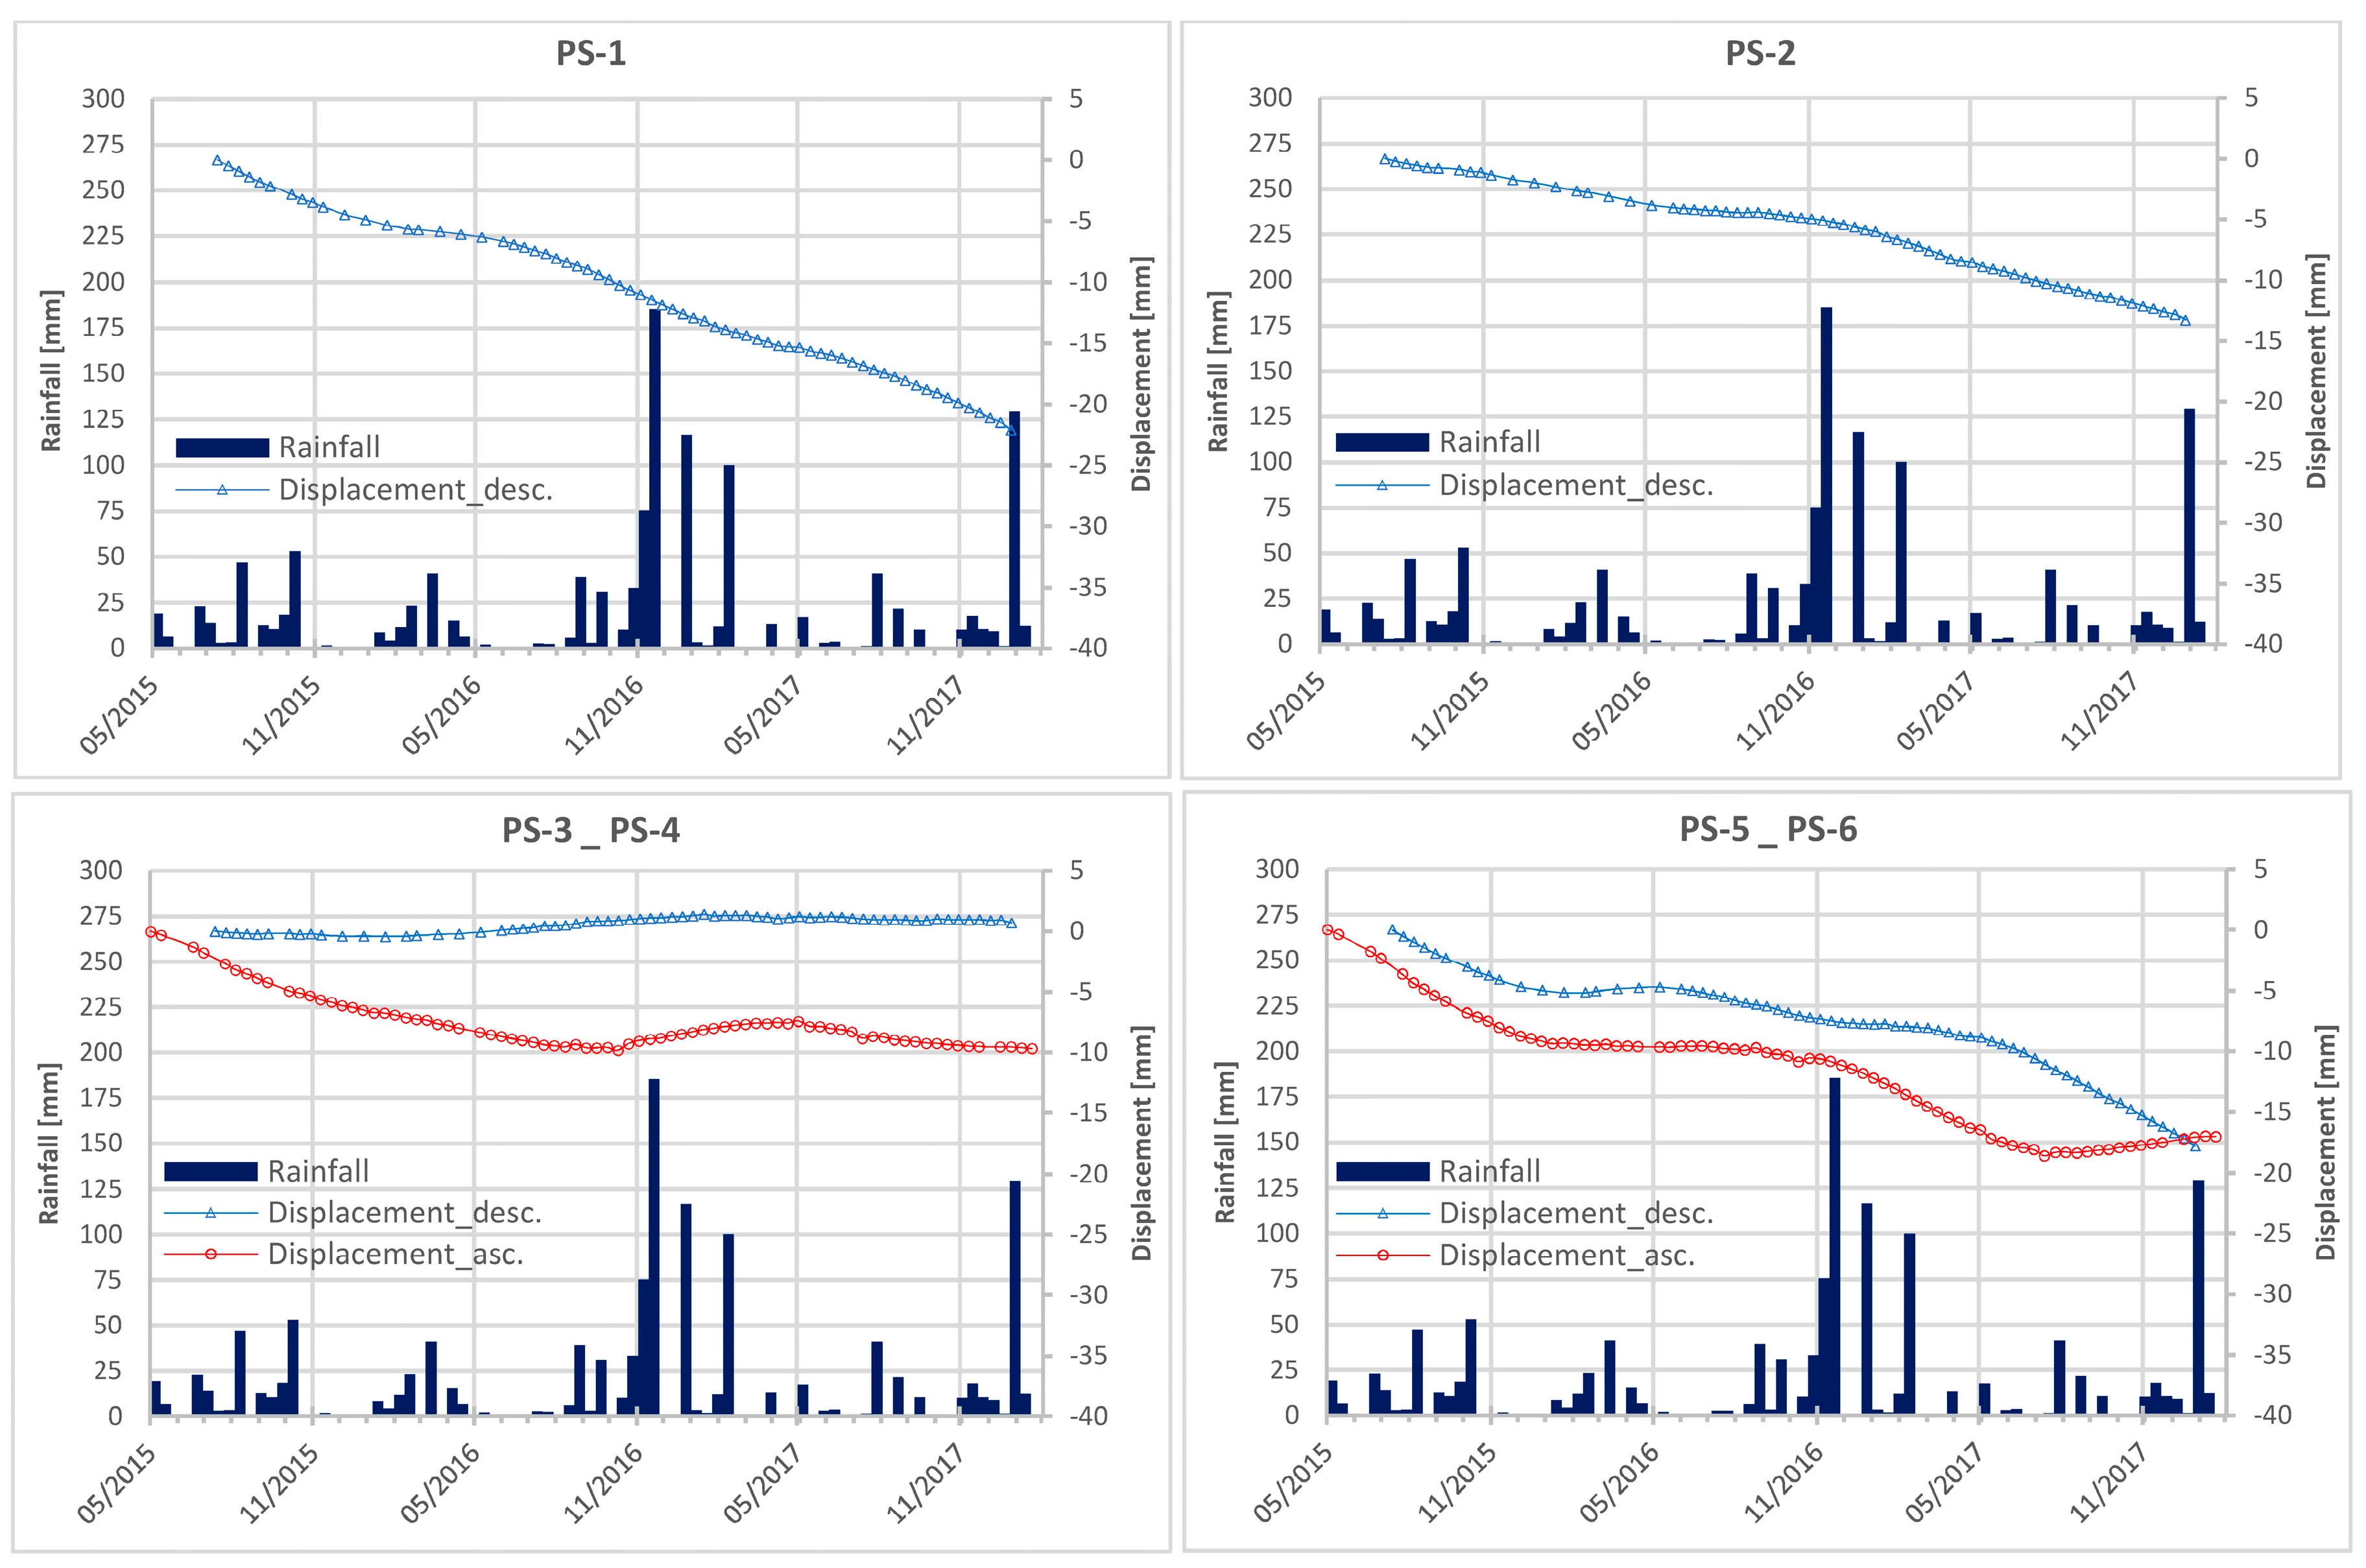
3.4.1. DInSAR
3.4.2. LiDAR
3.4.3. Inclinometers
3.4.4. Topography
3.4.5. Elastomeric Bearing Pads
4. Results
4.1. Geological and Geotechnical Survey
4.2. Geophysical Survey
4.3. Damage Assessment
4.4. Monitoring
4.4.1. DInSAR
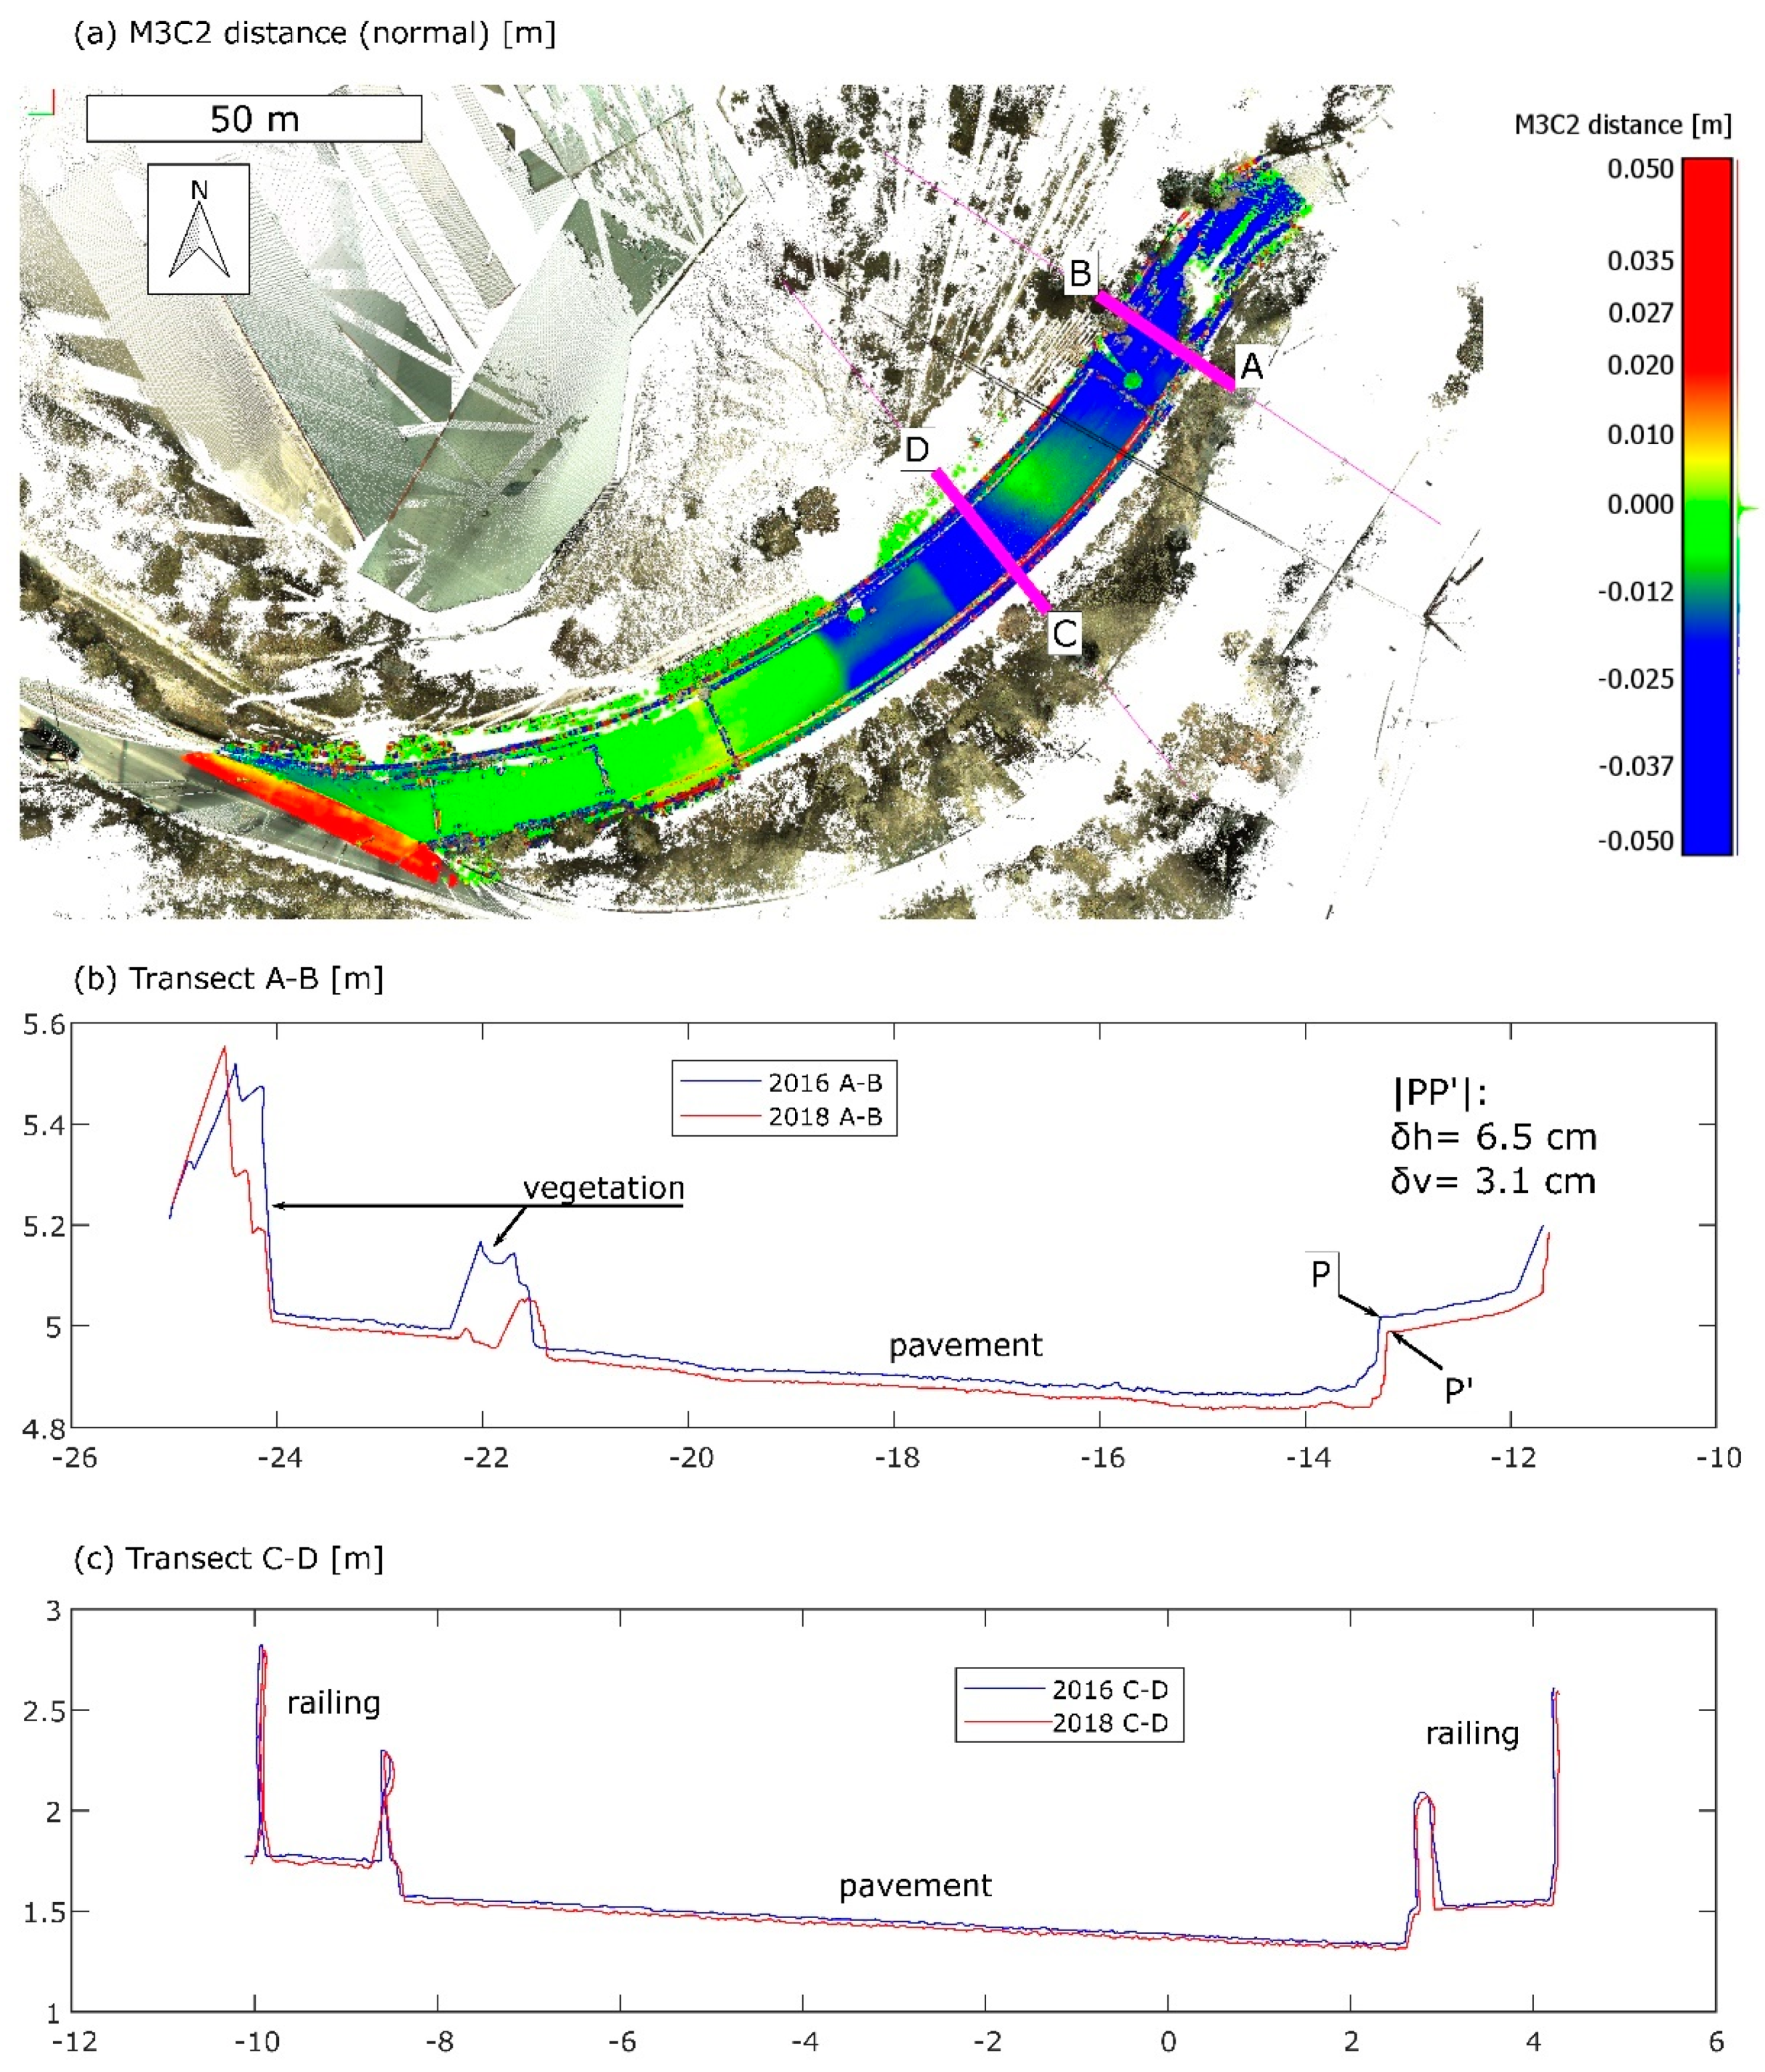
4.4.2. Lidar
4.4.3. Inclinometers
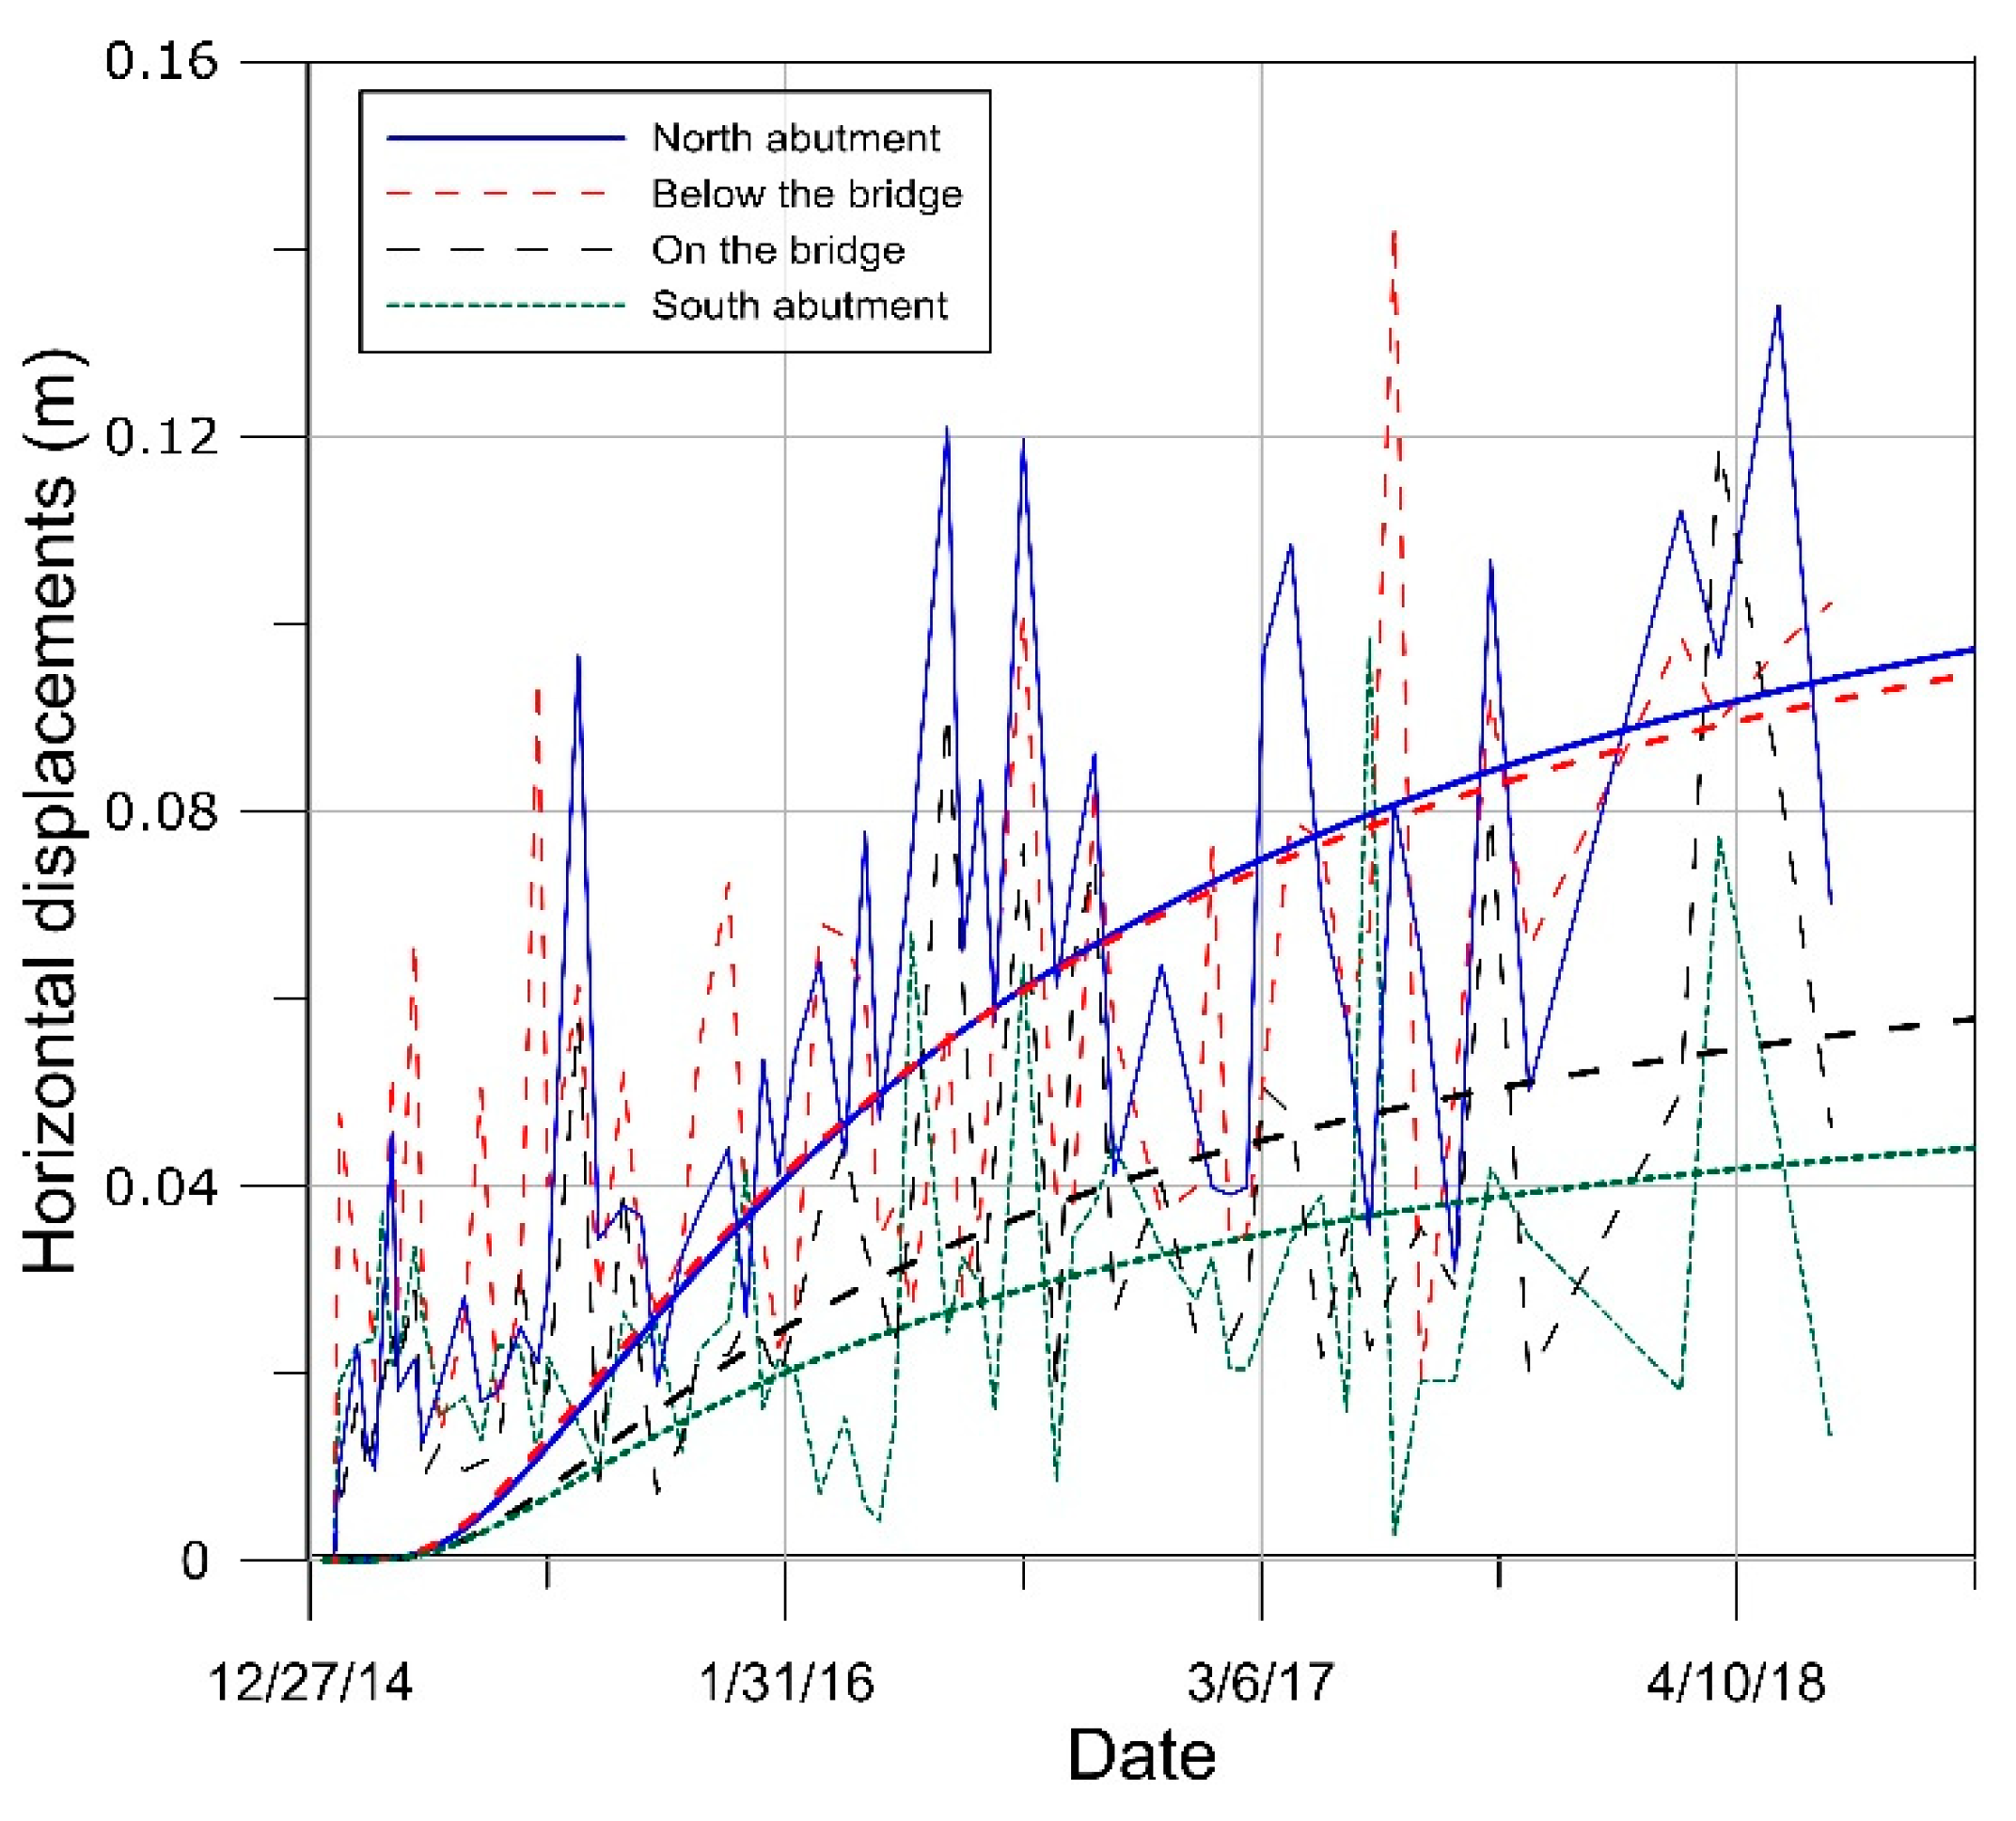
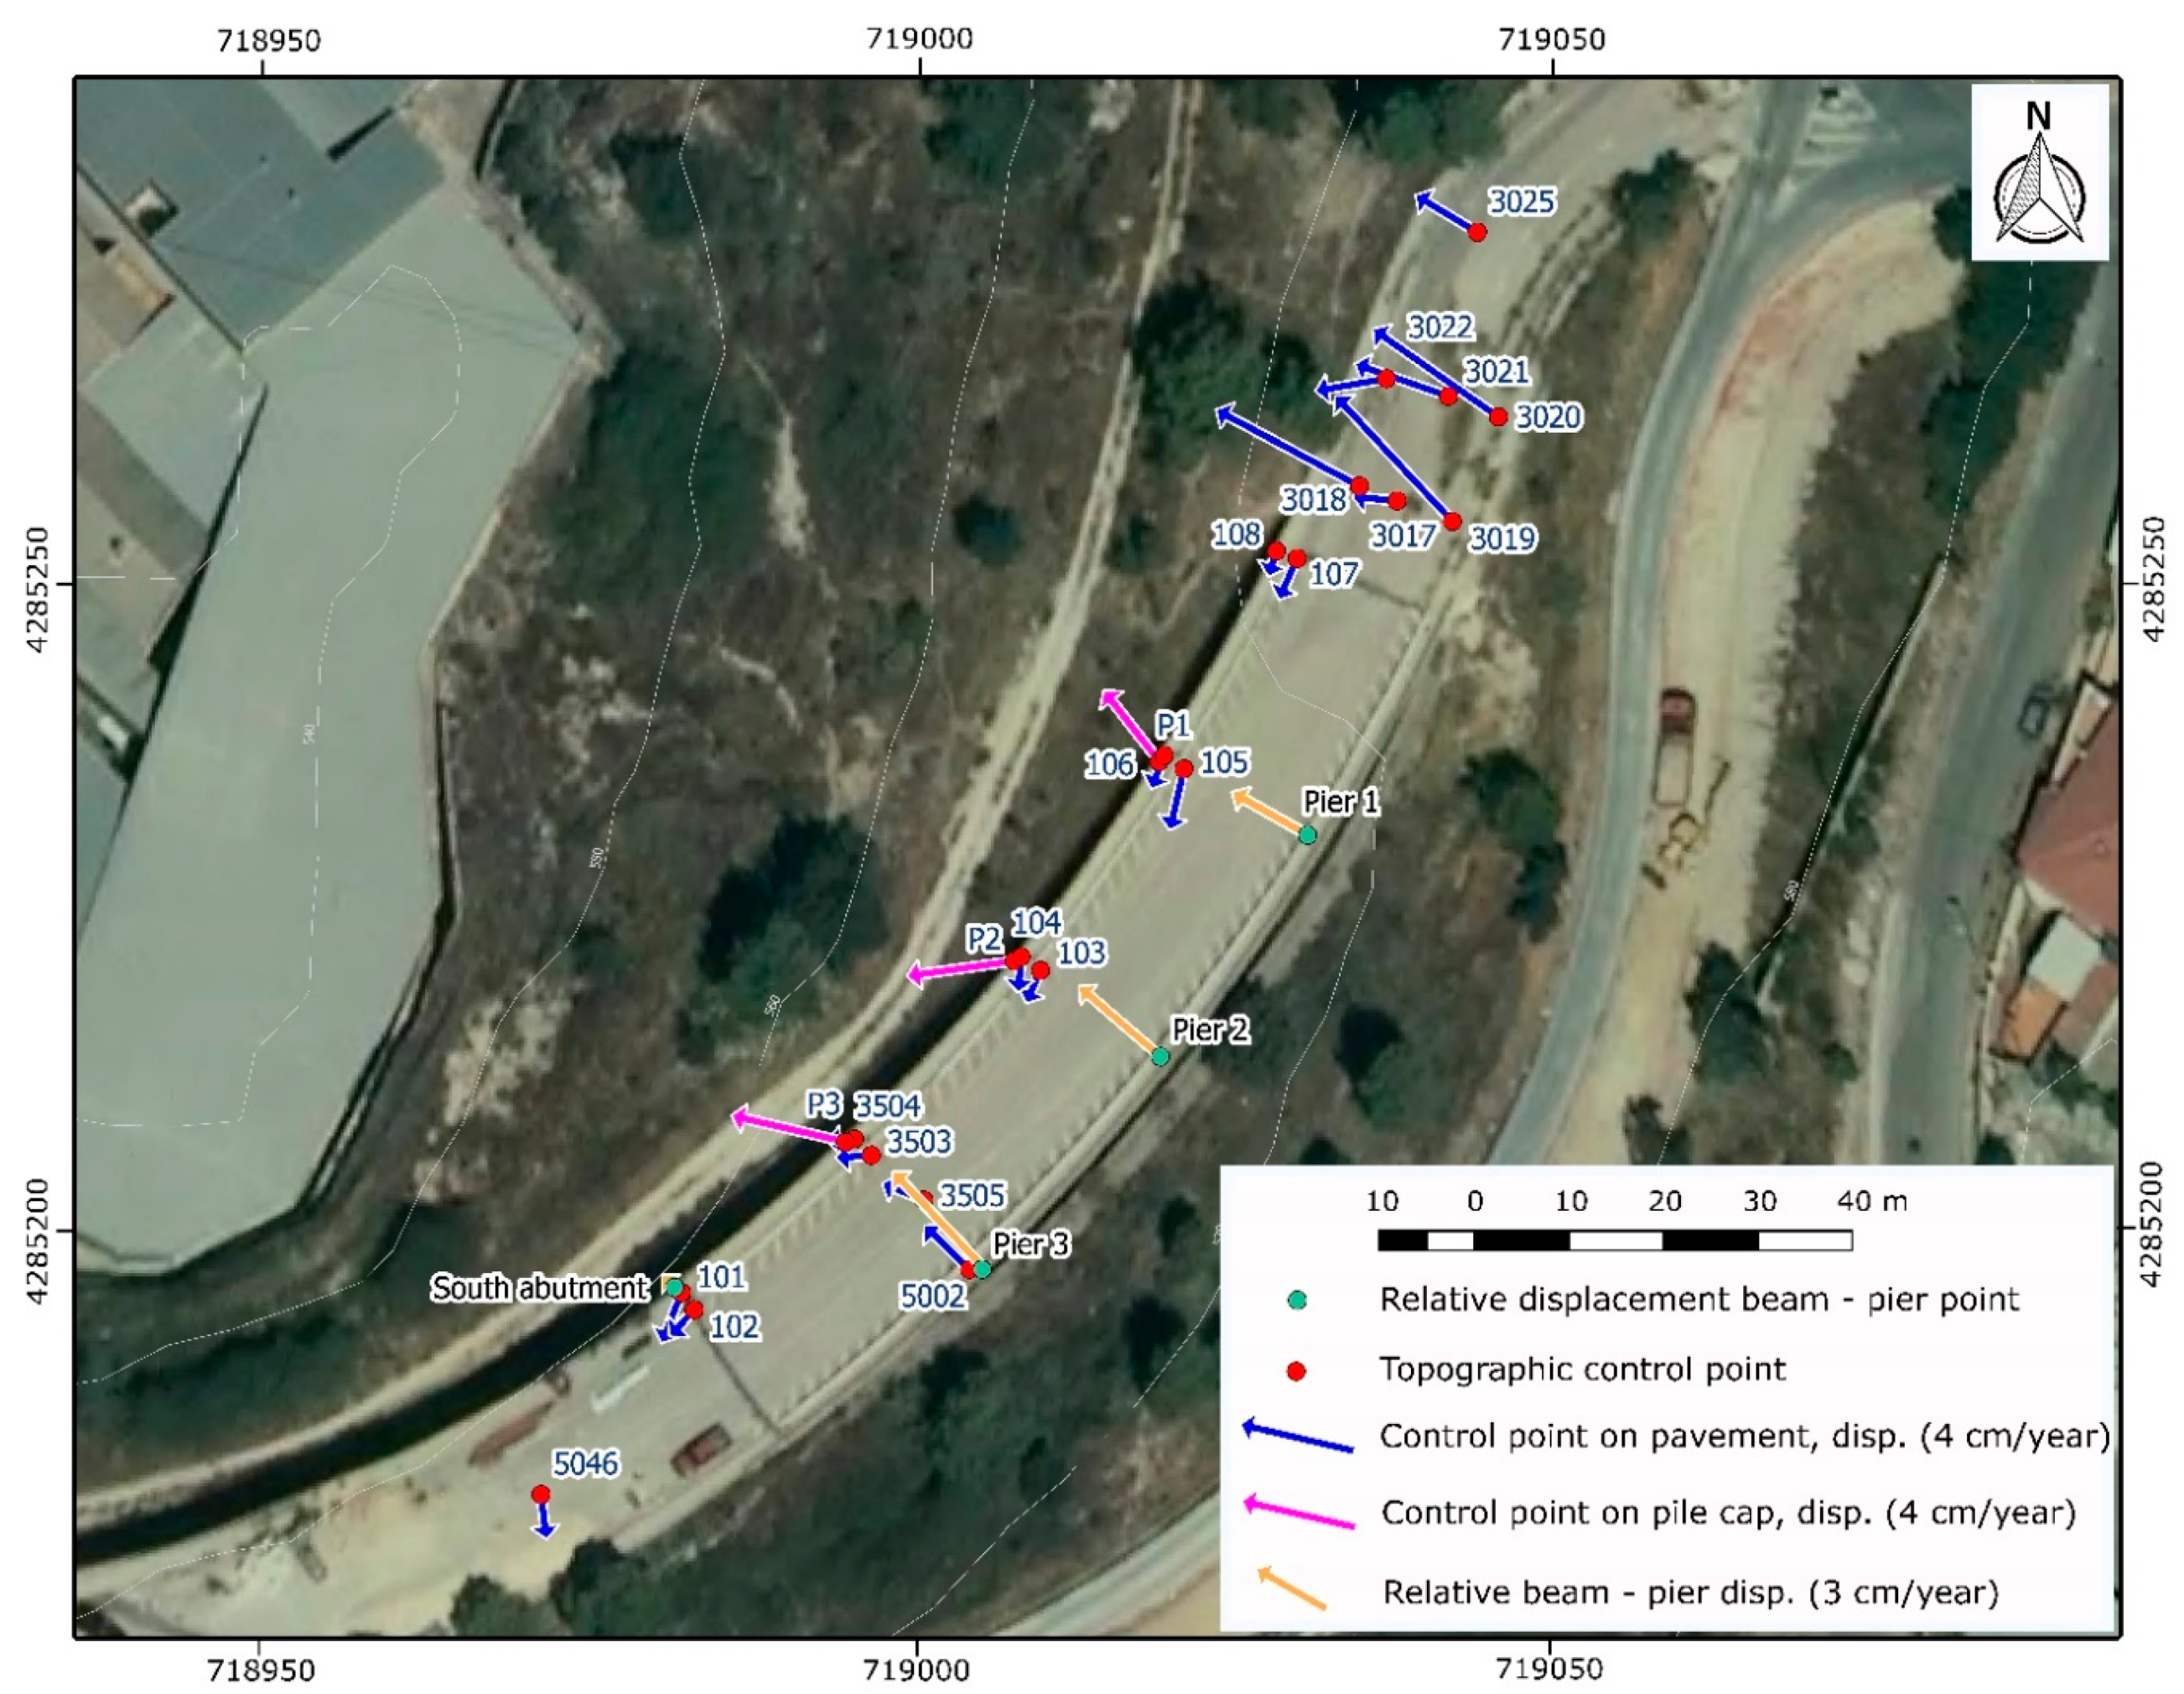
4.4.4. Topography Survey
4.4.5. Elastomeric Bearing Pads
5. Discussion
6. Conclusions
Author Contributions
Funding
Acknowledgments
Conflicts of Interest
References
- Agnesi, V.; Camarda, M.; Conoscenti, C.; Di Maggio, C.; Serena Diliberto, I.; Madonia, P.; Rotigliano, E. A multidisciplinary approach to the evaluation of the mechanism that triggered the Cerda landslide (Sicily, Italy). Geomorphology 2005, 65, 101–116. [Google Scholar] [CrossRef]
- Ausilio, E.; Zimmaro, P. Landslide characterization using a multidisciplinary approach. Measurement 2017, 104, 294–301. [Google Scholar] [CrossRef]
- Del Soldato, M.; Riquelme, A.; Tomás, R.; De Vita, P.; Moretti, S. Application of structure from motion photogrammetry to multi-temporal geomorphological analyses: Case studies from Italy and Spain. Geogr. Fis. e Din. Quat. 2018, 41, 51–66. [Google Scholar] [CrossRef]
- Mantovani, M.; Devoto, S.; Forte, E.; Mocnik, A.; Pasuto, A.; Piacentini, D.; Soldati, M. A multidisciplinary approach for rock spreading and block sliding investigation in the north-western coast of Malta. Landslides 2013, 10, 611–622. [Google Scholar] [CrossRef]
- Fressard, M.; Maquaire, O.; Thiery, Y.; Davidson, R.; Lissak, C. Multi-method characterisation of an active landslide: Case study in the Pays d’Auge plateau (Normandy, France). Geomorphology 2016, 270, 22–39. [Google Scholar] [CrossRef]
- Refice, A.; Spalluto, L.; Bovenga, F.; Fiore, A.; Miccoli, M.N.; Muzzicato, P.; Nitti, D.O.; Nutricato, R.; Pasquariello, G. Integration of persistent scatterer interferometry and ground data for landslide monitoring: The Pianello landslide (Bovino, Southern Italy). Landslides 2019, 1–22. [Google Scholar] [CrossRef]
- Tomás, R.; Abellán, A.; Cano, M.; Riquelme, A.; Tenza-Abril, A.J.; Baeza-Brotons, F.; Saval, J.M.; Jaboyedoff, M. A multidisciplinary approach for the investigation of a rock spreading on an urban slope. Landslides 2018, 15, 199–217. [Google Scholar] [CrossRef]
- Grandjean, G.; Pennetier, C.; Bitri, A.; Meric, O.; Malet, J.-P. Caractérisation de la structure interne et de l’état hydrique de glissements argilo-marneux par tomographie géophysique: l’exemple du glissement-coulée de Super-Sauze (Alpes du Sud, France). Comptes Rendus Geosci. 2006, 338, 587–595. [Google Scholar] [CrossRef]
- Jongmans, D.; Bièvre, G.; Renalier, F.; Schwartz, S.; Beaurez, N.; Orengo, Y. Geophysical investigation of a large landslide in glaciolacustrine clays in the Trièves area (French Alps). Eng. Geol. 2009, 109, 45–56. [Google Scholar] [CrossRef]
- Caris, J.P.T.; Van Asch, T.W.J. Geophysical, geotechnical and hydrological investigations of a small landslide in the French Alps. Eng. Geol. 1991, 31, 249–276. [Google Scholar] [CrossRef]
- Schmutz, M.; Albouy, Y.; Guérin, R.; Maquaire, O.; Vassal, J.; Schott, J.-J.; Descloîtres, M. Joint Electrical and Time Domain Electromagnetism (TDEM) Data Inversion Applied to the Super Sauze Earthflow (France). Surv. Geophys. 2000, 21, 371–390. [Google Scholar] [CrossRef]
- Lapenna, V.; Lorenzo, P.; Perrone, A.; Piscitelli, S.; Rizzo, E.; Sdao, F. 2D electrical resistivity imaging of some complex landslides in Lucanian Apennine chain, southern Italy. GEOPHYSICS 2005, 70, B11–B18. [Google Scholar] [CrossRef]
- Méric, O.; Garambois, S.; Malet, J.-P.; Cadet, H.; Guéguen, P.; Jongmans, D. Seismic noise-based methods for soft-rock landslide characterization. Bull. la Soc. Geol. Fr. 2007, 178, 137–148. [Google Scholar] [CrossRef] [Green Version]
- Cascini, L.; Peduto, D.; Pisciotta, G.; Arena, L.; Ferlisi, S.; Fornaro, G. The combination of DInSAR and facility damage data for the updating of slow-moving landslide inventory maps at medium scale. Nat. Hazards Earth Syst. Sci. 2013, 13, 1527–1549. [Google Scholar] [CrossRef]
- Ferlisi, S.; Peduto, D.; Gullà, G.; Nicodemo, G.; Borrelli, L.; Fornaro, G. The Use of DInSAR Data for the Analysis of Building Damage Induced by Slow-Moving Landslides. In Engineering Geology for Society and Territory—Volume 2; Springer International Publishing: Cham, 2015; pp. 1835–1839. [Google Scholar]
- Antonello, G.; Casagli, N.; Farina, P.; Leva, D.; Nico, G.; Sieber, A.J.; Tarchi, D. Ground-based SAR interferometry for monitoring mass movements. Landslides 2004, 1, 21–28. [Google Scholar] [CrossRef]
- Tessitore, S.; Di Martire, D.; Calcaterra, D.; Infante, D.; Ramondini, M.; Russo, G. Multitemporal synthetic aperture radar for bridges monitoring. In Proceedings of the Proceedings of SPIE—The International Society for Optical Engineering, Gdansk, Poland, 2017; p. 10431C. [Google Scholar]
- Infante, D.; Di Martire, D.; Confuorto, P.; Tessitore, S.; Ramondini, M.; Calcaterra, D. Differential SAR interferometry technique for control of linear infrastructures affected by ground instability phenomena. Int. Arch. Photogramm. Remote Sens. Spat. Inf. Sci. 2018, XLII-3/W4, 251–258. [Google Scholar] [CrossRef]
- Barbarella, M.; Fiani, M. Monitoring of large landslides by Terrestrial Laser Scanning techniques: Field data collection and processing. Eur. J. Remote Sens. 2013, 46, 126–151. [Google Scholar] [CrossRef]
- Wang, G.; Joyce, J.; Phillips, D.; Shrestha, R.; Carter, W. Delineating and defining the boundaries of an active landslide in the rainforest of Puerto Rico using a combination of airborne and terrestrial LIDAR data. Landslides 2013, 10, 503–513. [Google Scholar] [CrossRef]
- Ciampalini, A.; Raspini, F.; Frodella, W.; Bardi, F.; Bianchini, S.; Moretti, S. The effectiveness of high-resolution LiDAR data combined with PSInSAR data in landslide study. Landslides 2016, 13, 399–410. [Google Scholar] [CrossRef]
- Szulwic, J.; Tysiąc, P.; Wojtowicz, A. Coastal Cliffs Monitoring and Prediction of Displacements Using Terrestial Laser Scanning. In Proceedings of the 2016 Baltic Geodetic Congress (Geomatics); Baltic Geodetic Congress, Gdansk, Poland, 2–4 June 2016. [Google Scholar]
- Crepaldi, S.; Zhao, Y.; Lavy, M.; Amanzio, G.; Suozzi, E.; De Maio, M. Landslide analysis by multi-temporal terrestrial laser scanning (TLS) data: The Mont de la Saxe landslide. Rend. Online Della Soc. Geol. Ital. 2015, 35, 92–95. [Google Scholar] [CrossRef]
- Nikolakopoulos, K.; Kavoura, K.; Depountis, N.; Kyriou, A.; Argyropoulos, N.; Koukouvelas, I.; Sabatakakis, N. Preliminary results from active landslide monitoring using multidisciplinary surveys. Eur. J. Remote Sens. 2017, 50, 280–299. [Google Scholar] [CrossRef] [Green Version]
- Othman, Z.; Wan, A.W.A.; Anuar, A. Evaluating the performance of GPS survey methods for landslide monitoring at hillside residential area: Static vs rapid static. In Proceedings of the 2011 IEEE 7th International Colloquium on Signal Processing and its Applications, Penang, Malaysia, 4–6 March 2011; pp. 453–459. [Google Scholar] [CrossRef]
- Notti, D.; Galve, J.P.; Mateos, R.M.; Monserrat, O.; Lamas-Fernández, F.; Fernández-Chacón, F.; Roldán-García, F.J.; Pérez-Peña, J.V.; Crosetto, M.; Azañón, J.M. Human-induced coastal landslide reactivation. Monitoring by PSInSAR techniques and urban damage survey (SE Spain). Landslides 2015, 12, 1007–1014. [Google Scholar] [CrossRef]
- Del Soldato, M.; Bianchini, S.; Calcaterra, D.; De Vita, P.; Di Martire, D.; Tomás, R.; Casagli, N. A new approach for landslide-induced damage assessment. Geomatics, Nat. Hazards Risk 2017, 8, 1524–1537. [Google Scholar] [CrossRef]
- Del Soldato, M.; Di Martire, D.; Bianchini, S.; Tomás, R.; De Vita, P.; Ramondini, M.; Casagli, N.; Calcaterra, D. Assessment of landslide-induced damage to structures: The Agnone landslide case study (southern Italy). Bull. Eng. Geol. Environ. 2018, 1–22. [Google Scholar] [CrossRef]
- Almela, A.; Gómez, E.; Quintero, I.; Mansilla, H. Mapa Geológico de España, hoja de Alcoy; Servicio de publicaciones del Ministerio de Industria, Ed.: Madrid, Spain, 1975. [Google Scholar]
- Moseley, F.; Cuttell, J.C.; Lange, E.W.; Stevens, D.; Warbrick, J.R. Alpine tectonics and diapiric structures in the Pre-Betic zone of southeast Spain. J. Struct. Geol. 1981, 3, 237–251. [Google Scholar] [CrossRef]
- Delgado, J.; Peláez, J.A.; Tomás, R.; López-Casado, C.; Doménech, C.; Estévez, A.; Cuenca, A.; Henares, J. Susceptibilidad a movimientos de ladera inducidos por terremotos en Alcoy (Alicante) y sectores adyacentes. Geo - Temas 2004, 6, 285–288. [Google Scholar]
- Delgado, J.; Peláez, J.A.; Tomás, R.; Estévez, A.; López Casado, C.; Doménech, C.; Cuenca, A. Evaluación de la susceptibilidad de las laderas a sufrir inestabilidades inducidas por terremotos. Aplicación a la cuenca de drenaje del río Serpis (provincia de Alicante). Rev. la Soc. Geológica España 2006, 19, 197–218. [Google Scholar]
- IGME. Mapa geotécnico y de riesgos geológicos para la ordenación urbana de Alcoy: Mapa de riesgos geologicos E. 1/25.000, 1/2.500, 1/1000: Mapa geotecnico E. 1/25.000, 1/5.000; Instituto, Geoló gico y Minero de, Españ a., Direcció n de Aguas, Subterrá neas y, Geotecnia, Ed.; Servicio de publicaciones del Ministerio de Industria: Madrid, Spain, 1984. [Google Scholar]
- Miśkiewicz, M.; Mitrosz, O.; Brzozowski, T. Preliminary Field Tests and Long-Term Monitoring as a Method of Design Risk Mitigation: A Case Study of Gdańsk Deepwater Container Terminal. Polish Marit. Res. 2017, 24. [Google Scholar] [CrossRef]
- Miśkiewicz, M.; Pyrzowski, Ł.; Wilde, K.; Mitrosz, O. Technical Monitoring System for a New Part of Gdańsk Deepwater Container Terminal. Polish Marit. Res. 2017, 24, 149–155. [Google Scholar] [CrossRef]
- TYPSA. Inestabilidad en el puente de acceso al polígono Santiago Payá y Sembenet, Alcoy (Alicante), Unpublished work. 2012.
- Reynolds. An Introduction to Applied and Environmental Geophysics; Wiley, Ed.: Chichester, UK, 1997. [Google Scholar]
- Blanco-Sànchez, P.; Mallorquí, J.J.; Duque, S.; Monells, D. The Coherent Pixels Technique (CPT): An Advanced DInSAR Technique for Nonlinear Deformation Monitoring. In Earth Sciences and Mathematics; Birkhäuser Basel: Basel, Switzerland, 2008; pp. 1167–1193. [Google Scholar]
- Mora, O.; Mallorqui, J.J.; Broquetas, A. Linear and nonlinear terrain deformation maps from a reduced set of interferometric sar images. IEEE Trans. Geosci. Remote Sens. 2003, 41, 2243–2253. [Google Scholar] [CrossRef]
- Leica Geosystems AG. Leica ScanStation C10 Data Sheet; Leica Geosystems AG: Heerbrugg, Switzerland, 2011. [Google Scholar]
- Lague, D.; Brodu, N.; Leroux, J.J. Accurate 3D comparison of complex topography with terrestrial laser scanner: Application to the Rangitikei canyon (NZ). ISPRS J. Photogramm. Remote Sens. 2013, 82, 10–26. [Google Scholar] [CrossRef]
- Notti, D.; Davalillo, J.C.; Herrera, G.; Mora, O. Natural Hazards and Earth System Sciences Assessment of the performance of X-band satellite radar data for landslide mapping and monitoring: Upper Tena Valley case study. Hazards Earth Syst. Sci 2010, 10, 1865–1875. [Google Scholar] [CrossRef]
- Plank, S.; Singer, J.; Minet, C.; Thuro, K. Pre-survey suitability evaluation of the differential synthetic aperture radar interferometry method for landslide monitoring. Int. J. Remote Sens. 2012, 33, 6623–6637. [Google Scholar] [CrossRef]
- Esposito, G.; Sacchi, M.; Srl, G.; Somma, R. Multitemporal monitoring of a coastal landslide through SFM-derived point cloud comparison. Photogramm. Rec. 2017, 32, 459–479. [Google Scholar] [CrossRef]
- California Department of Transportations. Total Station Survey System (TSSS) Survey Specifications. In Surveys Manual; California Department of Transportations: Sacramento, CA, USA, 2007. [Google Scholar]
- Jongmans, D.; Garambois, S. Geophysical investigation of landslides: A review. Bull. la Soc. Geol. Fr. 2007, 178, 101–112. [Google Scholar] [CrossRef]


| Particle Size | Atterberg Limits | % w | |||||
|---|---|---|---|---|---|---|---|
| % Gravel | % Sand | % Fines | L.L. | P.L. | P.I. | ||
| Road embankment (Clayey gravels) | 39.0 ± 5.1 (4) | 25.1 ± 4.6 (4) | 36.0 ± 9.0 (4) | 31.4 ± 2.3 (4) | 13.4 ± 1.1 (4) | 18.0 ± 1.6 (4) | - |
| Quaternary Colluvial deposits (Clayey sands with some gravels) | 1.0 ± 2.0 (4) | 52.7 ± 17.8 (4) | 46.4 ± 19.7 (4) | 33.6 ± 3.8 (4) | 18.5 ± 3.2 (4) | 15.1 ± 3.1 (4) | 17.6 ± 3.7 (4) |
| Tertiary (clays and marls) | 3.2 ± 9.5 (34) | 21.9 ± 9.3 (34) | 74.9 ± 22.3 (34) | 44.2 ± 9.8 (34) | 21.1 ± 3.1 (34) | 23.1 ± 8.5 (34) | 22.6 ± 3.9 (32) |
| Bulk density (kN/m3) | Dry density (kN/m3) | qu (kPa) | c’ (kPa) | Ø’ (°) | MCO3 (%) | Nspt | |
| Road fillings (Clayey gravels) | - | - | - | - | - | - | 25.0 ± 21.1 (3) |
| Quaternary Colluvial deposits (Clayey sands with some gravels) | 20.5 ± 1.0 (4) | 17.5 ± 1.4(4) | - | 22 ± 31 (2) | 36.5 ± 10.6 (2) | - | - |
| Tertiary (clays and marls) | 20.0 ± 0.7 (22) | 16.3 ± 0.8 (22) | 329 ± 213 (15) | 44 ± 31 (19) | 29,6 ± 7.3 (19) | 57.0 ± 4.6 (7) | 28.0 ± 12.7 (9) |
| Geology and Geotechnics | Geophysics | Damage Assessment | DinSAR | LiDAR | Inclinometers | Topography Control | |
|---|---|---|---|---|---|---|---|
| Type of soil/rock involved | X | ||||||
| Landslide mechanism | X | X | X | X | X | X | |
| Depth of the sliding surface | X | X | X | ||||
| Boundaries of the landslide | X | X | X | X | |||
| Kinematics | X | X | X | X | X |
© 2019 by the authors. Licensee MDPI, Basel, Switzerland. This article is an open access article distributed under the terms and conditions of the Creative Commons Attribution (CC BY) license (http://creativecommons.org/licenses/by/4.0/).
Share and Cite
Pastor, J.L.; Tomás, R.; Lettieri, L.; Riquelme, A.; Cano, M.; Infante, D.; Ramondini, M.; Di Martire, D. Multi-Source Data Integration to Investigate a Deep-Seated Landslide Affecting a Bridge. Remote Sens. 2019, 11, 1878. https://0-doi-org.brum.beds.ac.uk/10.3390/rs11161878
Pastor JL, Tomás R, Lettieri L, Riquelme A, Cano M, Infante D, Ramondini M, Di Martire D. Multi-Source Data Integration to Investigate a Deep-Seated Landslide Affecting a Bridge. Remote Sensing. 2019; 11(16):1878. https://0-doi-org.brum.beds.ac.uk/10.3390/rs11161878
Chicago/Turabian StylePastor, José Luis, Roberto Tomás, Luca Lettieri, Adrián Riquelme, Miguel Cano, Donato Infante, Massimo Ramondini, and Diego Di Martire. 2019. "Multi-Source Data Integration to Investigate a Deep-Seated Landslide Affecting a Bridge" Remote Sensing 11, no. 16: 1878. https://0-doi-org.brum.beds.ac.uk/10.3390/rs11161878