Does Earlier and Increased Spring Plant Growth Lead to Reduced Summer Soil Moisture and Plant Growth on Landscapes Typical of Tundra-Taiga Interface?


Abstract
:
1. Introduction
2. Methods
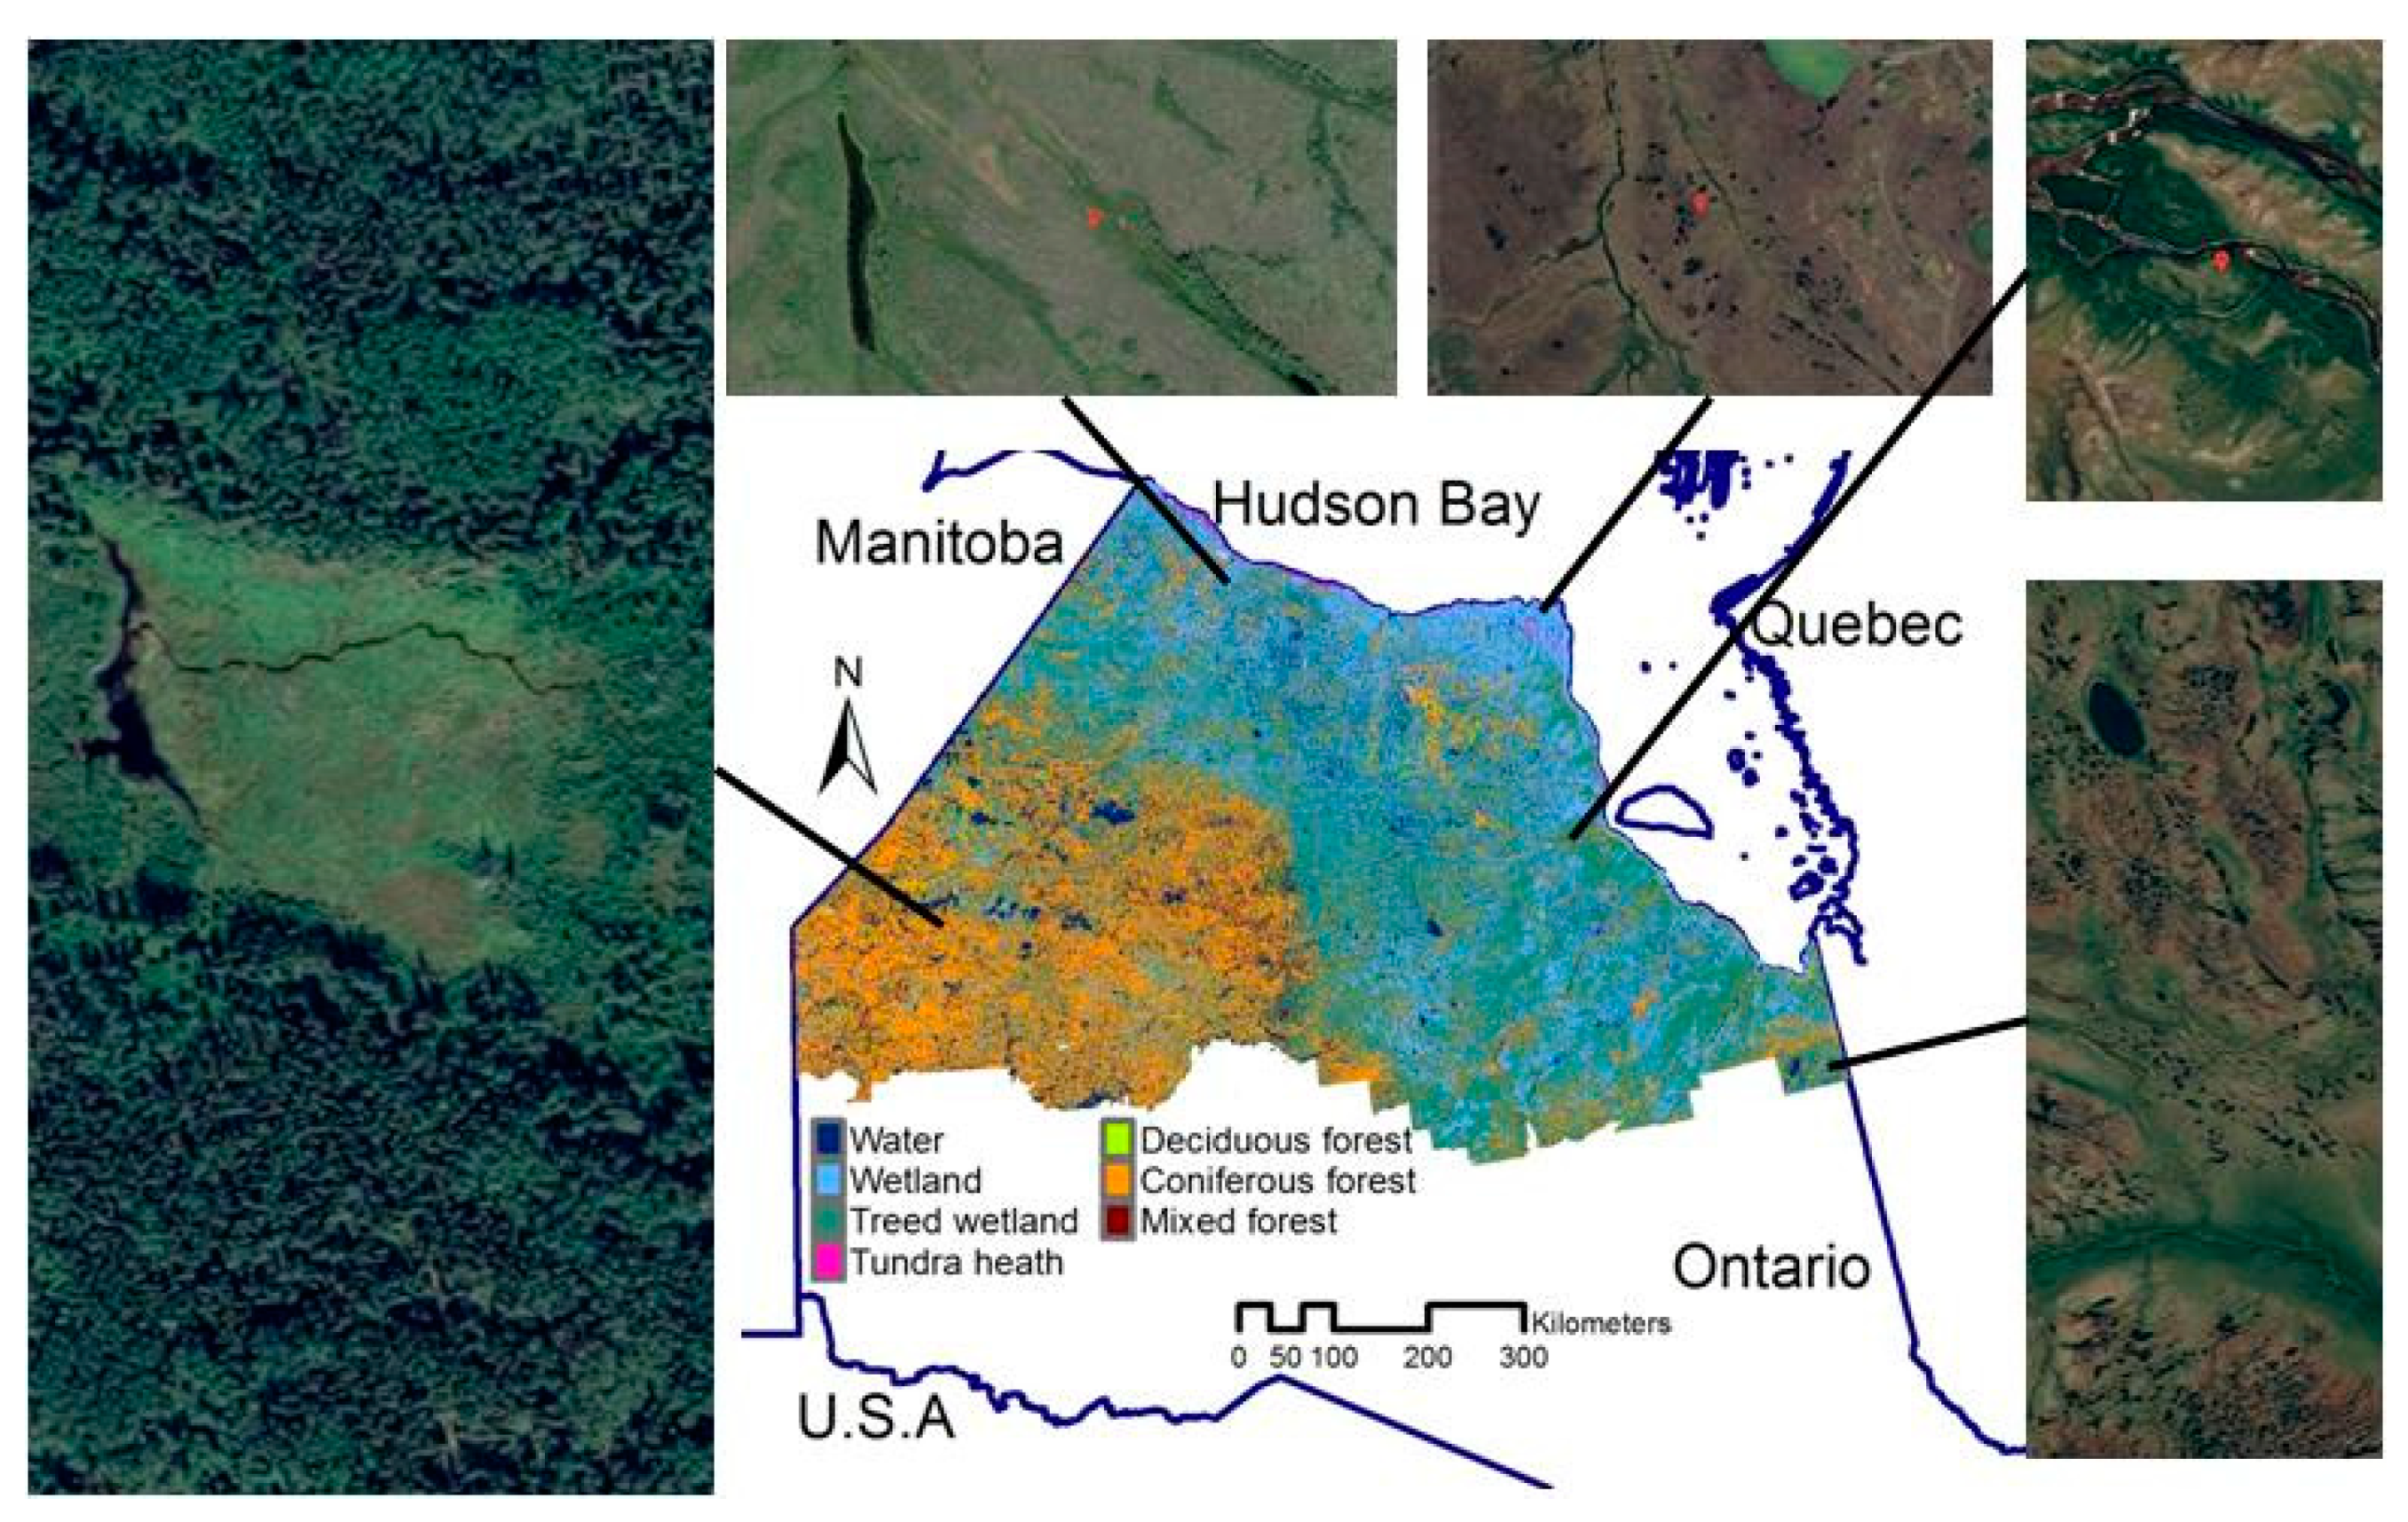
2.1. Study Area
2.1.1. Data
2.1.2. Analysis
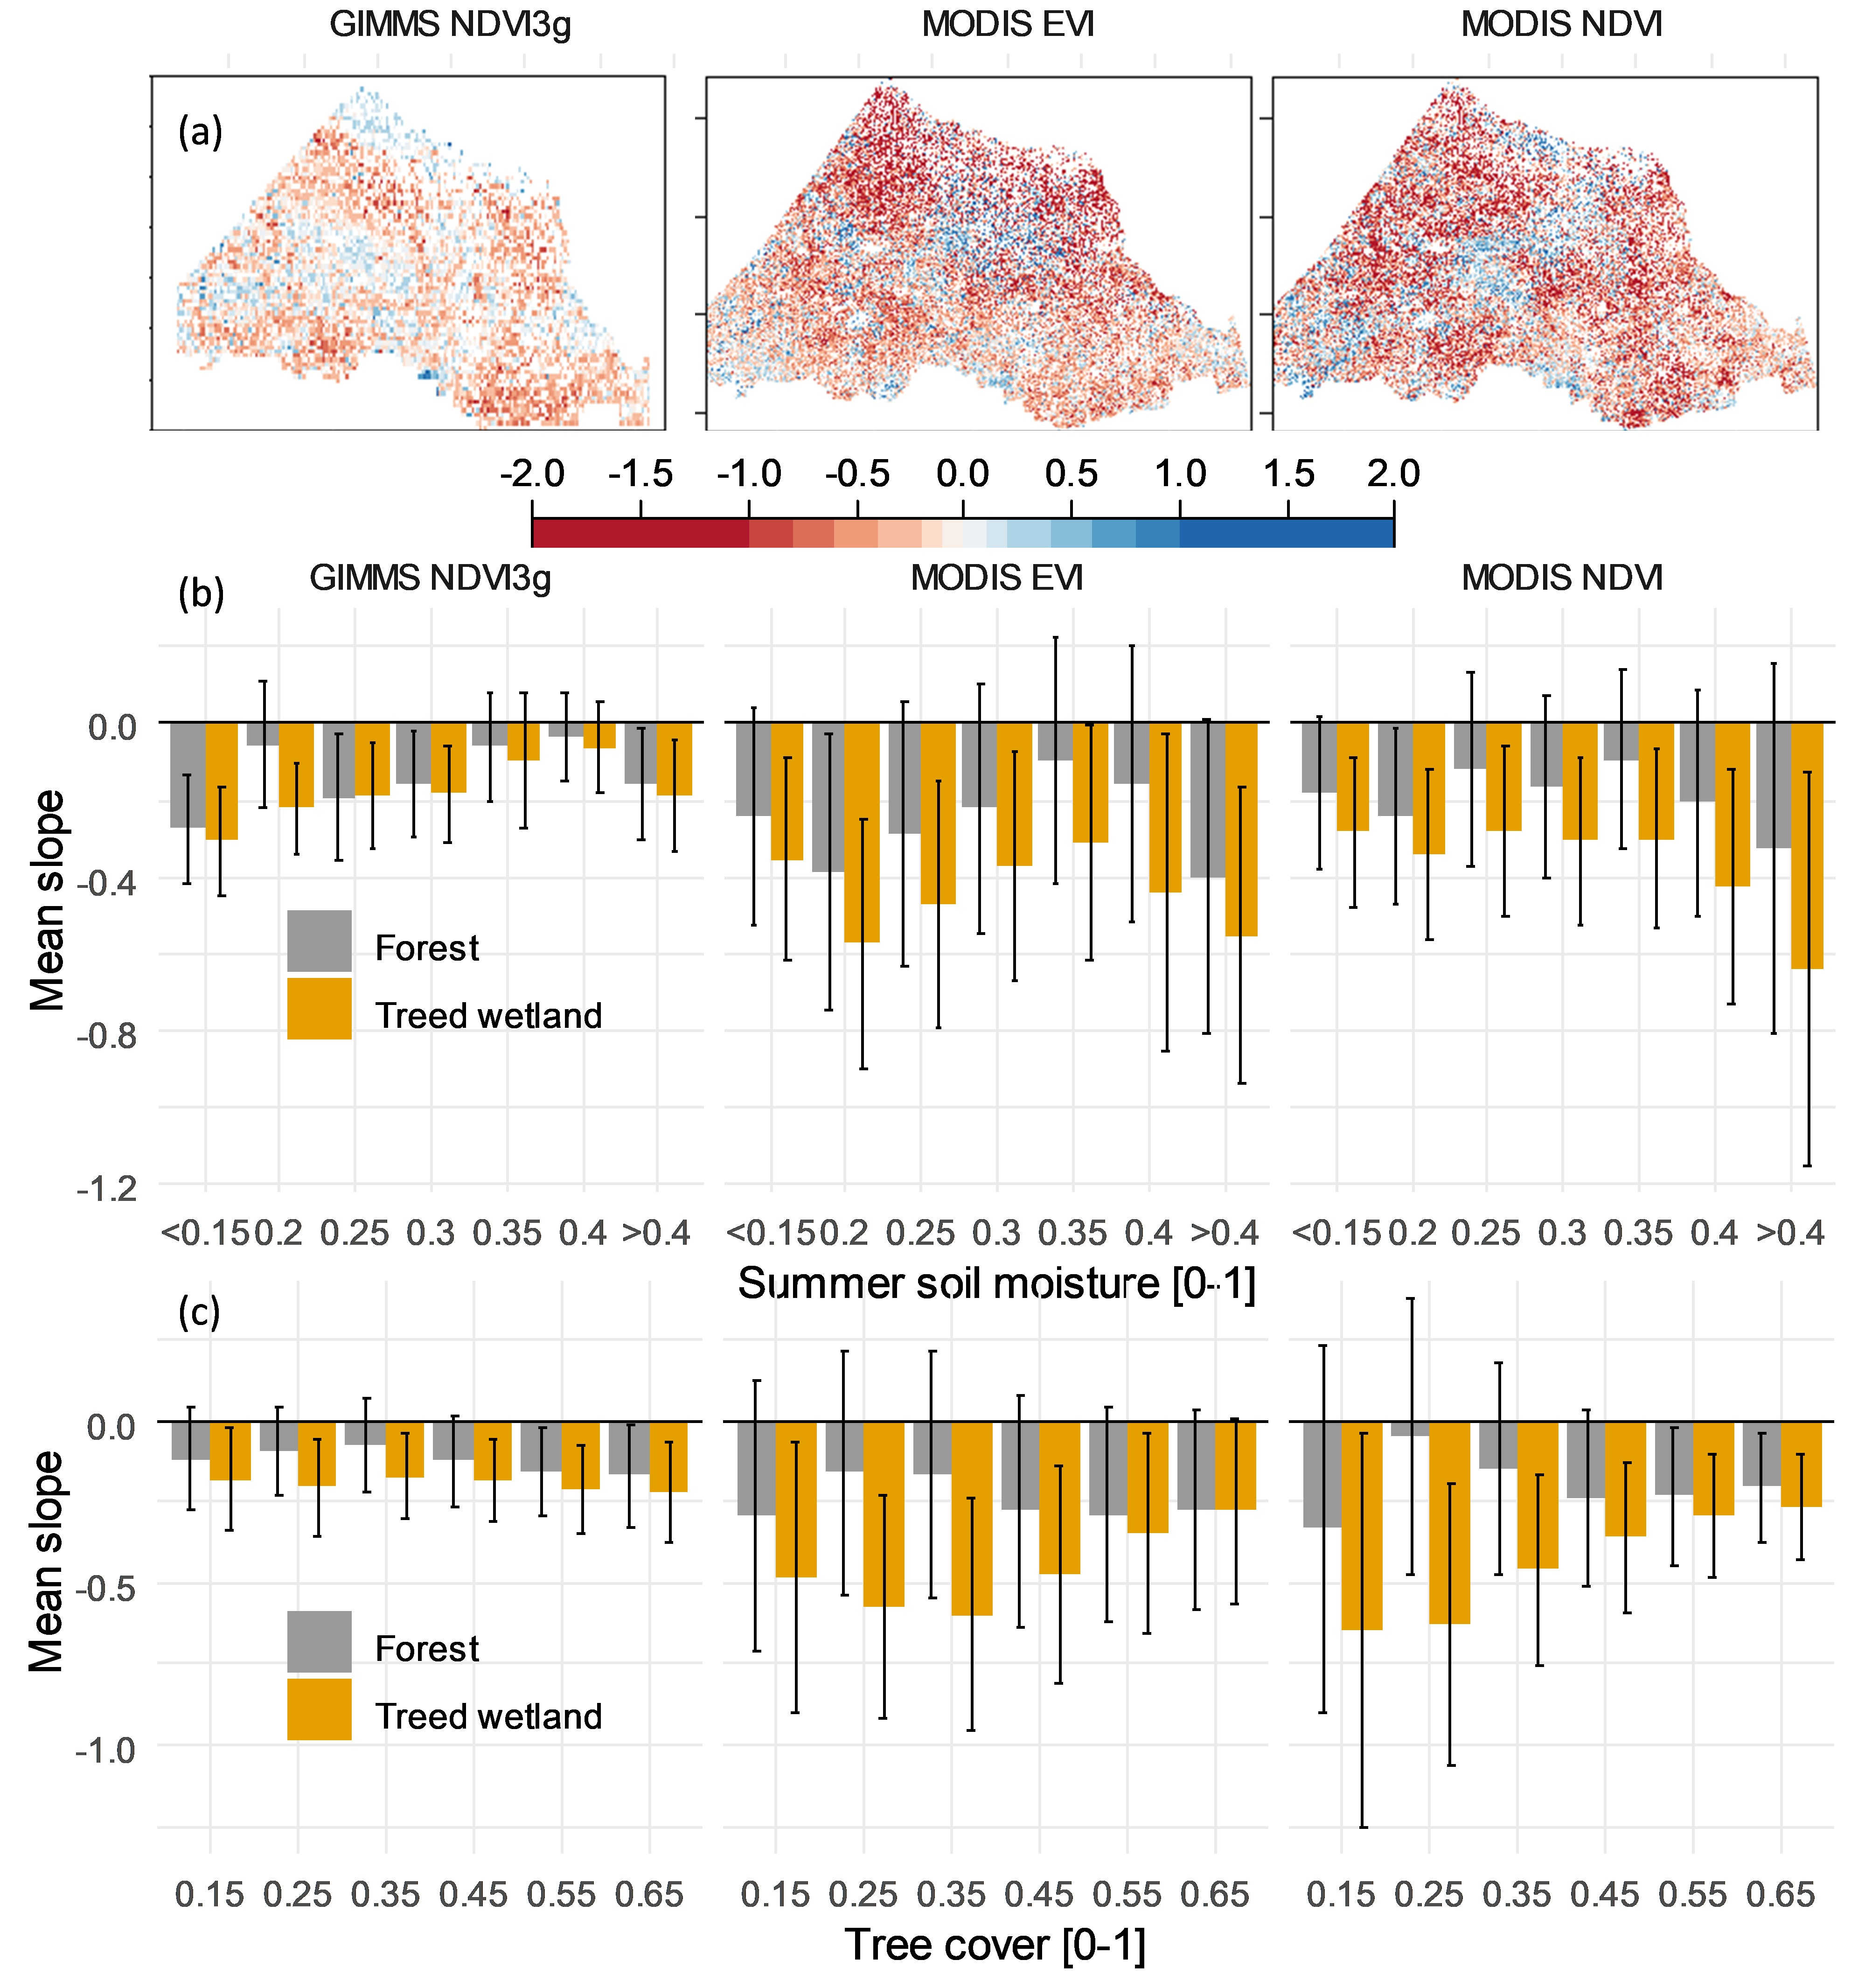
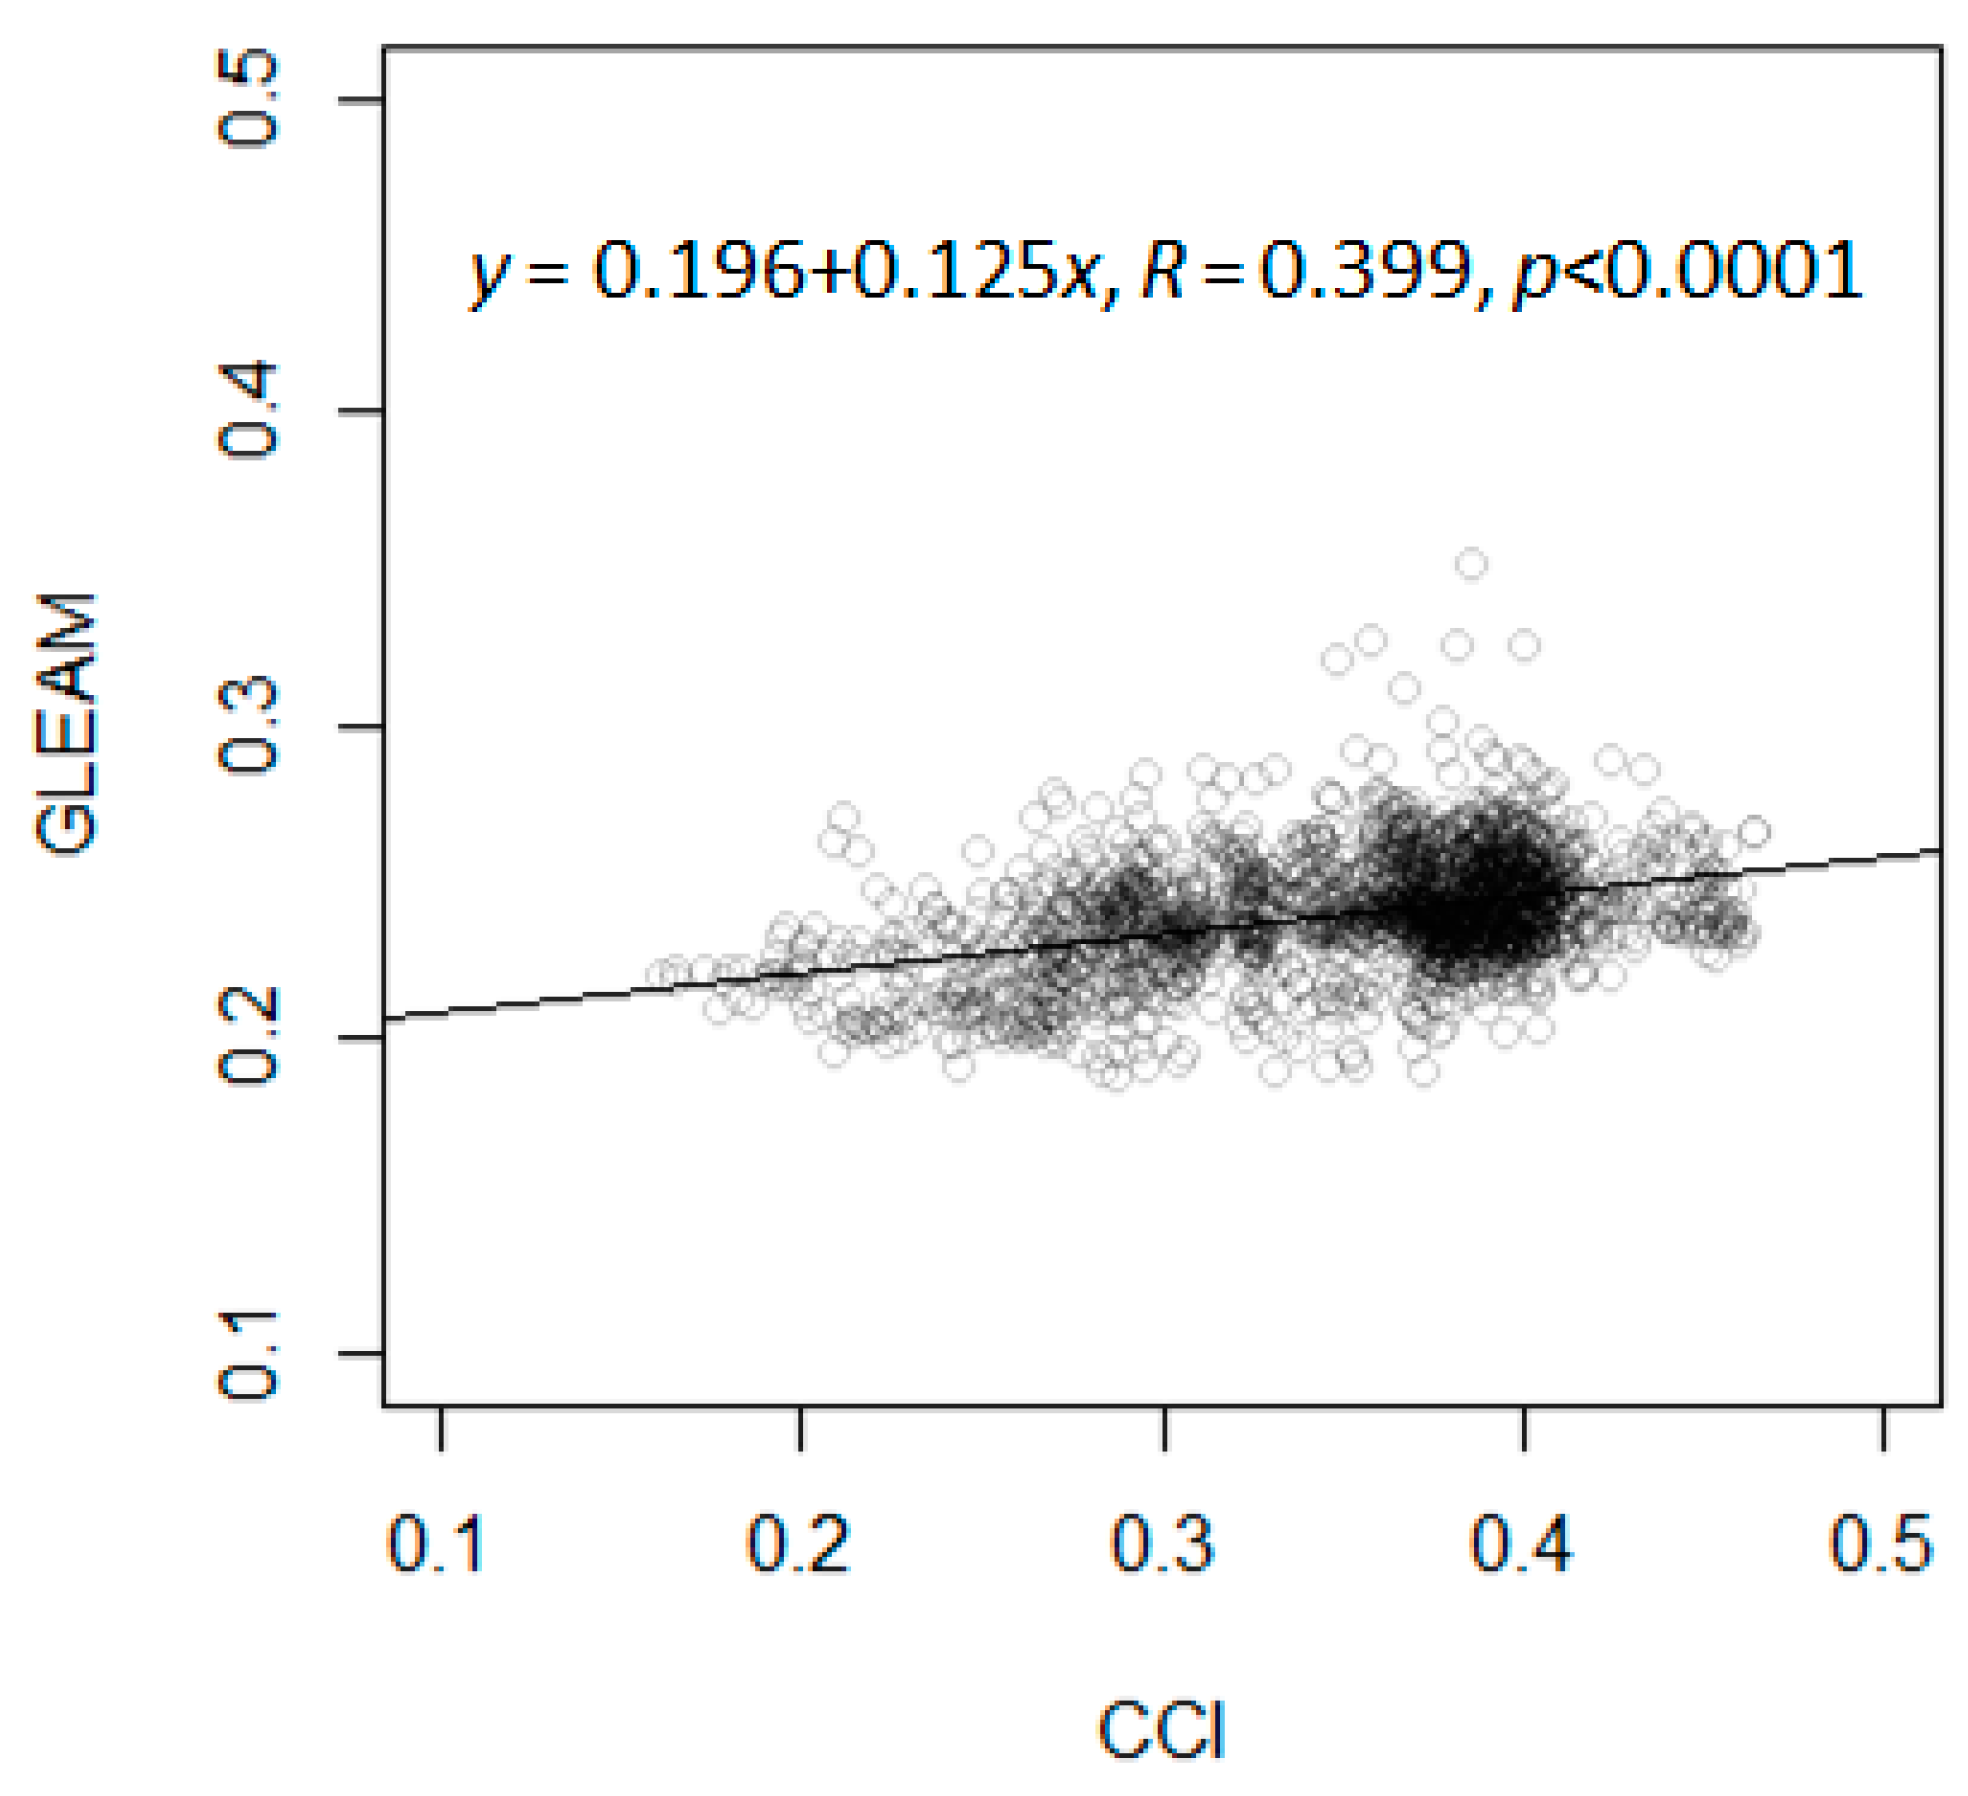
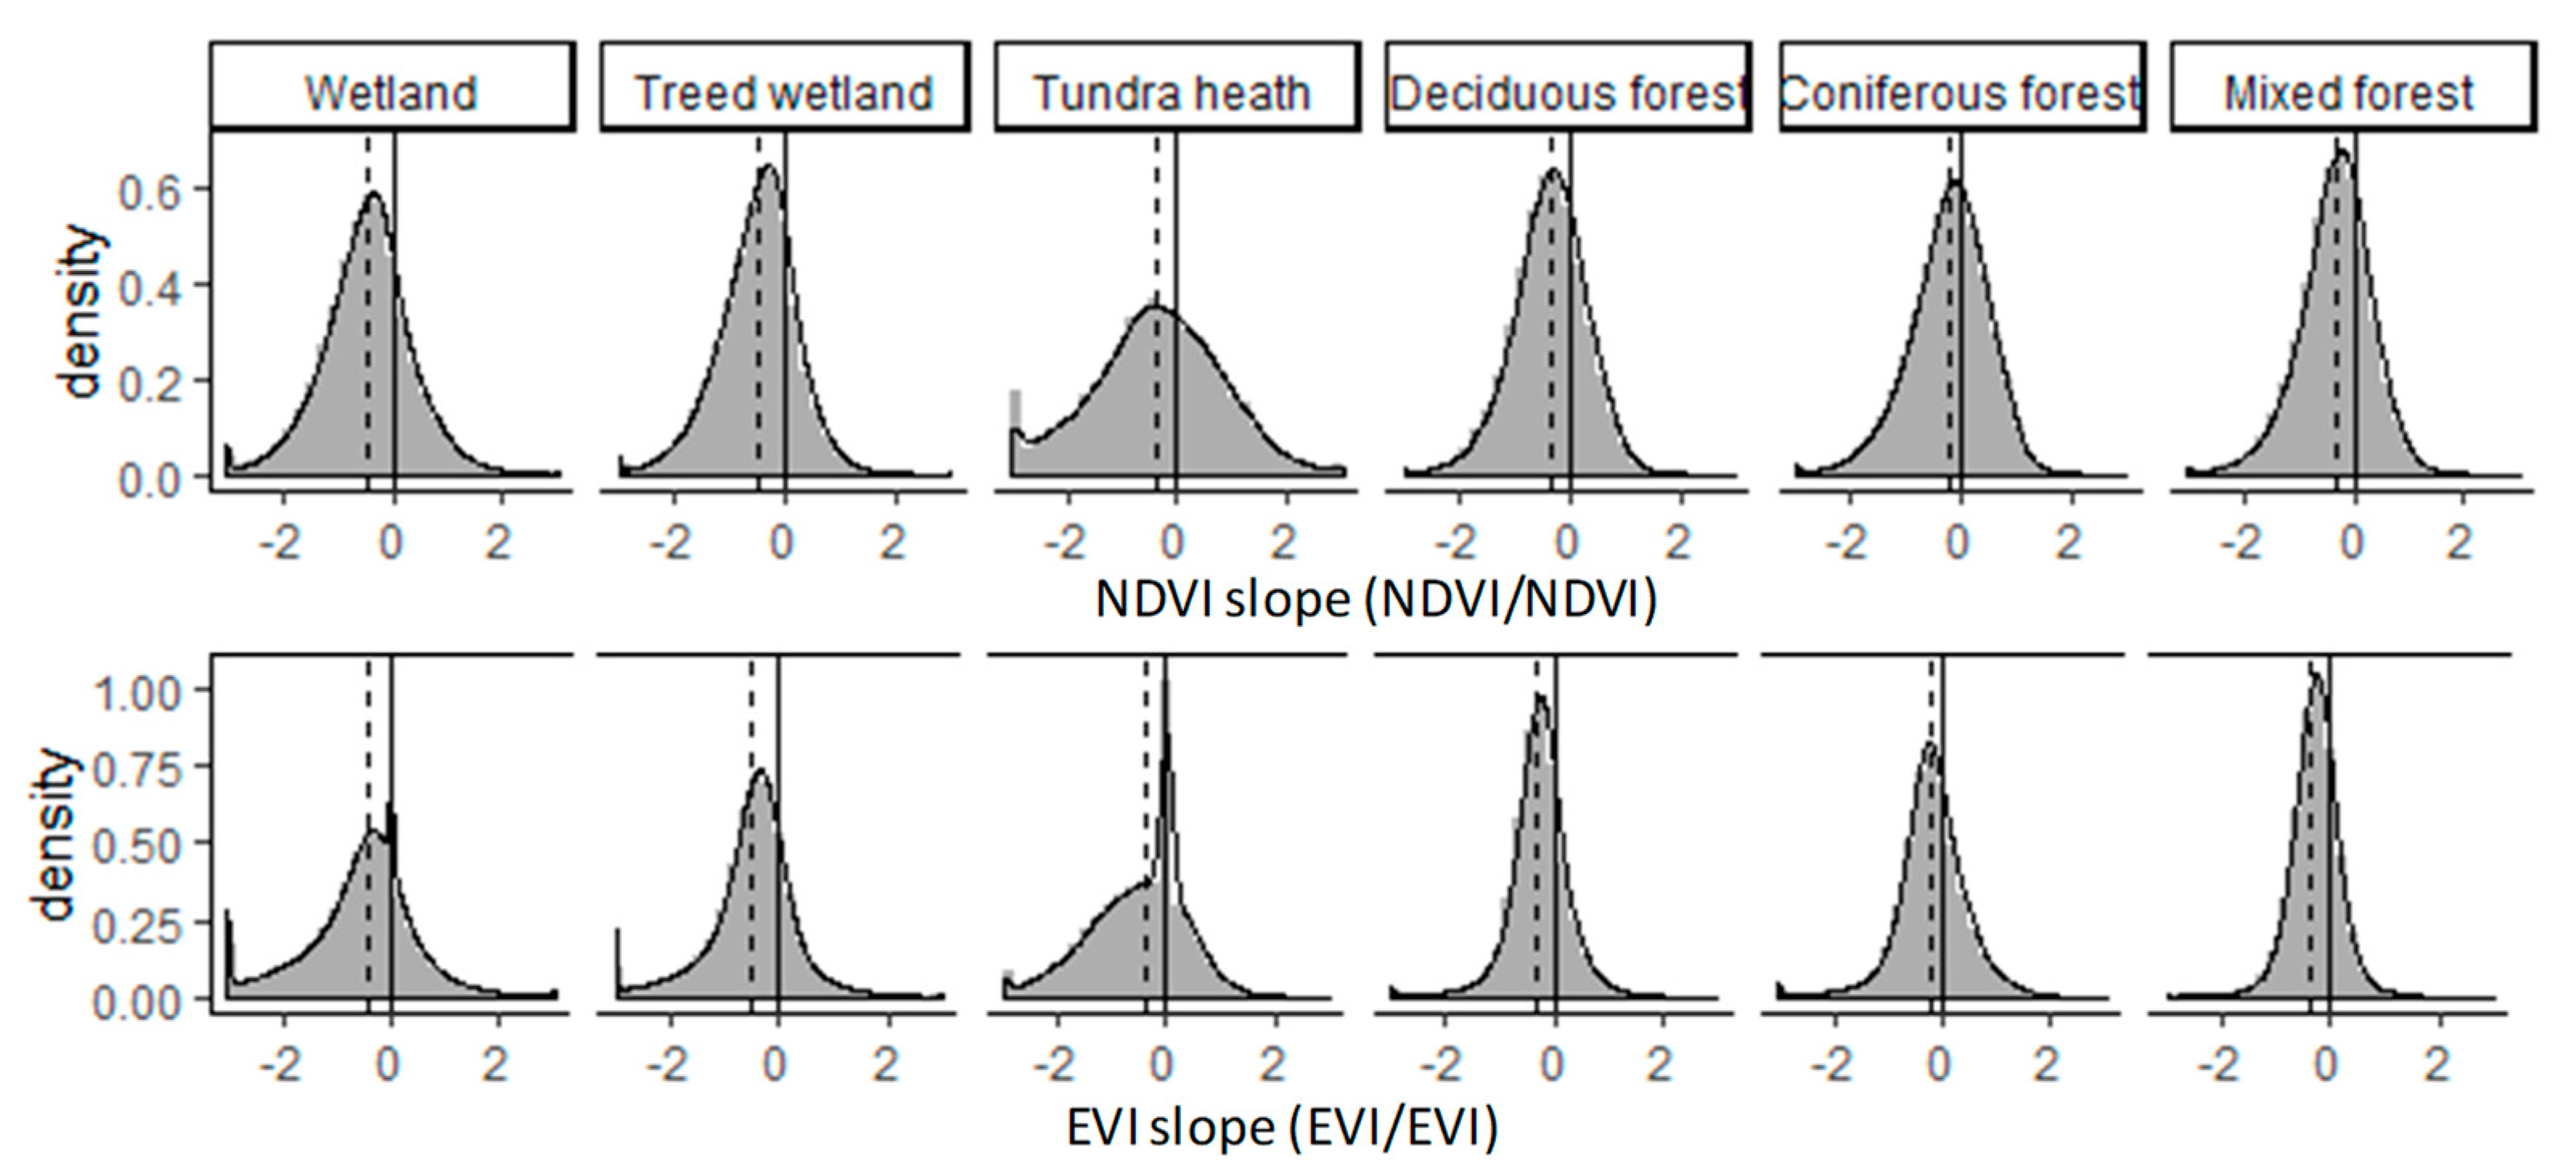
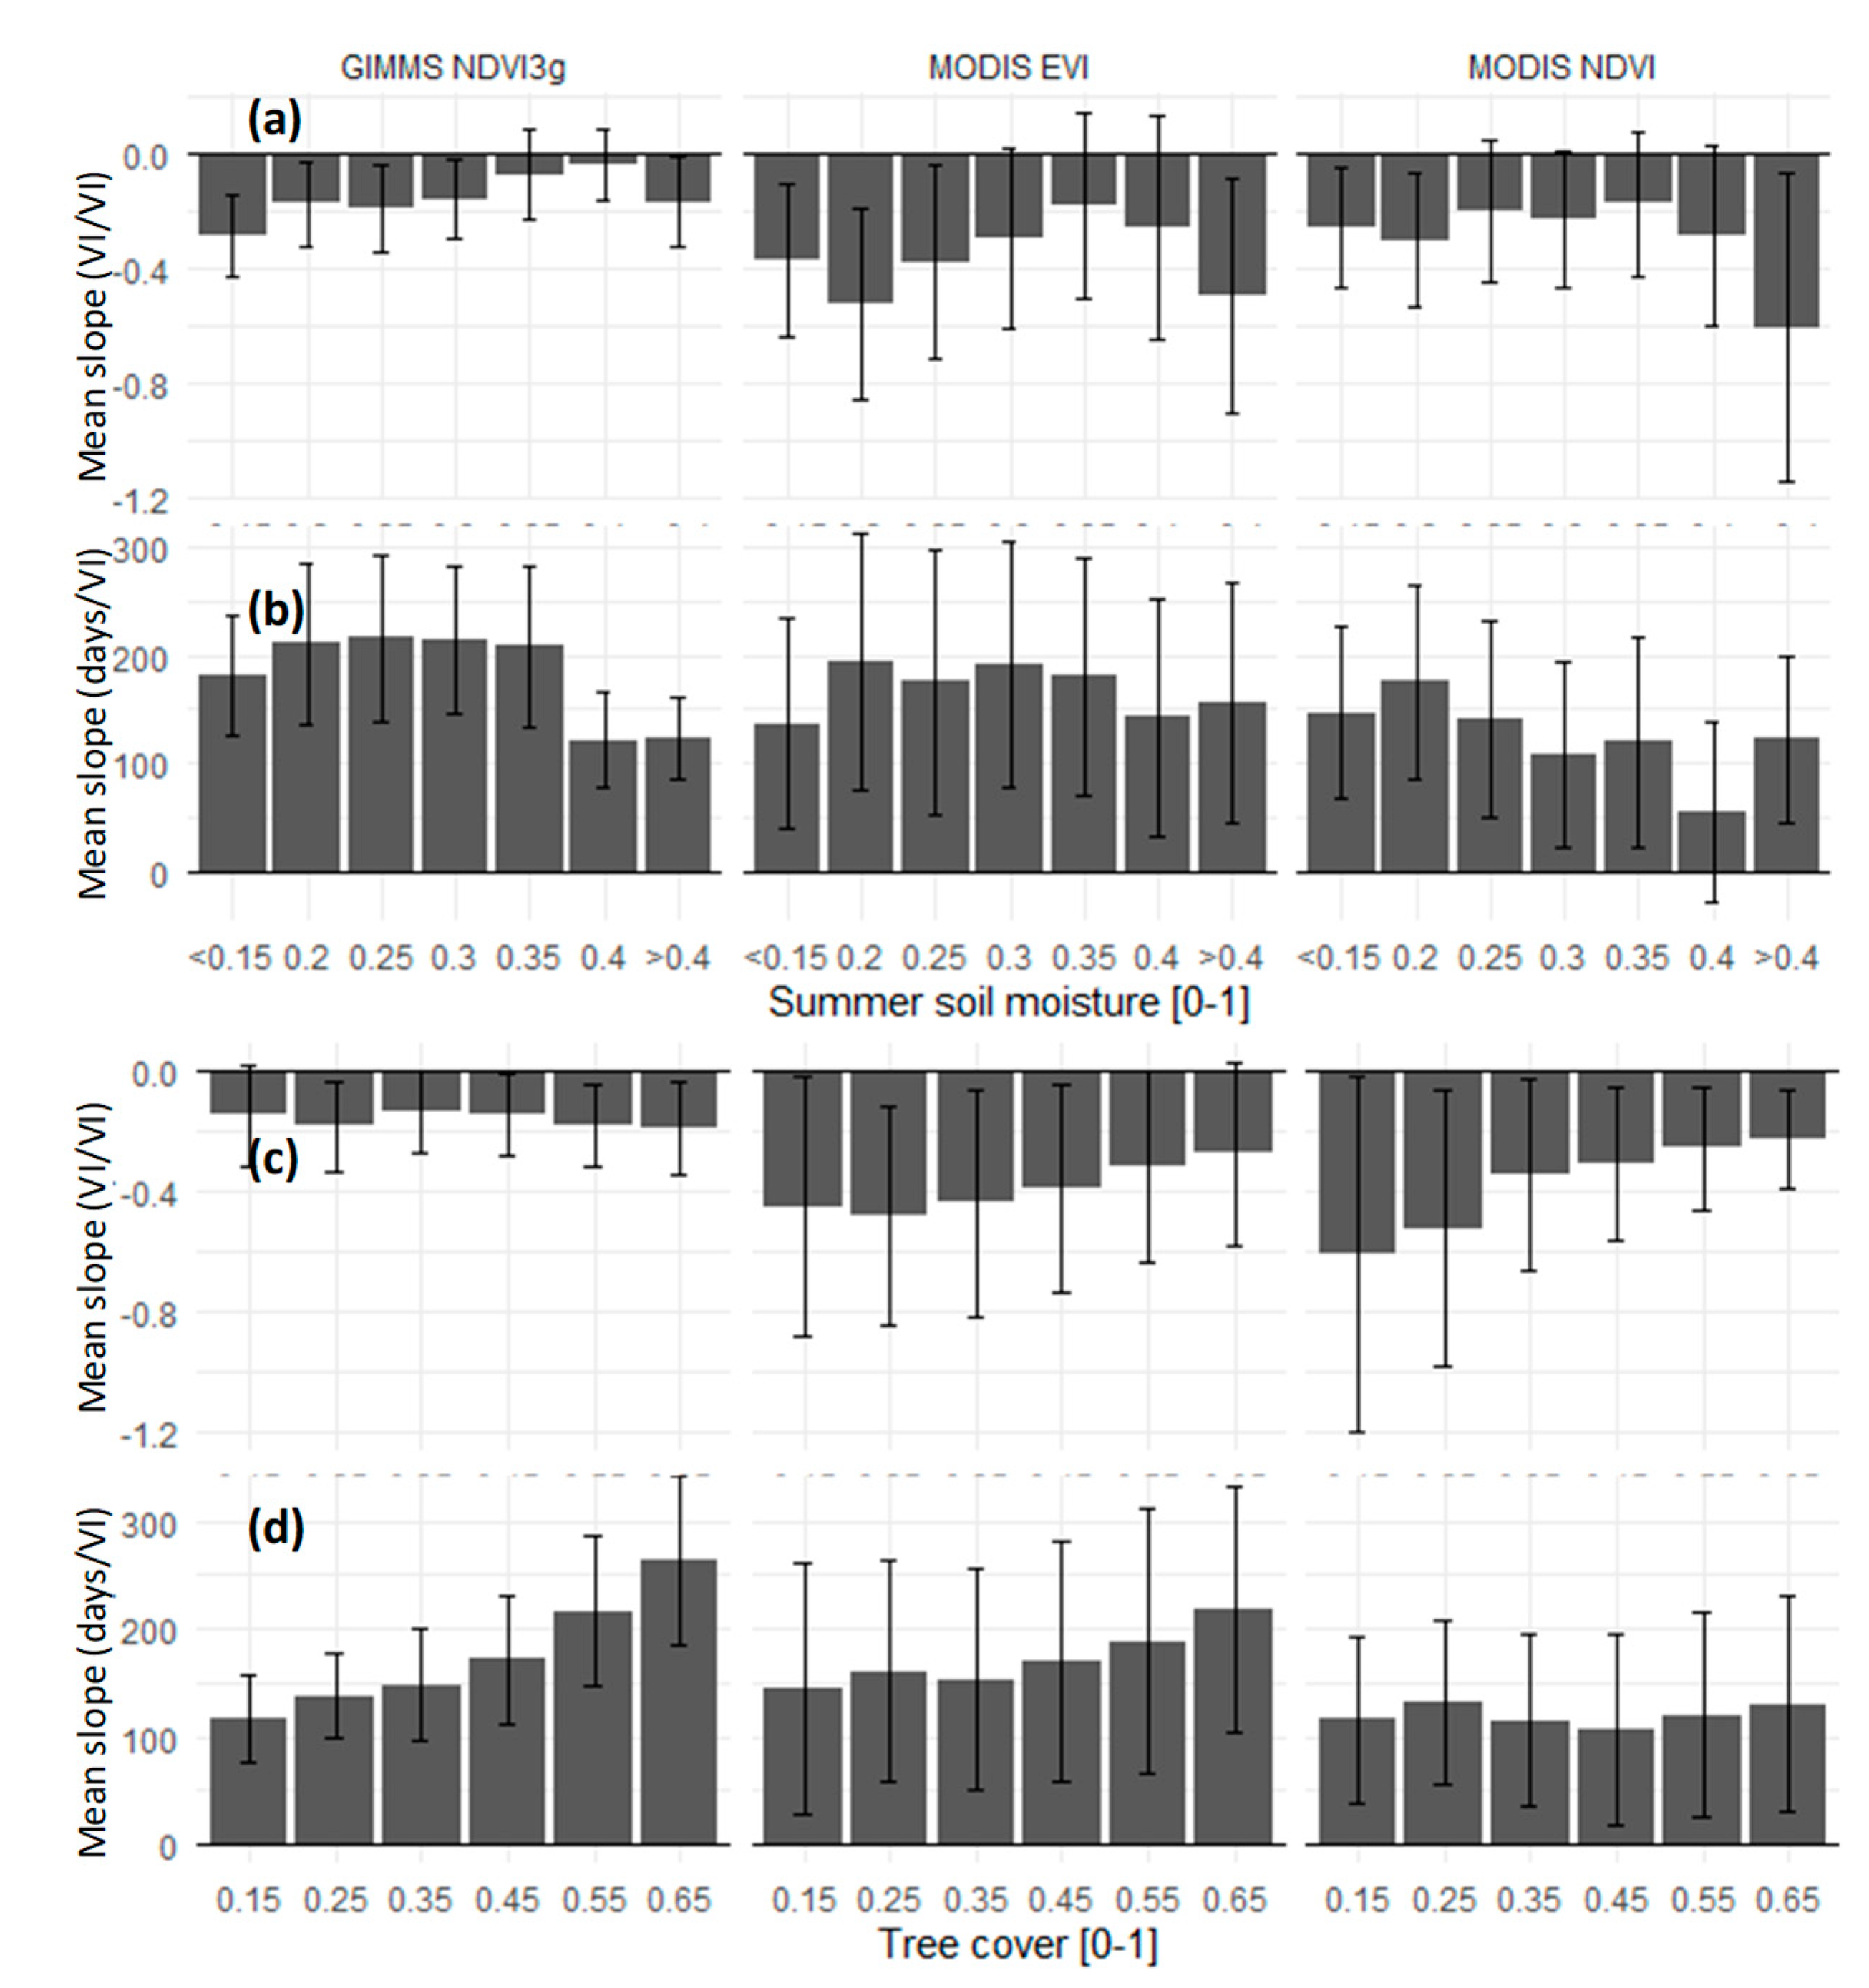
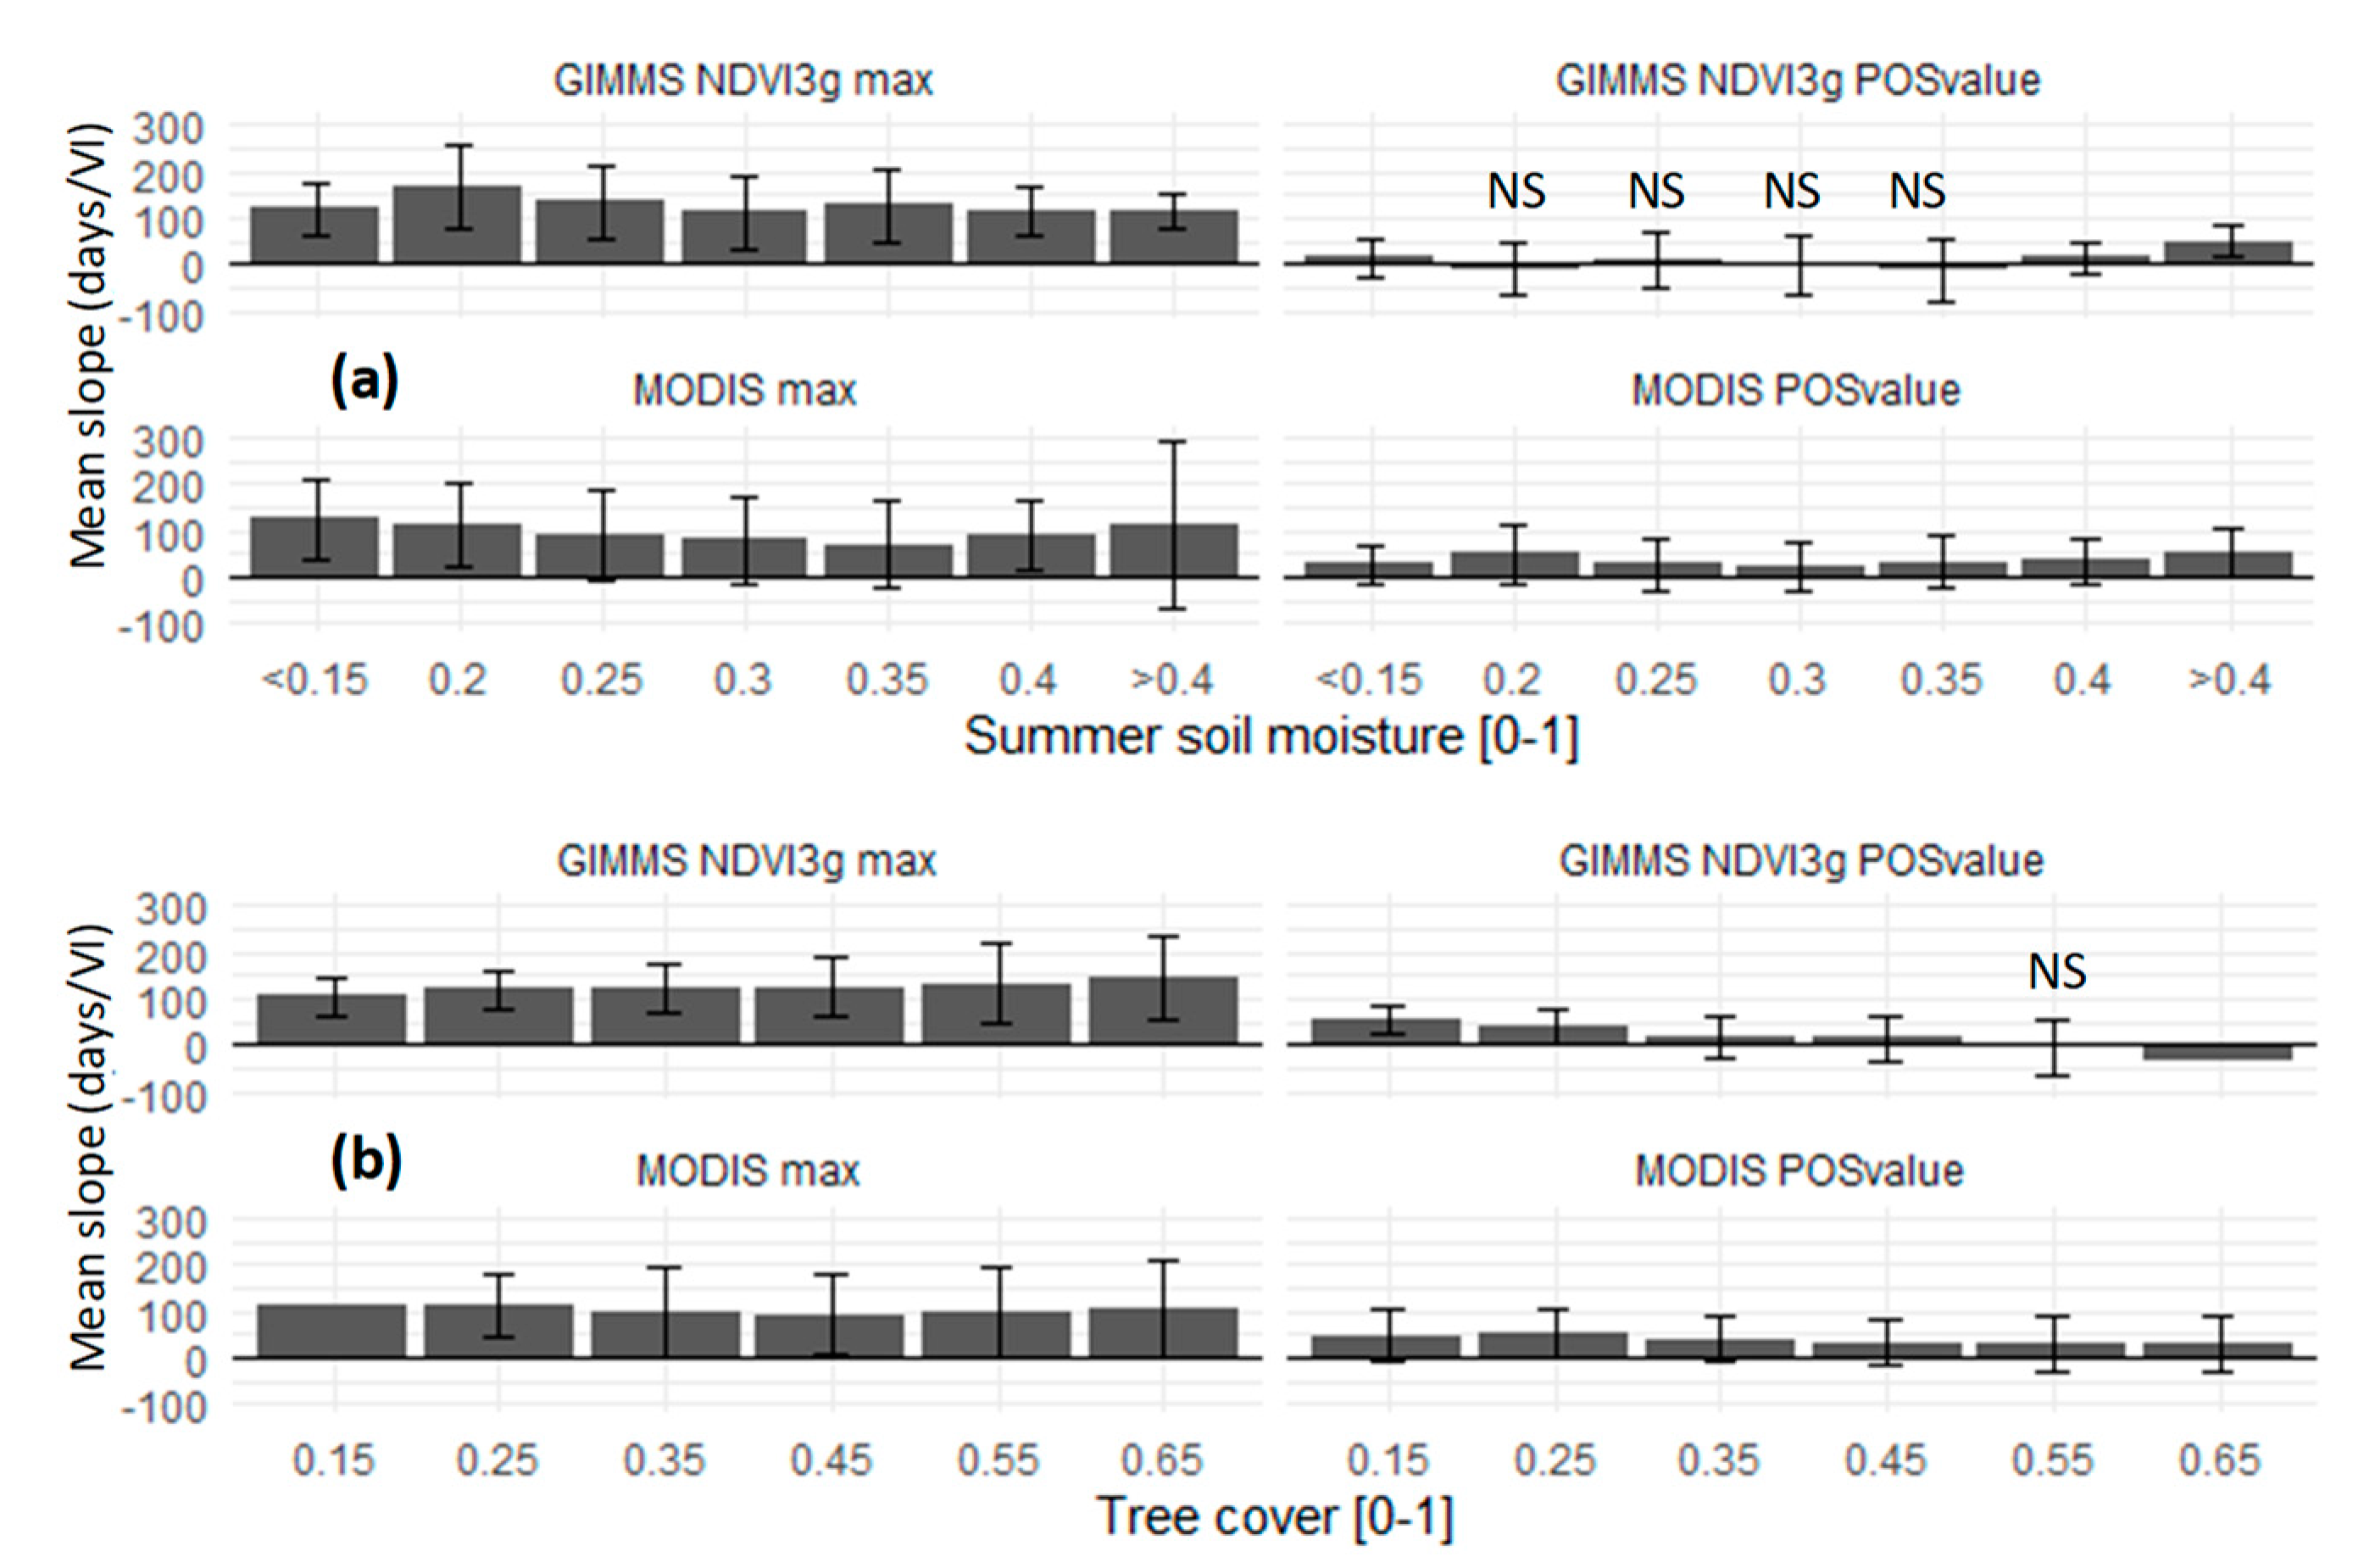
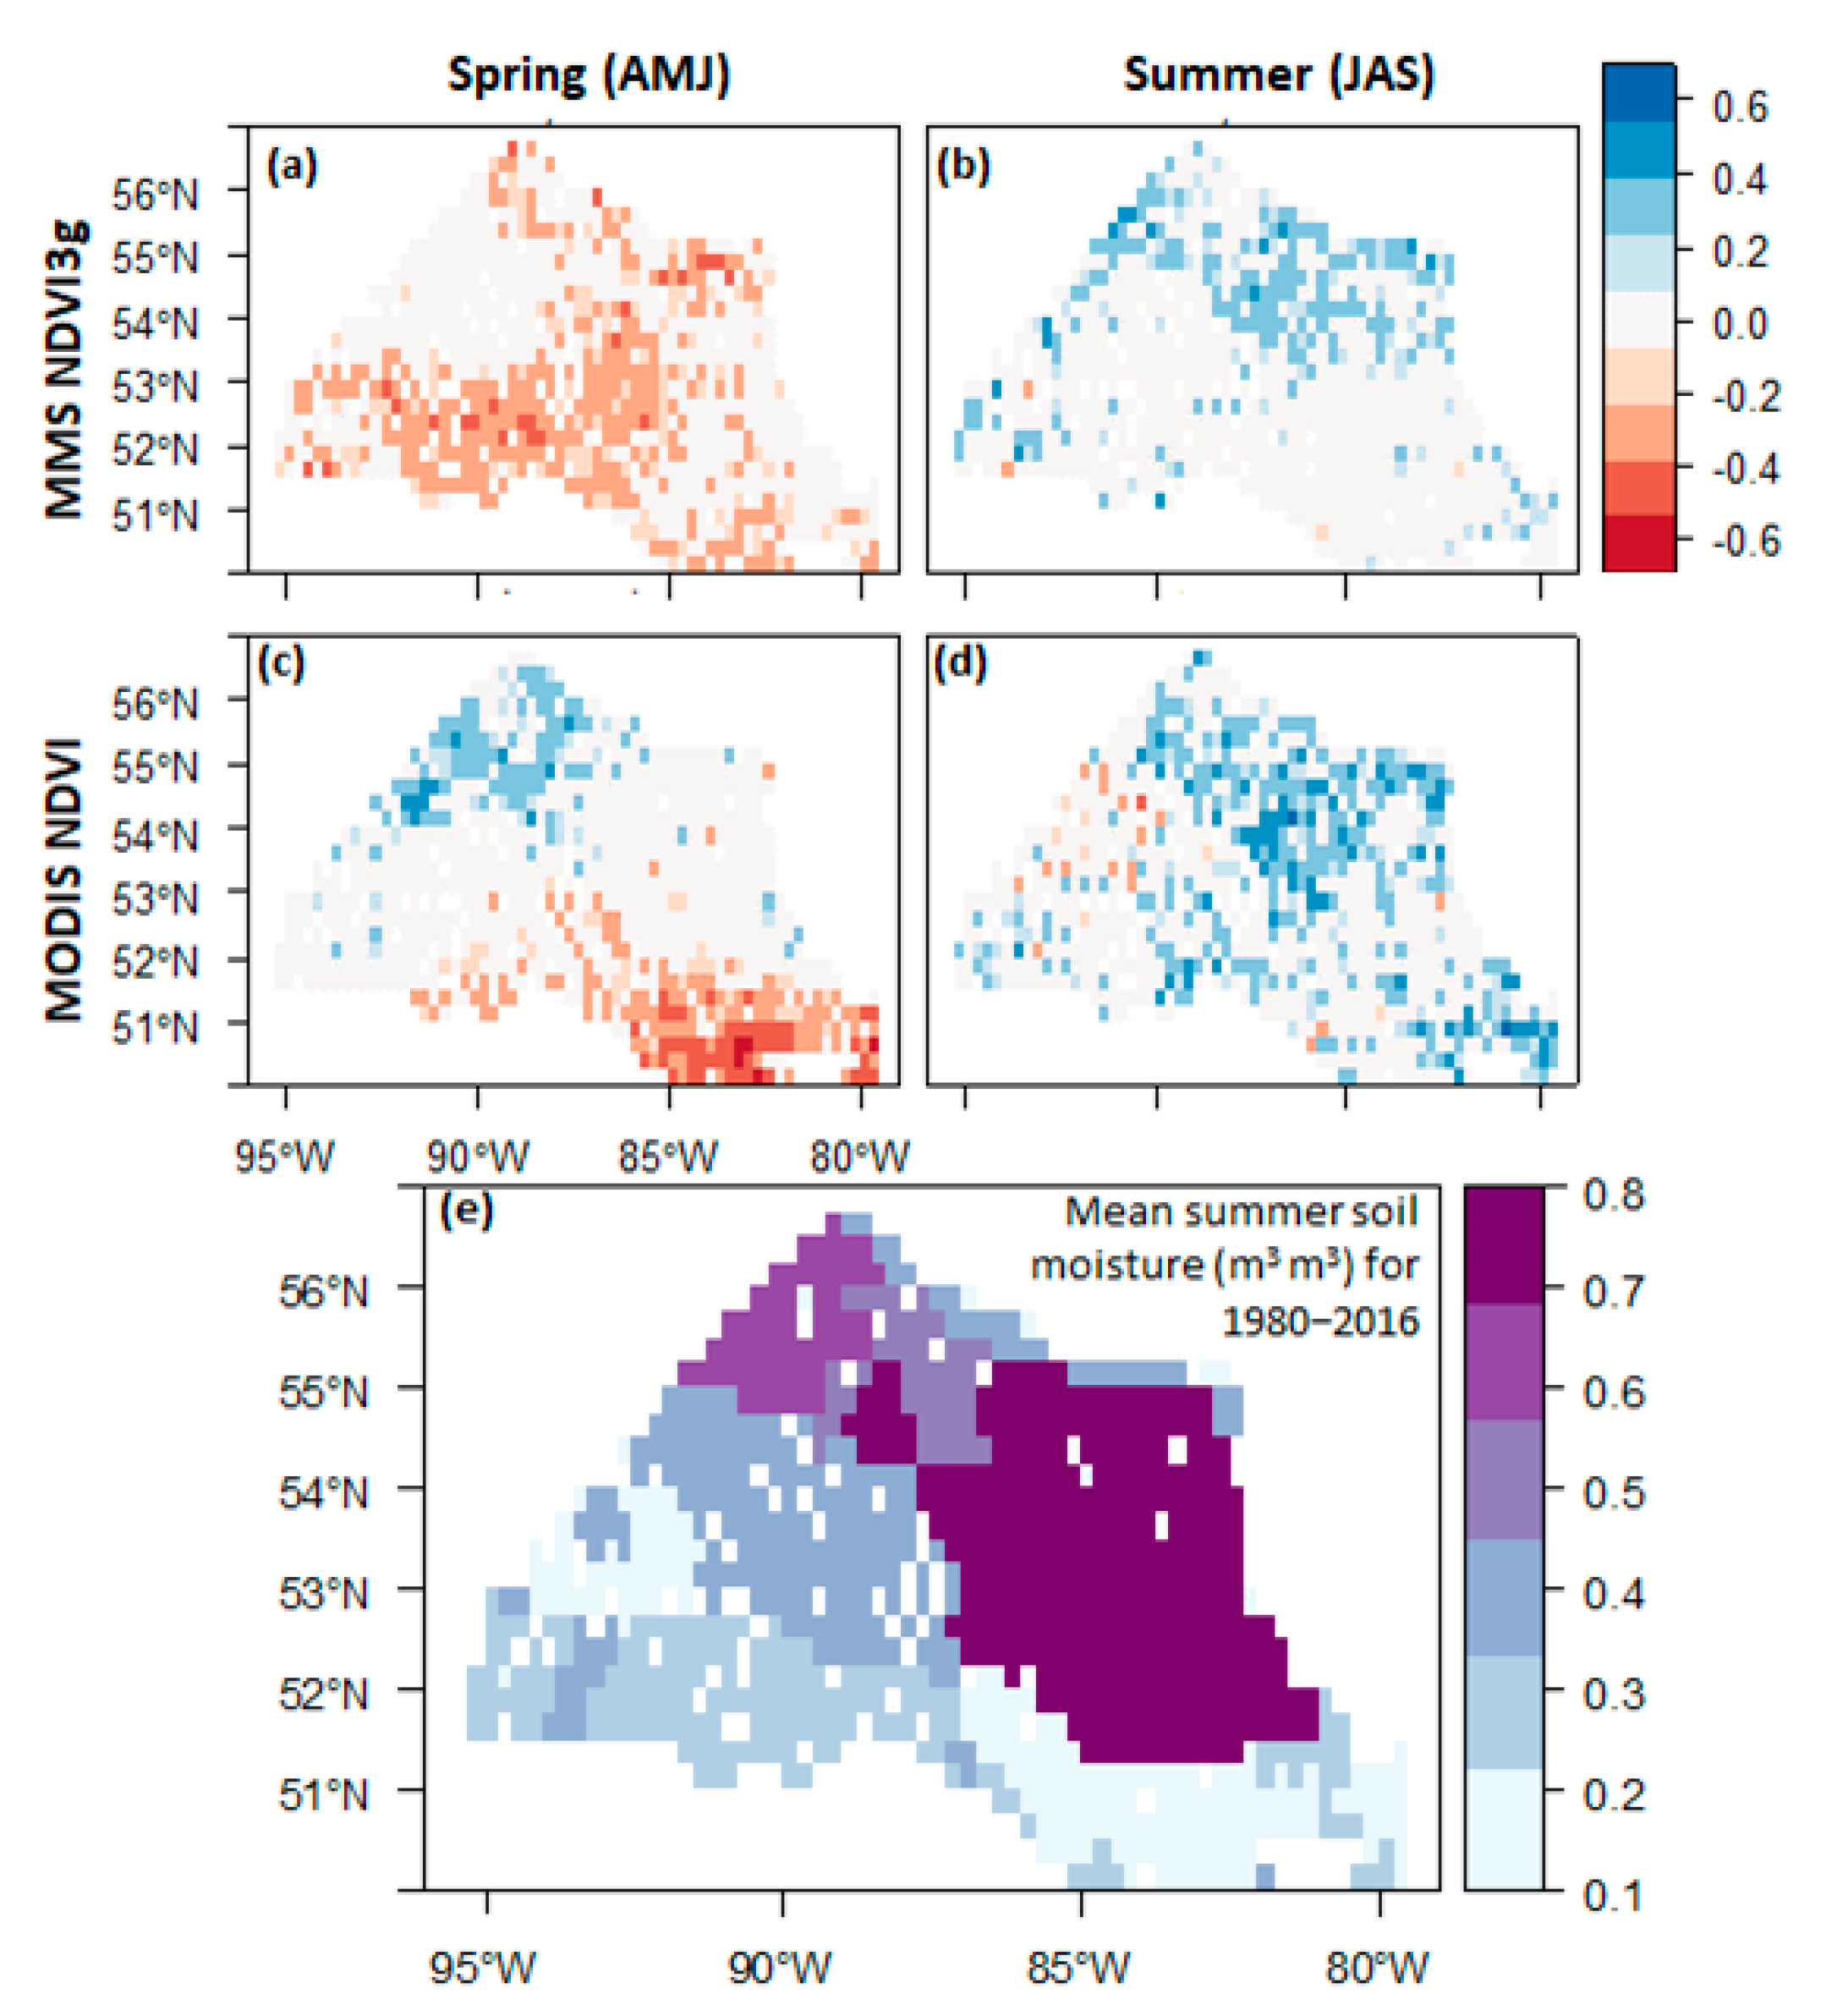
3. Results and Discussion
4. Conclusions
Supplementary Materials
Author Contributions
Funding
Acknowledgments
Conflicts of Interest
References
- Nemani, R.R.; Keeling, C.D.; Hashimoto, H.; Jolly, W.M.; Piper, S.C.; Tucker, C.J.; Myneni, R.B.; Running, S.W. Climate-driven increases in global terrestrial net primary production from 1982 to 1999. Science 2003, 300, 1560–1563. [Google Scholar] [CrossRef] [PubMed]
- Myneni, R.B.; Keeling, C.D.; Tucker, C.J.; Asrar, G.; Nemani, R.R. Increased plant growth in the northern high latitudes from 1981 to 1991. Nature 1997, 386, 698–702. [Google Scholar] [CrossRef]
- Gonsamo, A.; Chen, J.M.; Shindell, D.T.; Asner, G.P. Coherence among the Northern Hemisphere land, cryosphere, and ocean responses to natural variability and anthropogenic forcing during the satellite era. Earth Syst. Dyn. 2016, 7, 717–734. [Google Scholar] [CrossRef] [Green Version]
- De Jong, R.; De Bruin, S.; De Wit, A.; Schaepman, M.E.; Dent, D.L. Analysis of monotonic greening and browning trends from global NDVI time-series. Remote Sens. Environ. 2011, 115, 692–702. [Google Scholar] [CrossRef] [Green Version]
- Gonsamo, A.; Chen, J.M.; Lombardozzi, D. Global vegetation productivity response to climatic oscillations during the satellite era. Glob. Chang. Boil. 2016, 22, 3414–3426. [Google Scholar] [CrossRef] [PubMed]
- Zhang, Y.; Song, C.; Band, L.E.; Sun, G.; Li, J. Reanalysis of global terrestrial vegetation trends from MODIS products: Browning or greening? Remote Sens. Environ. 2017, 191, 145–155. [Google Scholar] [CrossRef] [Green Version]
- Tian, F.; Fensholt, R.; Verbesselt, J.; Grogan, K.; Horion, S.; Wang, Y. Evaluating temporal consistency of long-term global NDVI datasets for trend analysis. Remote Sens. Environ. 2015, 163, 326–340. [Google Scholar] [CrossRef]
- Graven, H.D.; Keeling, R.F.; Piper, S.C.; Patra, P.K.; Stephens, B.B.; Wofsy, S.C.; Welp, L.R.; Sweeney, C.; Tans, P.P.; Kelley, J.J.; et al. Enhanced Seasonal Exchange of CO2 by Northern Ecosystems Since 1960Enhanced Seasonal Exchange of CO2 by Northern Ecosystems Since 1960. Science 2013, 341, 1085–1089. [Google Scholar] [CrossRef]
- Forkel, M.; Carvalhais, N.; Rödenbeck, C.; Keeling, R.; Heimann, M.; Thonicke, K.; Zaehle, S.; Reichstein, M. Enhanced seasonal CO2 exchange caused by amplified plant productivity in northern ecosystems. Science 2016, 351, 696–699. [Google Scholar] [CrossRef]
- Keeling, C.D.; Chin, J.F.S.; Whorf, T.P. Increased activity of northern vegetation inferred from atmospheric CO2 measurements. Nature 1996, 382, 146–149. [Google Scholar] [CrossRef]
- Cleland, E.E.; Chuine, I.; Menzel, A.; Mooney, H.A.; Schwartz, M.D. Shifting plant phenology in response to global change. Trends Ecol. Evol. 2007, 22, 357–365. [Google Scholar] [CrossRef] [PubMed]
- Menzel, A.; Sparks, T.H.; Estrella, N.; Koch, E.; Aasa, A.; Ahas, R.; Alm-Kübler, K.; Bissolli, P.; Braslavská, O.; Briede, A.; et al. European phenological response to climate change matches the warming pattern. Glob. Chang. Boil. 2006, 12, 1969–1976. [Google Scholar] [CrossRef]
- Walther, G.-R.; Post, E.; Convey, P.; Menzel, A.; Parmesan, C.; Beebee, T.J.C.; Fromentin, J.-M.; Hoegh-Guldberg, O.; Bairlein, F. Ecological responses to recent climate change. Nature 2002, 416, 389–395. [Google Scholar] [CrossRef] [PubMed]
- Gonsamo, A.; Chen, J.M.; Ooi, Y.W. Peak season plant activity shift towards spring is reflected by increasing carbon uptake by extratropical ecosystems. Glob. Chang. Biol. 2018, 24, 2117–2128. [Google Scholar] [CrossRef] [PubMed]
- Xu, C.; Liu, H.; Williams, A.P.; Yin, Y.; Wu, X. Trends toward an earlier peak of the growing season in Northern Hemisphere mid-latitudes. Glob. Chang. Boil. 2016, 22, 2852–2860. [Google Scholar] [CrossRef] [PubMed]
- Bhatt, U.S.; Walker, D.A.; Raynolds, M.K.; Bieniek, P.A.; Epstein, H.E.; Comiso, J.C.; Pinzon, J.E.; Tucker, C.J.; Steele, M.; Ermold, W.; et al. Changing seasonality of panarctic tundra vegetation in relationship to climatic variables. Environ. Res. Lett. 2017, 12, 055003. [Google Scholar] [CrossRef]
- Keenan, T.F.; Gray, J.; Friedl, M.A.; Toomey, M.; Bohrer, G.; Hollinger, D.Y.; Munger, J.W.; O’Keefe, J.; Schmid, H.P.; Wing, I.S.; et al. Net carbon uptake has increased through warming-induced changes in temperate forest phenology. Nat. Clim. Chang. 2014, 4, 598–604. [Google Scholar] [CrossRef]
- Keeling, C.D.; Piper, S.C.; Bacastow, R.B.; Wahlen, M.; Whorf, T.P.; Heimann, M.; Meijer, H.A. Atmospheric CO2 and 13CO2 exchange with the terrestrial biosphere and oceans from 1978 to 2000: Observations and carbon cycle implications. In A History of Atmospheric CO2 and its Effects on Plants, Animals, and Ecosystems; Ehleringer, J.R., Cerling, T.E., Dearing, M.D., Eds.; Springer: New York, NY, USA, 2005; pp. 83–113. [Google Scholar]
- Gonsamo, A.; D’Odorico, P.; Chen, J.M.; Wu, C.; Buchmann, N. Changes in vegetation phenology are not reflected in atmospheric CO2 and 13C/12C seasonality. Glob. Chang. Boil. 2017, 23, 4029–4044. [Google Scholar] [CrossRef]
- Guay, K.C.; Beck, P.S.A.; Berner, L.T.; Goetz, S.J.; Baccini, A.; Buermann, W. Vegetation productivity patterns at high northern latitudes: A multi-sensor satellite data assessment. Glob. Chang. Boil. 2014, 20, 3147–3158. [Google Scholar] [CrossRef]
- Berner, L.T.; Beck, P.S.A.; Bunn, A.G.; Lloyd, A.H.; Goetz, S.J. High-latitude tree growth and satellite vegetation indices: Correlations and trends in Russia and Canada (1982–2008). J. Geophys. Res. Space Phys. 2011, 116. [Google Scholar] [CrossRef]
- Beck, P.S.A.; Goetz, S.J. Satellite observations of high northern latitude vegetation productivity changes between 1982 and 2008: Ecological variability and regional differences. Environ. Res. Lett. 2011, 6, 045501. [Google Scholar] [CrossRef]
- Bunn, A.G.; Goetz, S.J. Trends in Satellite-Observed Circumpolar Photosynthetic Activity from 1982 to 2003: The Influence of Seasonality, Cover Type, and Vegetation Density. Earth Interact. 2006, 10, 1–19. [Google Scholar] [CrossRef] [Green Version]
- Verbyla, D. The greening and browning of Alaska based on 1982–2003 satellite data. Glob. Ecol. Biogeogr. 2008, 17, 547–555. [Google Scholar] [CrossRef]
- Ju, J.; Masek, J.G. The vegetation greenness trend in Canada and US Alaska from 1984–2012 Landsat data. Remote Sens. Environ. 2016, 176, 1–16. [Google Scholar] [CrossRef]
- Pan, N.; Feng, X.; Fu, B.; Wang, S.; Ji, F.; Pan, S. Increasing global vegetation browning hidden in overall vegetation greening: Insights from time-varying trends. Remote Sens. Environ. 2018, 214, 59–72. [Google Scholar] [CrossRef]
- Phoenix, G.K.; Bjerke, J.W. Arctic browning: Extreme events and trends reversing arctic greening. Glob. Chang. Biol. 2016, 22, 2960–2962. [Google Scholar] [CrossRef]
- Fu, Y.H.; Zhao, H.; Piao, S.; Peaucelle, M.; Peng, S.; Zhou, G.; Ciais, P.; Huang, M.; Menzel, A.; Peñuelas, J.; et al. Declining global warming effects on the phenology of spring leaf unfolding. Nature 2015, 526, 104–107. [Google Scholar] [CrossRef] [Green Version]
- Rutishauser, T.; Luterbacher, J.; Defila, C.; Frank, D.; Wanner, H. Swiss spring plant phenology 2007: Extremes, a multi-century perspective, and changes in temperature sensitivity. Geophys. Res. Lett. 2008, 35. [Google Scholar] [CrossRef] [Green Version]
- Piao, S.; Nan, H.; Huntingford, C.; Ciais, P.; Friedlingstein, P.; Sitch, S.; Peng, S.; Ahlström, A.; Canadell, J.G.; Cong, N.; et al. Evidence for a weakening relationship between interannual temperature variability and northern vegetation activity. Nat. Commun. 2014, 5, 5018. [Google Scholar] [CrossRef] [Green Version]
- Briffa, K.R.; Schweingruber, F.H.; Jones, P.D.; Osborn, T.J.; Shiyatov, S.G.; Vaganov, E.A.; Osborn, T. Reduced sensitivity of recent tree-growth to temperature at high northern latitudes. Nature 1998, 391, 678–682. [Google Scholar] [CrossRef]
- Piao, S.; Liu, Z.; Wang, T.; Peng, S.; Ciais, P.; Huang, M.; Ahlstrom, A.; Burkhart, J.F.; Chevallier, F.; Janssens, I.A.; et al. Weakening temperature control on the interannual variations of spring carbon uptake across northern lands. Nat. Clim. Chang. 2017, 7, 359–363. [Google Scholar] [CrossRef]
- Trahan, M.W.; Schubert, B.A. Temperature-induced water stress in high-latitude forests in response to natural and anthropogenic warming. Glob. Chang. Boil. 2016, 22, 782–791. [Google Scholar] [CrossRef] [PubMed]
- Ding, J.; Yang, T.; Zhao, Y.; Liu, D.; Wang, X.; Yao, Y.; Peng, S.; Wang, T.; Piao, S. Increasingly important role of atmospheric aridity on Tibetan alpine grasslands. Geophys. Res. Lett. 2018, 45, 2852–2859. [Google Scholar] [CrossRef]
- D’Orangeville, L.; Maxwell, J.; Kneeshaw, D.; Pederson, N.; Duchesne, L.; Logan, T.; Houle, D.; Arseneault, D.; Beier, C.M.; Bishop, D.A.; et al. Drought timing and local climate determine the sensitivity of eastern temperate forests to drought. Glob. Chang. Boil. 2018, 24, 2339–2351. [Google Scholar] [CrossRef] [PubMed]
- Yu, Z.; Lu, C.; Cao, P.; Tian, H.; Hessl, A.; Pederson, N. Earlier leaf-flushing suppressed ecosystem productivity by draining soil water in the Mongolian Plateau. Agric. For. Meteorol. 2018, 250, 1–8. [Google Scholar] [CrossRef]
- Hu, J.; Moore, D.J.P.; Burns, S.P.; Monson, R.K. Longer growing seasons lead to less carbon sequestration by a subalpine forest. Glob. Chang. Boil. 2010, 16, 771–783. [Google Scholar] [CrossRef]
- Angert, A.; Biraud, S.; Bonfils, C.; Henning, C.C.; Buermann, W.; Pinzon, J.; Tucker, C.J.; Fung, I. Drier summers cancel out the CO2 uptake enhancement induced by warmer springs. Proc. Natl. Acad. Sci. USA 2005, 102, 10823–10827. [Google Scholar] [CrossRef]
- Buermann, W.; Bikash, P.R.; Jung, M.; Burn, D.H.; Reichstein, M. Earlier springs decrease peak summer productivity in North American boreal forests. Environ. Res. Lett. 2013, 8, 024027. [Google Scholar] [CrossRef]
- Parmentier, F.-J.; Van Der Molen, M.K.; Van Huissteden, J.; Karsanaev, S.A.; Kononov, A.; Suzdalov, D.A.; Maximov, T.C.; Dolman, A.J. Longer growing seasons do not increase net carbon uptake in the northeastern Siberian tundra. J. Geophys. Res. Space Phys. 2011, 116. [Google Scholar] [CrossRef] [Green Version]
- Parida, B.R.; Buermann, W. Increasing summer drying in North American ecosystems in response to longer nonfrozen periods. Geophys. Res. Lett. 2014, 41, 5476–5483. [Google Scholar] [CrossRef]
- The Far North Science Advisory Panel. Science for a Changing Far North; Ontario Ministry of Natural Resources: Nipigon, ON, USA, 2010.
- Gonsamo, A.; Chen, J.M.; Colombo, S.J.; Ter-Mikaelian, M.T.; Chen, J.; Ter-Mikaelian, M.T. Global change induced biomass growth offsets carbon released via increased forest fire and respiration of the central Canadian boreal forest. J. Geophys. Res. Biogeosci. 2017, 122, 1275–1293. [Google Scholar] [CrossRef]
- Packalen, M.S.; Finkelstein, S.A.; McLaughlin, J.W. Carbon storage and potential methane production in the Hudson Bay Lowlands since mid-Holocene peat initiation. Nat. Commun. 2014, 5, 4078. [Google Scholar] [CrossRef] [PubMed] [Green Version]
- Hugelius, G.; Strauss, J.; Zubrzycki, S.; Harden, J.W.; Schuur, E.A.G.; Ping, C.-L.; Schirrmeister, L.; Grosse, G.; Michaelson, G.J.; Koven, C.D.; et al. Estimated stocks of circumpolar permafrost carbon with quantified uncertainty ranges and identified data gaps. Biogeosciences 2014, 11, 6573–6593. [Google Scholar] [CrossRef] [Green Version]
- Gonsamo, A.; Chen, J.M.; Price, D.T.; Kurz, W.A.; Liu, J.; Boisvenue, C.; Hember, R.A.; Wu, C.; Chang, K.-H. Improved assessment of gross and net primary productivity of Canada’s landmass. J. Geophys. Res. Biogeosci. 2013, 118, 1546–1560. [Google Scholar] [CrossRef]
- Huete, A.; Didan, K.; Miura, T.; Rodriguez, E.; Gao, X.; Ferreira, L. Overview of the radiometric and biophysical performance of the MODIS vegetation indices. Remote Sens. Environ. 2002, 83, 195–213. [Google Scholar] [CrossRef]
- Vermote, E.F.; Vermeulen, A. Atmospheric Correction Algorithm: Spectral Reflectance (MOD09); University of Maryland, Department of Geography: College Park MD, USA, 1999. [Google Scholar]
- Pinzon, J.; Tucker, C. A Non-Stationary 1981–2012 AVHRR NDVI3g Time Series. Remote Sens. 2014, 6, 6929–6960. [Google Scholar] [CrossRef]
- Martens, B.; Miralles, D.G.; Lievens, H.; Van Der Schalie, R.; De Jeu, R.A.M.; Fernández-Prieto, D.; Beck, H.E.; Dorigo, W.A.; Verhoest, N.E.C. GLEAM v3: Satellite-based land evaporation and root-zone soil moisture. Geosci. Model Dev. 2017, 10, 1903–1925. [Google Scholar] [CrossRef]
- Dorigo, W.; Wagner, W.; Albergel, C.; Albrecht, F.; Balsamo, G.; Brocca, L.; Chung, D.; Ertl, M.; Forkel, M.; Gruber, A.; et al. ESA CCI Soil Moisture for improved Earth system understanding: State-of-the art and future directions. Remote Sens. Environ. 2017, 203, 185–215. [Google Scholar] [CrossRef]
- Gonsamo, A.; Chen, J.M. Circumpolar vegetation dynamics product for global change study. Remote Sens. Environ. 2016, 182, 13–26. [Google Scholar] [CrossRef] [Green Version]
- Gonsamo, A.; Chen, J.M. Spectral Response Function Comparability among 21 Satellite Sensors for Vegetation Monitoring. IEEE Trans. Geosci. Remote Sens. 2012, 1–17. [Google Scholar] [CrossRef]
- Buermann, W.; Forkel, M.; O’Sullivan, M.; Sitch, S.; Friedlingstein, P.; Haverd, V.; Jain, A.K.; Kato, E.; Kautz, M.; Lienert, S.; et al. Widespread seasonal compensation effects of spring warming on northern plant productivity. Nature 2018, 562, 110–114. [Google Scholar] [CrossRef] [PubMed] [Green Version]
- Girardin, M.P.; Bouriaud, O.; Hogg, E.H.; Kurz, W.; Zimmermann, N.E.; Metsaranta, J.M.; de Jong, R.; Frank, D.C.; Esper, J.; Büntgen, U.; et al. No growth stimulation of Canada’s boreal forest under half-century of combined warming and CO2 fertilization. Proc. Natl. Acad. Sci. USA 2016, 113, E8406–E8414. [Google Scholar] [CrossRef] [PubMed]
- Verbyla, D. Remote sensing of interannual boreal forest NDVI in relation to climatic conditions in interior Alaska. Environ. Res. Lett. 2015, 10, 125016. [Google Scholar] [CrossRef]
- May, J.L.; Parker, T.; Unger, S.; Oberbauer, S.F. Short term changes in moisture content drive strong changes in Normalized Difference Vegetation Index and gross primary productivity in four Arctic moss communities. Remote Sens. Environ. 2018, 212, 114–120. [Google Scholar] [CrossRef]
- Barber, V.A.; Juday, G.P.; Finney, B.P. Reduced growth of Alaskan white spruce in the twentieth century from temperature-induced drought stress. Nature 2000, 405, 668–673. [Google Scholar] [CrossRef] [PubMed]
- Peng, C.; Ma, Z.; Lei, X.; Zhu, Q.; Chen, H.; Wang, W.; Liu, S.; Li, W.; Fang, X.; Zhou, X. A drought-induced pervasive increase in tree mortality across Canada’s boreal forests. Nat. Clim. Chang. 2011, 1, 467–471. [Google Scholar] [CrossRef]
- Sherriff, R.L.; Miller, A.E.; Muth, K.; Schriver, M.; Batzel, R. Spruce growth responses to warming vary by ecoregion and ecosystem type near the forest-tundra boundary in south-west Alaska. J. Biogeogr. 2017, 6, 1457–1468. [Google Scholar] [CrossRef]
- Barichivich, J.; Briffa, K.R.; Myneni, R.; Van Der Schrier, G.; Dorigo, W.; Tucker, C.J.; Osborn, T.J.; Melvin, T.M.; Schrier, G. Temperature and Snow-Mediated Moisture Controls of Summer Photosynthetic Activity in Northern Terrestrial Ecosystems between 1982 and 2011. Remote Sens. 2014, 6, 1390–1431. [Google Scholar] [CrossRef] [Green Version]
- Buermann, W.; Parida, B.R.; Jung, M.; Macdonald, G.M.; Tucker, C.J.; Reichstein, M. Recent shift in Eurasian boreal forest greening response may be associated with warmer and drier summers. Geophys. Res. Lett. 2014, 41, 1995–2002. [Google Scholar] [CrossRef] [Green Version]


© 2019 by the authors. Licensee MDPI, Basel, Switzerland. This article is an open access article distributed under the terms and conditions of the Creative Commons Attribution (CC BY) license (http://creativecommons.org/licenses/by/4.0/).
Share and Cite
Gonsamo, A.; Ter-Mikaelian, M.T.; Chen, J.M.; Chen, J. Does Earlier and Increased Spring Plant Growth Lead to Reduced Summer Soil Moisture and Plant Growth on Landscapes Typical of Tundra-Taiga Interface? Remote Sens. 2019, 11, 1989. https://0-doi-org.brum.beds.ac.uk/10.3390/rs11171989
Gonsamo A, Ter-Mikaelian MT, Chen JM, Chen J. Does Earlier and Increased Spring Plant Growth Lead to Reduced Summer Soil Moisture and Plant Growth on Landscapes Typical of Tundra-Taiga Interface? Remote Sensing. 2019; 11(17):1989. https://0-doi-org.brum.beds.ac.uk/10.3390/rs11171989
Chicago/Turabian StyleGonsamo, Alemu, Michael T. Ter-Mikaelian, Jing M. Chen, and Jiaxin Chen. 2019. "Does Earlier and Increased Spring Plant Growth Lead to Reduced Summer Soil Moisture and Plant Growth on Landscapes Typical of Tundra-Taiga Interface?" Remote Sensing 11, no. 17: 1989. https://0-doi-org.brum.beds.ac.uk/10.3390/rs11171989