An Integrated Approach to 3D Web Visualization of Cultural Heritage Heterogeneous Datasets


School of Rural and Survey Engineering, National Technical University of Athens, 15780 Zografou, Greece
*
Author to whom correspondence should be addressed.
Remote Sens. 2019, 11(21), 2508; https://0-doi-org.brum.beds.ac.uk/10.3390/rs11212508
Submission received: 30 September 2019
/
Revised: 19 October 2019
/
Accepted: 24 October 2019
/
Published: 26 October 2019
(This article belongs to the Special Issue 2nd Edition Advances in Remote Sensing for Archaeological Heritage)
Abstract
:The evolution of the high-quality 3D archaeological representations from niche products to integrated online media has not yet been completed. Digital archives of the field often lack multimodal data interoperability, user interaction and intelligibility. A web-based cultural heritage archive that compensates for these issues is presented in this paper. The multi-resolution 3D models constitute the core of the visualization on top of which supportive documentation data and multimedia content are spatial and logical connected. Our holistic approach focuses on the dynamic manipulation of the 3D scene through the development of advanced navigation mechanisms and information retrieval tools. Users parse the multi-modal content in a geo-referenced way through interactive annotation systems over cultural points of interest and automatic narrative tours. Multiple 3D and 2D viewpoints are enabled in real-time to support data inspection. The implementation exploits front-end programming languages, 3D graphic libraries and visualization frameworks to handle efficiently the asynchronous operations and preserve the initial assets’ accuracy. The choice of Greece’s Meteora, UNESCO world site, as a case study accounts for the platform’s applicability to complex geometries and large-scale historical environments.
1. Introduction
Virtual reality, 3D graphics and digitized objects no longer require any expensive equipment or specialized hardware to be visualized. Their almost ubiquitous presence on the web has contributed to the comprehension of the third dimension by a wider audience. Exploiting users’ familiarization, the most prominent assets of the cultural heritage field are currently on the spotlight. Tangible heritage 3D models are of immense value, not only to the domain experts, but to anyone that can recognize their natural and cultural particularities. The distinctiveness of the represented object cannot be disputed or misinterpreted. Its inherited communicability reveals the cross-disciplinary information that lies to the aim of its digitation; geometric documentation, diagnosis and monitoring, conservation, natural disaster risk assessment, etc. [1]. The collaborative nature of these projects is enhanced as the 3D representations are common ground among the involved parts (professionals, researchers, institutions, organizations) for integrating and synthesizing various different approaches, methodologies and practices. Therefore, the perspective of their publication and online deployment covers a wider spectrum of applications for the cultural heritage community. It permits remote access, real-time co-operation, content updating and outward-looking policies. Especially when the supportive documentation data and textual information are appended to the visualization, the potential of transdisciplinary is maximized. The multi-level correlation of 3D and 2D cultural data elucidates technical assumptions and meanings, outlines the research findings and depicts the outcomes. For instance, it facilitates comparative surveys regarding seismic vulnerability or climate change impact to historical buildings by highlighting geometrical or structural changes [2]. Non-experts also profit from the openness of such projects and the reuse of cultural heritage information in 3D reconstructions, animations, virtual museums and narratives with multimedia content [3]. The actual potential landscape is expanded with search and retrieval services, contextualizing of digital resources and user interaction strategies. The most prominent efforts encompass partnerships among institutions, organizations and professional associations for digital libraries, 3D archives and organized repositories, such as CyArk, Europeana and Open Heritage 3D [4,5]. Research projects and individual scientific initiatives have also demonstrated pioneer work within these objectives. The Archaeo framework embraces collaborative research by publishing online ongoing field work documentation. Segmented 3D models of an archaeological site and its findings are embedded to a high-end 3D viewer and correlated with 2D GIS vector data and textual information derived by a MySQL database [6]. A multi-purpose platform is developed to promote the site of Nora and the Sanctuary of Aesculapius by University of Padova and 3DOM research group. It includes semantically enriched point-cloud visualization, a 2,5D WebGIS viewer and embedded photogrammetric 3D models of the sites’ artifacts for a scalable, interactive and contextual presentation [7].
Besides relevant seminal implementations in heritage datasets, the great abundance of related frameworks, platforms and applications can be misleading. Achieving a balance between 3D qualified displays and integrated advanced functionalities remains a challenge. Emphasizing to geometrically precise point clouds and meshes, they are the outreach of emerging methods (computer vision, reverse engineering, digital photogrammetry), cutting-edge technology (LiDAR, laser-scanners, UAVs) and spontaneous research. As their accuracy, size and complexity increase, so inadequate to manage them are the current technologies. Moreover, only a few can be considered as conclusive regarding the interactive, instructive and multidimensional aspect of the visualization.
Such a centralized approach involves two main issues. Each factor of the problem is subject to its own commitments and sets specific constrains and difficulties. The first one concerns the process of rendering and displaying 3D content and therefore, the techniques and means of managing efficiently the third dimension. In the context of the current work, the open-source software 3D Heritage Online Presenter (3DHOP) and Three.js 3D graphics library undertake this heavy computation task along with their underlying streaming and rendering technologies (Nexus.js, WebGL API etc.). The interactive integration and coordination of the different data in a dynamic website is the second factor and the main subject to be addressed in this article. We have developed an online visualization platform oriented to large-scale archaeological sites and complex historical assets. Our approach surpasses built-in features and basic paradigms leveraging JavaScript and WebGL for maximum customization of the 3D environment. It is developed based on the following principles:
Compliance with the principles of 3D Cultural Heritage archives
Facilitation of 3D scene navigation and investigation of the supplementary documentation with new tools to both experts and simple users
Modification, extension and testing of the 3DHOP and Three.js codebases
Development of spatial and logical relations based on data interoperability across different collections and viewpoints
Client-side architecture for optimal performance and responsiveness
Sophisticated design and user-friendly Graphical User Interface (GUI)
In particular, the overall aim is met by introducing these new tools and features:
Interactive retrieval of multimedia information (3D models, images and text) from the 3D scene while freely exploring it
Automatic navigation to predefined positions of the scene with brief descriptions for a narrative and comprehensive experience
Annotations and text labels applied on points of interest of 3D models for semantic enrichment
Concurrent visualization of 3D models of different level of detail, scale and format
Handling 3D models by assigning JavaScript functions directly to source code and scripting based on their inherent properties
Normalization of event model using jQuery library.
The complete visualization infrastructure is implemented and assessed upon the archaeological site of Meteora, an area greater than 10 km2. The input data (3D models, ortho-photo maps and various image collections) are part of the 3D geometric documentation of the site, conducted by the Laboratory of Photogrammetry, National Technical University of Athens, Greece. The remainder of this paper is organized as follows: Section 2 reviews existing solutions and their earlier related initiatives to reveal literature gaps or shortcomings. Section 3 elucidates the main aspects of the problem, and introduces the proposed methodology and system’s structure. The subsequent Section demonstrates the case study and the input data along with their acquisition and processing pipeline. In Section 5, the implementation process and its results are analyzed, including the design of the graphical user interface and the development of advanced tools and features. Finally, Section 6 evaluates the performance of the web platform by examining factors like loading times and network load.
2. Related Work
Focusing on the rendering and visualization pipeline, the current development platforms with corresponding implementations are presented and evaluated in this section. For consistency purposes we only report the works that followed photogrammetric methods for data collection and processing in the context of 3D geometric documentations. Along with a brief description of compression and streaming techniques, the paper’s contribution is highlighted and the choice of 3DHOP and Three.js library is justified.
2.1. 3D Web Publishing
The first approaches of 3D content on the web combined user interfaces such as OpenGL, Direct 3D or Java 3D with ISO VRML and X3D standards [8]. A common requirement was the partial or exclusive use of add-ons beyond the software and the browser. Until 2011, the lack of standardization and the diverging implementations prevented the consideration of 3D content as an internet media. The advent of WebGL standard introduced an intrinsic and cross-platform technical visualization environment and pushed the development of supportive libraries, open-source frameworks and commercial software. Synergetic approaches for precise 3D representations of the field employ low-level programming libraries like Three.js [9], Babylon.js [10] and Scene.js [11] with the higher-lever frameworks and software Potree [12], 3DHOP [13], X3DOM [14], Sketchfab or alternatively Unity3D. Some of them configure an adaptive user interface with predefined functions while other abstract WebGL concepts to offer shading and rendering methods as well as animations, math routines, loaders and scene components [15,16,17]. Each solution entails different code literacy skills, technological pipeline, data size and formats but eventually all succeed in their applicability area. There exists a considerable body on literature dedicated to Cultural Heritage 3D resources deploying either one exclusively or a combination of these utilities [18,19,20]. 3DHOP and Potree are free and open-source software packages for point cloud rendering and high-resolution 3D datasets respectively. Both have been proven competent to challenging use cases such as 4D–3D heritage sites [21,22] or 3D archaeological stratigraphy [23]. The progressive streaming of X3DOM has proven appropriate for case studies where virtual large-scale archaeology [24], geospatial data [25] and scanned museum artifacts [26] are presented in a basic viewer. A consolidated geometric documentation with textual descriptions linked on spots is presented in a modular framework using JavaScript, HTML5 and WebGL. Rather than deploying the X3DOM model directly, XML files describe the configuration, content and semantics schema that was incorporated independently to a 3D viewer module. [27]. Sketchfab is a commercial platform that hosts the 3D assets of more than 500 cultural institutions but its navigation, labeling and scene editing services are determined by the membership plan users are purchasing [28]. The free option allows a partially adjustable interaction and a number of annotations on top of the 3D scene but no further modifications can be made [29,30]. An unconventional way of online 3D publishing is merging gaming technology with WebGL. The Unity3D commercial game engine is known for its advanced interaction capabilities like ground detection and animation events and its robust API for large and complex geometries. The created 3D scene is compiled to be compatible with WebGL leading to big file size and memory footprint unlike native JavaScript solutions. Arc-Team has published a virtual navigation application on a photorealistic 3D model of Punta Linke archaeological museum using Unity 3D. The tour simulates how the 3D scene looks from eye-height, imitating the human-like walking behavior while highlighted points of interest provide additional information [31].
Among the aforementioned development platforms, research specific to a visualization schema that unites the manifold of a geometric documentation dataset is scarcely considered. In general, they adhere to the default set of capabilities of web-publishing solutions rather than customize their built-in functionalities to their project’s requirements. This study seeks to correlate cultural resources with high variability of data types, formats and levels of precision on the basis of interaction, geospatial display and semantics. In the need of a flexible modular setup, both commercial software like Sketchfab, and Potree that is an exclusively point-cloud renderer are excluded.
2.2. 3D Online Streaming
The concluding selection of the core display system depends upon its ability to manage large files and high-resolution 3D geometries. The large size complicates the web transmission phase and the rendering process. While WebGL provides instant access to graphics processor resources, the way data are transferred from a remote server to the local GPU is a purely programming matter. Loading each 3D model in its entirety implies transferring a file of hundreds of megabytes. This technique is ineffective, especially if the loading has to be completed in order to be able to visualize it. The fact that it is deployed by Unity3D for web publishing degrades its performance and confines its applicability. To address shortcomings and failures, robust 3D visualization systems utilize either multi-layer or multi-resolution data encoding. Other support progressive data transfer or suggest pre-processing compression techniques with good ratios [32]. Alliez and Desbrun introduced in 2001 a type of interactive encoding that enables progressive connectivity with the rendering system [33]. More recently, Gobbetti et al. proposed the parameterization of 3D models to an equivalent format that mimics the multi-resolution logic [34] and Lavoué et al. achieved a satisfying compression ratio of 3D meshes in a relatively short time through the conjunction of iterative simplifications with P3DW data encoding [35]. In 2015, Ponchio and Dellepiane developed a multi-resolution rendering paradigm that combines the progressive streaming of view-dependent representations of the mesh with data online compression/decompression [36]. This algorithm along with simplification, compression and displaying utilities compose a C++ and JavaScript library, Nexus.js and is exploited by the 3DHOP framework and Three.js library. The latter defines as well a Level of Detail (LOD) constructor that switches rendering between less or more detailed versions of the mesh based on the distance from the camera. Alternatively, the POP Buffer is a lightweight hybrid scheme that attains a fast-progressive transmission and basic multi-layer features [37]. This single-rate approach is taken by X3DOM framework that transfers directly to the GPU the stored quantized geometry but underperforms as regards compression rates.
Concerning the prerequisites of a fast start-up time and a reduced network load, the multiresolution format seems to be the optimal solution for the analysis preservation of our high-resolution 3D models. And yet, 3DHOP framework excels in both performance and range of applicability. In comparison with X3DOM that also outstands in the field, 3DHOP has a flexible structure with simpler configuration setup and as mentioned above, better rendering capabilities. As it is tailor-made to detailed Cultural Heritage representations and supports modifications, it meets the standards of the proposed use cases.
3. Methodology
A detailed overview of the methodology followed with the core underlying components of the implementation is described in this section. After clarifying the problem formulation and the difficulties to be resolved in the current work, insights into the technological means are provided, comprising the multiresolution schema of Nexus.js library, the programming tools and the 3D visualization pipeline. The case study is presented with emphasis to data acquisition and processing workflow and finally, the architecture of the platform and its data structure are defined and analyzed.
3.1. Problem Definition
The main problem in managing heterogeneous datasets of the Cultural Heritage lies in their size, especially when remote access and use over the Internet is entailed. Loading time, lossless transmission, network load and hardware limitations are consequent issues that dictate 3D visualization quality, website’s overall performance and eventually, user’s engagement and retention. The amount of 3D and 2D data largely determines their transmission speed to the client browser. This overall time is bound by the network bandwidth, namely, the maximum data rate which is specified by the Internet Service Provider (ISP). Exceeding the bandwidth limit creates congestion points and bottlenecks on the data transmission line. Congestion occurs once the router is running out of available buffer, an overflow which is likely to happen when large amounts of contents are transferred online. Therefore, the huge 3D models size leads to increased latency, packets loss and poor performance and the site ceases to be functional. In order to compensate for the transmission delay and network load, the total amount of the 3D models is often reduced. Depending on the editing software, the compression method and the development platform, the consequences may be loss of geo-referencing as most software impose their own coordinate systems and quality degradation related to geometry and texture. The perceived visual quality is inevitably equated with the visual fidelity of the original models. Its degradation does not justify their high-cost and time-consuming generation processes and is not consistent with their role as geospatial and geometrically accurate data. The end users take the visualized cultural assets at face value as the rendered appearance is not appealing and doesn’t correspond to a detailed and realistic representation. In addition, precise measurement tools cannot be implemented in the context of scientific and professional use.
At the same time, the platform’s development must conform to the practices and the thematic design of an online 3D Cultural Heritage repository in order to fulfill its purposes. Besides the aforementioned visualization efficiency, basic practices encompass interactivity, data interoperability and information systems. Their objectives are user’s familiarization with the cultural resources via easy-to-use interaction components and accessible archiving, multidisciplinary knowledge transfer and obviously digital preservation of its prominent content. Common services comprise manipulation of the 3D scene (move, rotate and zoom) using the trackball, highlighted and clickable points of interest with aside relative information and textual labeling. The freely navigation is appropriate for artifacts, small-scale assets and flat surfaces but rather inadequate for large-scale monuments and complex geometries. Polymorphic and heterogeneous data are usually displayed on independent webpages accordingly to their visualization format or the type of information they educe. In the case of image and text incorporation to the 3D visualization page, they undertake a static role with a specific position outside the border of the 3D viewer. Such platforms are insufficient to spatially relate 3D and 2D information, failing to generate a two-way access and provide an exploratory examination of the data. In terms of programming technique, user interaction requires the design of a coordinated events’ system to avoid glitches and delays in response. The hierarchical model of the interface and the WebGL 3D specifications restrict some content and structure adjustments. Exceeding the canvas element and executing queries asynchronously, imitating multi-threading process without runtime errors would attain high-performance and advanced interaction.
3.2. Technical Pipeline
3.2.1. Multi-Resolution Format
The multi-resolution approach ensures fast data transfer, rendering and loading, compensating for size and complexity. Generally, multi-resolution schemes divide geometry into smaller parts, an effective method for slow network connections as well. Different levels of detail correspond to each geometric part. The transmission is made on demand and the resolution is view-dependent. Only the sections of the model that are absolutely necessary for the composition of each display are loaded and delivered. The advantages of this approach are summarized in fast start-up time, minimized network load and considerably good visual quality. A low-resolution version of the model is readily available some milliseconds after the start-up. The model is gradually refined as new parts are progressively loaded, depending on the distance from the viewpoint and the position and orientation of the camera. Our visualization system exploits the multi-resolution format as an intrinsic component of the Nexus.js library, developed by Visual Computing Lab of CNR-ISTI. Its integrated distribution comprises simplification, compression and streaming utilities as well as an interface for the converted models. It streams directly for online visualization very large 3D models, point clouds and texture maps with per-vertex attributes, a typical characteristic of scanned and image-based photogrammetric data. The data encoding constitutes a pre-processing phase where a sequence of sub-sampled partitions of the object, from coarse to fine, is generated and their corresponding representations of different resolutions are stored in the nxs structure. The multiresolution model can be either compressed, pruned or locally visualized (Figure 1). Compression is slightly lossy with visible results in small 3D models but attains better performance and less server-side memory consumption. Pruning is a sort of optimization as it reduces the size of the files and assists in the appearance of a more detailed version of the object in website initialization. The streaming involves loading, decompressing and sending the data structure to the GPU. The Nexus.js is appended to 3DHOP’s codebase and provides a loader for Three.js library.
3.2.2. Front-End Development
Front-end programming defines the content and the design of the elements’ user interacts with in any browser with network access. The developed visualization platform is intended for real-time information retrieval and interactive functionalities; thus, it is hosted by a dynamic website. The front-end part is made up of the web markup HTML, CSS and principally of the programming language JavaScript. The rest is built upon Apache web server, MongoDB database and the server-side scripting language PHP. Its client-side part though outweighs the back-end. Specific JavaScript scripts control the response of the server to user requests for continuous updating of the dynamic website procedures. However, it cannot be predicted whether the result of running parallel processes will be successful. Apart from the single threaded JavaScript, the large number of files being accessed and processed and the sequential changes made to the DOM jeopardize its feasibility. In order to eliminate the risk, JavaScript’s methods for synchronizing and overlapping dynamic operations are examined, tested and applied. The event methods are essential for the responsiveness of the browser to interactive tasks and the synchronization technique. An event is a user-generated action that triggers a script to run and the encoded JavaScript responses that receive the action are called event handlers. The assignment is made with reference to the desired DOM object, and then a function is assigned to the corresponding event handler property. An open-source library that simplifies event handling and abstracts JavaScript scripting into simple and intuitive syntax is jQuery. The optimized and compressed format profits the delegation of browser events, the handling of the HTML page and the manipulation of the DOM. It is principally used for cross-platform web applications and jointly with AJAX it corrects the potential inconsistencies between browsers. The HTML <canvas> element defines the region of the website where the 3D scene is rendered. It configures its position and dimensions in the HTML website and exploits the scene-graph provided by the 3D rendering APIs like WebGL.
3.2.3. 3D Visualization Tools
The visualization of the heterogeneous data is assigned to the 3DHOP framework and the Three.js graphics library, hence to the graphics rendering processes of the WebGL API. Every single technology is open-source with an active community of contributors, codebase transparency and scalable capabilities. They are all implemented in client-side facilitating the access and interaction between the different configuration levels. JavaScript bridges the gap between the underlying systems’ architecture and their supporting API layers. Therefore, 3D viewers tailored to the high standards of 3D Cultural Heritage archives can be created with the appropriate code adjustments and additions. 3DHOP framework, developed by the Visual Computing Laboratory of ISTI – CNR is devoted to interactive presentations of high-resolution 3D models and points clouds of the field [38]. Its 3D viewer is embeddable to any website without the need for a dedicated server and interoperates efficiently with HTML elements and real-time JavaScript updates. Its mathematical formulas and geometry routines are endorsed by SpiderGL, an open-source JavaScript library [39]. Among the ready-to-use tools and mid-level functionalities it offers, the following establish advanced interactivity and used in the 3D platform:
- Highlighted and clickable geometry that serves as an annotation tool for points of interest
- Extraction of the original coordinates of any selected point on the model’s surface
- Euclidean distance measurement between two selected points
- Cross-section toolset for real-time orthogonal sections through the 3D scene or specific models
The developed platform is a high-level solution that leverages the capabilities of lower-level utilities to achieve the desired degree of customization [40]. The interdependency is scalable according to the level of programming and the expected usability. In particular, it adopts the Nexus’s streaming, rendering and displaying functions that uphold the visualization schema of the 3D models. On scene level, the proposed system partially interferes with the existing settings of 3DHOP and Three.js. It retains the key components of the scene graph, such as the hierarchical structures and the geometry definition and equally modifies some of the appearance properties. In regards to functionality, new programming models of dynamic manipulation of the 3D scene are created based on the build-in features and the native functions of 3DHOP. The degree of 3DHOP’s extension on the scope of interactivity is enhanced by a sophisticated and user-friendly graphical environment. Finally, on integration level, the current solution is independent of its structural components. The incorporation of a complete dataset, the investigation of correlation strategies with the 3D content and the final programming orchestration are autonomous issues, being developed from scratch. As part of the integration, the Three.js library is imported for the generation of multiple viewports on the same page. Besides the creation of advanced computer graphics, it maintains a wide range of loaders for various types of 3D data, including a compatible solution for Nexus.js. The supplementary viewers aim to enhance and clarify the main 3DHOP scene by replacing the ordinary collections of images with collections of individual 3D models. In this way, 3D data of different scale, resolution and level of detail are directly accessed. Figure 2 illustrates the various hierarchical levels of the platform’s components regarding our interference to each codebase. The utilities close to the bottom of the pyramid correspond to low and mid programming levels with zero or little modifications respectively. The 3D platform is the synergistic result of its inferior layers and comprises the visualization interface available to the end users.
3.3. System Architecture
The client-server computing model provides the two-way communication between the user and the website. In the current case the web browser undertakes the role of the client. The data transfer between the server and the client is assigned to the HyperText Transfer Protocol (HTTP), the basic architectural structure of the Internet. HTTP messages are a set of sequential requests and responses. The server used to read the HTTP protocol is the Apache HTTP server, an open-source solution developed by the Apache Software Foundation (ASF). It is installed and maintained on the local disk and aims to serve users’ requests and promote the hosted websites. In this project, the local server is the development and testing environment.
The platform’s HTML, CSS, and JavaScript files, the 3DHOP distribution, the 3D models and the complementary data are stored in the Apache htdocs folder. The distribution of the Three.js library is stored there as well (Figure 3). The configured local network ensures the client/server interference to efficiently simulate the website’s appearance and performance before it is ready for hosting on a remote web server. The IP address of the site is replaced by the localhost address for instant access to the files on the local server. On the Internet level, communication is initiated by the browser so that the server is ready to respond. Initially, the browser loads the web site’s graphical user interface. From the moment of loading and as long as the user is active and interacts with its content, the client constantly sends requests to the server. The server inspects the requests and responds. The returned information is stored by the client. For the proposed system, the website is loaded using the standard client-server communication that was described above. Interaction functions are just simple requests to the server. The browser analyzes and executes the scripts it receives in response to its intrinsic script’s mechanism. Following the same logic, Nexus.js streams the multi-resolution models by sending their various representations with sequential requests to the browser. Through the HTTP protocol the algorithm gains random access to binary files and receives specific data partitions from each file; thus, transferring only the necessary data at a time. The browser successively loads the 3D data by accelerating the server’s hardware through the WebGL API. When the Three.js user interface is called, the scene graph is updated without the requirement to draw the entire 3D scene on each frame. The client does not need to make repeated requests for visualization but just one is enough to respond to Three.js. The response time though is not immediate. An equivalent Nexus loader can compensate for this delay. In addition, asynchronous server calls by AJAX in conjunction with jQuery and the JSON format establish the connection to a MongoDB database’s collection. This part of the client-server system is maintained for a new developed tool and is presented in the Section 5.
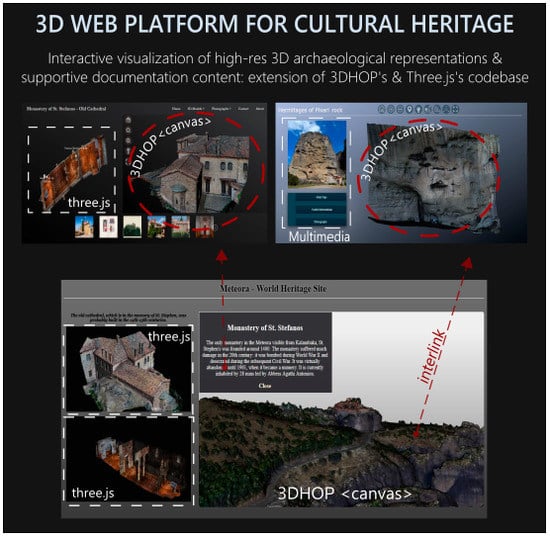
As shown in Figure 3, the platform’s homepage hosts two 3D model viewers, inherited by 3DHOP and Three.js library. In total it comprises three webpages and various image collections. Predefined points of the homepage’s 3D viewer are indicated as interlinks the user can follow to navigate the subpages and digital image collections. The subpages are ancillary 3D repositories for the detailed 3D models and contain a 3DHOP viewer either with multimedia or a second Three.js viewer.
4. Case Study
This section gives initially a brief description of the study area emphasizing on historical and archaeological aspects. Then, the photogrammetric procedures of data acquisition and processing are analyzed and the outcomes of the 3D geometric documentation are presented. Among the integrated Cultural Heritage dataset three case studies are demonstrated and used as inputs on the 3D platform: (a) The archaeological site of Meteora (b) The Pixari pillar with the hermitages of St. Gregory (c) The old catholikon of the monastery of St. Stephen. The second and third case studies have been digitized both as part of the 3D model of the site and independently for high geometric and visual accuracy.
4.1. Study Area
Meteora is located near the town of Kalambaka, at the northwestern part of Thessaly, Greece. It constitutes a special geological phenomenon and hosts one of the most prominent monastic complexes of Orthodox religion in Greece. The giant rocks are molasses sediments that were formed at the end of the Tertiary, 23 million years ago and are mainly composed of sandstone and conglomerate. The original number of monasteries that were built in the 16th century at the top of some pillars was twenty-four but only six are preserved, restored and functioning at the moment. The archaeological site of Meteora was included in the UNESCO World Heritage List in 1988. The proposal, evaluation and selection were under the UNESCO cultural criteria (C 1–5) and the natural environment criterion (N 7). It has been also proposed as a geological heritage monument because of its unique geomorphic and geological features. The Meteora rocks are considered part of the Antichasia mountain range and the whole region is designated as NATURA 2000 protected area. The St. Stephen monastery is connected to female monasticism and one of the first founded. Its old main church (catholikon) is a small, single-naved basilica with narthex with exceptional samples of post-Byzantine frescoes (Figure 4). The frescoes of the Virgin Blachernitissa (Platytera) on the sanctuary of the church and the depictions of holy founders Anthony and Philotheus and the Dormition of the Virgin Mary are the most distinguished. The wall paintings and decorations were performed in two phases. It was built around the 14th century and renovated by the monk Philotheus in the mid-16th century.
The cavernous asceticism that began around the 11th century in Meteora is of particular religious and cultural significance. The early ascetics established small prayer spaces within the natural cavities of the rocks and gradually organized ascetics as symbiotic places of worship, such as the Dupianite skete in the 12th century. On the northeast side of Pixari rock, at a height of 40 m, the cave hermitage of St. Gregory lies, a cluster of three hermitages with characteristic wood-beamed balconies (Figure 5).
The first one is at a height of 25 m, the second one at 35 m and the third at 40 m from the foot of the pillar. The wooden balcony is well preserved as the acute angle that Pixari forms with the ground protects it from rain water and prevents corrosion. In 1972, when monks of the Great Meteoron monastery climbed into these caves they discovered a chapel decorated with relatively well-preserved 14th-century frescoes. The three sides of this small church are built of stone and the fourth one is carved in the rock.
4.2. Data Acquisition-Processing
The geometric documentation of Cultural Heritage sites of great extent and morphological peculiarities requires special planning for 3D representations of high fidelity and resolution. Besides visual quality, a geometrically accurate topology is vital for the acquisition of precise metric information. A second priority is the deployment of low-cost, fast and automated techniques for data acquisition and processing. For mapping and 3D modeling large and inaccessible areas with the aforementioned requirements and specifications the method of Aerial Photogrammetric Survey was exploited. The area to be surveyed comprised 10 km2 of significant variations in altitude, dense vegetation and a 6 km2 archaeological site with a big number of landmarks. Therefore, it was captured by manned aircraft system and a definitive number of ground control points (GCPs) was used to ensure accuracy in spite of the topological variations. Almost 2500 both vertical and oblique images were acquired over the site. The Structure from Motion (SfM) and MultiView Stereo (MVS) techniques were used for images alignment and formation of the sparse point cloud and dense point cloud in the Agisoft Metashape software. The editing, optimization and refinement of the dense point cloud and the generation of the high-resolution 3D mesh were undertaken by the Geomagic Wrap 3D scanning software. The surface color information was applied by the initial images. Considering the need of 3D models of different level of detail and scales but equally, high accuracy and photo realism, the Pixari rock and the old catholicon of the Monastery of St. Stephen were also documented. Two more methods were integrated at the data acquisition phase; close-range and unmanned aerial photogrammetry. The data processing until the generation of the photo-textured 3D models employed the same pipeline. In addition to the 3D products, site plans, ortho-photos and ortho-photo maps were generated.
4.3. Input Data and Basic Configuration
Based on the scale and level of detail, the 3D model “Meteora” constitutes the core of the visualization and the development of new tools and functionalities. The integration of the rest documentation outputs forms a coherent Cultural Heritage archive on the basis of the spatial interconnections that derive from it. In addition to “Meteora”, the platform is enriched with the following assets:
3D models: Part of Pixari rock and separately the interior and exterior of the old catholicon of St. Stephen’s Monastery
Images: Ortho-photos, engravings and historical photographic evidence and photographic documentation of monuments’ exterior and interior
Text: Information, explanations and brief descriptions
The 3D models’ properties and characteristics can be observed in Table 1.
The 3D data are subject to a pre-processing phase in order to be initiated into the visualization pipeline. They are converted to the Nexus multiresolution format prior to their progressive streaming and adaptive rendering to the 3D platform. The Nexus library supports both ply and obj file formats with per-vertex color and texture mapping respectively. In the case of Pixari, a preparation is needed in order to be compatible with conversion’s prerequisites. The accompanied texture image should be per-wedge since the algorithm re-calculates the vertex normal during processing. After conversion, the 3D models are pruned rather than be compressed for lossless size reduction and eventually, attain the eligible encoding for online visualization. The 3D models of Meteora, Pixari and the exterior of St. Stephen’s catholikon are presented in the 3DHOP framework’s environment in the main page and the subpages of the 3D platform accordingly. The data entry and scene declaration happen in three independent HTML files using the basic 3DHOP’s interface. The default graphical user interface of the visualization, including the toolbar and the 3D canvas can be observed in Figure 6a–c. The basic 3D viewer is formatted from a CSS file based on the responsive design. Among other, it determines the position and appearance style of its elements including the toolbar with its individual fields. The 3D model of the interior of St. Stephen’s catholikon is added and loaded as custom Nexus geometry to the Three.js framework in another HTML file (Figure 6).
5. Web Platform
5.1. Data Structure and Graphics User Interface
Prior to the 3D platform’s design, it is necessary to gather and organize its content logically. The old catholikon of the Monastery of St. Stephen and the Pixari rock with the skete of Osios Gregorios are located in the 3D model of the archaeological site of Meteora. The opportunity to represent this spatial relationship in a practical context is offered by coinciding a cartographic and knowledge base in the 3D environment of the platform. The 3D model of Meteora serves the function of being the core of the visualization schema from which the rest data derive as logical and spatial entities. Therefore, the model of Meteora is integrated to the homepage, Pixari in the first subpage and the interior with the exterior of St. Stephen catholikon is the other subpage.
The user is redirected to the supplementary repositories through links on the 3D scene of the homepage. These internal links are assigned on the position of the relative case studies on the generic model of Meteora and are available after specific tools’ activation. Textual information and image collections are available to every page through navigation bars, menus, buttons and semantic links. Design’s aim is a user-friendly and sophisticated graphical interface with a simple and consistent data structure. A sense of predictability is intended so as the user can estimate the position of every element of the website and its functionality. This objective is met when the layout is operational. It is of common perspective and styling for the whole repository. Every page contains the title and a top margin, the side panel, a bottom margin and a main 3D scene. Image and 3D models collections, buttons, menus, text and figures are placed out of the canvas, which defines the 3D space. The only exception is the toolbar’s position within the canvas for direct correlation and ease of use. A elements’ hierarchy is maintained and priority is given to the 3D visualization. Such a 3D repository design facilitates both novice users and domain experts with its simple data inquiring through 3D models.
The homepage of the 3D platform is shown in Figure 7. Its sidebar consists of a drop-down menu with general information, a collection of orthophoto maps that cover the entire area and three buttons with different interactive roles. The first provides access to supplementary galleries of historic images and vintage illustrations, the second activates a new tool; the interactive data retrieval from the 3D scene and the third a guided webpage tour. The toolbar is composed by the interaction functionalities of the 3D space and each icon’s styling corresponds to the role it performs.
On the homepage all the tools are pre-built and ready-to-use by 3DHOP except for two new added utilities: the automatic navigation and the activation of text labels. The webpage with the documentation of the Pixari rock and its hermitages is structured as shown in Figure 8. An image field and an intrusive menu with four categories comprise the sidebar. In particular, the dropdown navigation bar provides access to textual information on historic, religious and cultural aspects of the hermitages and collections of the photographic documentation of the landmark. The last assets are displayed in the image field which dynamically changes its content according to user’s choices. The complete archiving of the old catholikon of the monastery of St. Stephen is presented in the third webpage of the platform (Figure 9). The exterior model of the old catholikon is displayed on a 3DHOP’s viewer while its interior is visualized by Three.js. The pattern that defines the page’s data structure is slightly different. With the incorporation of the second viewer, dual importance is conveyed to 3D space and the 3D models have a stronger visual force. The rest of the content is organized into two semantic elements: a top navigation bar and a horizontal image slider at the bottom.
5.2. Dynamic Multimedia Incorporation
A 3D repository of the cultural heritage field cannot be regarded as a qualified and constructive solution unless it integrates multimedia. Image and text clarify, enhance and enrich the visualized 3D content. Especially if a comprehensive presentation of the products of a geometric documentation is intended, the heterogeneous dataset should be exposed in its entirety. The platform incorporates image collections and textual information the user has direct access while browsing it. Many of the current digital archives of the field share this practice. This multimedia display is esthetically pleasing and useful but does not correspond to the spatial dimension of the visualized data. The approach applied to Pixari’s 3D model in the platform’s subpage attempts to tackle this deficiency. It is proposed that the aggregate data’s presentation is on the basis of their relative topology and emerge from a dynamic scheme. The functionality aims to showcase the hermitage of Saint Gregory and the inner chapel located in one of the caves.
At first, a multi-level menu with slider effects is created in the side panel of the subpage. Creating such a navigation bar by declaring each category and subcategory via the table element of HTML and using the scroll and click effects with either CSS or jQuery is relatively simple. A more pertinent strategy is the association of the information provided by the menu sections to the relevant 3D spot of the scene. The plan leverages a native functionality from the 3DHOP’s scene setup; the hotspot. Small spherical geometries are placed on the natural cavities of the hermitage and declared as spots in the field of scene objects. When the hotspot tool is enabled, the spheres are highlighted and inherit the clickable attribute. Their selection invokes a set of dynamic events: smooth animation that brings the view to the hotspot and toggling of the side menu’s sections (Figure 10).
The menu’s content, which provided general facts prior to the tool’s activation, is adapted to the corresponding information for the featured landmark. Historical and cultural information, ortho-photos and other photographic evidence configure and enrich each one of its customized versions. The text is displayed in dialog popup windows while images either in a slider on the side panel of the webpage or in their full size though redirection to the digital image galleries of the platform. The dynamically modification of the navigation bar by assigning specific content to each hotspot is based on JavaScript conditions and jQuery events. Each hotspot is declared as a case of the switch statement and each case encloses the code with the actions enabled if this hotspot is clicked. The menu index is updated via jQuery selectors and the click, toggle and toggleClass events. As more and more click event handlers are added, it is necessary to unregister previous handlers by the .off(click) statement.
5.3. Development of New Tools
The fact that in the archaeological site of Meteora the unique natural landscape is intertwined with one of the most important Orthodox religious monuments accounts for its choice as a case study for the 3D platform. The developed tools correspond to an insightful interpretation of the historical, physical and cultural aspects of the site. The spatial distribution of historical and archaeological sights within its borders requires specific mechanisms in order to be perceived and valued. The aim of both academic and public engagement predisposes to increased difficulty regarding the diffusion of the diversified information. Two new types of 3D scene navigation and annotation utilities are developed for exploratory investigation of the archaeological site and parse of the documentation data: the first involves a narrative tour through a predefined route and the second an interactive data retrieval directly from the 3D scene. The textual and graphic label assignment enhances the cartographic interpretation and serves the function of embellishing. The additions and extensions made are applicable to any specific-domain heterogeneous dataset with a spatial reference.
5.3.1. Automatic Navigation
A completely free navigation to the 3D space with the trackball is likely to disorient or confuse the user but it definitely does not convey any kind of information. An opportunity to explore all the points of interest of a Cultural Heritage site in short time with descriptive captions is presented by the tool of automatic navigation. The mechanism that simulates immersive virtual tours is applied to the 3D models of Meteora and Pixari of the homepage and subpage respectively. Every tour is assembled by sequential seamless animations of the scene that either magnify a certain focus point or provide a wider view. The camera frames the areas of interest above eye-level and from high angle conveying an omniscient perspective and surmounting the problem of non-visible. Close-ups and tilted camera angles help maneuver through the very rugged nature and change dynamically the center of attention. At the same time, brief information is automatically generated and synchronized with the relevant frame (Figure 11). Therefore, the tool offers a narrative navigation, highlighting the name and historical aspects of the landmark or toponym displayed each time. The tour through the 3D model of Meteora invokes a transition from the town of Kalampaka and the six functioning monasteries to the sketes and the remains of old churches and chapels.
The tour on Pixari initiates from ground level at eye’s sight and is gradually elevated with smooth rotations and movements of the 3D scene. This mechanism is performed either within the container of the scene in normal display or in full screen. The user has the potential to pause or stop it at any time. The movement of the camera to the predefined positions subsequently is triggered by setTimeout, a JavaScript time function. A vector with the six parameters of the trackball state represents the current position and is declared as a function variable of a native method of 3DHOP for animations. Thus, an array with all desired frames is created and parsed by conditional statements. The setTimeout method executes the anonymous function sequentially at each location and with a specific time step (Figure 12). The syntax of the subtitles’ synchronization exploits a conditional statement and setInterval, another JavaScript time function as well. The sequence of the various descriptions is executed at specific intervals until the end of the tour. Whenever the function of the automatic navigation is called the current index is updated according to the time elapsed between two transitions. The visibility and duration of each description are toggled by the fadeto jQuery event.
5.3.2. Interactive Data Retrieval from the 3D Scene
The coherence of every single dataset of the Cultural Heritage field, varying from archaeological recordings to diagnosis or restoration projects depends on its spatial dimension. The individual data, regardless context, type and format, are associated with specific locations in the physical space of the study area. This apparent connection can convey an accessible role to the users of the 3D platform. A strategy to retrieve the whole documentation data of the repository from their corresponding position on the 3D scene is employed. The idea transforms the conventional text annotations to dynamic feature-linked labels that emerge from the interactive exploration of the 3D space. The tool is developed on a cartographic base, represented by the 3D model of Meteora of the homepage. It enhances the visualization schema with additional 3D viewports and establishes the access to the subpages through interlinks. Once enabled, with a smooth animation the camera frames a section of the 3D scene from high angle. From this viewpoint a wider area can be observed and the mechanism of interactive data retrieval initiates. Instead of highlighting or placing labels, it is proposed a more creative and interactive approach for prominent and distinct from their surroundings points of interest. The indication is provided during moving the cursor on top of the scene. The position where the cursor changes into a hand pointer identifies a landmark whose documentation data can be accessed. This actually means that there are no constrains on the manipulation of the scene with the mouse.
The user can freely explore it, examine the cursor’s behavior and select the landmarks that elicit his/her attention. Once clicked, relative contextual information appears to a dialog box on top of the canvas. The brief description contains links that redirect to the subpages and the photographic collections of the 3D platform. The static and passive knowledge divulgation evolves to an interactive experience and the spatial relationship among the particles of the platform turns into logical. Prior to browsing, a preview of the redirected page is shown so as the users anticipate and inspect its content before the navigation. At the same time, a customized photographic collection, which can be also displayed on an independent full-size viewer, is presented on the side panel. Replacing the image collection by a collection of smaller-scale and more detailed 3D models of the dataset maximizes the platform’s potential. The user can interact with the 3D assets within the new viewports or on their subpage’s viewer with further functionalities (Figure 13). Such a scalable visualization communicates the documentation outputs that emerge from multiple data acquisition techniques, time periods or disciplines to the simple user. The experts can compare and extract the topological, directional and metric relations among multi-resolution models. The exploratory analysis of the 3D scene and its supportive dataset is implemented on top of Meteora model and the points of interest are the six functioning Monasteries, the rock of Pixari and the town of Kalampaka and Kastraki. Their characteristic position, roof’s color and assembly make them readily apparent and no highlighted geometry or label is needed for interactivity. Under other conditions, a proper indication is needed for users’ usability.
The syntax of the new attribute is based on an anonymous JavaScript function and jQuery events applied to a HTML element of transparent geometry. The screen coordinates are related to the projected spatial coordinates of the georeferenced 3D model and the desired positions are stored in an array. An anonymous JavaScript function is executed at runtime along with the hover event. It tracks the cursor position, parse the array and decide when the modal pop-ups have to be displayed. Three.js library set up the ancillary visualization of the collection of 3D models. HTML elements with specific dimensions are defined as containers for the rendering and customization of the Three.js viewer. The 3D models are multi-resolution and their loading is managed by Nexus.
5.3.3. Labeling System
The most common but efficient way to identify features of the 3D scene is labeling systems. Text strings or 2D graphical labels are placed on the surface of the 3D model for interpretation and clarification purposes. The scope and applicability area of this conventional technique is expanded by a more flexible and interactive schema with the following characteristics:
Clickable property: The user can select the labels in order to interact with the objects of other 3D viewers and the content of the page.
Back-end support: Text descriptions, geographic coordinates and other attributes associated with each label are stored in a database.
It is implemented in the 3D model of the interior of the old catholikon of St. Stephen monastery in the context of the Three.js visualization pipeline. Parts of the Orthodox Church architecture, frescoes and other decorative details are delineated and described. Simple spheres or planes are placed on the desired positions and a piece of text identifies each semantic region. The tags appear in such a way that they are always on the field of view of the camera. As the user manipulates the scene by zooming, pan or rotating, the text and graphics attached on it adjust to the real-time transformations. Equivalent user’s modifications of the 3D view adjust the visibility of the church’s framing. The walls, the ceiling and the floor are becoming invisible once they face the camera preventing the obscuring of critical interior parts. The clickable property enables two dynamic actions in the subpage: animations of the 3DHOP’s scene and content update of the subpage. When user selects a sphere, the camera of the exterior 3D model frames the equivalent position with a smooth transition and a customized image gallery is shown (Figure 14). The index of the labels can be dynamically toggled as well with the geospatial coordinates of the center of the sphere.
The text label assignment is not a simple programming task when it is independent of pre-built components and interferes with the 3D space. The HTML canvas element that hosts the 3DHOP’s viewer, cannot display at runtime both 2D and 3D context. This shortage can be handled by Three.js library. It’s ray casting method determines the clickable geometry by projecting a ray from the mouse position on the screen to the 3D scene. An anonymous function detects the sphere that the ray intersects within an accepted distance threshold and returns the point of collision. The label is created at this position based on the procedural text geometry of Three.js. The interaction with 3DHOP and HTML document is controlled by the JavaScript switch statement. Each clickable sphere is a case that invokes specific statements involving a native animation function of 3DHOP and jQuery events. As regards to the back-end configuration, the text strings and the coordinates are retrieved and accessed by the query operations of MongoDB, a NoSQL database. AJAX requests are sent to the server, get the aggregated data as JSON format then parse it and give input to the user interface. The connection between AJAX and database is handled by a server-side scripting language, PHP.
6. Evaluation
The web-based visualization of large and high-resolution 3D models requires a robust bandwidth, high hardware performance and fast data transmission in order to be optimized. The network speed of 12 Mbp/sec that ISPs typically provide is adequate for streaming 3D content without the risk of congestion. With WebGL API, GPU resources are directly accessed while transferring and rendering the 3D data. Therefore, the latency’s factor outweighs the other two regarding the 3D platform’s performance. The loading time gets even more important in the case of non-specialized users that are not disposed towards slow loading times, poor frame rates and delays in the visualization. Such a website is quickly abandoned and characterized as a bad user experience. The performance analysis is a crucial insight for the effectiveness of the developed tools and data structure and their impact to the 3D platform’s general responsiveness. Browser developer tools are used and all testing is done locally, with client and server running on the same network infrastructure. The test is executed on a conventional laptop with an Intel Dual Core i5-7200, CPU at 2.50 GHz, 8 GB of RAM and AMD Radeon ™ 520 Graphics (2 GB DDR3 exclusively), in Windows 10. Bandwidth throttling is used to simulate network download speed of 10 Mbit / s and the upload rate up to 0.7 Mbit/s. The throttling takes into account possible low bandwidths and latencies due to external network interference. The test results are executed by the DevTools in the latest version of three browsers (Google Chrome, Mozilla Firefox, and Microsoft Edge) and are presented in Table 2.
In less than five seconds the homepage of the platform that comprises the largest amount of data needed from the default point of view are fully loaded. An equivalent excellent performance attains the subpages. The ideal website load time ranges from two to five seconds and a further delay in loading process impacts user engagement and the overall usability. The current speed marginally affects the performance but its optimization is a prerequisite in case of updating platform’s content with more data or several paradigms. Further analysis is needed to investigate which resources consume the most network load and to what extent they affect the overall loading speed of the 3D platform. Besides the XHR requests and responses, the multimedia assets likely consume lots of bandwidth and start-up time may be affected by code syntax and structure. The Network Monitor of Develop Tools includes a performance analysis tool in order to determine how long the browser takes to download these different parts of the website. The tool loads each page with an empty cache simulating the first time a user visits it. The metrics for the cached content are summarized in Figure 15. The resources are grouped by type and chart (a) illustrates the loading time and chart (b) the relative size of each type.
The time taken in delivering the requested data, namely the xhr type, has the largest impact on platform’s responsiveness. The multi-resolution format and its rendering technique account considerably for this delay. Each request transfers a sufficient amount of each model’s partitions for the composition of the final 3D model. The streaming of the different versions of the 3D models at variable resolution is carried out by consecutive requests and browser-side responses. Instead of delivering a single chunk on the order of hundreds of megabytes, the view-dependent visualization leads to balanced compression and decompression rates and progressive loading. The efficacy of this mechanism to the overall performance is demonstrated in the considerable small size of xhr resources, as can be observed in the second chart of Figure 15.
The images consume the largest portion of the average platform’s pay-load on the web which is unsurprising considering their quality level and initial size. JavaScript scripts constitute also expensive resources as they require downloading, parsing and compiling prior to their execution. An optimization strategy for the website responsiveness and usability involves the following modifications:
Compressing the multi-resolution models following their creation on the post-processing phase for faster streaming and adaptive rendering. The Nexus library comprises an efficient compression and decompression method as well as a dedicated Three.js loader. The good compression rates, the reduction of original files’ size and the relative high decompression speed attain better performance.
Optimizing the front-end architecture, moving inline scripts and styling into external files, jQuery reformats syntax or replaces the long lines of code with shorter versions. Curtailing the inline scripts and using AJAX methods for manipulation the page content improve the overall page loading.
Minifying and compressing images before adding them and determining their dimensions so as not to reflow the content while loading. Single image caching can assist decrease pare latency while loading. Delivering the files responsively also improves performance for the smaller screens of tablets and smartphones.
Finally, a demonstration of the visualization efficiency of the multi-resolution method is conducted in a section of the 3D model of Meteora. The parameters of this specific frame of the scene are stored in a vector and set as the default view. With time step of 0.5 s from the homepage’s startup the stages of the visualization refinement are recorded (Figure 16). At initial loading (0.5 s), a low-resolution and “rough” version of the 3D model is already visible in the homepage. The speed of rendering and loading is remarkable as at two seconds after homepage launch the high-resolution model is well defined. The stages of the progressive refinement can be observed in Figure 15. The low analysis corresponds to the less detailed and smaller data chunks of the multi-resolution schema and the visualization is improved on-the-fly.
7. Conclusions
The developed platform aims to a centralized and sophisticated visualization of diverse heritage data emphasizing on user interaction and knowledge dissemination. Therefore, the capabilities of the 3DHOP platform are extended with new interactive features and manipulation mechanisms of the 3D scene. The introduction of two new types of tools, the automatic navigation and the scene-based search and retrieval, provides critical oversight of the 3D space and the spatial interconnection of the information that clarifies it. The textual and graphical labels depict an additional information layer that enables characterization and instant identification in the context of the plenteous cultural and historical assets. Finally, the incorporation of the Three.js viewer proves that two visualization systems of different specifications, technical backgrounds and capabilities can be synthesized into a cohesive solution. The successful implementation of these features rests upon the effectiveness of the designed programming system and its ability to respond to parallel and dynamic actions. The JavaScript programming language endorses web development with high-tech features and is recommended to be used to dynamically manipulate the content of digital Cultural Heritage repositories. The evaluation of the platform is held by a performance analysis by measuring the loading time of each page and examining the network load of its resources.
The intrinsic openness of the platform is appealing to simple users and profits the scientific community by identifying, retrieving and re-using the cultural resources. The cognitive and navigational tools facilitate the deeper and broader comprehension of the physical, historical and archaeological aspects of the presented objects by the non-domain experts. Similarly, it fosters collaboration on information sharing and synergies across a wider range of disciplines, including engineering, natural science, education, media and economics. It efficiently addresses emerging issues of the Cultural Heritage field, such as risk characterization, disaster management and landscape dynamics by anthropogenic and physical factors. Structural analysis can be performed to 3D structures, BIMs and CAD models regardless of geometric complexity, loading conditions or material type. Seismic vulnerability, structural behavior, damage phenomena and other pathological changes can be precisely represented and measured on multi-LOD or time-series datasets. Their perception and interpretation is amplified by the use of the platform’s interactive and metric tools in virtue of their spatial consistency. Alternatively, view-based indexing and real-time segmentation are supported utilities for identification, monitoring and diagnosis of all 3D modeling formats. Its programming and styling principles could lie at the core of web virtual and augmented reality or supply other online repositories with predefined functions and design mechanisms. The following suggestions are made regarding further extensions and optimization plans of the presented work:
Linking a relational database would provide semantically enhanced access to the existing digital resources. The back-end scheme that was partially implemented for the labeling system showcases the viability and practically of server-side configuration for visualization enrichment. Pre-processing geometric classification, annotations and management of the manifold content on a conceptual framework are incomplete at this development stage.
The responsiveness of the developed tools on low-end and mid-range mobile devices could be examined to ensure that access and applicability are not restricted. Transitioning from React.js to React Native development is a proposed approach that could wrap Three.js functionalities and the associated data in a cross-platform application.
The dynamic multimedia integration, its correlation strategies with the 3D scene and the navigation mechanisms could formulate mid-level solutions and define a higher programming level. Therefore, the platform would undertake the role of a web service or framework. With simple and automated procedures, they could be exploited by any user, regardless of programming skills as native utility functions for effortless customization.
Investigating the compatibility and performance of ancillary data encodings and development platforms is recommended for the optimum visualization schema to attain immersive user’s experience. It is suggested to experiment with the multi-resolution format and progressive or compression techniques and test the combination use of interfaces and libraries of both imperative and declarative programming.
Author Contributions
Conceptualization, A.-M.B. and S.S.; Data curation, C.I. and S.S.; Funding acquisition, C.I. and S.S.; Methodology, A.-M.B.; Project administration, C.I. and S.S.; Resources, C.I. and S.S.; Software, A.-M.B.; Supervision, C.I.; Visualization, A.-M.B.; Writing–original draft, A.-M.B. and S.S.; Writing–review & editing, A.-M.B. and C.I.
Funding
This research has been co-financed by the European Union and Greek national funds through the Operational Program Competiveness, Entrepreneurship and Innovation, under the call RESEARCH–CREATE–INNOVATE (project code: Τ1ΕΔΚ-02859).
Acknowledgments
The authors acknowledge the society for the preservation and promotion of the Meteora Heritage “Meteoron Lithopolis” for multimedia provision and free access to useful information.
Conflicts of Interest
The authors declare no conflict of interest.
References
- Dall’Asta, A.; Leoni, G.; Meschini, A.; Petrucci, E.; Zona, A. Integrated approach for seismic vulnerability analysis of historic massive defensive structures. J. Cult. Herit. 2019, 35, 86–98. [Google Scholar] [CrossRef]
- Fortunato, G.; Funari, M.F.; Lonetti, P. Survey and seismic vulnerability assessment of the baptistery of san giovanni in tumba (Italy). J. Cult. Herit. 2017, 26, 64–78. [Google Scholar] [CrossRef]
- Moraitou, E.; Aliprantis, J.; Christodoulou, Y.; Teneketzis, A.; Caridakis, G. Semantic Bridging of Cultural Heritage Disciplines and Tasks. Heritage 2019, 2, 611–630. [Google Scholar] [CrossRef] [Green Version]
- Freire, N.; Voorburg, R.; Cornelissen, R.; de Valk, S.; Meijers, E.; Isaac, A. Aggregation of Linked Data in the Cultural Heritage Domain: A Case Study in the Europeana Network. Information 2019, 10, 252. [Google Scholar] [CrossRef]
- M’Darhri, A.A.; Baillet, V.; Bourineau, B.; Calantropio, A.; Carpentiero, G.; Chayani, M. Share-Publish-Store-Preserve. Methodologies, Tools and Challenges for 3D Use in Social Sciences and Humanities; PARTHENOS: Marseille, France, 2019; p. 94. [Google Scholar]
- Jensen, P. Semantically Enhanced 3D: A Web-Based Platform for Spatial Integration of Excavation Documentation at Alken Enge, Denmark. J. Field Archaeol. 2018, 43, S31–S44. [Google Scholar] [CrossRef]
- Carraro, F.; Marinello, A.; Morabito, D.; Bonetto, J. New Perspectives on the Sanctuary of Aesculapius in Nora (Sardinia): From Photogrammetry to Visualizing and Querying Tools. Open Archaeol. 2019, 5, 263–273. [Google Scholar] [CrossRef]
- Reddy, M.; Leclerc, Y.; Iverson, L.; Bletter, N. TerraVision II: Visualizing Massive Terrain Databases in VRML. IEEE Comput. Graph. Appl. 1999, 19, 30–38. [Google Scholar] [CrossRef]
- Three.js. Available online: https://threejs.org/ (accessed on 17 October 2019).
- Babylon.js. Available online: https://www.babylonjs.com/ (accessed on 17 October 2019).
- SceneJS. Available online: http://scenejs.org/ (accessed on 17 October 2019).
- Schütz, M. Potree: Rendering Large Point Clouds in Web Browsers. Diploma Thesis, Vienna University of Technology, Vienna, Austria, 2016; p. 92. [Google Scholar]
- Potenziani, M.; Callieri, M.; Dellepiane, M.; Corsini, M.; Ponchio, F.; Scopigno, R. 3DHOP: 3D Heritage Online Presenter. Comput. Graph. 2015, 52, 129–141. [Google Scholar] [CrossRef]
- Behr, J.; Eschler, P.; Jung, Y.; Zöllner, M. X3DOM: A DOM-Based HTML5/X3D Integration Model. In Proceedings of the 14th International Conference on 3D Web Technology—Web3D ’09, Darmstadt, Germany, 16–17 June 2009; ACM Press: Darmstadt, Germany, 2009; p. 127. [Google Scholar] [CrossRef]
- Potenziani, M.; Callieri, M.; Dellepiane, M.; Scopigno, R. Publishing and Consuming 3D Content on the Web: A Survey. FNT Comput. Graph. Vis. 2018, 10, 244–333. [Google Scholar] [CrossRef]
- Mwalongo, F.; Krone, M.; Reina, G.; Ertl, T. State-of-the-art report in web-based visualization. Comput. Graph. Forum 2016, 35, 553–575. [Google Scholar] [CrossRef]
- Evans, A.; Romeo, M.; Bahrehmand, A.; Agenjo, J.; Blat, J. 3D Graphics on the Web: A Survey. Comput. Graph. 2014, 41, 43–61. [Google Scholar] [CrossRef]
- Scopigno, R.; Callieri, M.; Dellepiane, M.; Ponchio, F.; Potenziani, M. Delivering and Using 3D Models on the Web: Are We Ready? Virtual Archaeol. Rev. 2017, 8, 1–9. [Google Scholar] [CrossRef]
- Barrettara, M. New Methods for Sharing and Exhibiting 3D Archaeology. Posthole 2013, 31, 8–13. [Google Scholar]
- Statham, N. Scientific Rigour of Online Platforms for 3D Visualization of Heritage. Virtual Archaeol. Rev. 2019, 10, 1–16. [Google Scholar] [CrossRef]
- Rodríguez-Gonzálvez, P.; Guerra Campo, Á.; Muñoz-Nieto, Á.; Sánchez-Aparicio, L.; González-Aguilera, D. Diachronic Reconstruction and Visualization of Lost Cultural Heritage Sites. ISPRS Int. J. Geo-Inf. 2019, 8, 61. [Google Scholar] [CrossRef]
- Abate, D.; Avgousti, A.; Faka, M.; Hermon, S.; Bakirtzis, N.; Christofi, P. An online 3d database system for endangered architectural and archaeological heritage in the south-eastern mediterranean. Int. Arch. Photogramm. Remote Sens. Spat. Inf. Sci. 2017, XLII-2/W3, 1–8. [Google Scholar] [CrossRef]
- Galeazzi, F.; Callieri, M.; Dellepiane, M.; Charno, M.; Richards, J.; Scopigno, R. Web-Based Visualization for 3D Data in Archaeology: The ADS 3D Viewer. J. Archaeol. Sci. Rep. 2016, 9, 1–11. [Google Scholar] [CrossRef]
- Lucci Baldassari, G.; Demetrescu, E.; Pescarin, S.; Eriksson, J.; Graf, H. Behind Livia’s Villa: A Case Study for the Devolution of Large Scale Interactive “in-Site” to “on-Line” Application. In Design, User Experience, and Usability. Web, Mobile, and Product Design; Marcus, A., Hutchison, D., Kanade, T., Kittler, J., Kleinberg, J.M., Mattern, F., Mitchell, J.C., Naor, M., Nierstrasz, O., Pandu Rangan, C., et al., Eds.; Springer: Berlin/Heidelberg, Germany, 2013; Volume 8015, pp. 238–247. [Google Scholar] [CrossRef]
- Krämer, M.; Gutbell, R. A Case Study on 3D Geospatial Applications in the Web Using State-of-the-Art WebGL Frameworks. In Proceedings of the 20th International Conference on 3D Web Technology—Web3D ’15, Heraklion, Crete, Greece, 18–21 June 2015; ACM Press: New York, NY, USA, 2015; pp. 189–197. [Google Scholar] [CrossRef]
- Hristov, P.I.; Petkov, E.G. Approach for mesh optimization and 3d web visualization. East. Acad. J. 2018, 3, 46–52. [Google Scholar]
- Callieri, M.; Leoni, C.; Dellepiane, M.; Scopigno, R. Artworks Narrating a Story: A Modular Framework for the Integrated Presentation of Three-Dimensional and Textual Contents. In Proceedings of the 18th International Conference on 3D Web Technology—Web3D ’13, San Sebastian, Spain, 20–22 June 2013; ACM Press: New York, NY, USA, 2013; p. 167. [Google Scholar] [CrossRef]
- Mi, X.; Pollock, B.M. Metadata Schema to Facilitate Linked Data for 3D Digital Models of Cultural Heritage Collections: A University of South Florida Libraries Case Study. Cat. Classif. Q. 2018, 56, 273–286. [Google Scholar] [CrossRef]
- Lloyd, J. Contextualizing 3D Cultural Heritage. In Digital Heritage. Progress in Cultural Heritage: Documentation, Preservation, and Protection; Ioannides, M., Fink, E., Moropoulou, A., Hagedorn-Saupe, M., Fresa, A., Liestøl, G., Rajcic, V., Grussenmeyer, P., Eds.; Springer International Publishing: Cham, Switzerland, 2016; Volume 10058, pp. 859–868. [Google Scholar] [CrossRef]
- Ubik, S.; Kubišta, J. Scalable Real-Time Sharing of 3D Model Visualizations for Group Collaboration. In Cooperative Design, Visualization, and Engineering; Luo, Y., Ed.; Springer International Publishing: Cham, Switzerland, 2017; Volume 10451, pp. 244–251. [Google Scholar] [CrossRef]
- Bezzi, L.; Bezzi, A.; Boscaro, C.; Feistmantl, K.; Gietl, R.; Naponiello, G.; Ottati, F.; de Guzman, M. Commercial Archaeology and 3D Web Technologies. J. Field Archaeol. 2018, 43, S45–S59. [Google Scholar] [CrossRef] [Green Version]
- Siddeq, M.M.; Rodrigues, M.A. Novel 3D Compression Methods for Geometry, Connectivity and Texture. 3D Res. 2016, 7, 13. [Google Scholar] [CrossRef]
- Alliez, P.; Desbrun, M. Progressive Compression for Lossless Transmission of Triangle Meshes. In Proceedings of the 28th Annual Conference on Computer Graphics and Interactive Techniques—SIGGRAPH ’01, Los Angeles, CA, USA, 12–17 August 2001; ACM Press: New York, NY, USA, 2001; pp. 195–202. [Google Scholar] [CrossRef]
- Gobbetti, E.; Marton, F.; Rodriguez, M.B.; Ganovelli, F.; Di Benedetto, M. Adaptive Quad Patches: An Adaptive Regular Structure for Web Distribution and Adaptive Rendering of 3D Models. In Proceedings of the 17th International Conference on 3D Web Technology—Web3D ’12, Los Angeles, CA, USA, 4–5 August 2012; ACM Press: New York, NY, USA, 2012; p. 9. [Google Scholar] [CrossRef]
- Lavoué, G.; Chevalier, L.; Dupont, F. Streaming Compressed 3D Data on the Web Using JavaScript and WebGL. In Proceedings of the 18th International Conference on 3D Web Technology—Web3D ’13, San Sebastian, Spain, 20–22 June 2013; ACM Press: New York, NY, USA, 2013; p. 19. [Google Scholar] [CrossRef]
- Ponchio, F.; Dellepiane, M. Fast Decompression for Web-Based View-Dependent 3D Rendering. In Proceedings of the 20th International Conference on 3D Web Technology—Web3D ’15, Heraklion, Crete, Greece, 18–21 June 2015; ACM Press: New York, NY, USA, 2015; pp. 199–207. [Google Scholar] [CrossRef]
- Limper, M.; Jung, Y.; Behr, J.; Alexa, M. The POP Buffer: Rapid Progressive Clustering by Geometry Quantization. Comput. Graph. Forum 2013, 32, 197–206. [Google Scholar] [CrossRef] [Green Version]
- Potenziani, M.; Callieri, M.; Scopigno, R. Developing and Maintaining a Web 3D Viewer for the CH Community: An Evaluation of the 3DHOP Framework. In Proceedings of the Eurographics Workshop on Graphics and Cultural Heritage, Vienna, Austria, 12–15 November 2018; pp. 169–178. [Google Scholar] [CrossRef]
- Di Benedetto, M.; Corsini, M.; Scopigno, R. Spidergl: A Graphics Library for 3d Web Applications. Int. Arch. Photogramm. Remote Sens. Spat. Inf. Sci. 2012, XXXVIII-5/W16, 467–474. [Google Scholar] [CrossRef]
- Boutsi, A.-M.; Ioannidis, C.; Soile, S. INTERACTIVE ONLINE VISUALIZATION OF COMPLEX 3D GEOMETRIES. ISPRS Int. Arch. Photogramm. Remote Sens. Spat. Inf. Sci. 2019, XLII-2/W9, 173–180. [Google Scholar] [CrossRef] [Green Version]
Figure 1.
A multi-resolution model in the graphical interface of nxsview tool.

Figure 2.
Structural schema of the visualization tools of the application.

Figure 3.
System architecture and functional relationships that accomplish the server–client computing model.
Figure 3.
System architecture and functional relationships that accomplish the server–client computing model.

Figure 4.
The old catholikon of the Monastery of St. Stephen: (a) Exterior; (b) Part of the nave where the full-length figures of Saints and Jesus are distinct. In the back the iconostasis that separates the nave from the sanctuary is distinguished.
Figure 4.
The old catholikon of the Monastery of St. Stephen: (a) Exterior; (b) Part of the nave where the full-length figures of Saints and Jesus are distinct. In the back the iconostasis that separates the nave from the sanctuary is distinguished.

Figure 5.
(a) View of the rock of Pixari (b) The skete of Pixari with the three hermitages of St. Gregory and the characteristic wooden balconies and ladders.
Figure 5.
(a) View of the rock of Pixari (b) The skete of Pixari with the three hermitages of St. Gregory and the characteristic wooden balconies and ladders.

Figure 6.
The 3D inputs of the developed platform in the 3DHOP’s basic user interface (a) 3D model of the archaeological site of Meteora (b) 3D model of the exterior of St. Stephen’s old catholikon (c) 3D model of Pixari rock (d) 3D model of the interior of St. Stephen’s old catholikon.
Figure 6.
The 3D inputs of the developed platform in the 3DHOP’s basic user interface (a) 3D model of the archaeological site of Meteora (b) 3D model of the exterior of St. Stephen’s old catholikon (c) 3D model of Pixari rock (d) 3D model of the interior of St. Stephen’s old catholikon.

Figure 7.
Homepage of the 3D platform with details from the side column: (a) tabs with map location and brief description of the purpose and methodology (b) various image galleries.
Figure 7.
Homepage of the 3D platform with details from the side column: (a) tabs with map location and brief description of the purpose and methodology (b) various image galleries.


Figure 8.
The second page of the 3D platform that hosts the documentation data of Pixari rock.

Figure 9.
The third page of the 3D platform that hosts the documentation data of the old catholikon of St. Stephen monastery.
Figure 9.
The third page of the 3D platform that hosts the documentation data of the old catholikon of St. Stephen monastery.

Figure 10.
Real-time adjustment of menu contents and its corresponding information for the selected hotspot.
Figure 10.
Real-time adjustment of menu contents and its corresponding information for the selected hotspot.

Figure 11.
Snapshot during the automatic navigation while camera frames pillars with remains of sketes.
Figure 11.
Snapshot during the automatic navigation while camera frames pillars with remains of sketes.

Figure 12.
The JavaScript setTimeout method iterates “pos”, the array that contains the anonymous functions with parameter a 3DHOP’s exposed method, within a callback function.
Figure 12.
The JavaScript setTimeout method iterates “pos”, the array that contains the anonymous functions with parameter a 3DHOP’s exposed method, within a callback function.

Figure 13.
The interactive retrieval tool enables the access to heterogeneous data via 2D and 3D viewports (a) Emulation of the subpage with the detailed documentation of Pixari rock (b) Image collection of Roussanou Monastery (c) 3D models’ collection of St. Stephen’s Monastery.
Figure 13.
The interactive retrieval tool enables the access to heterogeneous data via 2D and 3D viewports (a) Emulation of the subpage with the detailed documentation of Pixari rock (b) Image collection of Roussanou Monastery (c) 3D models’ collection of St. Stephen’s Monastery.


Figure 14.
(a) Text and graphic labels on the interior of the church and (b) the result of a click event to a point of interest.
Figure 14.
(a) Text and graphic labels on the interior of the church and (b) the result of a click event to a point of interest.

Figure 15.
Cashed content used normally for each page of the platform: (a) Resources loading time (sec) (b) Size of data transferred (MB).
Figure 15.
Cashed content used normally for each page of the platform: (a) Resources loading time (sec) (b) Size of data transferred (MB).

Figure 16.
Visualization results of a detail of the 3D model of Meteora after (a) 0.5 s, (b) 1 s, (c) 1.5 s and (d) 2 s from homepage launch.
Figure 16.
Visualization results of a detail of the 3D model of Meteora after (a) 0.5 s, (b) 1 s, (c) 1.5 s and (d) 2 s from homepage launch.


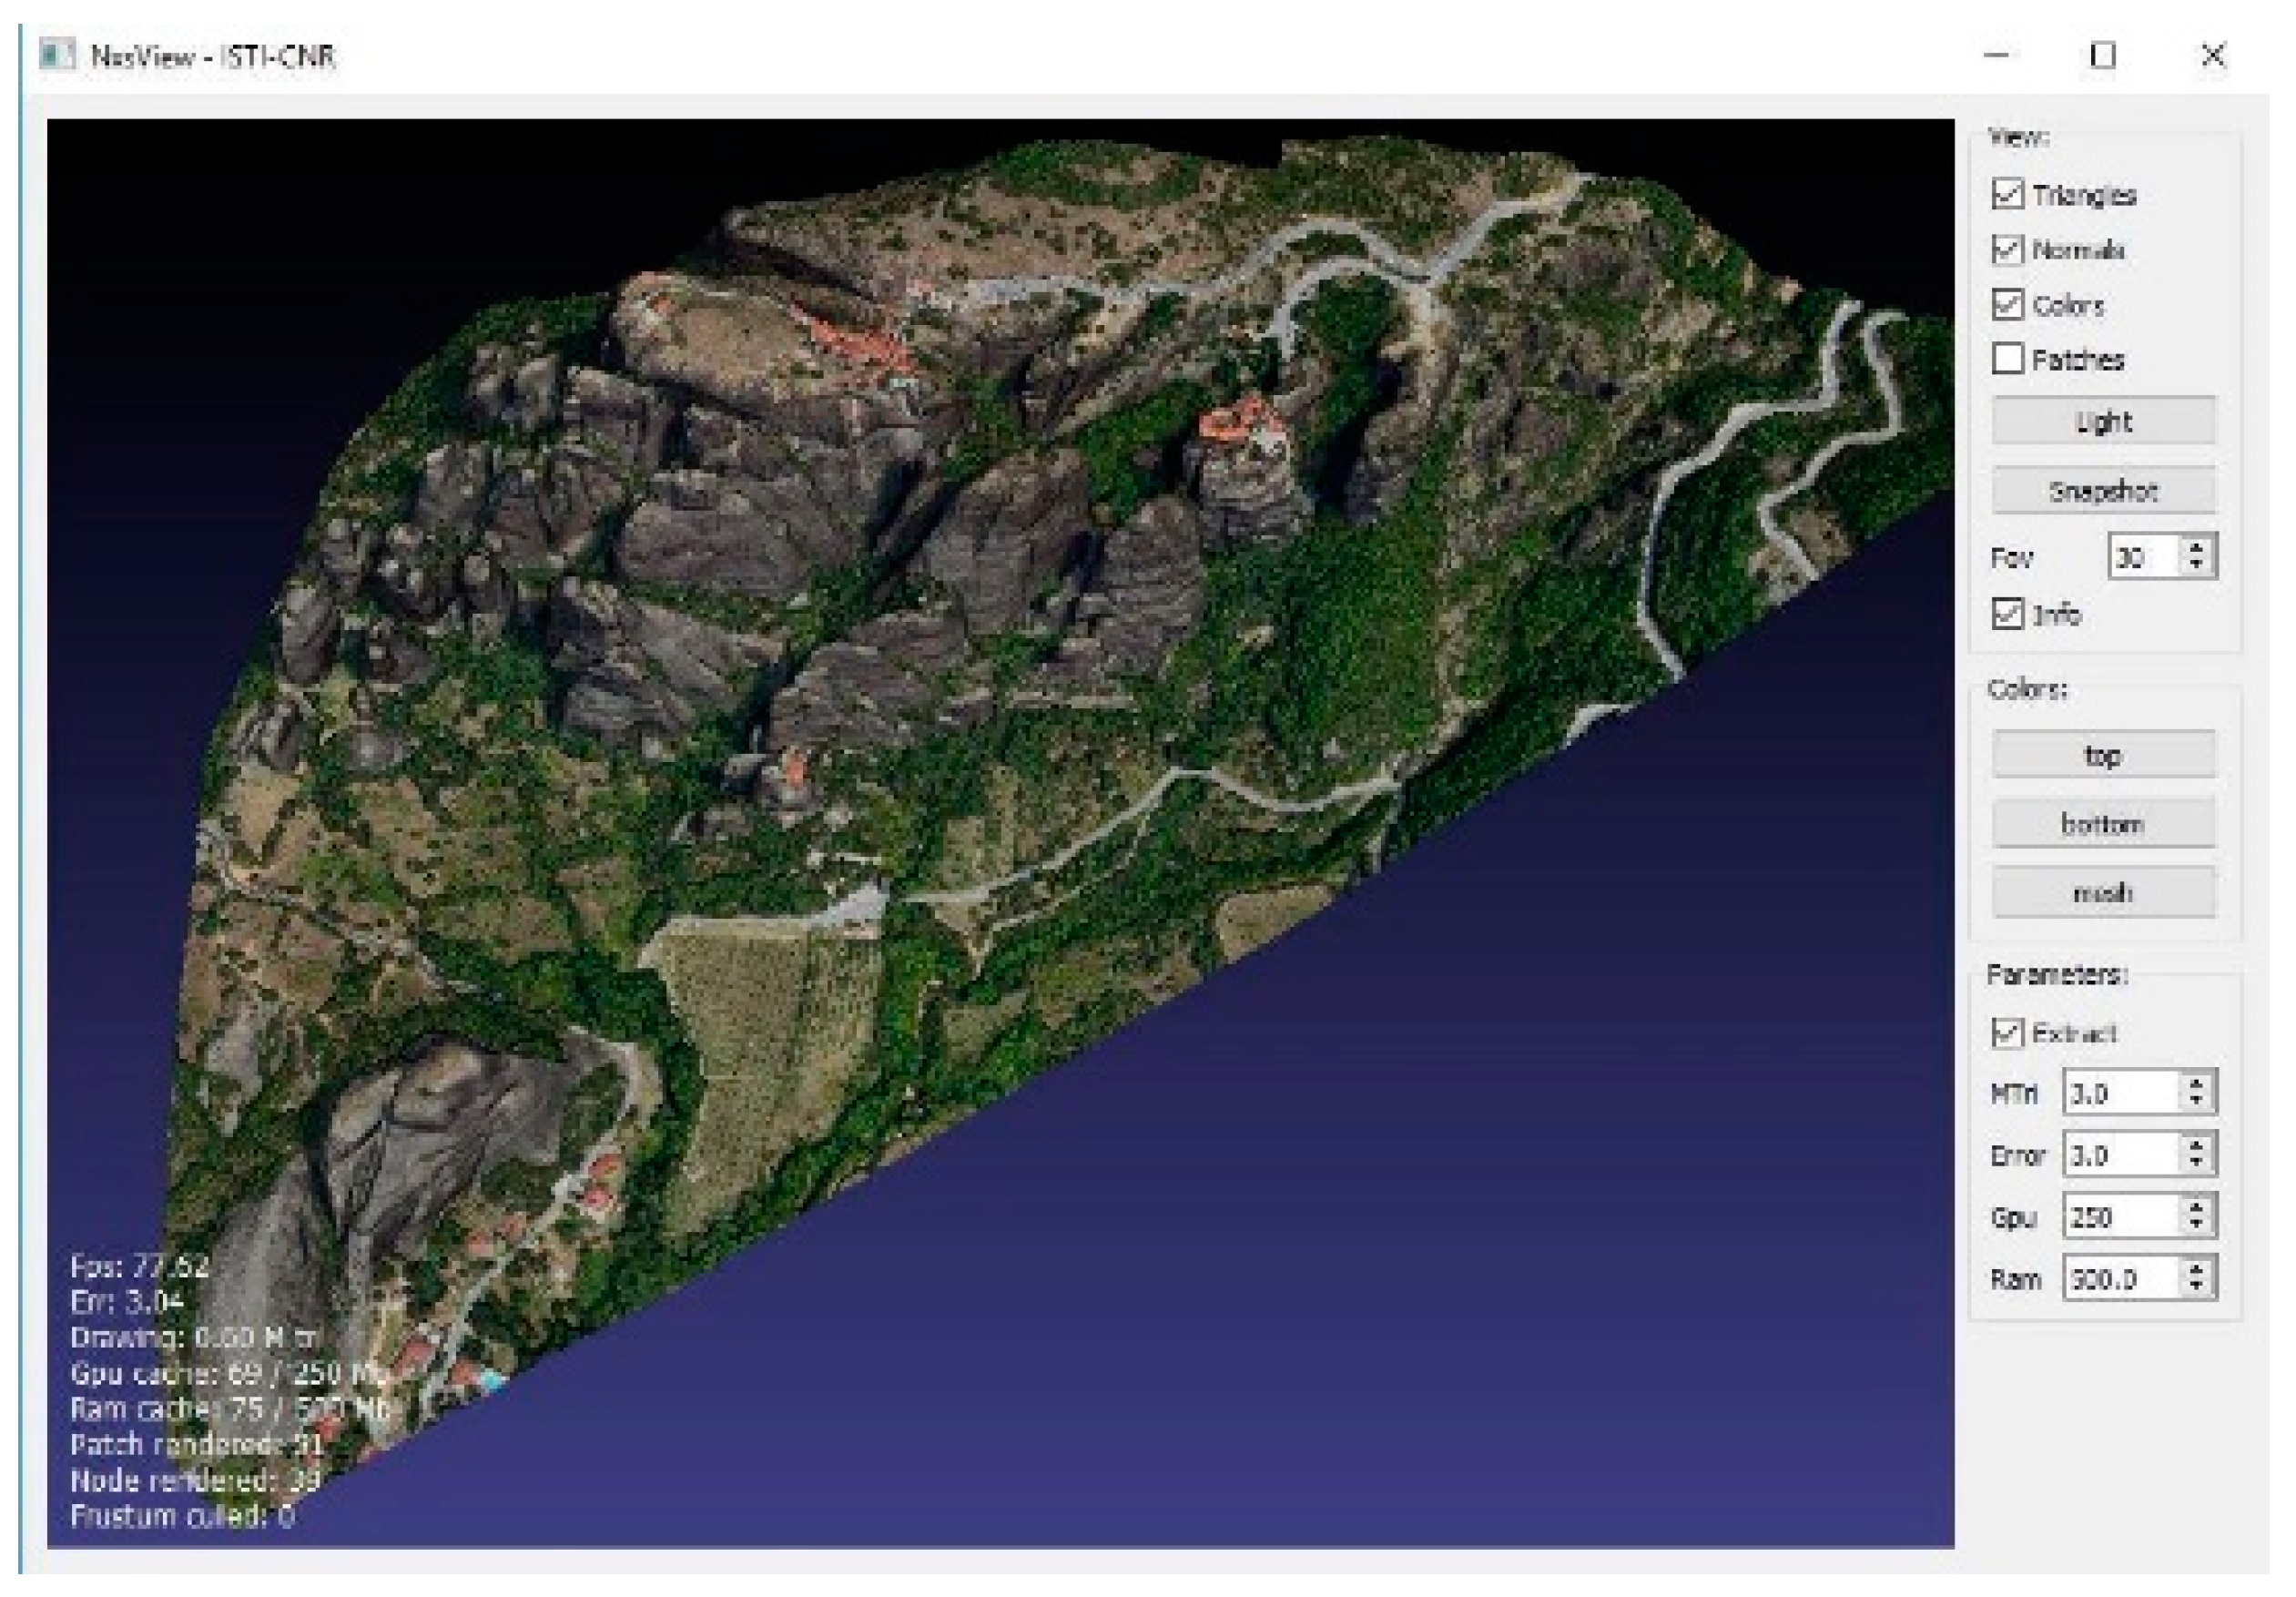
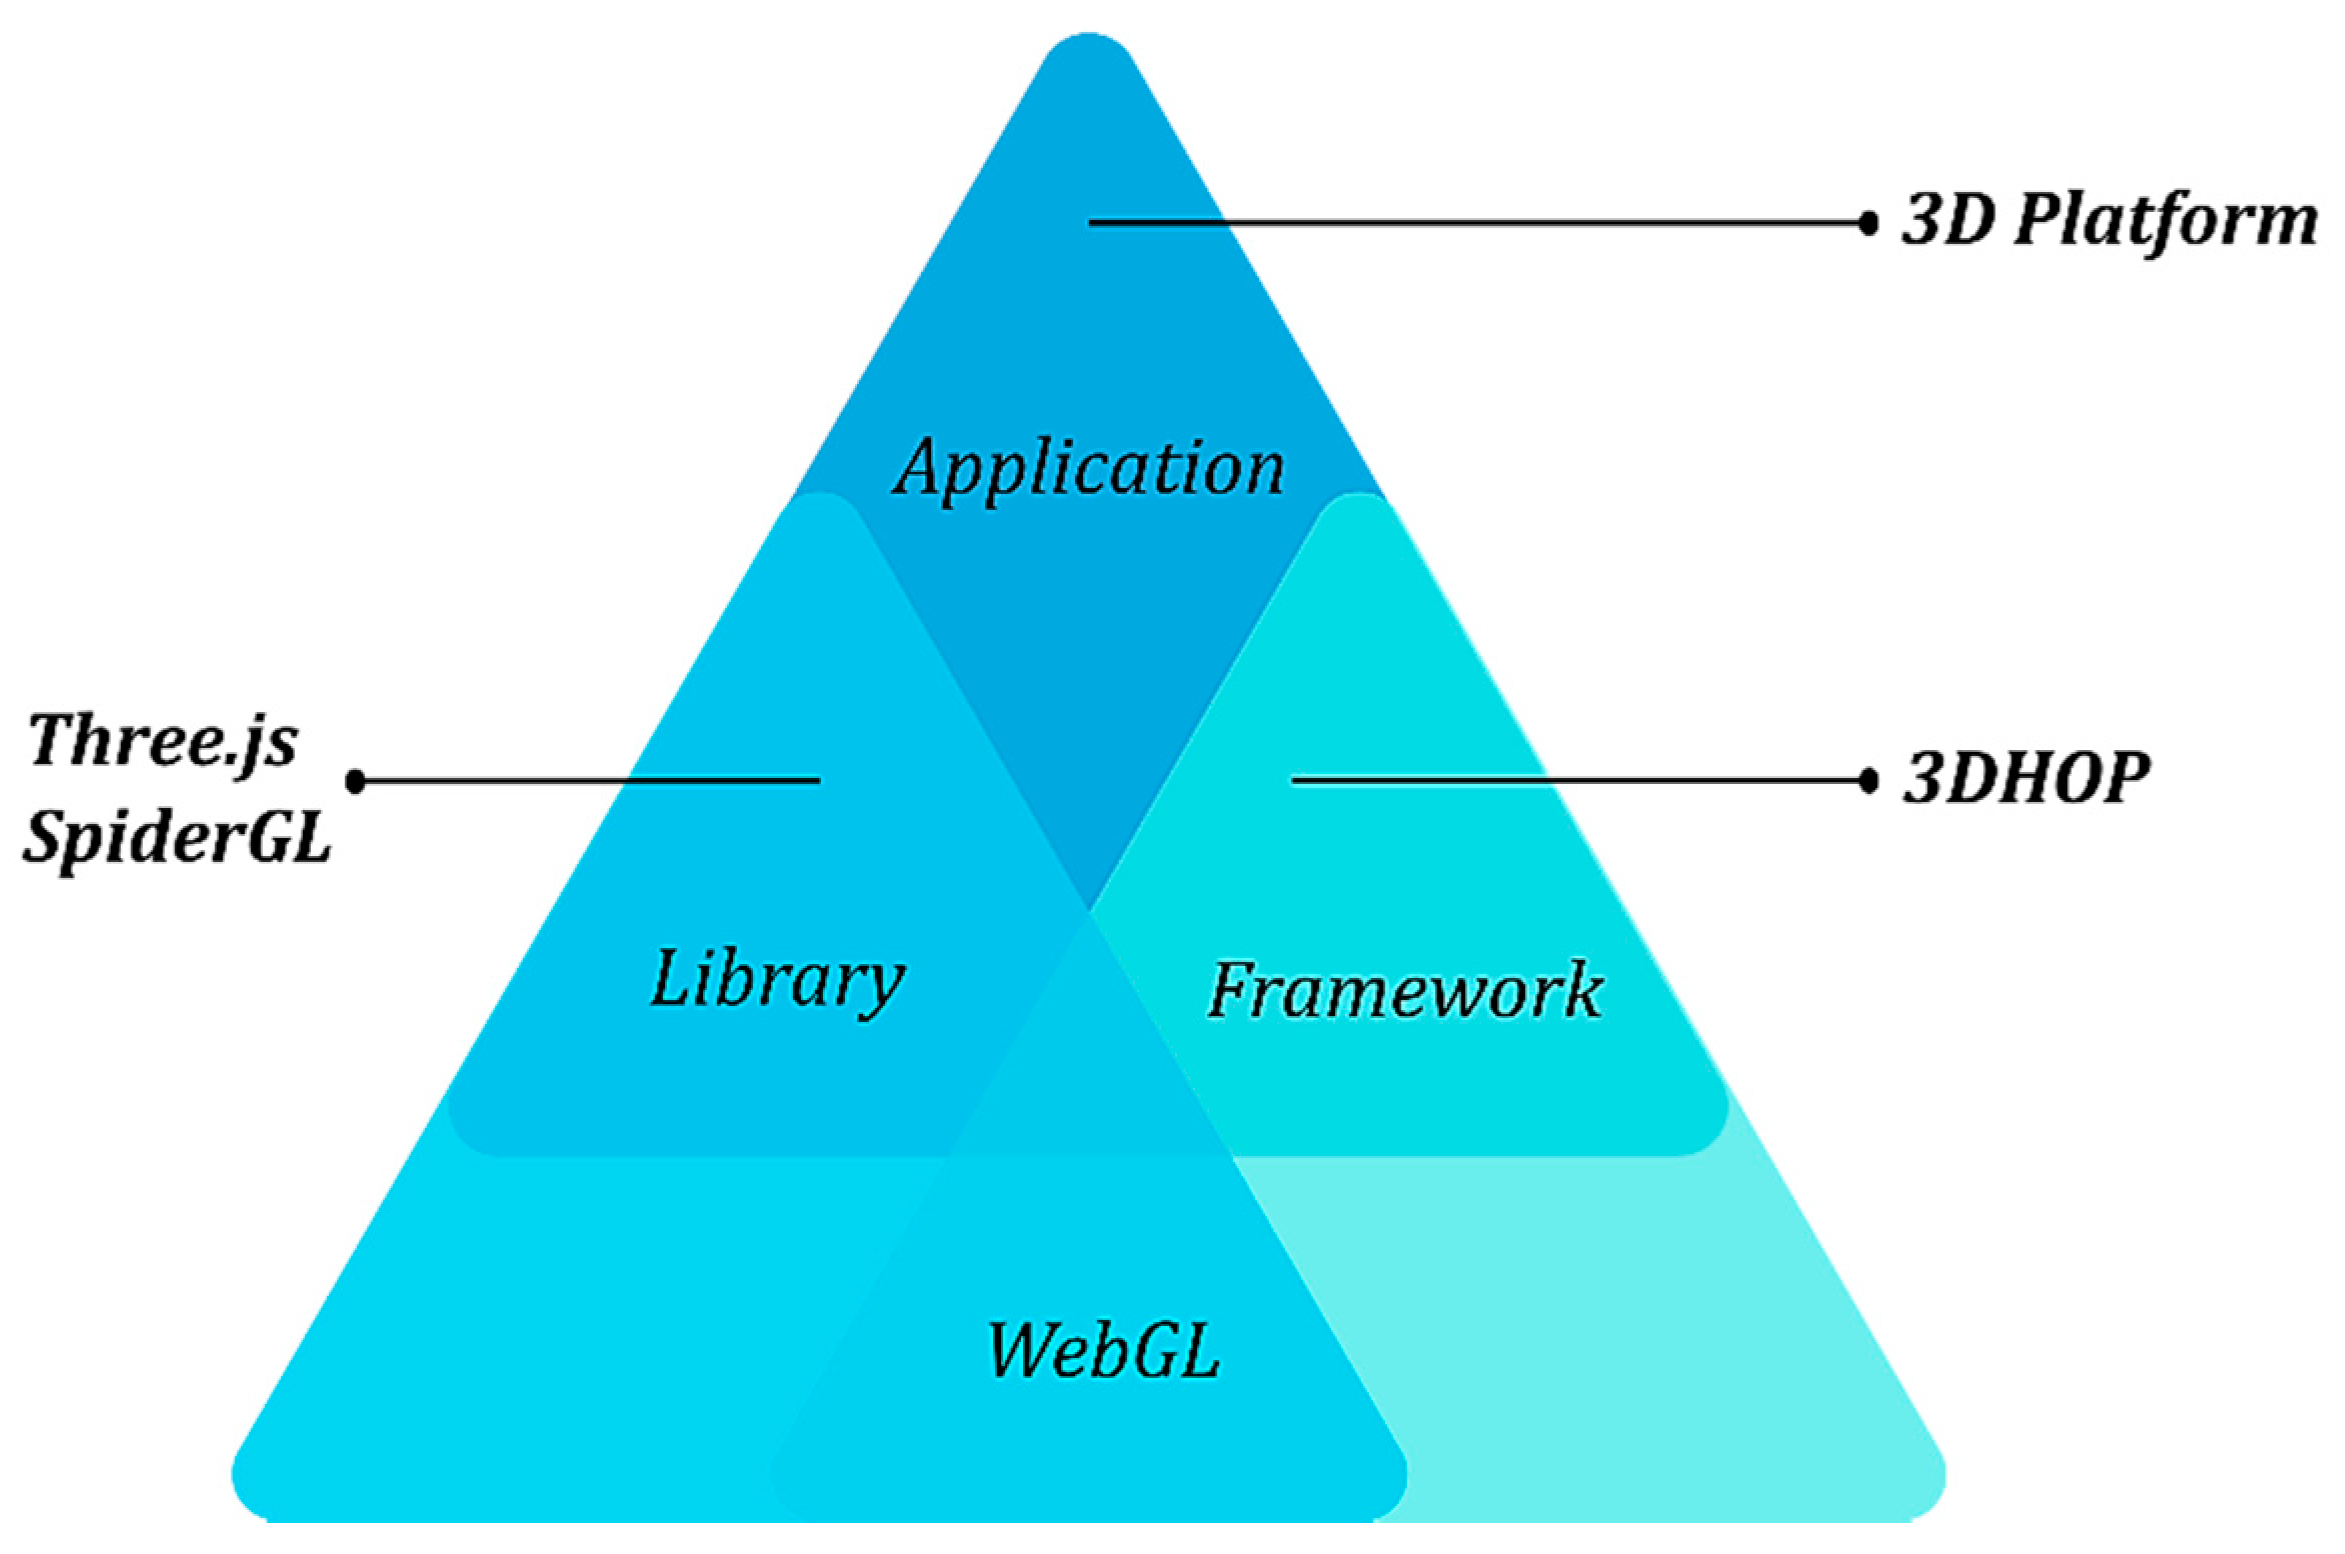
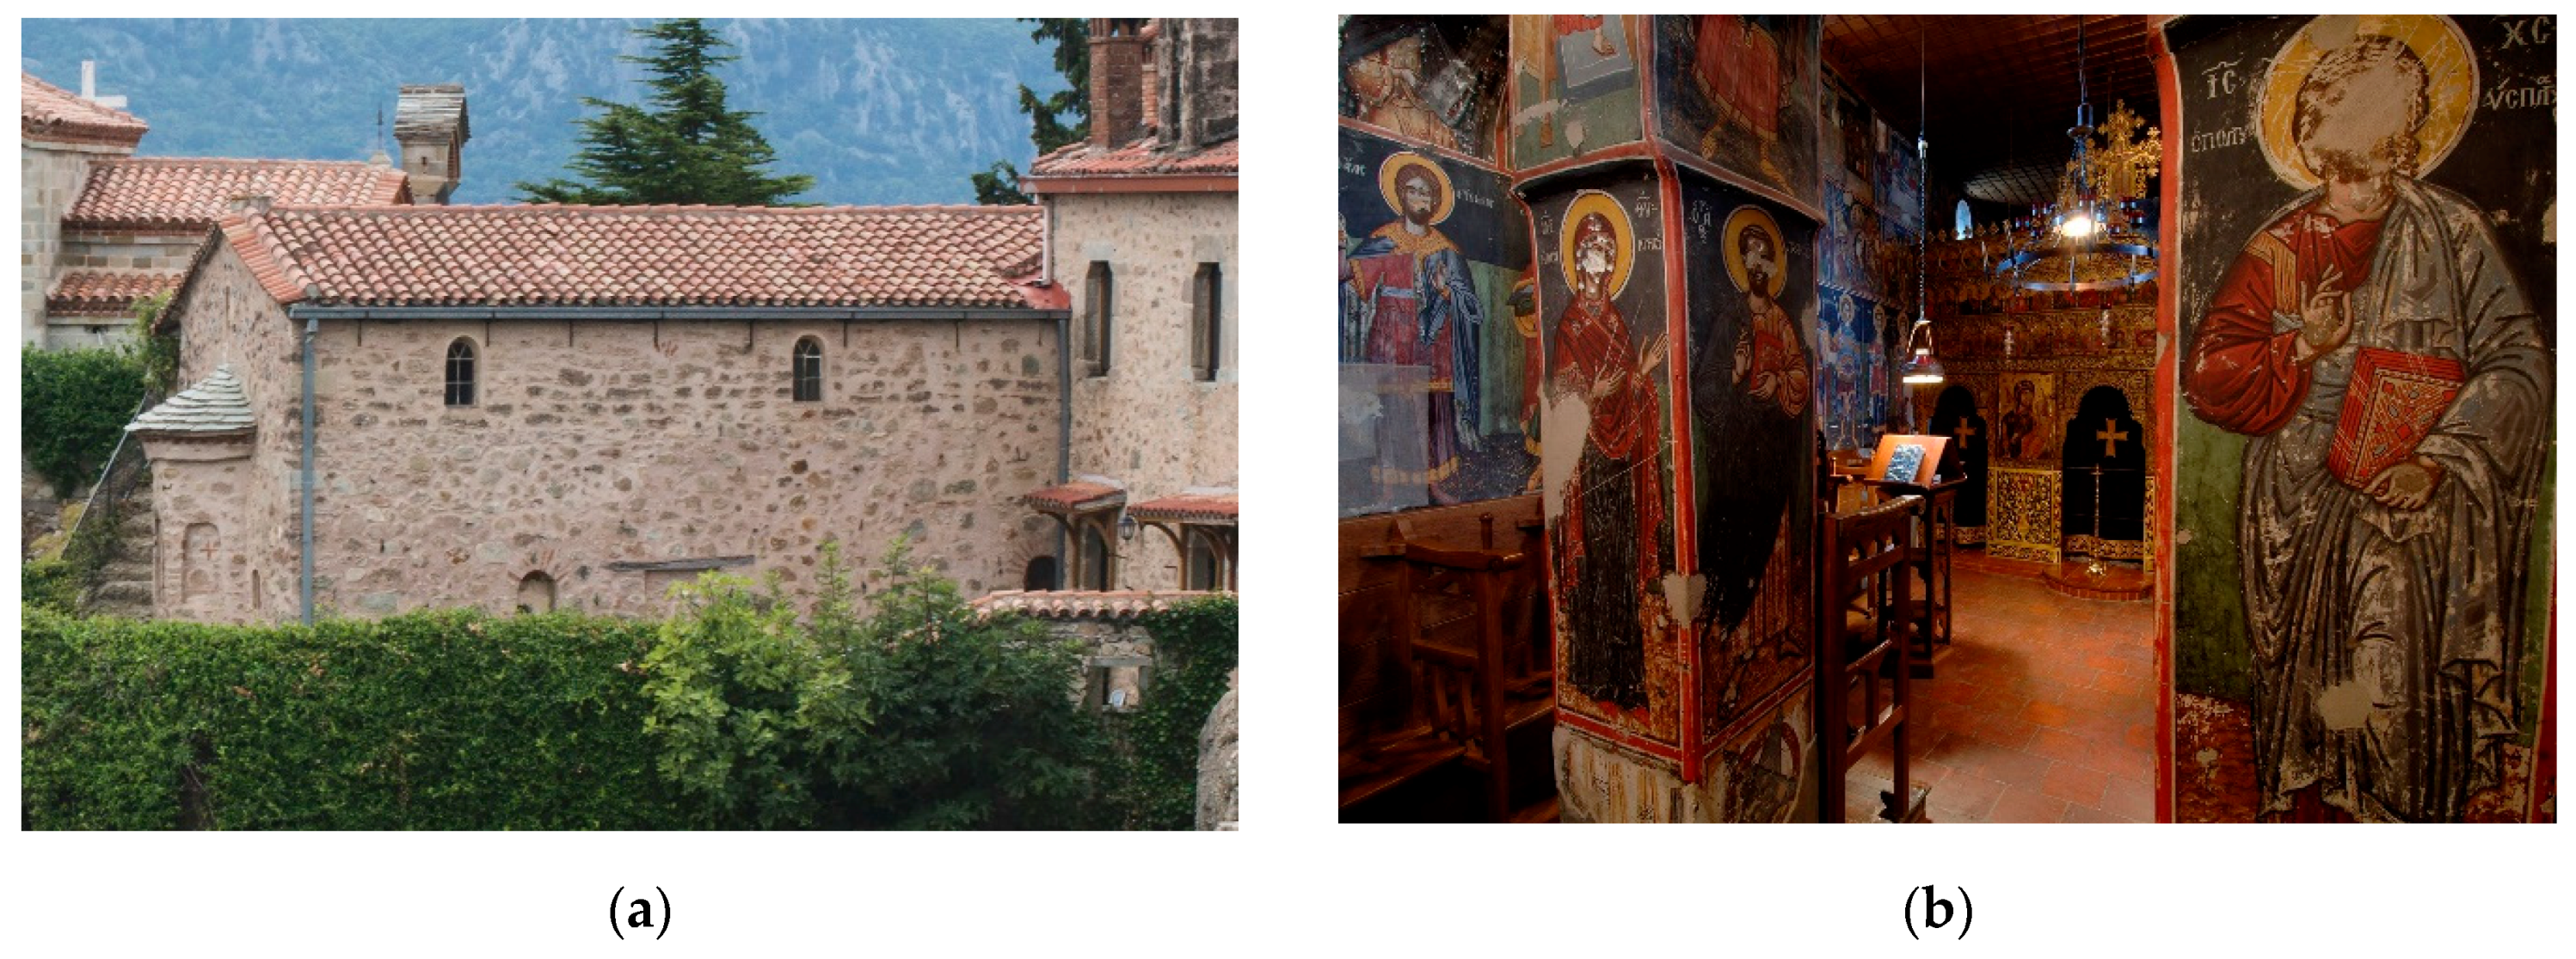
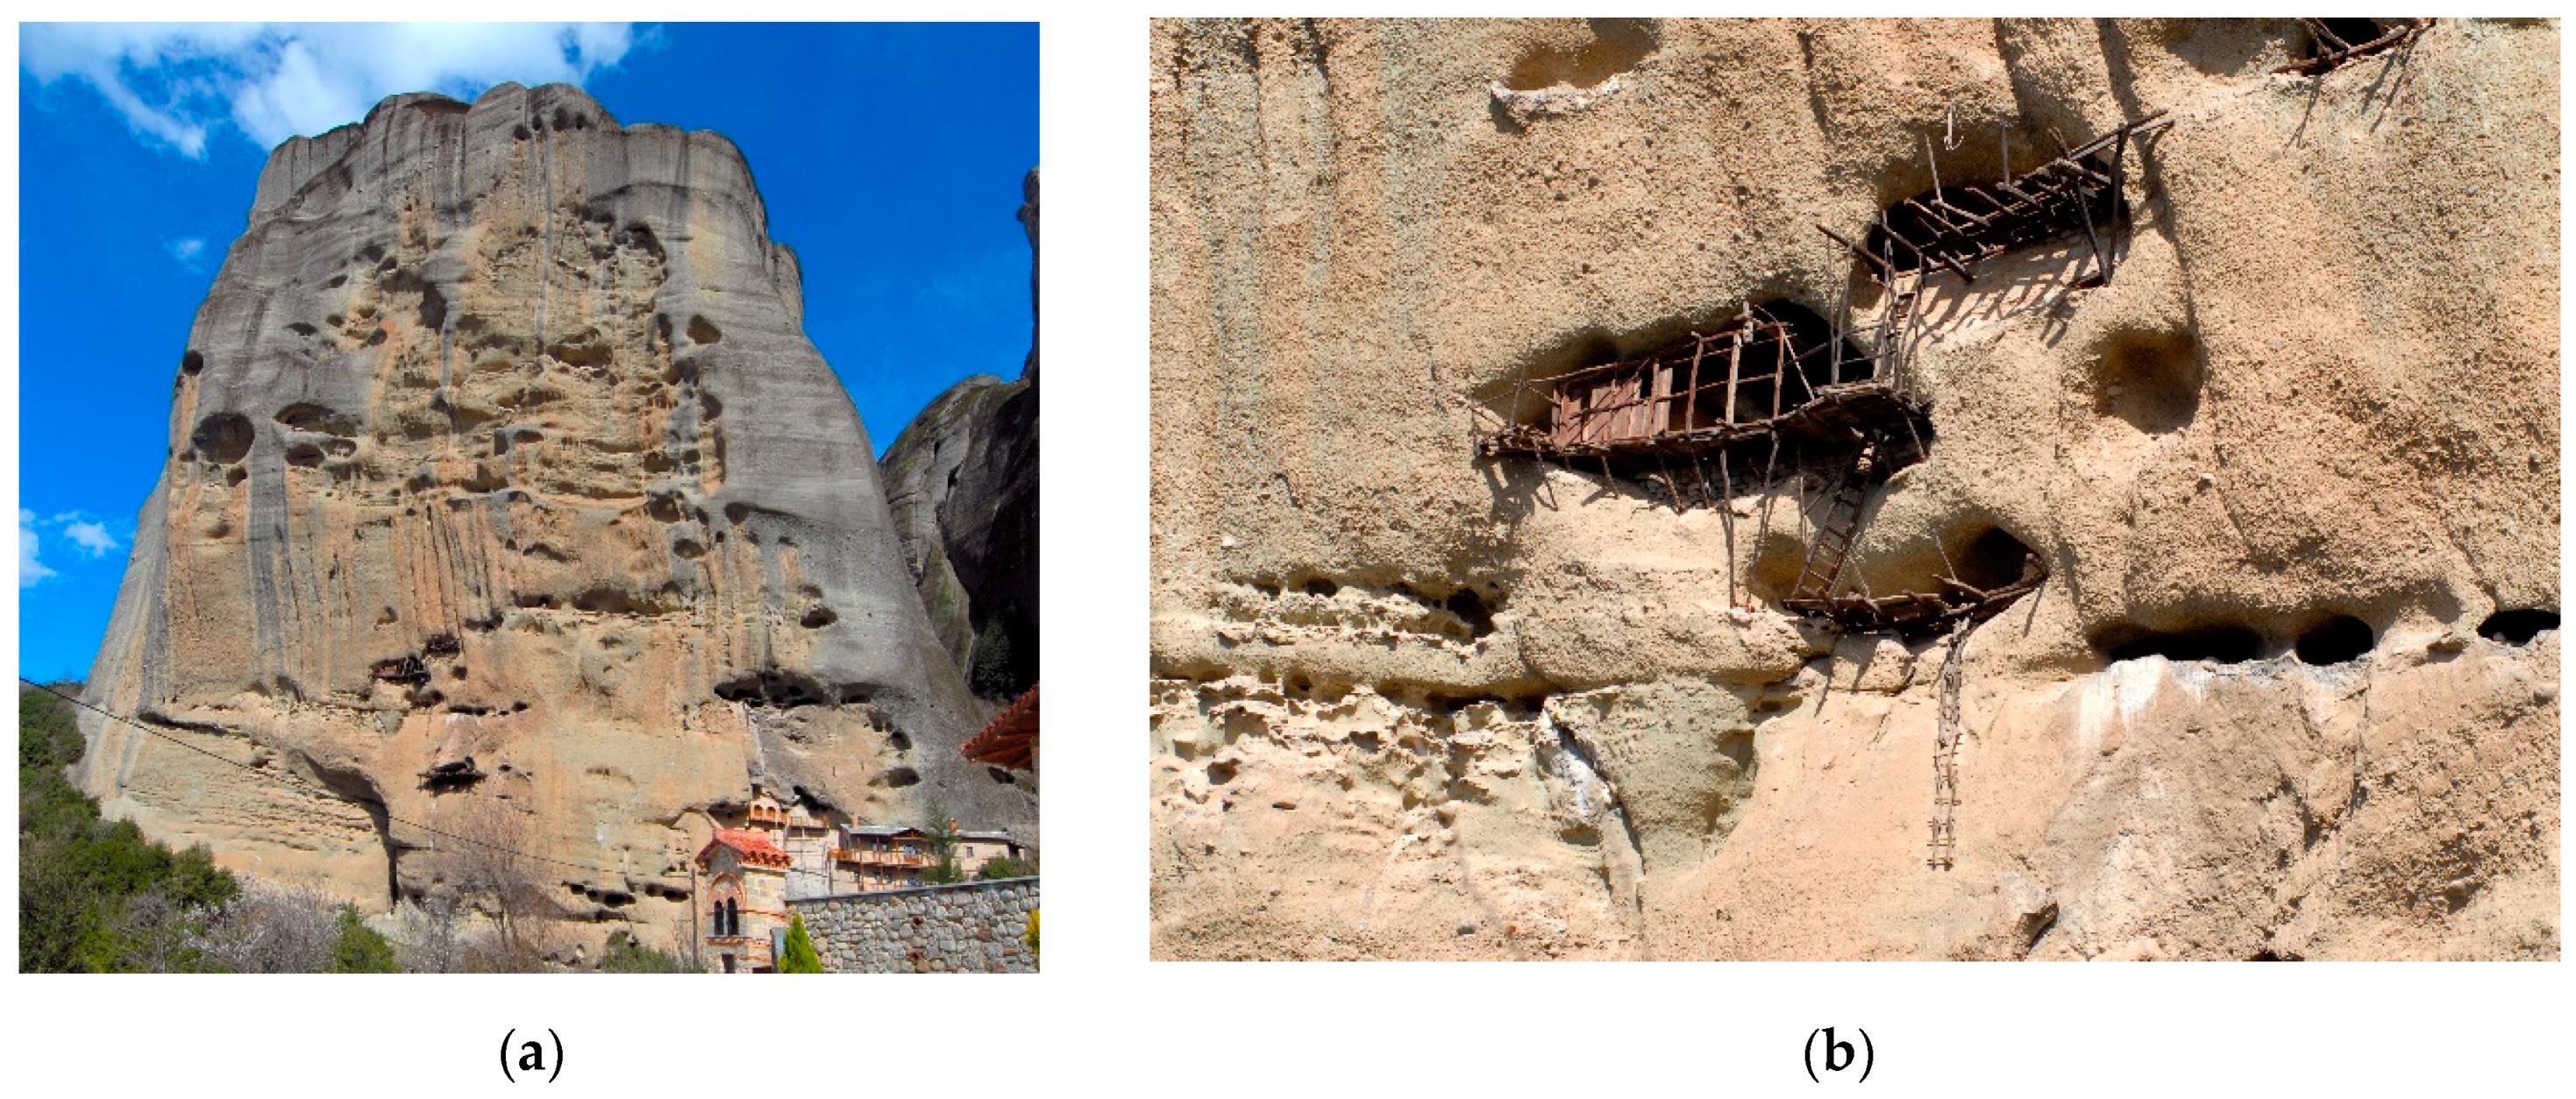
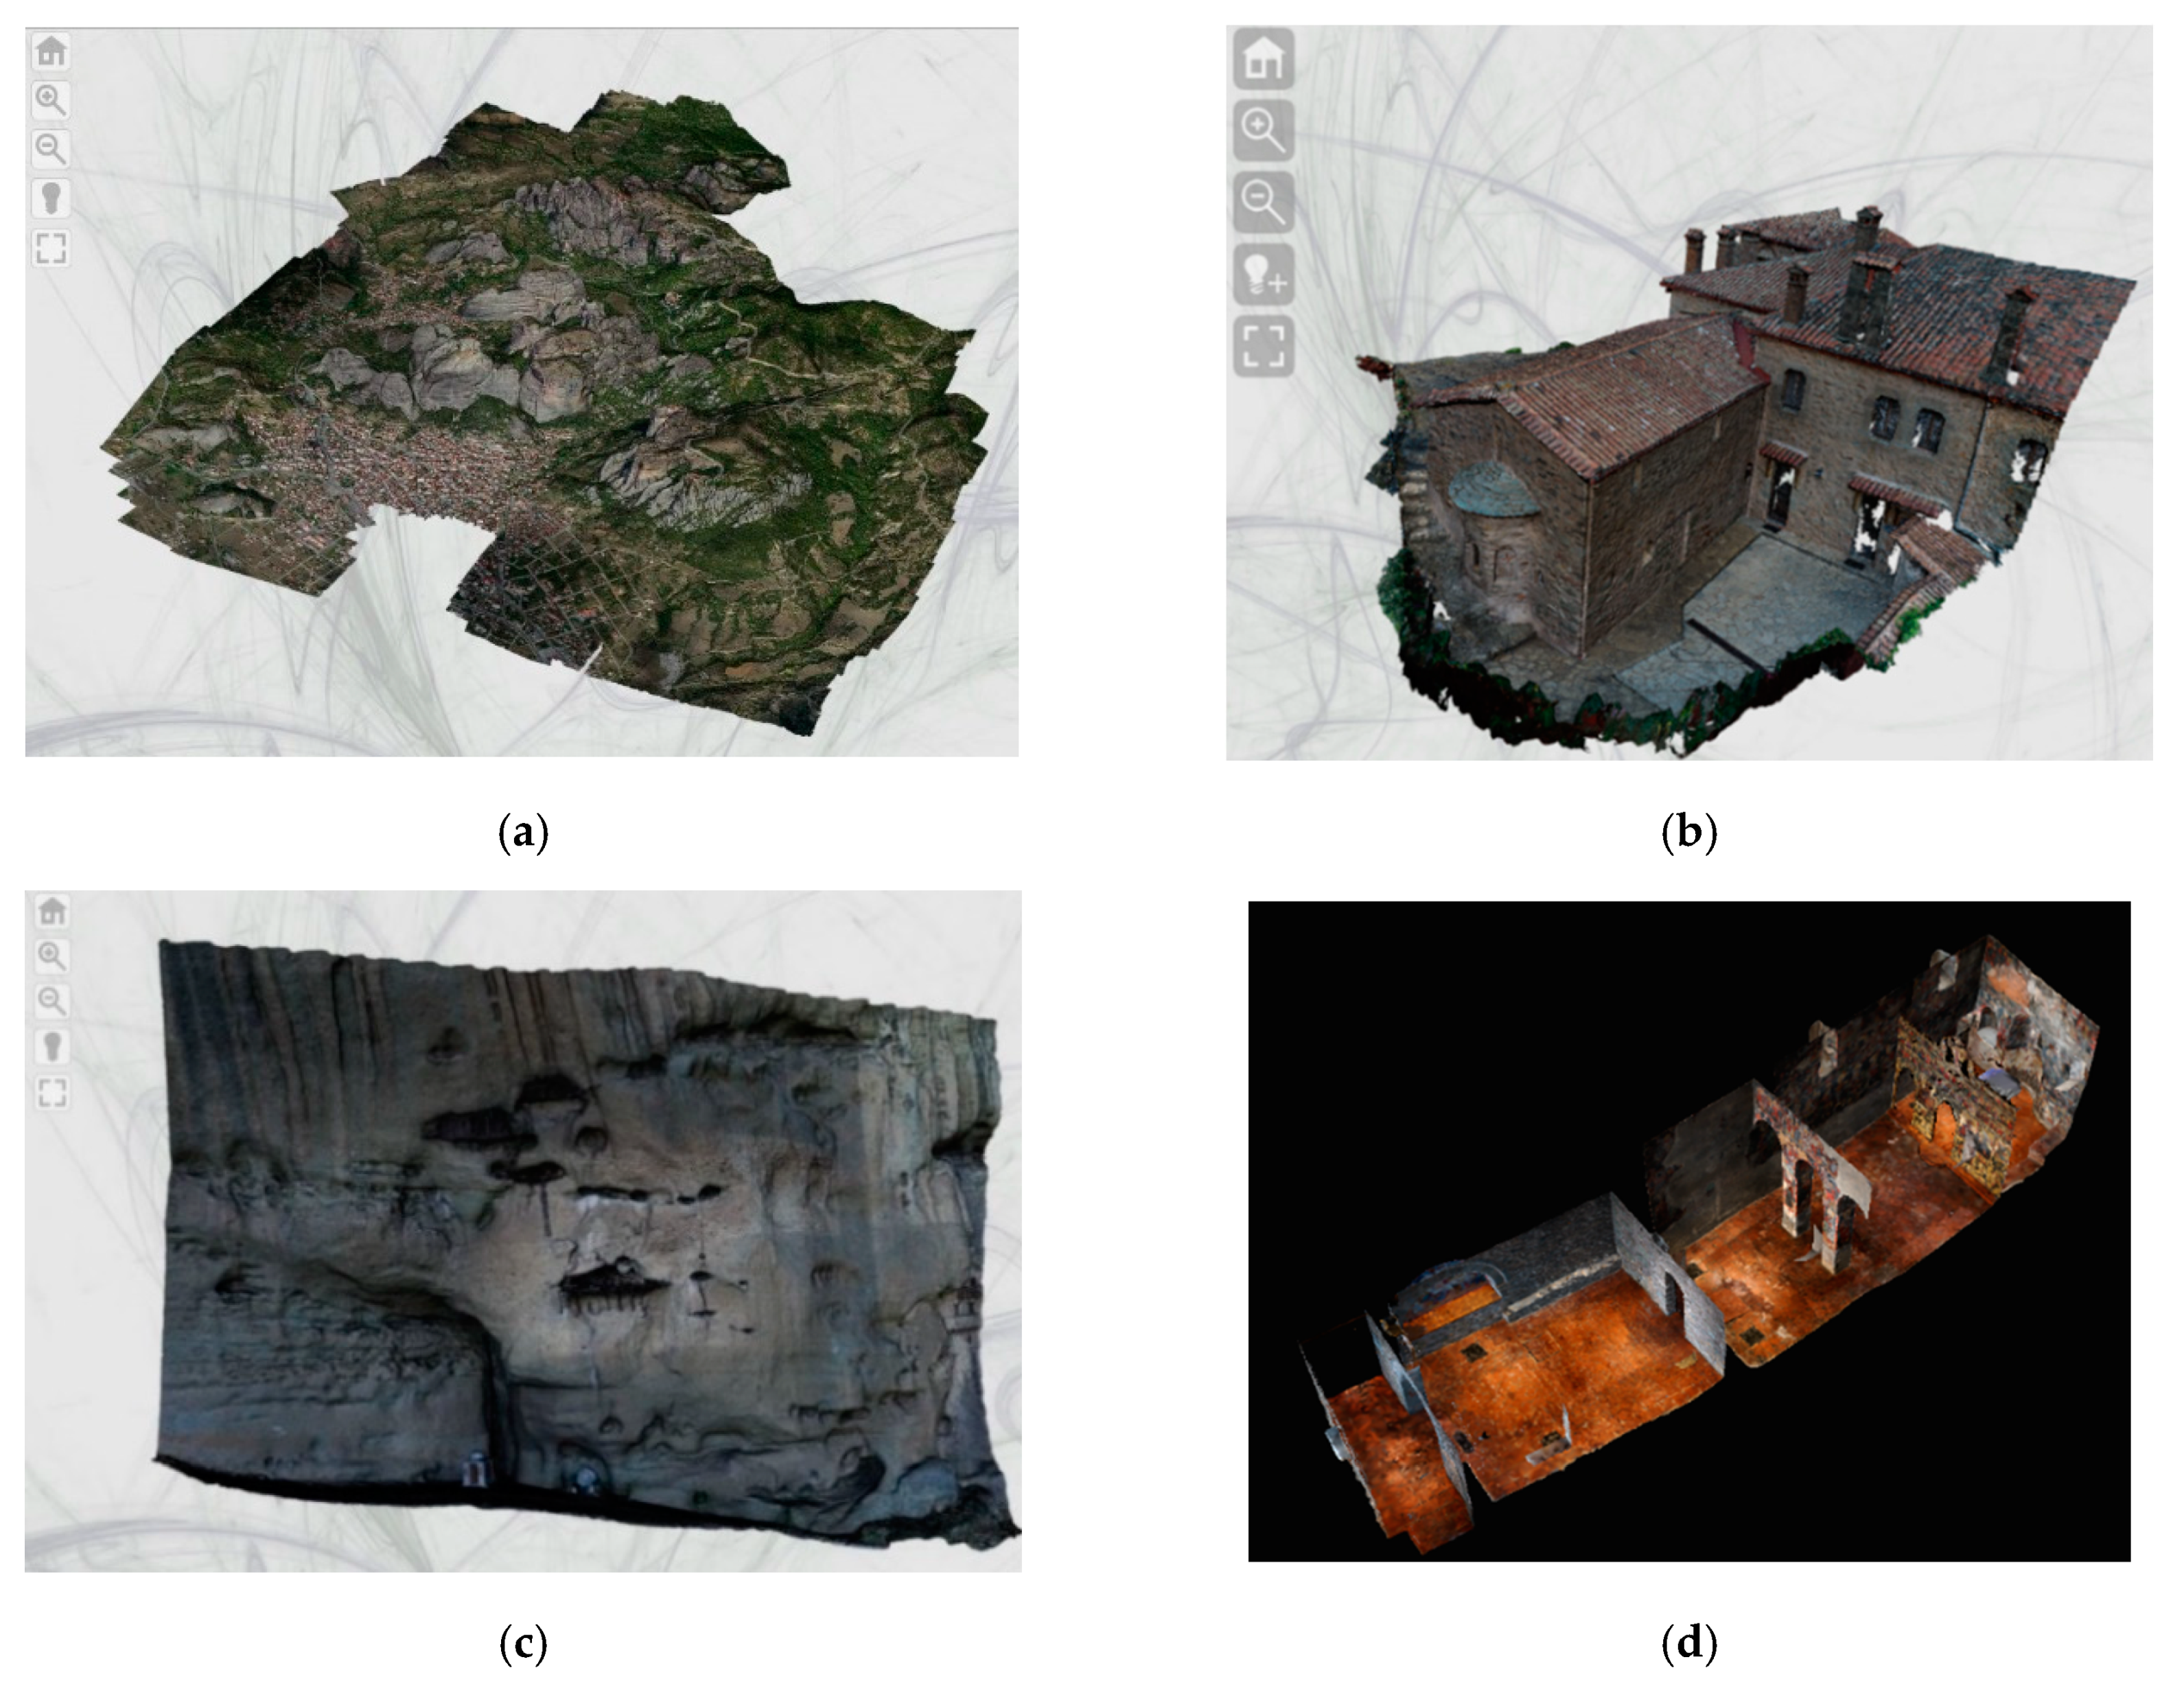
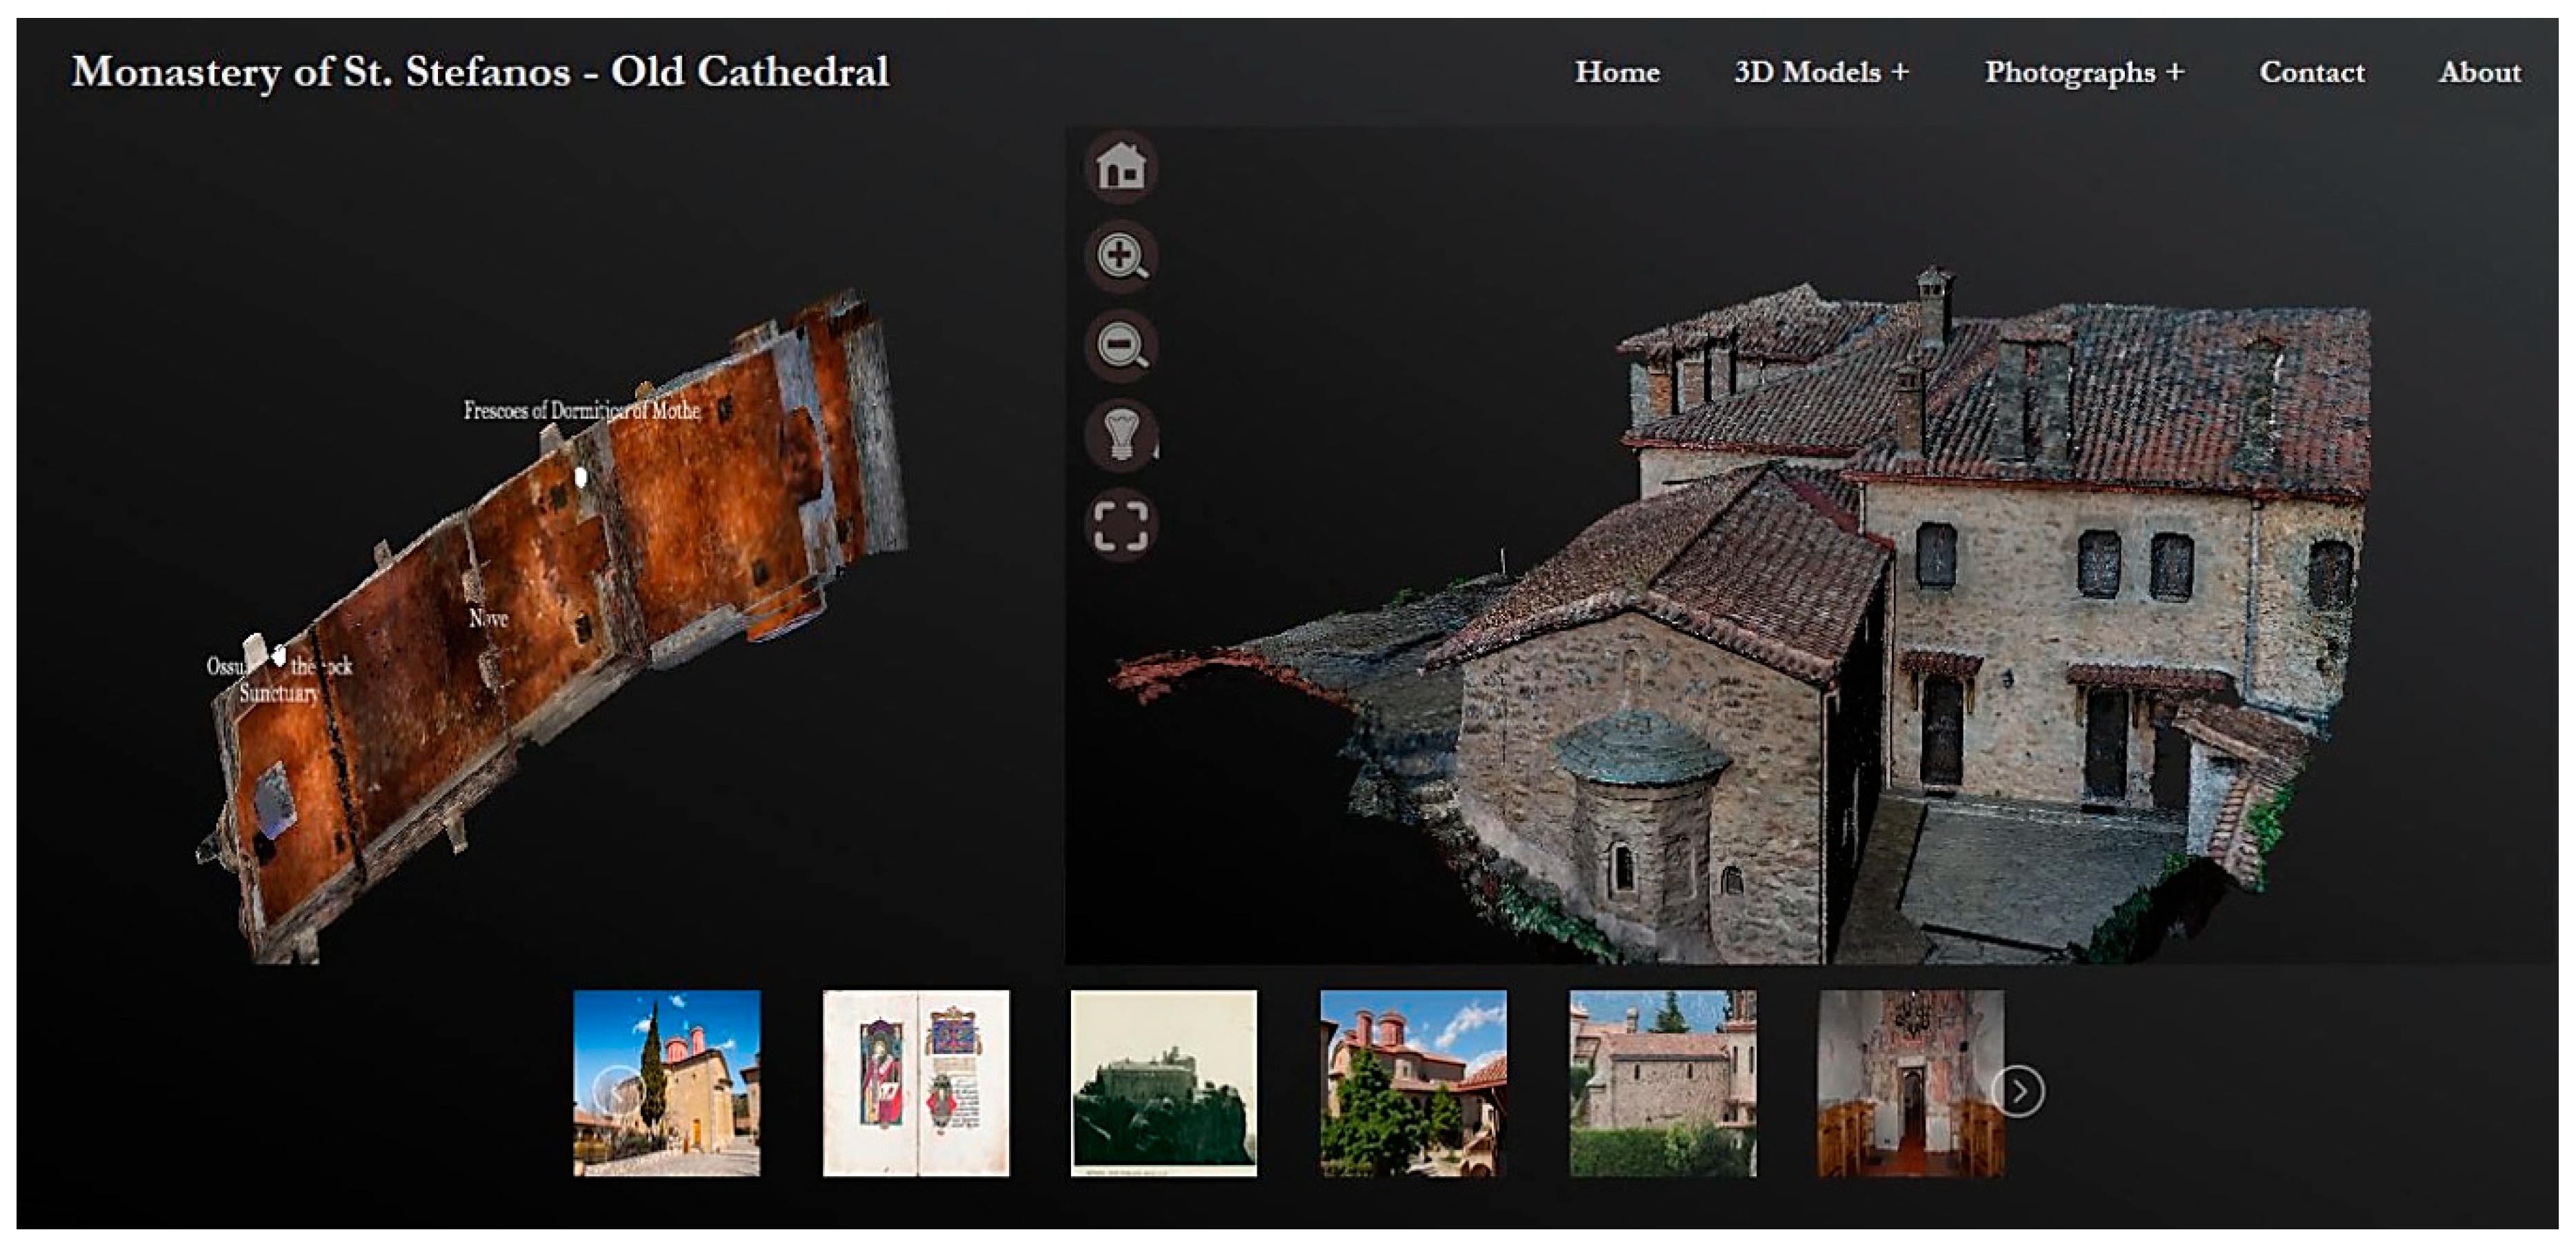
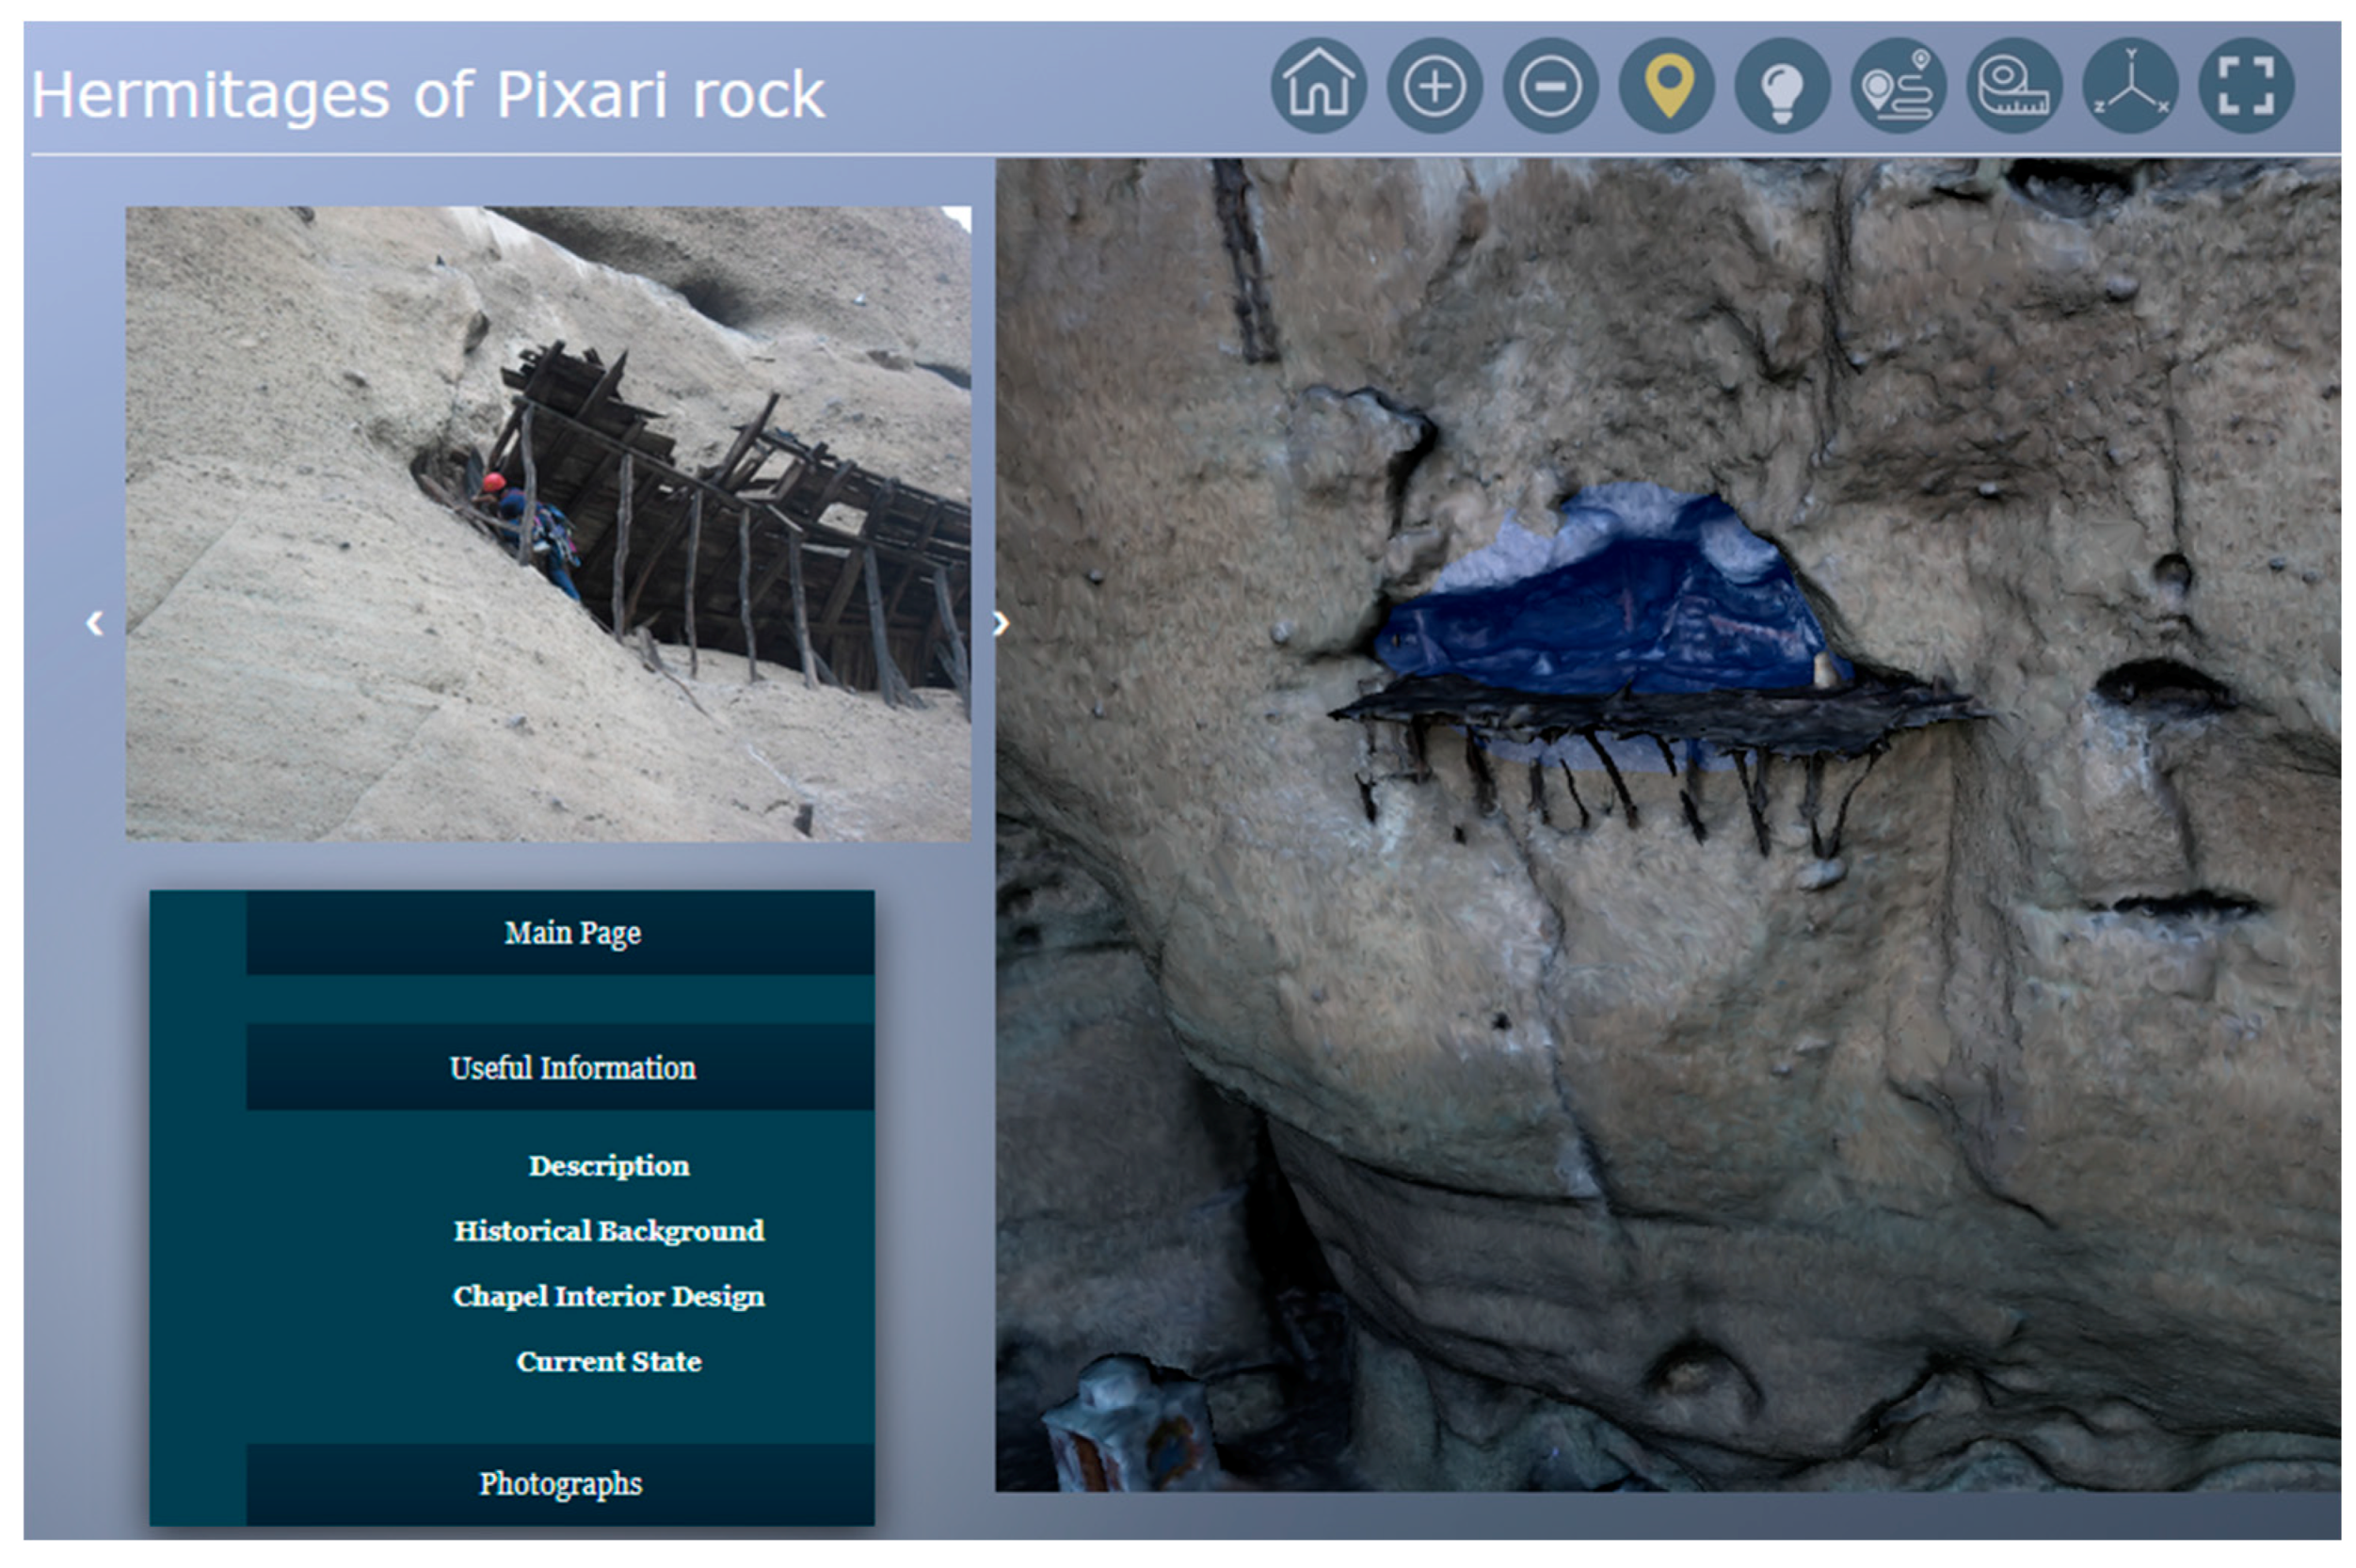
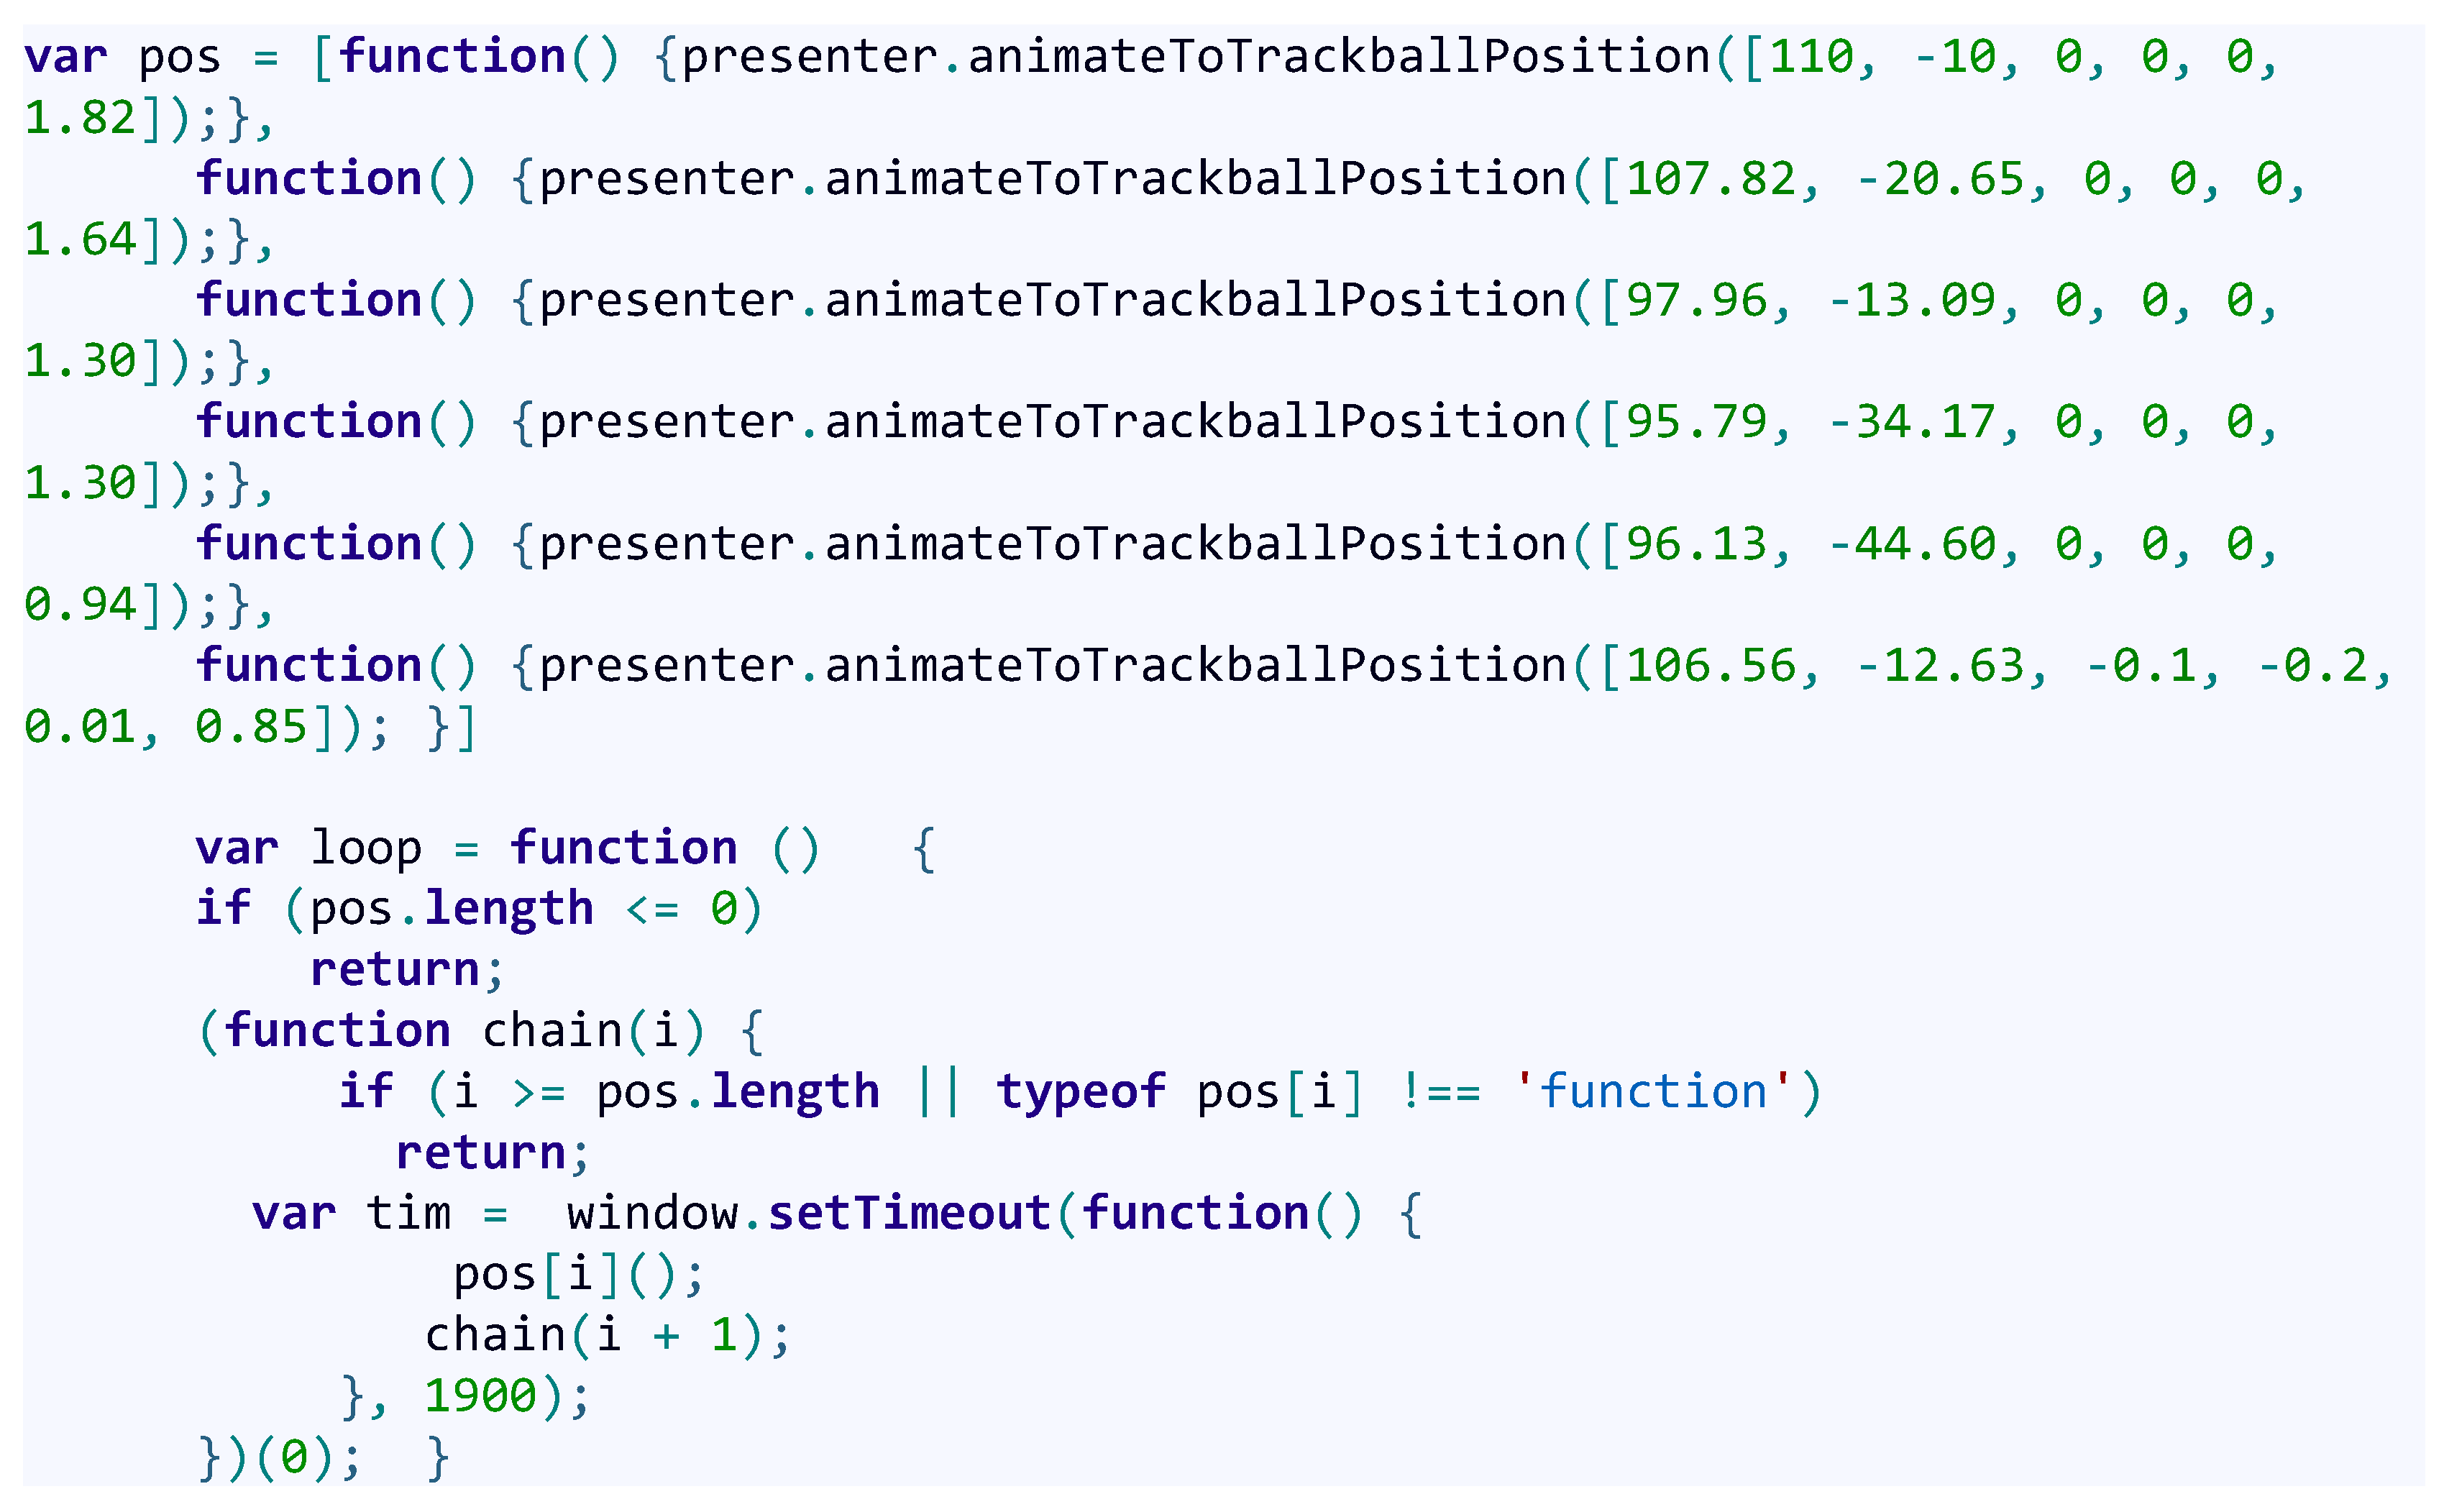
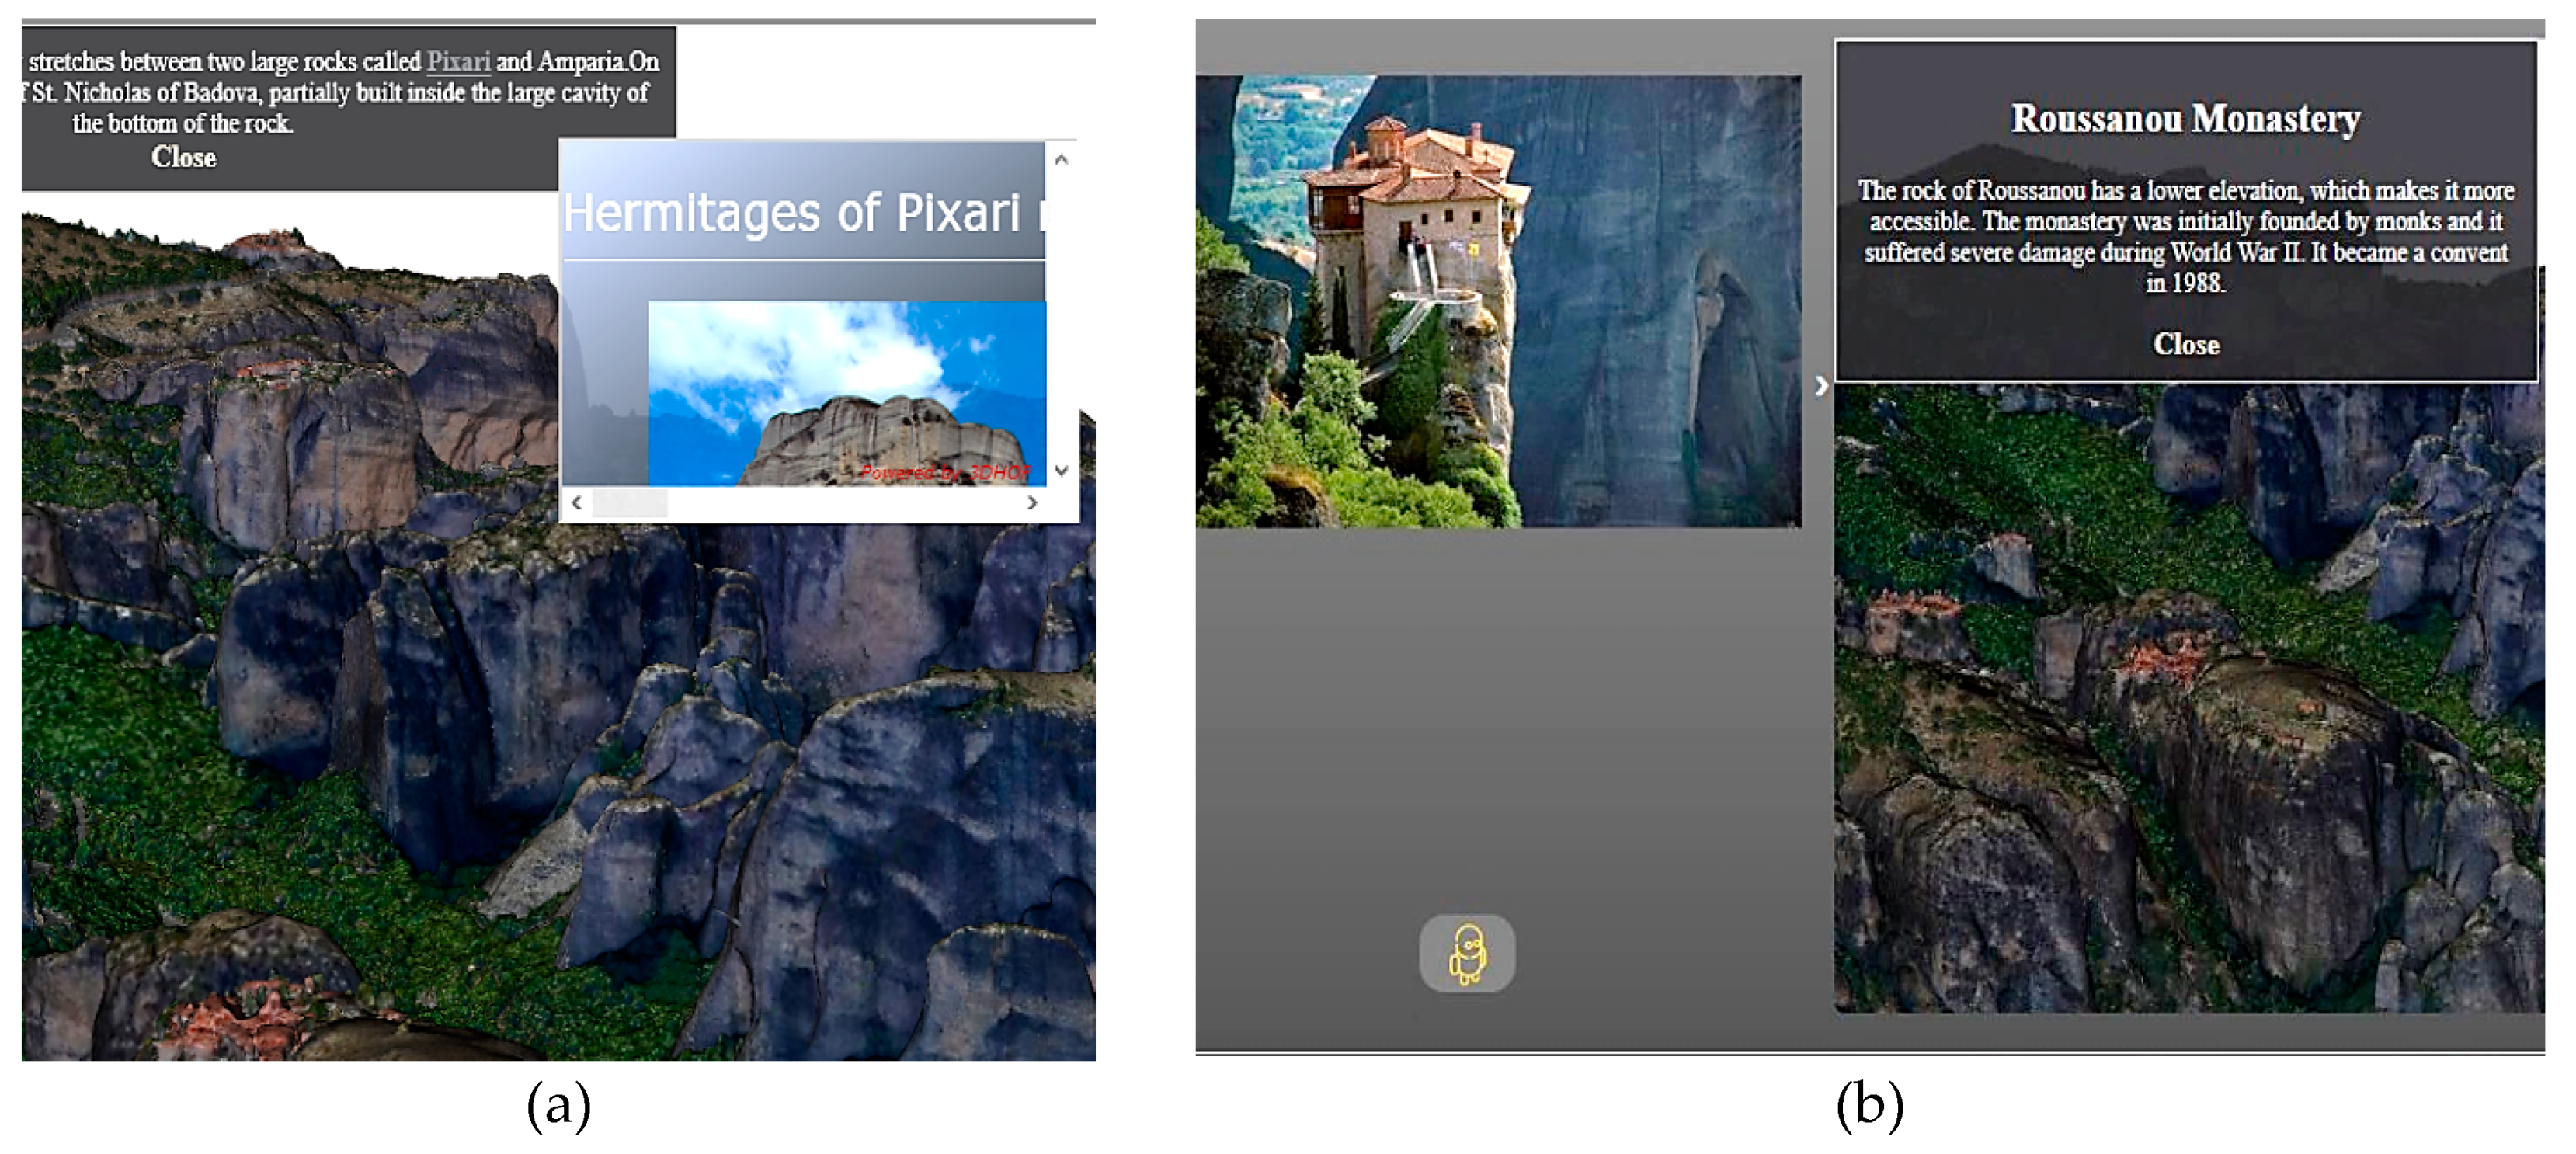
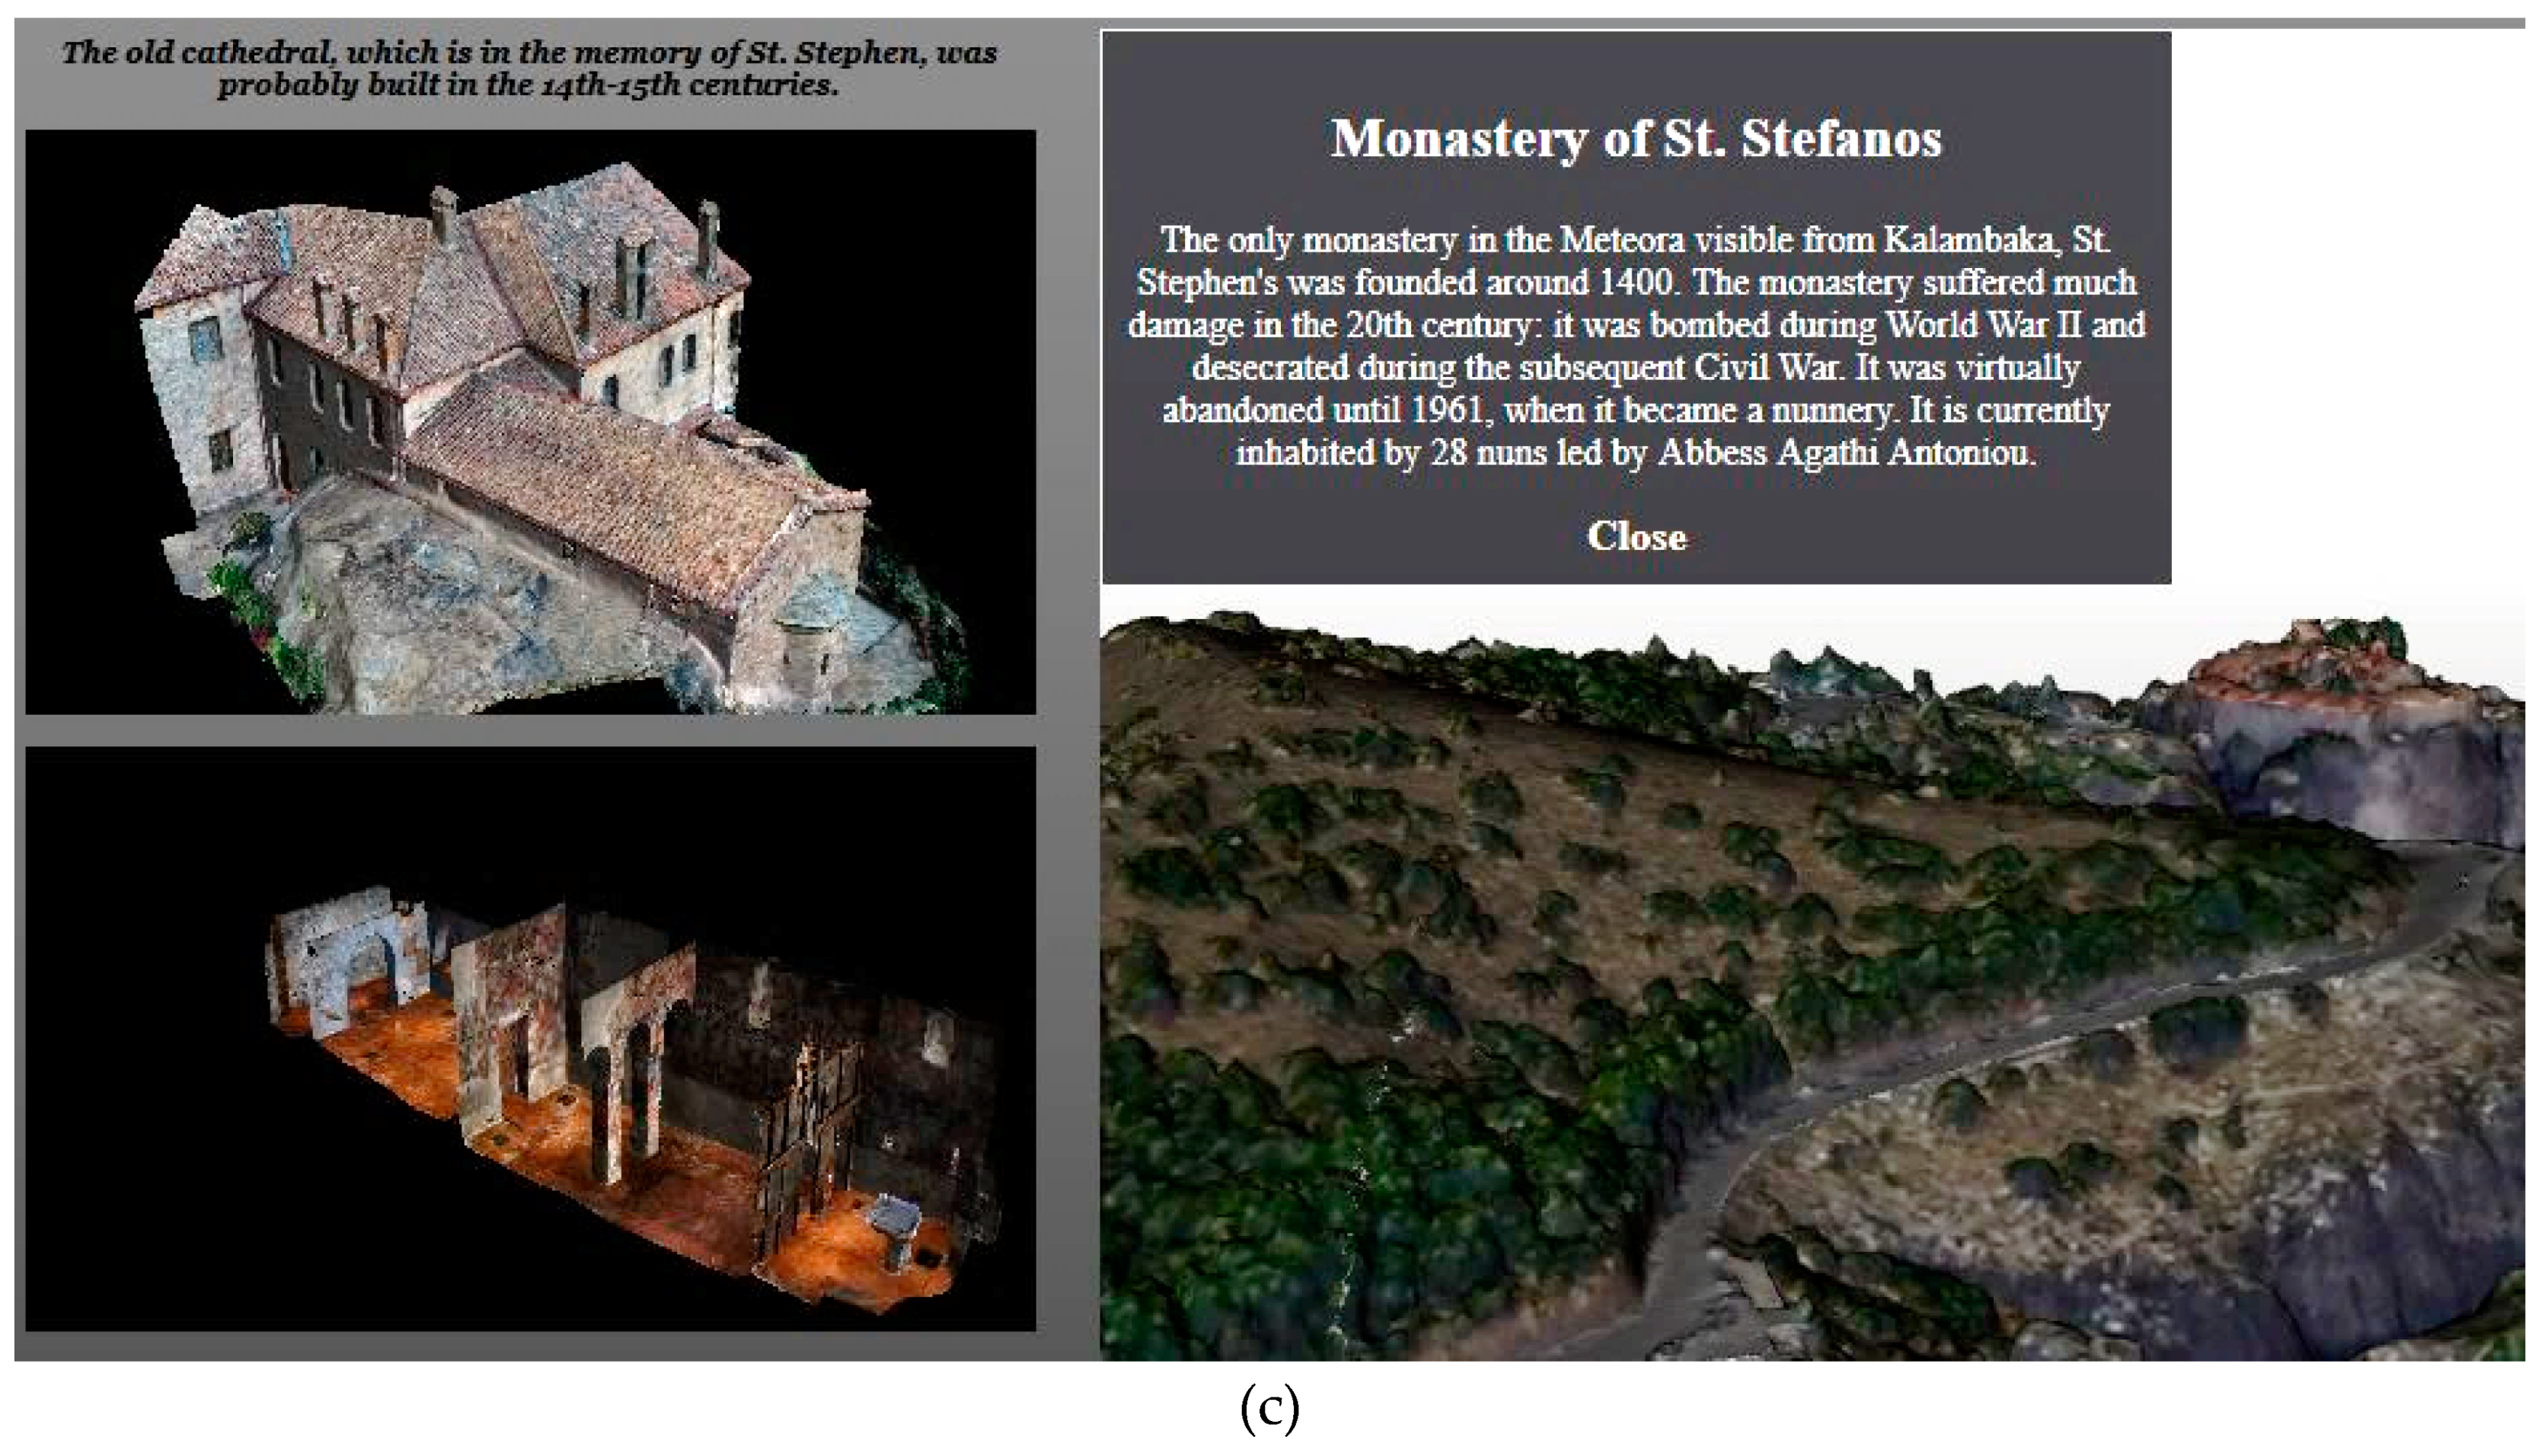
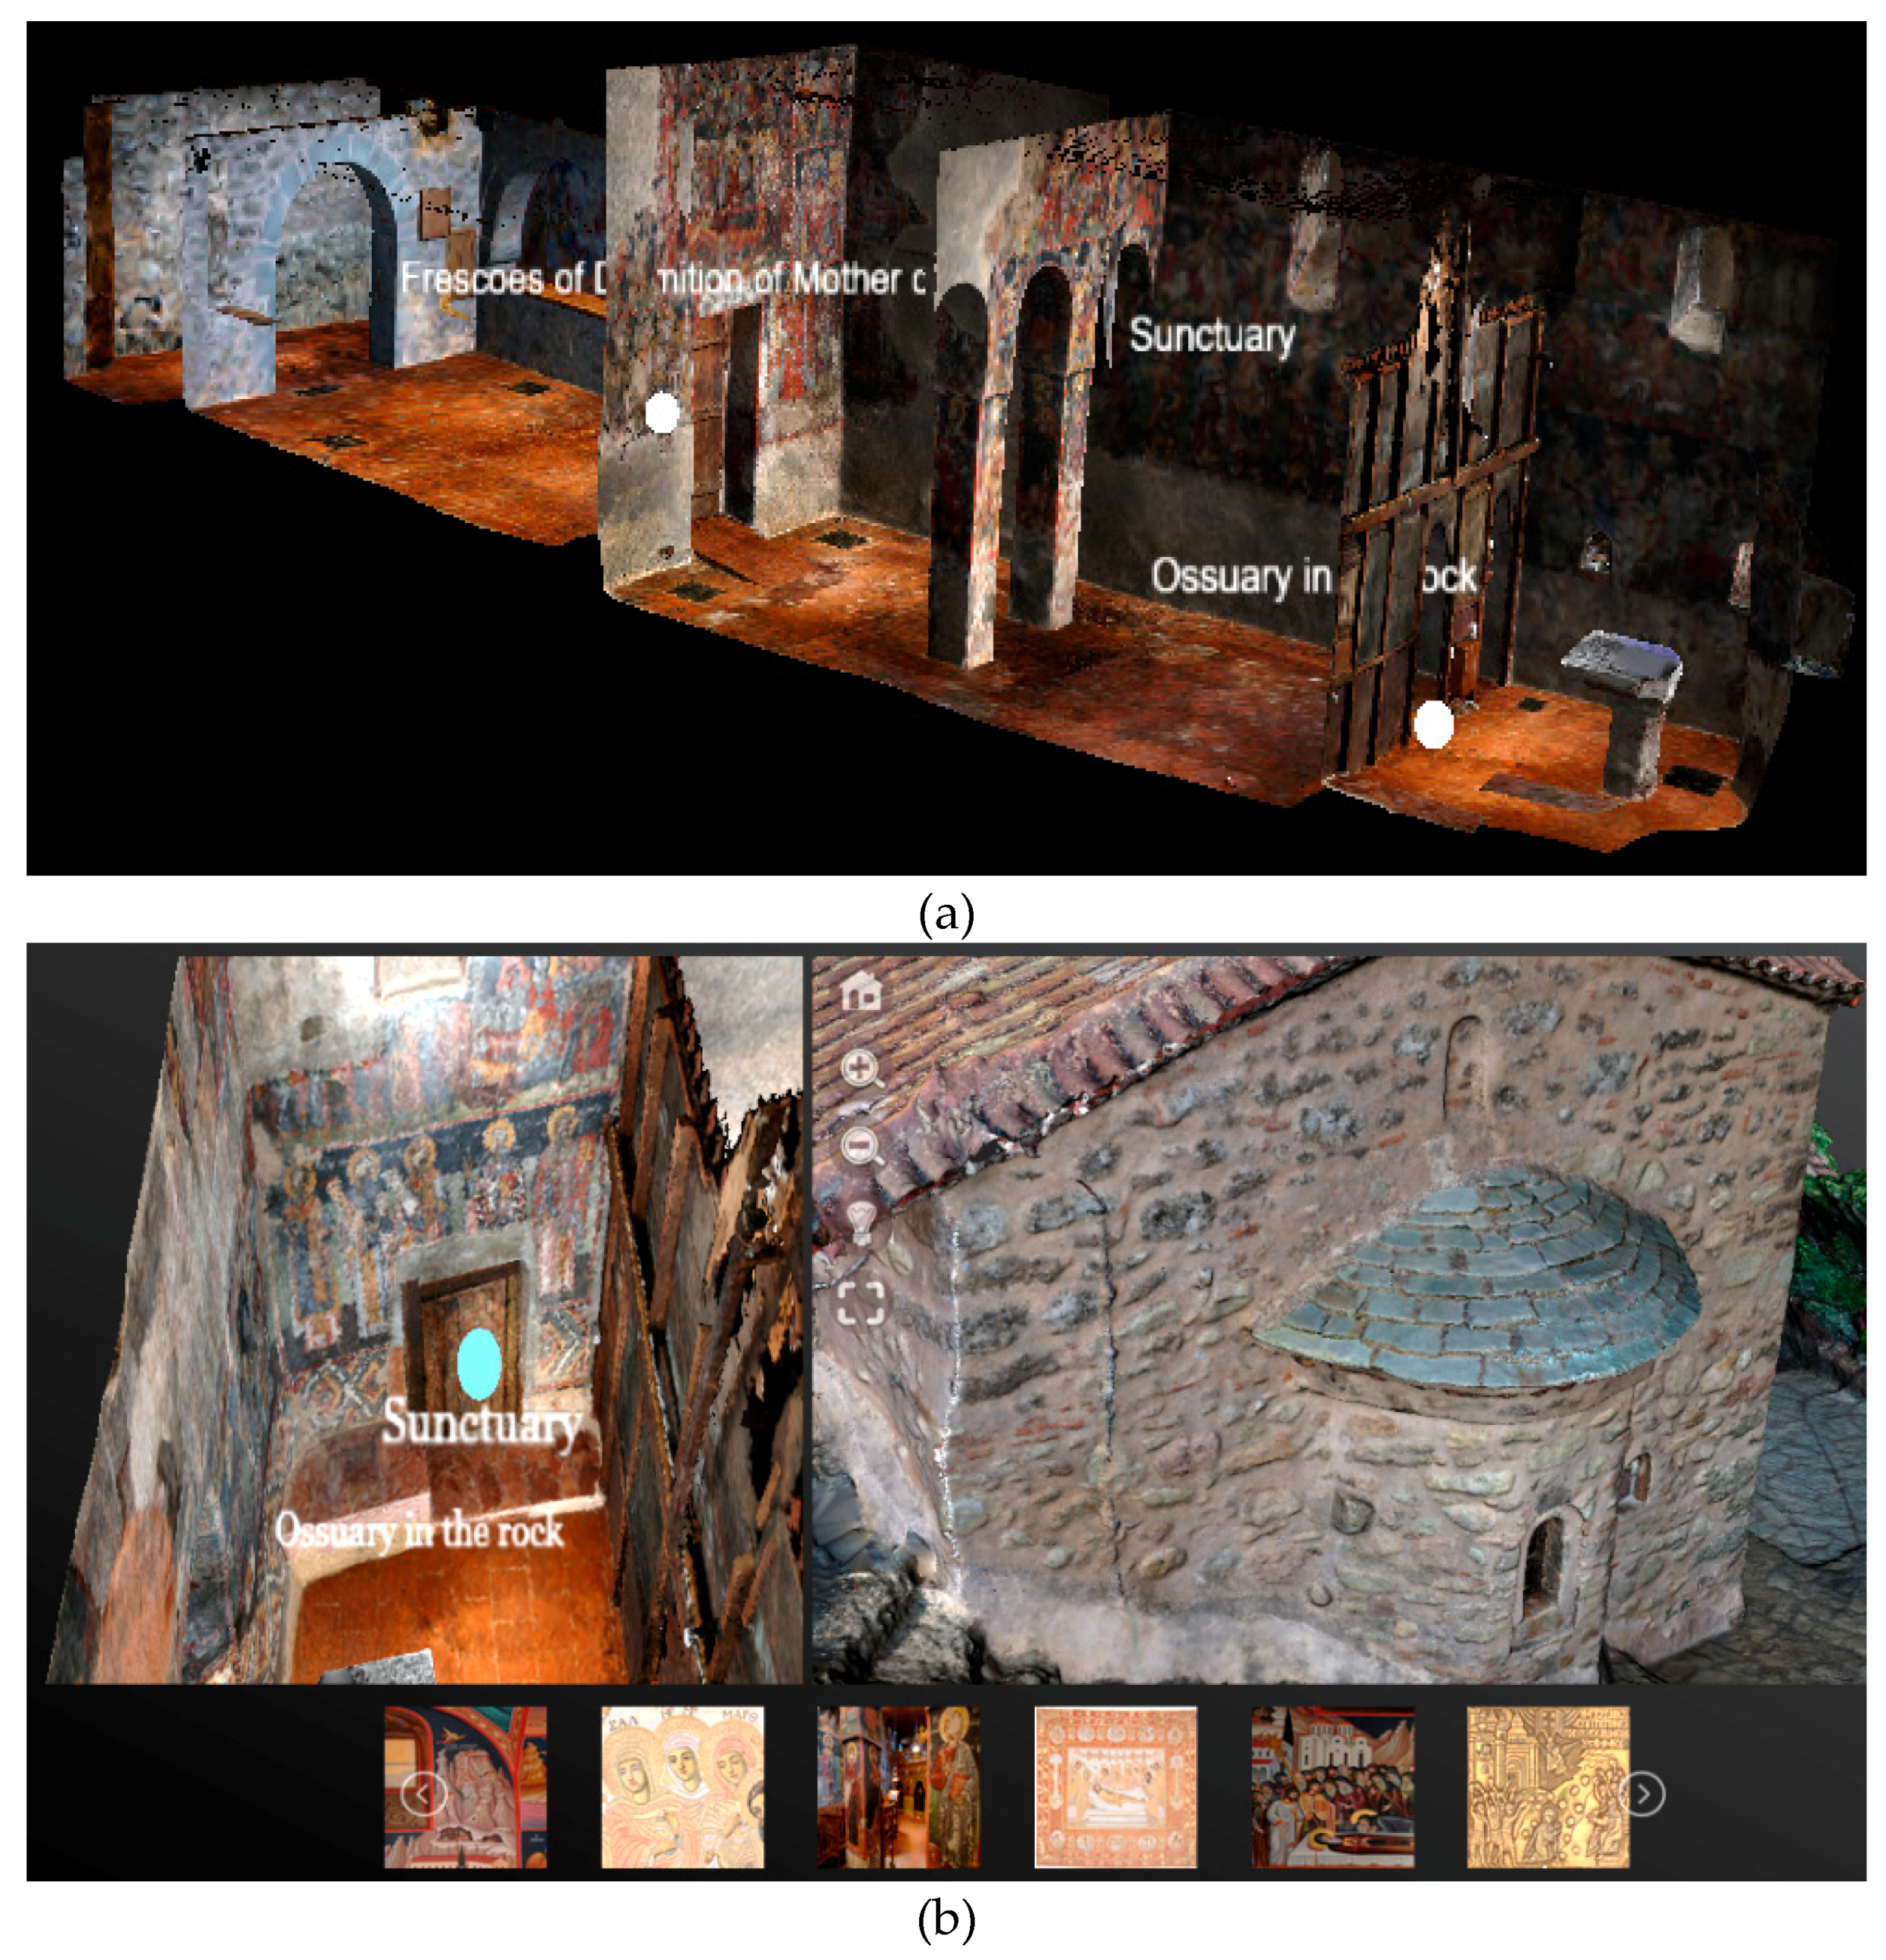
Table 1.
Characteristics of the 3D models that are integrated in the web platform.
| Meteora | Pixari | Interior of St. Stephen | Exterior of St. Stephen | |
|---|---|---|---|---|
| Geometry | 75M faces 40M vertices | 17M faces 7M vertices | 32M faces 17M vertices | 46M faces 23M vertices |
| RGB data | Color per vertex | Texture mapping | Color per vertex | Color per vertex |
| Format | ply | obj | ply | ply |
| Original size | 2.37 GB | 354 MB | 650 MB | 914 MB |
Table 2.
Comparing 3D platform’s pages loading time on three major browsers.
| Browser | Homepage | Subpage 1 | Subpage 2 |
|---|---|---|---|
| Google Chrome 77 | 4.98 s | 1.50 s | 3.87 s |
| Microsoft Edge 44 | 4.93 s | 1.31 s | 3.94 s |
| Mozilla Firefox 69 | 4.80 s | 1.36 s | 3.73 s |
© 2019 by the authors. Licensee MDPI, Basel, Switzerland. This article is an open access article distributed under the terms and conditions of the Creative Commons Attribution (CC BY) license (http://creativecommons.org/licenses/by/4.0/).
Share and Cite
MDPI and ACS Style
Boutsi, A.-M.; Ioannidis, C.; Soile, S. An Integrated Approach to 3D Web Visualization of Cultural Heritage Heterogeneous Datasets. Remote Sens. 2019, 11, 2508. https://0-doi-org.brum.beds.ac.uk/10.3390/rs11212508
AMA Style
Boutsi A-M, Ioannidis C, Soile S. An Integrated Approach to 3D Web Visualization of Cultural Heritage Heterogeneous Datasets. Remote Sensing. 2019; 11(21):2508. https://0-doi-org.brum.beds.ac.uk/10.3390/rs11212508
Chicago/Turabian StyleBoutsi, Argyro-Maria, Charalabos Ioannidis, and Sofia Soile. 2019. "An Integrated Approach to 3D Web Visualization of Cultural Heritage Heterogeneous Datasets" Remote Sensing 11, no. 21: 2508. https://0-doi-org.brum.beds.ac.uk/10.3390/rs11212508
Note that from the first issue of 2016, this journal uses article numbers instead of page numbers. See further details here.