1. Introduction
The city of Zaruma is in the foothills of the Vizcaya Mountain Range of the Northern Andes, in the south of Ecuador; see
Figure 1.
Its relief is very irregular, with high areas dissected by deep valleys and canyons, and several rivers, such as Salvias, Ortega, Amarillo and El Salado river. Mining exploitation has a history cataloged since before the conquest of America. The city located within the Puyango river basin has provided abundant gold reserves. According to data from the Mining Regulation and Control Agency (ARCOM), 288,000 tons of quartz is extracted annually with an average of 4 grams of gold per ton, reaching a production of 1152 kilos of gold per year. [
1].
One of the hazards for the city caused by underground mining is related to the old abandoned galleries and pikes carried out by illegal miners, which is causing the sinking of the land and the collapse of the buildings in the urban area of the city.
Recently, in the years 2016 and 2019, considerable subsidence has occurred in some parts of the city, such as the city hospital, Gonzalo Pizarro Street, Fe y Alegría-La Inmaculada, subsidence that was detected in several studies conducted in previous decades [
2,
3].
The abandoned galleries and without technical closure, as well as the illegal pickets possibly caused the sinks dating from 2001 in several places such as in the sports coliseum, the municipal swimming pool, the Immaculate School, Gonzalo Pizarro Street, Zambrano Street, Colon, the city hospital among other sectors.
The sinking ground is a very common phenomenon around mining operations of underground exploitation. This subsidence is causing difficulties in the socio-economic development of Zaruma city and has directly endangered homes, buildings of the municipal basic services, educational centers, roads and uninterrupted environmental systems, including the possible loss of human lives.
Here, the importance of monitoring the subsidence of the relief in the colonial area of the city is born; monitoring that will strengthen the appropriate municipal ordinances for the protection of the population, the city and the environment.
The measurements of the subsidence of the relief are generally carried out punctually, with traditional methods, mainly by leveling the relief in static and dynamic GPS networks with the difficulty of obtaining regional and continuous sinking trends. A regional survey by leveling the relief with these traditional methods would imply onerous economic expenses. On the other hand, the surface of the soil induced by the excavations of mining galleries without pillars that support the weight of the soil load and the eroded rock,
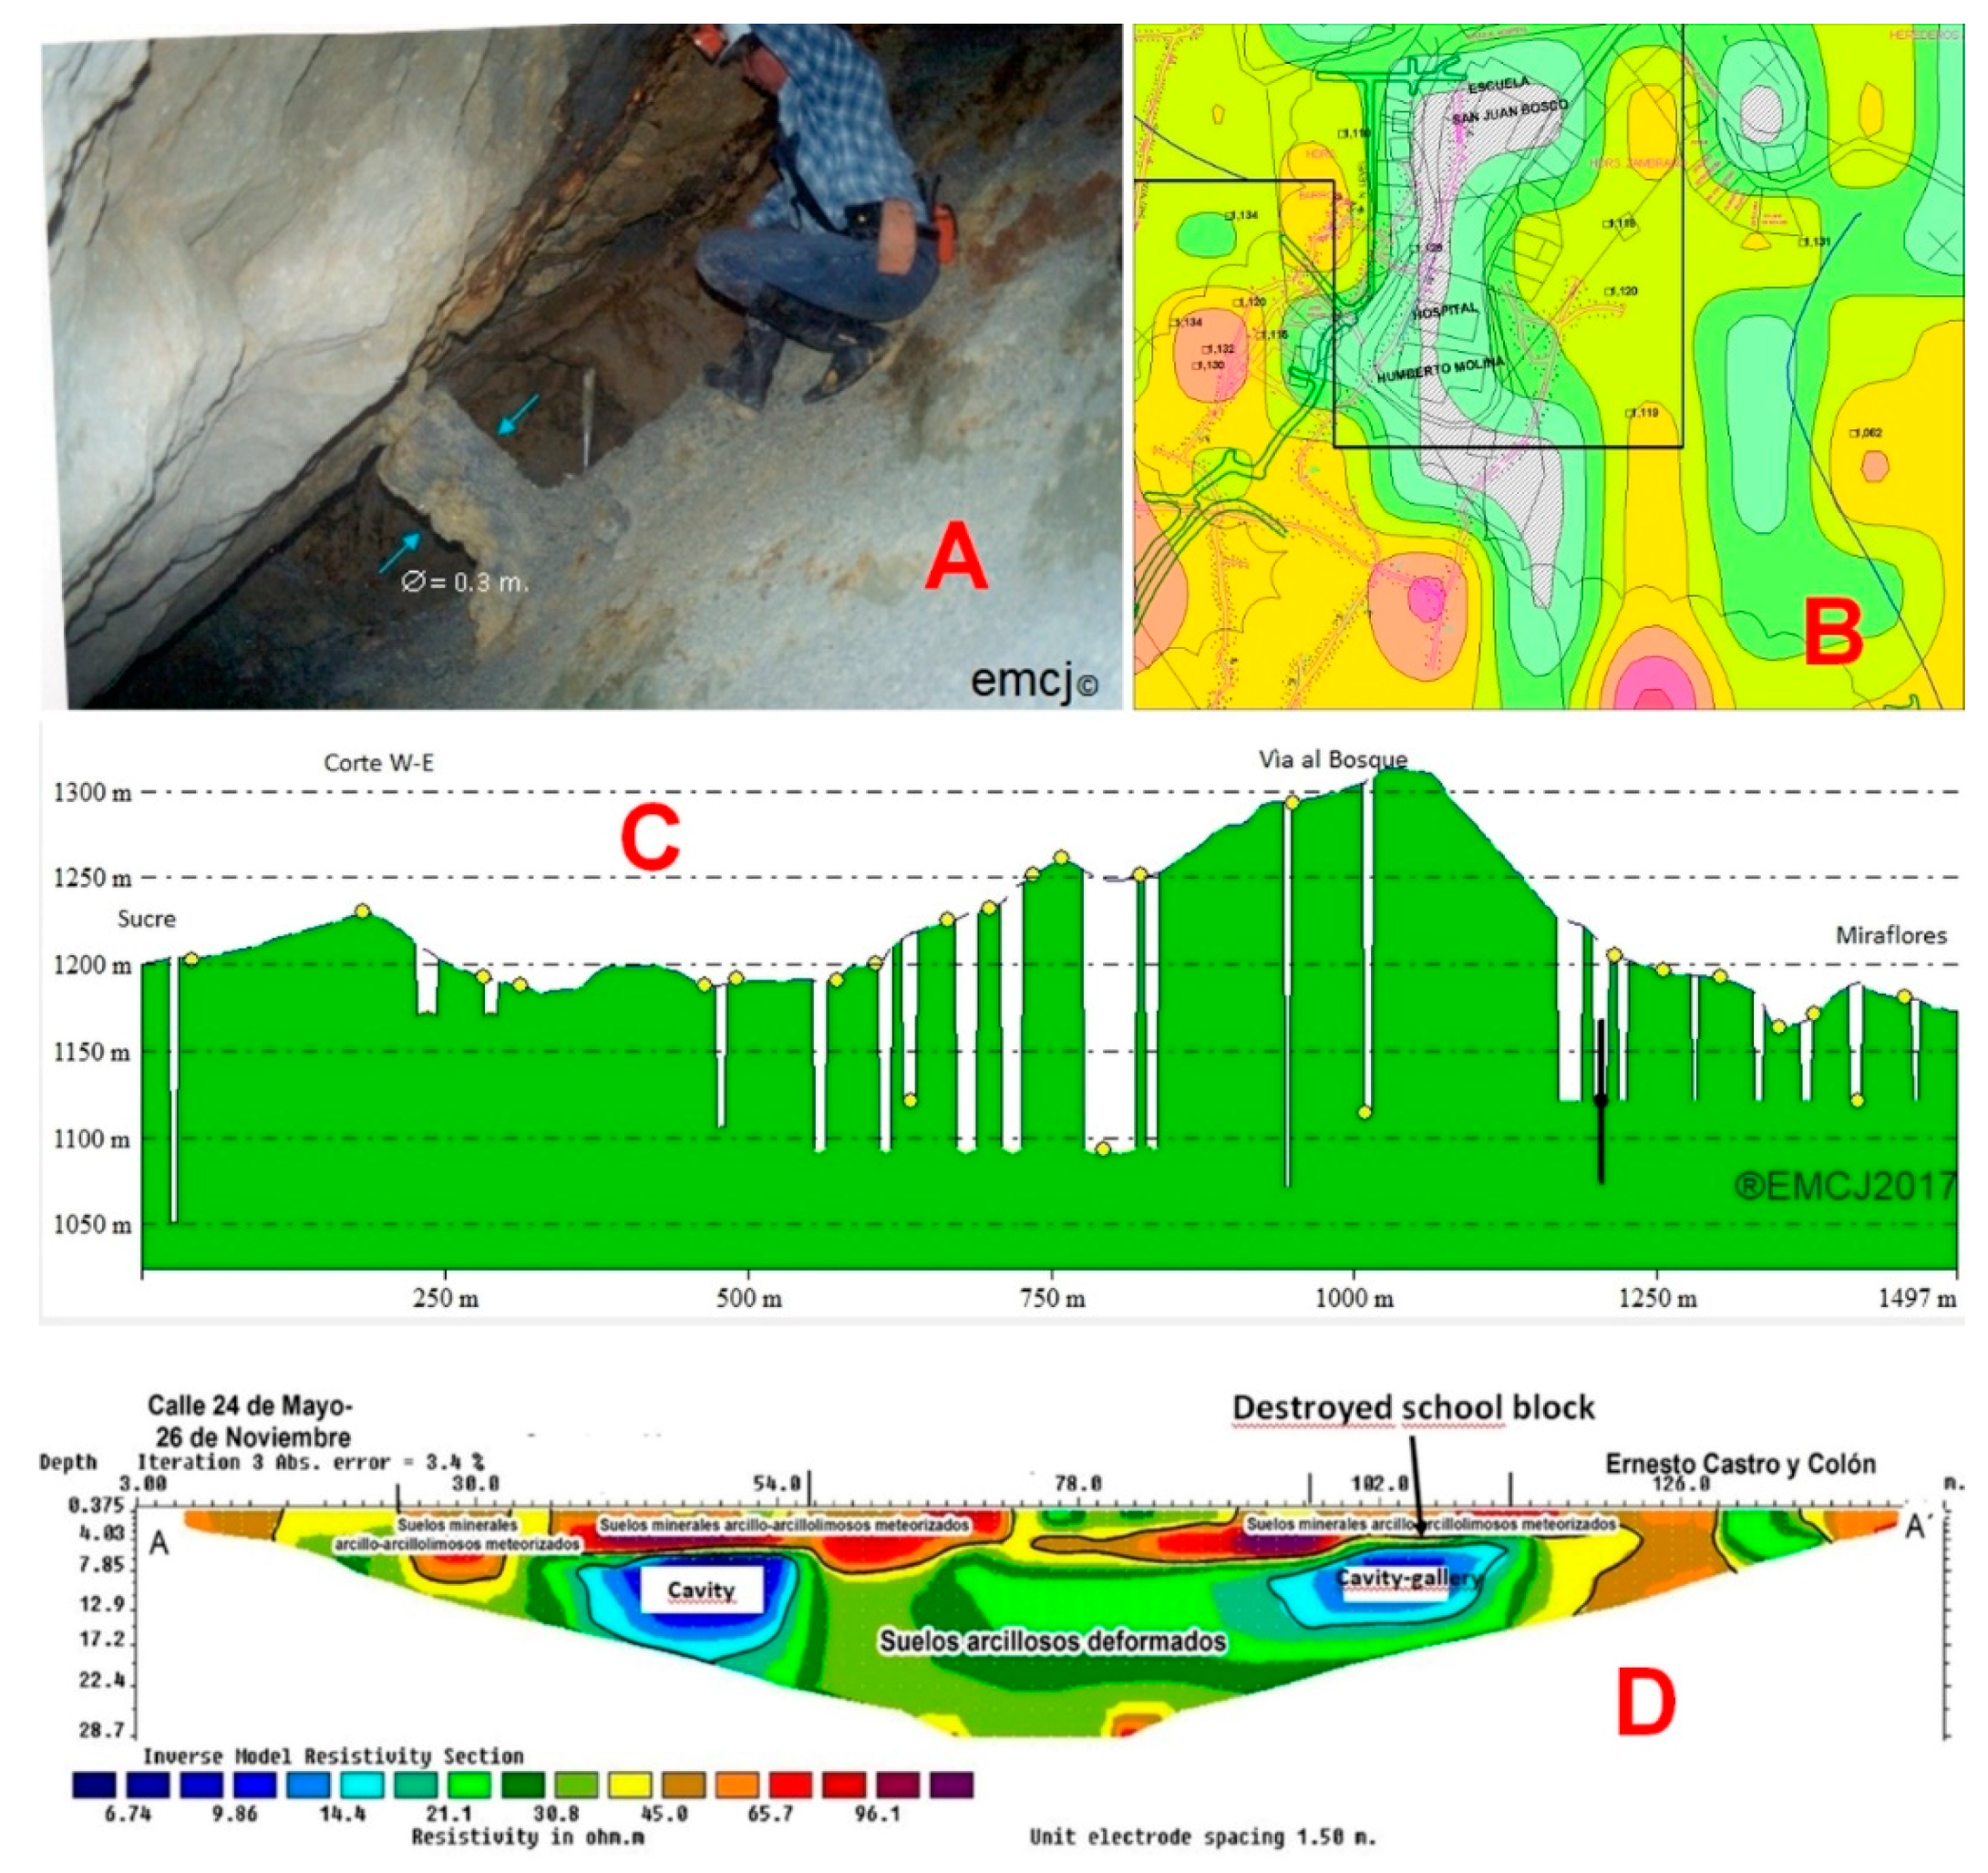
Figure 2(A), has exposed the buildings of the city to deformations and collapse of its structure, as several studies show, carried out since 2001 [
2].
In particular, the stress efforts caused by the bending and cutting component of these deformations have damaged the building materials making them almost fragile. These ground deformations and subsidence were verified in 2001 by inspecting the underground mining galleries, in addition to the geological characterization, without using the DInSAR technique, which did not exist at that time. The technique used and developed was the analysis of flow patterns and morphological rupture lines, developed by the authors of this article, and topographic–geological information of each gallery investigated by ex-National Directorate of Geology, National Directorate of Geology [
2,
3,
4], among researchers. An example of the state of deformation in 2001 can be seen in
Figure 2B in the hospital sector of the city Humberto Molina and the San Juan Bosco school, where there is a anthropogenic subsidence zone (area with black slanted lines), caused by the mining galleries represented by green and cyan lines.
A topographic profile W–E from Sucre Street to Miraflores Street, is presented,
Figure 2C, from the surface to the top of the inventoried mining galleries at that time. This topographic profile shows the intensity of subsidence caused by the underground galleries. The last study carried out by the Secretariat of Risk Management by means of electrical tomography of the subsoil in 2016, verified that the areas susceptible to subsidence detected in the previous decade were activated and caused the collapse of the La Inmaculada-Fé y Alegría School. Subsequently in 2019, subsidence occurred on 24 May and 26 November on Ernesto Castro, Colon and Gonzalo Pizarro Streets. Subsidence that were previously detected,
Figure 2D.
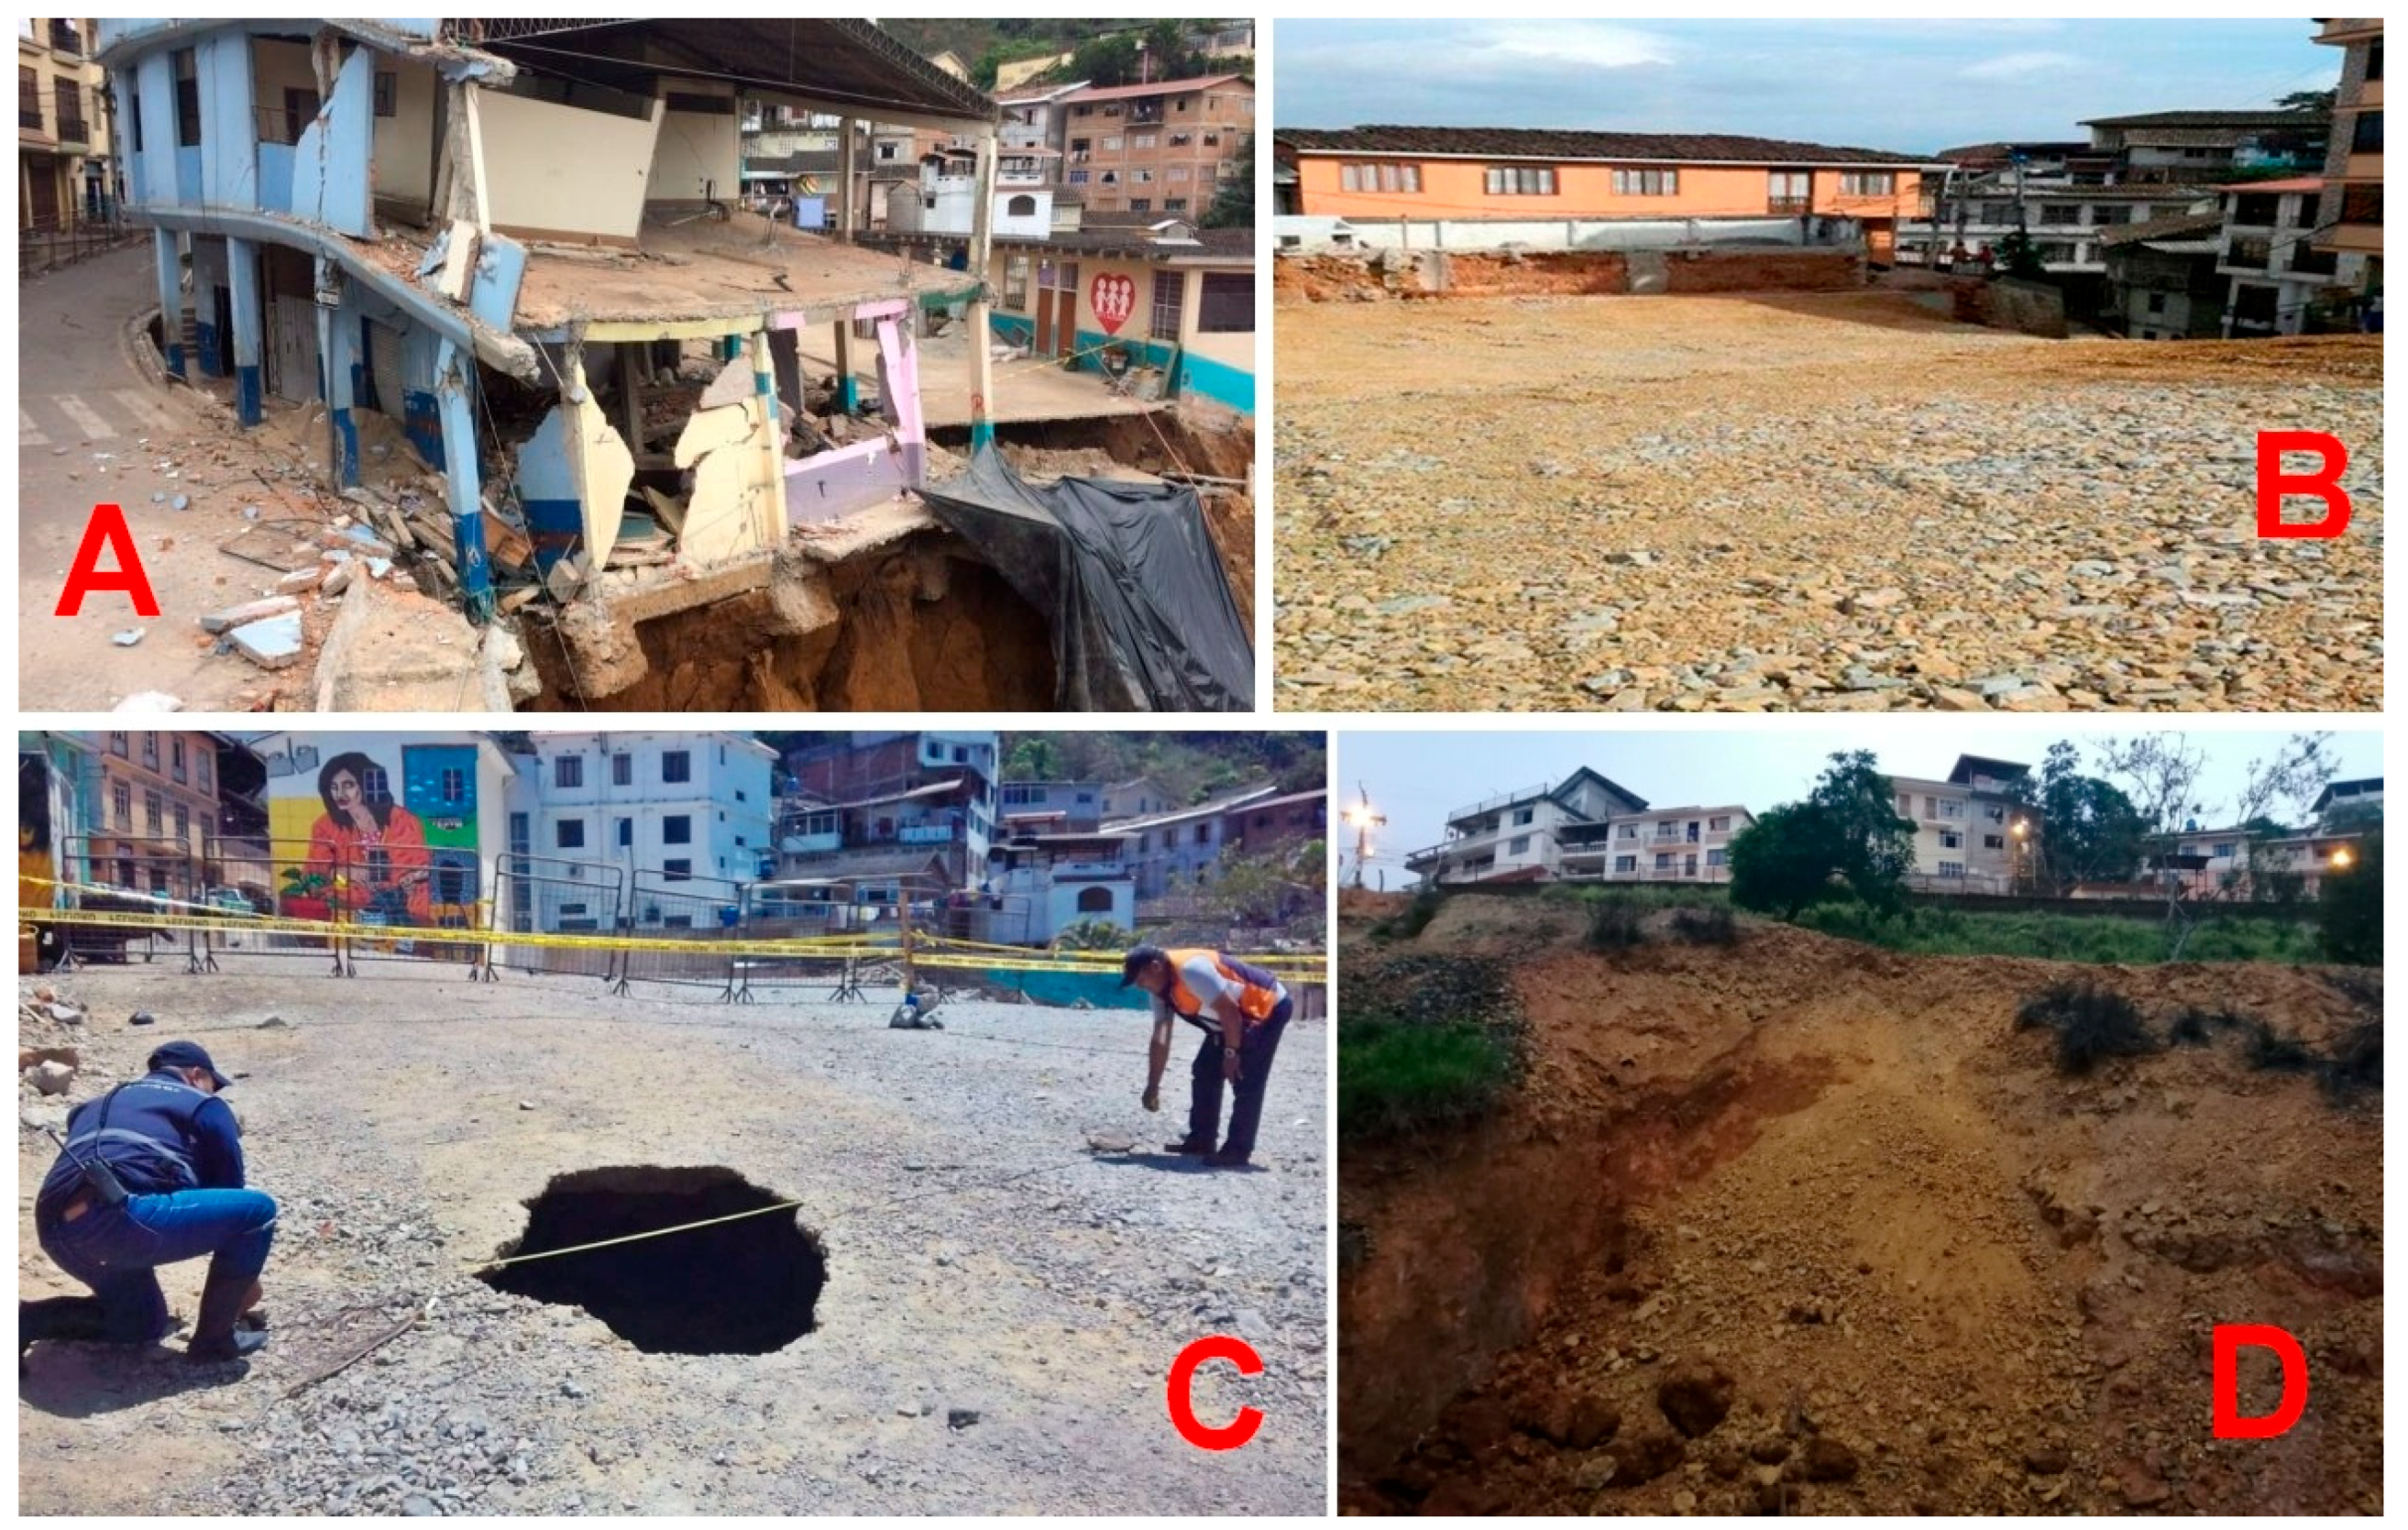
In December 2016, the Immaculate School-Fe y Alegría, completely collapsed possibly due to being in an old gallery and in illegal exploitation, which sank the ground, as determined by several recent technical reports [
3]. The classroom block collapsed as its foundations sank, and consequently the structures fractured and collapsed.
Figure 3 shows the collapse of the school in October 2016 (A), the technical filling done in 2017 (B), the new collapse in the same place (C) and the new collapse in the Gonzalo Pizarro Street sector (D), which occurred in 2019.
The Zaruma canton is developed on the External Slopes of the Western Cordillera, it presents diversified reliefs on ancient volcanic materials, with partial pyroclastic coverage. The city is located on an andesitic–porphyritic volcano-sedimentary series mineralized with metallic sulfides deformed by granodioritic and tonalitic intrusive [
5].
The Morphology of the Zaruma Canton is characterized by presenting steep slopes, rounded ridges and numerous hills that result from the dendritic pattern of the secondary drains. The heights are between 1150 and 2800 masl. The main drainages of the area are the Río Luís that merge with the Río Salatì and Río Ambocas and which end at the Río Pindo. The Calera River and the Yellow River are also located within the area, which joins a few kilometers before its confluence with the Pindo River that forms the Puyango River downstream. There are numerous relatively large streams. The predominant geoform of the area corresponds to heterogeneous slopes, with medium to strong slopes (>25–40%), relative differences between 200 and 300 m, the drainage density is little dissected, with long lengths greater than 500 m.
Structural lineaments preferential NW–SE directions are fundamentally found by controlling the drainage pattern in the study area; however, important structures especially in the E–W and N–S direction are controlling the mineralization in the sector and are responsible for the external and internal geodynamic processes, which has caused the deformation of the main existing geoforms in the study area. Local geological faults, fracture systems and joints were considered in the concentration pattern model of this type of guidelines, to determine relief deformations in [
4] and which were verified in the current methodology.
Locally, the study area is located within the Portovelo Unit, exposed in the work of research of the Zaruma geological sheet, scale 1: 100000, prepared by the National Research Geological, Mining, Metallurgical Institute. The mineralization at Zaruma is housed in intermediate to siliceous volcanics of the Portovelo Unit, which is faulty against the metamorphic rocks of the south, along the Piñas-Portovelo geological fault system and discordantly overlaps the El Oro Matamorphic Complex. This Unit, for the most part, is made up of massive porphyry andesitic lavas to andesitic basalts and gaps with intermediate tuffs. There are also rhyolitic to dacitic "Ash Flow" type tuffs with intercalations of sedimentary rocks (slates, cherts). The andesitic volcanoes present generalized propylitic alteration to epidote, calcite and chlorite. The main structural geological feature of the region is the Piñas-Portovelo fault / thrust system, E–SW direction, which has a great descent in the North block and separates the Saraguro group from the El Oro Metamorphic Complex. The metamorphic rocks of the basement, along this fault system, have been cataclysmically deformed and brecciated [
6].
The city has a mining exclusion area, declared EMERGENCY RESOLUTION No. SGR-029-2015, which encloses the colonial center of the city and is the internal limit where it is prohibited to carry out mining work that has not been respected. When the underground mining works and galleries enter the exclusion zone, exploiting and chasing the veins laden with gold, after a while, they abandon those "pikes" without any technical closure, leaving gaps below the surface that have collapsed after several years of settlement. This has caused the collapse of the soil and as in the case of the Fe y Alegría-la Immaculada School, causing a sinkhole that was initially 10 m deep and currently can reach 150 m. Underground galleries in that sector can reach more than 250 meters depth.
The landscape in Zaruma is changing intensely due to the intensification of illegal mining. When galleries are abandoned due to lower ore grade, illegal miners leave the galleries without technical closure, causing the upper layers to collapse. This sinking process continues to the surface and eventually causes the ground to sink, fracturing the houses above them.
The consequence of mining exploitation around the veins that have been exploited indiscriminately for decades, has caused new local surface and underground hydrological conditions, which influenced in equilibrium the species of plants, animals and other organisms that occupy those areas that have had to adapt to the new conditions imposed by the limits of urban mining growth, which has put them at the limit of their extinction [
7].
To reduce the threat of subsidence caused by underground mining in this study, in this article, Differential Interferometry techniques used to detect small relief deformations with high precision, using data from the synthetic microwave aperture radar-Synthetic Aperture Radar (SAR) and enhancing the trace or traces of underground galleries that are not found in the mining cadaster of the sector and that are possibly the cause of the collapses in various sectors of the city.
In recent years, DInSAR Differential Interferometry has been used to measure relief deformations very effectively based on large stacks of SAR images, unlike the two classic images used in standard InSAR configurations [
8].
The state of the art of DInSAR techniques that make use of the data acquired by spatial SAR sensors exploit the information contained in the radar phase of complex SAR images acquired at different times over the same area. Several studies have contributed to improve the spatial location of subsidence by excavation of tunnels that cause the desiccation of aquifers by underground mineral extraction [
9].
The DInSAR technique and its applications have been documented in several articles in high-level scientific journals such as Nature and Science, where it has contributed in different fields of Geosciences such as seismology, with important scientific achievements, including coseismic and post-seismic analysis before the occurrence of an earthquake. Volcanology is another important field of application, with several studies of volcanic deformation (deflation and elevation). These volcanic deformations have allowed determining the possible origins of secondary lahars as can be seen in [
10].
The DInSAR analysis on landslides that despite being an important application for the location and reduction of these events, according to several researchers, the DInSAR analysis has less efficient results, mainly due to the loss of coherence due to its heterogeneous character in its composition. Despite this, with the Persistent Scatterers-PS dispersion technique, the geometry of some types of landslides can be determined with good results. The most relevant results are described in [
10]. In the case of subsidence and ground lift, the DInSAR analysis has obtained efficient results in several parts of the world that have been described in specialized journals. It has been demonstrated as tunnels and underground galleries that have unbalanced the water systems of the surface runoff as well as the groundwater flow systems, causing the destruction of the buildings on the surface. Other subsidence processes worldwide have been investigated for other factors such as fluid pumping, construction work, geothermal activity, etc. [
11]. In most of the published results that refer to urban areas, the DInSAR data is consistent even in long periods, due to the existence of static artificial reflectors such as buildings and other reinforced concrete structures that remain stable. With the advent of Persistent Scatterers techniques with high and pseudo coherence, more efficient results have been obtained to monitor deformations of the relief outside urban, suburban and industrial areas [
12,
13,
14,
15,
16,
17,
18,
19,
20,
21,
22,
23,
24].
In Ecuador, there are few studies using SAR images, InSAR methodologies and their variants. In 1977 the Ecuadorian Government created the Center for Integrated Surveys of Natural Resources by Remote Sensors (CLIRSEN), a technological and scientific entity aimed at integrating the most advanced technologies related to Geodesy, Natural Resources, Environment, Cadaster, Geographic Information Systems (SIG), Software. Clirsen, used radar images of lateral vision and of real opening (SLAR), acquired by the oil companies in the Amazon region and the first semi-controlled mosaic of Radar Aero transported synthetic opening (SAR), images taken for the exploration of oil fields in 1982.
Subsequently, the Ecuadorian Space Institute replaces Clirsen Center and in 2013 the first InSAR analysis project with Cosmo-SkyMed images is carried out within the Space and Geophysics Technology project in risk management external geodynamics for prevention and mitigation of floods and torrential floods [
25]. This was the first project that the regent institution in remote sensing executed in the country. In 2014, one of the first projects of soil deformation analysis was carried out using the DInSAR technique in a mountainous region of the Andean region. This work was done with Roi-Pac software with very good results [
26]. Since 2016, after the destructive earthquake of 7.8 Mw on the Ecuadorian coast that caused more than 600 deaths and economic losses of more than 3 miles million dollars, the Risk Management Secretariat, implemented the deformation zone analysis project in the country, using the InSAR methodology.
The authors of this article have developed some projects using the InSAR methodology with a pair of Sentinel images and with piles images to determine deformations of the ground in the Fuego volcano in Guatemala, subsidence in Zaruma, neighborhood in Quito city and combined InSAR analysis with geomorphological, geophysical and geotechnical methods in Manta and Portoviejo cities as can be seen in the articles [
27].
The following is a summary of obtaining the Interferometric Phase: The Radar System of Synthetic Opening-SAR, allow the obtaining of images of the reflectivity of the ground, which are subsequently processed by InSAR (Interferometry SAR) techniques for the generation of precise maps of soil deformation. The technology (InSAR) or SAR Interferometry is the technique that is based on the study of the phase interference pattern of the waves of two SAR images to generate maps of displacements of the topographic relief, and digital models of terrain elevation [
28]. With this technique, it is possible to determine, displacements of the topographic relief, in mm/year of large extensions of the topographic relief, without the need for field measurements and at low cost. [
29]. This technique can also provide more data to understand the geomorphological evolution of the site. An antenna of synthetic or virtual opening consists of a vector of successive and consistent signals of radar that are transmitted and received by a small antenna that moves along a certain flight or orbit path. The signal processing uses the magnitudes and phases of the signal received on successive pulses to create an image [
30]. From interferometry, the data obtained are the distances between the satellite and the ground area, calculated by the measurement of times and lags. The main platforms that use Radar Synthetic Aperture are shown in
Table 1 [
31].
If at least two observations of the same site are obtained from space at different times, the "interferometric phase" is directly proportional to any change in the range of topographic relief characteristics.
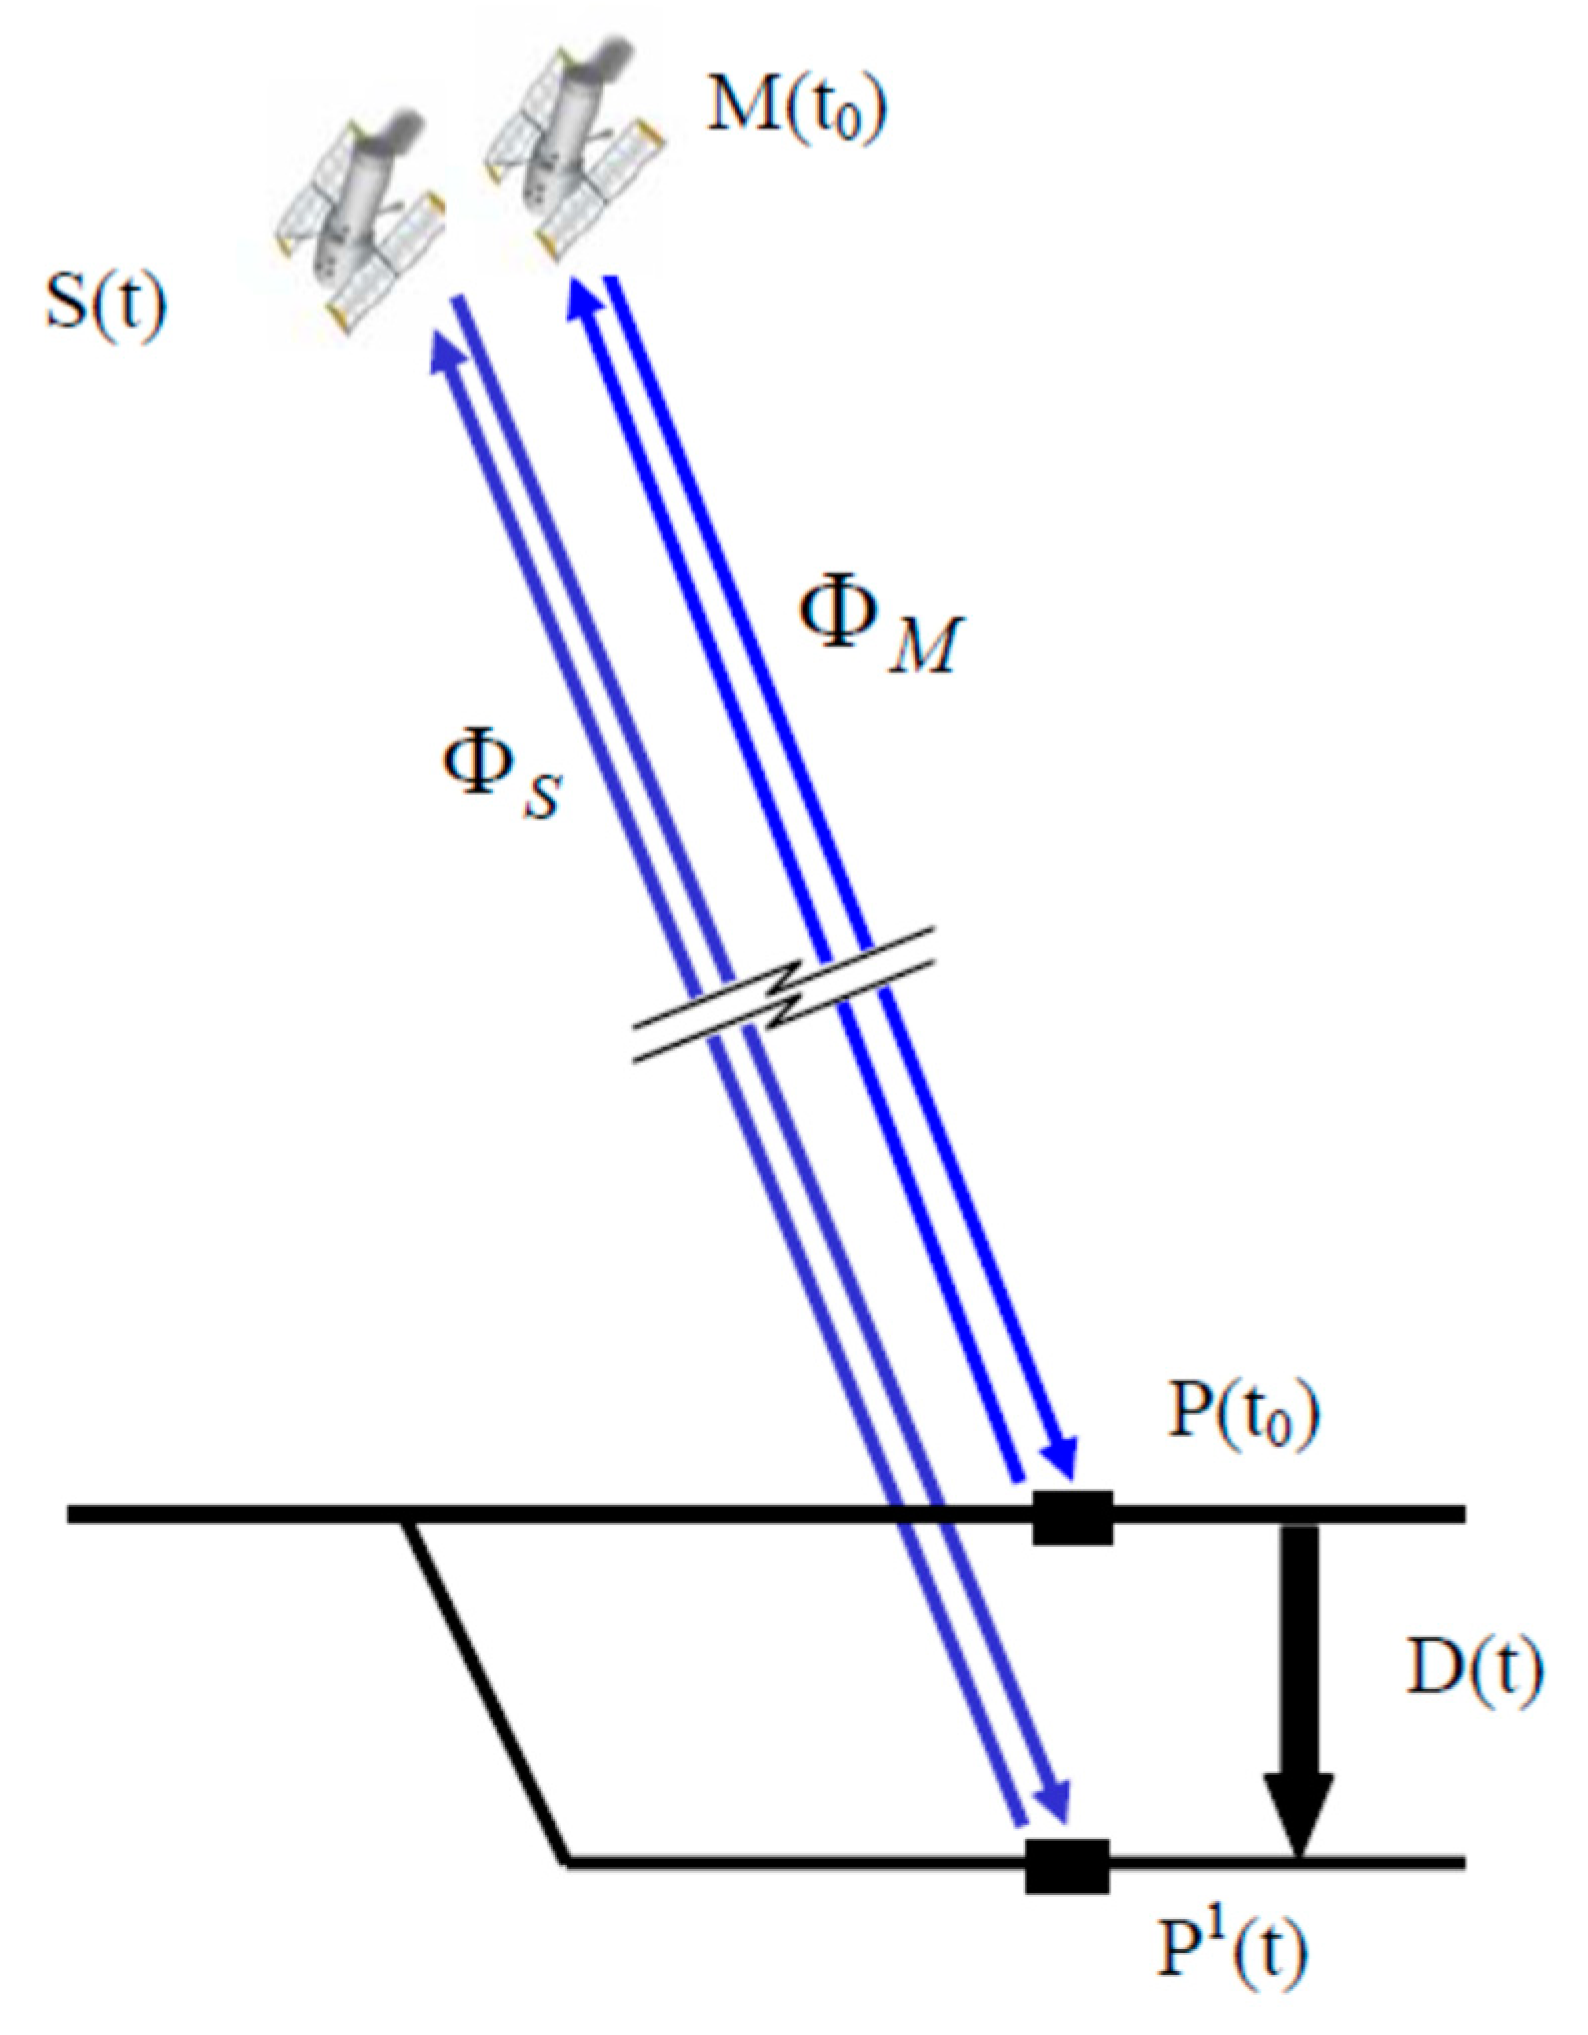
In reference to
Figure 4 for the acquisition of an interferogram, have followed what M. Crosetto et al., describes about the basic principles of Interferometry from the Synthetic Aperture Radar (SAR) [
30].
At time t
0, the sensor obtains a first SAR image, measuring the phase Φ
M (Equation (1)), an image called master, M. If a deformation of the ground D occurs, over a time, point P moves to P
1. Subsequently, the satellite obtains a second image at time t, and measures the phase Φ
S. This image is called slave, S. The InSAR technique calculates the phase difference between Φ
S and Φ
M, a difference called interferometric phase ΔΦ
Int.
In this study, the DInSAR methodology has been used to determine this type of deformation movement and is an ideal tool to monitor the sinking of the topographic relief in large areas and for prolonged periods, with a high precision of a few millimeters to centimeters per square kilometer. Sentinel images in the C band, were used to determine the deformation and accumulated displacement over a period from 2016 to 2019 [
27]. A period in which subsidence occurred as mentioned above.
To study the local subsidence of the soil processed a multitemporal series of interferograms in the C band with one stack of Sentinel 1 images before the collapse of the Fe y Alegría-La Immaculada School and after. The results were verified in those sites that have sunk where abandoned and active underground mines are found.
There are historical studies that report severely damaged buildings, possibly due to being in subsidence areas in the Colonial Center of the Zaruma city.
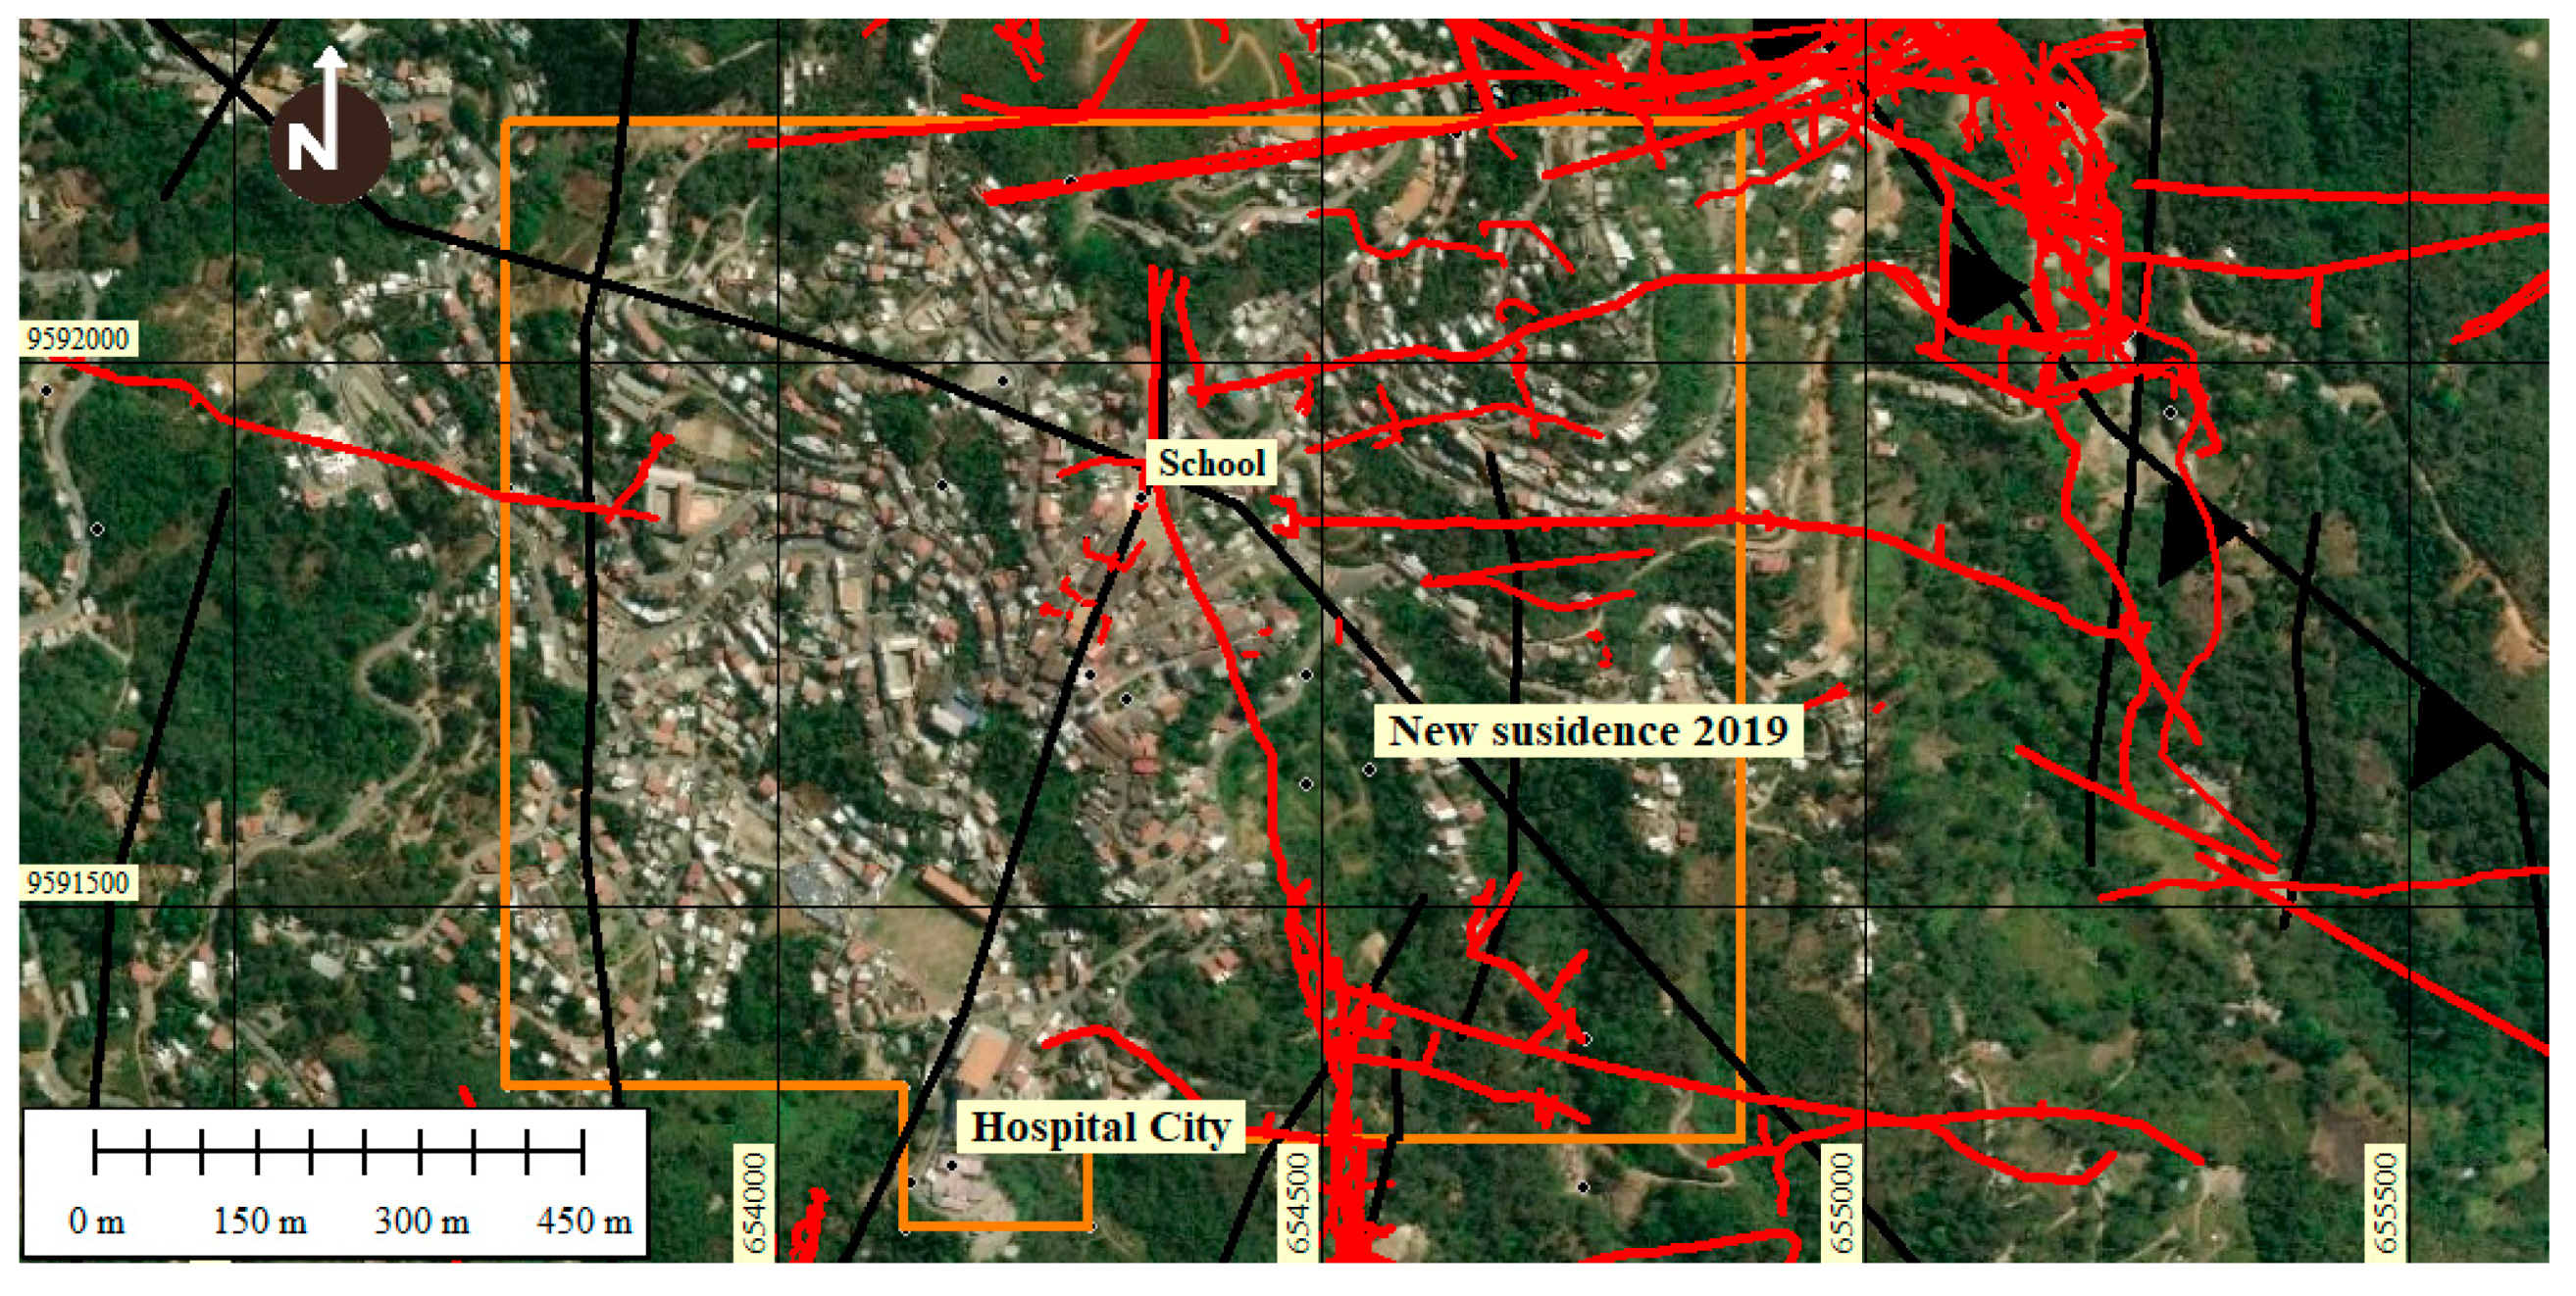
Figure 5 shows the location of the city, the mining exclusion area (ocher color), the underground mining galleries (red lines) in the central part and to the east, the veins and mineralized structures a geological faults (black color lines). In the western part, there are no surveys of mining galleries except for one represented with a red color line (possibly, there is no survey of the mining cadaster in this area).
2. Materials and Methods
Considering that, interferometry can detect minute deformations of the topographic relief with high precision using microwave SAR data. In this article, the DInSAR methodology has been used to determine this type of deformation movement and is an ideal tool to monitor the sinking of the topographic relief in large areas and for prolonged periods of time, with a high precision of a few millimeters to centimeters per square kilometer. Sentinel images in the C band were used to determine the deformation and accumulated displacement over a period from 2016 to 2019 [
16,
17,
18,
19,
20,
21,
22,
23,
24]. A period in which several subsidence occurred as mentioned above. The calculation of the accumulated displacement may have errors due to atmospheric noise, which in this case was reduced with the filter for Atmospheric Phase Screen reduction (APS) tool, to obtain interferograms with high coherence, which guarantees the accumulated displacement results in mm / year. The residual error is 0.1 mm. The displacement is an average within the period studied.
The images were taken from 25 October 2016, before the sinking, until 22 October 2019, and include images from 2016, 2017, 2018, period within which the beginning of the sinking in the school is located (26 October 2016). This allowed us to analyze how the subsidence evolved and determined possible reactivation of the subsidence in the school (22 October 2019), including the new collapse on Gonzalo Pizarro Street in August 2019 (rate +/- 30 mm/year, lifting/sinking).
One of the factors that causes errors in the capture and interpretation of interferograms with InSAR technology is the influence of atmospheric noise.
To avoid the influence of atmospheric noise, the Atmospheric Phase Screen (APS) filter has been applied in SARPROZ, taking into account that in this central area of the city, the vegetation coverage is minimal and is unlikely to cause atmospheric noise that distorts the quality of acquired images. Other sources of noise have been reduced, applying filters using the SARPROZ program. The objective of the reduction of the atmospheric noise is to obtain a high degree of coherence in the results to guarantee that the accumulated values of displacement and velocity have a high correlation with the real local subsidence caused by underground mining.
In this study, the filter for Atmospheric Phase Screen reduction (APS) was used with the persistent dispersion interferometry methodology PS-InSAR, in a Sentinel 1 B multitemporal imaging stack of 20 available images. The PS-InSAR Persistent Scatter is an InSAR processing technique that uses multiple images taken at regular intervals to achieve better measurement results.
The processing of the image stack allowed determining the topographic relief movement, by varying the time phase for each pixel in a time.
The method focuses on finding stable dispersers over time, not influenced by atmospheric noise and providing a stable response signal, which in the case of the city, correspond to artificial structures such as buildings, roads, obelisks, among others structures, called Persistent Scatters (PS) These Dispersers, provide a history of stable phases during the image acquisition time because they do not suffer from temporal correlation, allowing long-term observation and monitoring of the deformation of the sectors in their surroundings.
To analyze the multitemporal displacement of the Fe y Alegría-La Inmaculada School, the available images of Sentinel 1 B, on the stack [
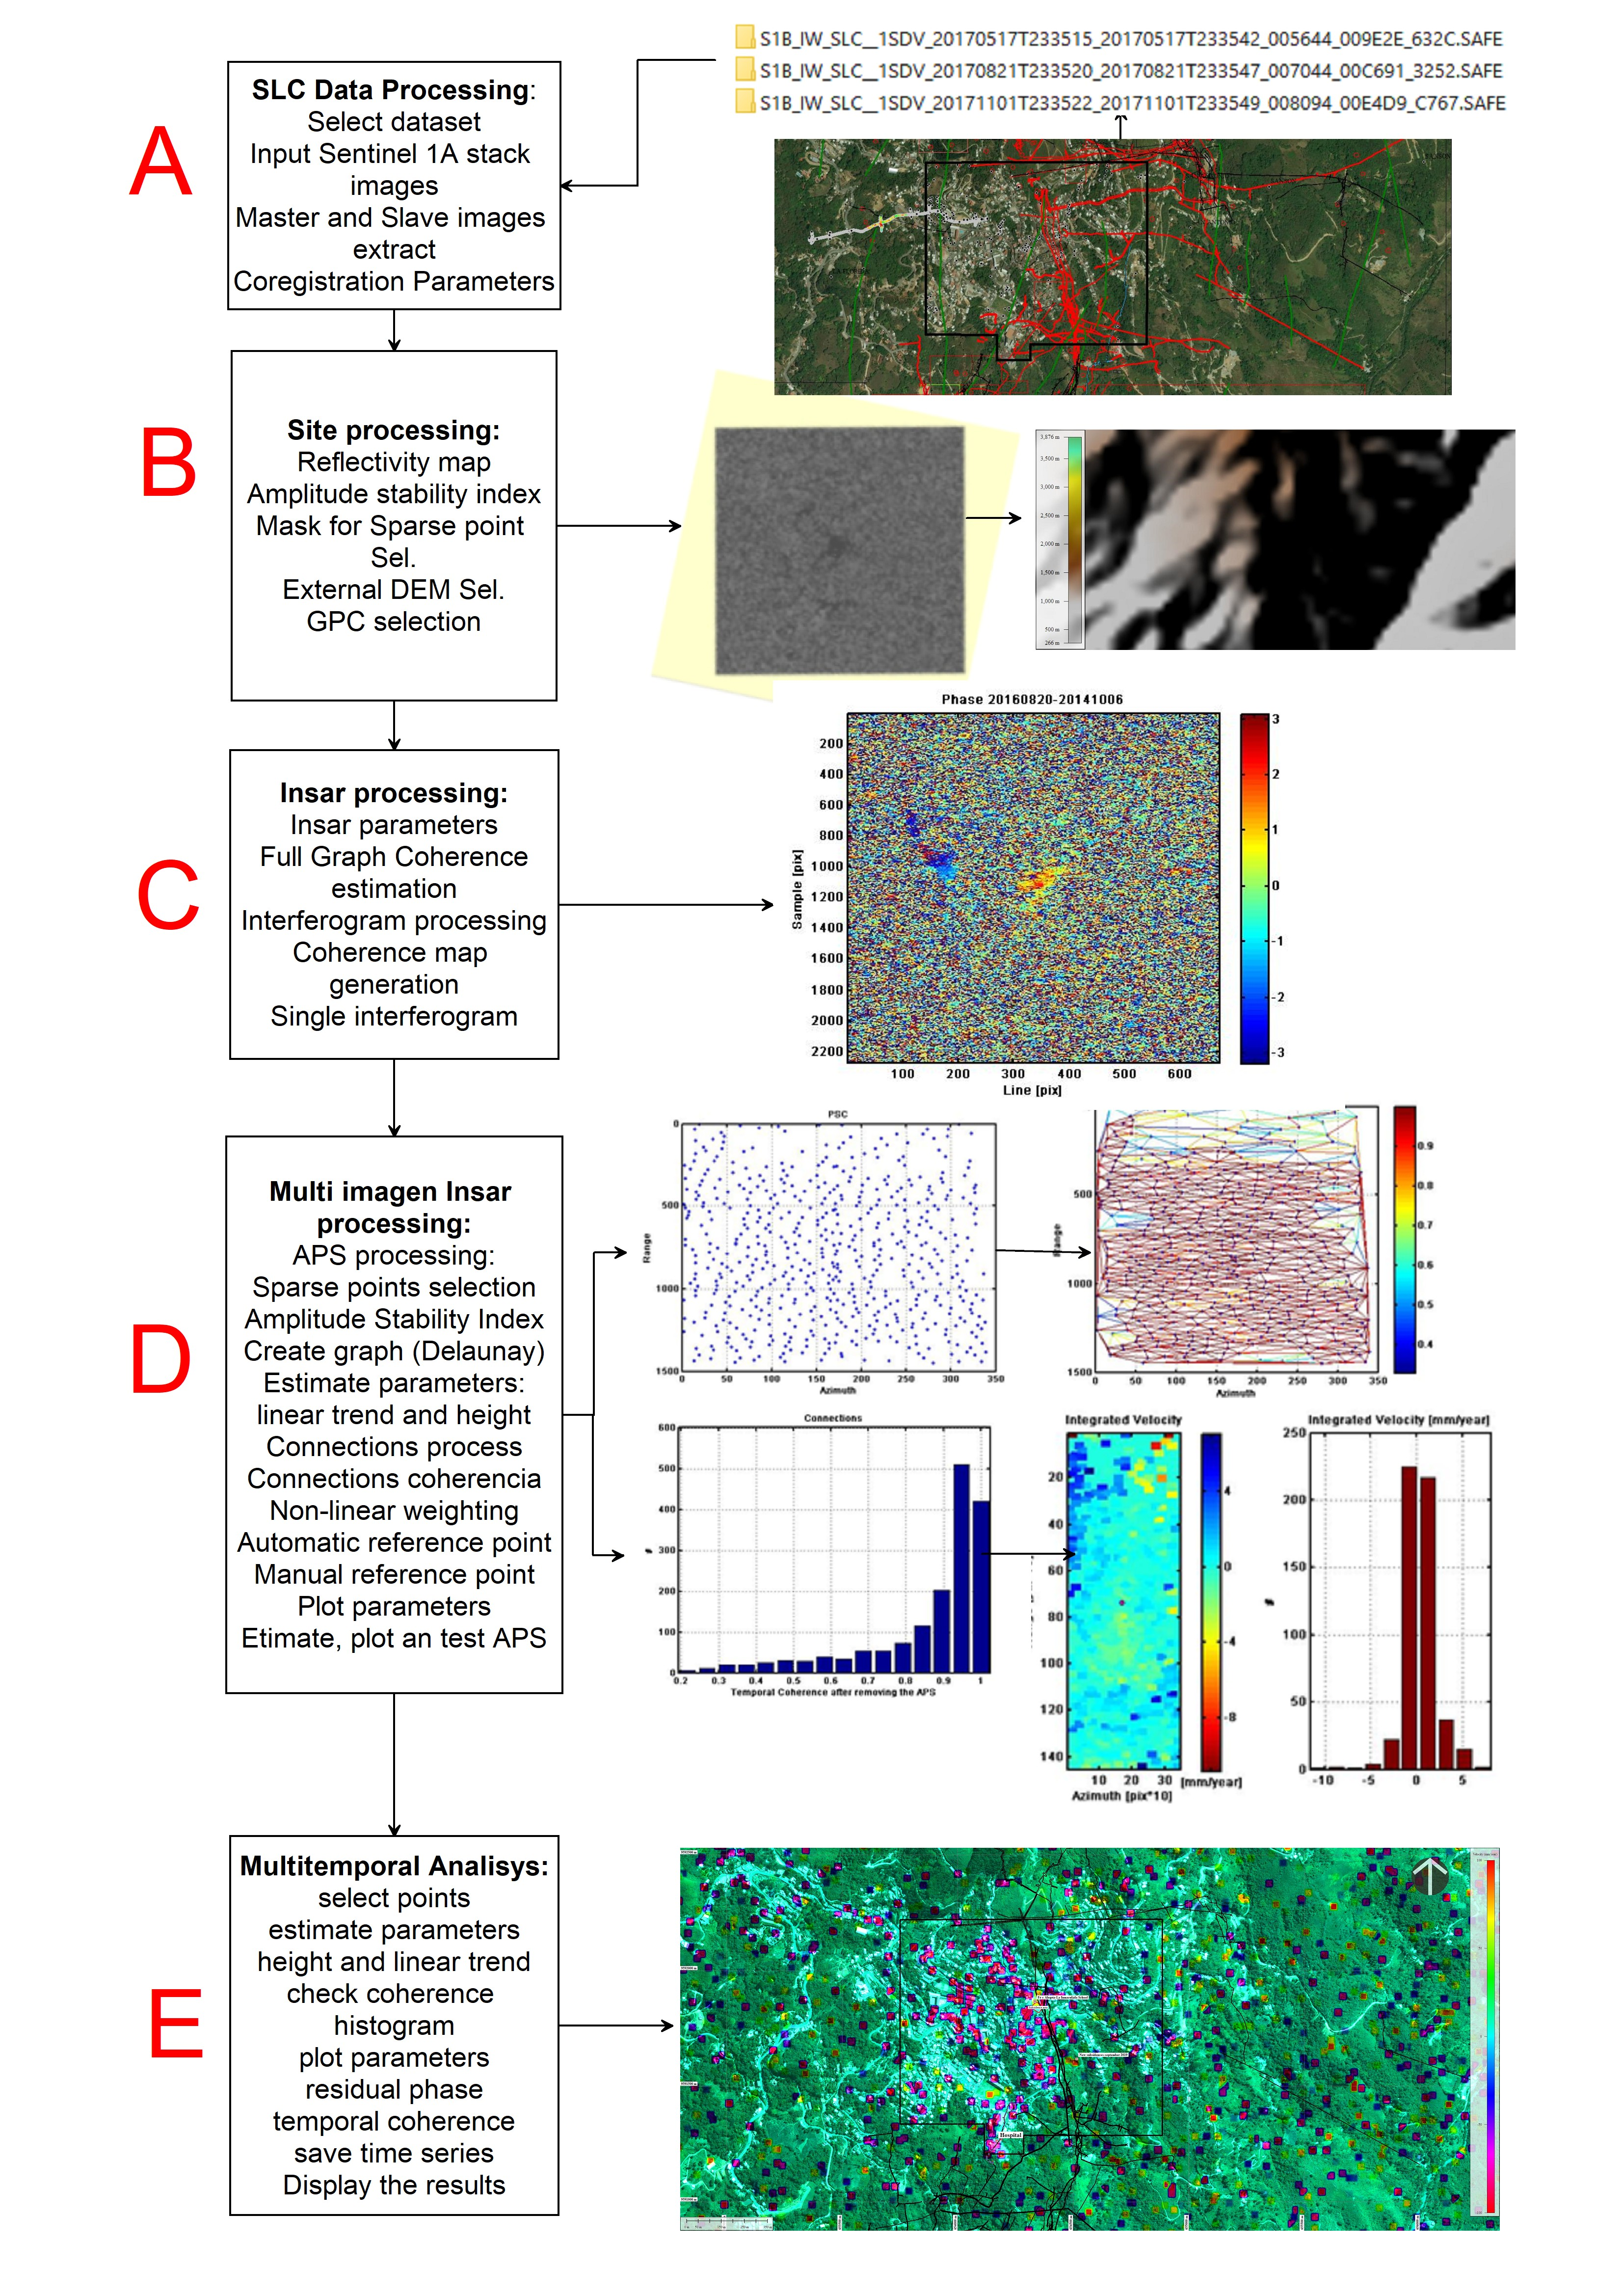
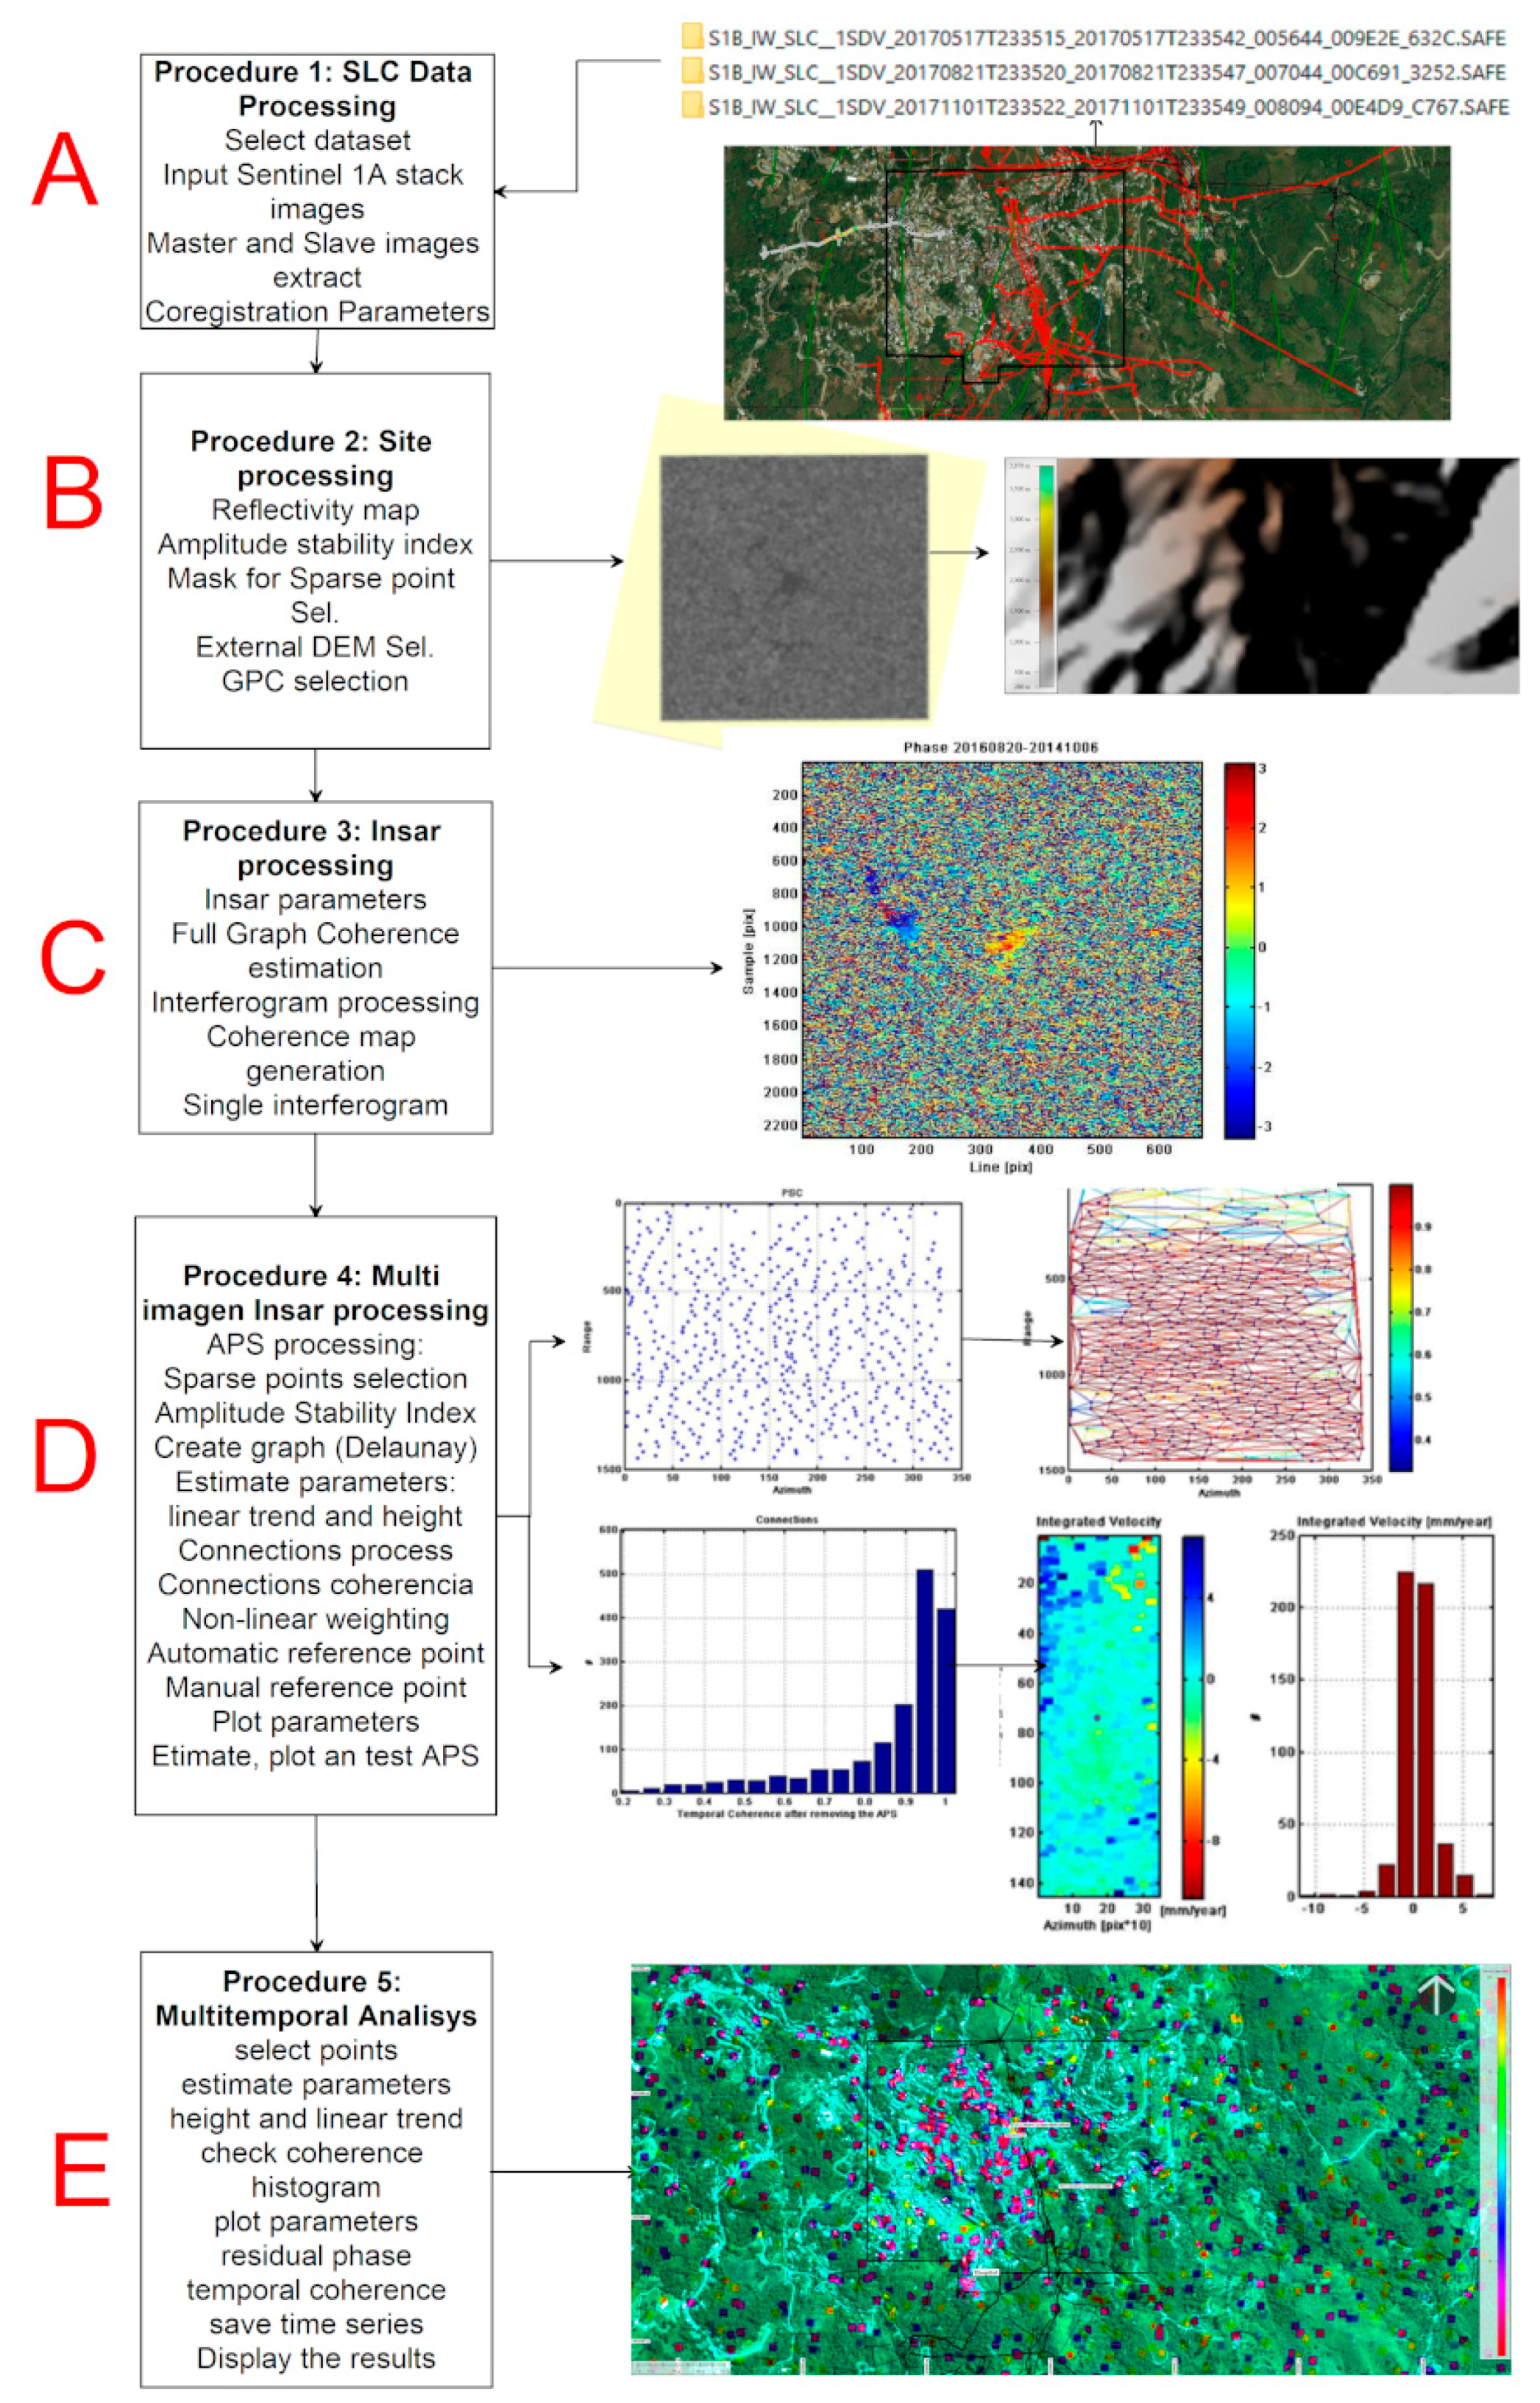
30] were used to obtain results before the beginning of the collapse in the school (26 October 2016), and during the evolution of the deformation of the land, until the reactivation of the sinking in the site and the new sinking in Gonzalo Pizarro Street. The project followed standard interferometric process in the SARPROZ software, according to the flow chart of
Figure 6 [
32,
33,
34].
To analyze the dispersion and coherence of the data and results of the analyzed parameters (velocity of movement mainly) in a time series with 20 images used, the PS technique was applied using the SARPROZ software with the following procedures, which the authors implemented and applied in other sectors and published in scientific articles [
28]:
SARPROZ is very powerful and versatile software that implements a wide range of Synthetic Aperture Radar (SAR), Interferometric SAR (InSAR) and Multitemporal InSAR processing techniques [
32].
Procedure 1: SLC (A) data processing to import or update extracted data from Sentinel 1 images. Master and slave images are extracted and defined by selecting them manually or automatically. In the star chart in
Figure 7A, the master image is close to half the perpendicular and temporal baseline domain between 1B and right, to try to minimize the effects of normal and temporal baselines. Finally, the Co-registration Parameters of the pixels of the corresponding master and slave images are defined for the elaboration of interferograms correctly.
Procedure 2: is called Site Processing (B), in which preliminary parameters of the images such as the reflectivity map are extracted, from the average time reflectivity of all the images in the stack. The amplitude stability index is calculated which is a unique number that provides a statistical property of the amplitude series with ranges between 0 and 1. A mask is generated for the selection of the scattered points based on a threshold value of the index of amplitude stability, whereby values above the threshold enter the interferometric process and values below this threshold will be masked and will not enter the process,
Figure 7B. Select an external Digital Elevation Model (DEM), to eliminate the topographic phase and geocode the images with the option Ground Control Point Selection-GPC, for orbital correction, flattening of interferograms and definition of persistent dispersers. The basic characteristic of a DEM is that it has positioned reference points; in this case, it is in relation to the Shuttle Radar Topography Mission -SRTM- that has a high degree of confidence in its position. Other external DEMs of various spatial resolutions can be used, provided they have stable static reference points (stable reflectors) that have not changed over time. Finally, the complete graphic coherence is calculated, to estimate the coherence of all the possible connections (interferograms) in the image scene.
Procedure 3: called InSAR (C) processing in which the InSAR parameters for interferometric processing are defined by estimating the complete graphic coherence according to the loaded image stack and the average coherence of the generated interferograms. From this calculated coherence, an interferogram is generated between the master image and each of the slave images. In this procedure, a single interferogram can also be generated, freely chosen from the master image with any of the slave images.
Procedure 4: called InSAR Multi Image Processing (D) in which the atmospheric noise APS is eliminated and the candidate points are selected to generate the persistent dispersion-PS, those that have a stable position in terms of deformation of the topographic relief. Based on these points, the program calculates the displacement height, relief velocity and the residuals of those parameters that serve to recover the delay of the atmospheric phase. The candidate points of persistent dispersion-PS in the urban area of Zaruma correspond to the constructions of buildings that remain stable over time both in radiometry and in the interferometric phase [
34]. The stack of 20 images used is the most important factor for estimating the coherence of the pixels, since it allowed identifying suitable PS for the displacement analysis of the relief. Insufficient use of the images will produce an overestimate of the coherence in the entire scene, a poor estimation of the PS, therefore, in false displacements. PS location is considered reliable when 20 or more images are used. In this phase, the APS ambient noise is also estimated, which can affect the process of generating the interferograms due to different atmospheric conditions at the time of image acquisition. Eliminating atmospheric noise, APS is important as it improves the coherence and phase response signal of the images to obtain more accurate ground displacement data.
Procedure 5: called Multitemporal Analysis (E) is a procedure that, based on the previous atmospheric noise reduction procedure, is used for the analysis of MT-InSAR multitemporal interferometry based on persistent scatter (PS). With this procedure, dispersers were identified, whose signal is dominant within the total dispersion of the analyzed pixels and with which a deformation map of the topographic relief was obtained, in which the deformation rate is represented from the time series obtained. These maps are made up of thousands of PS (persistent dispersions) and each PS is associated with an annual linear velocity value (mm / year), and with the accumulated displacement on each date of image acquisition.
A requirement before performing the analysis with PS-InSAR is that the image signals throughout time series must remain consistent for the extraction of PS points and to analyze their dispersion. In this case, to measure the relative displacement and the accumulated displacement as a function of a reference point, a stable point was selected (an artificial construction anchored to the ground, whose peak value in the histogram has a residual height with value 0 (point in ground) Points that are not on the ground may be unstable. The methodology used calculates the movement of the nearby points relative to this reference point, so it must be very stable.
In this case, the program chose PSC (Persistent Scatter Candidates) points based on their location in a connecting network and with a coherence threshold value greater than> 0.8. As mentioned, these points are parts of artificial civil structures to analyze the dispersion of amplitude stability around those points, drawing a coherent point connection network (Delaunay spatial connection graph). This procedure estimated a high coherence in the connections of each point of the network to obtain the height and relief displacement velocity with high confidence. After estimating the above parameters with high consistency, atmospheric noise was removed. The choice of the number of images in the stack showed coherence greater than or equal to 0.8, as presented in
Figure 7C and the estimation of APS atmospheric noise with high coherence for the entire set of points was processed with a nonlinear spatial distribution, ensuring that the final coherence is satisfactory.
The cumulative and integrated velocity and displacement of the relief were obtained considering that the accumulated displacement = velocity × time, so that at the reference point, the peak of the accumulated velocity histogram and displacement tends to zero, which means that most points have relative velocity and zero displacement, when they are approached and compared to the reference point.
The histograms verified that the connection speed and the connection residual height are consistent in the distribution of the residual value of travel velocity (mm/year) / height (m), as presented in
Figure 8A–C, where a histogram is seen, without jumps and high coherence (connecting lines with a red tendency),
Figure 8D.
3. Results
The dispersion and coherence analysis of the displacement height relief velocity was obtained over a time, with the availability of a stack of 20 images, applying the PS-InSAR technique, with the procedures mentioned above.
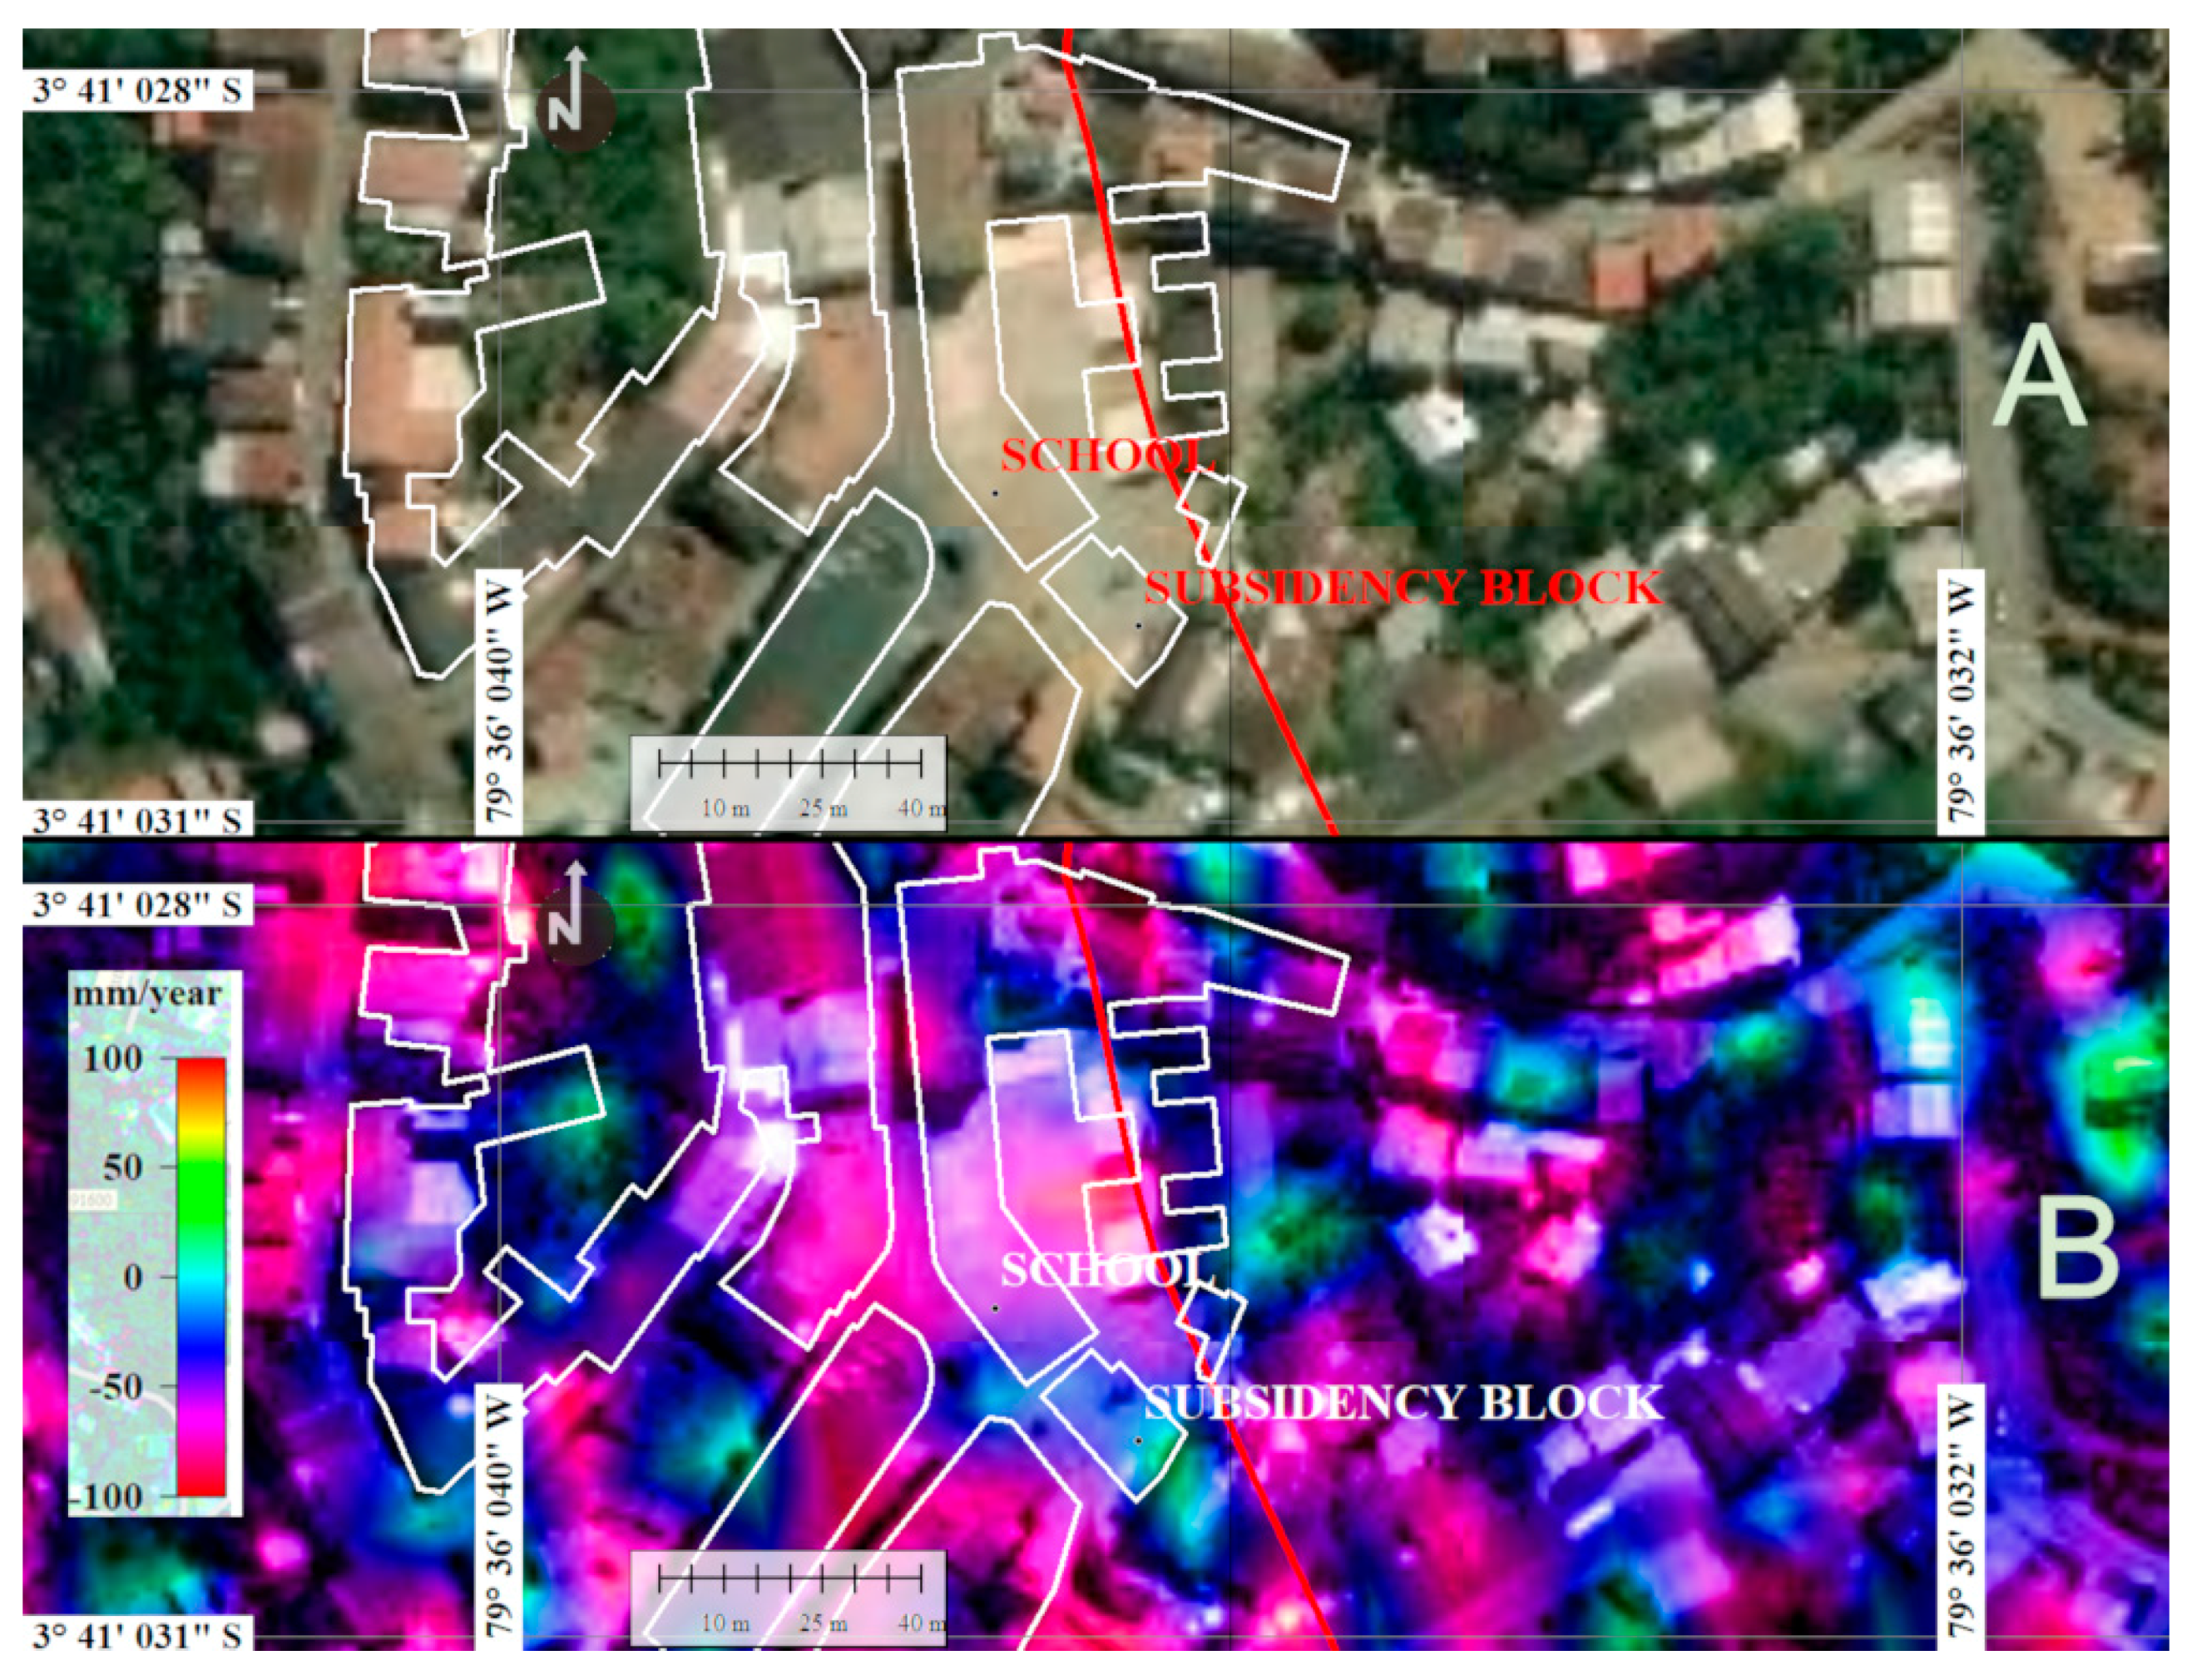
The first result of the interferograms within the period from 25 October 2016 to 22 October 2019, before the sinking in the Fe y Alegría-La Immaculada School, in 26 October 2016 is shown in
Figure 9. In (A) the current image of Google Earth with the old school site and the filler created to stabilize the site. In (B) the vertical displacement until October 2016. The elevation and subsidence relief values were within a range between −50 mm of subsidence (blue–cyan color) and 20 mm of the ground lifting (color towards red). The area completely collapsed in October and December 2016 (red polygon). The weak blue color inside the polygon indicates that on 25 October 25, the sinking of the area was in process. In the nearby areas, can see the deep cyan sinks, guided by the deep blue traces possibly demonstrate the presence of underground mining galleries. The white color represents the existing buildings in the school at that time. The year with the highest subsidence was 2016, possibly associated with low–moderate intraplate earthquakes and geological faults in the Gulf of Guayaquil [
35,
36].
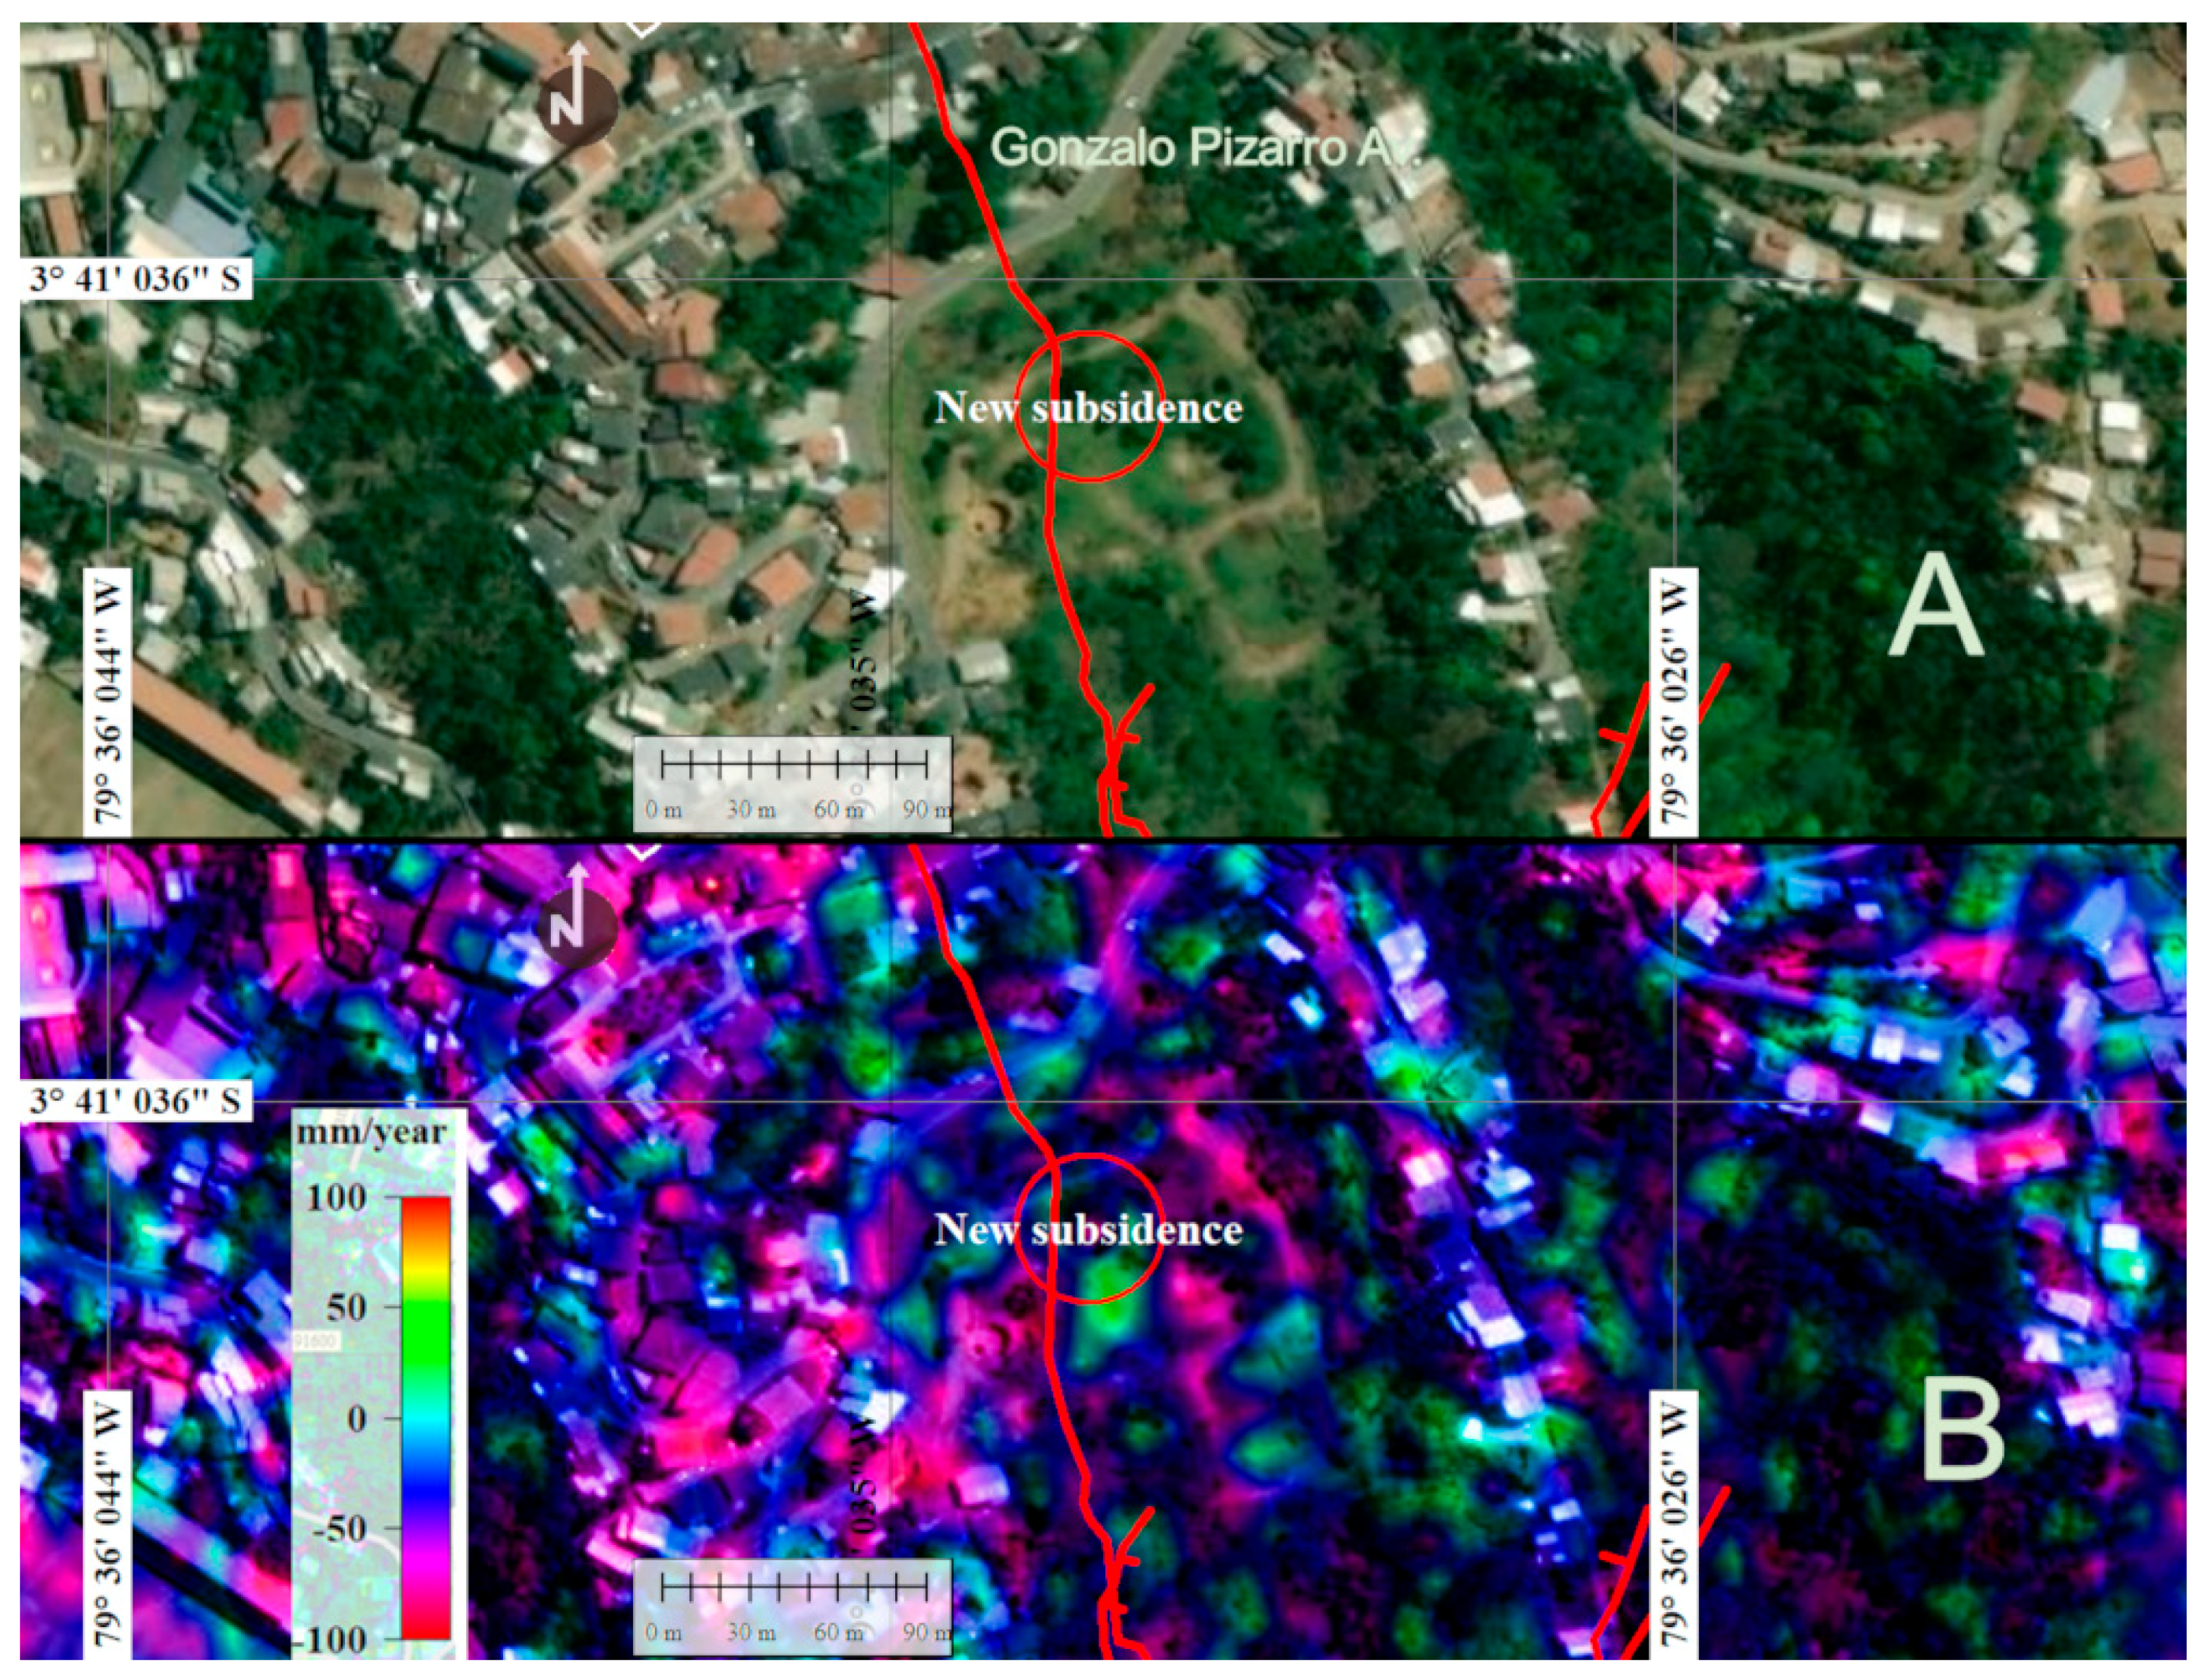
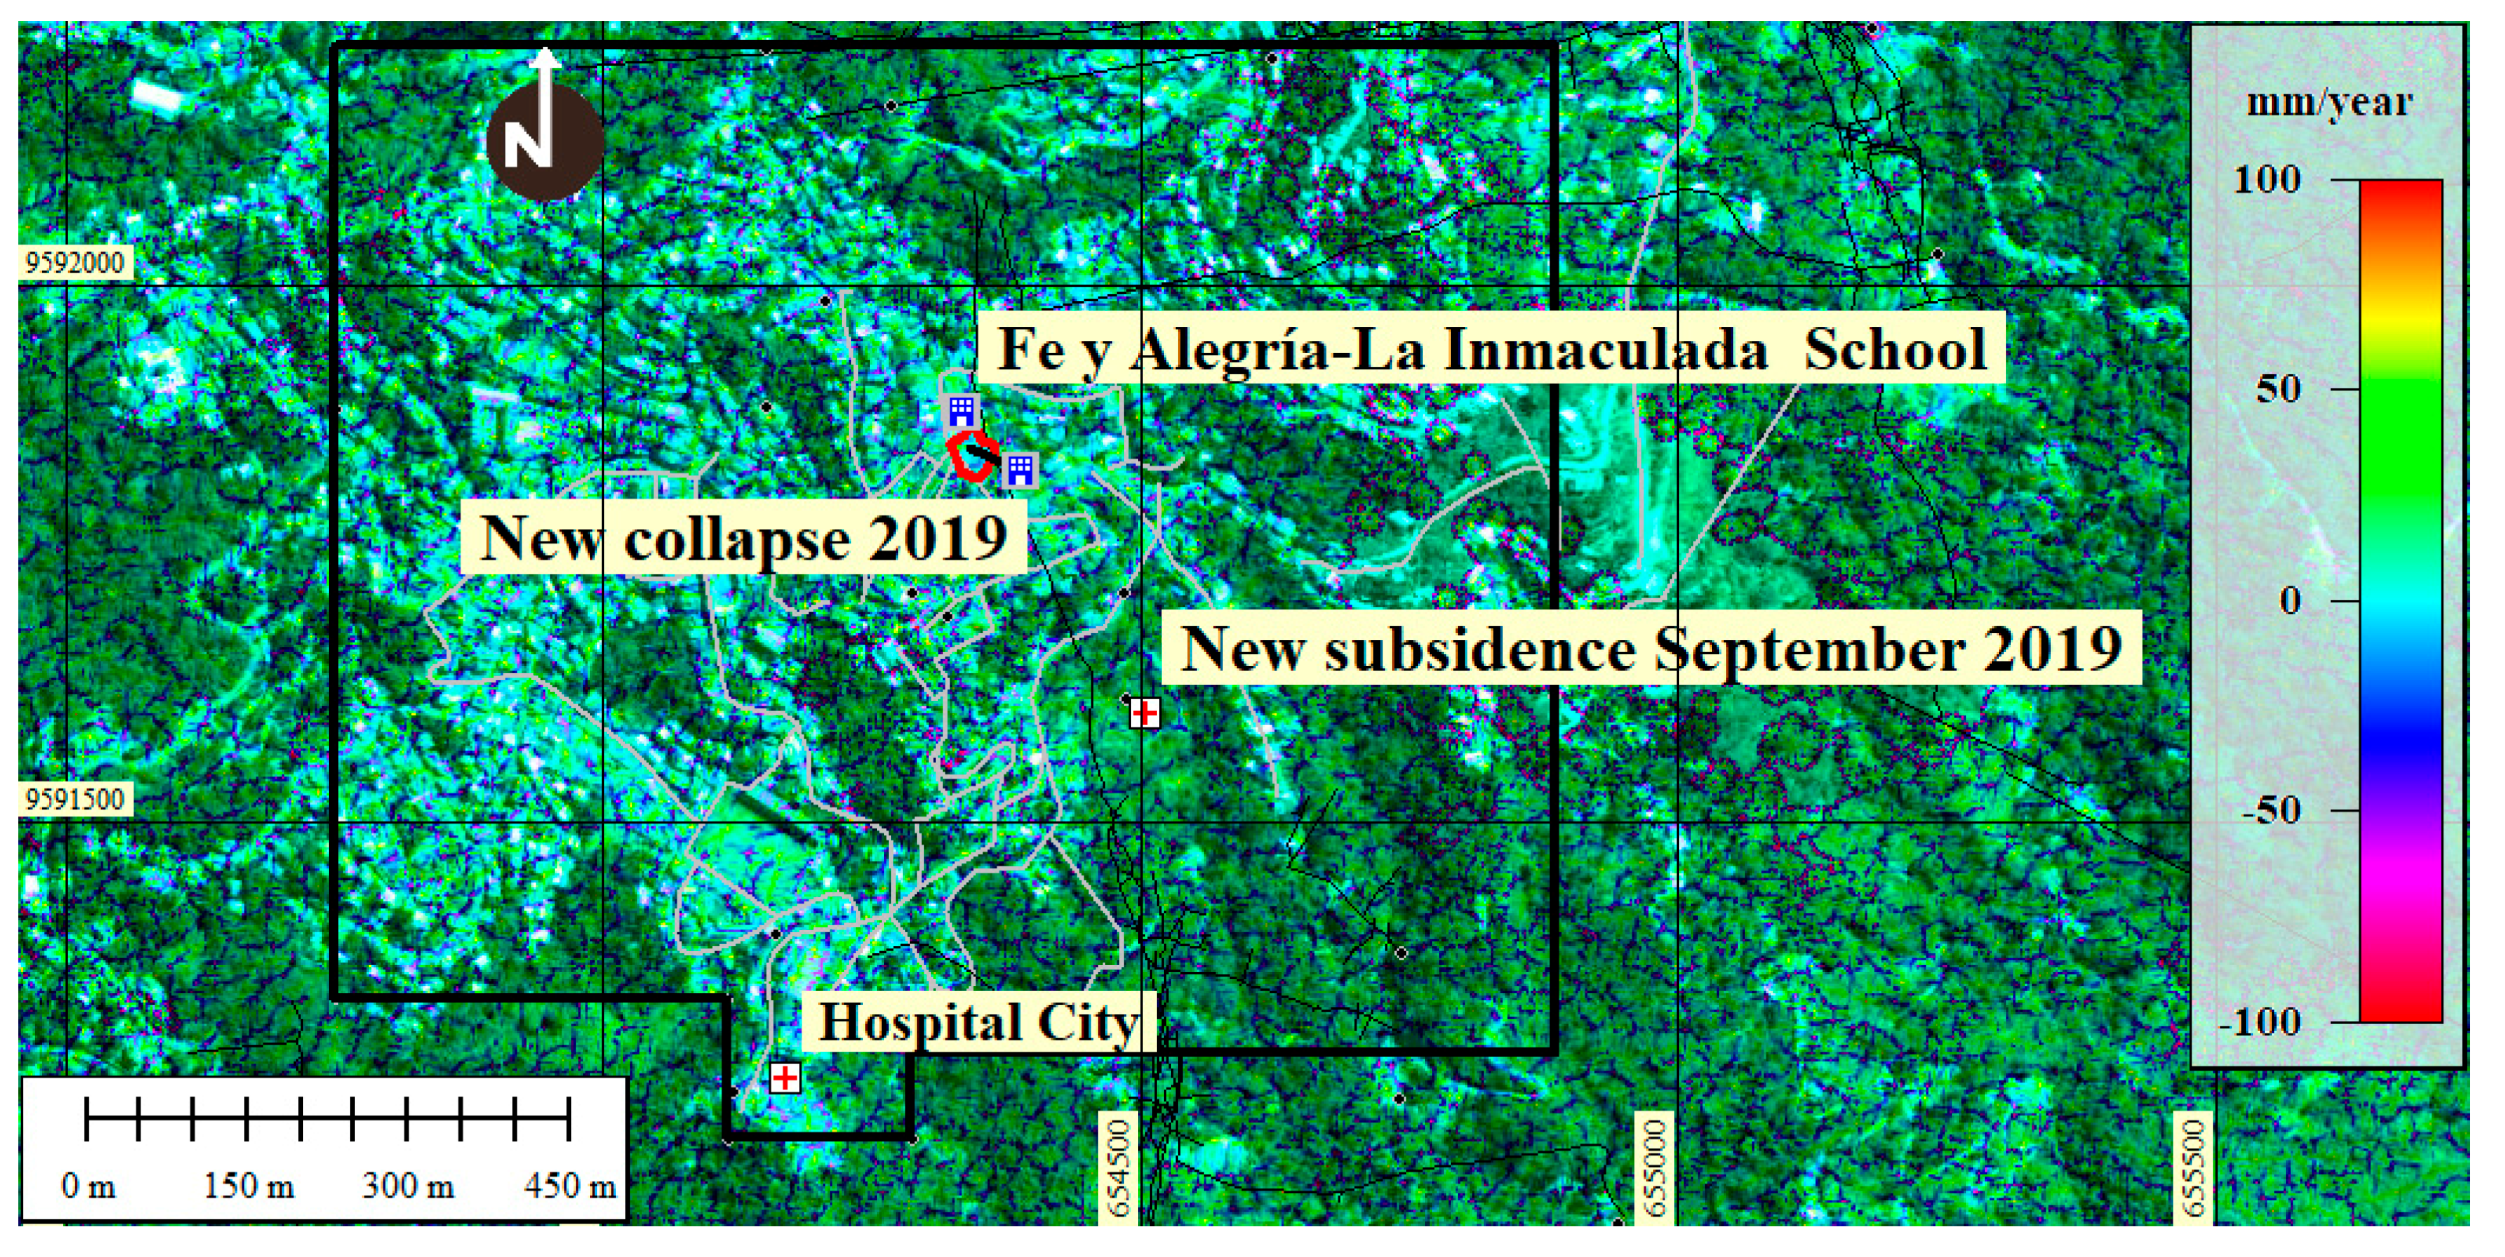
The results of the interferograms obtained from the stack between 25 October 2016 to 22 October 2019, show that the subsidence processes were in progress producing a new subsidence on Gonzalo Pizarro Street (
Figure 10).
The reclassified images of subsidences currently occurring in the city obtained by the InSAR method have a more detailed value than those presented in images 9 to 13 in a range of 20 mm/year (lifting relief) to −30 mm/year (subsidence relief) with an error of +/− 5 mm, therefore InSAR performs a quantitative analysis since it starts from points that it identifies on the ground as stable and are geo-referenced in a coordinate system (in this case UTM; WGS84; 17 Sur Zone), to determine the elevation difference of the same point taken in two different periods of time and prepare the interferogram. This is presented in the following image. The images obtained demonstrate the ranges of subsidence that currently occur in the sector in a period of time 2016 to 2019, which is in values similar to the ranges of displacement obtained by the INIGEMM that are 15 mm in two months (very short time to have more real data) (
Figure 10).
These results were compared with data from subsidence investigations conducted by National Metallurgical Mining Geological Institute-INIGEMM in March 21017 one year after the sinking of 2016 and presented in [
37], as part of the studies for the stabilization of the collapse of the school in October 2016.
The technicians of this Institute, made five perforations inside the school and in the southern zone near the sinking area. The perforations reached a depth of 70 m, which in general determined a first layer with an average of 30 cm thick that corresponds to concrete in the foundations. Then there is a layer of about 20 m in average thickness that corresponds to clay, which, according to its lithological composition, corresponds to the saprolite (eroded rock).
Then there is a layer about 8 m thick on average of andesite strongly weathered and finally, a layer of volcanic breccia with 50 m thickness on average.
The Rock Mass Rating -RMR- values obtained vary in a range from 14 for the clay (saprolite) with the lowest value to a value of 67 for the weathered andesite and the volcanic breccia.
The simple compression strength of these layers proved that the clay (saprolite) has a resistance classified as very soft, while andesite and the volcanic breccia have a resistance classified as hard.
The study of subsidence of the ground that the National Metallurgical Mining Geological Institute-INIGEMM carried out [
37] from a monitoring network of 24 points between the months of March and April 2017, using a Total TOPCON GTS-750 station, determined that the average displacements in the school. They have a range between 1 to 15 mm in two months. This range of subsidence is within what the InSAR method.
The subsidence range with InSAR has greater definition and goes up to 50 mm/year in accumulated velocity from 2016 to 2019, at all times. This means that the InSAR methodology is more efficient, free and can be applied in large or regional areas.
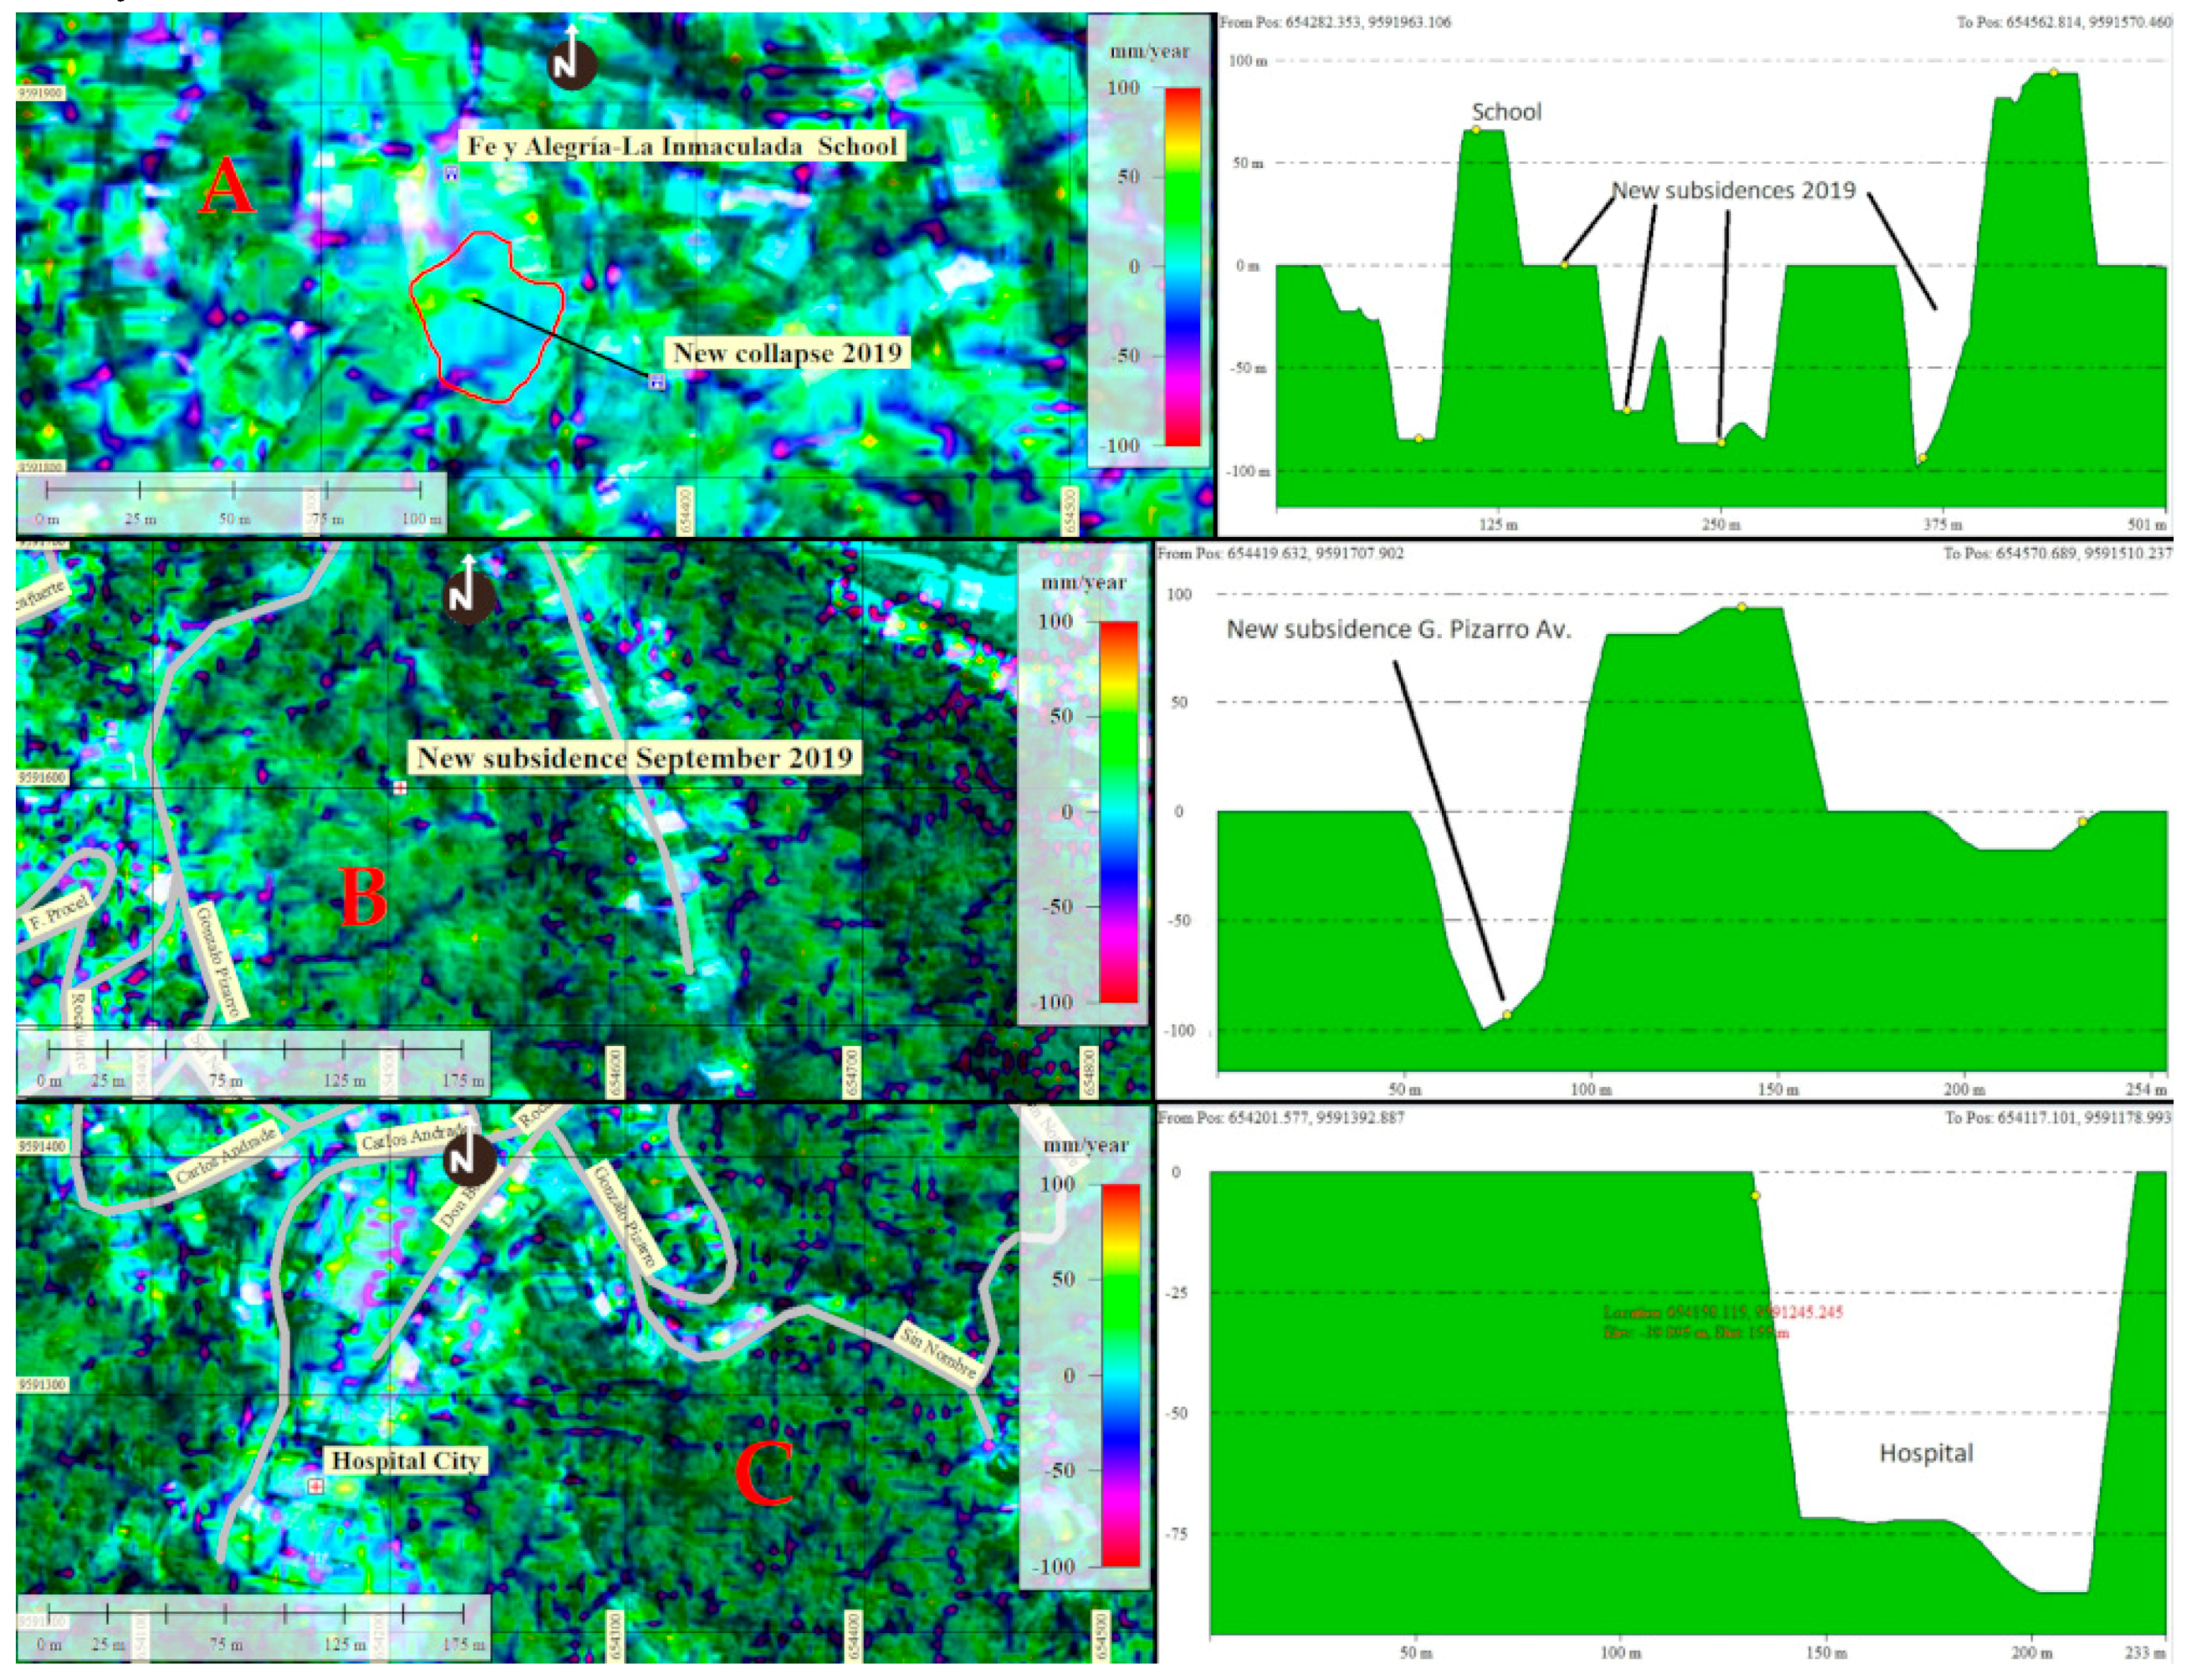
Figure 11 shows the velocity of elevation and subsidence of the terrain within a range of −20 to 50 mm, to classify the most accurate rank levels at the site. (A) The new collapse in the Fe y Alegría school, (B) the new subsidence in Gonzalo Pizarro Street and in (C) the subsidence that are occurring in the city hospital, among other places that were analyzed by the authors in 2001 [
2] and served to verify the results of this article.
The correlation of the subsidence areas that occurred in 2001, 2016 and 2019 through the interferometric analysis performed with the DInSAR methodology and correlated with the geotechnical and subsidence investigations carried out by INIGEMM and the thesis author [
36] (
Figure 12), allowed the determination of progressive surface deformations that can cause current subsidence mainly in several sectors and its neighborhood.
Note the correlation between the sinking areas CF5 of
Figure 13A and the new collapse occurred at the same site in 2019 of
Figure 13B.
It is necessary to highlight the correlation that exists between the area of maximum subsidence REF 5 in Fe y Alegría-La Inmaculada School that seen in
Figure 13A of the INIGEMM and the new collapse occurred in the same site in the 2019 of
Figure 13B elaborated with the InSAR methodology. There is a correlation between subsidence in other nearby sectors. INIGEMM considered geotechnical parameters such as cohesion, angle of friction, UCS classification, and other parameters


