1. Introduction
The “urban shrinkage”, first put forward by [
1] as an alternative paradigm of urbanization that is completely different from the traditional “urban growth”, has become an important topic in urban studies. Research on this phenomenon has been carried out in Germany [
2], the United States [
3], and other countries. Urban shrinkage took place in China more than two decades ago and has had profound economic, social, and environmental impacts [
4]. With the Chinese economy slowing down in recent years, it has received much attention from both researchers and policymakers [
5,
6]. Several studies found that more than 20% of Chinese cities have experienced or been experiencing shrinkage [
7,
8]. As China has entered the new era of spatial planning [
9], the traditional paradigm of growth-oriented planning is being replaced by a new paradigm that reinforces the coordination between various spatial systems and plans, posing new opportunities as well as challenges for the understanding of urban shrinkage.
A new planning model known as “smart shrinkage” was proposed to address the challenges caused by urban shrinkage [
10,
11]. This model emphasizes accommodating shrinkage, diversifying the economy, and prioritizing adaptive strategies and policies that can attract and preserve investments, given the local context that may vary across places within a city. Before tailoring the shrinkage-mitigating strategies to local conditions, we must recognize the shrinking areas that are of great interest. Most existing measurements to identify urban shrinkage are at the city level and are unable to capture the local shrinking patterns inside a large city that are often spatially heterogeneous. Furthermore, these measurements mainly take a single indicator or a combination of several ones to identify shrinking cities based on the longitudinal changes of indicators, which inevitably neglects the functional relationship between shrinkage-related factors, e.g., the human activities and built environment. More importantly, the mismatch between the relevant factors may unveil causes for urban shrinkage.
As geospatial big data proliferated in recent years, unprecedented opportunities surface to supplement reliable but costly survey data for urban studies with high spatiotemporal resolution data collected cost-efficiently, such as volunteered location-based big data and remotely sensed data. Various sources of data collected by all types of sensors and a number of newly developed models and tools have been utilized to gain new insights into optimizing the efficiency of city operations and services and into connecting citizens with their urban environments under the umbrella of the Smart City concept [
12,
13,
14]. Applying smart city technologies to the investigation in the context of city shrinkage instead of growth becomes a promising approach to facilitating the study and management of urban shrinkage.
This paper aims to close the gaps in existing measurements of urban shrinkage discussed above by proposing a new concept, namely functional urban shrinkage, to guide the development of better measures for the delineation of local shrinking areas within cities. Taking advantage of a data fusion approach to integrate multi-source geospatial big data and survey data, a general analytical framework is developed to construct the functional shrinkage measure, which aims to capture the spatial mismatch between urban built-up areas and the areas where significantly intensive human activities take place, dubbed as the functional shrinkage area. Specifically, Landsat-8 remote sensing images were used for extracting urban built-up areas by supervised neural network classifications and Geographic Information System (GIS) tools, while cellular signaling data from China Unicom Inc. was used to detect human activity areas by spatial clustering methods. Once the functional shrinkage areas for a city are delineated, the framework further examines the spatial distributions, morphological features, and urban land-use compositions of these areas, and it enables the comparison of functional urban shrinkage patterns between cities from these dimensions by combining geospatial big data with urban land-use functions obtained from land survey data and Points-Of-Interests (POI) data. Therefore, the framework for functional urban shrinkage has the capacity to facilitate an in-depth investigation of the fundamental causes and internal mechanisms of urban shrinkage. With a case study of the Beijing-Tianjin-Hebei megaregion (BTH) using data from various sources collected for the year of 2018, we demonstrate the validity of this approach and its potential generalizability for other spatial contexts in facilitating timely and better-informed planning decision support.
The rest of this paper is organized as follows. The next section reviews related research on urban shrinkage in China and existing approaches to measuring urban shrinkage.
Section 3 proposes the key concept of functional urban shrinkage and a general analytical framework for developing the functional shrinkage measures, and further details the data and methodology to support the implementation. Results are presented in
Section 4 and further discussed in
Section 5 in terms of shrinkage-related factors and mechanisms. Finally, conclusions are drawn, and the future work is envisaged.
2. Literature Review
2.1. Urban Shrinkage in BTH
BTH is one of the fastest-growing urban agglomerations in China. However, a number of studies have pointed out that the region has been troubled by urban shrinkage, which has emerged as a critical threat to the sustainable development of this region. For example, Wu [
15] characterized the population loss by the longitudinal changes of the resident population (people who actually live there), registered population (people who have their Hukou registered there), and employed population. He further compared the different trends for the resident population and registered population, on which urban shrinkage was identified and evaluated for BTH. Wu [
15] studied the changing patterns of shrinking cities in this region and classified the process of shrinkage into five categories: less-developed peripheral shrinkage, downtown shrinkage in large cities, shrinkage in industrial and mineral cities, artificial shrinkage due to administrative redistricting and shrinkage in small counties and towns.
On the other hand, the extent of urbanization for cities in this region varies greatly given their local conditions [
9]. They share a low level of integration of systems and mechanisms, mainly root in the different industrial structures, huge gaps in development levels, and a lack of intercity coordination [
16]. They also follow a variety of development models respectively, including innovation-driven, capital-driven, and service-driven [
17]. Recent studies [
18] have explored the considerations and issues in coordinating various growth-driving factors, including the capital, population, and transport flows between cities in this region. However, these considerations and issues have not been considered with respect to urban shrinkage. Currently, with the planning and development of the Xiong’an New Area and a series of implemented policies on alleviating city functions that are less relevant to the national capital status of Beijing, BTH is experiencing unprecedented urban changes that comprise both growth and shrinkage. It is imperative to consider the internal relations among land, economy, population, and other factors for the study of urban shrinkage.
2.2. Geospatial Big Data for Urban Shrinkage Research
Our understanding of urban shrinkage is highly dependent on the availability of data. Previous research mainly utilized traditional data, such as population census and land surveys, due to their availability and reliability. However, collecting these data is often time-consuming and costly. Consequently, they have been limited to either small-scale or temporally sparse data samples. The proliferation of geospatial big data in recent years provides unprecedented opportunities to study both human and environmental dimensions of urban dynamics in shrinking cities [
19,
20,
21].
Many smart city-related studies [
22,
23] have demonstrated that geospatial big data enabled by sensors ubiquitously embedded in various mobile devices and by location-based services provided by various telecom operators and Internet companies at a low cost can effectively capture the dynamics of human activities covering large-scale urban areas. Compared to traditional data, such data record various human activities with a very fine spatiotemporal resolution, making feasible the dynamic monitoring, detection, and evaluation of the human dimensions of urban shrinkage. For example, a project called “London Dashboard” established at University College London provides the dynamic tracking and visualization of 12 kinds of data including jobs and economy, transport, environment, and so on, which can be accessed by every citizen [
24]. Sulis et al. [
25] use the Twitter data and smart card data as proxies of human activities and mobility flows to extract the most vibrant areas.
On the other hand, remote sensing platforms, as a well-known geospatial big data source, can provide diversified information on urban morphology. Various data products with different spatial and temporal resolutions have proved very useful in research with different purposes and needs. For example, MODIS 500-m data has been used for global urban mapping studies [
26], and a series of Landsat data have been widely used in urban environment studies, such as urban growth monitoring [
27], urban change detection [
28], and land-use and land-cover classification [
29]. In particular, such data have been employed to delineate built-up areas [
30], which can be used as a key element to identify and assess urban shrinkage [
31]. Compared to traditional land surveys, remote sensing data are automatically collected and much more cost-efficient due to its good geographic coverage and the high spatiotemporal resolutions, making it the best candidate for large-scale monitoring, detection, and evaluation of the physical/environmental dimensions of urban shrinkage.
Fusing geospatial big data from multiple sources including location-based services and remote sensing platforms allows for an integrated data approach, supplemented with traditional survey data, to the study of both human and physical/environmental dimensions of urban shrinkage. Moreover, the superior spatiotemporal resolution and geographic coverage of the big data approach empower the large-scale and dynamic monitoring, detection, and evaluation of urban shrinkage patterns and processes. As there have been few studies focusing on such an integrated data approach to urban shrinkage study, this paper aims to fill this gap.
2.3. Measurement of Urban Shrinkage
The measurement of urban shrinkage in the literature mainly takes two approaches. First, the univariate approach refers to a way to measure urban shrinkage by the change of individual indicators, such as population or economy or land-use, to characterize one of many aspects of urban shrinkage. Among these indicators, some research only focused on the widely used population change [
32,
33], while other studies use several indicators, such as the change of economic development level [
34] and the physical change of the built environment [
35] to investigate shrinkage from different aspects separately. Rieniets et al. [
36] found that as the entire city was growing, population decline occurred in some local areas of the city reflecting a pattern of spatially unequal development. Du and Li [
34] applied the Neo-Marxist urban theory to systematically investigate how the capital flow can cause urban shrinkage measured by the population decline.
Secondly, the multivariate approach takes a way to examine urban shrinkage by a combination of multiple indicators as a single index. The most widely used index is the population density which considers both the number of residents and the built-up area on which they dwell. Employing this index, Zheng et al. [
37] identified “ghost cities” from an angle of the discrepancy between lit areas and built-up areas, which reflects the house vacancy ratio in those cities and represents an aspect of urban shrinkage. Chi et al. [
38] identified more than 50 shrinking cities using estimated areas of vacant housing that were derived from combining the resident population estimated by location-based data of user activities acquired from Baidu Maps and housing-related urban services extracted from POI data. Jin et al. [
39] combined indicators such as intersection density, POI point density, LBS based human activity records and other variables to construct a rather comprehensive index to evaluate urban vitality in order to identify the “ghost cities” in China.
Both the above approaches take either a single aspect or several ones to examine urban shrinkage as changes of indicators between snapshots in time. Being a rather static way of measurement, they both ignore the interactions between the dynamic changes in those aspects, e.g., the human activities and built environment, which may lead to the functional mismatch between them and thus become a cause for urban shrinkage. As early as the 20th century, American researchers began to pay attention to the relationship between land use and population loss at the neighborhood scale [
40,
41]. Some researchers [
10,
42] further investigated the relationship between different land-use types, urban morphology, and depopulation. Yang et al. [
43] compared population changes and the land expansion of cities in 2000 and 2010 and identified a paradox of population loss and land development existing in a large number of cities. At the intra-city level, Long and Wu [
5] found that the coexistence of the rapid land development in general and the urban shrinkage in some local areas was quite common in China.
Although studies discussed above touch upon the relationship between different aspects of urban shrinkage, a formal definition of the functional relationship between those aspects, such as population and land-use, with respect to the extent to which they are mutually adaptive or mismatched in relation to urban shrinkage, remains missing. Hence, the associated measure for this functional shrinkage is lacking. Furthermore, most existing research took measurements at the city or provincial level, which missed out the spatially heterogeneous distribution of urban shrinkage at finer resolutions, such as intra-city or street block levels, and thus lacks the capacity to study the functional mismatch between different aspects of urban shrinkage at smaller geographies. To fill the two gaps, this study takes a multi-source data fusion approach to measure the functional urban shrinkage (formally defined in
Section 3.2) by leveraging both conventional survey data and geospatial big data. The new measurement is applied to BTH as a case study to demonstrate its validity.
3. Data and Methodology
3.1. Study Area and Data
BTH includes all administrative areas of Beijing City, Tianjin City, and Hebei Province (
Figure A1). This region has a total area of 216,000 km
2. As one of the largest urban agglomerations in China, BTH plays an important role in China’s urban system. National statistics (National Bureau of Statistics, 2018) show that in 2018, this region accounted for about 8.1% of China’s total population and 9.5% of its GDP. Moreover, the urbanization in cities and towns of this area is highly unbalanced, providing us a rich set of observations for the study of urban shrinkage.
Our data come from the following four sources.
- (1)
Cellular signaling data. The cellular signaling data from China Unicom, one of the largest telecom service operators in China, are used to represent the intensity of human activities (physical activities that need the presence of human individuals), namely the ambient population, which is defined as the 24-h average estimate of a population in a given area [
44]. The data record the number of mobile phone users by a grid of 1000-m-by-1000-m cells for a regular week from July 20th to 26th in 2018. While the data only covers a relatively limited time period, the daily average of the data for a typical week can be a representative to reflect the extent of significantly intensive human activities across spatial regions for a typical day (explained in detail in
Section 3.3). As the data is aggregated as given, it is anonymous and involves no privacy issue. However, the spatial resolution of the grid scheme is fine enough to estimate the ambient population relevant to the purpose of this research.
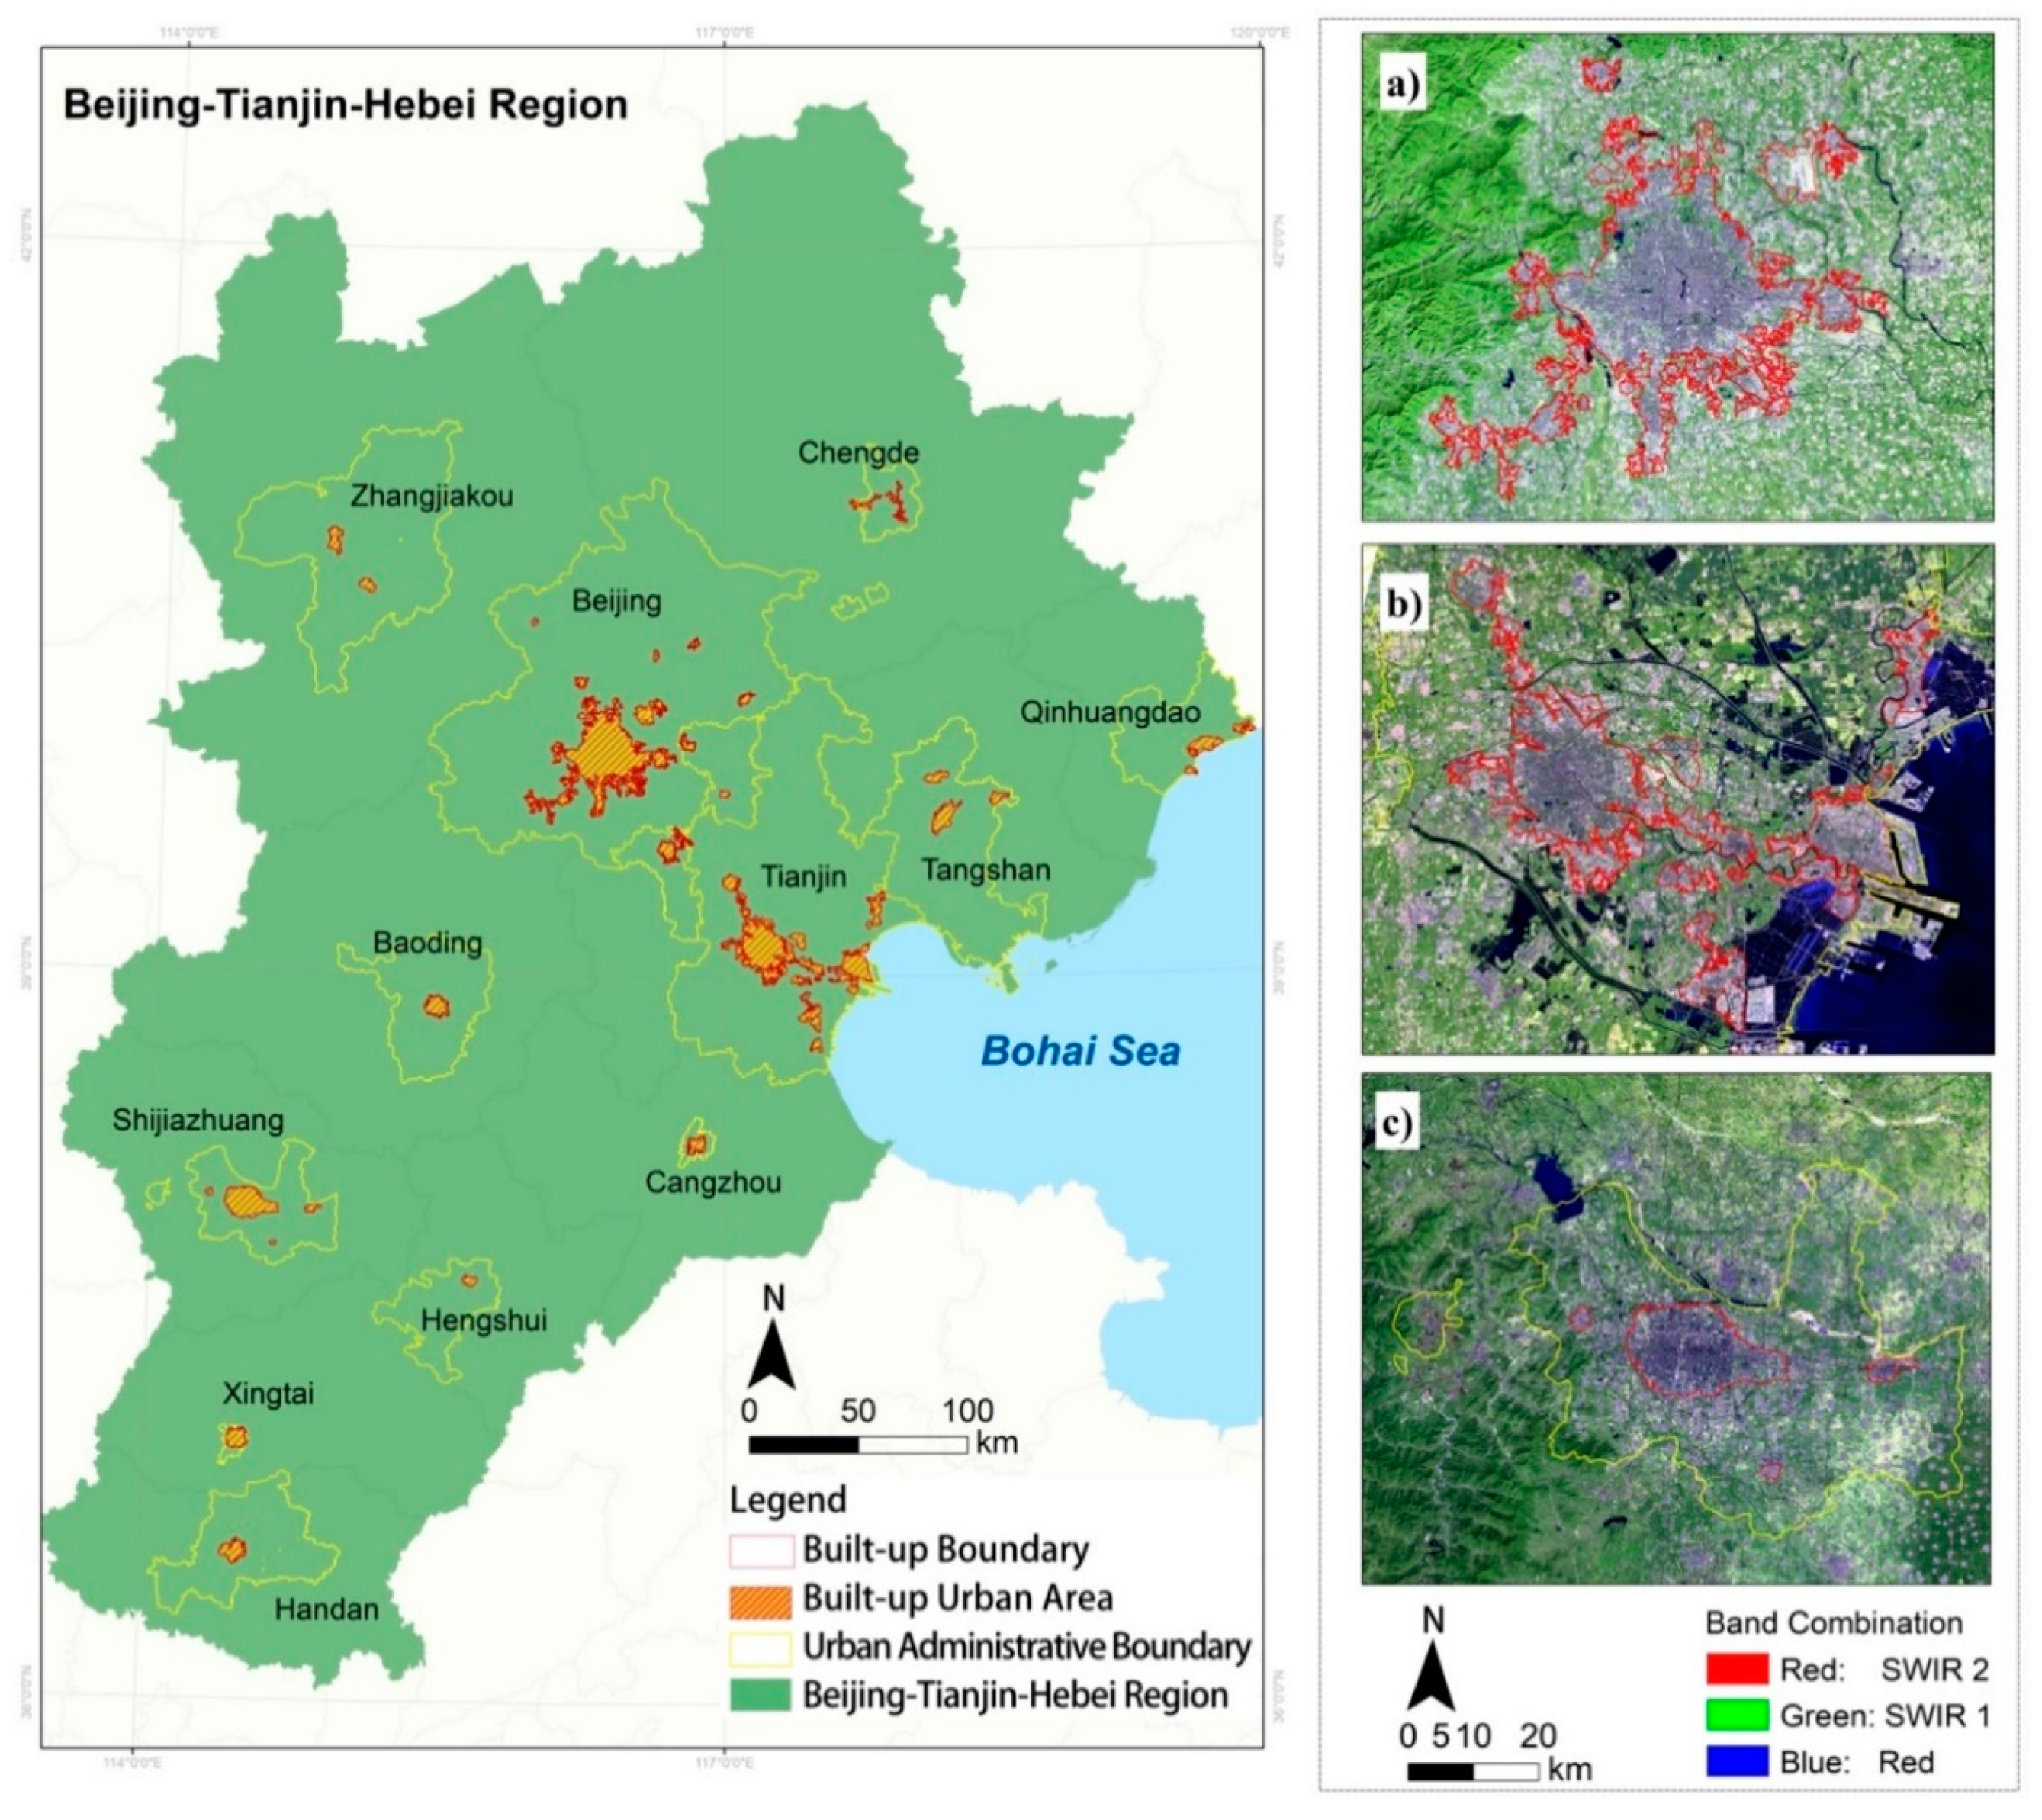
- (2)
Remote sensing data. Landsat 8 remote sensing images and high-resolution satellite images from Google Earth are used jointly to extract physical built-up areas. The Landsat-8 satellite launched in 2013 continues and maintains the characteristics of the previous Landsat series. It optimizes the imaging mode with two sensors, the Operational Land Imager (OLI) and the Thermal Infrared Sensor (TIRS). The narrowed spectral band range expands to 11 bands and improves signal-to-noise ratio making it more sensitive to some specific surface objects. The improvement of radiation resolution allows for details of the land surface to be captured and discriminated. It has advantages that can be useful in urban detection and monitoring. In this research, we use the OLI data with a spatial resolution of 30 m by 30 m, a total of 14 images including the Level-1 Terrain Precision (L1TP) data of Landsat 8 taken between September 2018 and January 2019 from the United States Geological Survey (USGS, free and available at
https://earthexplorer.usgs.gov/).
- (3)
Land-use survey data. The land-use survey data conducted and updated in August 2018 was provided by the planning authorities of cities in the BTH. This polygon vector data contains land-use type information reflecting urban functions, such as public service, industrial, residential, mixed-use, and undeveloped lands.
- (4)
Points-Of-Interest data. It is acquired via open Application Programming Interfaces from Baidu Maps, one of the largest web mapping providers in China. The data was collected in May 2018 and contains 28 categories and 105 subcategories of POI types, which reflect the detailed geographical distribution of most urban functions and services in cities.
3.2. Analytical Framework
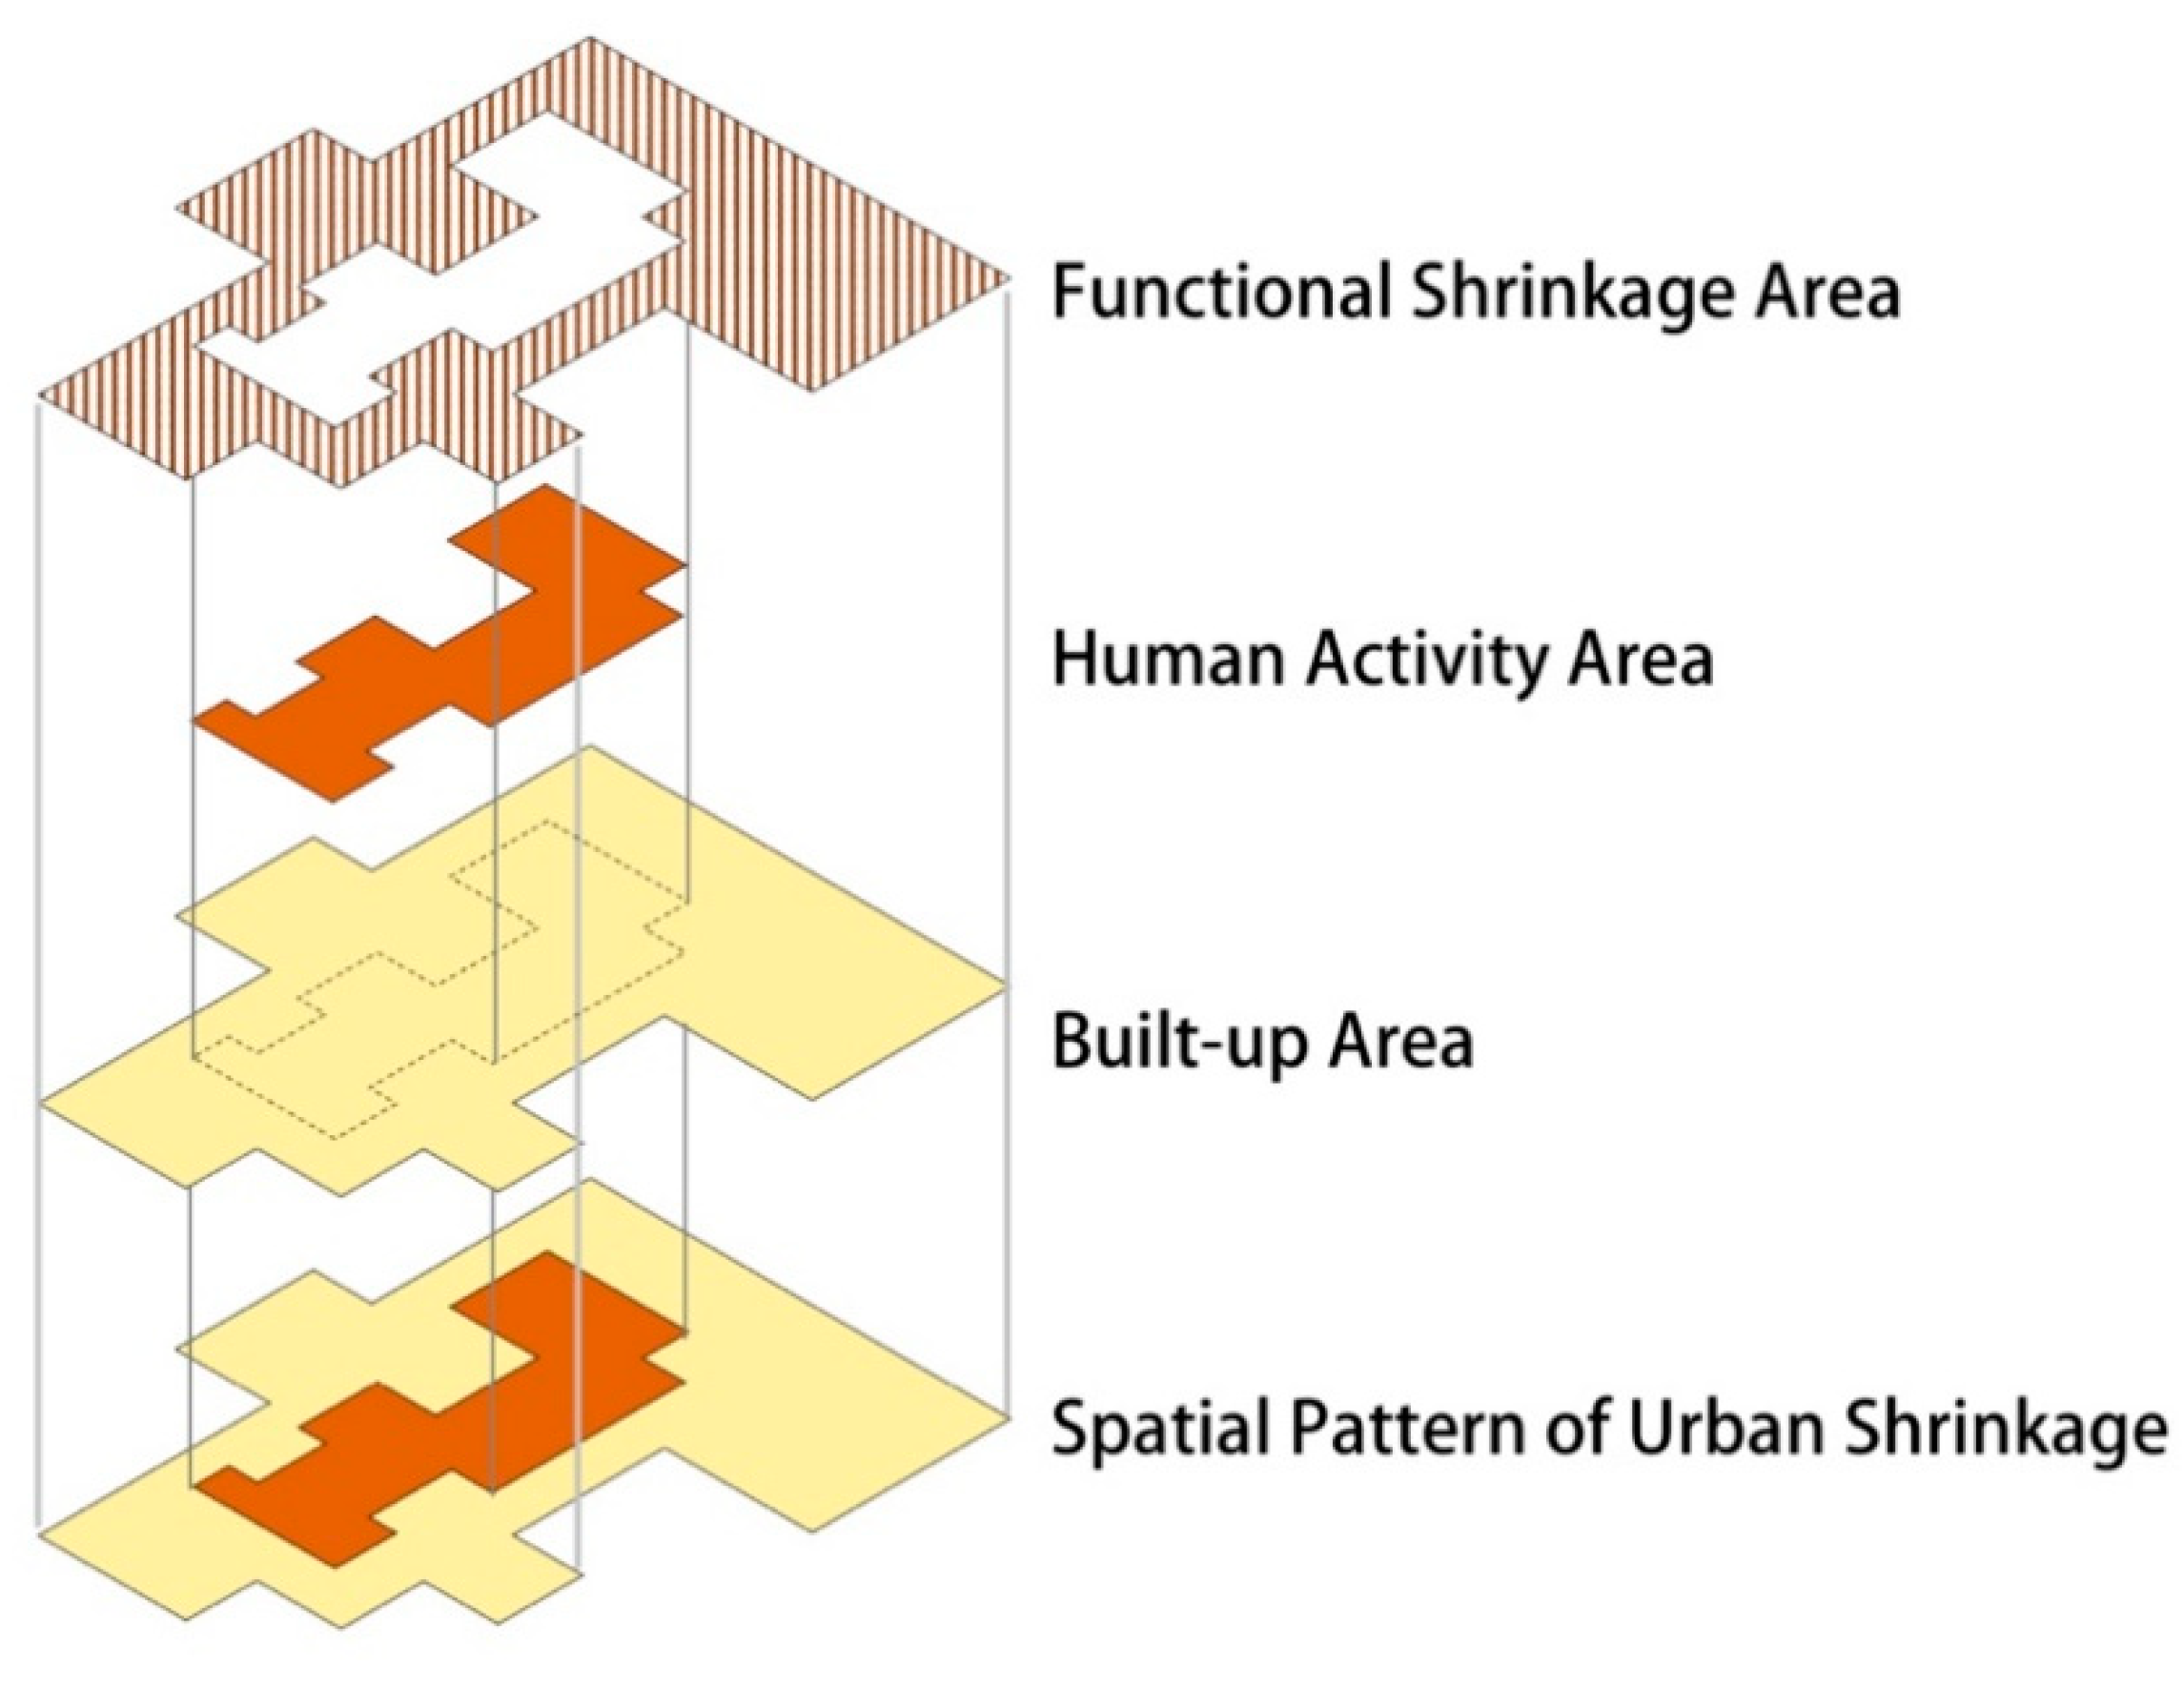
This study proposes a new concept, namely functional urban shrinkage, which is defined as the degree to which the two major aspects related to urban shrinkage, the human activity demand (the human dimension), and the supply of urban built-up areas and associated urban functions (the physical dimension) are mismatched geographically. We strategically focus on these two major aspects to develop a measure of functional shrinkage for a proof of concept and with no intention to include comprehensive dimensions for urban shrinkage in this study. That said, the proposed functional urban shrinkage concept can involve any other aspect, e.g., resources and economies, to develop new measures for urban shrinkage.
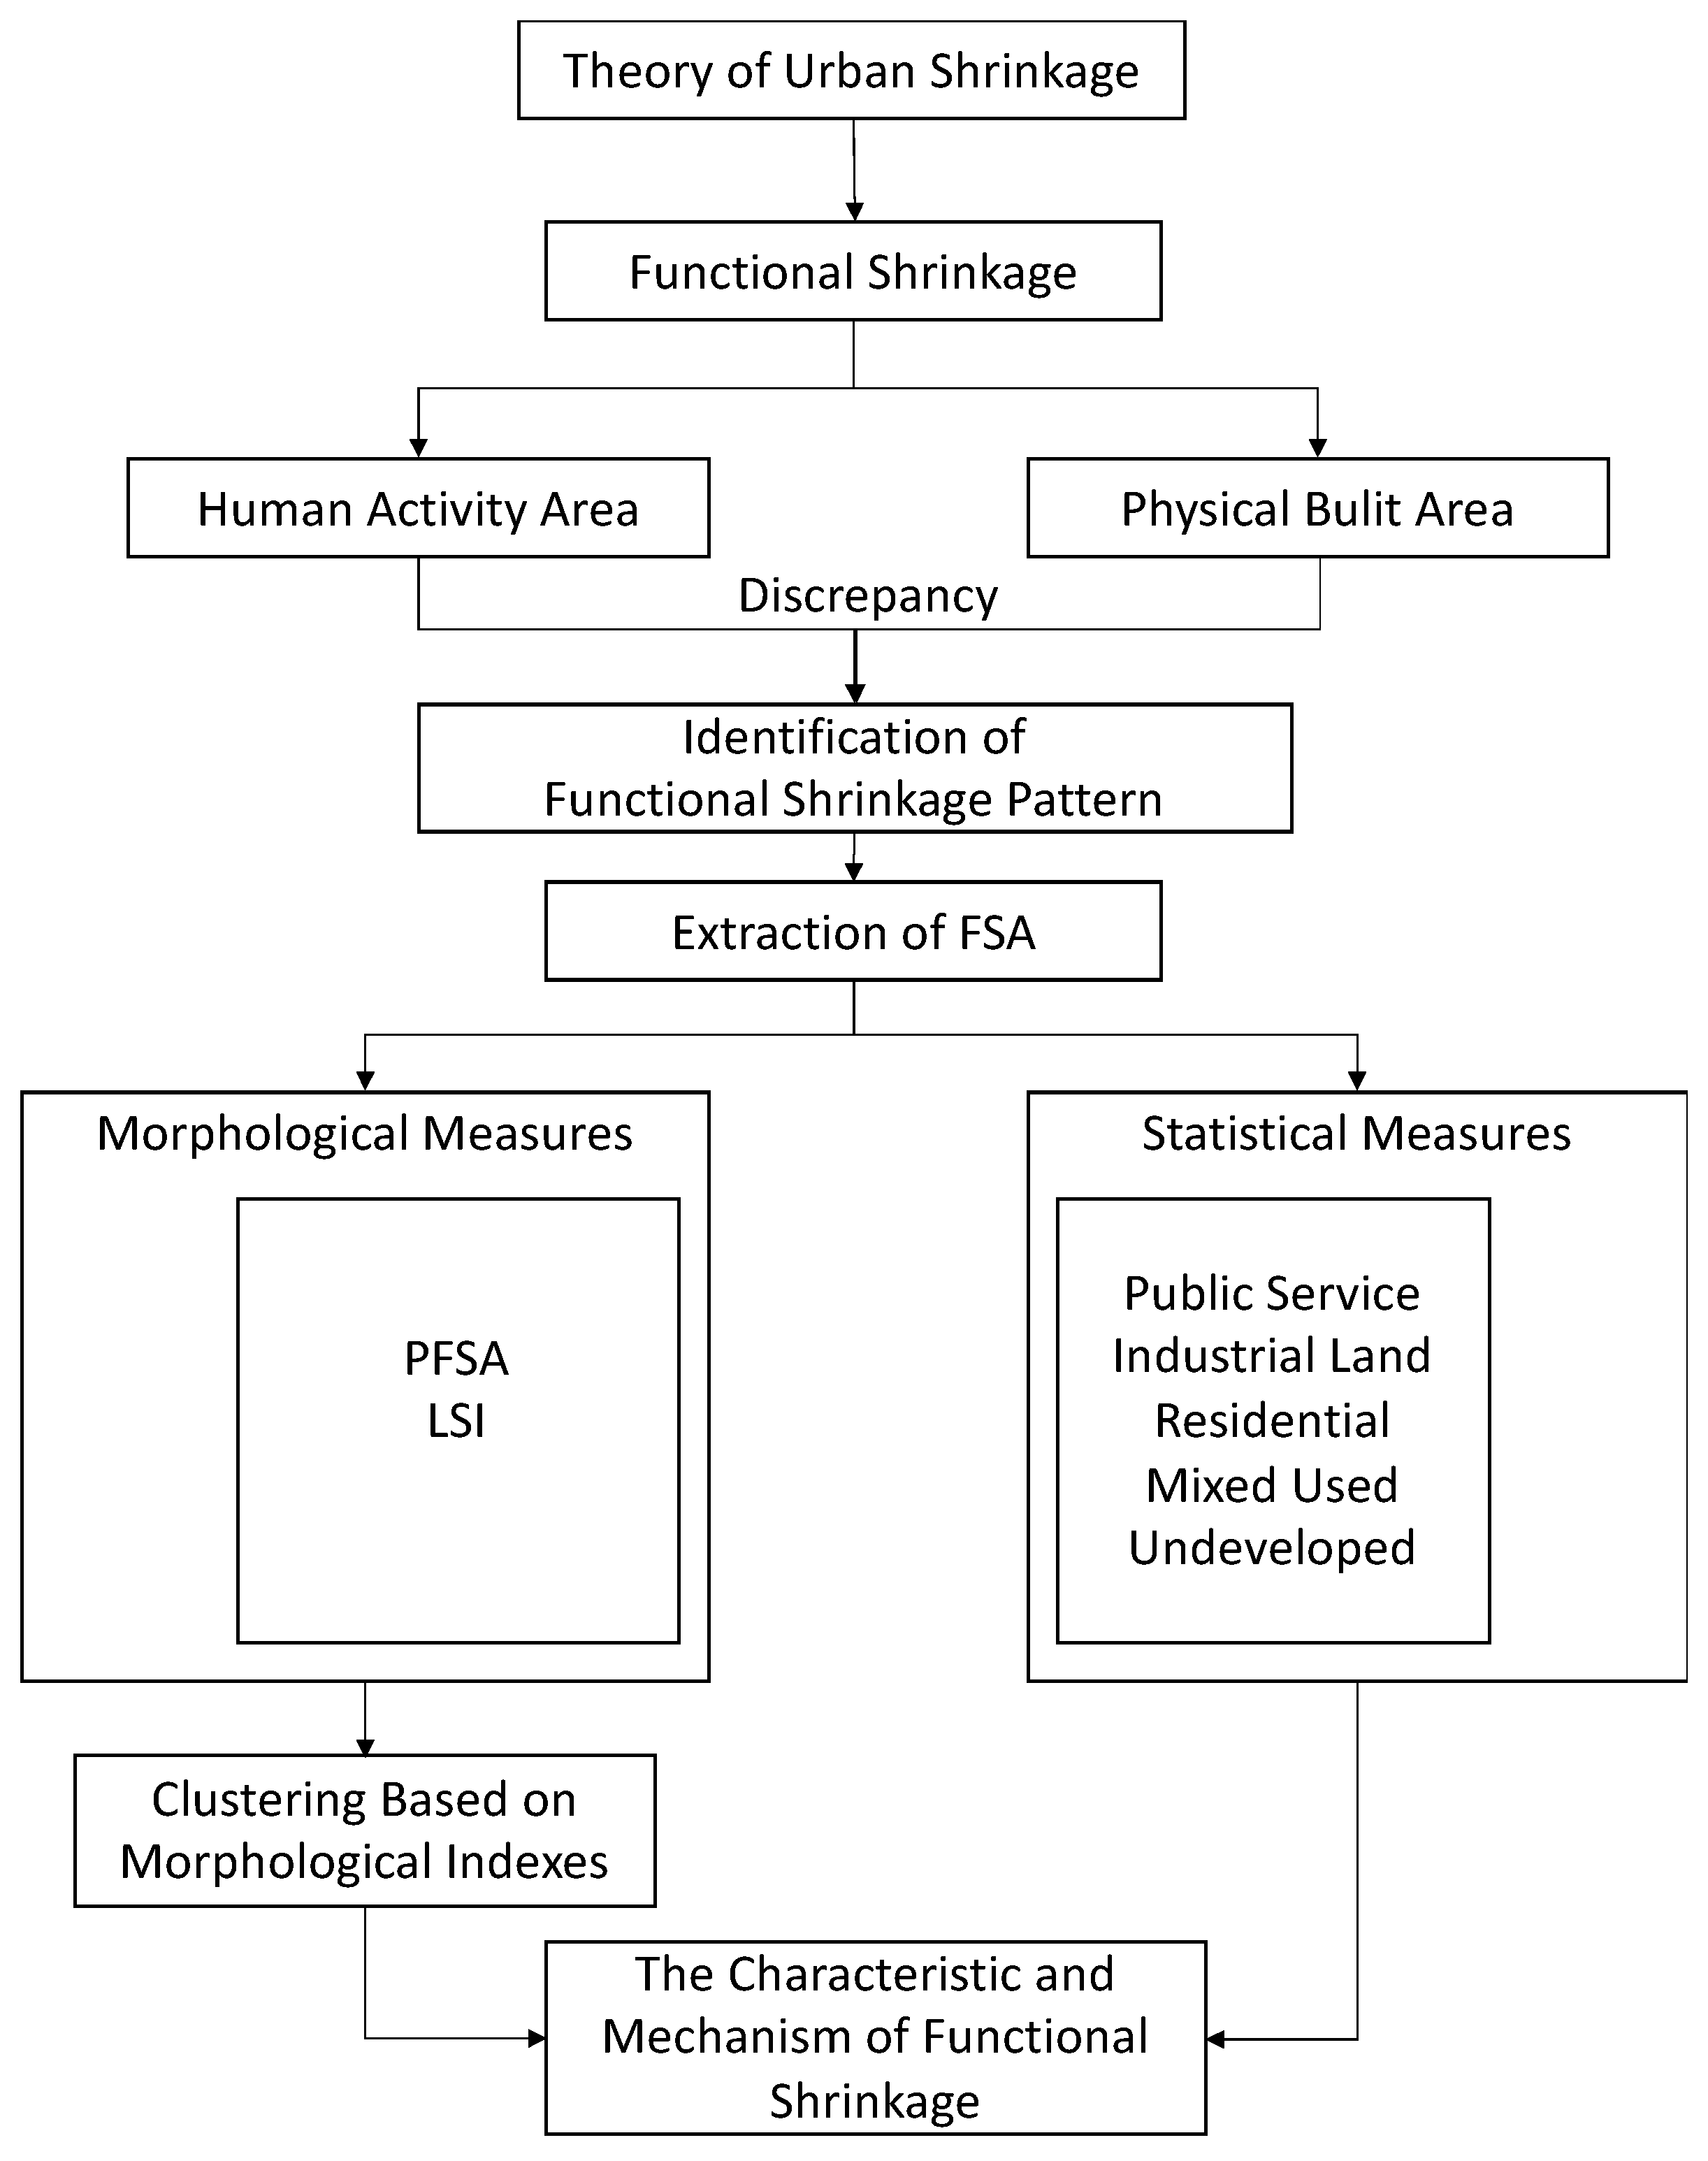
By leveraging multiple sources of geospatial big data, the human activity areas and the urban built-up areas are identified and delineated respectively to capture the population demand and the land-use supply. Specifically, human activity areas refer to the areas with the intensity of human activities significantly higher than the surrounding areas, while urban built-up areas are where urban land uses are concentrated within cities. Through a spatial comparison, the discrepant areas between the human activity areas and the urban built-up areas are formally defined as the Functional Shrinkage Areas (FSA). Then, the FSAs are characterized as follows: (1) morphological indices such as Percentage of Functional Shrinkage Areas (PFSA) and Landscape Shape Index (LSI) are employed to delineate the spatial layout of the FSAs; (2) statistical summaries provide the proportion of different urban land-use functions in FSAs. From the above dimensions, we are able to categorize and examine the status and characteristics of urban shrinkage for cities in the study area, and thus it enables a better understanding of the functional mechanism for urban shrinkage. The above processes are summarized as a general analytical framework for measuring functional urban shrinkage in
Figure 1. This framework is applied to the case study of BTH megaregion to demonstrate its validity. As it was developed as a standard framework based on the functional urban shrinkage concept, it could be applied to any spatial scale, e.g., city, region, and country, to measure the functional shrinkage patterns.
3.3. Extracting Functional Shrinkage Areas
3.3.1. Identifying City Extent Based on Built-Up Areas Extracted from Landsat-8 Data
The identification of urban areas involves five steps that were completed with tools from ENVI and ArcGIS software packages. The technical processes are depicted in
Figure 2.
First, data pre-processing. The L1TP data product of Landsat-8 provides radiometric and geodetic accuracy by incorporating ground control points while employing a Digital Elevation Model for topographic displacement. As the L1TP data are not corrected for atmospheric conditions, the FLAASH Atmospheric Correction tool in ENVI was applied to atmospherically correct the data. Further, Radiometric Calibration was applied to ensure the data quality and rescale the L1TP image in the unit of digital numbers to surface reflectance for further processing.
Second, urban land-cover classification. Given the complexity of urban areas that may contain different types of land cover, we used 7 bands from Landsat-8 (bands 1–7) to first classify the study area into six land covers: built-up, water, green space, agriculture land, unused land, and others. Regions of interests were manually selected as the training data for the six land-cover types, respectively, capturing the spectral features of different types in the supervised classification. The training set includes 261,363 sample cells (80,699 for urban and 180,664 for non-urban cells). The Neural Net algorithm in ENVI was employed, as it has shown a superior performance over other algorithms provided by ENVI in supervised classification tasks with Landsat-8 data [
45]. The Neural Net algorithm implements a feedforward neural network with standard backpropagation [
46]. Specifically, we set model parameters as follows, 1 hidden layer with a fixed number of neurons, training Root Mean Square error as 0.1 for model exit criteria, and training rate as 0.2, while keeping all other parameters as the default setting.
Third, post classification. To evaluate classification results, we first evaluate the training accuracy of the neural network model. As we focus on the built-up areas, the confusion matrix is simplified to include only built-up and non-built-up (water, green space, agriculture land, unused land, and others) categories (
Table 1). The Overall Accuracy and the Kappa Coefficient are 90.8% and 0.79, respectively. In particular, the producer and user accuracies for built-up areas are 91.93% and 80.9%. Therefore, the training performance of the model is acceptable. The six land covers classified from step 2 were further processed and converted into two categories, namely urban (built-up) and non-urban (water, green space, agriculture land, unused land, and others) areas. Specifically, two types of processing were performed. First, the “Clump Class” method based on mathematical morphology operators (corrosion and dilation) was used to merge many fragmented small patches together. Second, as there were some patches of non-built-up land covers located within urban areas, such as parks and lakes, these patches were merged into the urban category to ensure urban areas were spatially contiguous.
Fourth, city extent extraction: GIS-based methods were used to vectorize the cells classified as urban areas to produce the city extent map (
Figure A1).
Fifth, validation with Google Earth high-resolution images. We further tested the validity of the extract urban area by generating a validation dataset containing 2500 random samples in the study area for accuracy assessment. The true values of the validation samples are obtained from the Google Earth high-resolution images by visual interpretation.
Table 2 shows the validation accuracies for the urban and non-urban categories, which indicates a good performance of the model and validates the classification results.
3.3.2. Identifying Human Activity Areas
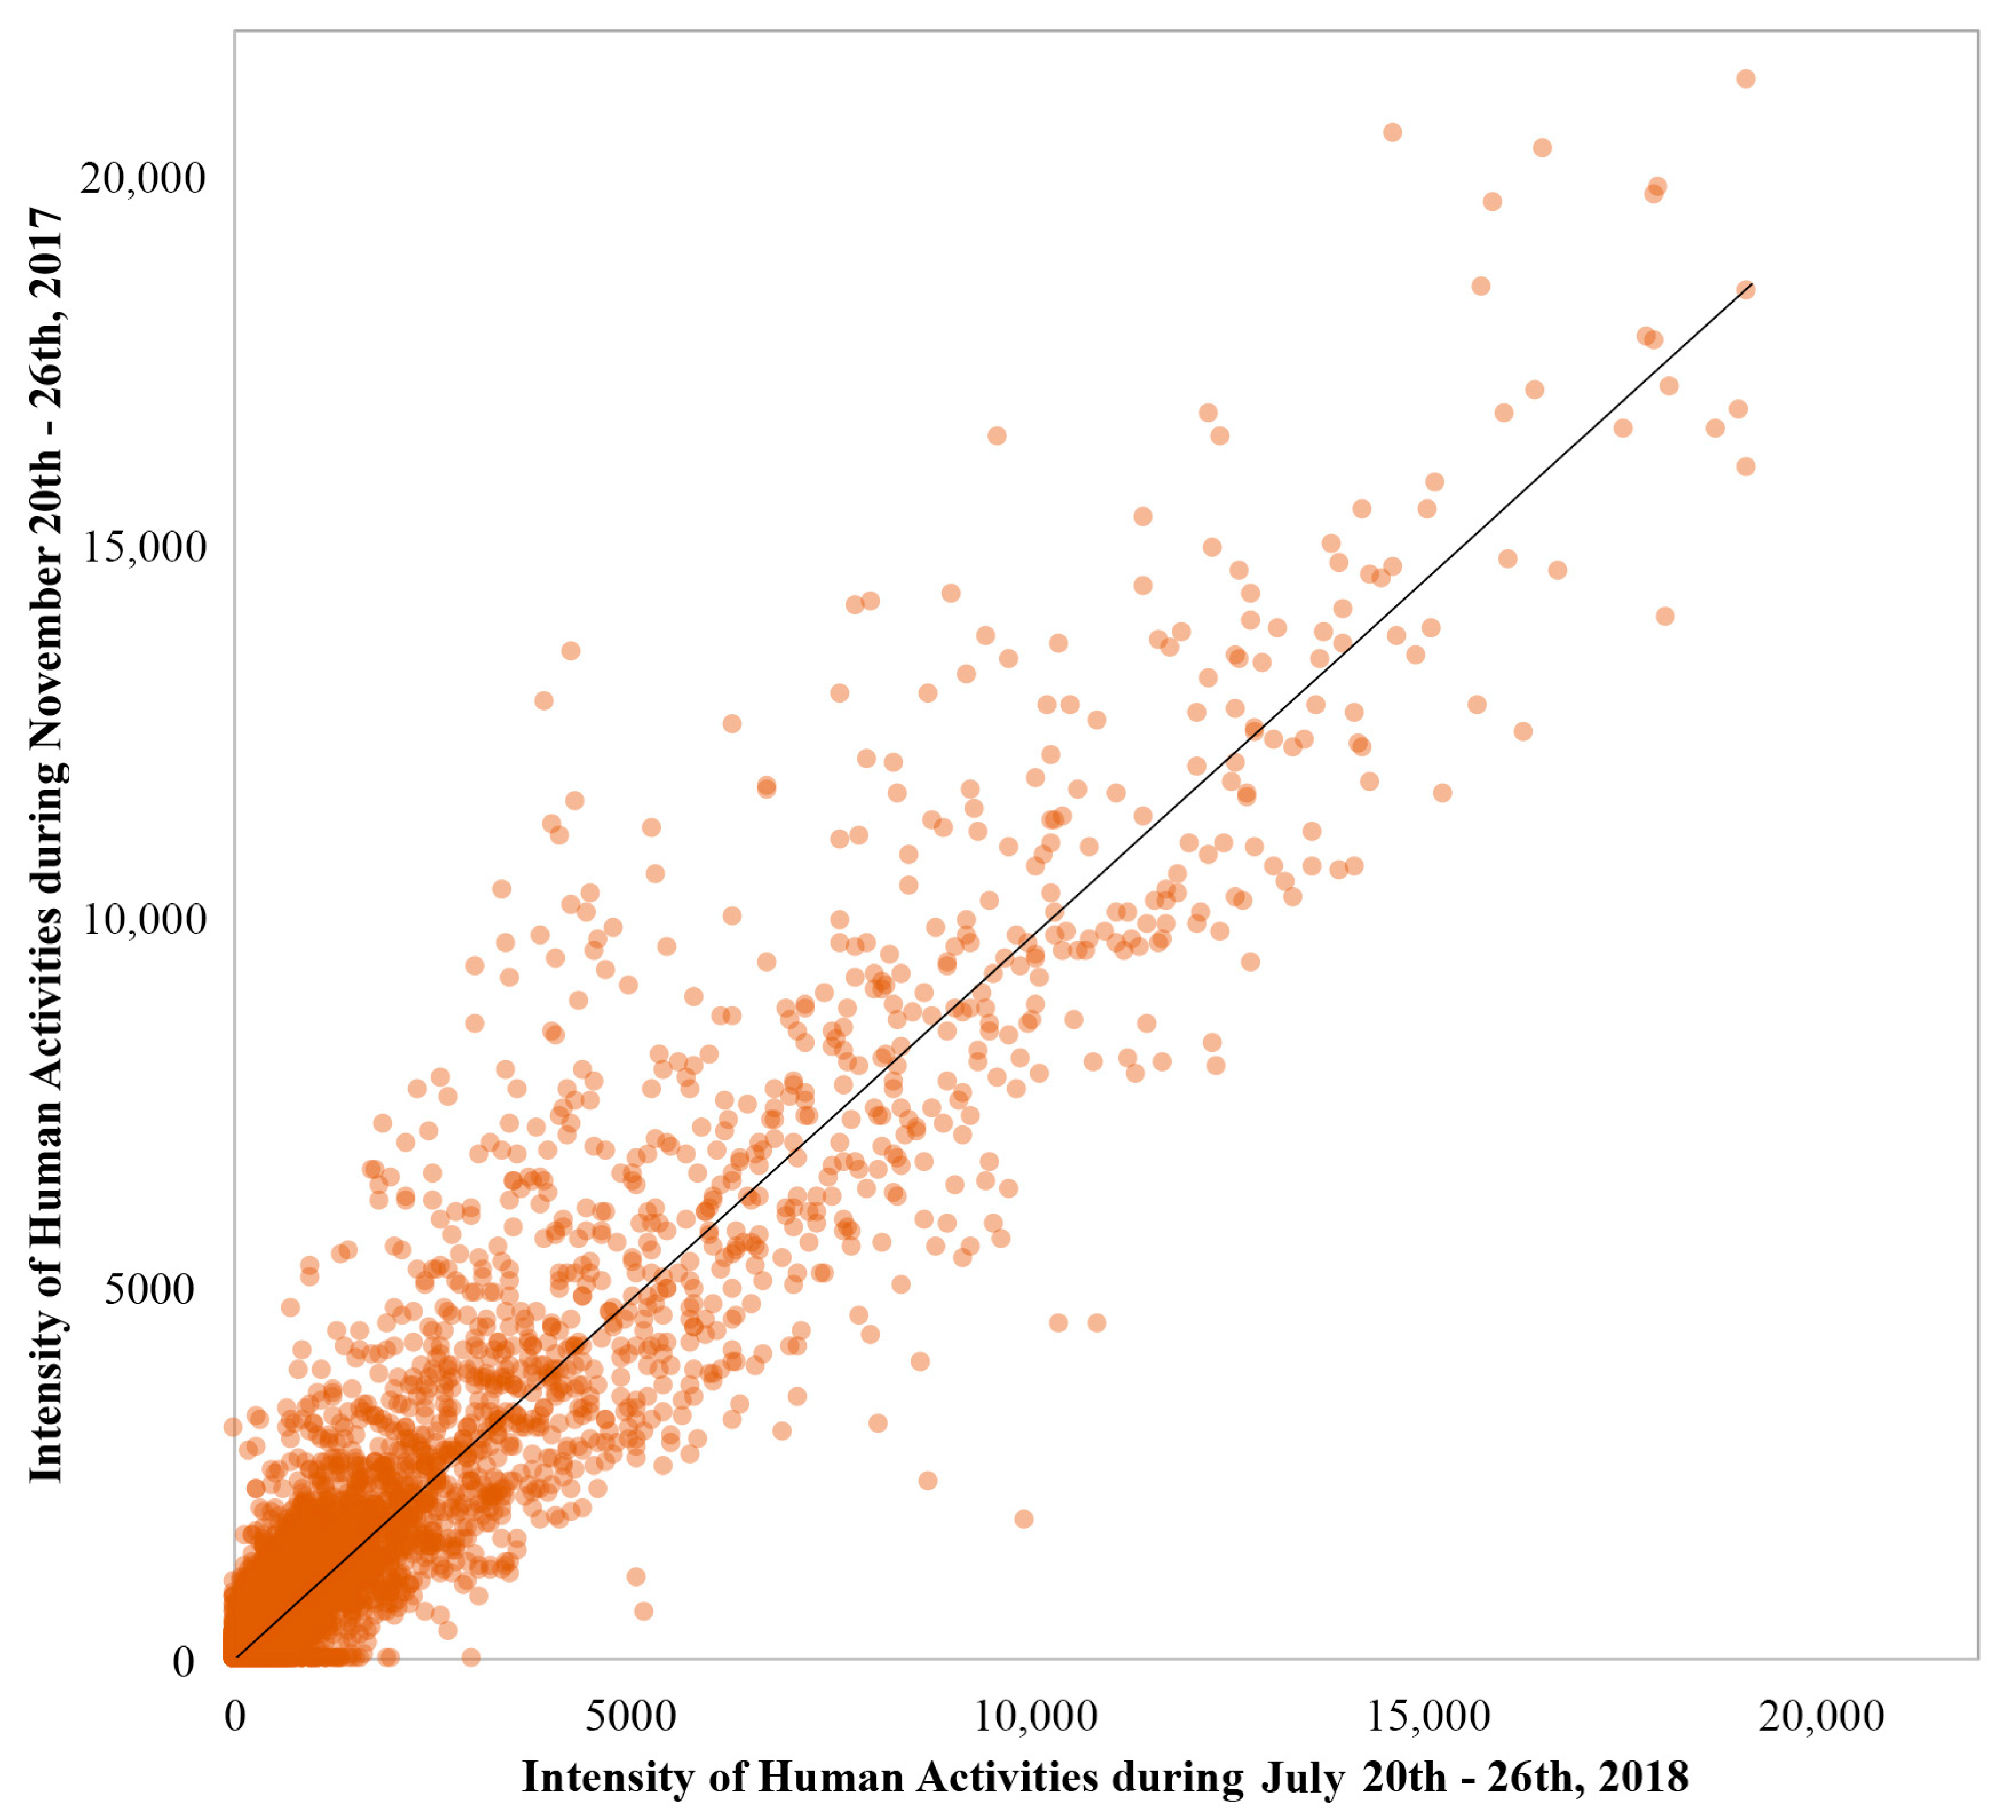
Human activity areas are defined as urban areas having a significantly high and stable ambient population density, i.e., the hotspot areas where human activities are located. In other words, these areas accommodate significantly intensive human activities showing consistent behavioral properties, such as shopping, schooling, working and commuting, and their extents do not vary much over time. It is assumed that the ambient population density revealed by the cellular signaling data for a week (20–26 July) in 2018 can be a representative to reflect the extent of significantly intensive human activities across spatial regions for a typical day. To support this assumption, evidence provided here tests the correlation across locations in Beijing between the ambient population density for the period of the 20th to 26th July 2018 and that for the period of the 20th to 26th November 2017 (data for both periods are from the same source, China Unicom), with a Pearson correlation coefficient of 0.94 (
Figure A2). This indicates high similarity between the ambient population densities in Beijing for the two different time periods. Therefore, it is reasonably valid to have the above assumption, given the definition of human activity areas and the limited time period, the cellular signaling data is available for this study.
The identification of human activity areas is technically performed as follows. First, the ambient population intensity of each spatial unit in the study area for a typical day is calculated based on the cellular signaling data. Second, hotspot areas with significantly high intensity are identified by a spatial clustering method. Ambient population density refers to the average intensity of periodic human activities in the region. The daily-averaged intensity of human activity per unit area is considered as the ambient population density of the region [
47]. Ambient population density reflects the purpose-based utilization of urban space; therefore, many studies use this index to study urban economic and social conditions [
44,
47]. The calculation of the ambient population density
for unit
j is as follows:
where
is the number of individuals active in unit j at the kth day;
is the area of the unit; k is the total number of days.
Second, after obtaining the ambient population density of each unit, a spatial clustering algorithm, namely AMOEBA [
48], is used to identify the human activity area. Unlike other spatial clustering algorithms such as spatial scan statistics [
49], AMOEBA is a bottom-up and contiguity-based clustering algorithm that can detect spatially contiguous, compact, and irregular-shaped clusters. Furthermore, as AMOEBA is a method to detect local patterns of spatial clustering or concentration of high/low values, it can be adaptive to the heterogenous urbanization situations in a large region. For example, an industrial park having the human activity intensity higher than that of the surrounding areas can be effectively identified as a local hotspot even though its intensity is not high globally. Specifically, to identify the hotspots for human activity, the algorithm starts from arbitrary seed units and attempts to iteratively expand the cluster towards neighboring units with the aim of maximizing the local
statistic [
50,
51], defined as follows:
The spatial weight equal to 1 if unit j is a neighbor of unit i, and 0 otherwise. n is the total number of units, and is the mean value of all . With the identified clusters from all predetermined seeds, Monte-Carlo simulations were carried out to select the clusters that pass the statistical significance level of 99% as the identified human activity areas.
3.3.3. Identifying the Functional Shrinkage Area
According to the definition of FSA in
Section 3.2, the difference between the built-up areas and the human activity areas was extracted through spatial overlay as the functional shrinkage areas, as demonstrated in
Figure 3.
3.4. Characterizing Functional Shrinkage Areas
3.4.1. Spatial Characteristics
We focus on two characteristics of the spatial distribution of functional shrinkage areas. The first is the Percentage of Functional Shrinkage Areas (PFSA) in the total urban built-up areas. The second is the fragmentation degree of functional shrinkage areas distributed in cities measured by the Landscape Shape Index (LSI) [
52]. The calculation of PFSA is as follows:
where
refers to the ith patch in the functional shrinkage area, and A is the total area of the urban built-up areas. The value of PFSA is between 0 and 100, and a larger value indicates serious functional shrinkage of the city, or considerable spatial difference between the human activity area and urban built-up area. The calculation of LSI is as follows:
where
represents the shared edge length between the functional shrinkage area and the human activity area. LSI is essentially the boundary density of the functional shrinkage zone standardized by the area of the urban built-up area. Since the value of LSI has been standardized, it can be used to compare functional shrinkage patterns between cities with different sizes. After the calculation of PFSA and LSI of functional shrinkage areas in each city, we further cluster the cities. In order to improve the performance of clustering, the Fuzzy C-Means clustering algorithm was used. The detailed description of this algorithm can be found in the relevant literature [
53].
3.4.2. Urban Land-Use Functions
To investigate the characteristics and dynamic mechanisms of functional shrinkage, we further analyzed the areas of five urban land-use functions according to the existing land-use classification standards [
29,
54] within the functional shrinkage areas extracted in
Section 3.3. The five land uses are: (1) public service, all types of land with public service function; (2) industrial land, including production-related land such as science and technology parks, industrial parks and logistics parks; (3) residential land, mainly including residential areas in the city, “village in the city” and other residential land; (4) mixed-use land. If a study unit (1 km × 1 km cell) contains more than 3 types of land use and the land use is balanced, it will be defined as the mixed land type. (5) Undeveloped land, including the construction land and sporadic bare land to be developed. As the land-use survey data have the full coverage of the functional shrinkage areas, they were combined with the POI data to fill in the missing areas with urban land-use functions and to create a layer of polygon vector data that is categorized by the above five urban land uses. Then, the areas of different land uses were produced by the spatial overlay of extracted functional shrinkage areas and the urban land-use polygon data.
4. Results
The human activity areas and the built-up areas for 13 cities in BTH are extracted (
Figure A1 and
Figure A3). The results (
Table 3) show that functional shrinkage has become a relatively common phenomenon across cities in BTH, which contrasts the fact that this region is one of the fastest-growing urban agglomerations (in terms of population and GDP) in China.
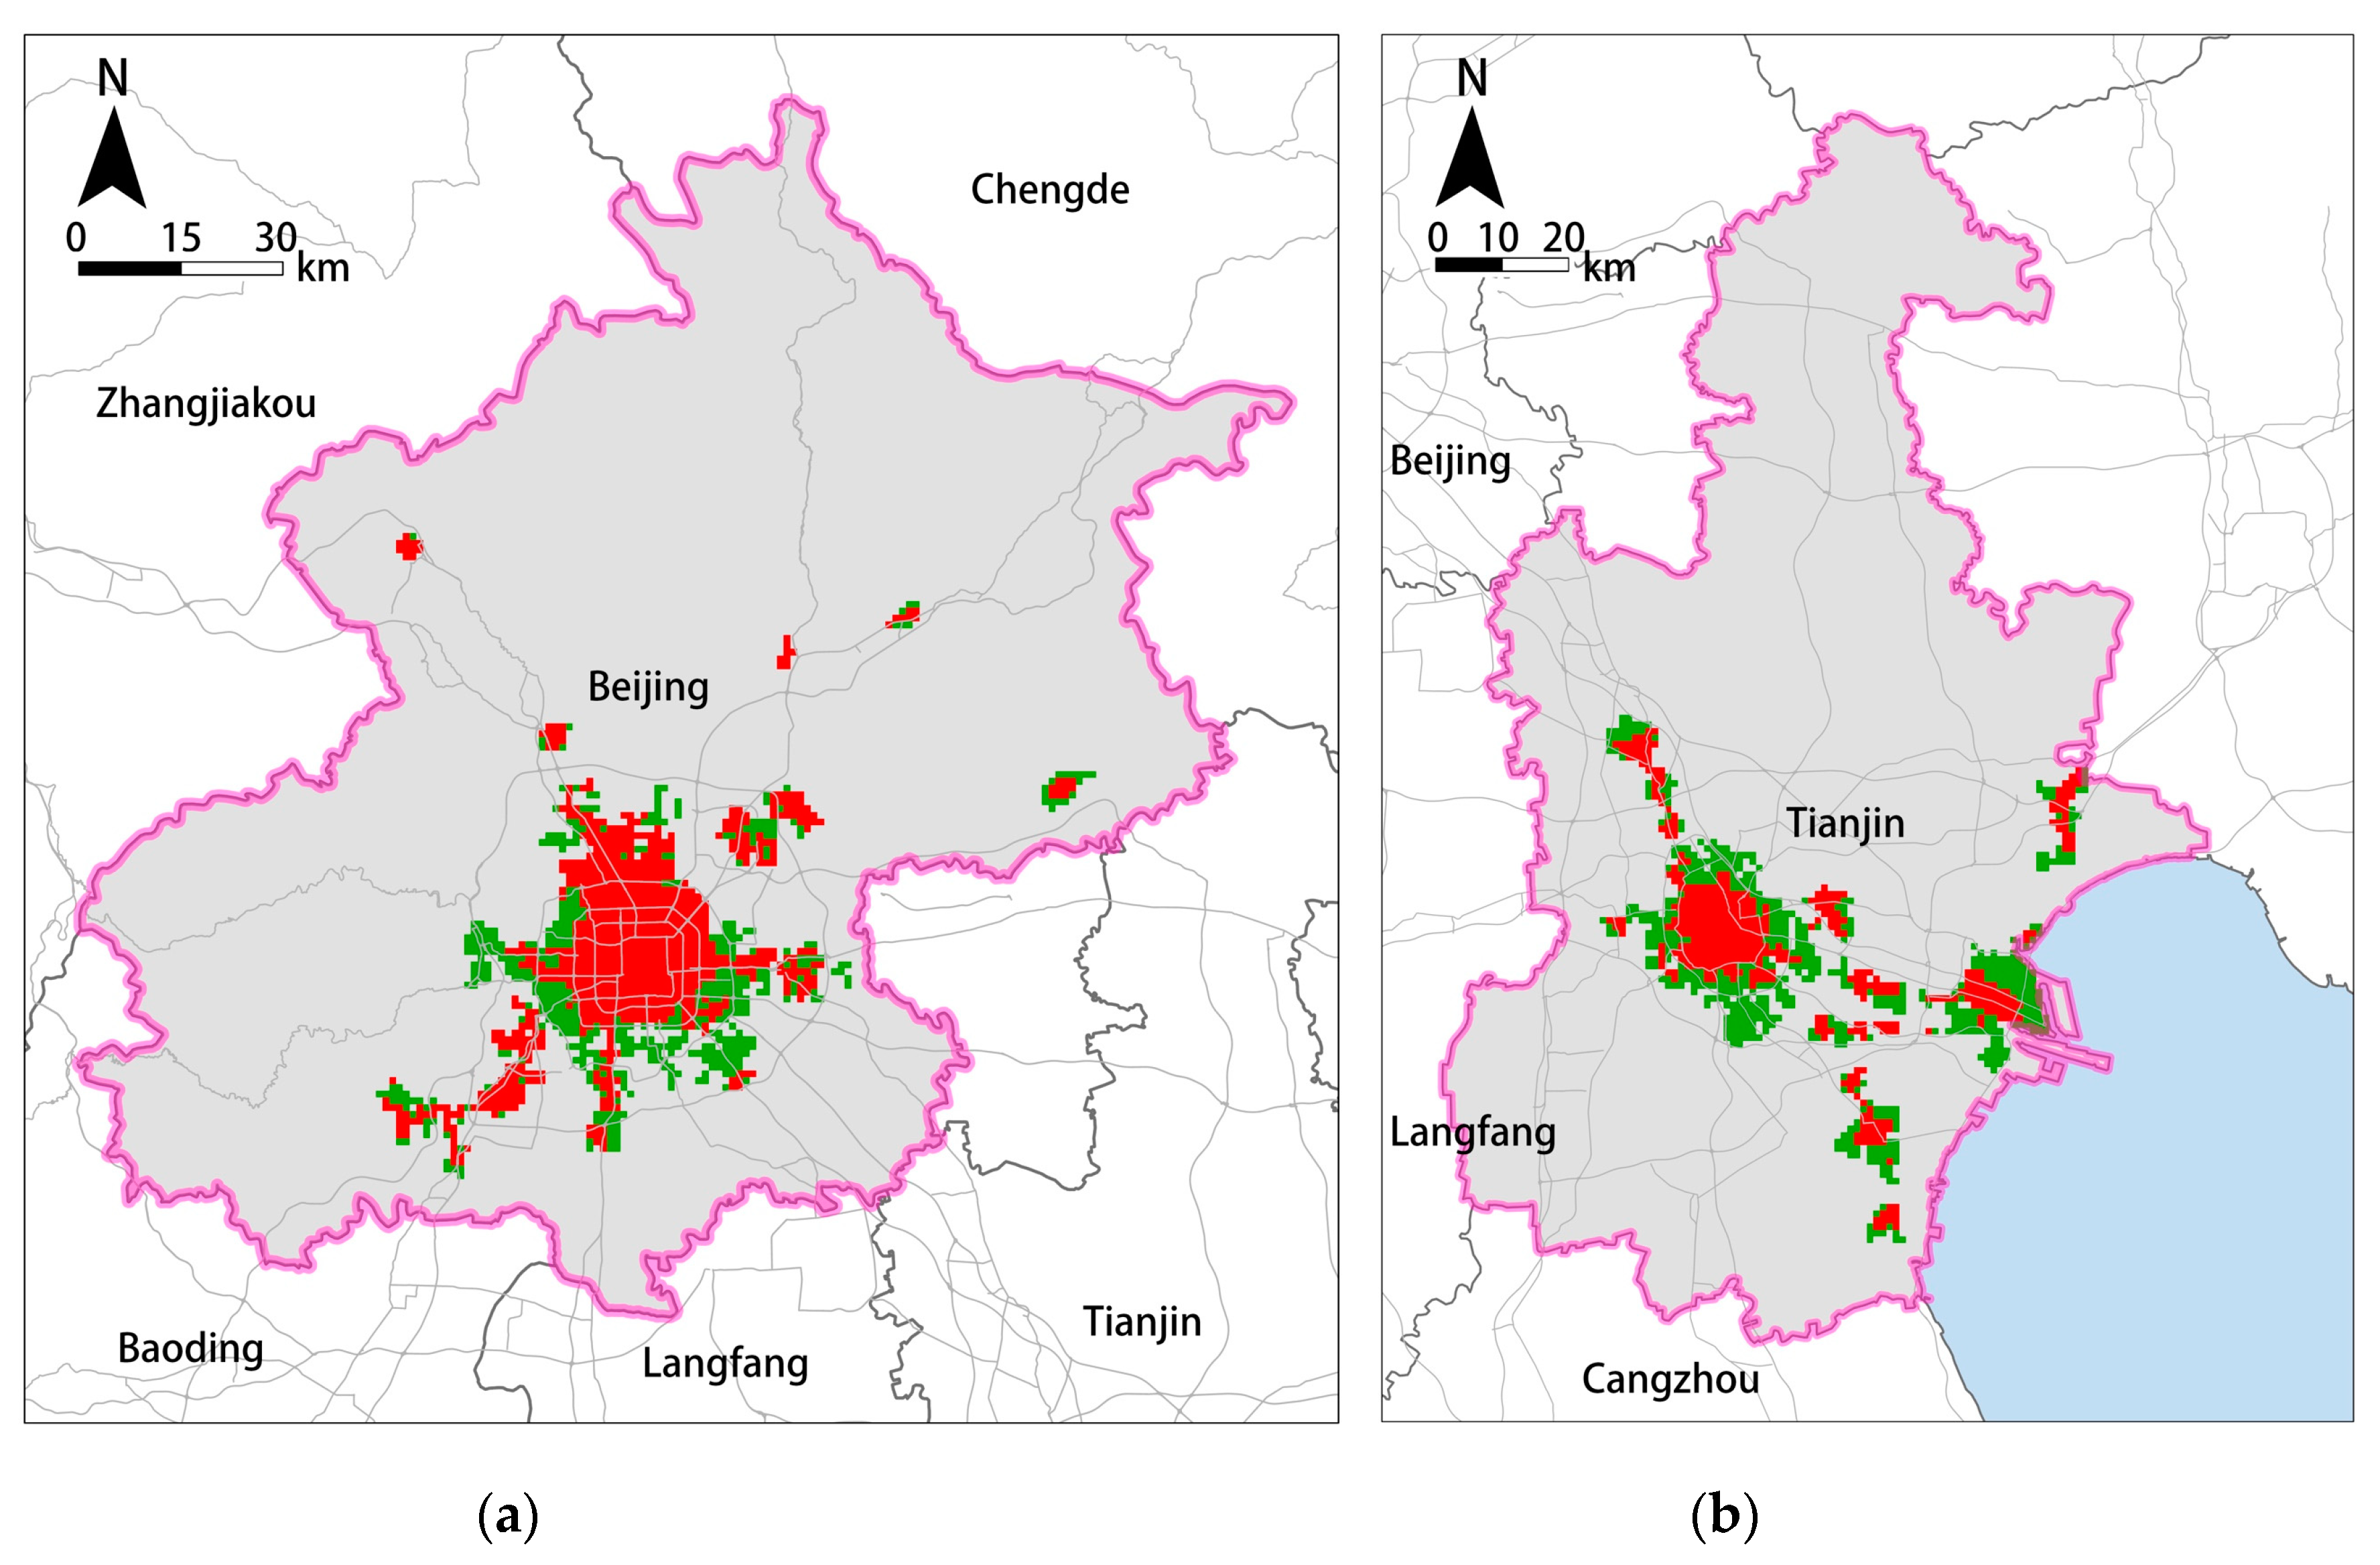
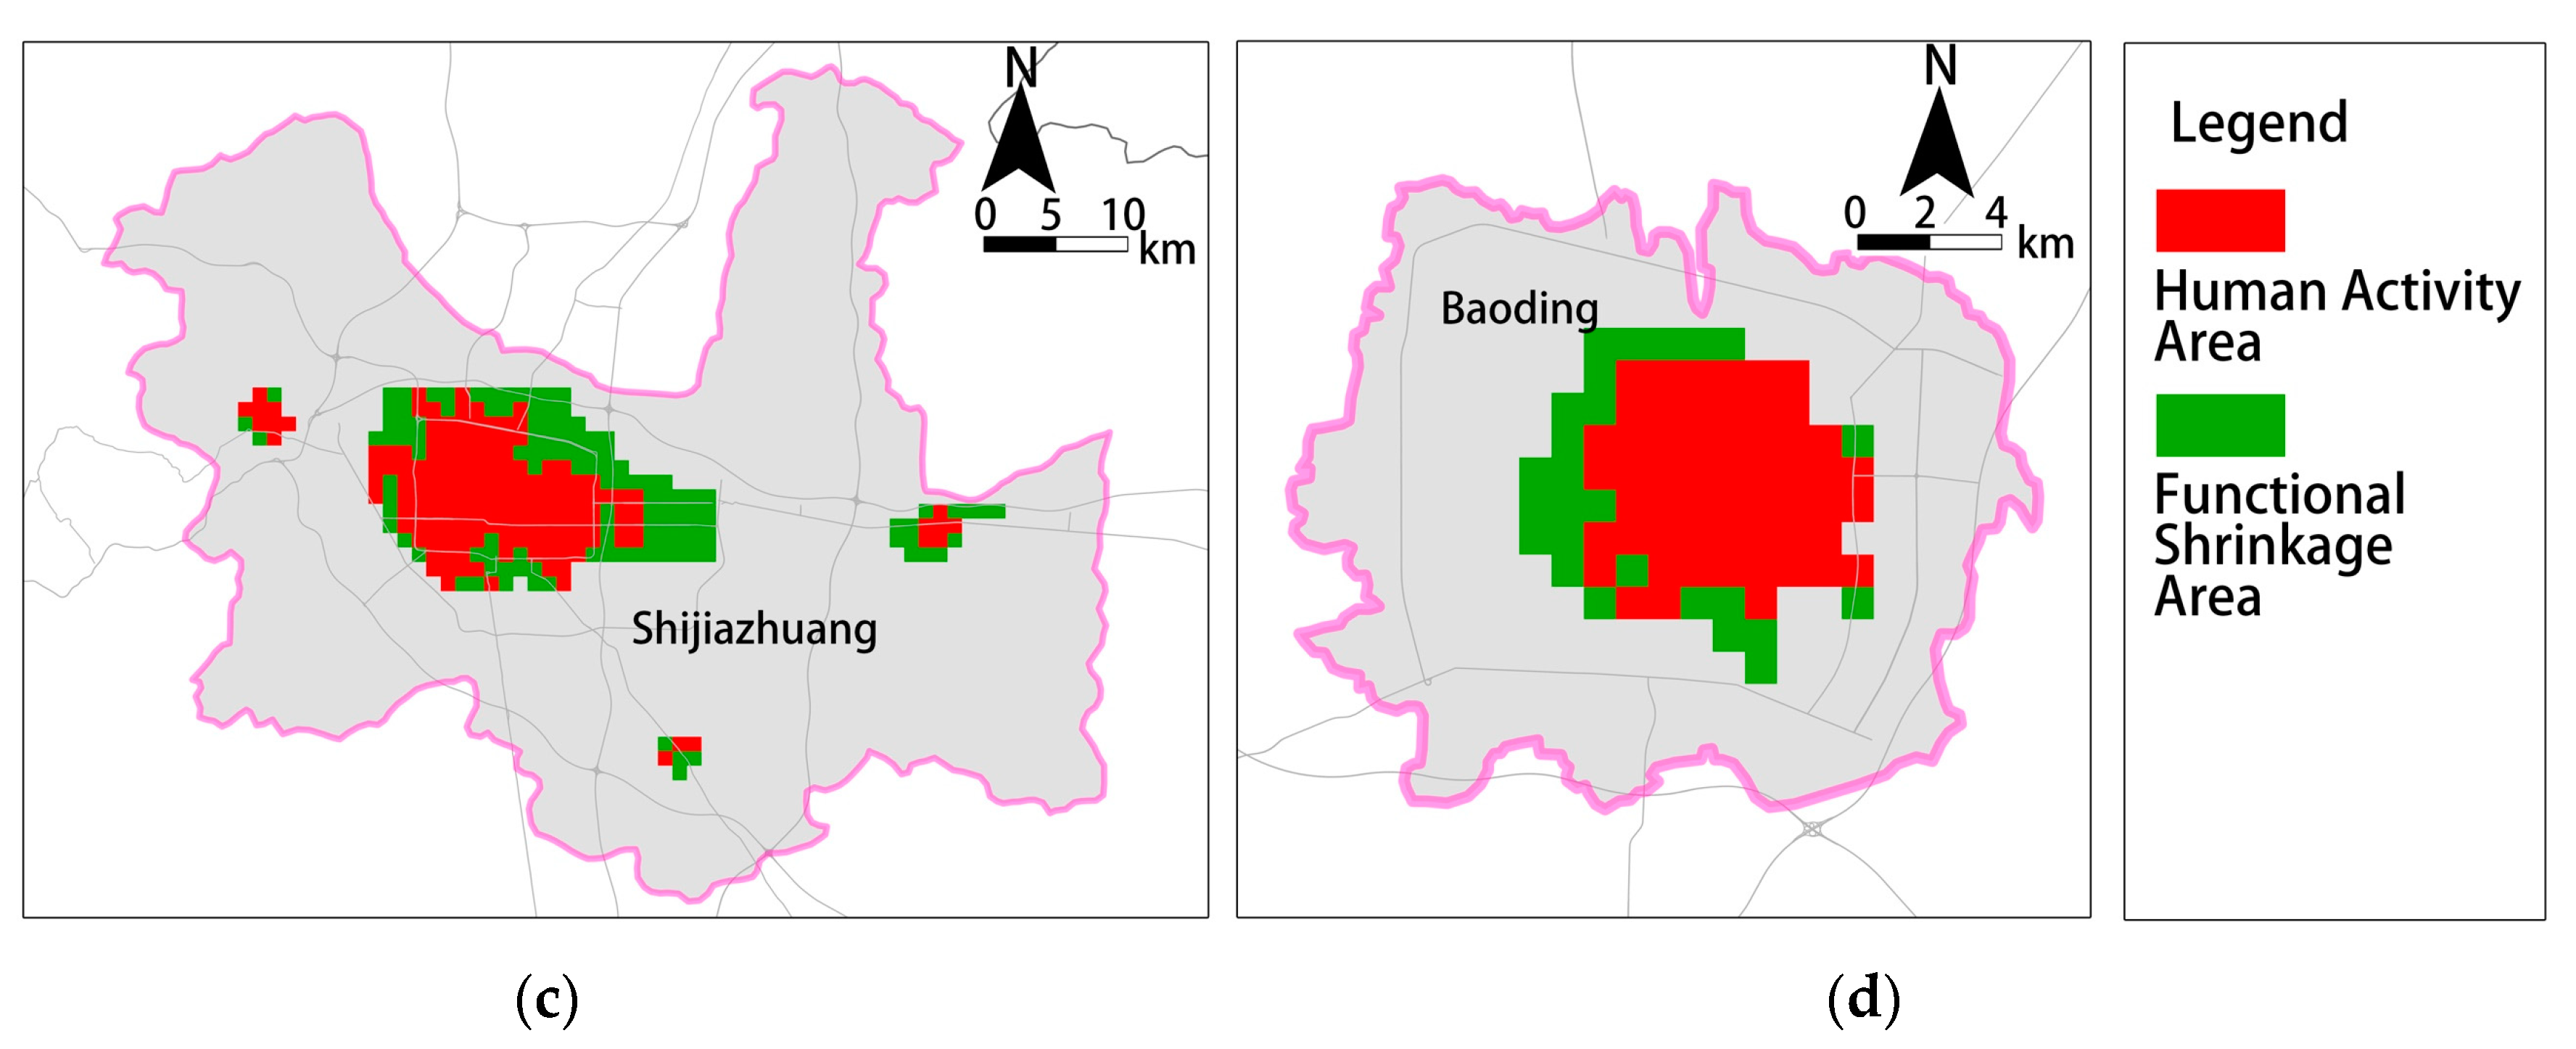
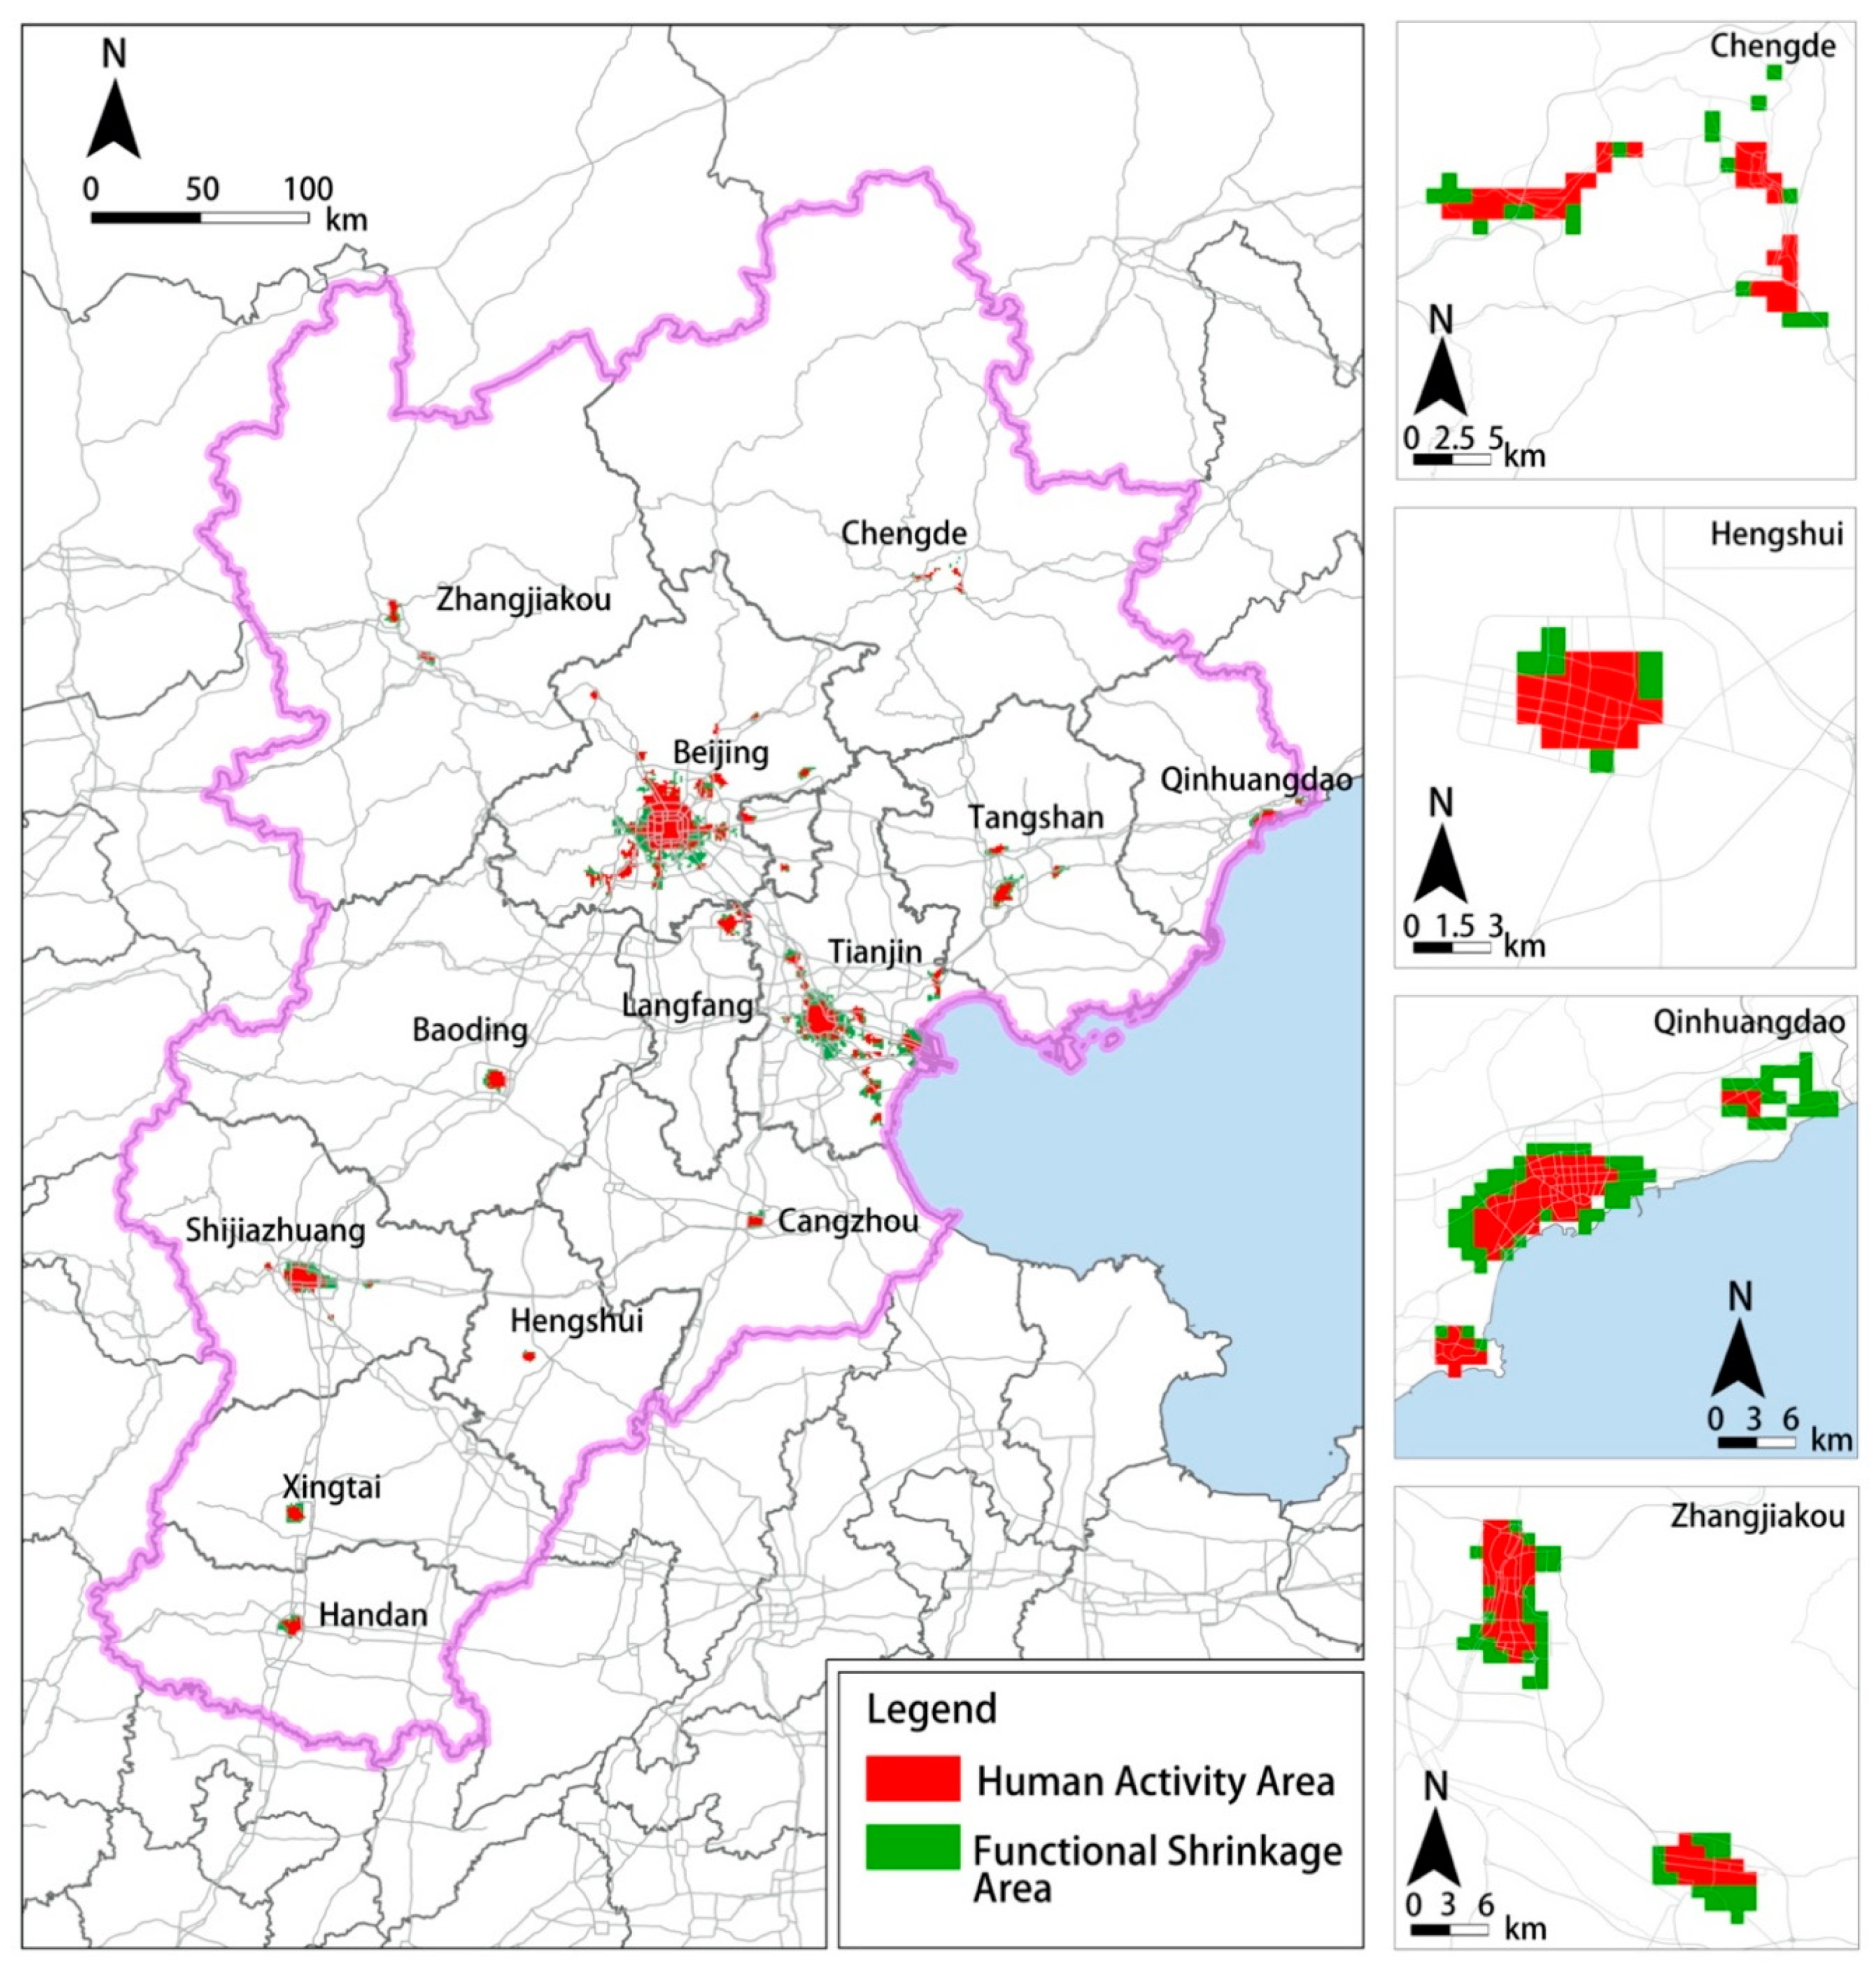
The spatial distribution of the FSAs exhibits some common patterns for most cities (
Figure A3). They are generally found outside the city centers and mostly in suburbs or industrial parks. Some of the new districts and the industrial parks at the urban fringe have less attractiveness to activities and have shown a low usage of lands. In contrast, the old city areas of all cities in our study area did not show a sign of functional shrinkage. This suggests that suburbanization is not evident in this region and the old city areas have a strong attraction to human activities.
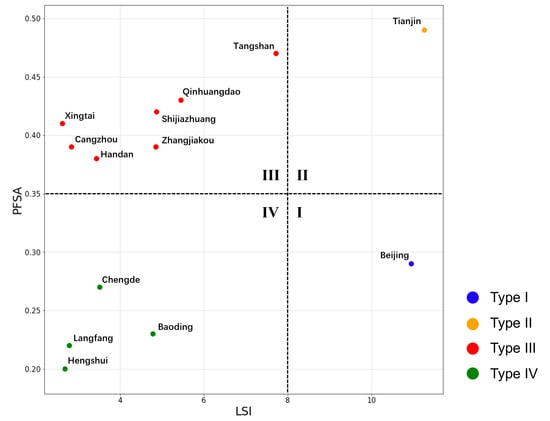
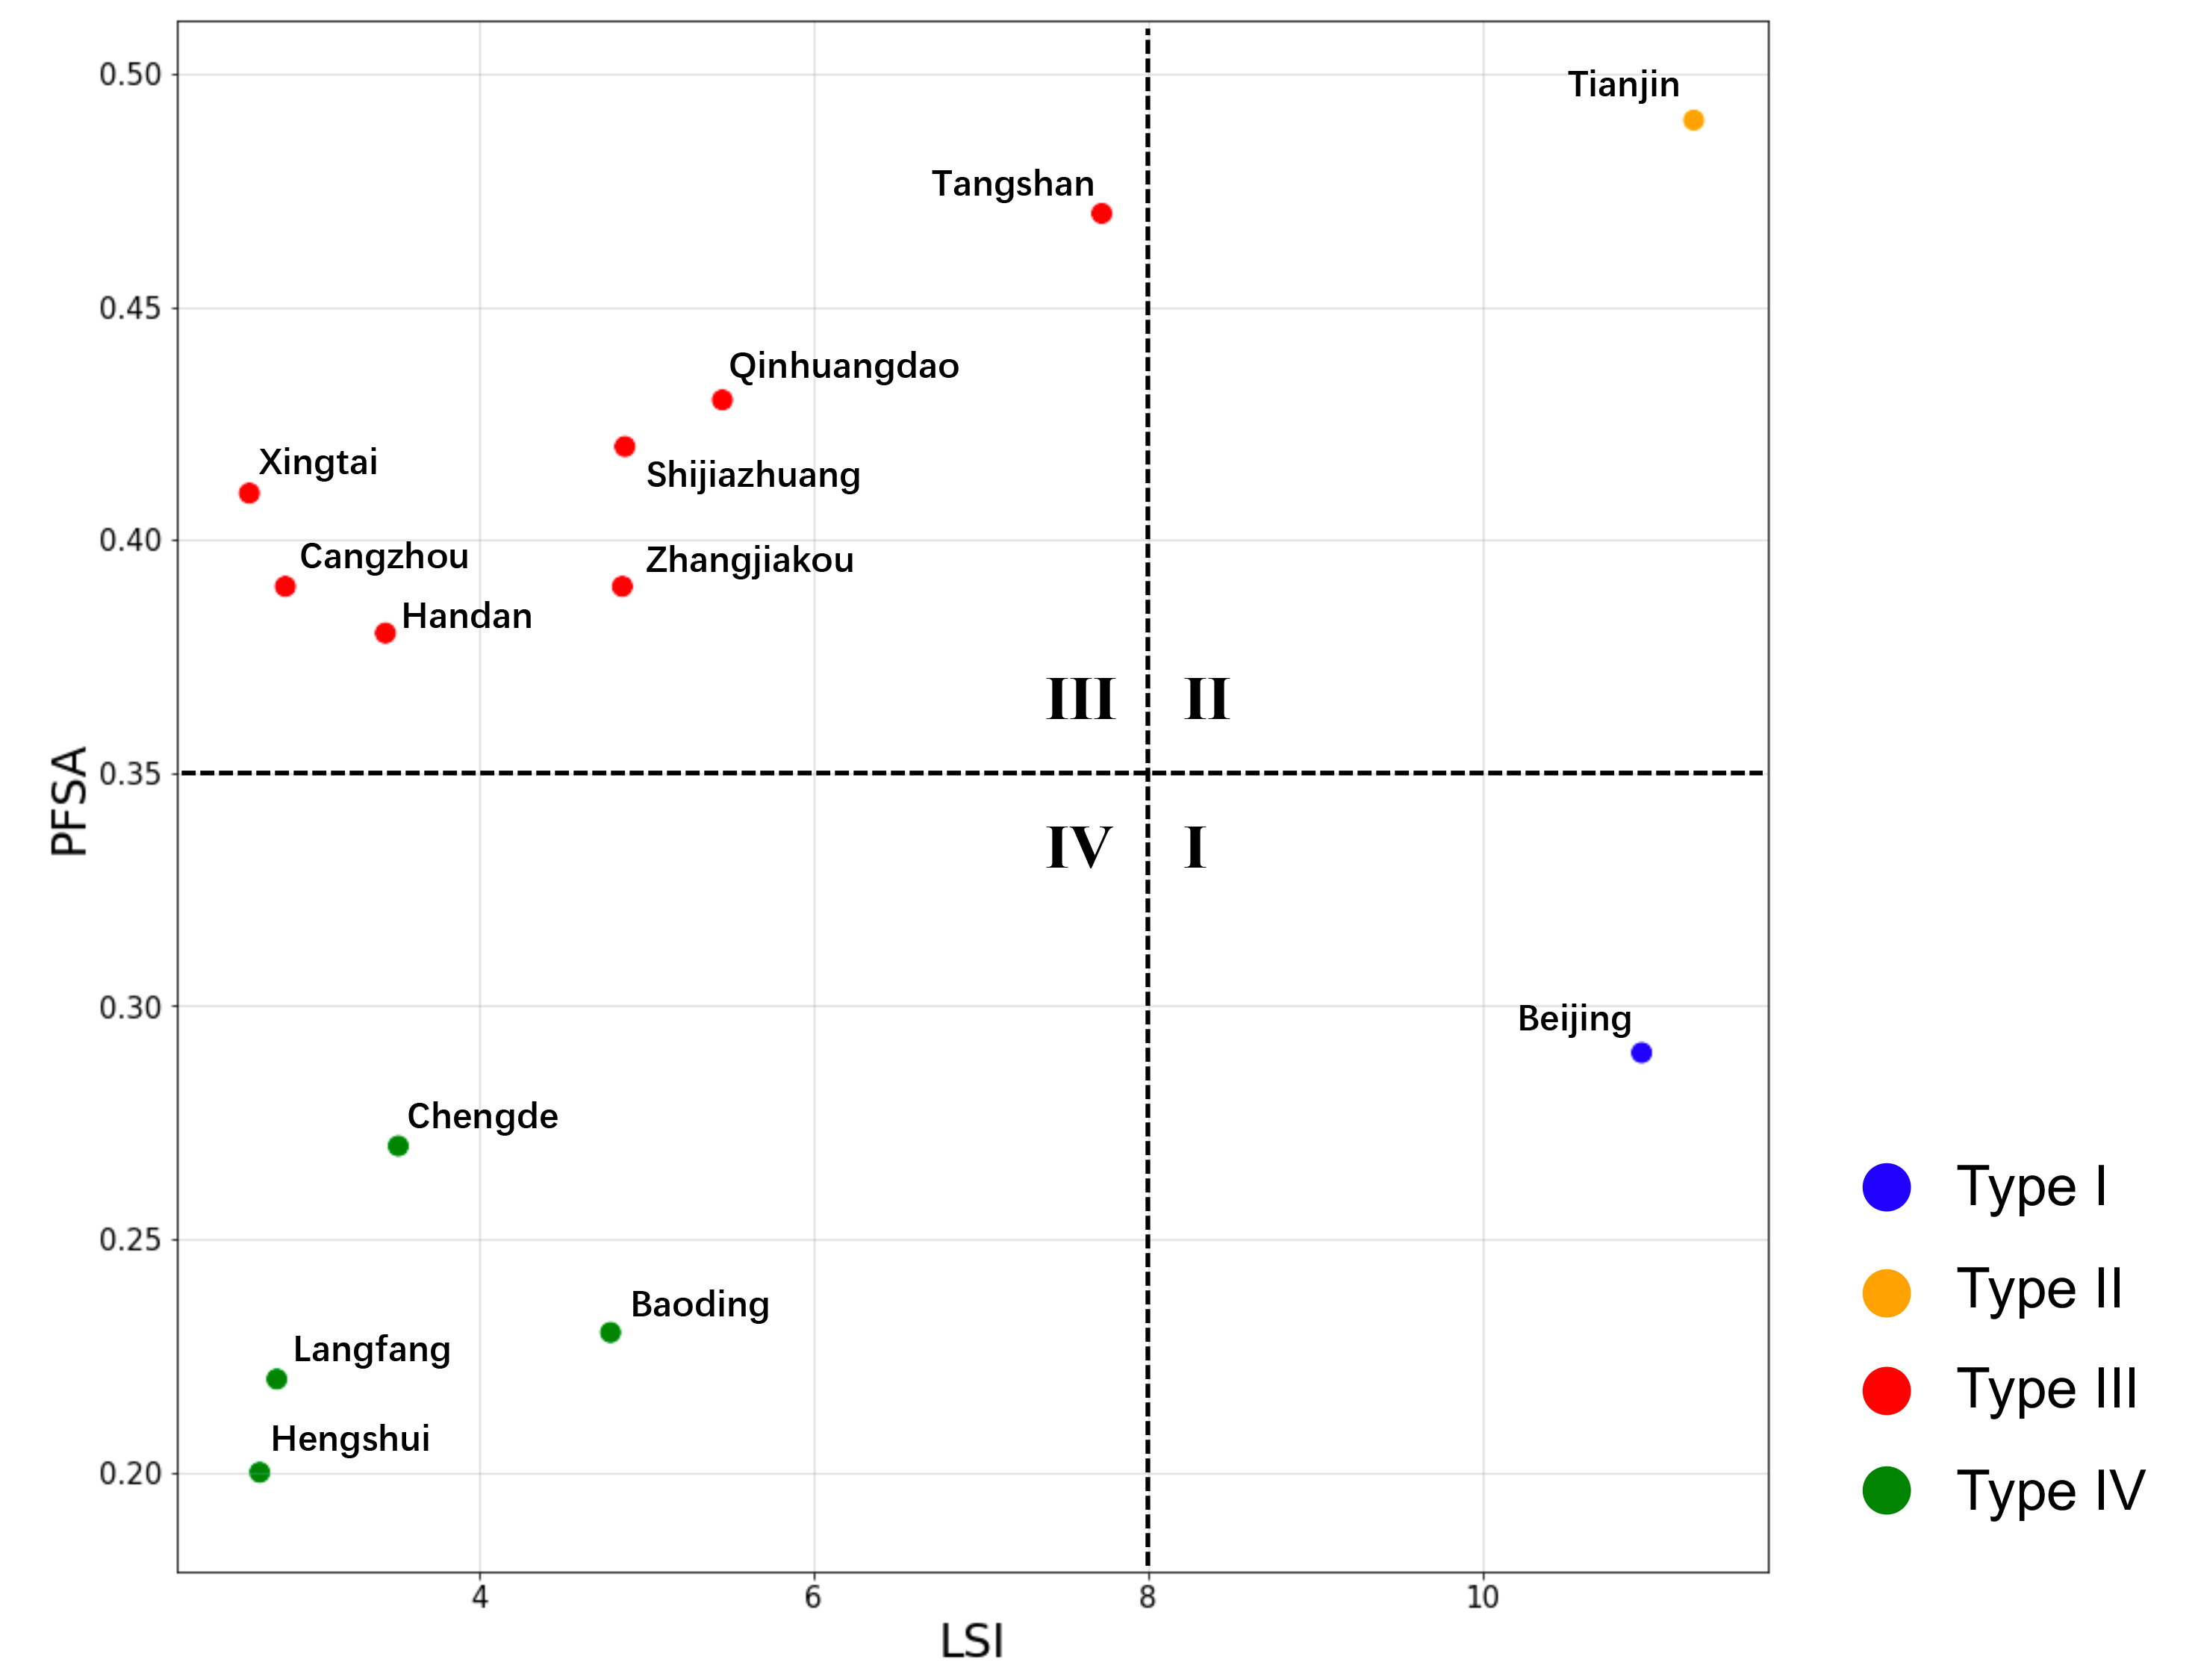
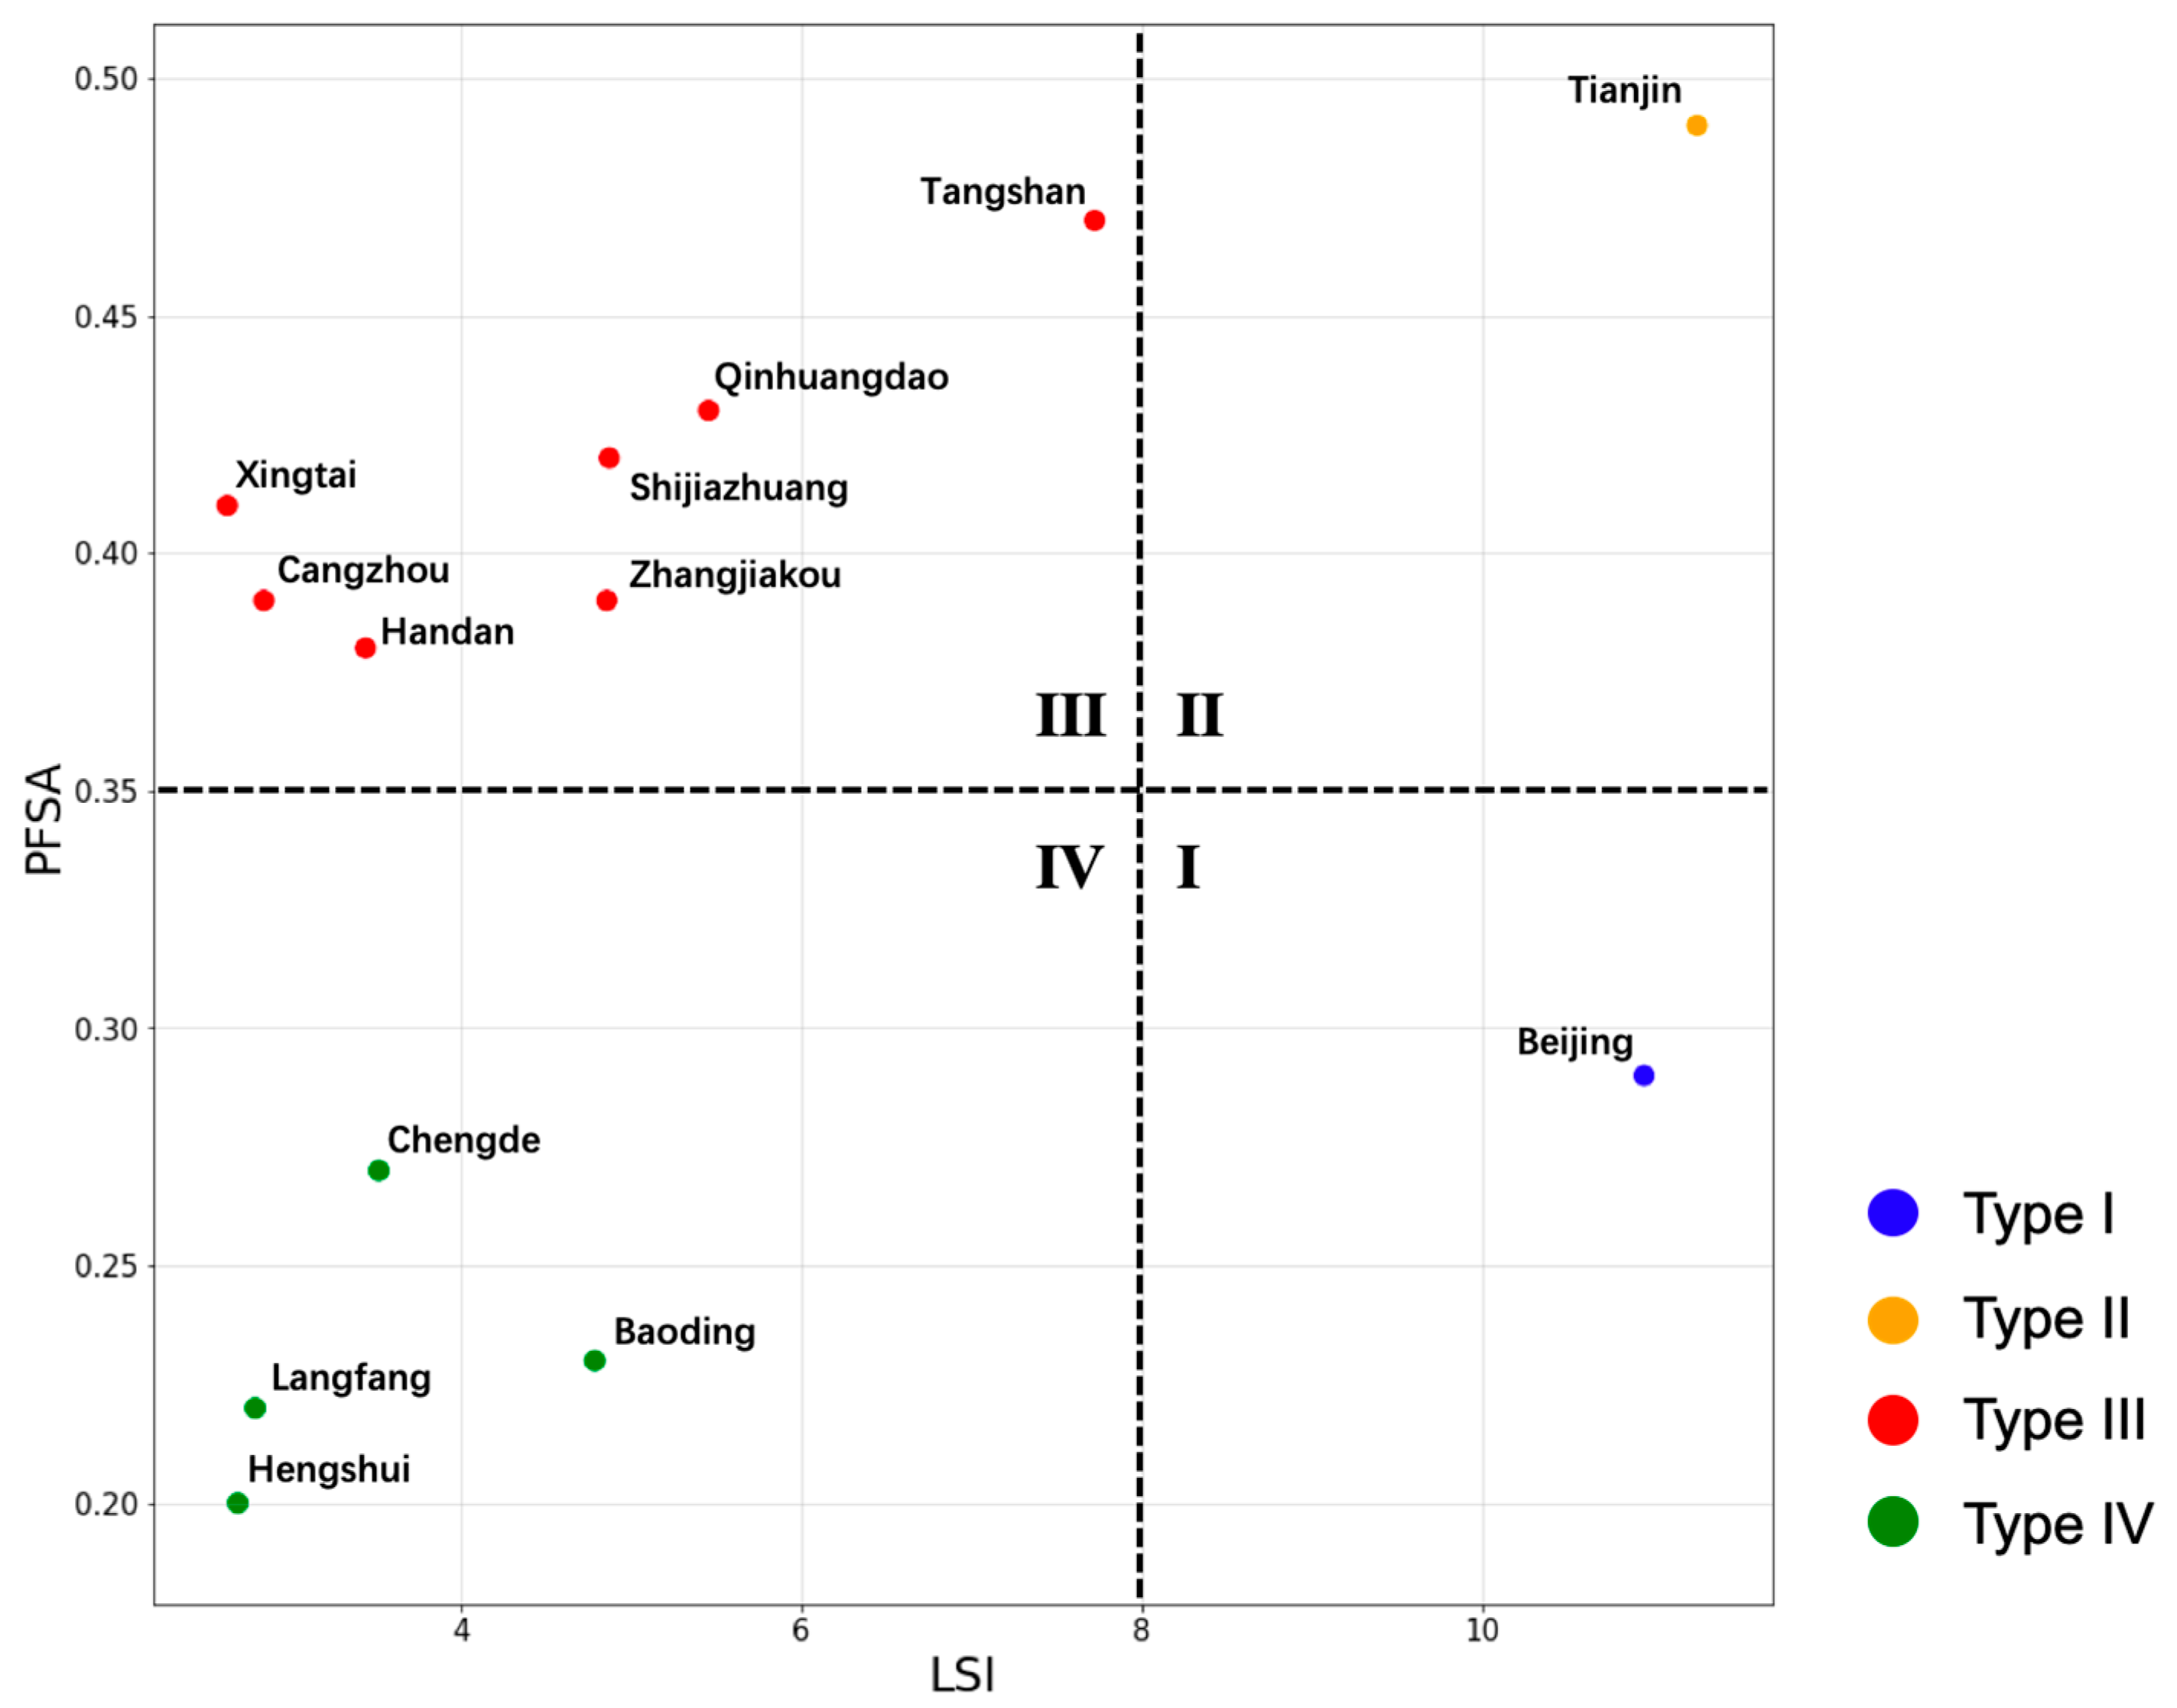
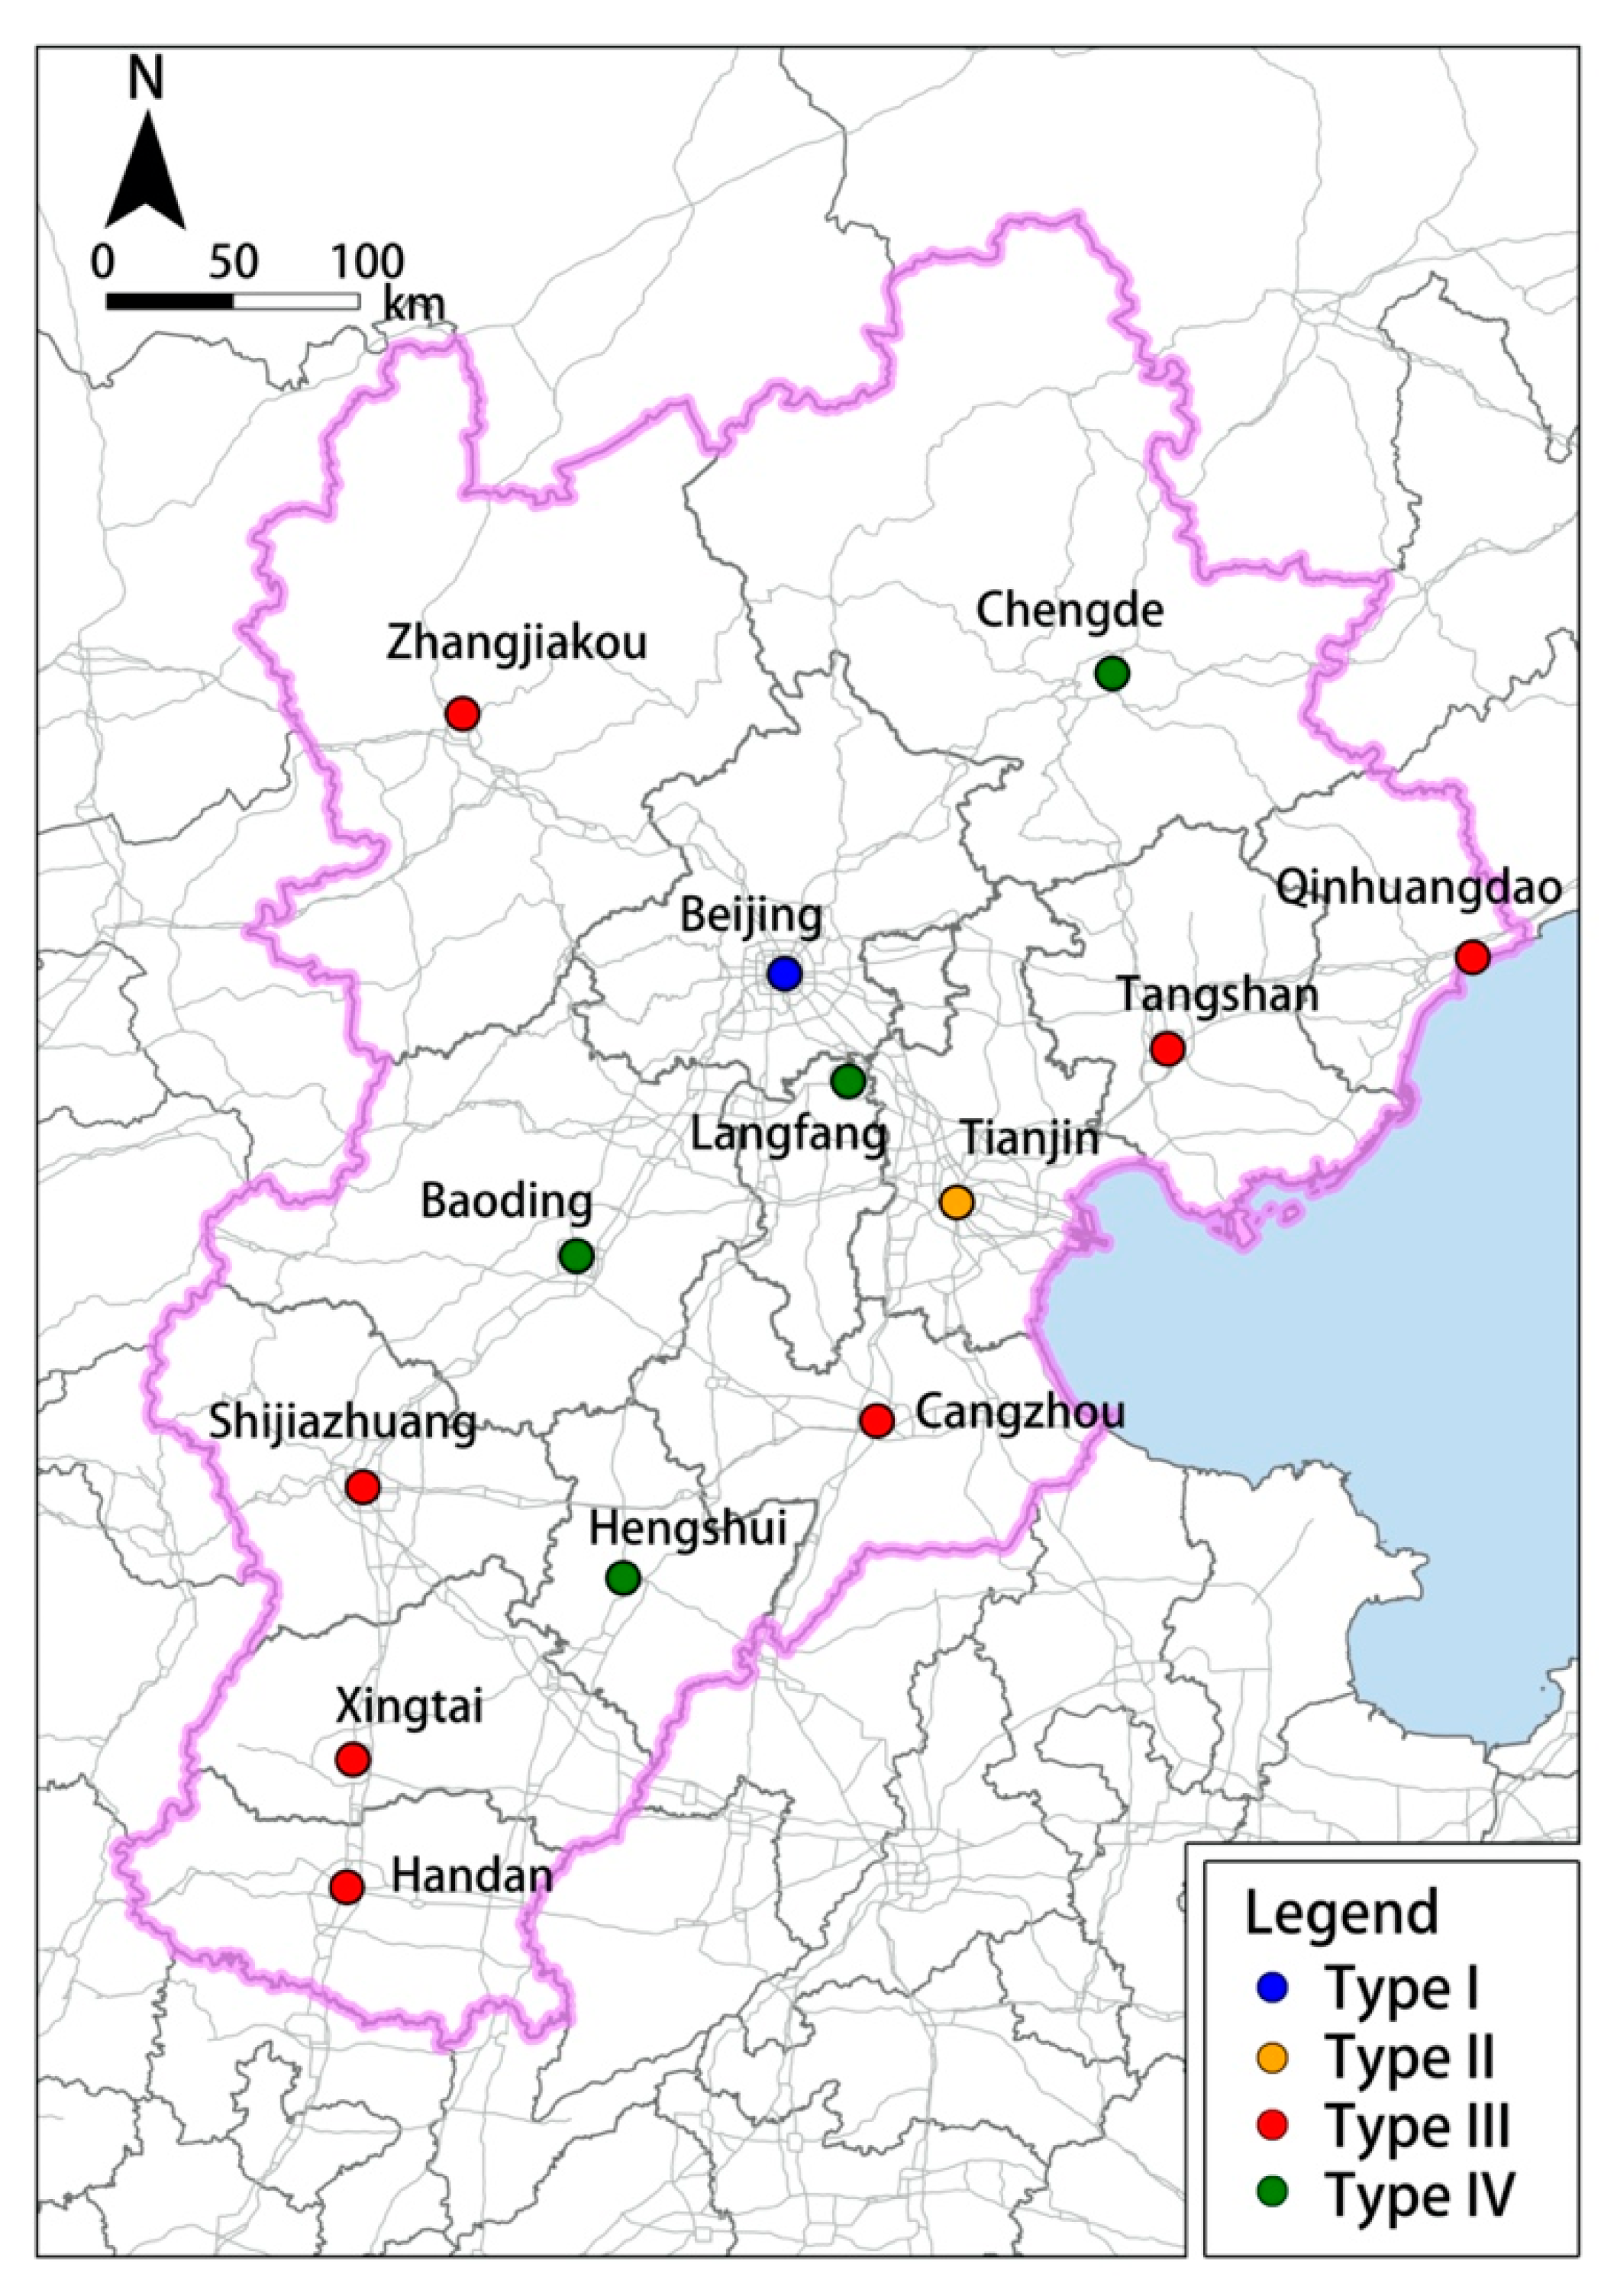
Figure 4 plots 13 cities in the study area according to their characteristics from the two dimensions of PFSA and LSI indices. Based on the clustering pattern, which is further confirmed by the result of the Fuzzy C-Means clustering algorithm, four types of cities can be intuitively identified, and their geographical distribution is shown in
Figure A4.
The four groups of cities with respect to their characteristics of functional shrinkage reflect the global heterogeneity across this region but also the local homogeneity within groups of cities (
Figure 5,
Figure 6 and
Figure 7).
5. Discussion
5.1. The General Pattern of Functional Shrinkage
The FSAs in BTH account for 37.8% of the built-up areas, indicating that overdevelopment is a prominent problem in general (
Table 3). This is because of the choices of the growth mode of most cities are supply-driven. Given the insufficient growth demand, most cities in this region still adopted growth-oriented planning for a long time. In the past decade, most cities have planned excessive new towns or industrial parks, where a majority of the functional shrinkage areas are located.
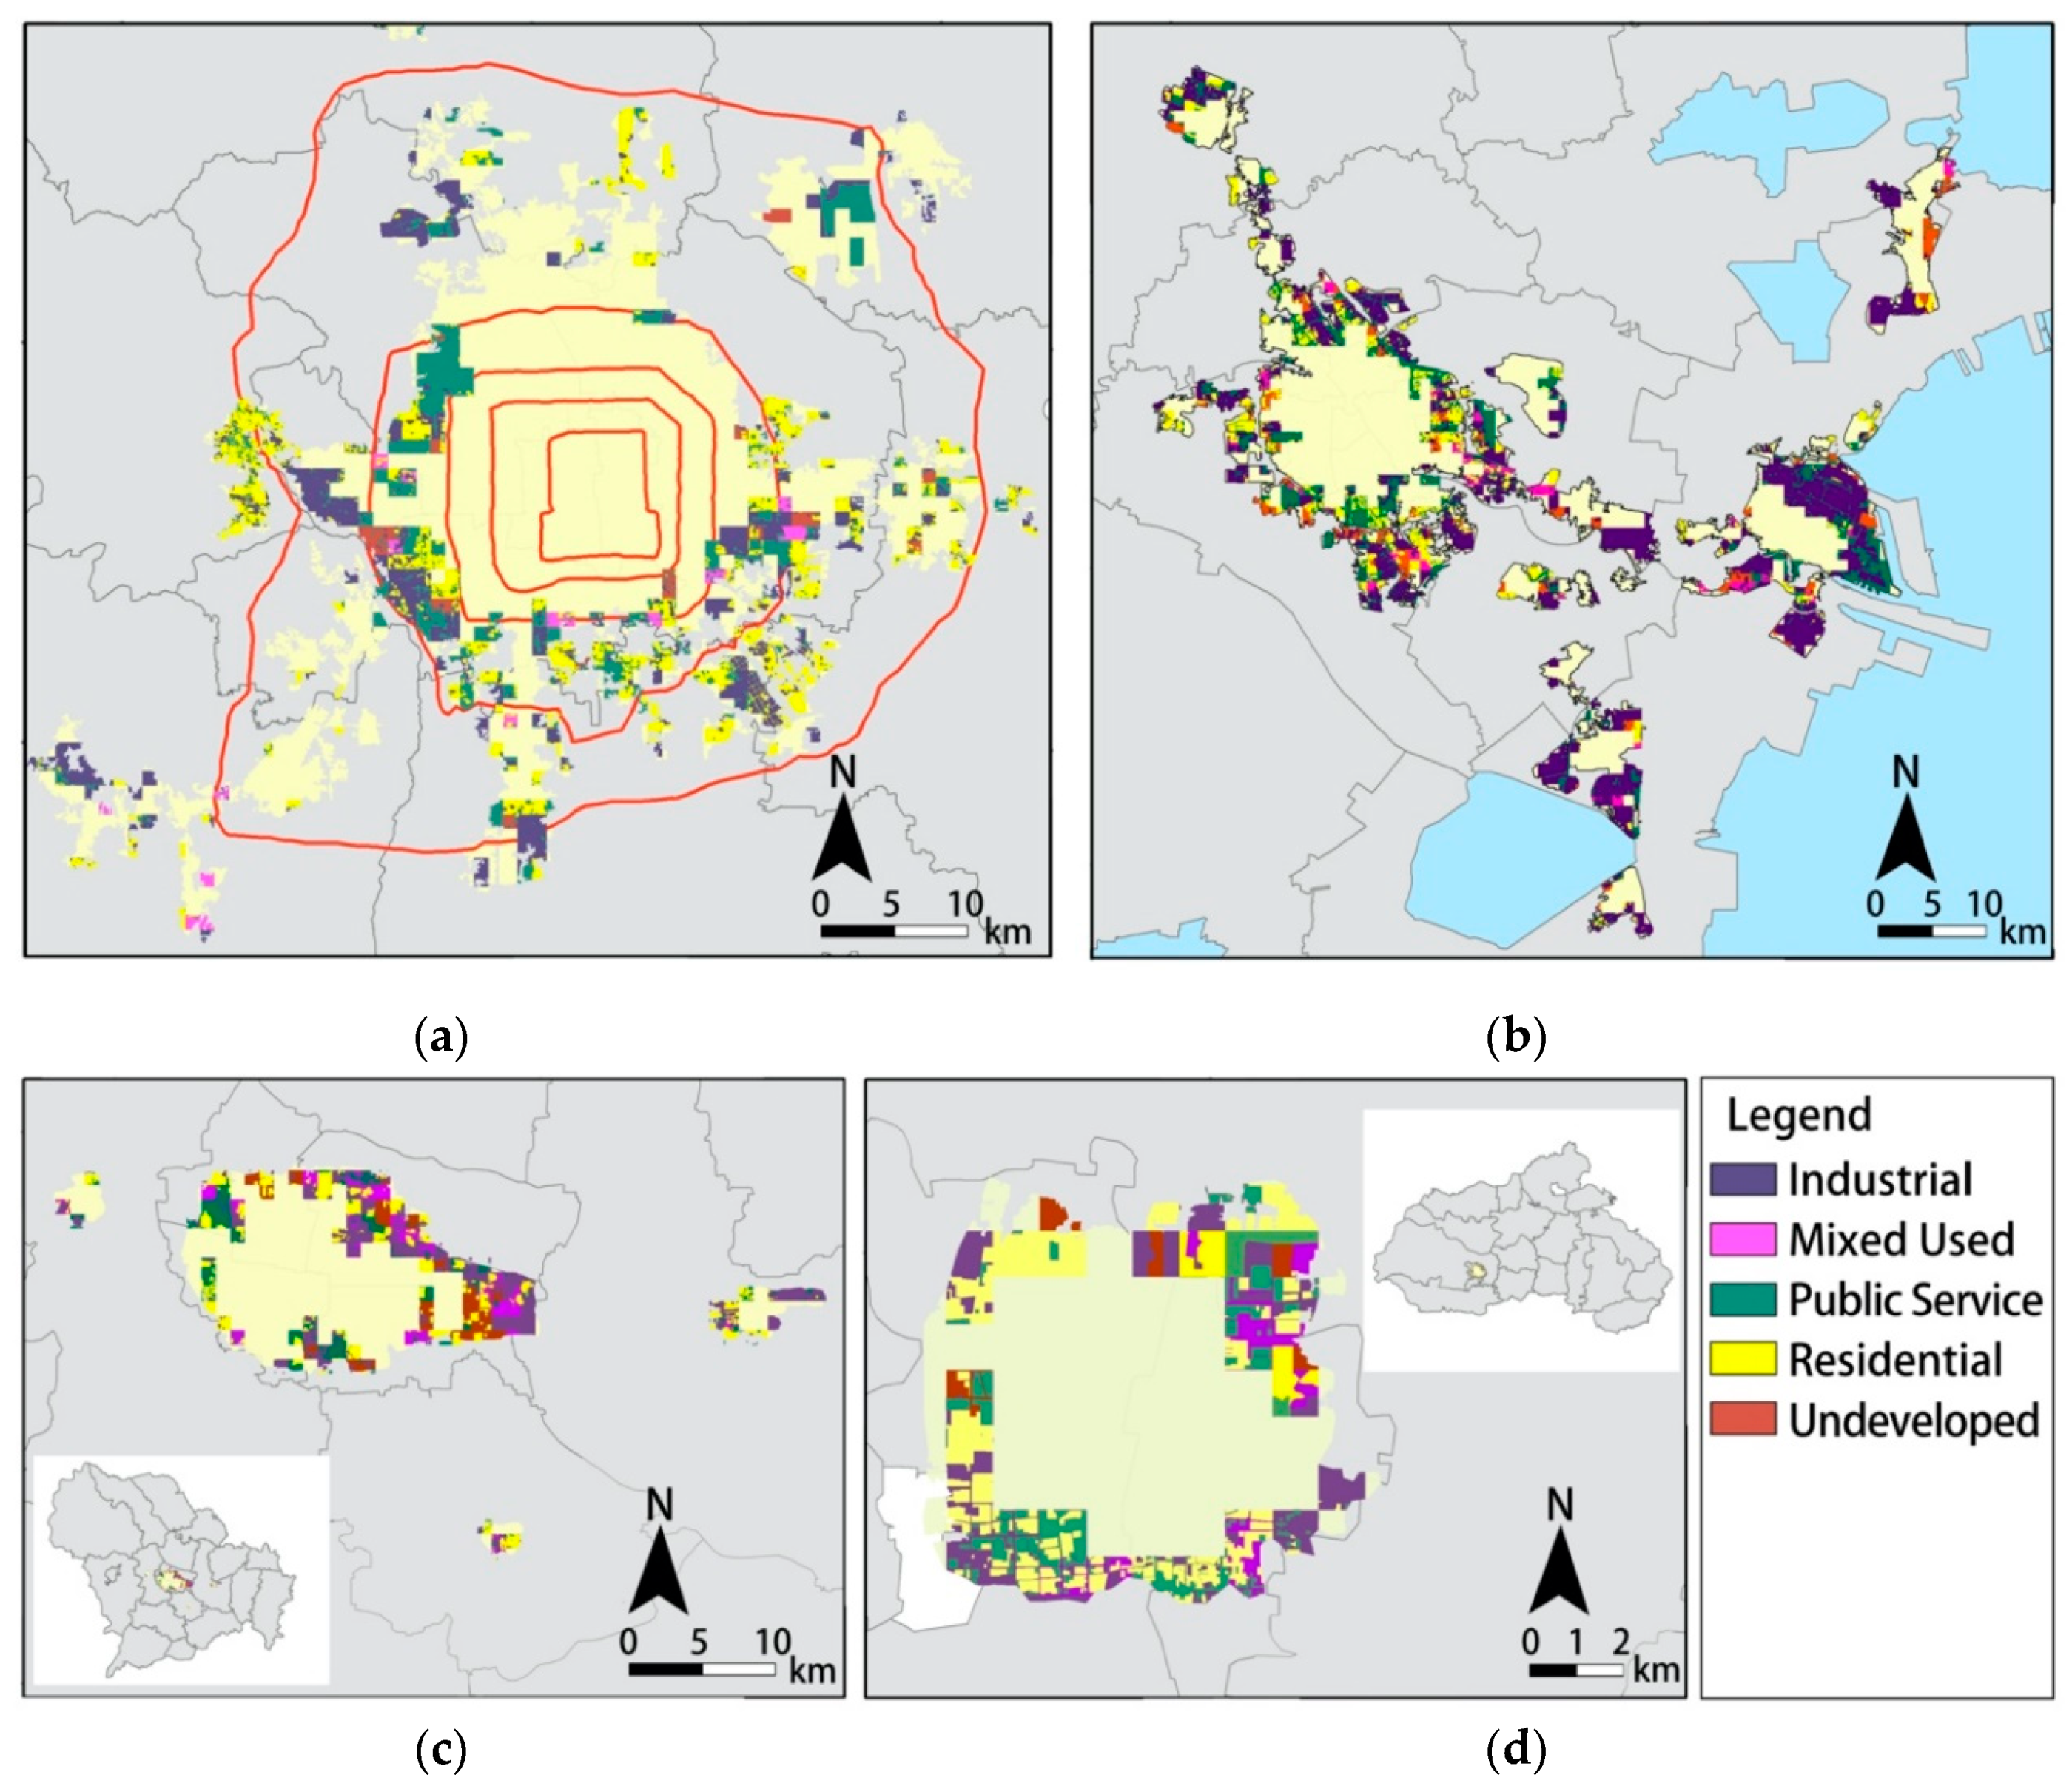
In terms of land uses, functional shrinkage takes place mostly in industrial lands, which accounts for about 44% of the total FSAs. This is because, many cities in this region shared a similar industry structure concentrating on capital-intensive equipment manufacturing, foundry, and petrochemical industries, which requires a large amount of land but a relatively low level of employed workers. Hence, it resulted in vast areas of industrial parks with relatively low intensity of human activities. On the other hand, the regional environmental policy targeted at ensuring the air quality in Beijing as the national capital had an obviously adverse effect on those industrial parks in controlling their productions. Residential and public service lands account for 24.7% and 24.1% of the area in FSAs and rank the second and third largest land uses, indicating the excessively constructed new towns.
5.2. Heterogeneity and Homogeneity of Functional Shrinkage at the City Level
5.2.1. Type I: Beijing
The functional shrinkage areas in Beijing are highly fragmented and most spatially scattered in the area between the fourth and sixth ring expressways instead of at the edge of the city (
Figure 6a). The PFSA of Beijing is intermediate (26.7%) in this region having a relatively mixed land composition, with residential (9.9%), industrial (9.2%), and public service (8.1%) as the three largest land uses (
Figure 4 and
Figure 5). The main cause that leads to the functional shrinkage in Beijing is the incomplete implementation of the polycentric development strategy. In the previous master plan, Beijing has put forward the goal of implementing the polycentric development strategy and relieving the population and industry in the core area. However, during the actual implementation, due to factors such as the excessive concentration of superior resources and insufficient development level of public transportation, most of the incremental construction land around the central urban area has a lower development level than expected. Despite the increasing construction volume, the urban vitality is still low. At the same time, in recent years, Beijing has vigorously implemented the policy of alleviating non-capital function and population regulation, which has slowed down the introduction of urban population and industry.
5.2.2. Type II: Tianjin
Tianjin is the only Type II city having the most severe functional shrinkage in BTH in terms of both PFSA and fragmentation. Those shrinking areas are concentrated in certain specific locations at the outskirts of the city. These locations include Beichen District on the northern side of the Central city, Dasi Town on the southern side, Dagang District on the southern side, and Binhai New District on the southeastern side, which are all industrial parks and new districts (
Figure 6b). The FSA in Tianjin is mainly composed of industrial (23.27%) and public service (11.6%) lands (
Figure 5). Tianjin is the second-largest city in BTH and is an important growth pole. It is also one of the largest ports and industrial bases in northern China. Since the beginning of the 21st century, Tianjin has implemented active growth planning and gradually formed an incremental urban space system with the Tianjin Port and Binhai New Area as the main body and a total area up to thousands of square kilometers. However, during the actual construction, the decline in the international manufacturing trend and the 2008 financial crisis have seriously affected the development of industrial parks and ports in Tianjin. At the same time, the layout of ports in the northern coastal areas of China is not coordinated enough, and the Tianjin Port is faced with great competitive pressure, which also leads to the mismatch between the growth of the urban population and the expansion of the physical built-up area.
5.2.3. Type III: Qinhuangdao, Tangshan, Xingtai, Cangzhou, Zhangjiakou, Shijiazhuang, and Handan
Most cities in this type are located in the outer ring of this region; in other words, they are not directly adjacent to Beijing, the core of this region. These cities share a high proportion of functional shrinking areas having a relatively low fragmentation. These areas are commonly new districts and industrial parks located outside the city center, meaning that they were not efficiently utilized (
Figure 6c). The two cities with the largest PFSA are Tangshan and Qinhuangdao. Given they are both heavy industrial cities, industrial lands contribute the highest fraction towards the FSAs in Tanghan (23.1%) and Qinhuangdao (14.0%). As for other cities, the PFSA values are mostly around 40%, indicating a relatively significant functional shrinkage (
Figure 4). Apart from Xingtai, the other six cities are dominated by equipment manufacturing, petrochemical, foundry, and other heavy industries [
55]. Influenced by the global recession and the regional environmental control policies, the development of most industrial parks is lagging behind. The new districts in Xingtai were mainly developed for residential and tourist purposes, showing lands in mixed-use as the largest portion in FSAs.
5.2.4. Type IV: Chengde, Baoding, Langfang, and Hengshui
Most cities in this type are directly adjacent to Beijing. They have both the lowest PFSA and fragmentation compared to those of other types. The shrinking areas are mostly scattered around the periphery of cities (
Figure 6d). Residential lands dominate the land use in functional shrinkage for these cities (
Figure 5). Cities of this type have a high concentration on labor-intensive industries, such as service, food processing, and textile industries, instead of capital-intensive industries [
55], causing a relatively low demand for lands for their economy. In addition, due to the labor-intensive industries, a high vitality can be maintained in the developed areas.
6. Conclusions and Future Work
This study proposed a new concept, namely functional urban shrinkage, to support the delineation of local shrinking areas within cities by measuring the spatial mismatch between the geographies of the human activity demand and the supply of built-up lands. Leveraging multi-source geospatial big data and traditional survey data, an integrated data approach was taken to account for both human and physical dimensions of urban shrinkage and a general analytical framework for measuring functional shrinkage was developed to enable the implementation of the proposed functional shrinkage measure. The identified functional shrinkage areas for cities were characterized based on their spatial distributions, morphological features, and land use compositions to allow for the comparison of functional shrinkage at the city level from dimensions of the above characteristics. Applied to the case study of BTH megaregion, the validity of the data approach and usefulness of the analytical framework have been demonstrated. Because the framework for measuring functional shrinkage was developed as a general one, it can be applied to urban settlements at any spatial scale, e.g., city, region, and country, to measure the functional shrinkage patterns. In addition, due to its superior spatiotemporal resolution and geographic coverage, the multi-source geospatial big data approach empowers the large-scale and dynamic monitoring, detection, and evaluation of functional urban shrinkage. More importantly, this approach is very time-efficient and low-cost and can be very valuable for timely and better-informed planning decision support.
The analysis of functional shrinkage measures reveals several underpinning obstacles to the sustainable development of BTH. First, it is the contradiction between the rapid growth of this region and the relatively low efficiency of land use. The latter is reflected by a high overall proportion of functional shrinkage areas representing a great extent of spatial mismatch between the geographies of human activities and the built-up areas. Specifically, the oversupply of developed lands lies in the growth-oriented planning, the particularity of industrial concentration in petrochemistry and heavy manufacturing, and the strict regional environmental regulations.
Secondly, four groups of cities with respect to their functional shrinkage characteristics were identified, reflecting the global heterogeneity across this region, as well as the local homogeneity within groups. The spatial heterogeneity of functional shrinkage across cities can be attributed to the intrinsic properties of cities such as industrial structure, the driving force for growth, and comparative advantage. Beijing and Tianjin, as the Type I and II cities respectively, are the growth poles of this region and their functional shrinkage is closely related to their aggressive growth-driven policies. Type III cities have more comparative advantages, such as natural resources, ports, and transport hubs, compared to Type IV cities, and have concentrated on heavy industries that commonly demand more lands rather than labors. Thus, they have a high potential to show a mismatch between human activities and built-up areas, given the growth-oriented planning implemented in the whole region. Due to their adjacency to growth poles, Type IV cities may receive more spillover effects from Beijing and Tianjin, compared to Type III cities, leading to their relatively low functional shrinkage.
Last but not least, from the perspective of central place theory [
56], BTH has an evident hierarchy of urban agglomerations with Beijing as the “powerhouse” of growth (
Figure A4). Consequently, the spatial planning and environmental policies targeting Beijing will have a definite impact on the entire region. In the process of alleviating the over-agglomeration issue for Beijing, functional shrinkage occurred and may exert externality on the functional shrinkage conditions of surrounding cities at lower hierarchies. Whether functional shrinkage is a phenomenon related to linkages between cities and how functional shrinkage pass along an urban hierarchy as it is in BTH are intriguing questions warranting future studies.
Author Contributions
Conceptualization, Q.M.; methodology, Q.M., Z.G., and J.K.; software, Q.M. and J.K.; validation, Q.M. and Z.G.; formal analysis, Q.M., Z.G., and J.K.; investigation, Q.M and Z.G.; resources, Q.M. and J.K.; data curation, Q.M.; writing—original draft preparation, Q.M., J.K., and Z.G.; writing—review and editing, Z.G., Q.M., J.K., and R.T.; visualization, Q.M., Z.G., and J.K.; supervision, Z.G. and A.D.; project administration, Q.M.; funding acquisition, A.D. All authors have read and agreed to the published version of the manuscript.
Funding
This research was funded by the National Key R&D Program of China, grant number 2018YFB2100701.
Conflicts of Interest
The authors declare no conflict of interest.
Appendix A
Figure A1.
The remote sensing images and the extraction result of urban built-up areas. (a) Central city of Beijing; (b) Central city of Tianjin; (c) Central city of Shijiazhuang.
Figure A1.
The remote sensing images and the extraction result of urban built-up areas. (a) Central city of Beijing; (b) Central city of Tianjin; (c) Central city of Shijiazhuang.
Figure A2.
The Pearson’s correlation test (0.94) across locations in Beijing between the ambient population density for the period of the 20th to 26th July 2018 and that for the period of the 20th to 26th November 2017.
Figure A2.
The Pearson’s correlation test (0.94) across locations in Beijing between the ambient population density for the period of the 20th to 26th July 2018 and that for the period of the 20th to 26th November 2017.
Figure A3.
The spatial layout of functional shrinkage areas in all 13 cities of BTH, detailed map of Chengde, Hengshui, Qinhuangdao, and Zhangjiakou are listed on the right side as examples.
Figure A3.
The spatial layout of functional shrinkage areas in all 13 cities of BTH, detailed map of Chengde, Hengshui, Qinhuangdao, and Zhangjiakou are listed on the right side as examples.
Figure A4.
The spatial distribution of cities with different functional shrinkage types.
Figure A4.
The spatial distribution of cities with different functional shrinkage types.
References
- Häußermann, H.; Siebel, W. Die Schrumpfende Stadt und die Stadtsoziologie. In Soziologische Stadtforschung; Friedrichs, J., Ed.; VS Verlag für Sozialwissenschaften: Wiesbaden, Germany, 1988; pp. 78–94. ISBN 978-3-322-83617-5. [Google Scholar]
- Mykhnenko, V.; Turok, I. East European cities—patterns of growth and decline, 1960–2005. Int. Plan. Stud. 2008, 13, 311–342. [Google Scholar] [CrossRef]
- Wiechmann, T.; Pallagst, K.M. Urban shrinkage in Germany and the USA: A comparison of transformation patterns and local strategies. Int. J. Urban Reg. Res. 2012, 36, 261–280. [Google Scholar] [CrossRef]
- Pei, P.; Yang, F. Study on Revitalizing Northeast China through a New Road of Industrialization. Can. Soc. Sci. 2009, 4, 74–80. [Google Scholar] [CrossRef]
- Long, Y.; Wu, K. Several emerging issues of China’s urbanization: Spatial expansion, population shrinkage, low-density human activities and city boundary delimitation (In Chinese). Urban Plan. Forum 2016, 2, 72–77. [Google Scholar]
- Batty, M. Empty buildings, shrinking cities and ghost towns. Environ. Plan. B Plan. Des. 2016. [Google Scholar] [CrossRef] [Green Version]
- Yang, Z.; Dunford, M. City shrinkage in China: Scalar processes of urban and hukou population losses. Reg. Stud. 2018, 52, 1111–1121. [Google Scholar] [CrossRef]
- Yuanyuan, G.; Li, L. Change in the Negative Externality of the Shrinking Cities in China. Sci. Geogr. Sin. 2019, 39, 52–60. [Google Scholar]
- Lin, J.; Zhao, Y. State Governance, Spatial Planning, and ‘Central-local’ Collaboration: With Discussions on the Development and Trend of the Central-local Government Relationship in the Evaluation of the Spatial Planning System (In Chinese). City Plan. Rev. 2019, 43, 20–23. [Google Scholar]
- Hollander, J.B.; Pallagst, K.; Schwarz, T.; Popper, F.J. Planning shrinking cities. Prog. Plan. 2009, 72, 223–232. [Google Scholar]
- Wiechmann, T.; Bontje, M. Responding to Tough Times: Policy and Planning Strategies in Shrinking Cities. Eur. Plan. Stud. 2015, 23, 1–11. [Google Scholar] [CrossRef]
- Batty, M. Can it Happen Again? Planning Support, Lee’s Requiem and the Rise of the Smart Cities Movement. Environ. Plan. B Plan. Des. 2014. [Google Scholar] [CrossRef]
- Batty, M. Artificial intelligence and smart cities. Environ. Plan. B Urban Anal. City Sci. 2018, 45, 3–6. [Google Scholar] [CrossRef]
- Ratti, C.; Claudel, M. The City of Tomorrow: Sensors, Networks, Hackers, and the Future of Urban Life; Yale University Press: London, UK, 2016; ISBN 978-0-300-22113-8. [Google Scholar]
- Wu, K. Urban Shrinkage in the Beijing-Tianjin-Hebei Region and Yangtze River Delta: Pattern, Trajectory and Factors. In Shrinking Cities in China: The Other Facet of Urbanization; Long, Y., Gao, S., Eds.; The Urban Book Series; Springer: Singapore, 2019; pp. 43–61. ISBN 9789811326462. [Google Scholar]
- Bo, W.; Chen, F. The Coordinated Development among Beijing, Tianjin and Hebei: Challenges and Predicaments. Nankai J. Philos. Lit. Soc. Sci. Ed. 2015, 1, 110–118. [Google Scholar]
- Bao, C.; He, D. Spatiotemporal characteristics of water resources exploitation and policy implications in the Beijing-Tianjin-Hebei Urban Agglomeration. Prog. Geogr. 2017, 36, 58–67. [Google Scholar]
- Fang, C. Theoretical foundation and patterns of coordinated development of the Beijing-Tianjin-Hebei urban agglomeration. Prog. Geogr. 2017, 36, 15–24. [Google Scholar]
- Hashem, I.A.T.; Chang, V.; Anuar, N.B.; Adewole, K.; Yaqoob, I.; Gani, A.; Ahmed, E.; Chiroma, H. The role of big data in smart city. Int. J. Inf. Manag. 2016, 36, 748–758. [Google Scholar] [CrossRef] [Green Version]
- Penn, A.; Al Sayed, K. Spatial information models as the backbone of smart infrastructure. Environ. Plan. B Urban Anal. City Sci. 2017, 44, 197–203. [Google Scholar] [CrossRef]
- Su, K.; Li, J.; Fu, H. Smart city and the applications. In Proceedings of the 2011 International Conference on Electronics, Communications and Control (ICECC), Ningbo, China, 9–11 September 2011; pp. 1028–1031. [Google Scholar]
- Stefanidis, A.; Crooks, A.; Radzikowski, J. Harvesting ambient geospatial information from social media feeds. GeoJournal 2013, 78, 319–338. [Google Scholar] [CrossRef]
- Jiang, B.; Ma, D.; Yin, J.; Sandberg, M. Spatial Distribution of City Tweets and Their Densities. Geogr. Anal. 2016, 48, 337–351. [Google Scholar] [CrossRef] [Green Version]
- Kitchin, R. The real-time city? Big data and smart urbanism. GeoJournal 2014, 79, 1–14. [Google Scholar] [CrossRef] [Green Version]
- Sulis, P.; Manley, E.; Zhong, C.; Batty, M. Using mobility data as proxy for measuring urban vitality. J. Spat. Inf. Sci. 2018, 2018, 137–162. [Google Scholar] [CrossRef]
- Schneider, A.; Friedl, M.A.; Potere, D. Mapping global urban areas using MODIS 500-m data: New methods and datasets based on ‘urban ecoregions. ’ Remote Sens. Environ. 2010, 114, 1733–1746. [Google Scholar] [CrossRef]
- Almazroui, M.; Mashat, A.; Assiri, M.E.; Butt, M.J. Application of Landsat Data for Urban Growth Monitoring in Jeddah. Earth Syst. Environ. 2017, 1, 25. [Google Scholar] [CrossRef] [Green Version]
- Tang, Y.; Zhang, L. Urban Change Analysis with Multi-Sensor Multispectral Imagery. Remote Sens. 2017, 9, 252. [Google Scholar] [CrossRef] [Green Version]
- Gong, P.; Wang, J.; Yu, L.; Zhao, Y.; Zhao, Y.; Liang, L.; Niu, Z.; Huang, X.; Fu, H.; Liu, S.; et al. Finer resolution observation and monitoring of global land cover: First mapping results with Landsat TM and ETM+ data. Int. J. Remote Sens. 2013, 34, 2607–2654. [Google Scholar] [CrossRef] [Green Version]
- Hegazy, I.R.; Kaloop, M.R. Monitoring urban growth and land use change detection with GIS and remote sensing techniques in Daqahlia governorate Egypt. Int. J. Sustain. Built Environ. 2015, 4, 117–124. [Google Scholar] [CrossRef] [Green Version]
- Xiao, P.; Wang, X.; Feng, X.; Zhang, X.; Yang, Y. Detecting China’s Urban Expansion over the Past Three Decades Using Nighttime Light Data. IEEE J. Sel. Top. Appl. Earth Obs. Remote Sens. 2014, 7, 4095–4106. [Google Scholar] [CrossRef]
- Pallagst, K. Shrinking cities in the United States of America. Future Shrinking Cities Probl. Patterns Strateg. Urban Transform. Glob. Context Los Angel. Univ. Calif. 2009, 81–88. Available online: https://www.researchgate.net/profile/Karina_Pallagst/publication/281785236_Karina_Pallagst_Shrinking_Cities_in_the_United_States_of_America_in_Karina_Pallagst_et_al_Eds_The_future_of_shrinking_cities_-_problems_patterns_and_strategies_of_urban_transformation_in_a_global_cont/links/56d8ad2c08aebabdb40d1ebd/Karina-Pallagst-Shrinking-Cities-in-the-United-States-of-America-in-Karina-Pallagst-et-al-Eds-The-future-of-shrinking-cities-problems-patterns-and-strategies-of-urban-transformation-in-a-global-co.pdf (accessed on 4 August 2020).
- Martinez-Fernandez, C.; Wu, C.; Schatz, L.K.; Taira, N.; Vargas-Hernández, J.G. The shrinking mining city: Urban dynamics and contested territory. Int. J. Urban Reg. Res. 2012, 36, 245–260. [Google Scholar] [CrossRef]
- Du, Z.; Li, X. The Formation and Planning of Shrinking Cities: From New Marxism Urban Theory. Planners 2017, 2017, 21. [Google Scholar]
- Wolff, M. Urban Shrinkage in Europe. Benefits and Limits of an Indicator-Based Analysis; Working Paper 2010-06; Dresden University of Technology: Dresden, Germany, 2010. [Google Scholar]
- Rieniets, T. Shrinking cities: Causes and effects of urban population losses in the twentieth century. Nat. Cult. 2009, 4, 231–254. [Google Scholar] [CrossRef]
- Zheng, Q.; Zeng, Y.; Deng, J.; Wang, K.; Jiang, R.; Ye, Z. “Ghost cities” identification using multi-source remote sensing datasets: A case study in Yangtze River Delta. Appl. Geogr. 2017, 80, 112–121. [Google Scholar] [CrossRef]
- Chi, G.; Liu, Y.; Wu, Z.; Wu, H. Ghost Cities Analysis Based on Positioning Data in China. arXiv 2015, arXiv:1510.08505. [Google Scholar]
- Jin, X.; Long, Y.; Sun, W.; Lu, Y.; Yang, X.; Tang, J. Evaluating cities’ vitality and identifying ghost cities in China with emerging geographical data. Cities 2017, 63, 98–109. [Google Scholar] [CrossRef]
- Bowman, A.O. Terra Incognita: Vacant Land and Urban Strategies; Georgetown University Press: Washington, DC, USA, 2004. [Google Scholar]
- Han, H.-S. Neighborhood characteristics and resistance to the impacts of housing abandonment. J. Urban Aff. 2017, 39, 833–856. [Google Scholar] [CrossRef]
- Hollander, J.B. Moving Toward a Shrinking Cities Metric: Analyzing Land Use Changes Associated With Depopulation in Flint, Michigan. Cityscape 2010, 12, 133–151. [Google Scholar] [CrossRef] [Green Version]
- Yang, D.; Long, Y.; Yang, W.; Sun, H. Losing population with expanding space: Paradox of urban shrinkage in China. Mod. Urban Res. 2015, 9, 20–25. [Google Scholar]
- Andresen, M.A. The ambient population and crime analysis. Prof. Geogr. 2011, 63, 193–212. [Google Scholar] [CrossRef]
- He, Y.; Zhou, J. Comparison of accuracy of the supervised classification methods in ENVI. Technol. Innov. Appl. 2018, 2018, 22–24. [Google Scholar]
- Yu, M.; Wang, H.-R.; Lan, T. The BP Neural Network for Improvement of Classification Accuracy in Remote Sensing Image. Int. J. Environ. Prot. Policy 2016, 4, 93. [Google Scholar] [CrossRef] [Green Version]
- Malleson, N.; Andresen, M.A. Spatio-temporal crime hotspots and the ambient population. Crime Sci. 2015, 4, 10. [Google Scholar] [CrossRef] [Green Version]
- Aldstadt, J.; Getis, A. Using AMOEBA to create a spatial weights matrix and identify spatial clusters. Geogr. Anal. 2006, 38, 327–343. [Google Scholar] [CrossRef]
- Kulldorff, M. A spatial scan statistic. Commun. Stat.-Theory Methods 1997, 26, 1481–1496. [Google Scholar] [CrossRef]
- Getis, A.; Ord, J.K. The Analysis of Spatial Association by Use of Distance Statistics. Geogr. Anal. 1992, 24, 189–206. [Google Scholar] [CrossRef]
- Ord, J.K.; Getis, A. Local Spatial Autocorrelation Statistics: Distributional Issues and an Application. Geogr. Anal. 1995, 27, 286–306. [Google Scholar] [CrossRef]
- Luck, M.; Wu, J. A gradient analysis of urban landscape pattern: A case study from the Phoenix metropolitan region, Arizona, USA. Landsc. Ecol. 2002, 17, 327–339. [Google Scholar] [CrossRef]
- Nayak, J.; Naik, B.; Behera, H. Fuzzy C-means (FCM) clustering algorithm: A decade review from 2000 to 2014. Comput. Intell. Data Min. 2015, 2, 133–149. [Google Scholar]
- Hu, T.; Yang, J.; Li, X.; Gong, P. Mapping Urban Land Use by Using Landsat Images and Open Social Data. Remote Sens. 2016, 8, 151. [Google Scholar] [CrossRef]
- He, R.; Xie, L.; Sun, W. Research on Comprehensive Evaluation of Urbanization Quality in Beijing-Tianjin-Hebei Urban Agglomeration (in Chinese). Areal Res. Dev. 2016, 35, 42–47. [Google Scholar]
- Mulligan, G.F. Agglomeration and Central Place Theory: A Review of the Literature. Int. Reg. Sci. Rev. 1984, 9, 1–42. [Google Scholar] [CrossRef]
© 2020 by the authors. Licensee MDPI, Basel, Switzerland. This article is an open access article distributed under the terms and conditions of the Creative Commons Attribution (CC BY) license (http://creativecommons.org/licenses/by/4.0/).


