An Object-Based Hierarchical Method for Change Detection Using Unmanned Aerial Vehicle Images

Abstract
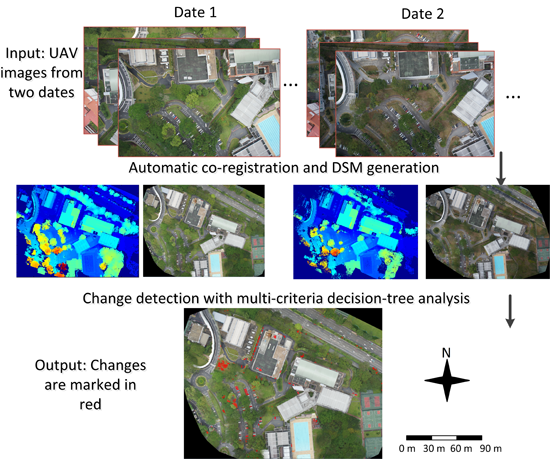
: There have been increasing demands for automatically monitoring urban areas in very high detail, and the Unmanned Aerial Vehicle (UAV) with auto-navigation (AUNA) system offers such capability. This study proposes an object-based hierarchical method to detect changes from UAV images taken at different times. It consists of several steps. In the first step, an octocopter with AUNA capability is used to acquire images at different dates. These images are registered automatically, based on SIFT (Scale-Invariant Feature Transform) feature points, via the general bundle adjustment framework. Thus, the Digital Surface Models (DSMs) and orthophotos can be generated for raster-based change analysis. In the next step, a multi-primitive segmentation method combining the spectral and geometric information is proposed for object-based analysis. In the final step, a multi-criteria decision analysis is carried out concerning the height, spectral and geometric coherence, and shape regularity for change determination. Experiments based on UAV images with five-centimeter ground resolution demonstrate the effectiveness of the proposed method, leading to the conclusion that this method is practically applicable for frequent monitoring.1. Introduction
Detecting changes over the urban area is essential for city monitoring and disaster response, as well as the map/3D model updating [1]. Gathering this type of information is valuable for applications at various scales: at the landscape scale, it provides information for studying land cover evolution. At the building level, it has the potential to reduce labor cost for city management and updating 3D models. There have been numerous studies on change detection on remote sensing images with low-to-medium resolution [2–5], which mainly focus on the landscape level. The use of very high resolution (VHR) [6,7] remote sensing images popularized the change detection on the building level [8–12]. However, the concept of smart city management requires such techniques to work even in a higher spatial (sub-building level) and temporal resolution within a relatively small area (e.g., city blocks, streets) [13]. Examples are the detection of the visible damage of city facilities, such as from telephone stations or the detection of misbehavior, such as illegal waste dumping [14,15]. Such scenarios ask for a low cost solution both data-wise and labor-wise, due to their highly frequent operation. The advent of auto-navigated (AUNA) Unmanned Aerial Vehicle (UAV) provides a possible platform for such missions. As a small flying vehicle, it is much cheaper and more flexible than traditional aerial platforms, and the AUNA capability enables the operator to locate the target area more easily and accurately. The flight path can be precisely programmed to record regularly overlapped images for deriving 3D information. Nevertheless, there were only a small number of studies addressing such tasks in the past, owning to the scene complexity and the temporal difference of the illuminations, and disturbances of moving cars and pedestrians.
1.1. Related Work
In general, change detection can be divided into Image-based change detection and DSM (Digital Surface model) aided approaches according to the data dimension. Bouziani et al. [10] proposed a rule-based change detection method using the existing geo-database that stores information about the building footprints and land semantics. One disadvantage of this approach is that the required information may not be commonly available or accurate enough. Pacifici et al. [16] proposed a classification-based method using a neural network to simultaneously perform pixel-wise classification and change detection. However, the method required manually labeled training samples, and images used in this method were limited to nearly vertical views. Related image-based techniques can also be found in [9,11,17].
There are a number of methods considering the use of DSMs, which aim to improve the change detection accuracy and apply volumetric change analysis. Martha et al. [18] analyzed the landslides phenomenon by subtracting two DSMs. Similar approaches can be found in [19,20]. Since simple subtraction of height values may lead to false positives and noisy results, Chaabouni-Chouayakh and Reinartz [21] applied a post-classification on an initial change mask computed by DSM subtraction, taking into account various shape features such as elongation, eccentricity and solidity. Similar methods were proposed in [8,22], where the classification was performed on the aerial images. However, these methods were sensitive to the quality of DSM and tall vegetation. By integrating the height and spectral information, Tian et al. [23] proposed a region-based method to perform change detection on DSMs and panchromatic orthophotos generated from Cartosat-1 stereo pairs. The height and spectral information were fused by the change vector analysis framework (CVA) [24]. In another work by Tian et al. [25], the Dampster-Shafer method [26] was adopted to fuse the height and spectral information for change detection on multispectral stereo imagery. However, the parameter tuning of such methods depended on the data quality, and shape features of the segments were not considered.
Several studies have investigated change detection/monitoring techniques for applications with UAVs. Coulter et al. [27] used UAV images for monitoring country borders, and a threshold-based method in the image space was used to reach real-time performance, yet this method was purely based on image comparison, which might be affected by perspective distortion and luminance difference. Shi et al. [28] combined feature points with segmentation results to perform image-based change detection, and the image registration between two dates was done through a projective transformation. However, this method was essentially an image-based method, which did not employ the geometric information. Xuan [29] used a UAV with AUNA capability and adopted a simple subtraction on manually edited DSMs for change detection. The images between two dates were registered by ground control points (GCP). These studies did not fully utilize the geometric or spectral aspects of the UAV images, as well as the special characteristics of UAVs such as their low flying altitude, speed, and high image redundancy. Hence, a comprehensive change detection method using UAV imagery should be explored.
1.2. Work in This Paper
This paper presents an object-based hierarchical method for change detection using images taken from a UAV with AUNA capability, which adopts a step-wise strategy under the object-based image analysis (OBIA) framework. The proposed method first registers images from a later date to the earlier date under the general bundle adjustment (BA) framework. Such solutions have rarely been explored for the UAV images before. A multi-primitive segmentation method is proposed concerning the color and geometric properties to support an object-based decision tree analysis. The contribution of this work is mainly threefold: first, the proposed method adopts the general BA for image registration of both dates to minimize the geometric misalignment; second, a multi-primitive segmentation is proposed integrating geometric and spectral information; third, the decision tree analysis is used to employ the color and smooth for coherence checking between neighboring segments, which is able to reduce false positives caused by matching errors.
The remainder of the paper is organized as follows: Section 2 presents the used UAV platform and data pre-processing, including automatic image registration and DSM generation. Section 3 introduces the proposed object-based change detection method. In Section 4, experiments performed on UAV images with a ground sample distance (GSD) of 5 cm are introduced, and the results are discussed. The last section concludes the paper by analyzing the pros and cons the proposed method.
2. Data Acquisition and Pre-Processing
2.1. Platform
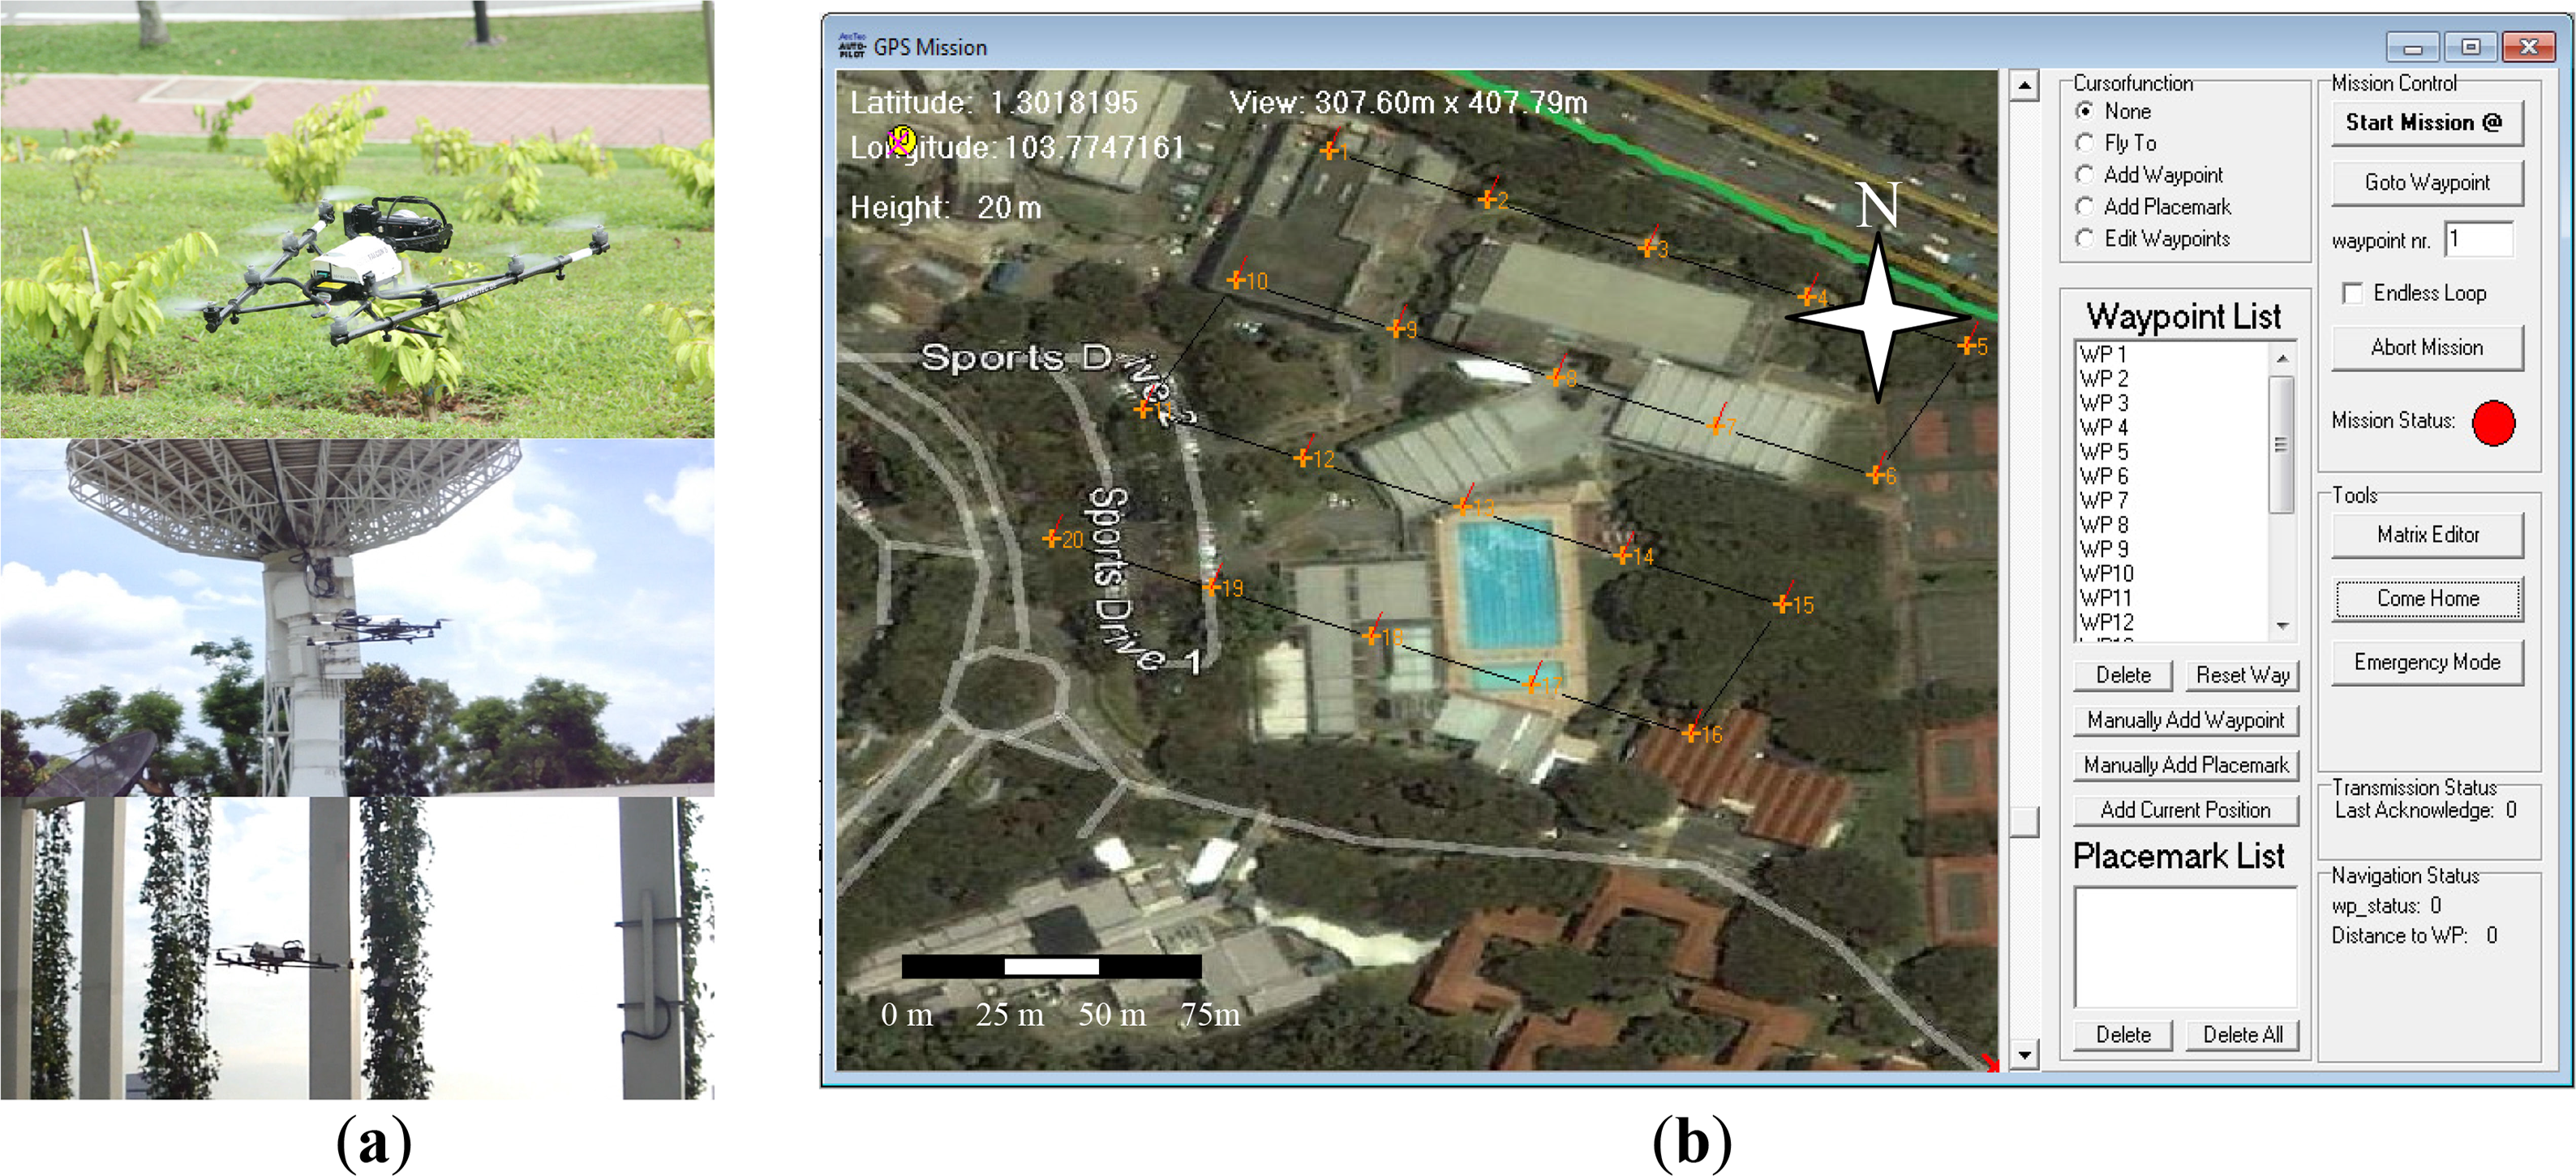
The UAV used in this work is the AscTec Falcon 8 octocopter [30], with an off-the-shelf Sony-Nex 5/5N camera is for the image acquisition (as shown in Figure 1). It has a built-in GPS unit (Global positioning system)/IMU (Inertial measurement unit), barometer and stabilizer, thus, to allow image acquisition following a predefined path. Such platforms usually have the following advantages:
- (1)
With a small take-off/landing space (e.g., 5 × 5 m2) and resistance of certain wind speed, the UAV is able to work in a relatively confined space with higher reliability (Figure 1a).
- (2)
Images can be taken in a discrete mode, with the UAV hovering when the shutter is being triggered, which effectively avoids motion blurs.
- (3)
The flight path can be pre-programed according to the expected overlaps and resolution. Once the path is designed (Figure 1b), it can be used repetitively for frequent data acquisition.
The above-mentioned advantages are not limited to this model, but in general apply to drones with AUNA capabilities. One drawback of such platform is that their battery life is short (usually 15–20 minutes of flying per battery), and this compromises the flexibility for close-range urban applications (noise-free and light).
2.2. Automatic Data Registration
Accurate and robust co-registration of the data from different dates is an essential issue for change detection. Change detection methods at the landscape level normally adopt affine transformations between images from two dates to achieve pixel-wise registration, but this is limited to low resolution images on relatively flat area [15]. DSM-based methods adopt 3D least squares surface matching for accurate registration [31], while this requires DSM to be coarsely aligned. GCP-based registration methods geo-reference the aerial/satellite images with manually collected GCPs either by additional survey or stereo measurement of the oriented images of the earlier date, and this requires extra manual work for GCP measurement and induces measurement errors. This work registers both datasets photogrammetrically by SIFT (Scale-invariant features transform) feature points [32] under a general bundle adjustment (BA) framework [33]. The UAV images of the earlier date is geo-referenced via free-network BA or GCP-assisted BA (this depends on the application whether the detected changes will be included into the Geographic Information System (GIS)), and images taken at the later date are oriented under the same coordinate system through a large number of tie points between two datasets. The GPS information can be used for the pairwise tie point generation, thus, to limit tie point extraction to neighboring images. The interior and exterior orientation parameters of the first date are fixed as observations, with the orientation parameters of the later date optimized through BA. By a simple expansion, the co-registration procedure can be explained under the following BA formulation:
SIFT extracts a large number of tie points between two dates. The BA is performed by APERO software [34], and the controlling script is modified particularly for the aforementioned co-registration task. It adopts the RANSAC algorithm [35] for incremental relative orientation to compute the initial approximation of the solution vectors. Then it solves the quadratic form of (1) with the Cholesky method after a suboptimal ordering of unknowns. The advantage of the software is its high degree of customization: it allows the users to freeze or release any unknowns in each iteration of the optimization, and supports multiple camera calibration. In this paper, the value of SCPs and EOPs of date 1 are computed in the earlier date and fixed as observations, while the co-registration procedure only optimizes the SCPs and EOPs of the images in date 2.
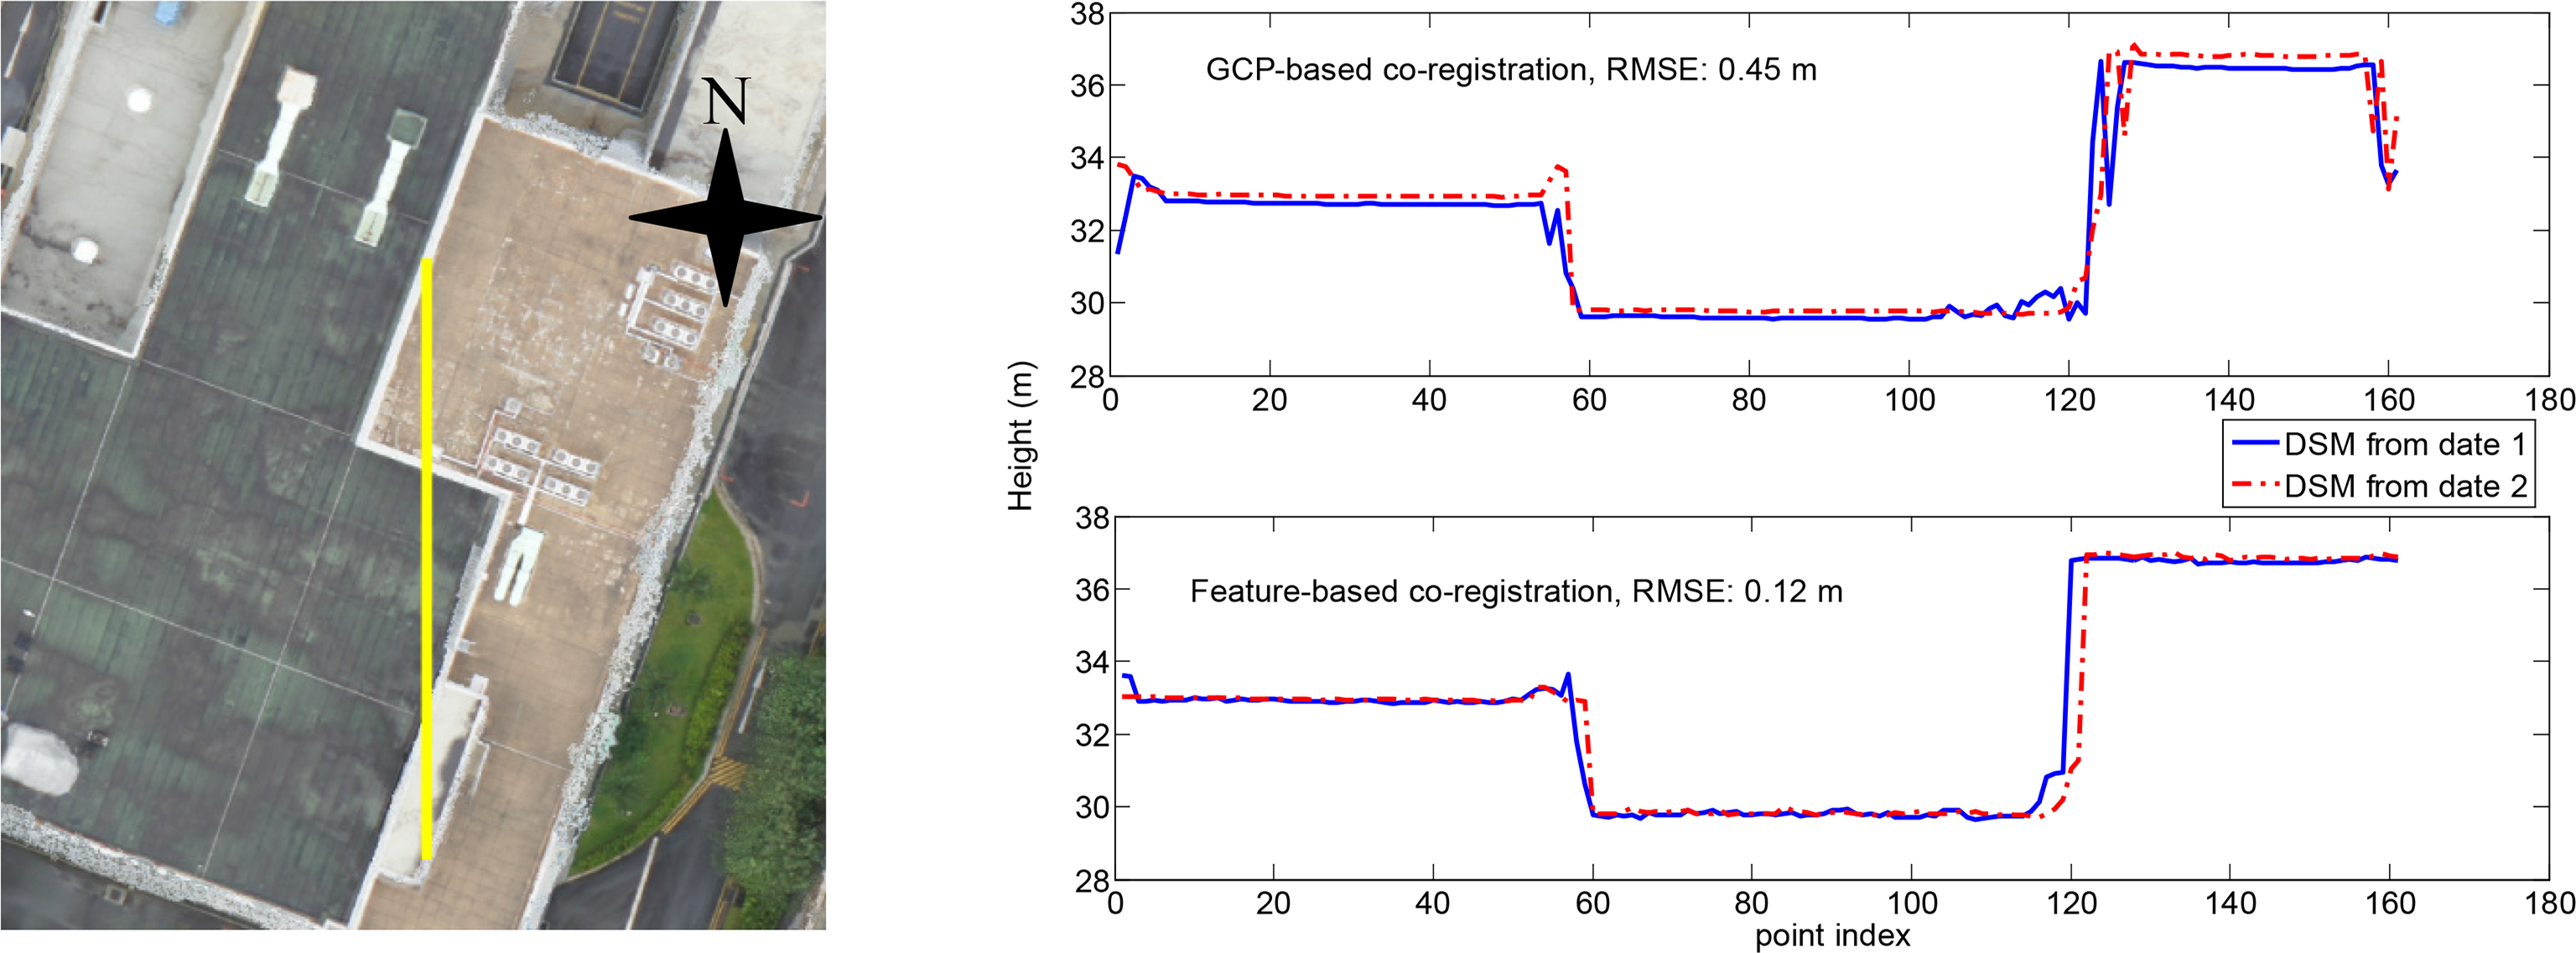
This procedure assumes there is no complete scene change in the area of interest (AOI), and this is particularly applicable for monitoring with high temporal resolution (1–24 months), as significant changes of the whole scene are not likely to occur in a short time. Moreover, due to the rich textural content, there are higher chances to extract a large number of feature points for co-registration. Compared to GCP-based registration, the proposed registration strategy provides accurate geometric alignment. Figure 2 shows a comparison of the proposed co-registration strategy and normal GCP-based co-registration.
It can be seen in Figure 2 that the GCP-based co-registration produces observable systematic shift in the flat region of the profile, which is mainly induced by the measurement error, while the proposed strategy gives better results due to the redundancy of a large number of tie points.
2.3. DSM Generation
The recent development of advanced image dense matching techniques offers the possibility to generate accurate and dense point clouds within reasonable time [36–38]. Semi-global matching (SGM) is favored by its dense stereo correspondence in texture-less area thanks to its quasi global optimization and neighborhood propagation. It adopts a multi-path dynamic programming to minimize the following energy within linear time (regarding to Image width × Image height × Disparity range):
UAV images usually produce large disparity range due to the large base-high ratio for high-rise buildings. Therefore, a hierarchical SGM (H-SGM) [39] is adopted to generate dense point clouds, which applies SGM with a coarse-to-fine strategy. Images are down-sampled as pyramids, and the disparity range is dynamically determined according to the disparity computed from the coarser level, while in the coarsest level the algorithm searches for all possible disparities.
Compared to traditional aerial platforms, the flying altitude and speed of UAV is relatively low, thus the moving objects (e.g., cars, pedestrians) on the ground may result in wrong disparities, as the corresponding points in each image are not geometrically identical. Most of such errors can be eliminated by a left-right consistency check. The remaining moving objects are further filtered by excluding 3D point with less than three rays. Therefore, the UAV’s low flying speed inherently excluded moving objects owing to the high matching redundancy.
Even with densely overlapped block design, such a low flying altitude inevitably creates notable occluded areas due to the large parallax. Traditional DSM generation procedure usually employs Delaunay triangulation for interpolation, whilst such interpolation will possibly result in height differences due to the uncertainty of the occluded area. Hence, this paper proposes to directly project the point clouds onto a regular grid, and to fill the small gaps using inverse distance interpolation (IVDI) with a small radius (five pixels), while to exclude the large occluded areas for the subsequent change detection.
Based on the DSMs, the corresponding orthophotos are generated by projecting each perspective image on the DSM, and then a weight average method is employed to blend the overlapped area according to the angle and visibility of each ray.
3. Change Detection
Among the proposed change detection methods, the most prominent trend is to combine both the height information and spectral information [21,23,25]. Especially in the case of very high resolution, the spectral information creates high intra-class variability and luminance discrepancy, so that change detection methods with spectral information alone bring a large number of false positives. Therefore, the height differences take the key role to improve the performance of change detection. In the meantime, the OBIA is agreed to be a valid tool for high resolution image analysis [40], owing to its robustness by representing information with groups of pixels. Therefore, a step-wise object-based change detection method is introduced in this section: the raster grid of the area is segmented and merged with a set of primitives extracted from the orthophoto and DSM, and then the change detection is performed on the object level according to a sequence of criteria under a decision tree analysis.
3.1. Multi-Primitive Segmentation and Region Merging
The primitives in this paper are defined as a set of special geometric and appearance properties, such as smoothness and blob. Each of the properties creates primitive segmentation (PS). The basic idea of the multi-primitive segmentation is to merge the resulting PS with each other, thus to form a group of segmentations with different properties. Then the segmentation results can be used for change decision analysis. Three spectral primitives and two geometric primitives are adopted in this paper. These primitives and the merging procedure will be introduced in the next subsections.
3.1.1. Spectral Primitives
(1) Texture Segments (TS)
The mean shift segmentation algorithm has been intensively studied in the past, and it produces acceptable results for spaceborne remote sensing images [23]. It aims to find clusters of pixels which have similar spectral responses. This is not suitable for images with very rich textures. Therefore, an efficient graph-based segmentation (EGS) approach [41] is employed. It adopts a greedy strategy to perform a pairwise comparison between inside-region variations and across-region variations. An important characteristic of EGS is its ability to preserve low variation image regions (e.g., homogenous roofs, ground), at the same time ignoring details in high-variability regions (e.g., shrub area, grass area with regular texture patterns). It has three tunable parameters: a smooth parameter σ for preprocessing, a threshold k for greedy merging, and a post-processing segment size m for small region merging. A typical parameter set is used in this paper (σ = 1, k = 800, m = 200) and these parameters are robust for normal RGB images. Readers may refer the algorithmic detail of EGS to [41];
(2) Bright Blobs (BB) and (3) Dark Blobs (DB)
Some small but significant objects may be ignored by EGS due to inappropriate threshold values. Such small objects sometimes create high local contrasts, such as public benches, dustbins, either brighter or darker than the surrounding environment. Such appearance characteristic can be effectively extracted by top-hat reconstruction (THR), which originates from morphological reconstruction of grey-level images [42]. It reconstructs a mask image J as BJI from a marker I, and this is done by finding the peaks of J, which are marked by I. The THR is then computed by subtracting BJI from J, where I is numerically smaller than J and is usually computed by a morphological erosion of a given structural element e. Thus, the THR computation can be written as:
A disk-shaped element with a given radius r is adopted to extract the blobs in an isotropic way. r is defined as the maximal radius of the objects of interest in pixels, and objects with radius larger than r will not be detected.
The color orthophoto is transformed into CIELAB space [43] and then the THR is applied on L band images and its negative images. The computed THRs are truncated with a given threshold to detect the DB and BB, and the thresholds can be determined by finding the median of the k-mean clusters [44]. The binarized DB and BB are segmented according to their 4-neighborhood connectivity. Therefore, the spectral primitives consist of large texture segments TS and small reflectance primitives segments DB and BB.
3.1.2. Geometric Primitives
(1) Connected Surface Segments (CS)
In an urban area, man-made structures usually create discontinuous surfaces to the ground, and pixels on such surfaces usually have high coherence in geometric deformation. Namely, pixels on the same surface may have the same change status. Such surfaces with large height jumps can be effectively detected with a simple and fast 4-neighborhood segmentation [45] with a single parameter τ in a linear time, which is the cut-off threshold for the height jumps.
(2) Blob-shaped Objects (BO)
With the same idea as the BB and DB, the geometric blobs can be detected by applying the THR on the DSM, which has shown its great advantages in building detection applications [46]. It should be noted that the BO are complementary to DB and BB, and vice versa: objects with similar color but different height to the surroundings can be detected by BO, while geometric blobs which fail to show significant height difference in the image matching could be detected by DB and BB once they create a local contrast.
3.1.3. Region Merging
By merging the five PSs with different combinations, more detailed segmentations interpreting different semantics can be used for change analysis. Denote a segmentation result Q as a grid of labels:
The merging operation of two PSs A and B can be done by the following operation:
Thus Equation (6) can be rewritten as:
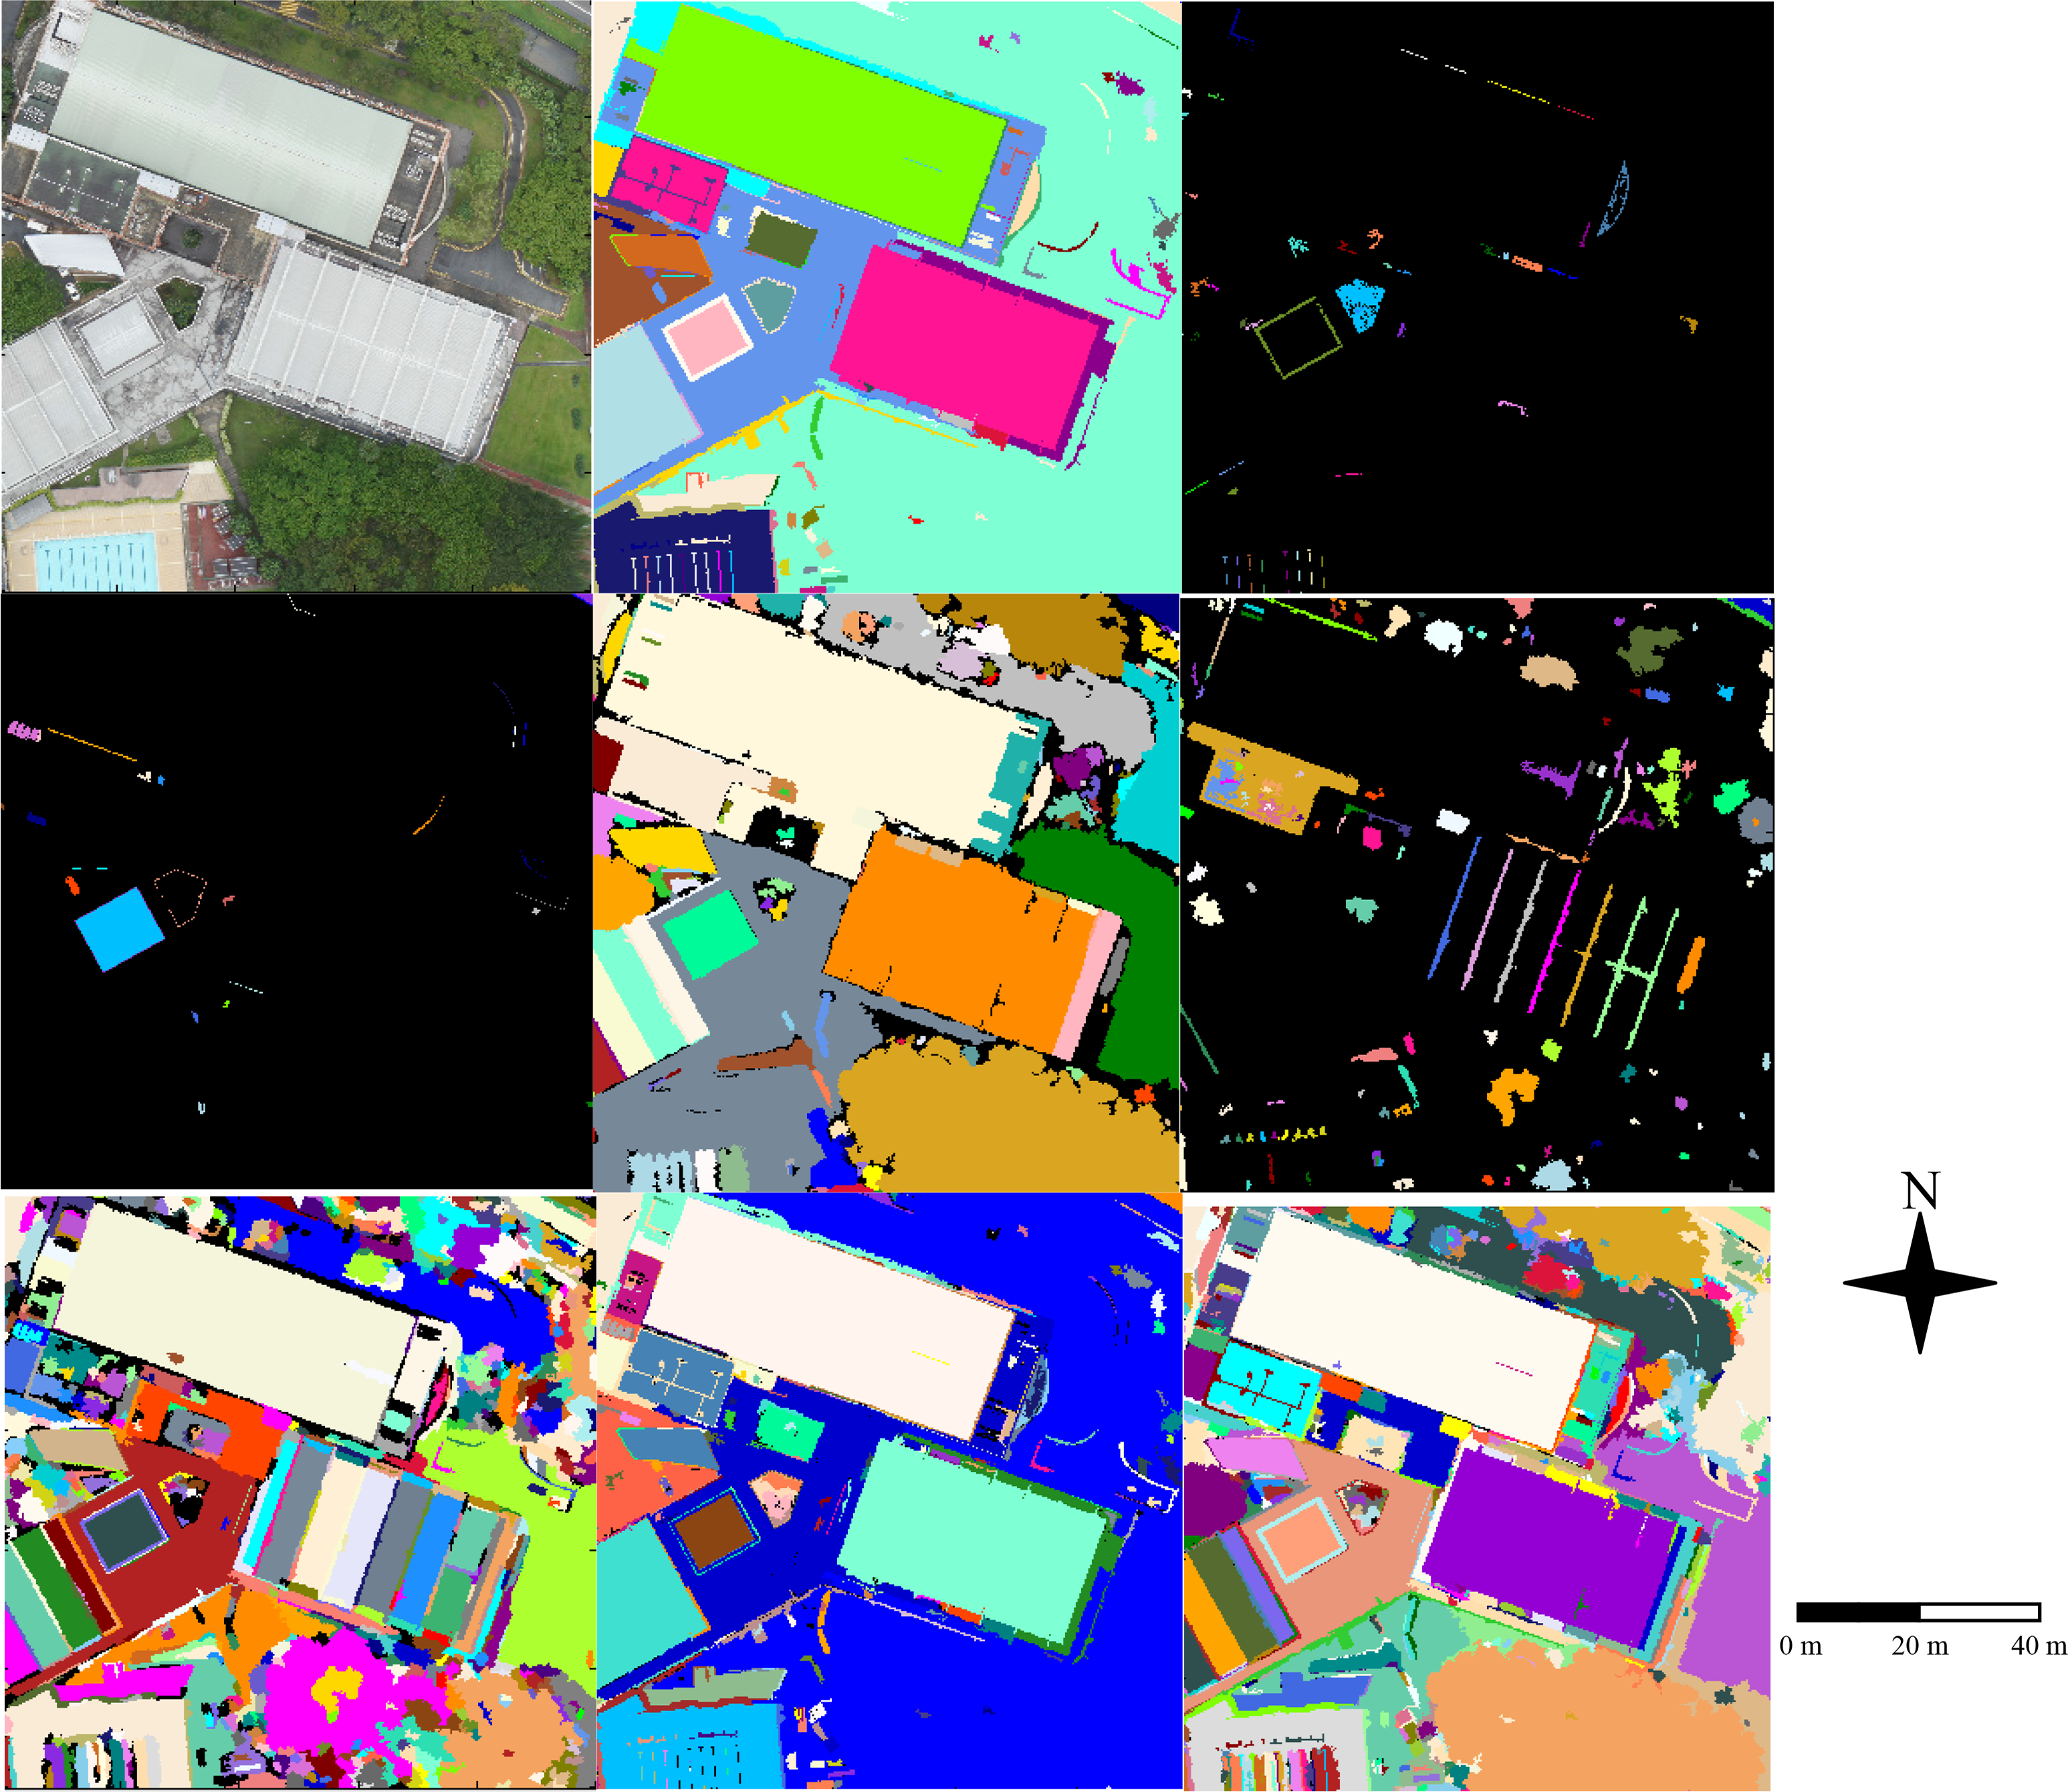
By varying the basic PS for merging, the resulting segmentations represent different levels of information. Let TSi, BBi, DBi, CSi, BOi be the five PSs described in this section, with i = 1, 2 distinguishing between date 1 and date 2, the inherent meanings of different combinations of them are illustrated in the Table 1.
The segmentations in Table 1 are defined as the multi-primitives segmentation. An example of the PSs and the multi-primitive segmentation is shown in Figure 3, where it can be seen that different PS complement each other such as the DB and BB, while TDBCB is the most detailed segmentation, and each of its segment serves as basic unit for change analysis.
3.2. Change Detection with Multi-Criteria Decision Tree Analysis
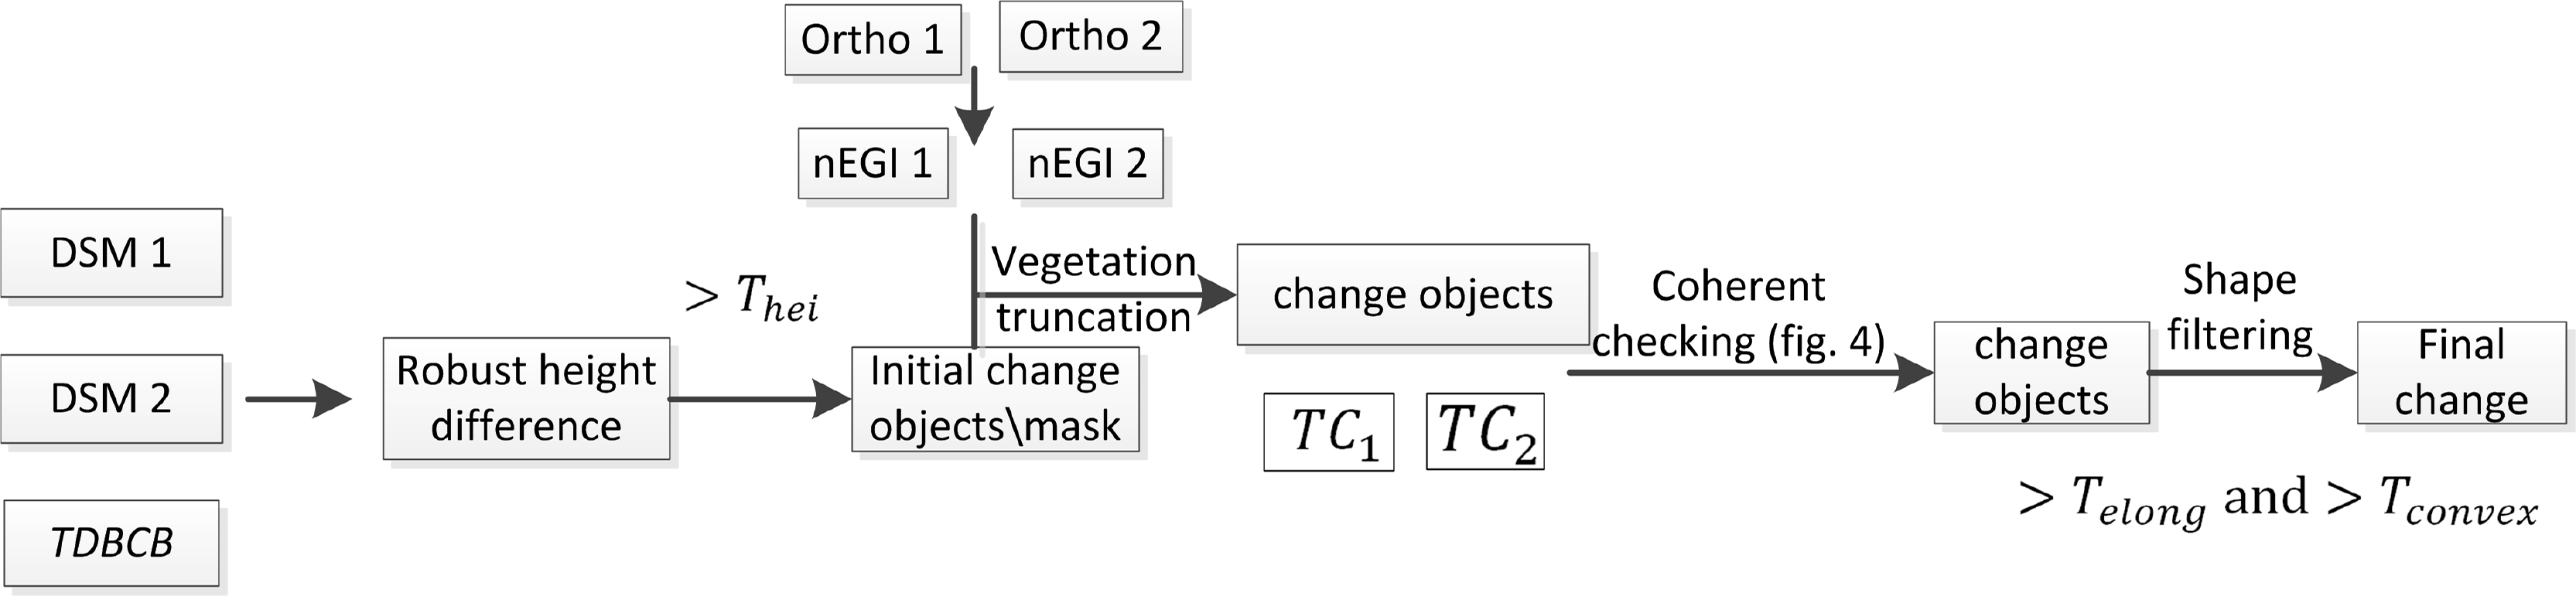
As mentioned in the first section, a weighting strategy fusing the spectral and height information might result in sensitive parameter tuning. This sometimes affects the transferability of the methods. Moreover, in most cases, the derived height information of UAV images is more robust than the spectral information for change detection, as it directly reflects the geometric difference. Therefore, hierarchical utilization of the height and color information might help to reduce false positives, and give rise to the transferability of the method. Based on the segmentation results, a multi-criteria decision analysis is used to post the spectral and height constraints hierarchically. The basic idea is to obtain an initial change mask first by comparing the height differences of each segment in TDBCB, and then falsify the segments identified in the initial mask by a set of spectral and height constraints, and a post-shape filtering. The proposed decision analysis considers four criteria sequentially: (1) the height difference of the segment in TDBCB; (2) the vegetation index; (3) the color and smooth coherence; (4) the shape of the segments.
3.2.1. Height Difference
Segments in TDBCB serve as the basic units for change analysis. Due to the unexpected luminance difference, the color information is used to check the color coherence of neighboring segments, rather than compare the color difference directly. An initial change mask is computed first by comparing the height difference of each segment in TDBCB. For each segment, the histogram of the height difference is computed. Height differences of pixels with more than 10% of total amount are averaged as the height difference value of the segment. Thus a threshold Thei is given to determine segments as candidates of potential changes.
3.2.2. Vegetation Index
Sometimes the seasonal change of vegetation is not of interest, and trees usually cause matching errors due to their complex and irregular shapes. Therefore these areas are not considered or given less weight. NDVI (Normalized Difference Vegetation Index) is used to extracted vegetation when the near-infrared band is available. For the case that only normal RGB images are available, the greenness of each pixel can be computed to indicate the green vegetation, which can be represented by Excessive Green Index (EGI) [47]:
As an extension, a normalized form of EGI (nEGI) similar to NDVI can be used:
By repetitive tests, the value 0.1 is chosen as an empirical parameter in this paper. To eliminate the disturbances by the soft canopies from the vegetation, pixels identified as vegetation in both dates with height differences less than 2Thei will not be considered as changes, and segments in TDBCB containing 80% of such pixels will not be considered.
3.2.3. Color and Smooth Coherence
It has been found that the matching artifacts usually occur at image edges for global matching methods [23], and this might lead to false positives. Color coherence check is helpful to eliminate such artifacts: if a segment in TDBCB is identified as a change due to the large height difference, while the neighboring segments share the same color segments in TDB are non-change, these changed segments might be false positives. Noting that there is a correlation between the DSM and the orthophoto, an erroneously matched pixel leads to a wrongly picked color, which might create wrong DB and BB segments. Therefore, only TS are used for more robust coherence check. Moreover, since the geometrically connected surfaces usually have the same change status, the CS is also considered to falsify the identified changes.
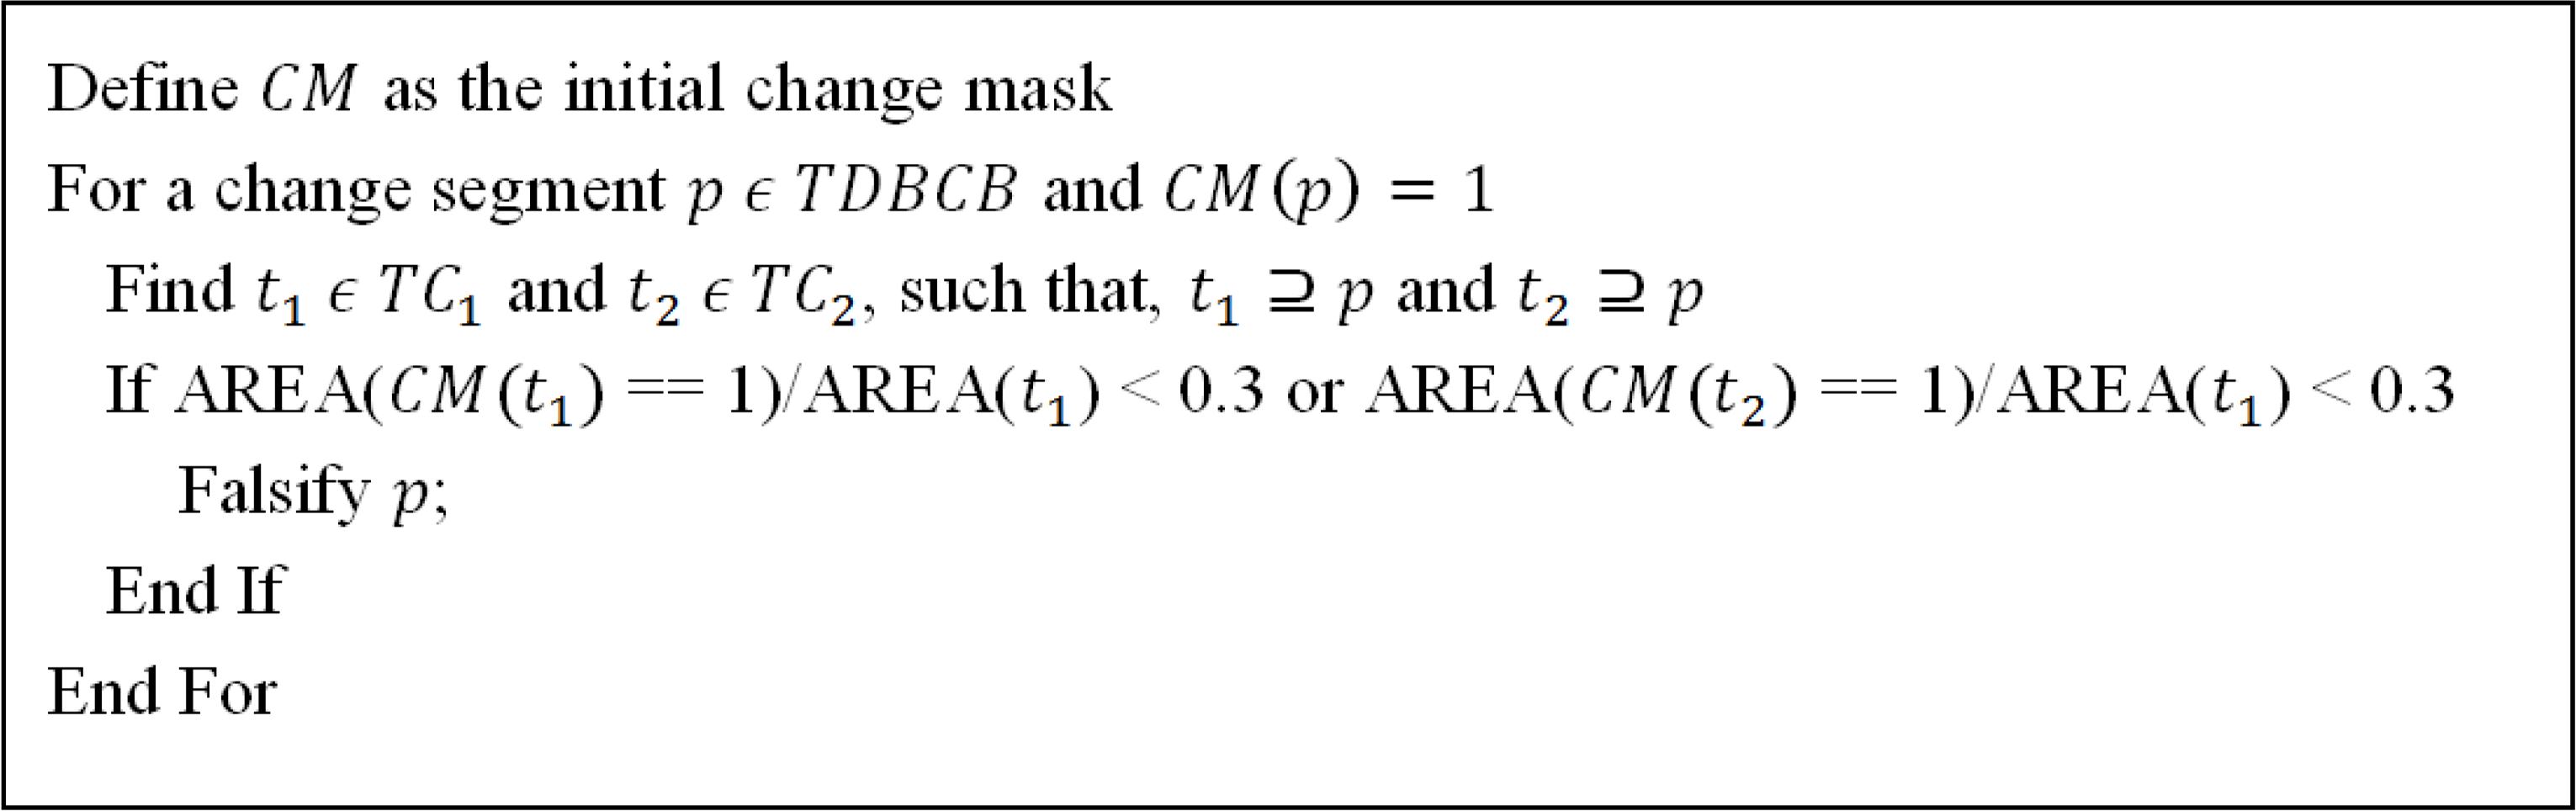
Therefore, a color-smooth coherence check is performed by testing each segment with the following pseudo code:

Intuitively, this procedure (Figure 4) checks each change segment p in TDBCB in a larger component: if a larger component containing p is not dominated by changed pixels, thus p should be falsified. The larger components contain the color and smooth surface information, and the smooth coherence check is made separately for each date, as artifacts may sometimes only occur in one date at the same place.
3.2.4. Shape Filtering
Since the aim is to detected possible changed objects, some irregularly shaped segments, such as thin structures, are likely to be artifacts induced by matching errors. Therefore, a post-shape filtering procedure is adopted considering two measures for thin and highly concave segments:

4. Experiments and Discussion
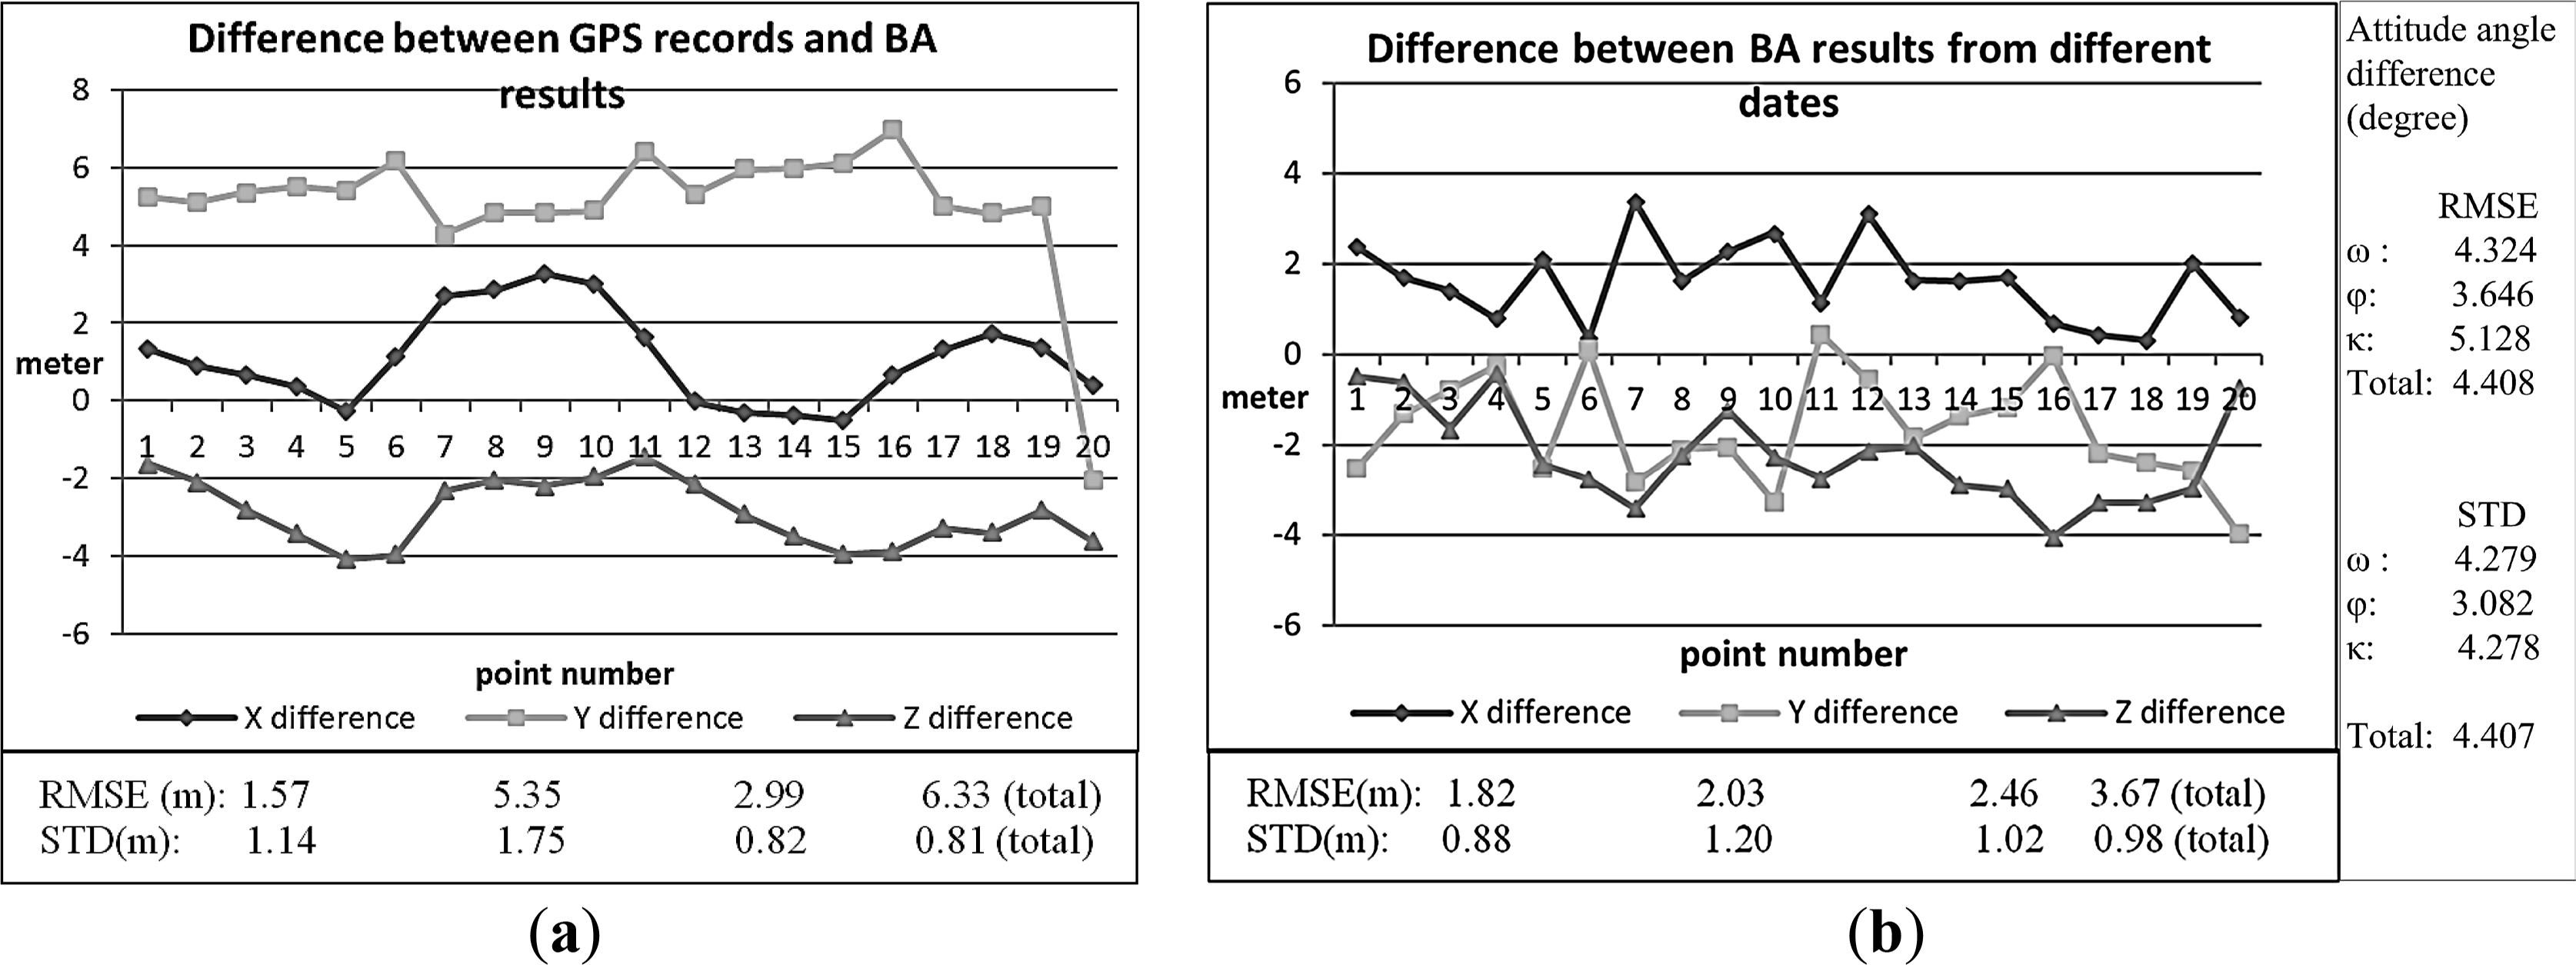
The proposed method aims to detect the geometric changes in an urban scenario for frequent monitoring, thus, changes of buildings and small infrastructures are of interest. We are also interested in detecting the significant changes of tree canopies, since they might be caused by natural disasters such as lightning or sudden failing due to healthy problems, which are important for the application of smart city management. The UAV images in this study are acquired with Falcon-8 octocopter. Two test areas in a university campus are chosen for experiments, and each test area contain 20 images. Images are acquired with 15 months difference, and the flight waypoints are designed as a regular block (as shown in Figure 1b) with five images (with 80% overlap) in the in-strip direction and 4 (with 60% overlap) in cross-strip direction. The same waypoints are used for image acquisition in both dates, and an accuracy assessment of the on-board GPS system can be found in Figure 6 by comparing the GPS records and perspective centers after BA. It shows, from Figure 6b, that positional deviation between two dates is relatively small (3.67 m in total), which is good enough to ensure the UAV image between two dates are accurately overlapped, while the GPS drifts shown in Figure 6a is larger (6.33 m in total), which mainly comes from to the Y direction, and this might be a systematic error induced by physical conditions such as radio quality, which demonstrates the deviation of the actual and planned flight waypoint. In this experiment, the GPS records are only used to find neighborhoods for pair-wise tie point matching, instead of being one of the observations.
A Sony-Nex 5 camera and a Sony-Nex 5N are used for date 1 and date 2, respectively. With 16 mm focal length and 5 micron pixel size, the flying height is 150 meters above the ground, producing images with roughly 5 cm GSD. The interior and exterior orientations of image in date 1 were computed with GCPs from land surveys from one of our previous 3D modeling project [48], with RMSE of 0.08, 0.06, 0.06 in X, Y, Z dimension for check points. The co-registration of these two dates is illustrated in the “Data Acquisition and Pre-processing” section, with average image residual of 0.6 pixels. The change detection results were validated by the ground truth masks, which were generated by carefully manual inspection.
4.1. Experiment 1
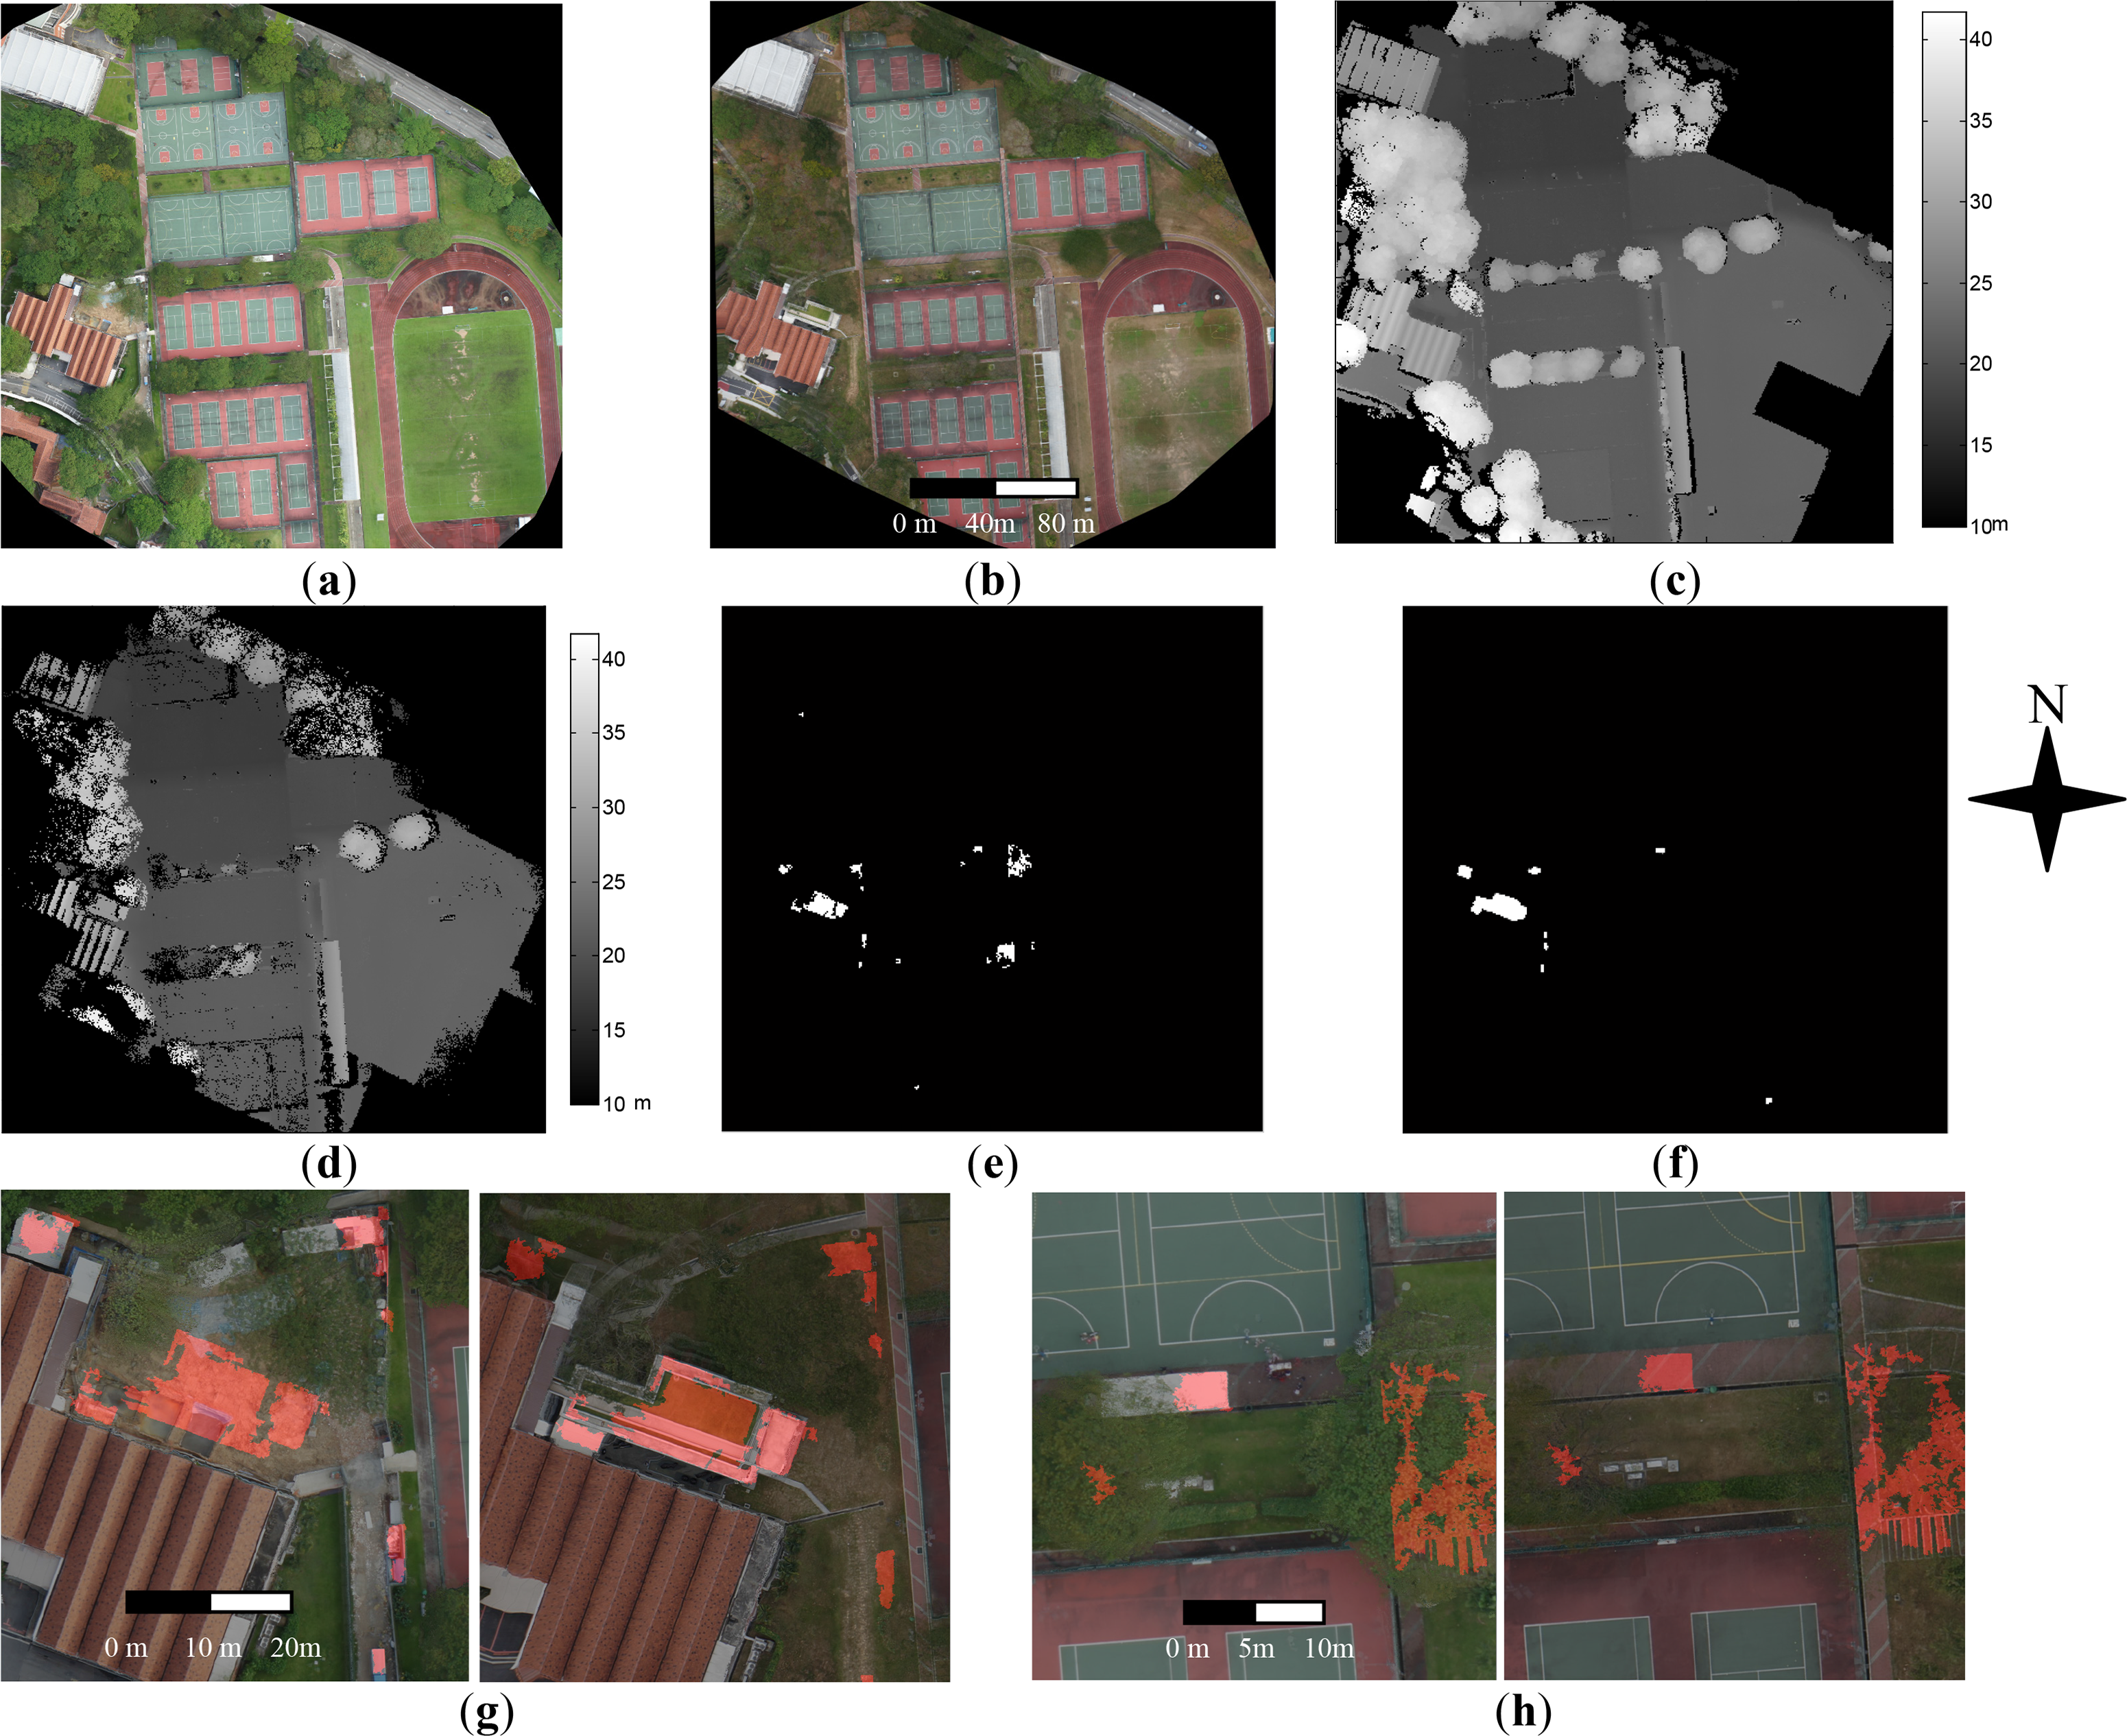
Figure 7 shows a relatively simple scene, with only a few houses. There exists a clear seasonal change on the vegetation due to dryness, with a high degree of luminance difference, the sparser trees in date 2 lead to a notable error in the matched DSM (Figure 7c,d). This test area covers 7.82 hectares, with a 25 cm2 footprint per pixel, and the dimension of the orthophoto is 5853 × 6009. The change detection results in Figure 7e show that the proposed method has detected most of the significant changes, such as new buildings and standing construction vehicles. Tree differences are also detected as significant vegetation change, while these are false positives caused by the matching errors (Figure 7h).
4.2. Experiment 2
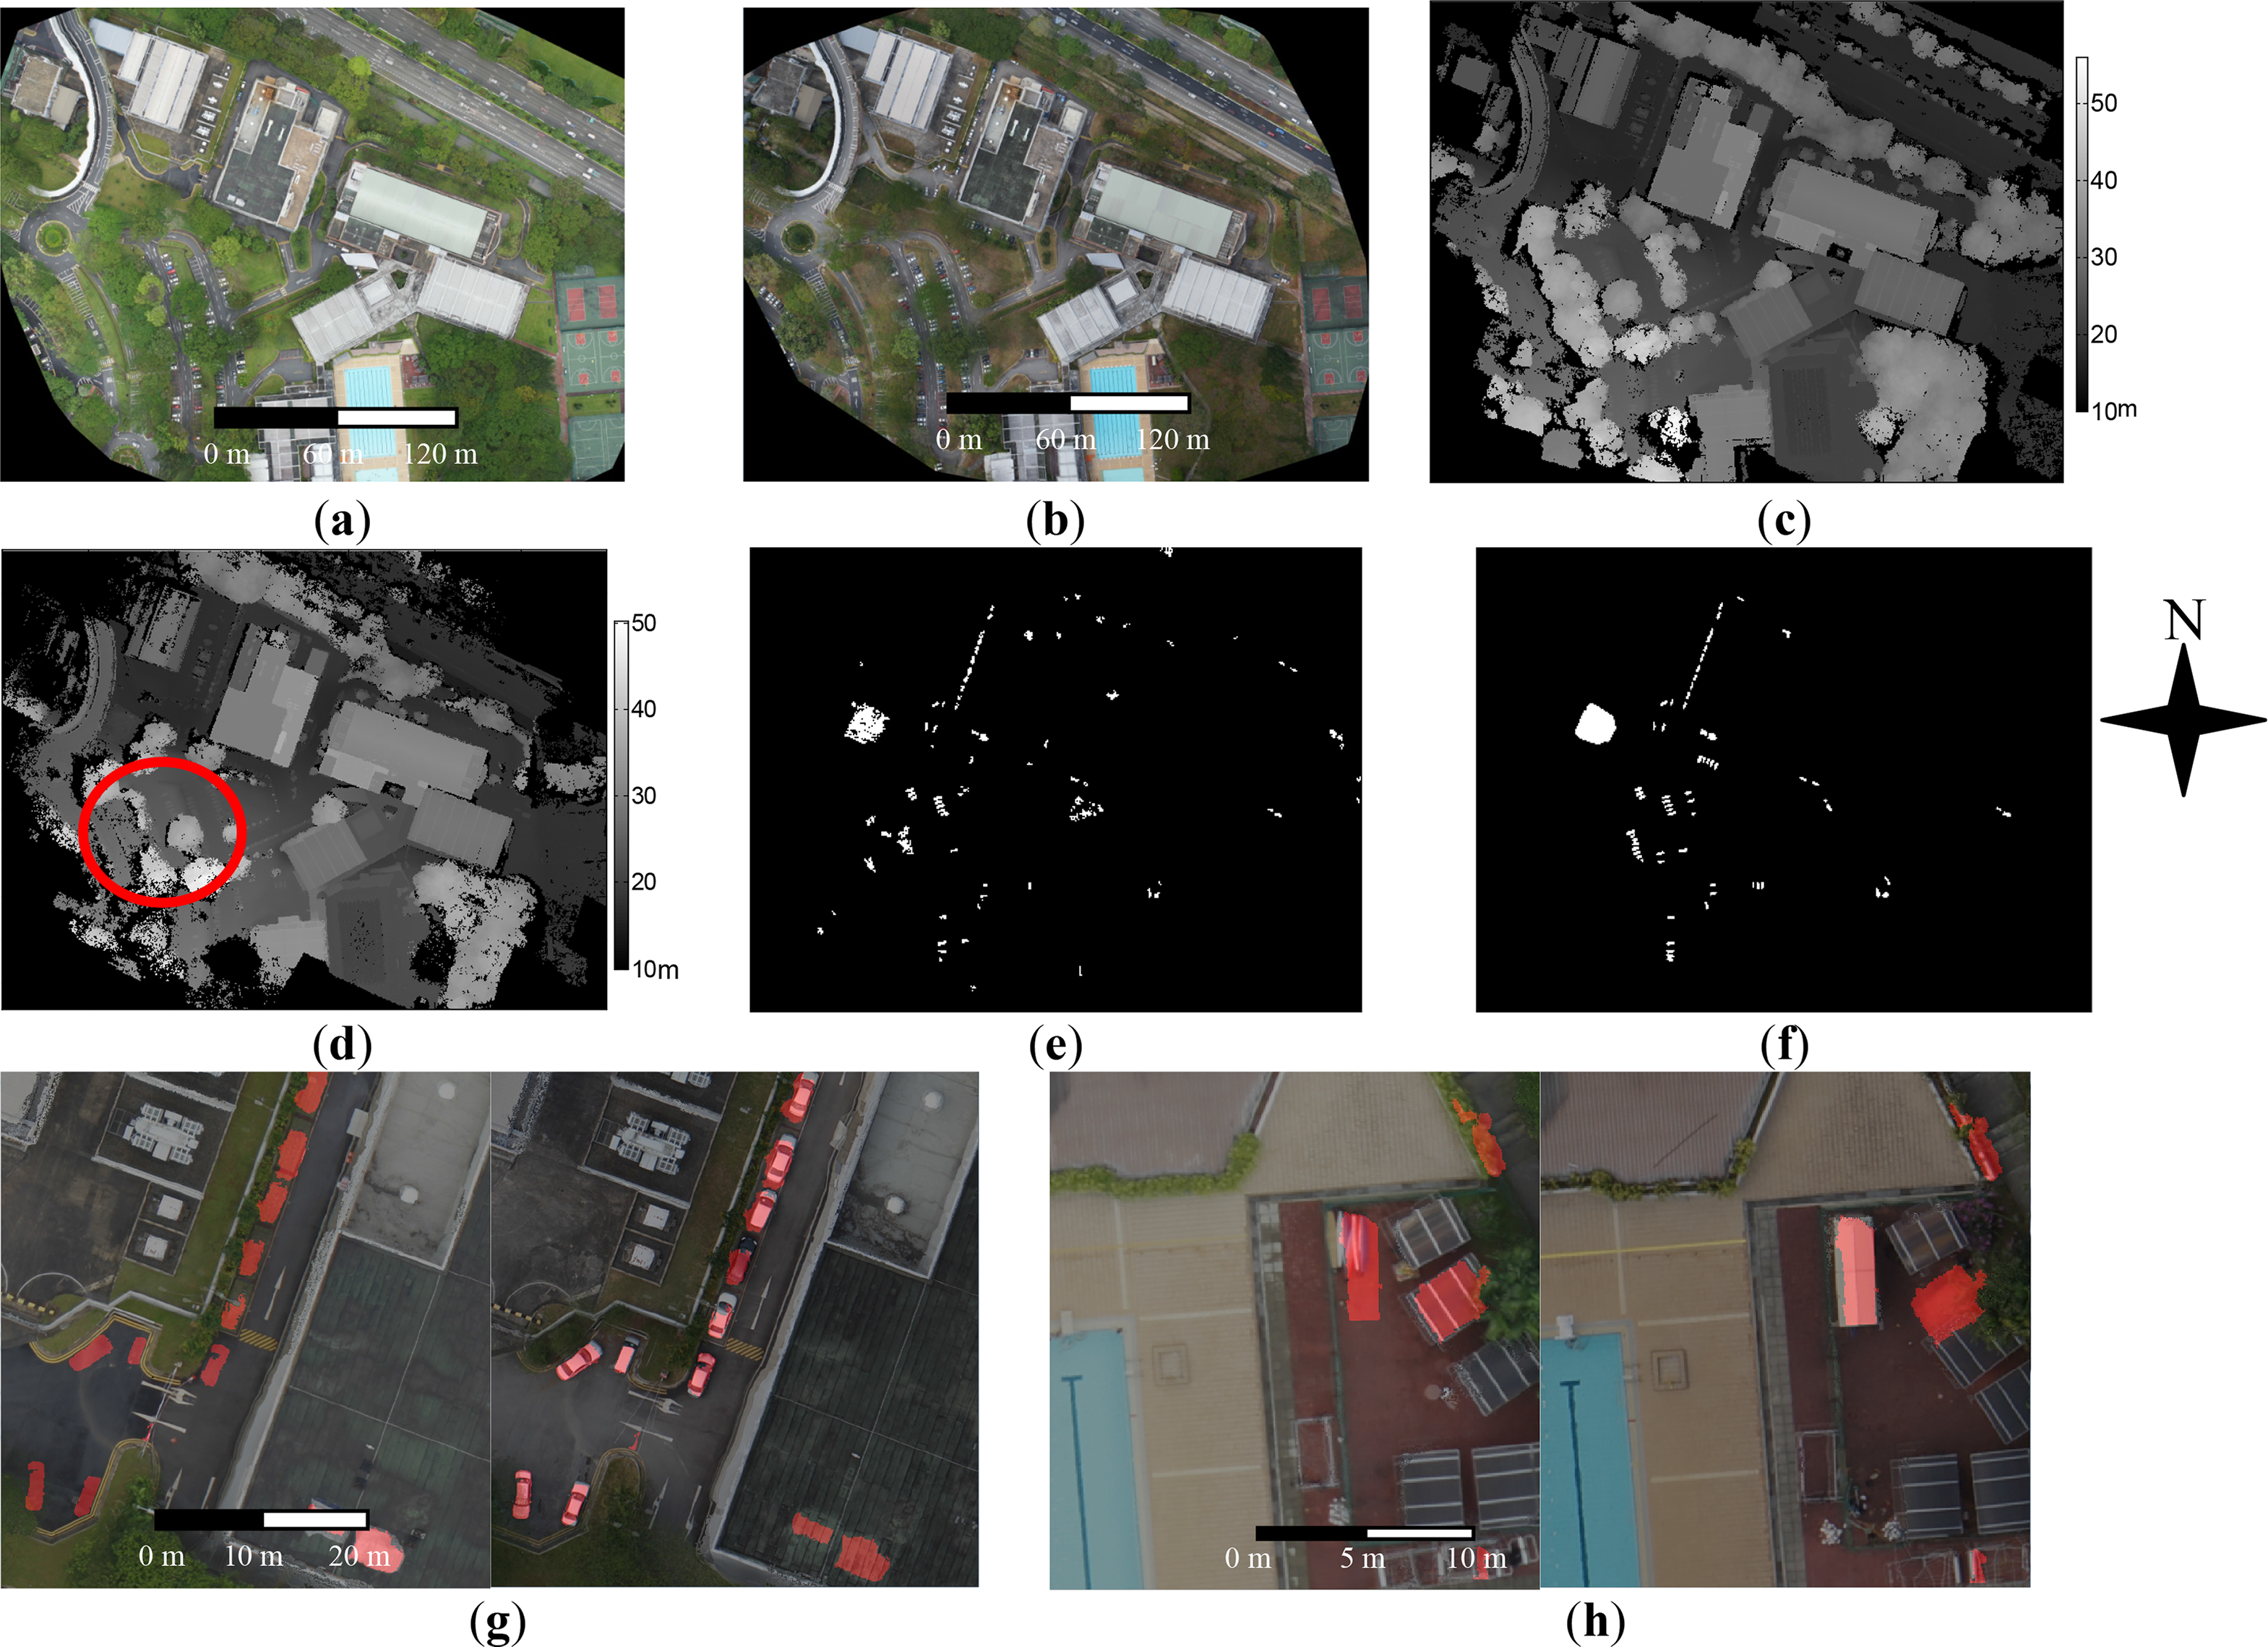
Figure 8 shows a more complex scenario with dense buildings and parting lots, covering 8.64 ha. There is a high coverage of vegetation, leading to many occlusions. Since this paper aims to monitor the scene frequently, thus the presence of still cars in the scene is also counted as changes. The orthophotos and DSMs have the same GSD as experiment 1. Compared to the ground truth mask (Figure 8f), the detection result (Figure 8e) shows that most of the significant changes are detected, and the level of detail is down to individual still cars. Figure 8g shows the cars are parking along the road, which demonstrates the application of illegal parking detection, and missing detection happens to cars partially covered by trees. In Figure 8h, the displacements of conservation facilities around the swimming pools are detected, which demonstrate an application for facility monitoring. Moreover, the largest change segment in Figure 8f is the significant change from grass to a bush area, which is 2 meters higher than date 1. This indicates it might need some actions for cleaning. It can be seen that there are large height differences in the tree canopy (Figure 8d shown in red circle), and they are not identified as changes. This is mainly because this area has the same height as the ground, and they are removed due to the color-smooth coherence procedure. Therefore, it shows that this strategy is able to eliminate false positives induced by large matching errors.
4.3. Results and Discussion
4.3.1. Accuracies, Errors and Uncertainties
The accuracies and errors are established with TP (true positives), FP (false positives), FN (false negatives) and TN (true negatives) in pixel-wise and object-wise. TPR (TP rate), FPR (FP rate), FNR (FN rate), OA (overall accuracy), and Kappa coefficient (KC) are computed to quantify the accuracy measure:
The results in Table 2 demonstrate that the proposed method achieves a KC of 0.987 and 0.979 for both experiments, which are mainly attributed to the large number of TN pixels. The pixel-wise measures require that the method not only detect the changes, but also ensure that the change segments should fit the ground truth well. This causes a lower TPR (0.652) in the pixel domain, where the errors mainly occur in the vegetation area.
From the object-based evaluation, 87.5 and 70.8 percent are correct detections for the two experiments, which show the proposed method could provide valuable information to reduce the manual work for frequent urban monitoring. 58.2 and 42 percent of the detected segments are erroneous detection for the two experiments; 12.5 and 29.2 percent of changed segments are missed. These errors are mainly due to the uncertainties of DSM, which substantially attribute to the matching algorithm.
The main uncertainties in the experiments come from the unwanted changes, such as seasonal effects of the vegetation and moving pedestrian, which essentially affect the performance of the matching algorithm, resulting erroneous height information. Moreover, the matching algorithm itself has uncertainties, which might come from noises, occlusions, quality of geo-referencing and repetitive patterns of the data. These uncertain factors will also lead to erroneous detections.
4.3.2. Analysis of the Multi-Criteria Process
The experimental results show that most of the false positives occur in the tree canopy area, which are caused by matching errors and the strong seasonal effects on the greenness, and such seasonal effects will become much weaker if the temporal resolution increases. In addition, some artifacts with isotropic shape still remain on the edges of large objects owing to the matching errors, which are not filtered by the elongation and convexity constraints.
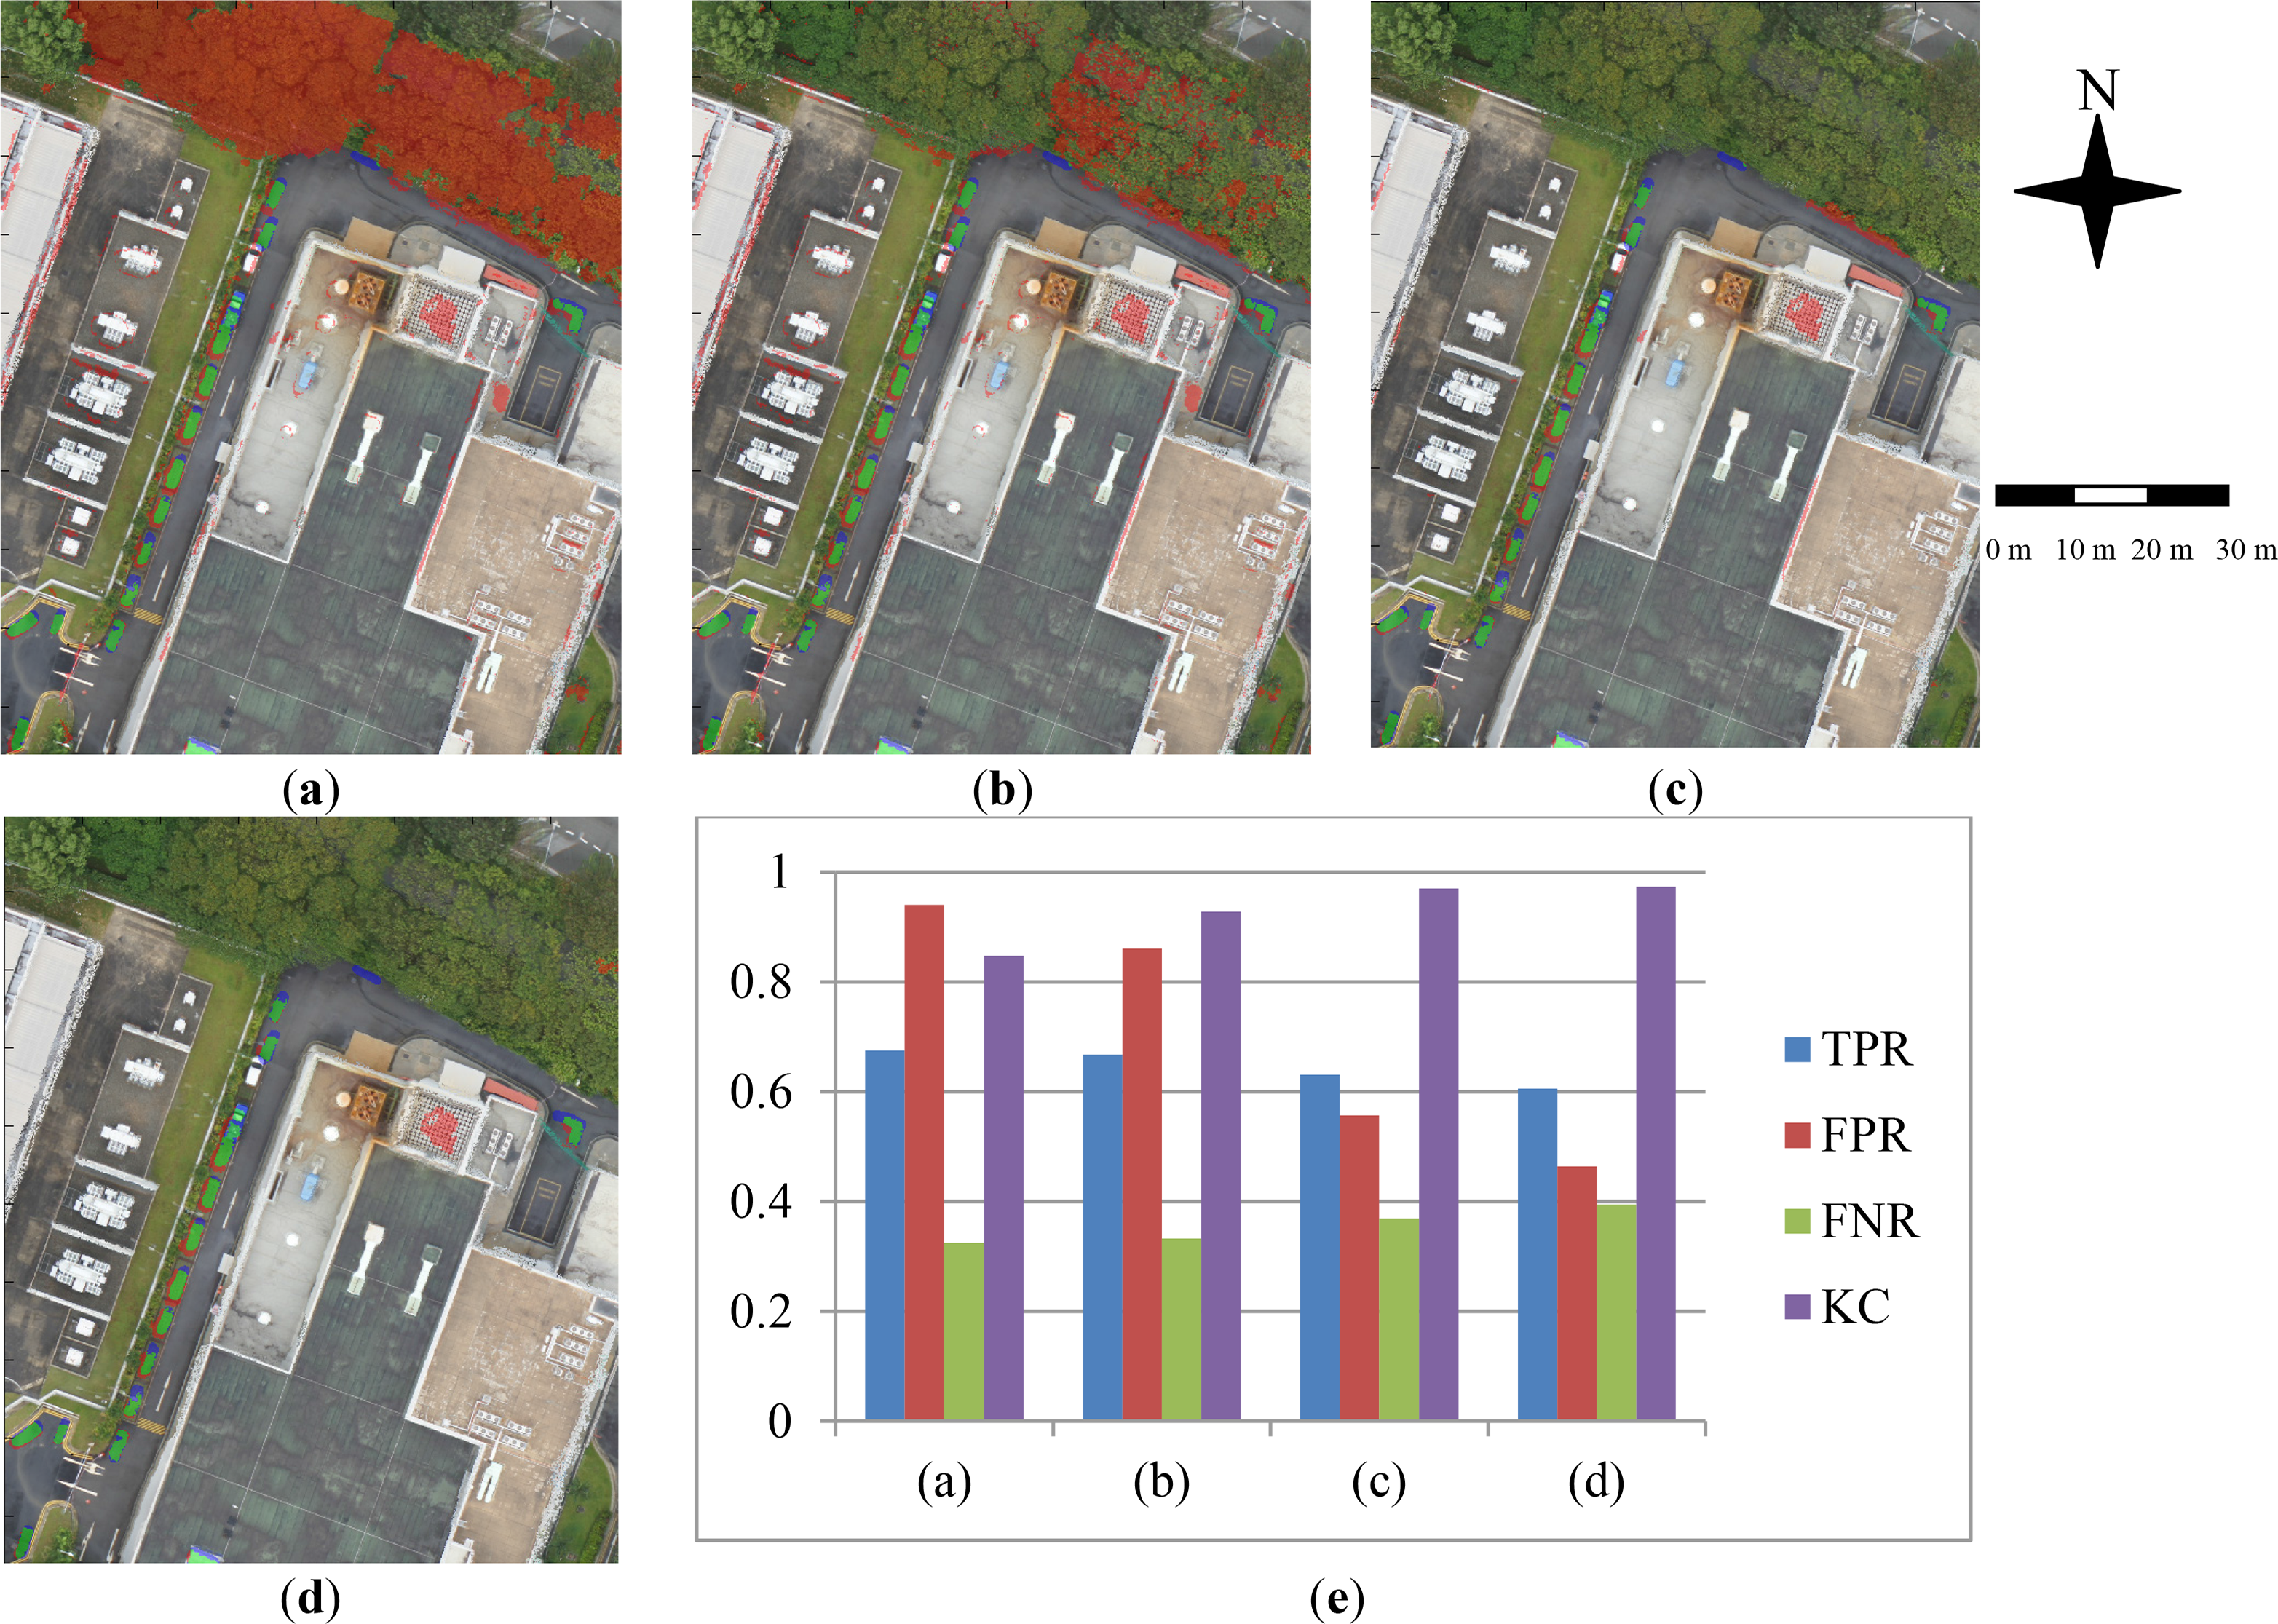
It is interesting to assess the contribution of each step of the multi-criteria process. Based on experiment 2, Figure 9 shows the results of each step in a portion of the images.
It can be seen from Figure 9a that the mere truncation on height difference with Thei produces many false positives, and the vegetation truncation eliminates most of the false positives which is induced by the matching uncertainties (Figure 9b). The color-smooth coherence check procedure reduces the false positives on both vegetation area and impervious surfaces (Figure 9c), and the final shape filtering removes the thin and concave structures (Figure 9d). Figure 9e shows this procedure greatly reduces the false positives with slight increasing the false negatives, and consequently raises the KC (from 0.84 to 0.97). The proposed method is able to detect changed objects with larger than 2.5 m2 footprint under the experimented case. There are still some false positives on vegetation and building segments, and they mainly sit on regular segments, where matching errors occur. In particular, the most significant error source is the matching artifacts on the multilayer and thin objects, which is the main limitation of the proposed method.
4.3.3. Parameters
The feature-based co-registration follows a standard BA procedure, where parameters are problem-independent and generally adaptable for UAV images. The H-SGM-based DSM generation adopts parameters that are very insensitive to imaging conditions [38]. Therefore these two procedures can be seen as parameter-less. The tunable parameters/thresholds of the proposed method are mainly from the process of multi-primitive segmentation the multi-criteria decision tree analysis. A summary of the tunable parameters can be seen in Table 3:

| Parameter/Thresholds | Description |
|---|---|
| Radius r for blob detection | This parameter is used for the morphological top-hat reconstruction for DB, BB and BO, the radius value should be larger than the detected blobs (dustbins, or chimneys, etc.), and is robust as it increases. |
| Thei for initial mask | This parameter is a self-explanatory value, dependent on the quality of the DSM and the resolution, an empirical value is Thei = 10GSD. |
| τ for CS computation | This parameter is dependent on the DSM quality and resolution, an empirical value is τ=2GSD. |
| Telong and Tconvex | These two thresholds are used for shape filtering of elongation and convexity, both of them are scale-invariant, and are used as an empirical values Telong = 0.025 and Tconvex = 0.3. |
It is worth mentioning that some of the parameters might be tuned to match different urban complexity for better change detection accuracy. r is directly linked to the minimal size of the changed object, and during the test, overestimation of r will not result in significant difference of the final KC. Thei and τ are related to the quality of the DSM, which depend on various factors such as the quality of the images, intersection angle and scene complexity. In practice, the given estimations of Thei and r in Table 3 performs well for H-SGM generated DSM. Since the parameters are mainly resolution dependent, it is intuitive to transfer the proposed methods to UAV images with different resolution under different scenario. Once an area is selected for frequent monitoring, the parameters can be optimized and fixed to achieve high automation. Moreover, most of the disturbances of the moving objects are inherently eliminated by constraining the minimal number of rays, while makes the proposed method more practical.
5. Conclusions
This paper presents an objected-based change detection method on UAV images for frequent urban monitoring. Two experiments were performed using regularly overlapped UAV images with 5 cm footprint. For each experiment, UAV images were taken with 15-month intervals, and the images from the earlier date were geo-referenced with GCPs. An overall accuracy of 99.6% and 99.2% were archived for both of the experiment. 58.2% and 42% wrong detection were observed due to the strong seasonal variance of the datasets. Most of the significant changes were detected, which showed that the proposed method could be used to reduce the manual work on inspecting urban changes and dynamics. In sum, the contribution of the work lies into the following aspects:
- (1)
This paper has explored the capability of UAV for automatic urban monitoring by integrating the color and height information, which has rarely been investigated before.
- (2)
The proposed method adopts a general BA framework to solve the registration of the multi-temporal dataset, which has achieved higher alignment accuracy (RMSE of 0.12 m) compared to traditional GCP-based registration (RMSE of 0.45 m) with the experiment dataset.
- (3)
A novel multi-criteria strategy is adopted combining multi-primitive segmentation, which has raised the KC progressively from 0.84 (initial change mask truncated with height difference) to 0.97 (final change mask).
However, since the increased resolution does not necessarily facilitate the same level of improvement for change detection, the disturbances from trees and omission errors due to matching ambiguity are also observed. Moreover, a UAV drone with longer battery life is expected to greatly enhance the practical value for this urban monitoring.
In future work, a more advanced and robust matching algorithm with higher edge-preservation capacity is planned. The near-infrared camera is expected for vegetation detection to reduce the false positives on the trees. More shape features such as solidity and eccentricity will be tested to filter false positives induced by matching errors on object boundaries. Furthermore, fixed-wing UAVs with longer operation time for large scene change detection will be explored and the use of oblique images will be investigated.
Acknowledgments
This work was established at the Singapore-ETH Centre for Global Environmental Sustainability (SEC), co-funded by the Singapore National Research Foundation (NRF) and ETH Zurich. The author would like to thank Armin Gruen and Gerhard Schmitt for their support on this work. The author would also like to thank Bernhard Klein for proof-reading and Gideon Aschwanden for assisting on the UAV image acquisition.
Disclaimer
Mention of brand names in this paper does not constitute an endorsement by the author.
Conflicts of Interest
The author declares no conflict of interest.
References and Notes
- Freire, S.; Santos, T.; Navarro, A.; Soares, F.; Silva, J.; Afonso, N.; Fonseca, A.; Tenedório, J. Introducing mapping standards in the quality assessment of buildings extracted from very high resolution satellite imagery. ISPRS J. Photogramm. Remote Sens 2014, 90, 1–9. [Google Scholar]
- Macleod, R.D.; Congalton, R.G. A quantitative comparison of change-detection algorithms for monitoring eelgrass from remotely sensed data. Photogramm. Eng. Remote Sens 1998, 64, 207–216. [Google Scholar]
- Hayes, D.J.; Sader, S.A. Comparison of change-detection techniques for monitoring tropical forest clearing and vegetation regrowth in a time series. Photogramm. Eng. Remote Sens 2001, 67, 1067–1075. [Google Scholar]
- Song, C.; Woodcock, C.E.; Seto, K.C.; Lenney, M.P.; Macomber, S.A. Classification and change detection using Landsat TM data: When and how to correct atmospheric effects? Remote Sens. Environ 2001, 75, 230–244. [Google Scholar]
- Rogan, J.; Franklin, J.; Roberts, D.A. A comparison of methods for monitoring multitemporal vegetation change using Thematic Mapper imagery. Remote Sens. Environ 2002, 80, 143–156. [Google Scholar]
- Qin, R.; Gong, J.; Li, H.; Huang, X. A coarse elevation map-based registration method for super-resolution of three-line scanner images. Photogramm. Eng. Remote Sens 2013, 79, 717–730. [Google Scholar]
- Qin, R.; Gong, J.; Fan, C. Multi-frame image super-resolution based on knife-edges. In Proceedings of 2010 IEEE International Conference on Signal Processing (ICSP), Beijing, China, 24–28 October 2010; pp. 972–975.
- Knudsen, T.; Olsen, B.P. Automated change detection for updates of digital map databases. Photogramm. Eng. Remote Sens 2003, 69, 1289–1296. [Google Scholar]
- Walter, V. Object-based classification of remote sensing data for change detection. ISPRS J. Photogramm. Remote Sens 2004, 58, 225–238. [Google Scholar]
- Bouziani, M.; Goïta, K.; He, D.-C. Automatic change detection of buildings in urban environment from very high spatial resolution images using existing geodatabase and prior knowledge. ISPRS J. Photogramm. Remote Sens 2010, 65, 143–153. [Google Scholar]
- Doxani, G.; Karantzalos, K.; Tsakiri-Strati, M. Automatic change detection in urban areas under a scale-space, object-oriented classification framework. In Proceedings of 2010 100 Years ISPRS-Advancing Remote Sensing Science, Vienna, Austria, 5–7 July 2010.
- Qin, R. Change detection on LOD 2 building models with very high resolution spaceborne stereo imagery. ISPRS J. Photogramm. Remote Sens 2014, 96, 179–192. [Google Scholar]
- Tenedório, J.A.; Rebelo, C.; Estanqueiro, R.; Henriques, C.D.; Marques, L.; Gonçalves, J.A. New developments in geographical information technology for urban and spatial planning. In Technologies for Urban and Spatial Planning: Virtual Cities and Territories; IGI Globle: Hershey, PA, USA, 2013; Volume 2326, pp. 196–227. [Google Scholar]
- LTA. Maintaining Our Roads and Facilities. http://www.lta.gov.sg/content/ltaweb/en/roads-and-motoring/road-safety-and-regulations/maintaining-our-roads-and-facilities.html (accessed on 14 January 2014).
- Qin, R.; Gruen, A. 3D change detection at street level using mobile laser scanning point clouds and terrestrial images. ISPRS J. Photogramm. Remote Sens 2014, 90, 23–35. [Google Scholar]
- Pacifici, F.; Del Frate, F.; Solimini, C.; Emery, W.J. An innovative neural-net method to detect temporal changes in high-resolution optical satellite imagery. IEEE Trans. Geosci. Remote Sens 2007, 45, 2940–2952. [Google Scholar]
- Kasetkasem, T.; Varshney, P.K. An image change detection algorithm based on Markov random field models. IEEE Trans. Geosci. Remote Sens 2002, 40, 1815–1823. [Google Scholar]
- Martha, T.R.; Kerle, N.; Jetten, V.; van Westen, C.J.; Kumar, K.V. Landslide volumetric analysis using Cartosat-1-derived DEMs. IEEE Geosci. Remote Sens. Lett 2010, 7, 582–586. [Google Scholar]
- Gong, P.; Biging, G.S.; Standiford, R. Technical note: Use of digital surface model for hardwood rangeland monitoring. J. Rang. Manag 2000, 53, 622–626. [Google Scholar]
- Waser, L.; Baltsavias, E.; Ecker, K.; Eisenbeiss, H.; Feldmeyer-Christe, E.; Ginzler, C.; Küchler, M.; Zhang, L. Assessing changes of forest area and shrub encroachment in a mire ecosystem using digital surface models and CIR aerial images. Remote Sens. Environ 2008, 112, 1956–1968. [Google Scholar]
- Chaabouni-Chouayakh, H.; Reinartz, P. Towards automatic 3D change detection inside urban areas by combining height and shape information. Photogramm. Fernerkund. Geoinf 2011, 2011, 205–217. [Google Scholar]
- Jung, F. Detecting building changes from multitemporal aerial stereopairs. ISPRS J. Photogramm. Remote Sens 2004, 58, 187–201. [Google Scholar]
- Tian, J.; Reinartz, P.; d’Angelo, P.; Ehlers, M. Region-based automatic building and forest change detection on Cartosat-1 stereo imagery. ISPRS J. Photogramm. Remote Sens 2013, 79, 226–239. [Google Scholar]
- Johnson, R.D.; Kasischke, E. Change vector analysis: A technique for the multispectral monitoring of land cover and condition. Int. J. Remote Sens 1998, 19, 411–426. [Google Scholar]
- Tian, J.; Cui, S.; Reinartz, P. Building change detection based on satellite stereo imagery and digital surface models. IEEE Trans. Geosci. Remote Sens 2013, 52, 406–417. [Google Scholar]
- Shafer, G. A mathematical Theory of Evidence; Princeton University Press: Princeton, NJ, USA, 1976. [Google Scholar]
- Coulter, L.; Lippitt, C.; Stow, D.; McCreight, R. Near real-time change detection for border monitoring. In Proceedings of 2011 the ASPRS Annual Conference, Milwaukee, WI, USA, 1–5 May 2011; pp. 1–5.
- Shi, J.; Wang, J.; Xu, Y. Object-based change detection using georeferenced UAV images. Int. Arch. Photogramm. Remote Sens. Spat. Inf. Sci 2011, 38, 177–182. [Google Scholar]
- Xuan, W. Topographical change detection from UAV imagery using M-DSM method. In Applied Informatics and Communication, Proceedings of 2011 Communications in Computer and Information Science, Xi’an, China, 20–21 August 2011; pp. 596–605.
- Ascending Technologies. Asctec Falcon 8. http://www.asctec.de/uav-applications/aerial-imaging/asctec-falcon-8/asctec-falcon-8/ (accessed on 5 January 2014).
- Gruen, A.; Akca, D. Least squares 3D surface and curve matching. ISPRS J. Photogramm. Remote Sens 2005, 59, 151–174. [Google Scholar]
- Lowe, D.G. Distinctive image features from scale-invariant keypoints. Int. J. Comput. Vis 2004, 60, 91–110. [Google Scholar]
- Gruen, A.; Beyer, H.A. System calibration through self-calibration. In Calibration and Orientation of Cameras in Computer Vision; Gruen, A., Huang, T.S., Eds.; Springer: New York, NY, USA, 2001; Volume 34, pp. 163–193. [Google Scholar]
- Deseilligny, M.P.; Clery, I. Apero, an open source bundle adjusment software for automatic calibration and orientation of set of images. In Proceedings of 2011 ISPRS International Workshop on 3D Virtual Reconstruction and Visualization of Complex Architectures, Trento, Italy, 2–4 March 2011; pp. 269–276.
- Fischler, M.A.; Bolles, R.C. Random sample consensus: A paradigm for model fitting with applications to image analysis and automated cartography. Commun. ACM 1981, 24, 381–395. [Google Scholar]
- Pierrot-Deseilligny, M.; Paparoditis, N. A multiresolution and optimization-based image matching approach: An application to surface reconstruction from SPOT5-HRS stereo imagery. In Proceedings of Topographic Mapping from Space (with Special Emphasis on Small Satellites), Ankara, Turkey, 14–16 February 2006; 36.
- Zhang, L.; Gruen, A. Multi-image matching for DSM generation from IKONOS imagery. ISPRS J. Photogramm. Remote Sens 2006, 60, 195–211. [Google Scholar]
- Hirschmuller, H. Stereo processing by semiglobal matching and mutual information. IEEE Trans. Pattern Anal. Mach. Intell 2008, 30, 328–341. [Google Scholar]
- Rothermel, M.; Wenzel, K.; Fritsch, D.; Haala, N. Sure: Photogrammetric surface reconstruction from imagery. In Proceedings of 2012 LC3D Workshop, Berlin, Germany, 2–3 December 2012.
- Hussain, M.; Chen, D.; Cheng, A.; Wei, H.; Stanley, D. Change detection from remotely sensed images: From pixel-based to object-based approaches. ISPRS J. Photogramm. Remote Sens 2013, 80, 91–106. [Google Scholar]
- Felzenszwalb, P.F.; Huttenlocher, D.P. Efficient graph-based image segmentation. Int. J. Comput. Vis 2004, 59, 167–181. [Google Scholar]
- Vincent, L. Morphological grayscale reconstruction in image analysis: Applications and efficient algorithms. IEEE Trans. Imag. Process 1993, 2, 176–201. [Google Scholar]
- Joblove, G.H.; Greenberg, D. Color spaces for computer graphics. In Proceedings of 1978 ACM SIGGRAPH, Atlanta, GA, USA, 23–25 August 1978; ACM: Atlanta, GA, USA; pp. 20–25.
- Hartigan, J.A.; Wong, M.A. Algorithm as 136: A k-means clustering algorithm. J. R. Stat. Soc. Ser. C (Appl. Stat.) 1979, 28, 100–108. [Google Scholar]
- Davies, E.R. Machine Vision: Theory, Algorithms, Practicalities, 4th ed; Morgan Kaufmann: Burlington, MA, USA, 2004; p. 934. [Google Scholar]
- Qin, R.; Fang, W. A hierarchical building detection method for very high resolution remotely sensed images combined with DSM using graph cut optimization. Photogramm. Eng. Remote Sens 2014, 80, 37–48. [Google Scholar]
- Woebbecke, D.; Meyer, G.; Von Bargen, K.; Mortensen, D. Shape features for identifying young weeds using image analysis. Trans. ASAE 1995, 38, 271–281. [Google Scholar]
- Gruen, A.; Huang, X.; Qin, R.; Du, T.; Fang, W.; Boavida, J.; Oliveira, A. Joint processing of UAV imagery and terrestrial mobile mapping system data for very high resolution city modeling. Int. Arch. Photegramm. Remote Sens. Spat. Inf. Sci 2013, XL-1/W2, 175–182. [Google Scholar]


| Combination | Interpretation | Short Form |
|---|---|---|
| TSi⊕DBi⊕BBi⊕CSi⊕BOi | contains all possible segments in both dates, and serves as the basic unit for change analysis | TDBCB |
| TSi⊕DBi⊕BBi | contains all possible color segments in both dates, useful to exclude false positives from DSMs | TDB |
| TSi⊕CS1 | contains possible color segments from both date, and connected surfaces in date 1, helpful to exclude matching errors in date 1. | TC1 |
| TSi⊕CS2 | contains possible color segments from both date, and connected surfaces in date 2, helpful to exclude matching errors in date 2. | TC2 |
Note: when i is present as the subscript, it mean this primitives are merged in both dates, e.g., TSi = TS1 ⊕ TS2
| (Pixel-Based) | OA | KC | TPR | (Object-Based) | TPR | FPR | FNR | NSCD | NSCG |
|---|---|---|---|---|---|---|---|---|---|
| Experiment 1 | 0.995 | 0.987 | 0.652 | 0.875 | 0.582 | 0.125 | 17 | 8 | |
| Experiment 2 | 0.992 | 0.979 | 0.683 | 0.708 | 0.420 | 0.292 | 69 | 73 |
NSCD: number of changed segments detected; NSCG: number of changed segments in ground truth.
© 2014 by the authors; licensee MDPI, Basel, Switzerland This article is an open access article distributed under the terms and conditions of the Creative Commons Attribution license (http://creativecommons.org/licenses/by/3.0/).
Share and Cite
Qin, R. An Object-Based Hierarchical Method for Change Detection Using Unmanned Aerial Vehicle Images. Remote Sens. 2014, 6, 7911-7932. https://0-doi-org.brum.beds.ac.uk/10.3390/rs6097911
Qin R. An Object-Based Hierarchical Method for Change Detection Using Unmanned Aerial Vehicle Images. Remote Sensing. 2014; 6(9):7911-7932. https://0-doi-org.brum.beds.ac.uk/10.3390/rs6097911
Chicago/Turabian StyleQin, Rongjun. 2014. "An Object-Based Hierarchical Method for Change Detection Using Unmanned Aerial Vehicle Images" Remote Sensing 6, no. 9: 7911-7932. https://0-doi-org.brum.beds.ac.uk/10.3390/rs6097911