Analysis and Assessment of the Spatial and Temporal Distribution of Burned Areas in the Amazon Forest

Abstract
: The objective of this study was to analyze the spatial and temporal distribution of burned areas in Rondônia State, Brazil during the years 2000 to 2011 and evaluate the burned area maps. A Linear Spectral Mixture Model (LSMM) was applied to MODIS surface reflectance images to originate the burned areas maps, which were validated with TM/Landsat 5 and ETM+/Landsat 7 images and field data acquired in August 2013. The validation presented a correlation ranging from 67% to 96% with an average value of 86%. The lower correlation values are related to the distinct spatial resolutions of the MODIS and TM/ETM+ sensors because small burn scars are not detected in MODIS images and higher spatial correlations are related to the presence of large fires, which are better identified in MODIS, increasing the accuracy of the mapping methodology. In addition, the 12-year burned area maps of Rondônia indicate that fires, as a general pattern, occur in areas that have already been converted to some land use, such as vegetal extraction, large animal livestock areas or diversified permanent crops. Furthermore, during the analyzed period, land use conversion associated with climatic events significantly influenced the occurrence of fire in Rondônia and amplified its impacts.1. Introduction
Biomass burning is considered one of the most important mechanisms of natural vegetation conversion in anthropogenic areas and is the primary management tool involved in land use and land cover change (LULCC) in Brazil, where it is used primarily for Amazon forest deforestation, the opening and maintenance of agricultural areas, and pest control, among other purposes [1–3].
Burned areas retain coal and ash deposits on the ground surface, wherein permanence may vary depending on climatic variables, fire severity and fuel load [4]. In the Amazon region, agricultural expansion and deforestation are achieved primarily by burning the forest. This activity occurs annually during the dry season to facilitate the combustion process, primarily between June and October. In these months, the seasonal rainfall deficit and low air humidity make the vegetation more susceptible to the propagation of fires, and the beginning and duration of fires are influenced by factors such as the type of biomass, air temperature and winds [5–7].
The intensity, duration and extent of a fire and the time of the year when it occurs will determine how a particular ecosystem will be impacted and how this ecosystem will respond to the event. In some cases, this phenomenon could be beneficial to vegetation, as some ecosystems may return more vigorously after a fire, as with Brazilian savannah pastures, due to the mineralization of nutrients that are released by burning the soil and are rapidly absorbed by plants. Alternatively, fire can be destructive because successive burnings alter the rates of infiltration and evapotranspiration of water in the soil, increasing the soil’s susceptibility to wind and water erosion. Moreover, unlike the Brazilian Savannah, the Amazon Rainforest is not adapted to fire, and the vegetation in most cases is totally consumed by burning, leading to the total destruction of plants [8]. Consequently, in the Amazon biome, practices involving biomass burning cause many environmental impacts such as the destruction of the fauna and flora of forests and the depletion and erosion of the soil. Moreover, the release of trace gases and aerosols by biomass burning causes modifications to the energy balance of the atmosphere, leading to local, regional and global alterations in the climate [6,7,9].
In this context, data from satellites have increasingly been used in studies of biomass burning, mainly in the identification and monitoring of this phenomenon at different scales. These orbital data enable several types of fire study, such as active fire detection, which registers the instantaneous temperature of objects in combustion using spectral bands between 3 and 11 μm [10,11]; burned area estimation based on changes in the spectral characteristics of vegetation before and after the occurrence of fires, which uses the spectral bands in the visible, near-infrared and mid-infrared regions of the electromagnetic spectrum [12]; fire patterns and severity; and studies of vegetation regeneration and risk analysis [5,10,13]. Additionally, the mapping of burned areas and acquisition of quantitative information about the spatial and temporal distribution of fire events are fundamental, not only to enable more precise estimations of environmental impacts and LULCC monitoring but because these are required input data in climate models [14,15].
Recent improvements in remotely sensed data from satellites have resulted in an increased number and quality of burned area and active fire products, such as GFED, MCD45, L3JRC, Globcarbon and GLOBSCAR [16–18]. However, remote sensing methods have limitations that can cause errors in final burned area products [19]. Major factors include the presence of clouds, which significantly reduces the ability to detect a fire hotspot due to the attenuation of the spectral radiance emitted by the flaming and smoldering phases in the biomass burning process [20], the lack of data on the moment of fire occurrence and, especially, the incompatibility of the spatial resolutions of some sensors, making these sensors unsuitable for the identification of fires [21–23].
The influence of low spatial resolution on the accuracy of burned area products was analyzed by [24]. These authors emphasized that some pixels are classified correctly, whereas a limited number of pixels are misclassified, and when a low-resolution pixel is partially covered by more than one target in the high-resolution map, the accuracy of the low resolution product will automatically decrease. Thus, these authors defined “low-resolution bias” as this inaccuracy introduced by the difference in spatial resolution between high- and low-resolution data.
Another analysis was performed by [25]. In this study, the author analyzed burned area maps generated from coarse-resolution satellite imagery, which omit most small burned areas. The author analyzed the fine-resolution spatiotemporal pattern of burning for a complete fire season using a series of Landsat images and compared the results with coarse-resolution burned area maps (GBA2000 and GLOBSCAR). Fires often burn only a fraction of a pixel area; therefore, small burned areas can be accurately discerned and mapped in fine spatial resolution data such as Landsat, whereas in coarse-resolution data, patches of burned areas are intermixed with unburned ones, decreasing the potential for detection. The results indicated that the two coarse-resolution burned area products significantly underestimated the amount of burned area, especially in areas where burned area patterns are highly fragmented and the bias will be greater than in areas with larger and more contiguous fires.
Moreover, [26] developed an algorithm for burned area mapping based on classification trees using vegetation sensor imagery and the Landsat ETM+ sensor as reference. These authors utilized a continuous grid of 15 km × 15 km located in an ETM+ scene, and the evaluation was performed through linear regression analysis. The results showed that the highest coefficients of determination ranged from 0.78 to 0.98 and the lowest from 0.25 to 0.41, with mean values of 0.67 and 0.61, and these variations occurred due to differences in the spatial pattern and size distribution of burns under the different fire regimes. In the case of burned areas dominated by large fires, the vegetation sensor estimated their measurements accurately, but when small and fragmented burned areas were present, the results indicated a large underestimation at a spatial resolution of 1 km. Furthermore, in areas of larger burn scars, some overestimation may occur due to the dilation of burns and filling of small unburned areas located inside the burns.
Given this background, a new approach for monitoring and detecting active fires and for mapping burned areas was derived from Moderate Resolution Imaging Spectroradiometer (MODIS) data, aboard the Terra and Aqua satellites [10,12,15]. This sensor presents improved characteristics compared to other moderate and coarse spatial resolution sensors, such as better spectral and radiometric resolution, better spatial resolution of visible, near-infrared and mid-infrared spectral bands (250 and 500 m, respectively) and a high temporal resolution of one day [10].
The aim of this work consisted in the spatial and temporal analysis of burned area maps derived for Rondônia State during the 2000 to 2011 time period using a Linear Spectral Mixture Model (LSMM) on MODIS surface reflectance images (MOD09GA and MOD09GQ products). Moreover, the mapped areas were evaluated with imagery from the Thematic Mapper (TM) sensor from Landsat 5 and Enhanced Thematic Mapper Plus (ETM+) from Landsat 7, as well as fieldwork conducted in August 2013 with the objective of acquiring reference data for mapping evaluation.
2. Materials and Methods
2.1. Study Area
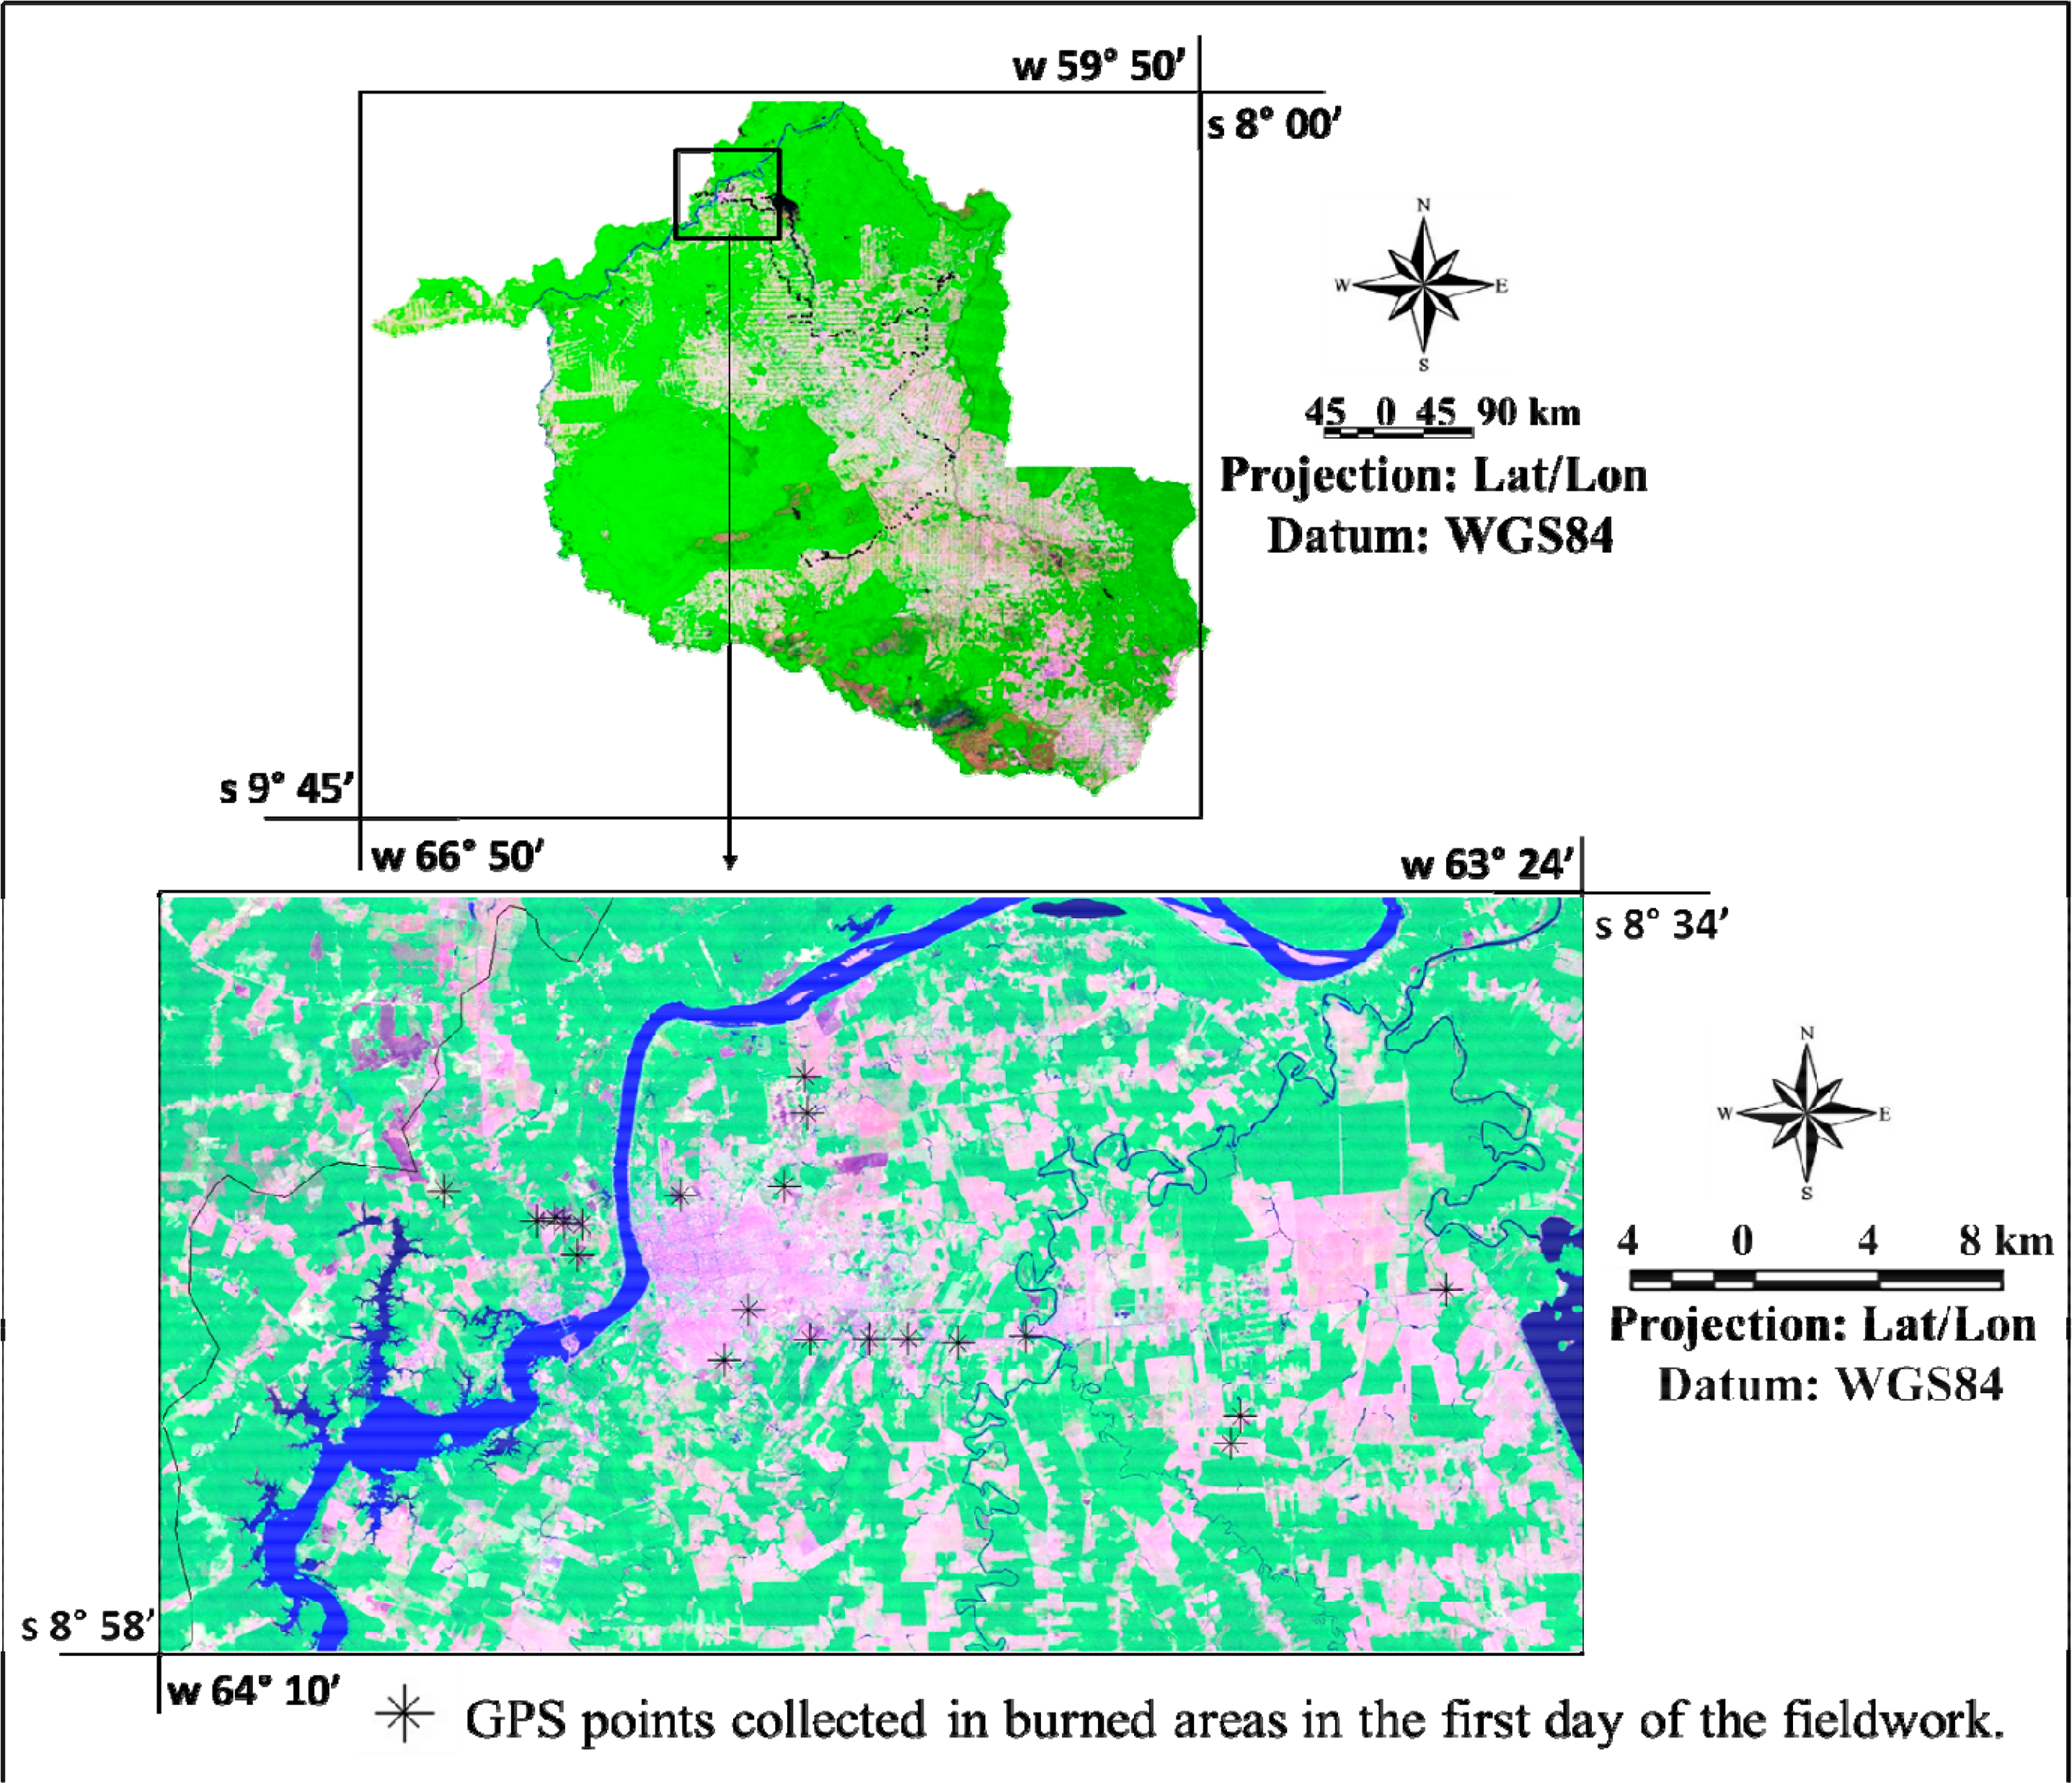
The study area covers Rondônia State, Brazil, located at 09°45′S to 8°00′S; 66°50′W to 59°50′W, as shown in Figure 1. The state presents a total area of 237,576 km2, bordering Amazonas to the north, Acre to the west, Mato Grosso to the east and south, and Bolivia to the west and south.
The human presence in Rondônia significantly increased in the 1960s due to the establishment of laws that promoted the socio-economic development of the Brazilian Amazon. These factors accelerated the human disturbance of the Amazon forest [27]. The implementation of policies associated with the growth of the wood industry and road improvements occasioned better opportunities and access for farmers and peasants. As a result, the deforestation once concentrated in the central area of Rondônia began to expand to the interior of the state, with fire being used to manage pastures and agricultural areas and to eliminate the biomass of dense forest [28]. Consequently, the land use in Rondônia is characterized by the presence of (I) conservation units with integral protection, which could include grains, cereals and animals livestock areas; (II) conservation units with sustainable use; (III) open fields; (IV) wood extraction; (V) diversified permanent crops; (VI) indigenous lands; and (VII) urban areas [29].
2.2. Methodology
2.2.1. Materials
The burned area maps were produced using surface reflectance imagery from the MODIS sensor, which has a polar orbit, a 700 km altitude and an imaging area of 2330 km. The time of image collection varies depending on the satellite. The Terra satellite crosses the equator in its descending orbit at 10:30 and 22:30, and its products are assigned the MOD acronym, whereas the Aqua satellite in its ascending orbit crosses the equator at 13:30 and 01:30, and its products receive the MYD acronym. In general, the two satellites together obtain approximately four daily looks at the same area.
The MODIS products used in the analyses include MOD09GA, comprising seven bands with a spatial resolution of 500 m, and MOD09GQ, presenting two bands with a spatial resolution of 250 m, both with a temporal resolution of one day. The images used encompassed the V09, V10, H11 and H12 tiles, which cover Rondônia State in the Amazon region, from June to November, the dry season, over 12 years (2000 to 2011). The images that presented a high incidence of clouds or poor radiometric quality (azimuth angle less than 30°) were discarded, leading to the use of 835 of the 2196 images available.
To validate the annual burned area maps, we utilized imagery from the TM and ETM+ sensors aboard the Landsat 5 and Landsat 7 satellites, respectively, which provide a finer spatial resolution (30 m). These images are widely used to validate burned area maps derived from imagery of medium and coarse resolution, such as that from the Advanced Very High Resolution Radiometer (AVHRR), MODIS, Geostationary Operational Environmental Satellite (GOES imager) and burned area products, including GBA2000, L3JRC, GlobScar and GlobCarbon [24,26,30–34].
The TM sensor is characterized by seven spectral bands in the visible, near-infrared, mid-infrared (30 m) and thermal infrared (120 m) regions, and the ETM+ sensor presents the same features as TM, with emphasis on a panchromatic band of 15 m and a thermal infrared band of 60 m, both sensors having a temporal resolution of 16 days. A random sampling was performed to select the scenes for validation, and subsequently, the downloading of all available images that presented burned areas without the presence of clouds was performed, totaling 71 images. Table 1 lists all of the scenes used to validate the burned areas.
The burned areas mapped from 2000 to 2011 in Rondônia were analyzed with respect to their current land use. Thus, the land use map of the Brazilian Institute of Geography and Statistics (IBGE) of 2011 was acquired in shapefile form. The data were inserted into Georeferenced Information Processing System (SPRING) software, and the classes were associated in a thematic category. A resampling to the same resolution as MODIS was performed, and subsequently the analysis of the results was originated by the cross-tabulation of the data.
Finally, to analyze the pattern of rainfall for the period from 2000 to 2011, we used data from the Tropical Rainfall Measuring Mission (TRMM) satellite. The TRMM data are estimated via an algorithm that combines global precipitation data originating from multiple satellite sensors. In this study, we used the precipitation values extracted from the 3B42 product with a spatial resolution of 3 h, geographical coverage of 50°S to 50°N and spatial resolution of 0.25° × 0.25°.
2.2.2. MODIS Surface Reflectance Images (MOD09) Data Processing
The MOD09GA and MODO09GQ products are available in Hierarchical Data Format (HDF); thus, after downloading the images, they were converted to GeoTIFF format using the MODIS Reprojection Tool (MRT). In this program, mosaics of the four tiles (V09H11, V09H12, V10H11 and V10H12) and clipping of the mosaic to the study area were performed, resulting in scenes with seven spectral bands with 250 m resolution.
2.2.3. Linear Spectral Mixture Model (LSMM) Application
There can be a great variety of targets (forest, bare soil, water, burned scars, urban areas) included within the spectral response of a single pixel; thus, the digital numbers (DNs) of pixels in remote sensing images present information about the mixing ratio between each component that will be influenced by the spatial resolution of each sensor [35,36]. Therefore, one of techniques utilized to identify burned areas is the LSMM, which uses a linear relationship to represent the spectral mixing of the targets in each pixel. In this method, the spectral response of the pixels representing any band can be considered a linear combination of each mixture component [35].
When analyzing a burned area, the pure pixels (endmembers) to be used as input data are selected directly in the image from homogeneous areas that present a spectral response closer to the theoretical curve expected for pure targets. The endmembers generally used for each set of data refer to the fraction images of vegetation, soil and shade, as shown in Equation (1).
In this work, LSMM was applied to MODIS images with the objective of generating shade fraction images, which enhances the low reflectance of the targets represented by the burned areas, thereby reducing the volume of analyzed data. The Environment for Visualizing Images (ENVI) program was utilized to extract the endmembers directly from the MODIS images using the spectral signature of the burned areas. The LSMM was performed a posteriori utilizing a script created in the Interactive Data Language (IDL) and implemented in ENVI, and the processing was applied to all 835 MODIS images at the same time using the same endmembers.
2.2.4. Burned Area Mapping in TM and ETM+ Images and Field Data
Initially, burned area maps were derived from TM and ETM+ imagery and used as reference data to validate the burned maps derived from MODIS images. After downloading all of the images, they were inserted into the Georeferenced Information Processing System (SPRING). In this software, all images were geometrically corrected using a polynomial model of 1° and nearest neighbor interpolation. The images were georeferenced to the GEOCOVER base map provided by NASA, originated from Landsat data, and submitted to orthorectification procedures to minimize displacements occasioned by relief.
The burned area maps were obtained from the image segmentation applied to each Landsat scene to generate spectrally homogeneous polygons. The segmentation tool is a procedure commonly utilized to separate the targets of the images, facilitating automatic or non-automatic classifications. Several studies have used this procedure, such as [37], which presented a semi-automatic procedure utilizing segmentation for burned area extraction in VEGETATION/SPOT and AVHRR/NOAA imagery; [38], which applied LSMM, segmentation and unsupervised classification to AVHRR/NOAA and TM/Landsat data to map burned forest areas in the Mediterranean, and [39], which used LSMM and segmentation in Landsat images to map deforested areas in the Amazon rainforest.
It is necessary to select thresholds of similarity (the minimum value at which two regions are considered similar and grouped into a single polygon) and area (the minimum size at which a region is individualized). After several tests performed on the images, the thresholds that offered the best delimitation of surface targets were 12 for similarity and 8 for area. After segmentation, the burned area polygons were grouped and associated in a thematic category, and then manual editing was performed to minimize possible errors of inclusion and omission resulting from segmentation.
Fieldwork was conducted in Rondônia State on 24–31 August 2013 with the objective of achieving better reliability in the mapping of reference images. The track related to this work is shown in Figure 2, and the black dots represent the GPS points collected. In this fieldwork, GPS points were collected at several types of surface targets, especially in areas that presented burn scars. The burned area points collected in the course of the fieldwork were compared with burned area maps created previously from Operational Land Imager (OLI) (Landsat 8) imagery collected during the same period as the fieldwork. In total, 56 points were collected in distinct burned areas, and only four did not match the classified maps, representing a 93% accuracy. It is noteworthy that these four mismatched points represent very old burn scars, which can be distinguished in the field but not in the Landsat images; therefore, the reference images are a reliable validation dataset with which to evaluate the burned area maps derived from MODIS imagery.
2.2.5. Burned Area Maps Derived from MODIS Sensor Images
After the generation of the 835 shade fraction images in IDL/ENVI, these data were inserted into SPRING. Segmentation of the shadow fraction images was performed, opting for the growth regions method to generate polygons that were spectrally homogeneous. The thresholds used were 12 for similarity and 8 for area, and topological editing was performed on the resulting segmentation polygons to delimit the polygons that represent burn scars. The final step involved manually editing the map to correct any errors resulting from the segmentation process.
2.2.6. Burned Area Validation
The validation of the annual burned area maps derived from MODIS was based on comparison with burned area maps derived from TM/ETM+ sensors for the same date of analysis. Due to the difference in the spatial resolution of the two products, which creates a geographic displacement between the associated burned area maps, we chose to perform a validation that emphasizes area. According to [40], the spatial pattern of burned areas impacts the accuracy of burned area maps at coarse spatial resolutions, generating some error due to scale problems. Thus, the analysis was focused on area estimation without considering the spatial location, borders, positioning or intersection of burned areas.
A grid with cells of 5 km × 5 km was created (Figure 3) to compare the burned areas estimated from MODIS and TM/ETM+ imagery based on the intersection of the areas in the grid. The comparison was performed by linear regression due to the lack of a dependency relationship between the variables. In this work, the burned areas mapped from TM/ETM+ images were chosen as the independent variable and the burned areas mapped from MODIS images as the dependent variable. We note that all regressions were significant at the p > 0.05 level (Student’s t-test).
The burned area maps derived from TM/ETM+ and MODIS were converted into ASCII files containing information about the latitude and longitude of each burned area polygon’s centroid and area. After this step, an algorithm was applied over a grid of 5 km × 5 km, and all of the areas that were included in the grid for both mapped products were summed according to Equation (2):
Comparison using grid cells has previously been utilized by [19,41], and according to [41] is a valid methodology. Those authors demonstrated that by assuming a misregistration in two products with distinct spatial resolutions, such as TM/ETM+ and MODIS, of approximately two pixels, the influence of this misregistration on the calculation of proportional errors for blocks larger than 13 pixels becomes negligible. The main advantage of this approach is the quantification of the bias in burned area estimations in coarse and medium resolution maps.
3. Results and Discussion
Figure 4 presents the validation graphics of burned area maps for Rondônia State (2000 to 2011). It can be noted that the coefficients of determination vary according to the burned area pattern and year. The lower values ranged between 0.46 and 0.58 and the higher values between 0.86 and 0.93, representing approximately 0.74 of average (all linear regressions were significant at p < 0.05, Student’s t-test).
In areas where small scars represent the majority of the burned area, the correlation between the MODIS and Landsat products tended to decrease, such as scenes 001/67 (2002, 2003), 229/69 (2003, 2004), 230/68 (2000), 231/66 (2011), 231/68 (2002, 2004), 231/69 (2009), 232/66 (2006), 232/67 (2006), 232/68 (2001), 233/66 (2008) and 233/68 (2007), varying between 46% and 76% (significant at p < 0.05, Student’s t-test). In addition, in these areas, MODIS underestimated burned area relative to TM/ETM+ by approximately 35%. Moreover, when the burn scars are greater than 2 km2 in area, the correlation between the products from these sensors increases expressively, varying between 81% and 96% (significant at p < 0.05, Student’s t-test). In some cases, MODIS presented an overestimation of approximately 6% (in mean values) relative to the TM/ETM+ data. According to [26], in areas with large burns, some overestimation may occur due to the dilatation of these burns and mixed pixels that include small unburned areas located inside the large burned areas.
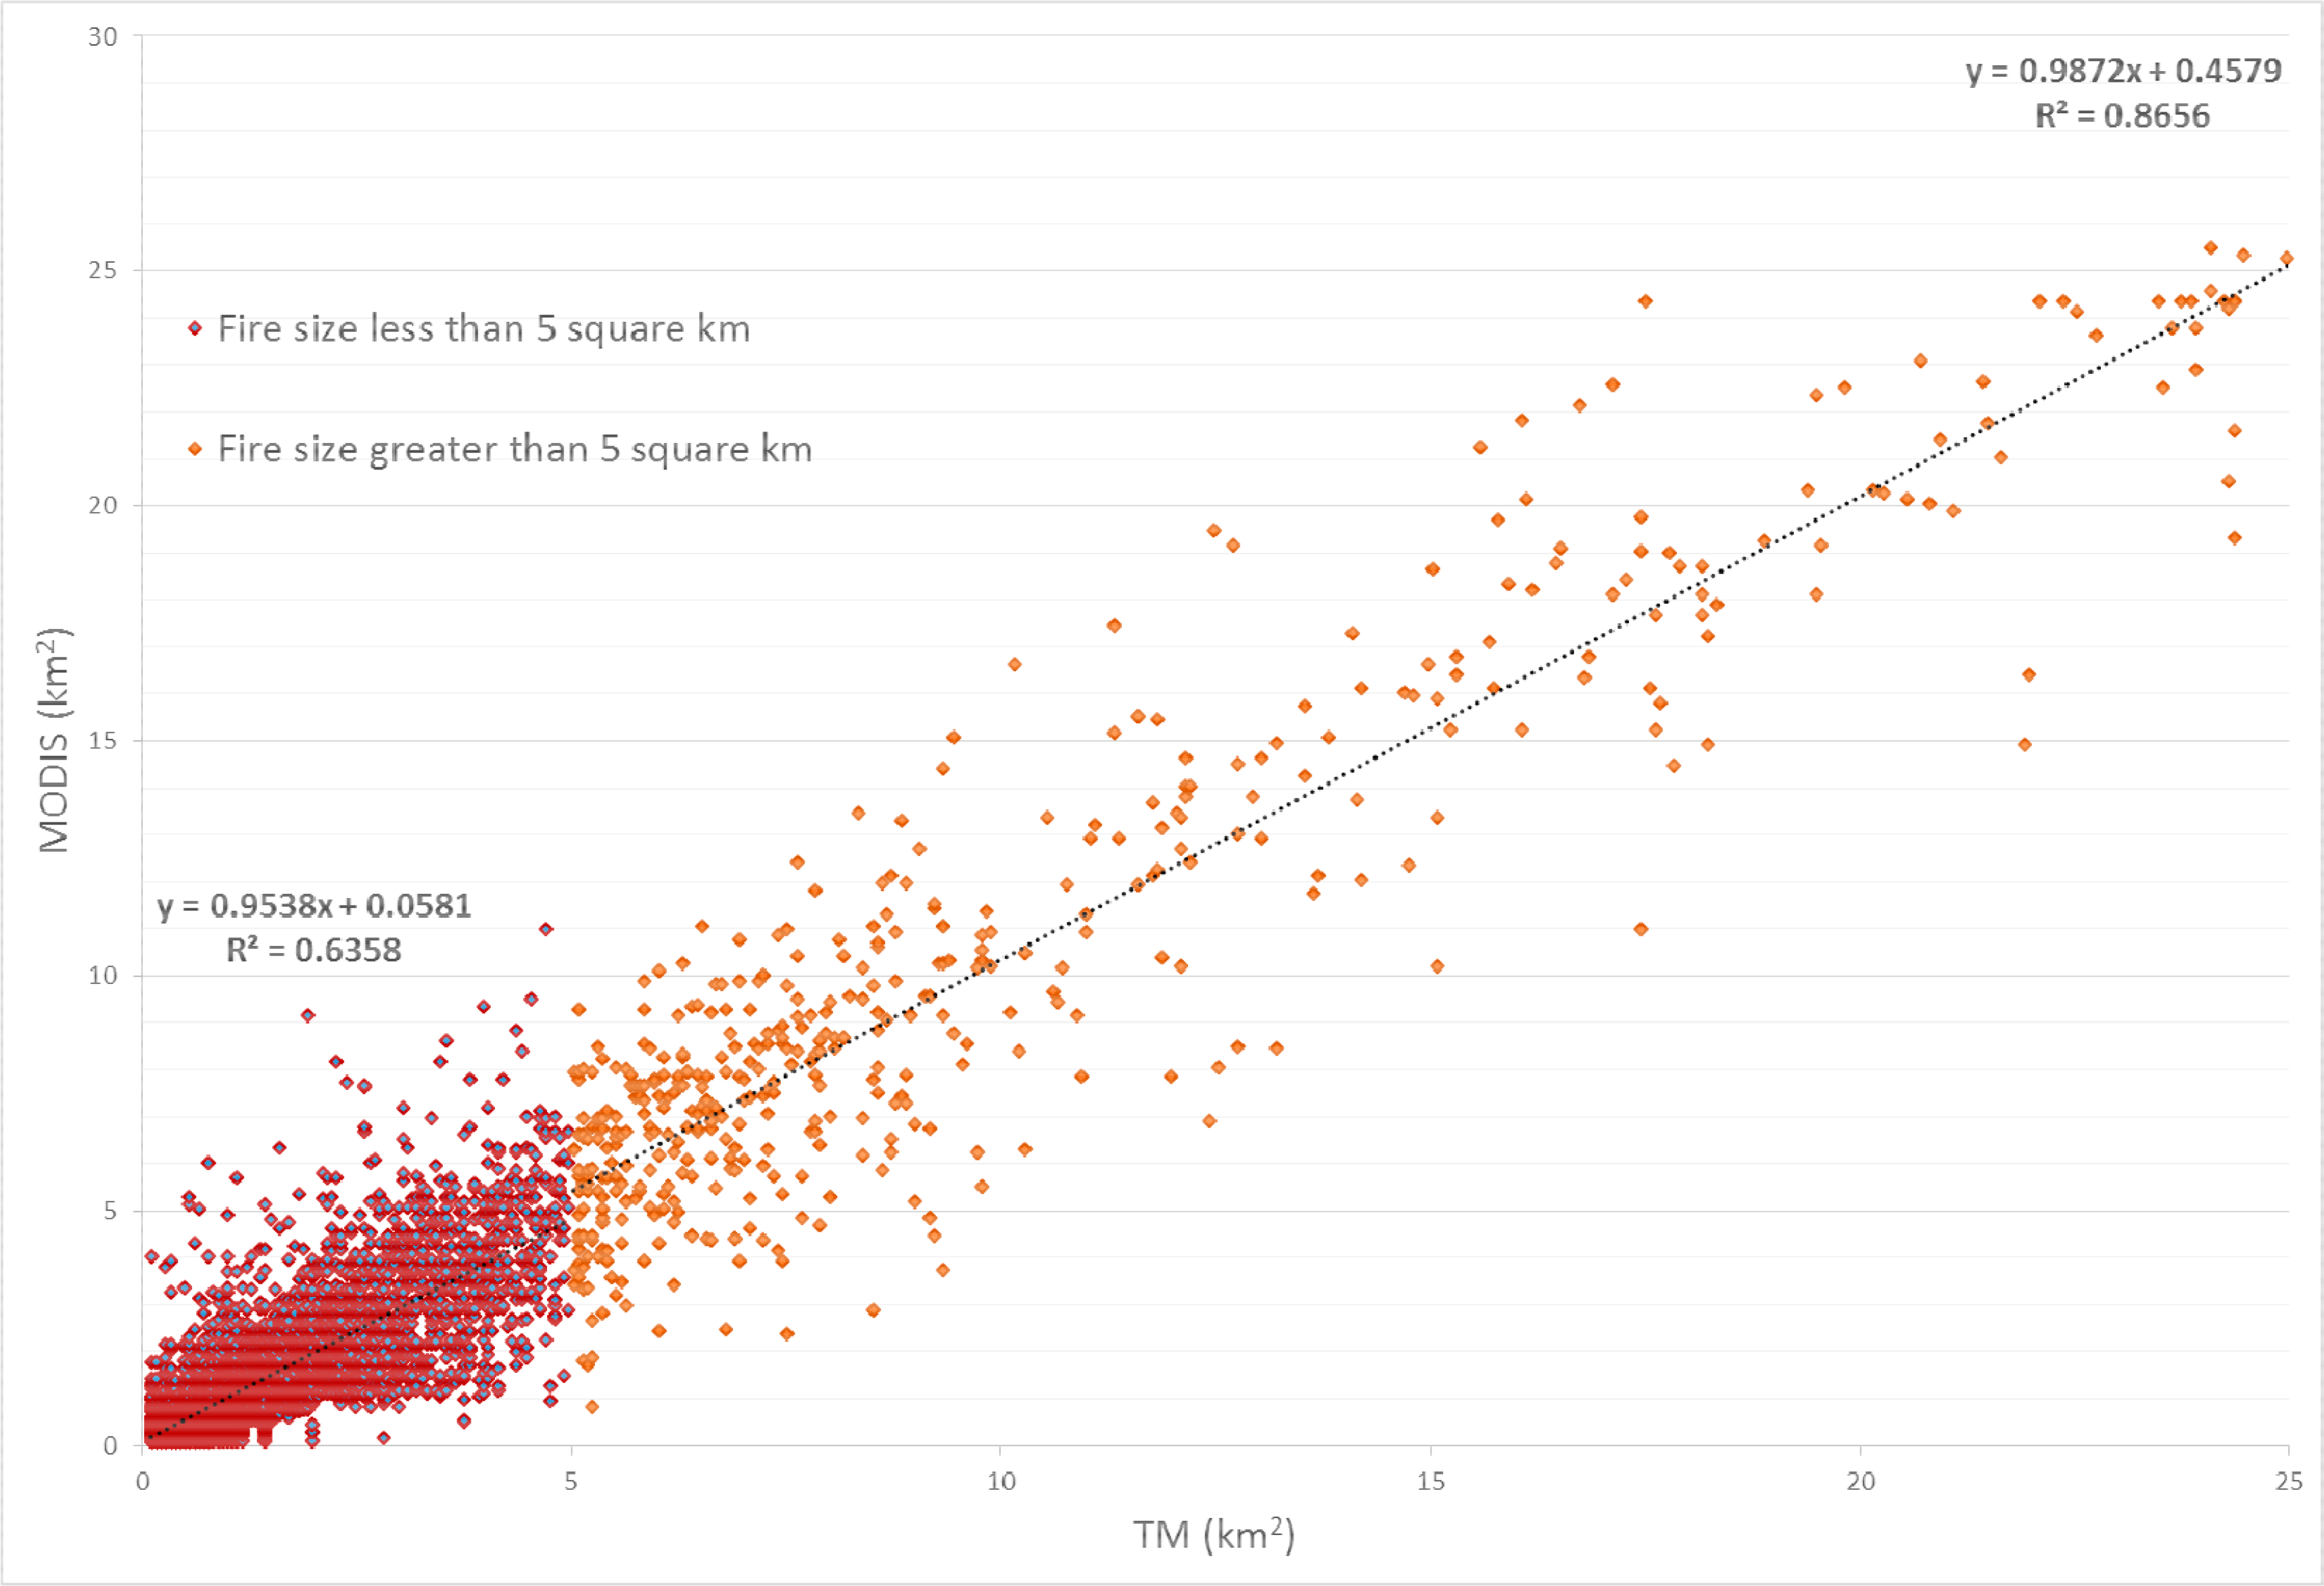
The validation graphics for fire size for the 27 randomly selected scenes are shown in Figure 5, separated into areas of less than 5 km2 (in red) and areas greater than 5 km2 (in orange). As discussed earlier, the coefficients of determination varied according to the size of the burned areas. In areas of less than 5 km2, the coefficient of determination values was 0.63, and in areas greater than 5 km2, the coefficient of determination increased to 0.86 (significant at p < 0.05, Student’s t-test).
The analysis of data with a low correlation (<70%) between the two sensors is shown in Figure 6, as well as the validation map of TM/ETM+ and MODIS images. Adjacent to the regression graph are the areas mapped using TM (left) and MODIS (right) images for a specific year and path/row (in World Reference System 2, WRS-2).
In Figure 6, we can recognize the occurrence of many fires in these areas, including small burn scars (the majority of areas) as well as larger scars. The small burn scars are wholly discernible in the TM/ETM+ images due to their 30 m spatial resolution, but due to the size of these fires, they are not resolvable in the MODIS images, which present a spatial resolution of 250 m. Therefore, the main factor causing omission of small burned areas in the MODIS product is the difference in resolution of the two sensors.
For Scene 230/68, four dates were utilized from the year 2000: 25 August, 10 September, 26 September, and 12 October. Analyzing this area, small burn scars are concentrated in the southwest region with a mean size of 1 km2, and a small number of burned areas are greater than 4 km2. For Scene 231/68, two images were utilized from 2004, dated 11 August and 12 September. In this area, we can distinguish a large number of burned areas compared to the previous scene, presenting areas of 2.5 km2 on average and particularly concentrated in the eastern region of the scene, with a low number of burned areas between 5 km2 and 10 km2.
Finally, for Scene 231/68, two dates were utilized from 2002: 15 September and 1 October. It is noteworthy that burned areas are present throughout the scene except in white spaces that represent conservation units with integral protection. The average size of the burned areas was 2 km2, with larger sizes between 6 km2 and 9 km2.
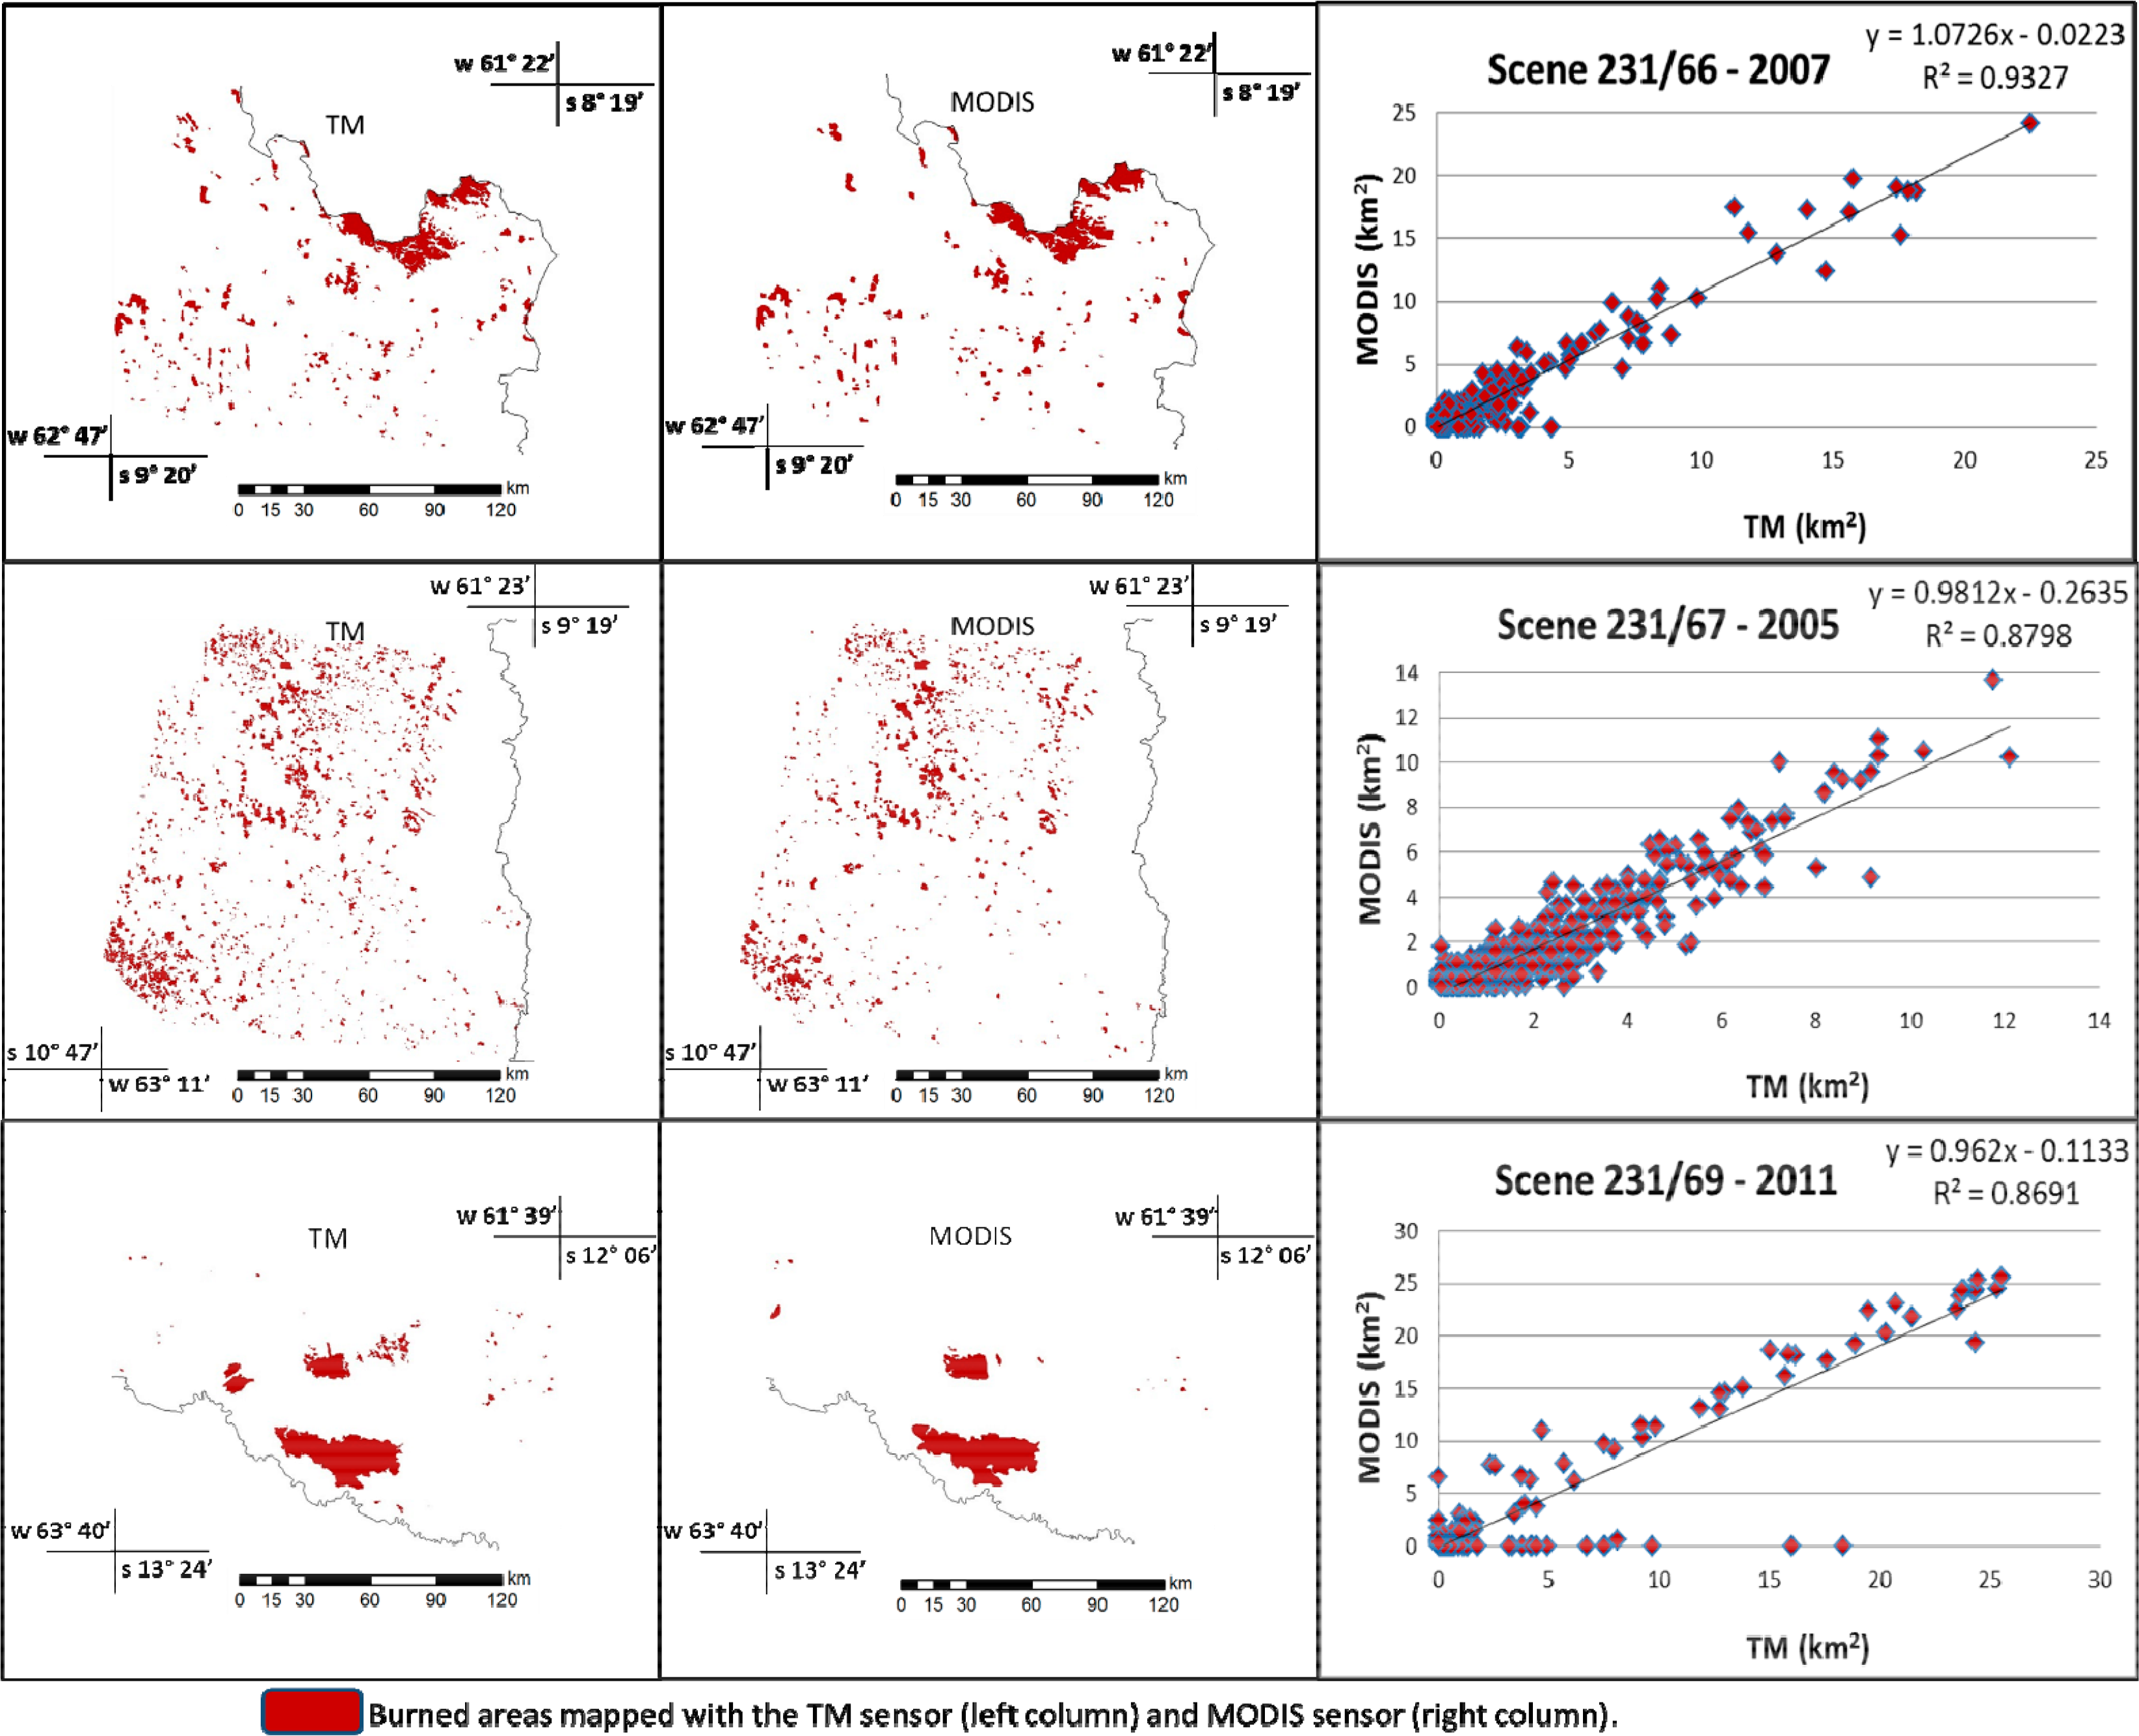
The analysis of the high-correlation data (>80%) between both mappings is shown in Figure 7, as well as the validation map of TM/ETM+ and MODIS images. Adjacent to the regression graph are the areas mapped using TM (left) and MODIS (right) images for a specific year and WRS-2 path/row.
Comparing the results presented in Figure 7, we can observe that the occurrence of fires presented differences due to the presence of larger burned scars; larger areas can be better resolved in MODIS images, increasing the correlation between the two sensors. For Scene 231/66, two dates were utilized for 2007 (20 August and 5 September). Analyzing this scene, we can note the presence of few smaller burned scars, with an average area of 2.5 km2. The most frequent burned areas were greater than 10 km2 in size and were concentrated in the northern region of the scene.
For Scene 231/67, three images were utilized from 2005, dated 14 August, 15 September and 1 October. In this scene, we can note a smaller number of large burn scars compared to the previous image, with an average size of 2 km2 and larger burn areas ranging from 7 to 12 km2, located in the northern region of the scene and in a small area of the left side (southern region of the scene). For Scene 231/69, two dates from 2011 were utilized (15 August and 16 September). In this scene, few burned areas are present and they are of larger sizes, with an average of 5 km2 and higher values between 10 km2 and 25 km2; however, it was noted that in some regions, large burn scars were not identified in the MODIS images. These omissions can be explained by the low radiometric quality of some MODIS images, which made fires undetectable.
The statistical analysis of the sizes of the burned areas that occurred in the study area was performed using a clustering process. Based on the burned area map used to validate MODIS, 10 dates were randomly selected to analyze the minimum number of polygons detected by both satellites. The scenes were grouped into classes ranging from 1 to 10,000 hectares, and a regression analysis was performed to verify the difference in global mapping for each scene. The results indicated that in the total burned area mapped with TM/ETM+, 40% of polygons were less than 6 hectares, which is the minimum size detected by MODIS (250 m × 250 m = 6.2 hectares). However, these small burned areas represent only 3%–5% of the total annual burned area for Rondônia. Based on these results, 33% of the burn scars that occur in the study area are not detected by MODIS (in some cases small polygons could be grouped with neighboring burned areas), equivalent to 7% of the total burned area estimated in this study for 2000–2011.
When the total burned area in all validation scenes for both products was analyzed, the regression results presented a correlation of 95% and an underestimation of 13% (by the cross-tabulation procedure), indicating that, in general, the burned area maps are concise. Moreover, the spatial resolution of the sensors influences the final results of the burned area maps in only 7% of cases (considering the convolution methodology), and this difference could be explained by borders and co-registration errors, as mentioned above. Usually, burn scars of sizes smaller than the spatial resolution of MODIS are not distinguishable in MODIS images. However, even with this geometry limitation, the results showed a good correlation between both products, making the MODIS burned areas reliable.
The improvements in the results occurred for several reasons. One was the use of a sensor with better spatial resolution. Another is related to the mapping method: the LSMM exhibited a high efficiency in separating the dark targets of the images, such as fires. However, this efficiency is obtained only when the scar remains on the ground for a considerable time and produces a significant amount of dark ashes, enabling the detection of burned areas in the shadow fraction images and facilitating the mapping. Such features vary with vegetation type. Areas in which the vegetation biomass is low and forest recovery is rapid will present a lower efficiency in the detection of burnings using LSMM. Another source of error is related to other dark targets on the surface, such as water bodies and shadows, that are also highlighted in the shadow fraction images; thus, a surface water mask is required.
Nevertheless, the LSMM proved to be a very useful tool for burned area mapping, especially when segmentation is used in the fraction images, due to the rapid processing time, which is essential when working with a long time series. Finally, following the procedures described in this work, the results were manually edited to avoid errors of omission and inclusion, which provided a good fit with the validation data. Thus, a burned area analysis for Rondônia State (2000 to 2011) was performed, and the final maps can be visualized in Figure 8.
It can be noted that the fires vary significantly and cover large areas of Rondônia during the 12 analyzed years. In general, the occurrence of burned areas increased between the years 2000 and 2005. After 2005, a gradual decrease in burnings occurred until 2009, followed by a new and significant increase in 2010 and a substantial decrease in the following year, as shown in the graph in Figure 9.
According to the burned area maps derived from MODIS reflectance images, the year with the highest occurrence of fire was 2005, with 18,468 km2 classified as burned area, comprising 7.7% of the entire state, followed by 2010, with 14,572 km2 (6.13%), and 2004, with 13,826 km2 (5.8%). The years that presented lower occurrences were 2009 (4916 km2, 2%) followed by 2011 (5730 km2, 2.4%) and 2001 (7495 km2, 3.1%).
Several factors are responsible for the occurrence of fires in Rondônia, including the opening and maintenance of areas for agriculture and pasture for cattle; however, there are several mechanisms that, combined with land use, accentuate the impacts of fires in the region. It was noted that in the last 30 years, the intensity and frequency of droughts in the Amazon region has increased, with two extreme events in the years 2005 and 2010 [42].
The 2005 and 2010 droughts were associated with the warm North Atlantic Tropical waters [43,44] and affected 1.9 million square kilometers in the Amazon in 2005 and approximately 3 million in 2010, the latter being considered the most severe drought episode in the last 100 years [45]. These droughts affected several states of the Amazon region, including Rondônia, a circumstance that increased the occurrence of fires in 2005 and 2010. Figure 10a represents the annual average precipitation and Figure 10b the monthly precipitation in Rondônia for the years 2000 to 2011, extracted from TRMM Data.
In Figure 9, it can be noted that, in general, the years that presented the highest burned areas coincided with the years with the lowest rates of precipitation, such as 2005 (873 mm), 2004 (912 mm) and 2010 (1722 mm) (Figure 10a). In the year 2010, the precipitation values are two times higher compared to 2004; nevertheless, this was the year that presented the third lowest rate of rainfall in the study period, and a severe drought that occurred in this year affected several states of the Amazon region due to low rainfall in April (two months earlier).
Thus, when analyzing the monthly rainfall data (Figure 10b), it is noted that in the dry season, including the months from June to October, the precipitation was 23% lower in the years with the highest presence of burned areas compared to the years with less area burned, and in the rainy season, which precedes the burning period, the rainfall was also less, representing 8%. Therefore, it is suggested that the land use associated with the occurrence of climatic events intensifies the number, origin and impacts of biomass burning.
The vegetation in Rondônia State has decreased substantially since 1980; this fact is demonstrated by the dominant vegetation classes in the study area of Amazon Rainforest being secondary vegetation and agricultural activities, totaling 73,306 km2 of deforested area in the central region of the State and comprising large animal livestock areas, diversified permanent crops and vegetal extraction in forest areas. The next two most dominant LULCC classes are represented by Lower Montane and Lowlands formations of Open Evergreen Forest, located around the large central deforested area, except in the southern region of the state; however, the two classes have undergone a significant reduction (52.5%) compared to their original area, replaced by conservation units of sustainable use and large animal livestock areas, which may be associated with diversified permanent crops, and by vegetal extraction in forest areas [18]. The main types of land use and land cover in Rondônia can be observed in Figure 11.
The intersection of burned area polygons with the current land use indicated that the majority of burned areas occur in what are now areas of vegetal extraction (14,994 km2), followed by land used for both livestock and diversified permanent crops (14,525 km2) and land used exclusively for livestock (12,409 km2). Thus, it is evident that fires occur mostly in areas that already have some type of land use, and most likely the fire is applied for the maintenance of such practices; however, it is important to note that new areas are burned every year in the state to open new lands for agriculture and cattle-raising activities.
The occurrence of burned area patterns within different types of land use was analyzed. The burned areas were separated into areas less than 1 km2, representing small and fragmented burns, and areas larger than 10 km2. In general, the fires greater than 10 km2 occurred in livestock areas, diversified permanent crop areas and conservation units of sustainable use, with 90% of occurrence, whereas only 10% of large fires occurred in areas of vegetal extraction. An example of this occurrence is shown in Figure 12.
In this figure, small fires are present in pasture areas and two large fires in forest areas, indicating that, in general, large burn scars occur in areas that already have some type of use, and their occurrence in forested areas is more uncommon because, in general, the forest is cut before being burned. The burned areas of less than 1 km2 occurred in livestock areas, diversified permanent croplands and conservation units of sustainable use in 60% of cases, and 33% of cases occurred in areas of vegetal extraction and near the edges of forest areas. Thus, small fires are used in Rondônia for the maintenance of areas that already have some type of use and for the opening of new areas of agriculture and pasture creation.
4. Conclusions
Burned areas in Rondônia have undergone oscillations since 2000, and the years with the highest burned areas were 2005 (7.7% of the entire state), 2010 (6.13%) and 2004 (5.8%). Moreover, the years that presented lower burned areas were 2009 (2%), followed by 2011 (2.4%) and 2001 (3.1%). Several factors are responsible for the occurrence of fires in Rondônia, primarily those related to land use, as for example the opening and maintenance of areas for agriculture and cattle. However, weather events also influence the incidence of fires, such as the drought events that occurred in years 2005 and 2010, which coincided with the years of major fires in the study area.
The results showed that the validation of the burned area maps for Rondônia State in 12 analyzed years (2000 to 2011) presented good agreement with reference data. Lower correlations were related to the difference in spatial resolution between the TM/ETM+ and MODIS sensors, primarily due to a high number of small burn scars, which are not resolvable in 250-meter MODIS imagery, whereas higher correlations were related to larger burn scars. The results obtained by regression analysis were satisfactory, making MODIS burned areas maps reliable.
Regression analysis could be used not only as a validation procedure, as in this study, but also to calibrate coarse- and medium-resolution estimates of burned areas with higher resolution maps, such as those derived from Landsat images. According to [19], a multisensor approach in which burned area estimates from coarse and medium spatial resolution data are calibrated using a sample of high spatial resolution estimates of burned area by linear regression is a reliable strategy for estimating biomass burning at regional scale.
Furthermore, the results indicate that although many fires are indistinguishable at the 250 m resolution of MODIS, this product is more efficient in the identification and mapping of burned areas when compared to 1 km coarse spatial resolution products. Additionally, the mapping method using LSMM exhibited a high efficiency in highlighting the dark targets of images, such as fires, and the segmentation process can be applied faster in fraction images compared to Landsat images, for example, which is essential when working with a long time series. Finally, manual editing enabled the avoidance of errors of omission and inclusion in the burned areas, providing a good fit with the validation data. These data are fundamental not only to analyze the impacts on the environment but as fundamental input data to numeric models analyzing the impacts of fire on the physical parameters of the surface and atmosphere, factors that cause changes in the climate.
Acknowledgments
The authors acknowledge financial support from the Research Support Foundation of São Paulo State (FAPESP) (process number 2010/17437-4).
Author Contributions
Francielle da Silva Cardozo executed the MOD09GA data processing, creation of the burned area maps from MODIS and TM/ETM+ imagery, and the validation of the products and participated in the fieldwork. Gabriel Pereira prepared the MODIS input data, executed the LSSM application and participated in the fieldwork. Yosio Edemir Shimabukuro and Elisabete Caria Moraes contributed to the manuscript compilation and revisions.
Conflicts of Interest
The authors declare no conflict of interest.
References
- Sampaio, G.; Nobre, C.; Costa, M.H.; Satyamurty, P.; Soares-Filho, B.S.; Cardoso, M.F. Regional climate change over eastern Amazonia caused by pasture and soybean cropland expansion. Geophys. Res. Lett 2007, 34, 1–7. [Google Scholar]
- Cardoso, M.; Nobre, C.A.; Lapola, D.; Oyama, M.D.; Sampaio, G. Long-term potential for fires in estimates of the occurrence of savannas in the tropics. Glob. Ecol. Biogeogr 2008, 17, 222–235. [Google Scholar]
- Marengo, J.A.; Nobre, C.; Salazar, L.F. Regional climate change cenarios in South America in the late XXI century: Projections and expected impacts. Nova Acta Leopold 2010, 112, 251–265. [Google Scholar]
- Pereira, E.B.; Martins, F.R.; Abreu, S.L.; Couto, P.; Stuhlmann, R.; Colle, S. Effects of burning of biomass on satellite estimations of solar irradiation in Brazil. Sol. Energy 2000, 68, 91–107. [Google Scholar]
- Freitas, S.R.; Longo, K.M.; Dias, M.A.F.S.; Dias, P.L.S.; Chatfield, R.; Prins, E.; Artaxo, P.; Grell, G.A.; Recuero, F.S. Monitoring the transport of biomass burning emissions in South America. Environ. Fluid Mech 2005, 5, 135–167. [Google Scholar]
- Van der Werf, G.R.; Randerson, J.T.; Giglio, L.; Collatz, G.J.; Kasibhatla, P.S.; Arellano, A.F., Jr. Interannual variability in global biomass burning emissions from 1997 to 2004. Atmos. Chem. Phys 2006, 6, 3423–3441. [Google Scholar]
- Fearnside, P.M.; Righi, C.A.; Graça, P.M.L.A.; Keizer, E.W.H.; Cerri, C.C.; Nogueira, E.M.; Barbosa, R.I. Biomass and greenhouse gas emissions from land-use change in Brazil’s Amazonian “arc of deforestation”: The states of Mato Grosso and Rondônia. For. Ecol. Manag 2009, 258, 1968–1978. [Google Scholar]
- Cochrane, M.A. Fire and fire ecology: Concepts and principles. In Tropical Fire Ecology, Climate Change, Land Use and Ecosystem Dynamics; Springer: Chichester, UK, 2009; pp. 60–97. [Google Scholar]
- Giglio, L.; van der Werf, G.R.; Randerson, J.T.; Collatz, G.J.; Kasibhatla, P.S. Global estimation of burned area using MODIS active fire observations. Atmos. Chem. Phys 2006, 6, 957–974. [Google Scholar]
- Justice, C.O.; Giglio, L.; Korontzi, S.; Owens, J.; Mrisette, J.; Roy, D.; Descloitres, J.; Alleaume, S.; Petitcolin, F.; Kaufman, Y. The MODIS fire product. Remote Sens. Environ 2002, 83, 244–262. [Google Scholar]
- Giglio, L.; Kendall, J.D.; Mack, R. A multi-year active fire data set for the tropics derived from TRMM VIRS. Int. J. Remote Sens 2003, 24, 4505–4525. [Google Scholar]
- Roy, D.P.; Lewis, P.E.; Justice, C.O. Burned area mapping using multitemporal moderate spatial resolution data—A bi-directional reflectance model based expectation approach. Remote Sens. Environ 2002, 83, 263–286. [Google Scholar]
- Casady, G.M.; Marsh, S.E. Broad-scale environmental conditions responsible for post-fire vegetation dynamics. Remote Sens 2010, 2, 2643–2664. [Google Scholar]
- Miguel, S.M.; Huesca, M.; González-Alonso, F. Modis reflectance and active fire data for burn mapping and assessment at regional level. Ecol. Model 2010, 221, 67–74. [Google Scholar]
- Zhan, X.; Sohlberg, R.A.; Townshend, J.R.G.; Dimiceli, C.; Carroll, M.L.; Eastman, J.C.; Hansen, M.C.; Defries, R.S. Detection of land cover changes using MODIS 250 m data. Remote Sens. Environ 2002, 83, 336–350. [Google Scholar]
- Grégoire, J.M.; Tansey, K.; Silva, J.M.N. The GBA2000 initiative: Developing a global burned area database from SPOT-VEGETATION imagery. Int. J. Remote Sens 2003, 24, 1369–1376. [Google Scholar]
- Simon, M.; S.; Plummer, F.; Fierens, F.; Hoeltzemann, J.J.; Arino, O. Burnt area detection at global scale using ATSR-2: The GlobScar products and their qualification. J. Geophys. Res 2004, 109, 1–16. [Google Scholar]
- Mouillot, F.; Schultz, M.G.; Yue, C.; Cadule, P.; Tansey, K.; Ciais, P.; Chuvieco, E. Ten years of global burned area products from spaceborne remote sensing—A review: Analysis of user needs recommendations for future developments. Int. J. Appl. Earth Obs. Geoinf 2014, 26, 64–79. [Google Scholar]
- Eva, H.; Lambin, E.F. Remote sensing of biomass burning in tropical regions: Sampling issues and multi sensor approach. Remote Sens. Environ 1998, 64, 292–315. [Google Scholar]
- Schroeder, W.; Morisette, J.T.; Csiszar, I.; Giglio, L.; Morton, D.; Justice, C.O. Characterizing vegetation fire dynamics in Brazil through multisatellite Data: Common trends and practical issues. Earth Interact 2005, 9, 1–26. [Google Scholar]
- Roy, D.P.; Boschetti, L.; Trigg, S.N. Remote sensing of fire severity: Assessing the performance of the normalized burn ratio. IEEE Geosci. Remote Sens. Lett 2006, 3, 112–116. [Google Scholar]
- Roy, D.P.; Boschetti, L.; Justice, C.O.; Ju, J. The collection 5 MODIS burned area product-global evaluation by comparison with the MODIS active fire product. Remote Sens. Environ 2008, 112, 3690–3707. [Google Scholar]
- Hantson, S.; Padilla, M.; Corti, D.; Chuvieco, E. Strengths and weaknesses of MODIS hotspots to characterize global fire occurrence. Remote Sens. Environ 2013, 131, 152–159. [Google Scholar]
- Boschetti, L.; Flasse, S.P.; Brivio, P.A. Analysis of the conflict between omission and commission in low spatial resolution dichotomic thematic products: The Pareto Boundary. Remote Sens. Environ 2004, 91, 280–292. [Google Scholar]
- Laris, P.S. Spatiotemporal problems with detecting and mapping mosaic fire regimes with coarse-resolution satellite data in savanna environments. Remote Sens. Environ 2005, 99, 412–424. [Google Scholar]
- Silva, J.M.N.; Sá, A.C.L.; Pereira, J.M.C. Comparison of burned area estimates derived from SPOT-VEGETATION and Landsat ETM+ data in Africa: Influence of spatial pattern and vegetation type. Remote Sens. Environ 2005, 96, 188–201. [Google Scholar]
- Silva, J.M.; Linhares, D.P.; Nunes, D.D.; Assunção, A.G.; Lima, T.R.; Furlan, D.N.; Carvalho, A.C.; Souza, R.C. Evolution of deforestation and natural resources degradation in Rondônia. Soc. Nat 2005, 502–511. [Google Scholar]
- Batista, I.X. Desenvolvimento em Rondônia: Políticas Públicas, Desmatamento e Evolução Socioeconômica; Dissertação de Mestrado, Universidade Federal de Rio Claro: Rio Claro, Brazil, 2001. [Google Scholar]
- Instituto Brasileiro de Geografia e Estatística. Mapa de Vegetação do Brasil; IBGE: Rio de Janeiro, Brazil, 2004. [Google Scholar]
- Pereira, J.M.C. A comparative evaluation of NOAA/AVHRR vegetation indexes for burned surface detection and mapping. IEEE Trans. Geosci. Remote Sens 1999, 37, 217–226. [Google Scholar]
- Boschetti, L.; Brivio, P.A.; Eva, H.D.; Gallego, J.; Baraldi, A.; Gregoire, J.M. A sampling method for the retrospective validation of global burned area products. IEEE Trans. Geosci. Remote Sens 2006, 44, 1765–1773. [Google Scholar]
- Csiszar, I.; O’Neal, K.J. Regionally adaptable dNBR-based algorithm for burned area mapping from MODIS data. Remote Sens. Environ 2007, 109, 429–442. [Google Scholar]
- Smith, A.M.S.; Drake, N.A.; Wooster, M.J.; Hudak, A.T.; Holden, Z.A.; Gibbons, C.J. Production of Landsat ETM+ reference imagery of burned areas within Southern African savannahs: Comparison of methods and application to MODIS. Int. J. Remote Sens 2007, 28, 2753–2775. [Google Scholar]
- Roy, D.P.; Boschetti, L. Southern Africa validation of the MODIS, L3JRC, and GlobCarbon burned-area products. IEEE Trans. Geosci. Remote Sens 2009, 47, 1032–1044. [Google Scholar]
- Shimabukuro, Y.E.; Smith, J.A. The least squares mixing models to generate fraction images derived from remote sensing multispectral data. IEEE Trans. Geosci. Remote Sens 1991, 29, 16–20. [Google Scholar]
- Teixeira, C.G. Validação do Modelo Linear de Mistura Espectral em Imagens ASTER/TERRA a partir de dados Ikonos; Dissertação de Mestrado, Instituto Nacional de Pesquisas Espaciais, São José dos Campos: Brazil, 2004. [Google Scholar]
- Zhang, Q.; Pavlic, G.; Chen, W.; Fraser, R.; Leblanc, S.; Cihlar, J. A semi-automatic segmentation procedure for feature extraction in remotely sensed imagery. Comput. Geosci 2005, 31, 289–296. [Google Scholar]
- Quintano, C.; Fernández-Manso, A.; Fernández-Manso, O.; Shimabukuro, Y.E. Mapping burned areas in Mediterranean countries using spectral mixture analysis from a uni-temporal perspective. Int. J. Remote Sens 2006, 27, 645–662. [Google Scholar]
- Arai, E.; Shimabukuro, Y.E.; Pereira, G.; Vijaykumar, N.L. Multi-resolution multi-temporal technique for detecting and mapping deforestation in the Brazilian Amazon rainforest. Remote Sens 2011, 3, 1943–1956. [Google Scholar]
- Malingreau, J.P.; Achard, F.; Estreguil, C.; Stibig, H.J.; D’Souza, G. NOAA-AVHRR based tropical forest mapping for south-east Asia, validated and calibrated with higher spatial resolution data. In Advances in the Use of NOAA AVHRR Data for Land Applications; Springer, Netherlands: Dordrecht, The Netherlands, 1996; pp. 279–309. [Google Scholar]
- Klein, C.; Dees, M.; Pelz, D.R. Sampling Aspects in the TREES Project: Global Inventory of Tropical Forests; Final Report to the Joint Research Centre; University of Freiburg: Fahnenbergplatz, Germany, 1993; p. 36. [Google Scholar]
- Lima, A. Influência da Cobertura da Terra na Extensão e Configuração Espacial de Áreas Queimadas em Anos de Seca Extrema na Amazônia Oriental; Tese de Doutorado. Instituto Nacional de Pesquisas Espaciais; Instituto Nacional de Pesquisas Espaciais (INPE): São José dos Campos, Brazil, 2013. [Google Scholar]
- Marengo, J.A.; Nobre, C.A.; Tomasella, J.; Oyama, M.D.; Oliveira, G.S.; Oliveira, R.; Camargo, H.; Alves, D.S.; Brown, I.F. The drought of Amazonia in 2005. J. Clim 2008, 21, 495–516. [Google Scholar]
- Zeng, N.; Yoon, J,H.; Marengo, J.A.; Subramaniam, A.; Nobre, C.A.; Mariotti, A.; Neelin, J.D. Causes and impacts of the 2005 Amazon drought. Environ. Res. Lett 2008, 3, 1–9. [Google Scholar]
- Lewis, S.L.; Brando, P.M.; Phillips, O.L.; Heijden, G.M.F.; Nepstad, D. The 2010 Amazon drought. Science 2011, 331, 554. [Google Scholar]


| Path/Row | Randomly Selected Years | Available Dates |
|---|---|---|
| 001/67 | 2002, 2003 | 2002 (19 August, 6 October); 2003 (14 August, 15 September) |
| 229/69 | 2003, 2004 | 2003 (11 August, 27 August, 12 September, 14 October); 2004 (28 July, 13 August, 29 August, 14 September) |
| 230/68 | 2000, 2008 | 2000 (10 September, 12 October, 25 August, 26 September); 2008 (15 August, 31 August, 16 September, 2 October) |
| 230/69 | 2005, 2010 | 2005 (22 July, 7 August, 23 August, 24 September); 2010 (21 August, 6 September) |
| 231/66 | 2007, 2011 | 2007 (20 August, 5 September); 2011 (15 August, 16 September) |
| 231/67 | 2005, 2008 | 2005 (14 August, 15 September, 1 October); 2011 (9 October, 23 September) |
| 231/68 | 2002, 2004 | 2002 (15 September, 1 October); 2004 (11 August, 12 September, 28 September) |
| 231/69 | 2009, 2011 | 2009 (9 August, 26 September, 12 October); 2011 (15 August, 16 September) |
| 232/66 | 2004, 2006 | 2004 (2 August, 18 August); 2006 (24 August, 25 September) |
| 232/67 | 2006 | 2006 (24 August, 12 November) |
| 232/68 | 2000, 2001 | 2000 (8 September, 23 August, 24 September); 2001 (10 August, 29 October) |
| 232/69 | 2001, 2009 | 2001 (10 August, 29 October); 2009 (1 September, 17 September) |
| 233/66 | 2005, 2008 | 2005 (12 August, 28 August); 2008 (20 August) |
| 233/67 | 2009 | 2009 (8 September, 23 August, 10 October) |
| 233/68 | 2007 | 2007 (1 July, 18 October, 3 September, 19 September, 5 October) |
© 2014 by the authors; licensee MDPI, Basel, Switzerland This article is an open access article distributed under the terms and conditions of the Creative Commons Attribution license (http://creativecommons.org/licenses/by/3.0/).
Share and Cite
Cardozo, F.D.S.; Pereira, G.; Shimabukuro, Y.E.; Moraes, E.C. Analysis and Assessment of the Spatial and Temporal Distribution of Burned Areas in the Amazon Forest. Remote Sens. 2014, 6, 8002-8025. https://0-doi-org.brum.beds.ac.uk/10.3390/rs6098002
Cardozo FDS, Pereira G, Shimabukuro YE, Moraes EC. Analysis and Assessment of the Spatial and Temporal Distribution of Burned Areas in the Amazon Forest. Remote Sensing. 2014; 6(9):8002-8025. https://0-doi-org.brum.beds.ac.uk/10.3390/rs6098002
Chicago/Turabian StyleCardozo, Francielle Da Silva, Gabriel Pereira, Yosio Edemir Shimabukuro, and Elisabete Caria Moraes. 2014. "Analysis and Assessment of the Spatial and Temporal Distribution of Burned Areas in the Amazon Forest" Remote Sensing 6, no. 9: 8002-8025. https://0-doi-org.brum.beds.ac.uk/10.3390/rs6098002