Tridimensional Reconstruction Applied to Cultural Heritage with the Use of Camera-Equipped UAV and Terrestrial Laser Scanner

Abstract
:1. Introduction
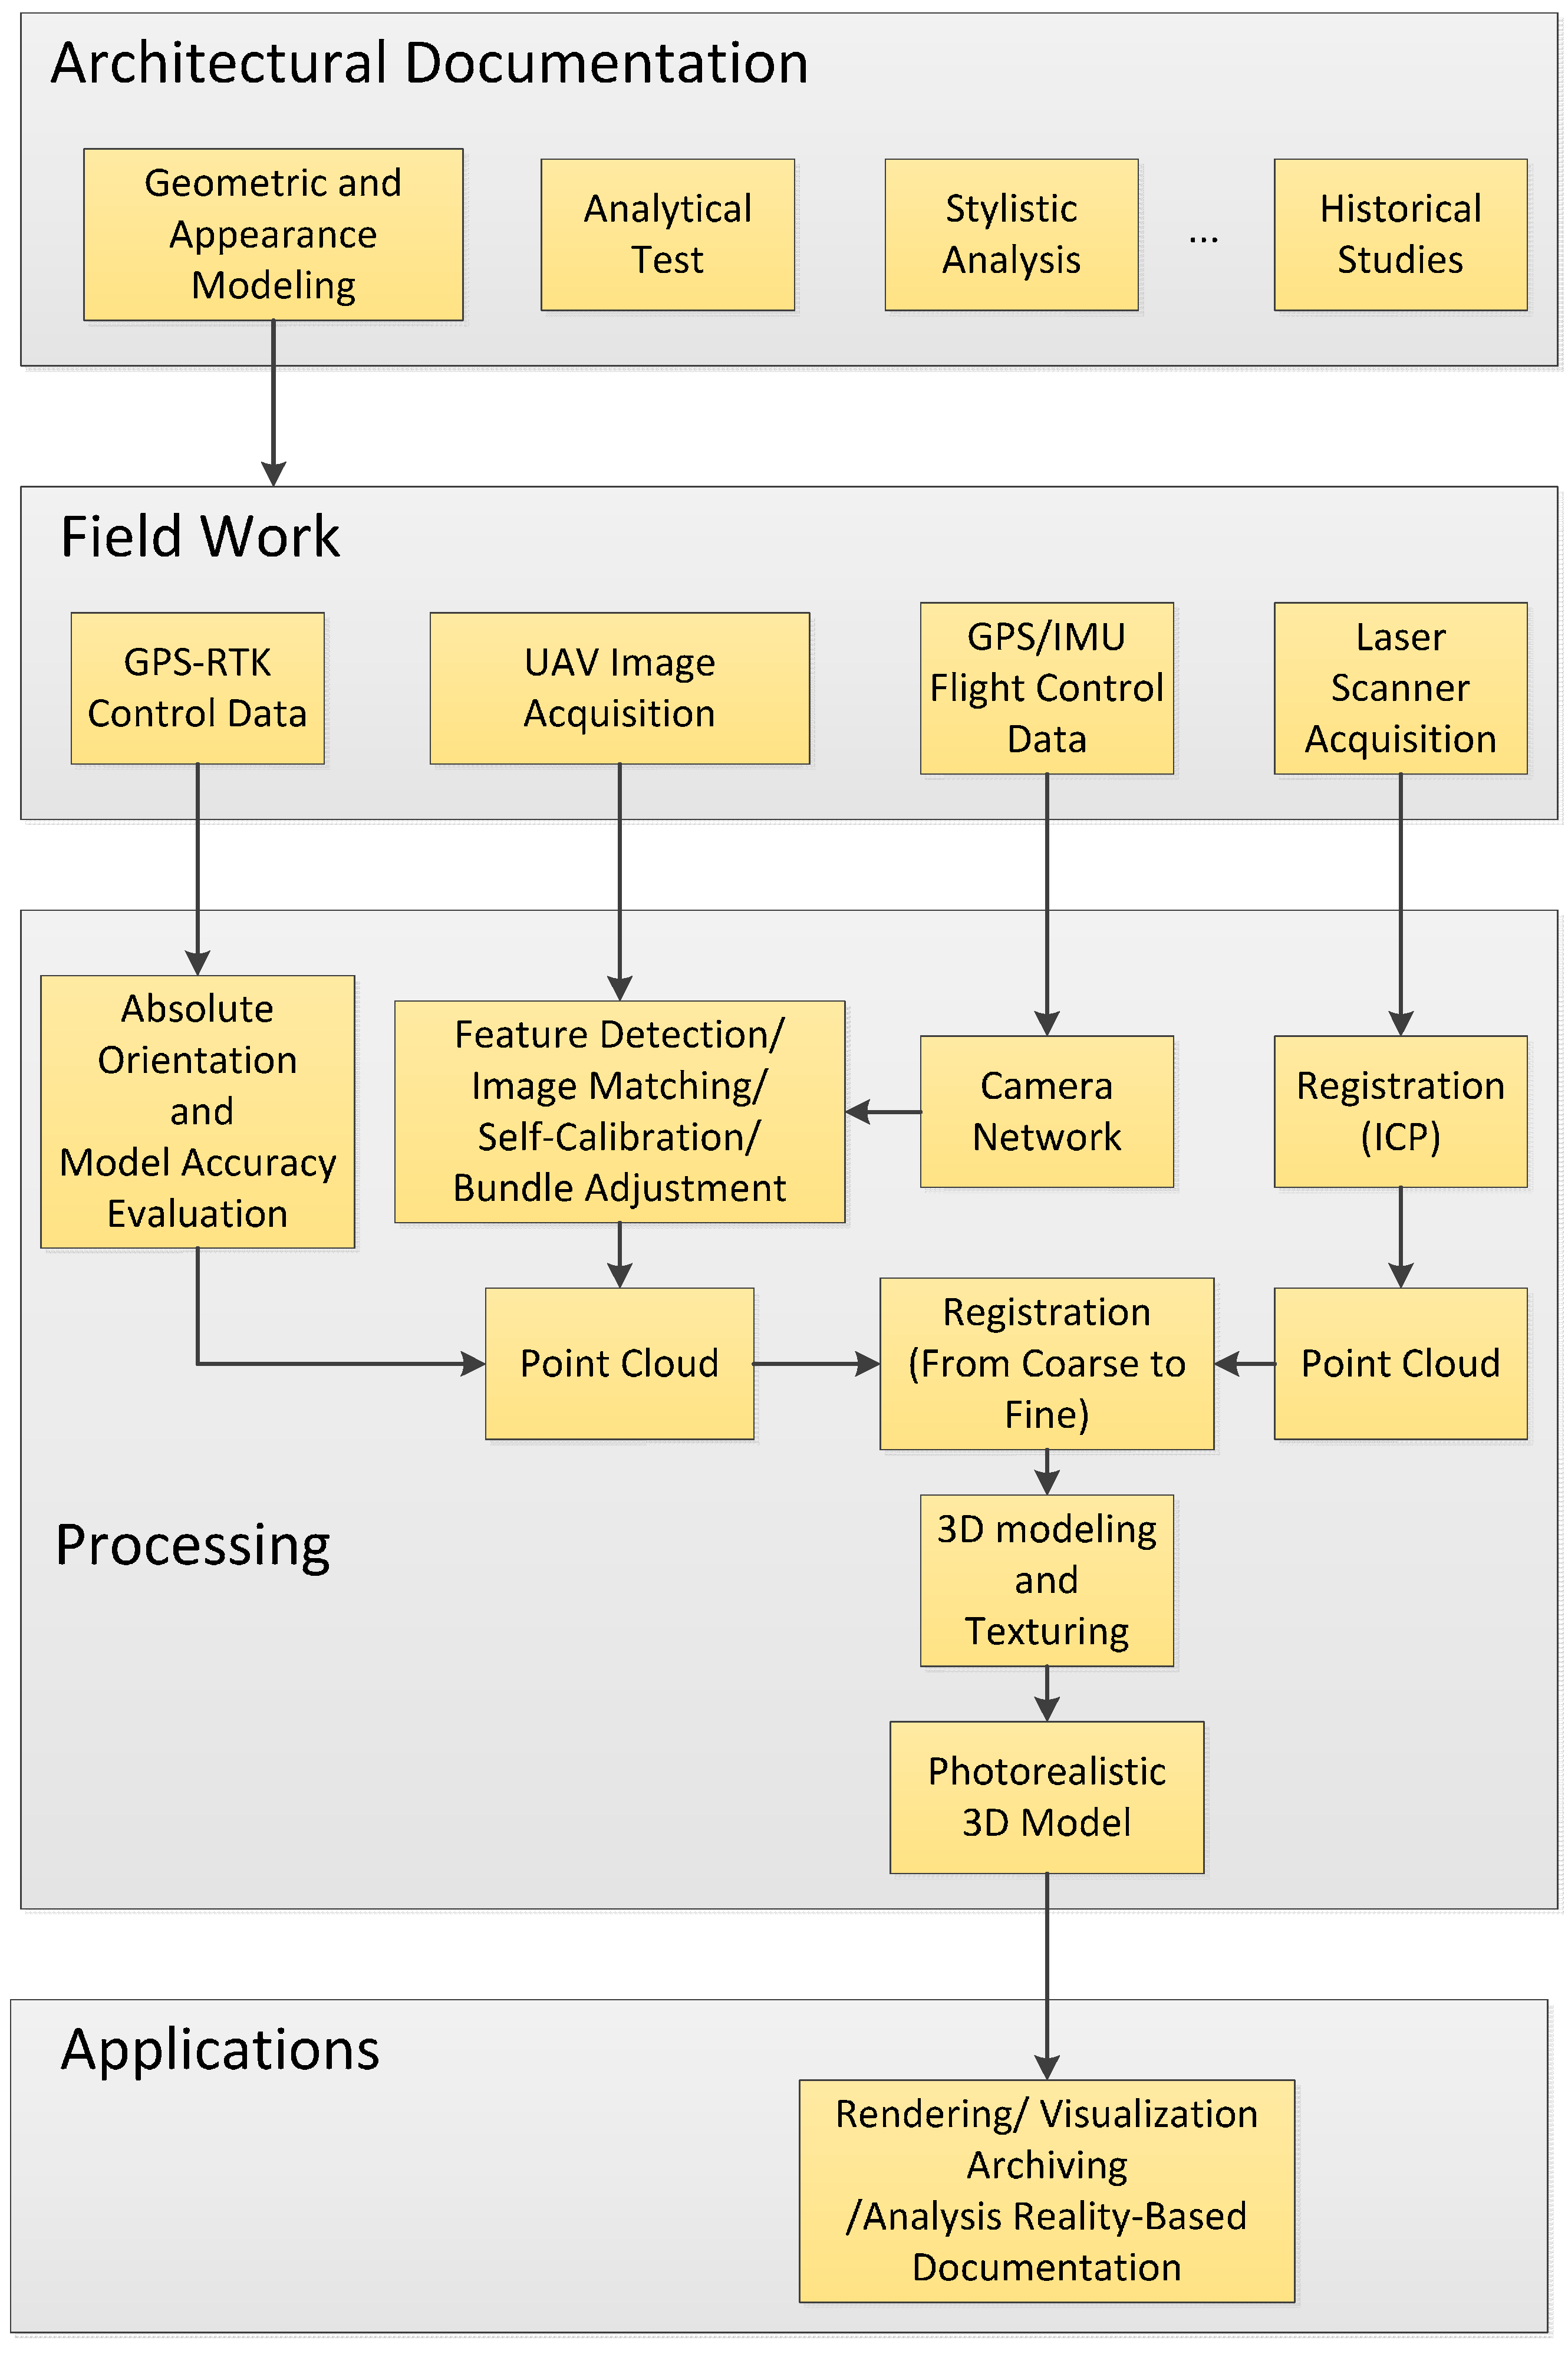
2. Methodology
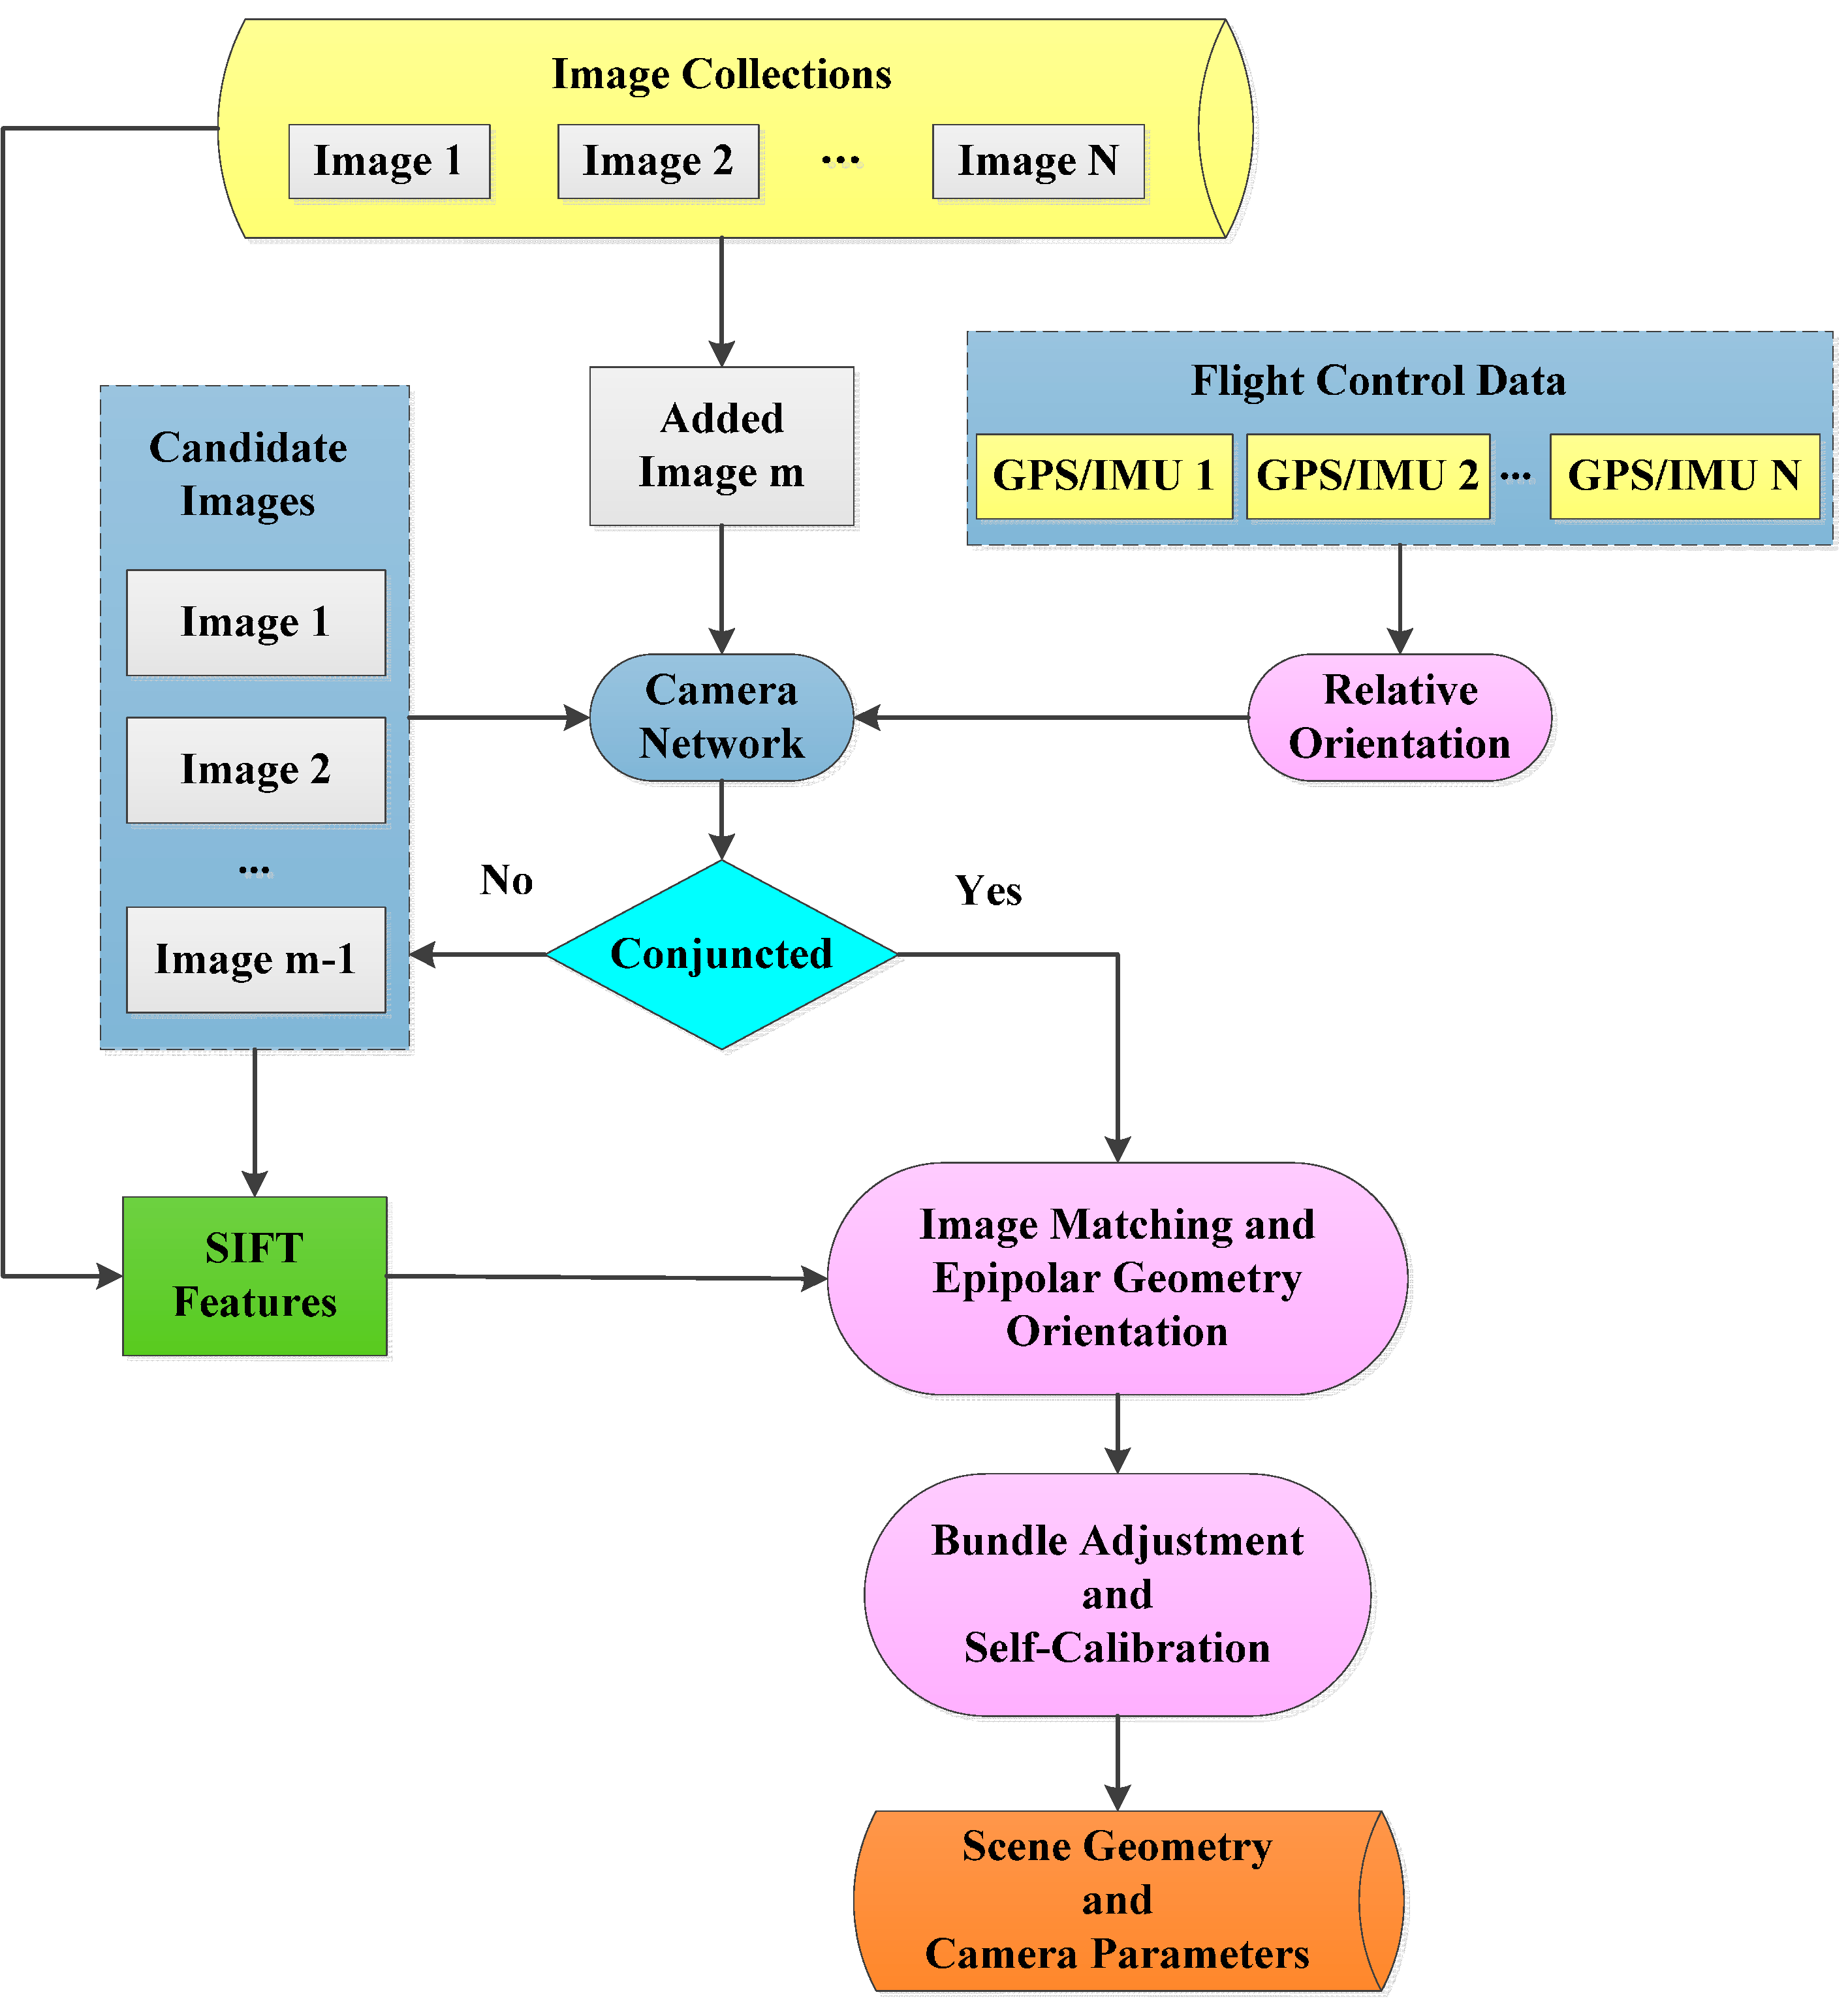
- Recover the scene geometry by orienting and calibrating the bundle of UAV images with the use of our modified SfM method with a computed camera network; and
- Coarse-to-fine co-registration of multi-source point clouds with an iterative method.

2.1. Image-Based Reconstruction of the UAV Optical Images

2.2. Co-Registration of UAV Image-Reconstructed Cloud and TLS Scanning Cloud
3. Experimental Study
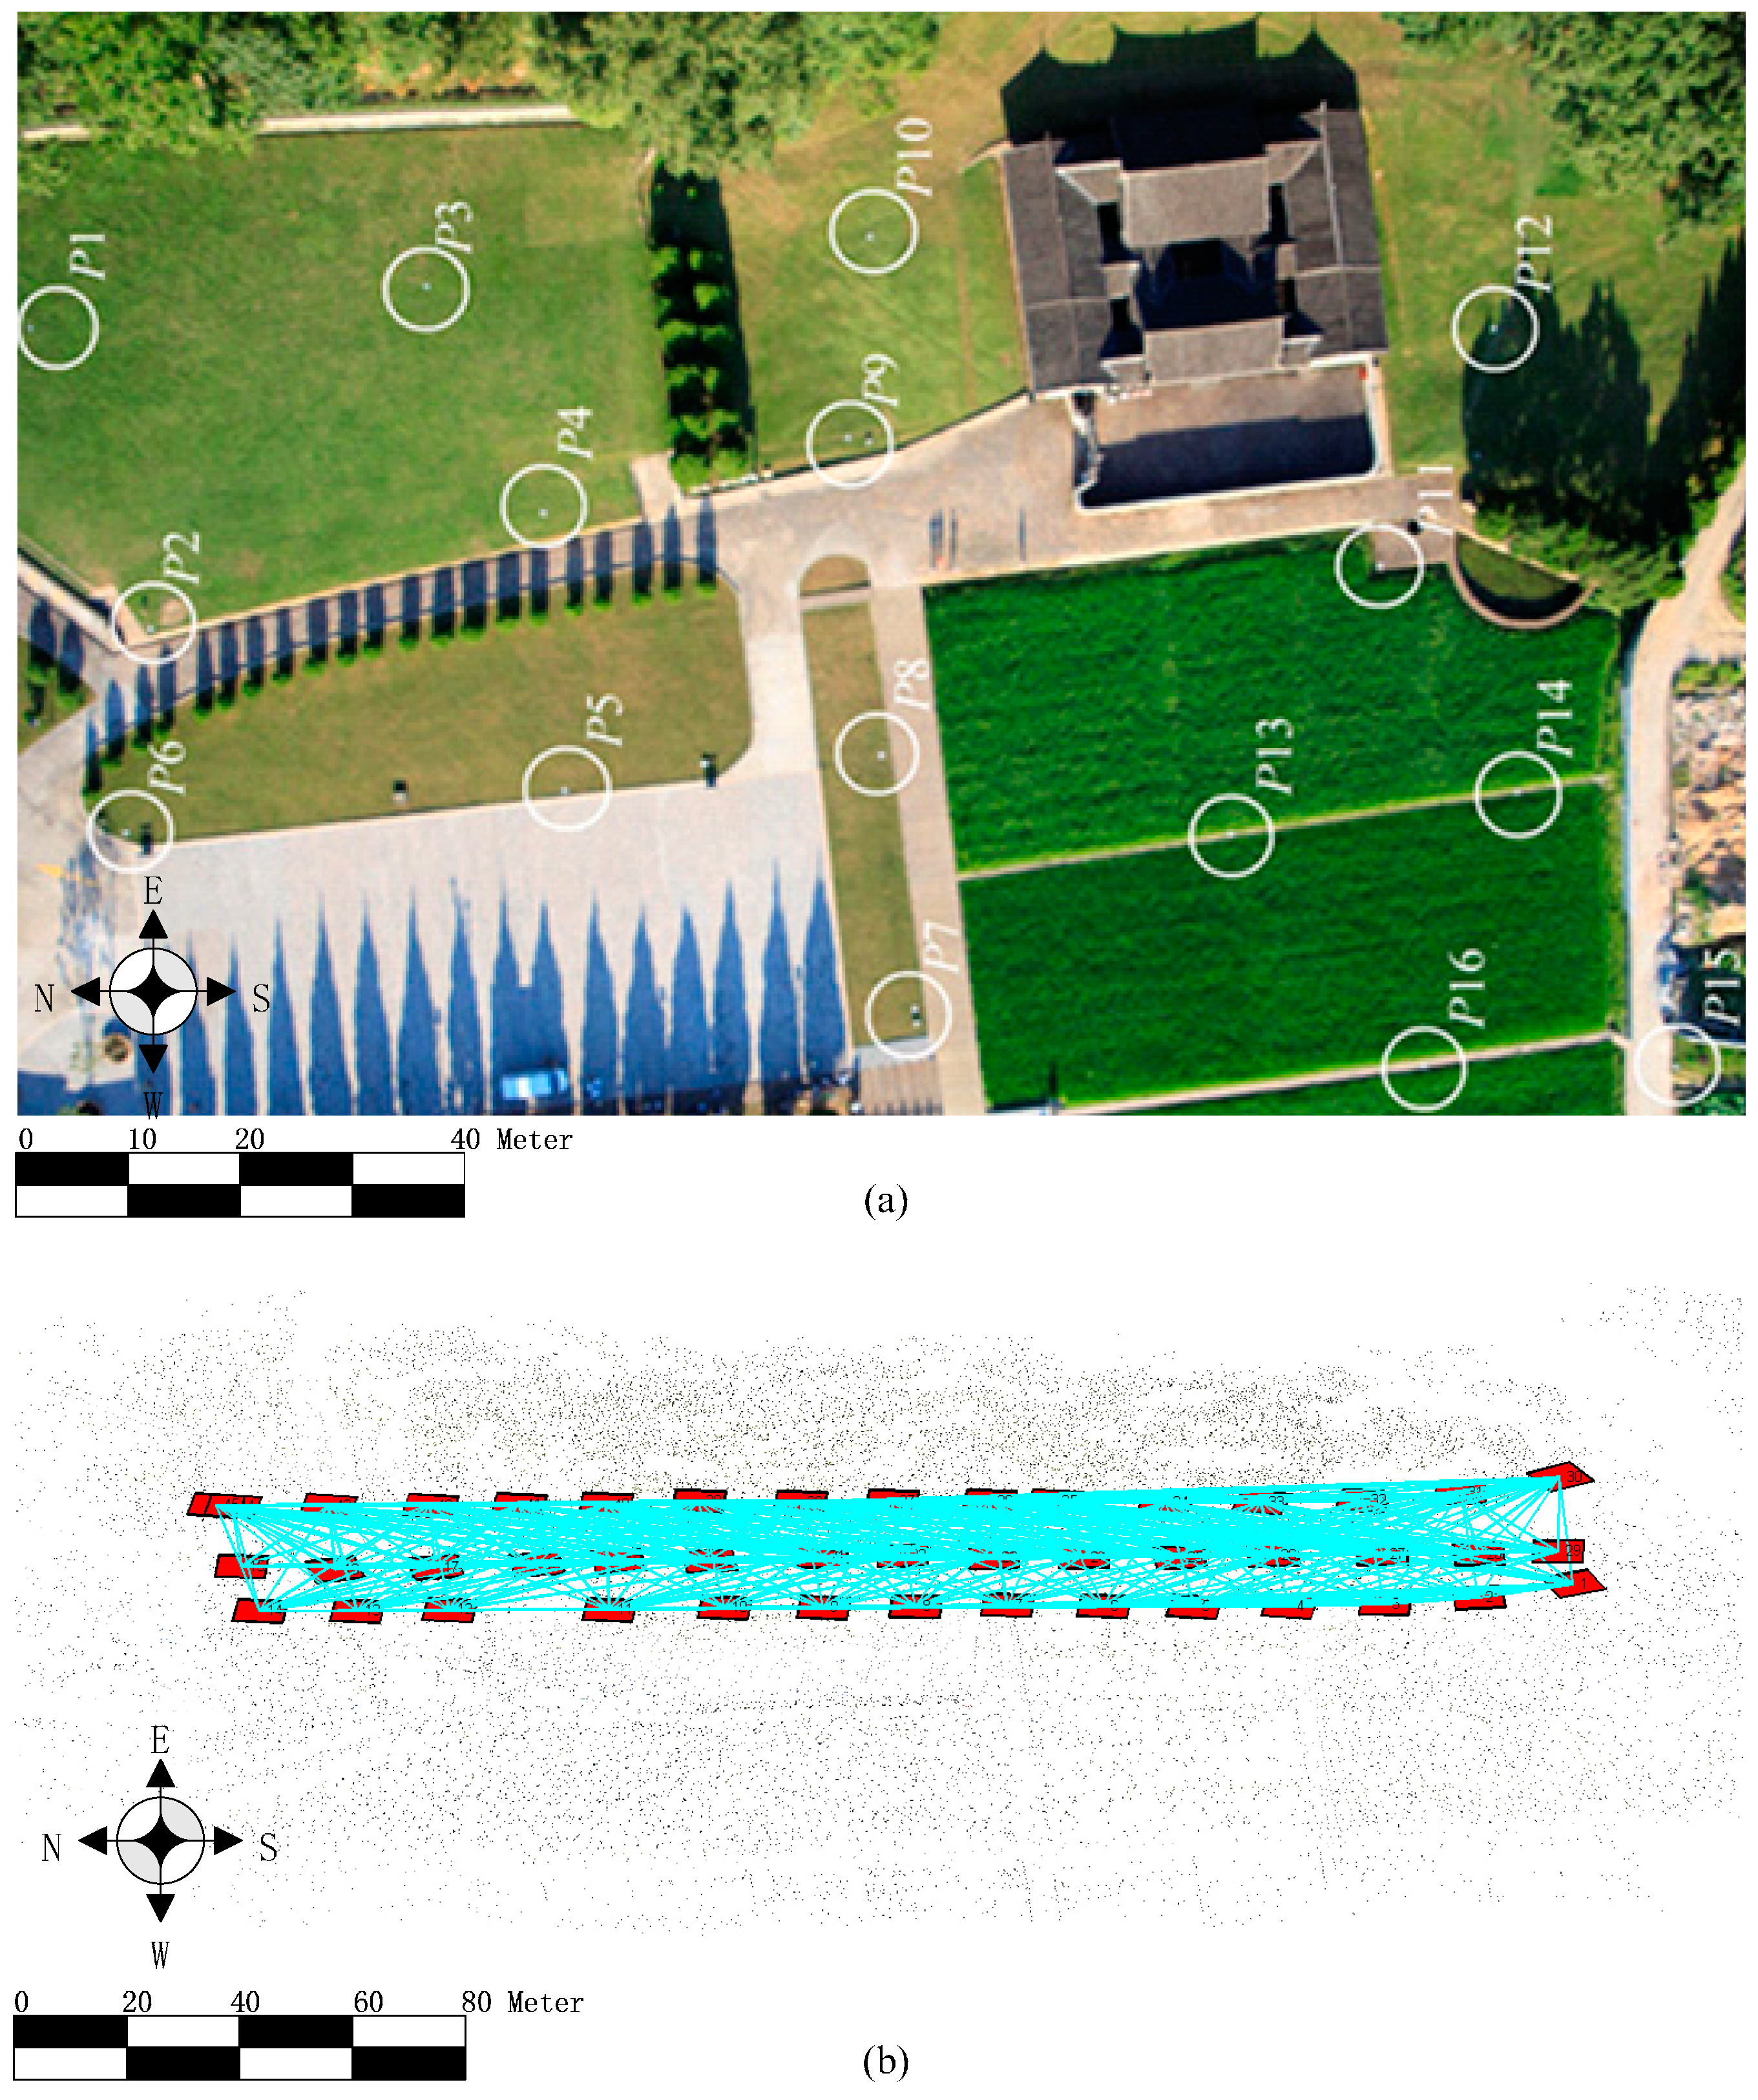
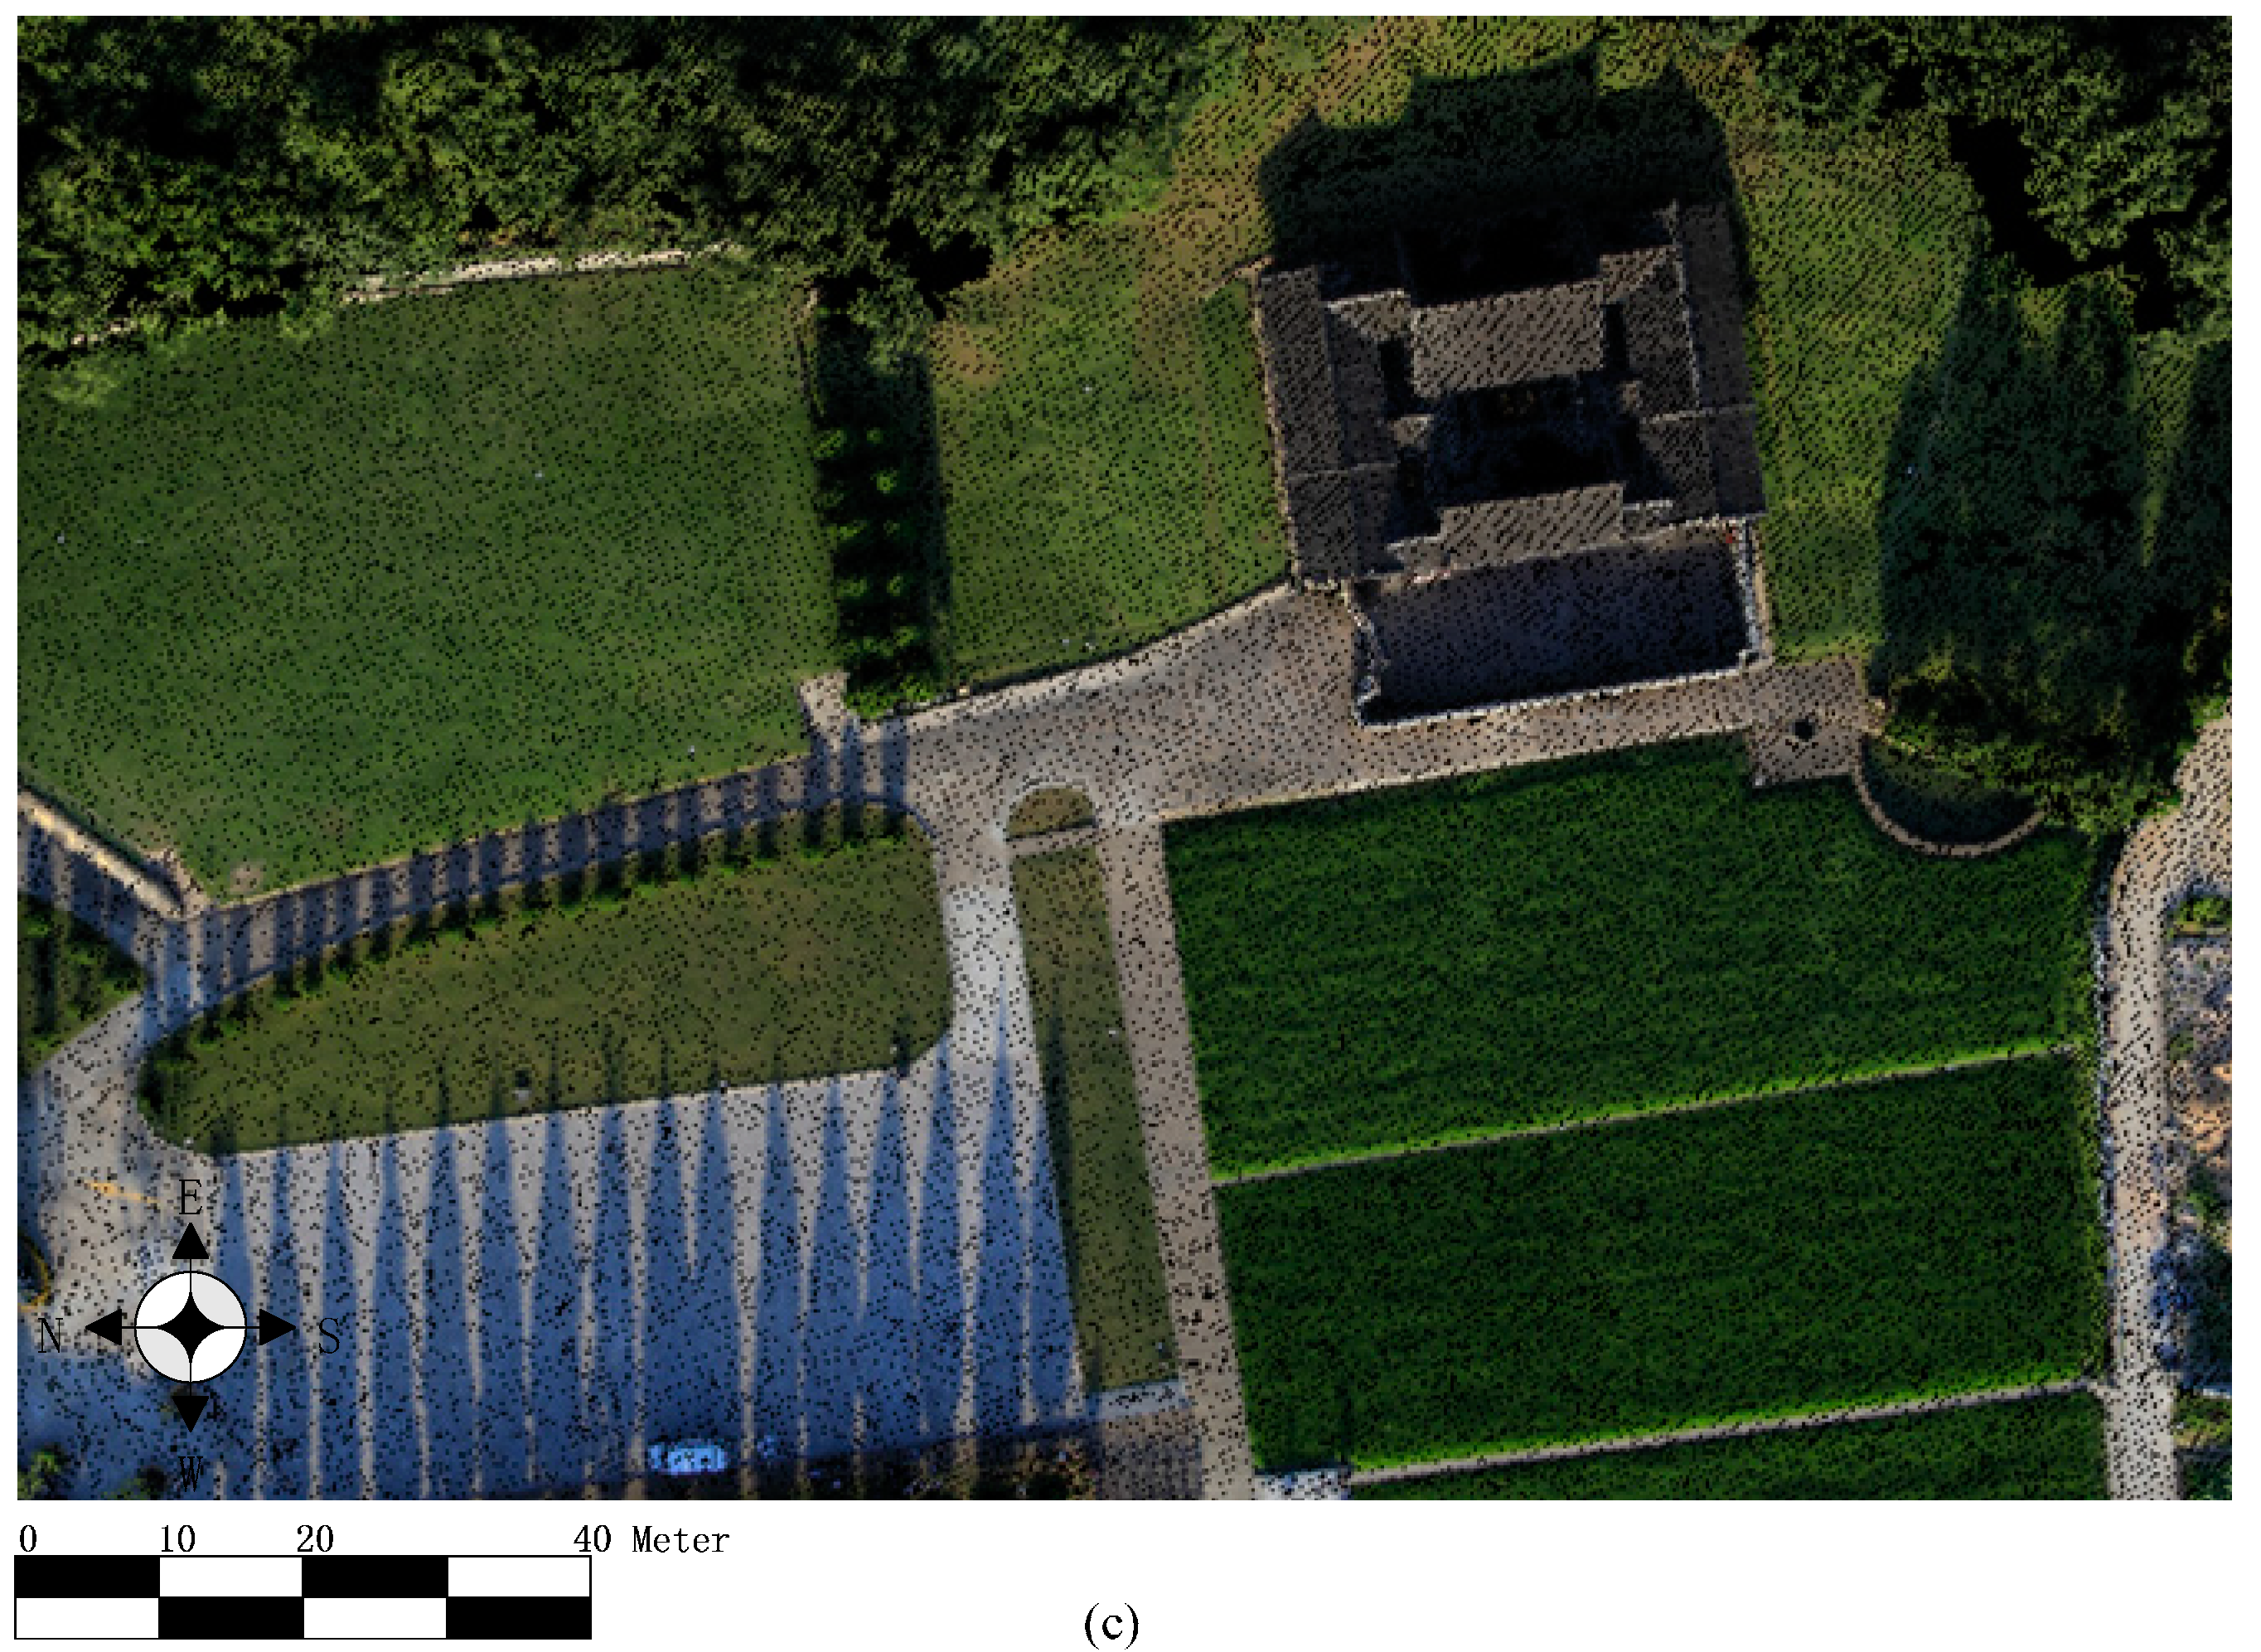
3.1. Study Area
3.2. Data Acquisition
3.2.1. UAV Oblique Image Acquisition

3.2.2. Terrestrial Surveying
4. Results and Discussions
4.1. Point Cloud Generation from UAV Optical Images


| Matching Images | Sparse Points Number | Dense Points Number | |
|---|---|---|---|
| Traversal Method | 900 | 3.02 × 10⁴ | 3.21 × 10⁶ |
| Camera Network | 564 | 2.98 × 10⁴ | 3.21 × 10⁶ |


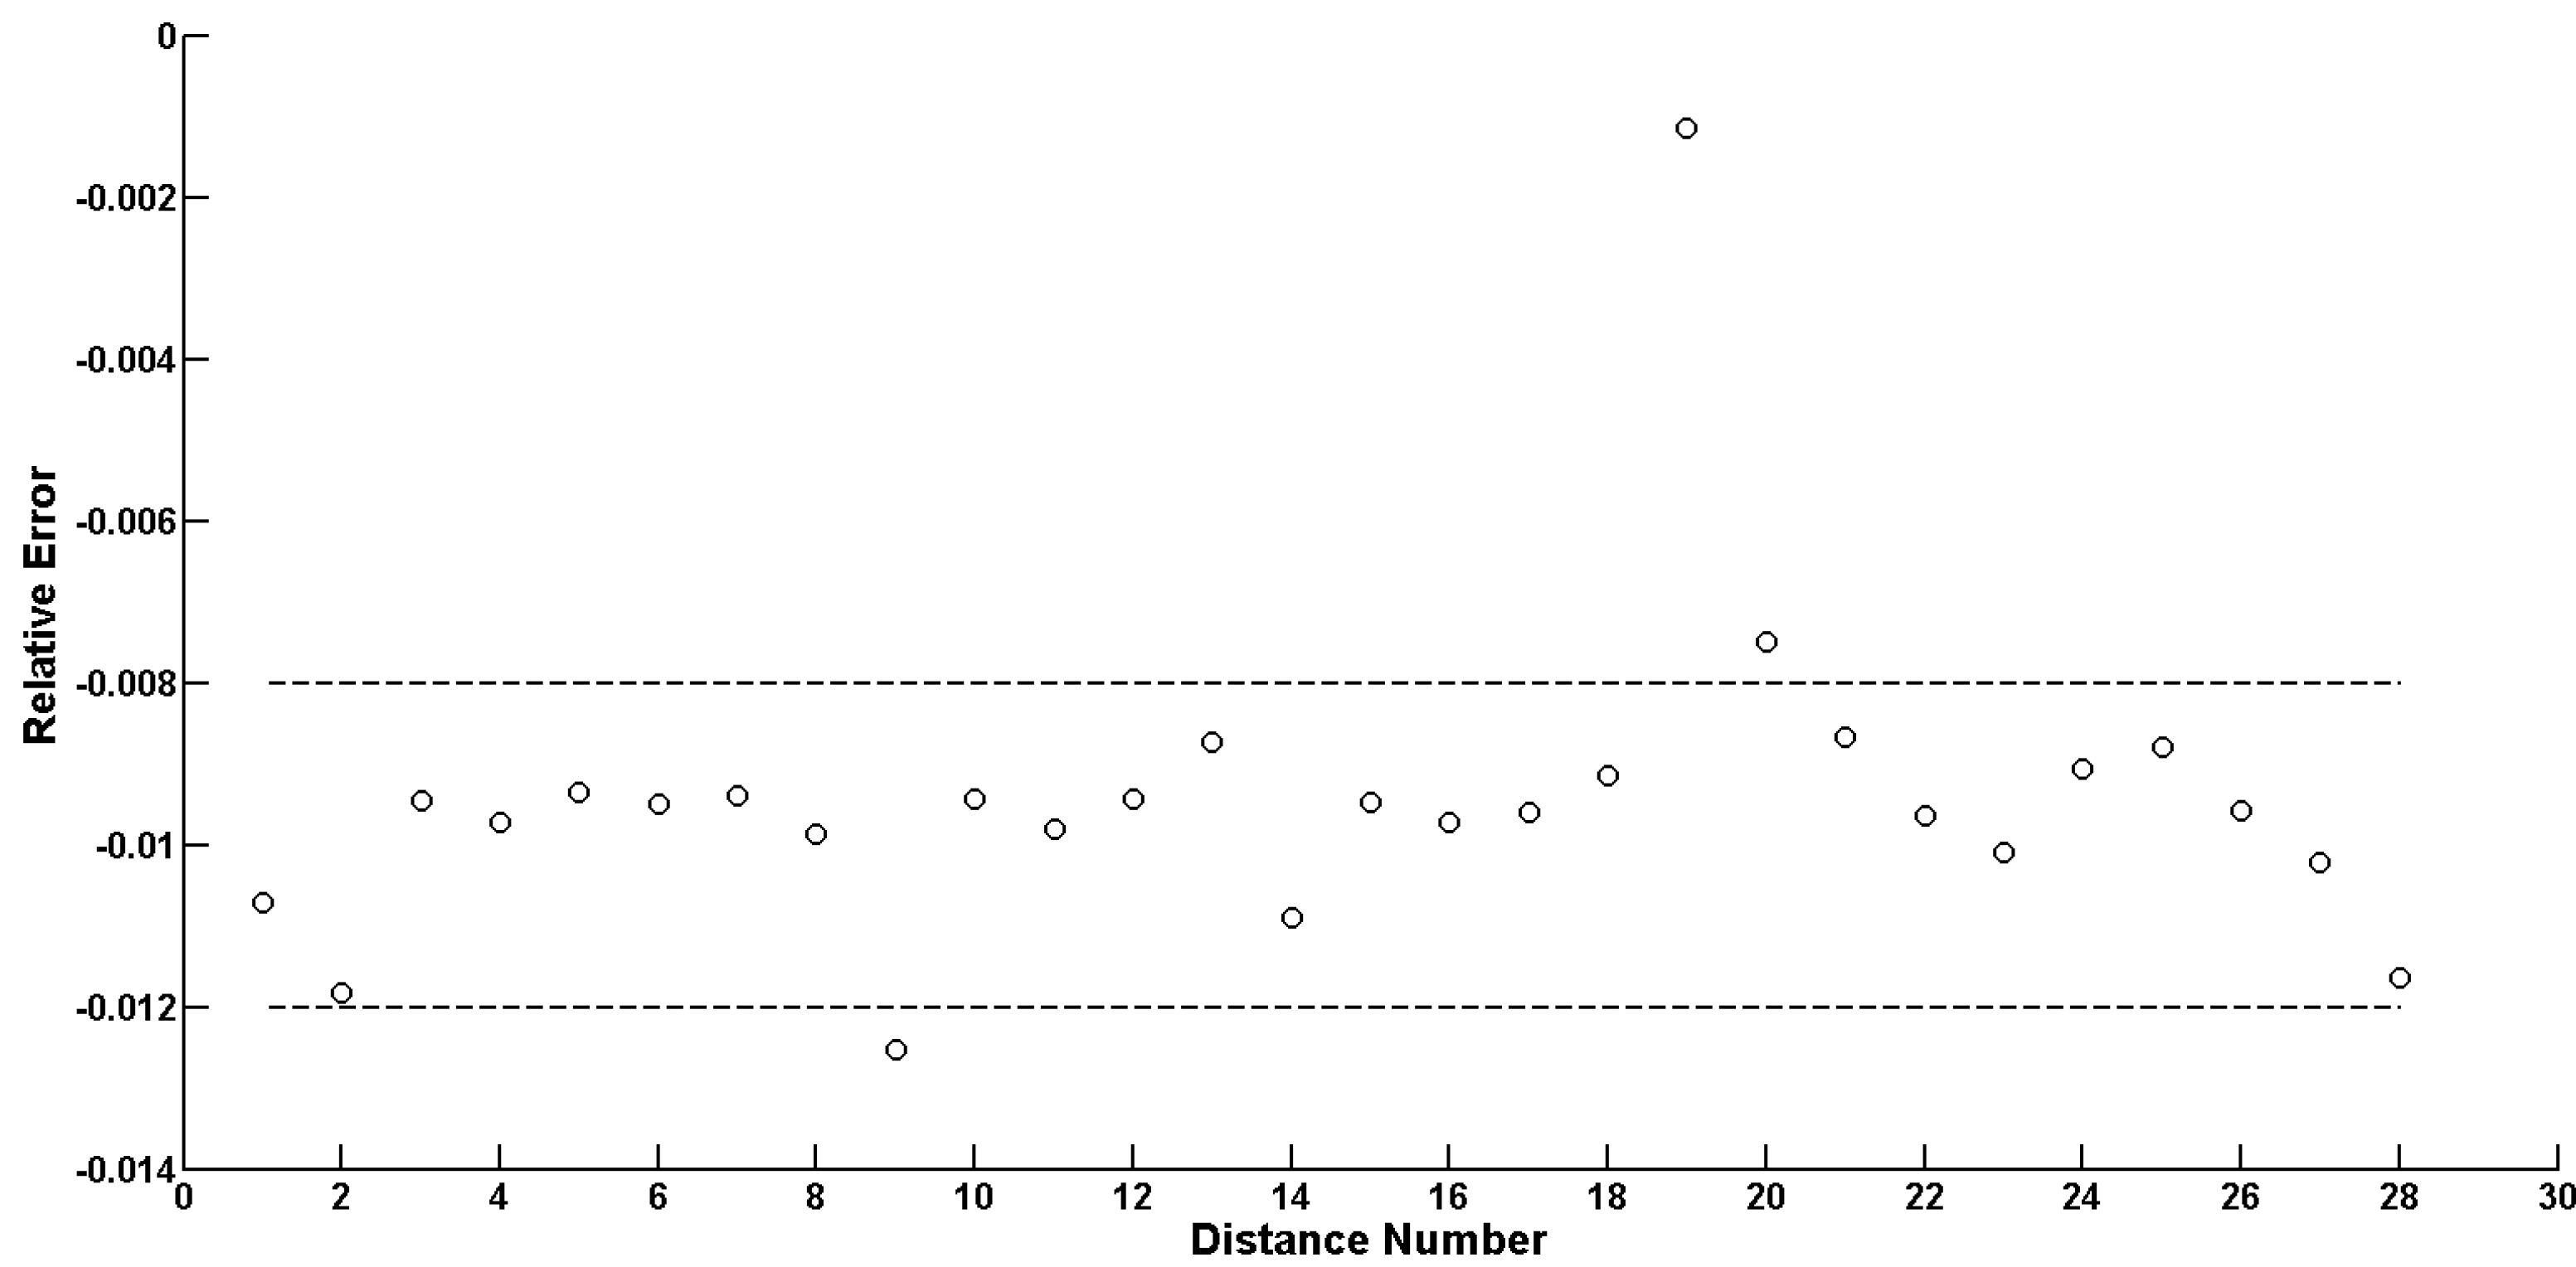
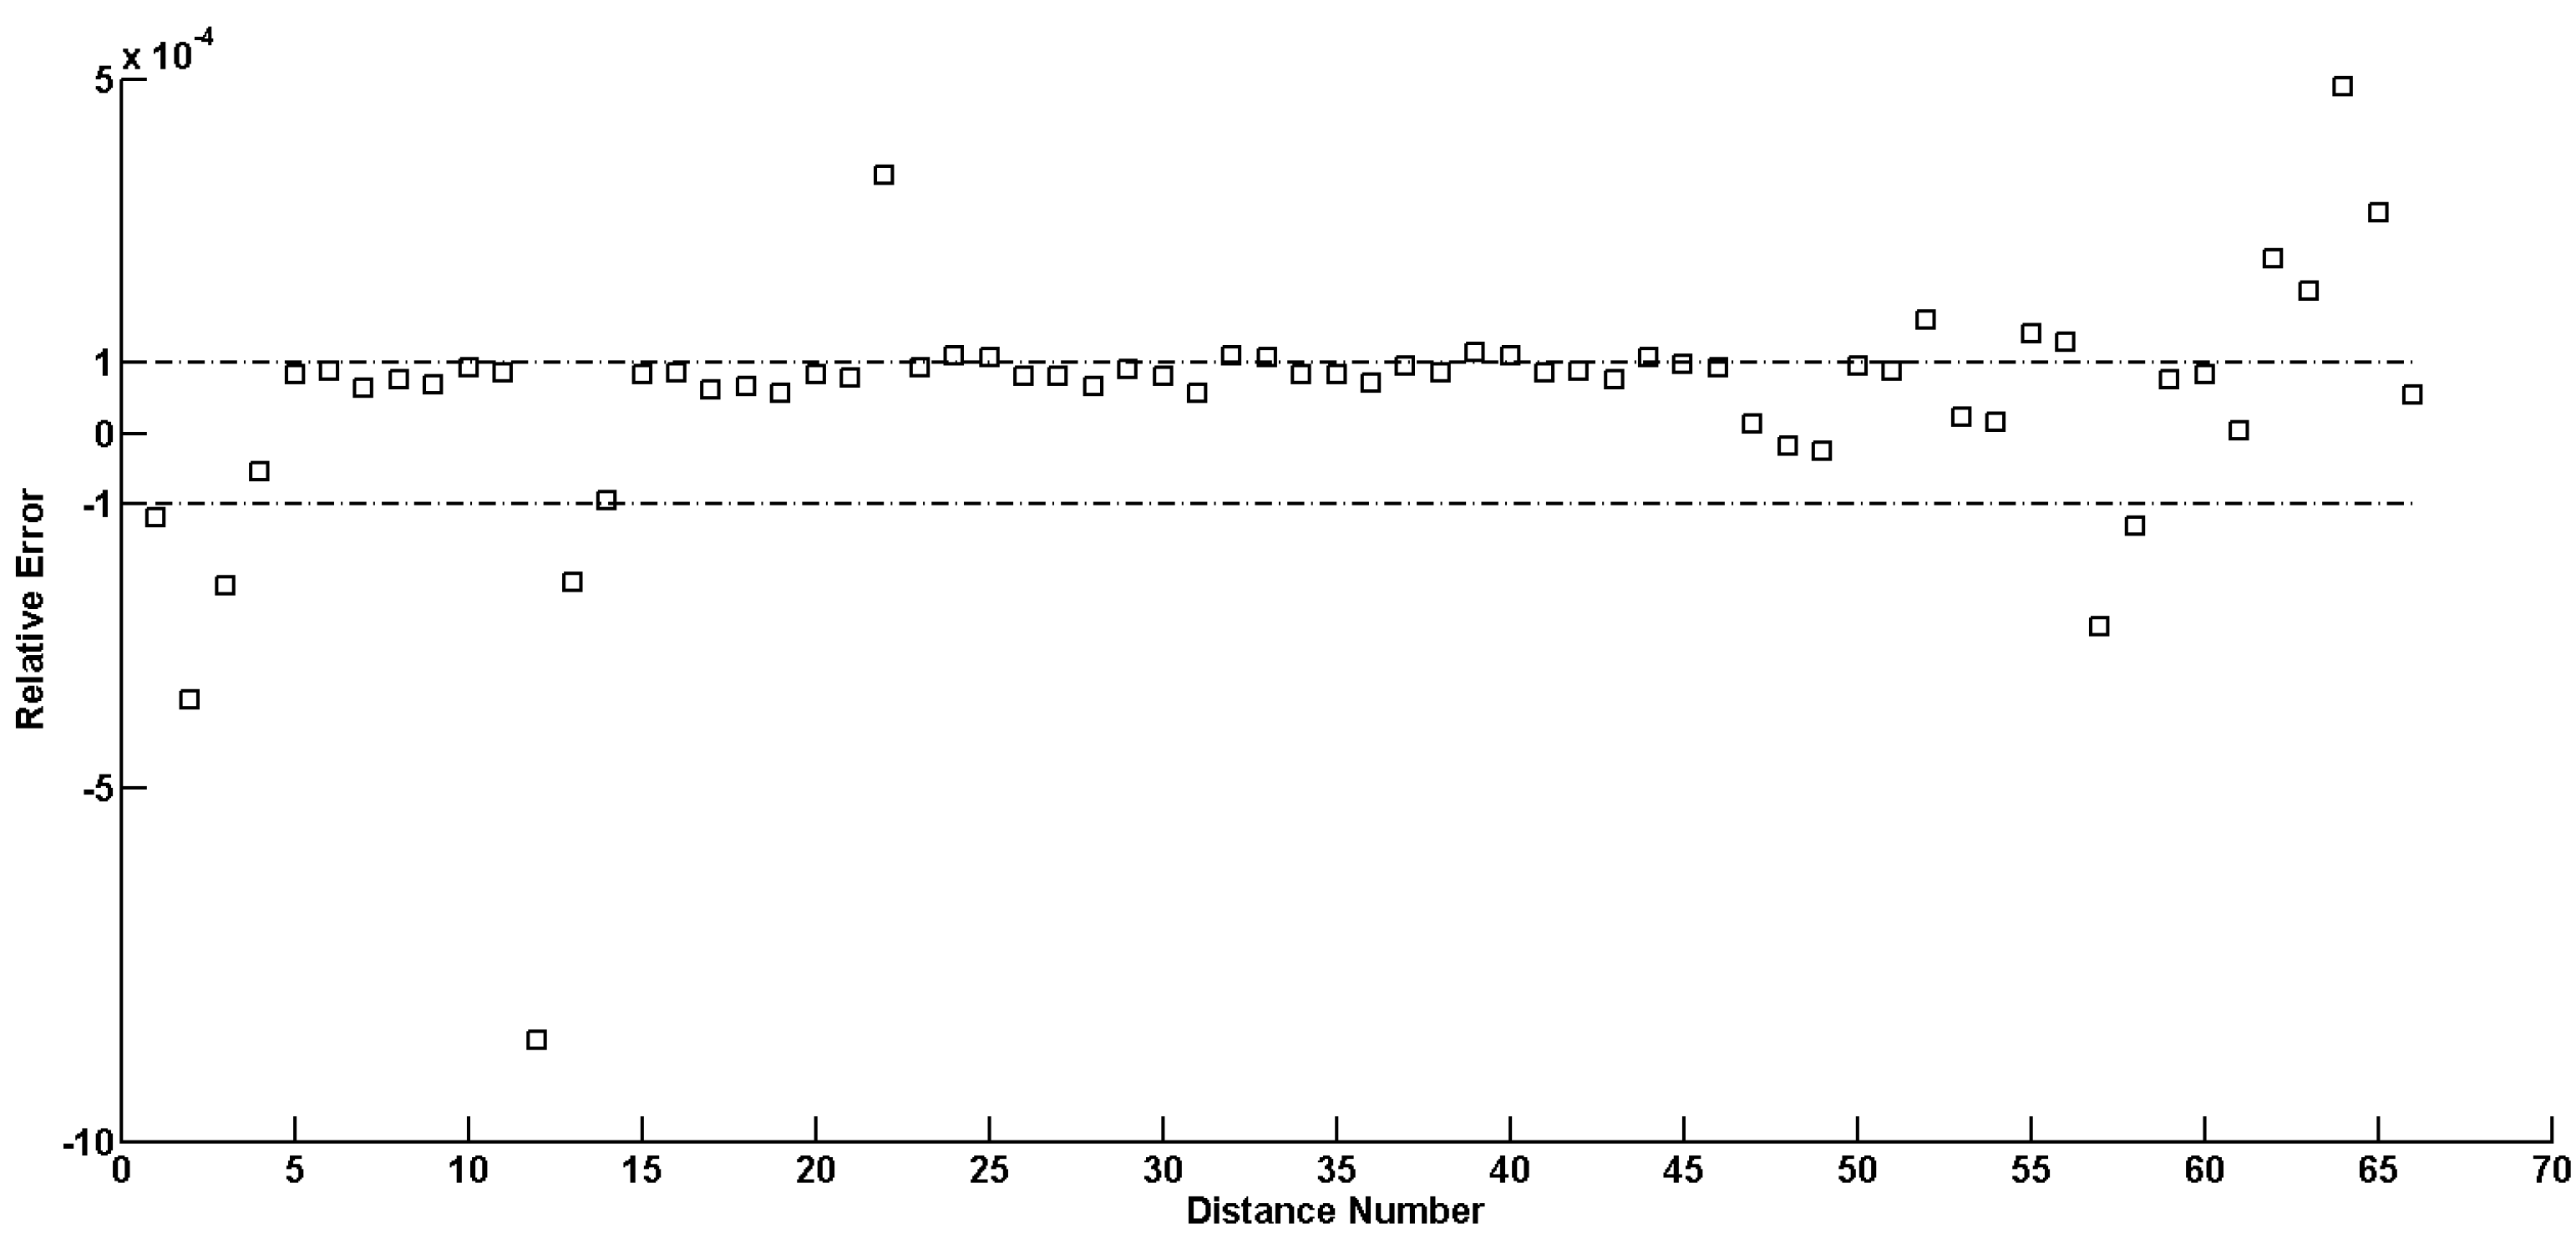
4.2. Accuracy Evaluation of TLS Point Cloud
| Reflector | 1 | 2 | 3 | 4 | 5 | 6 | 7 | 8 | 9 | 10 | 11 | 12 |
|---|---|---|---|---|---|---|---|---|---|---|---|---|
| Distance/m | 145.371 | 153.80 | 159.593 | 167.760 | 138.470 | 136.468 | 158.412 | 158.353 | 146.910 | 139.477 | 137.431 | 150.075 |
| Error/mm | −11.5 | −9.0 | −8.0 | −10.4 | −12.6 | −13.3 | −19.1 | −10.2 | −15.5 | −12.7 | −15.0 | −14.3 |

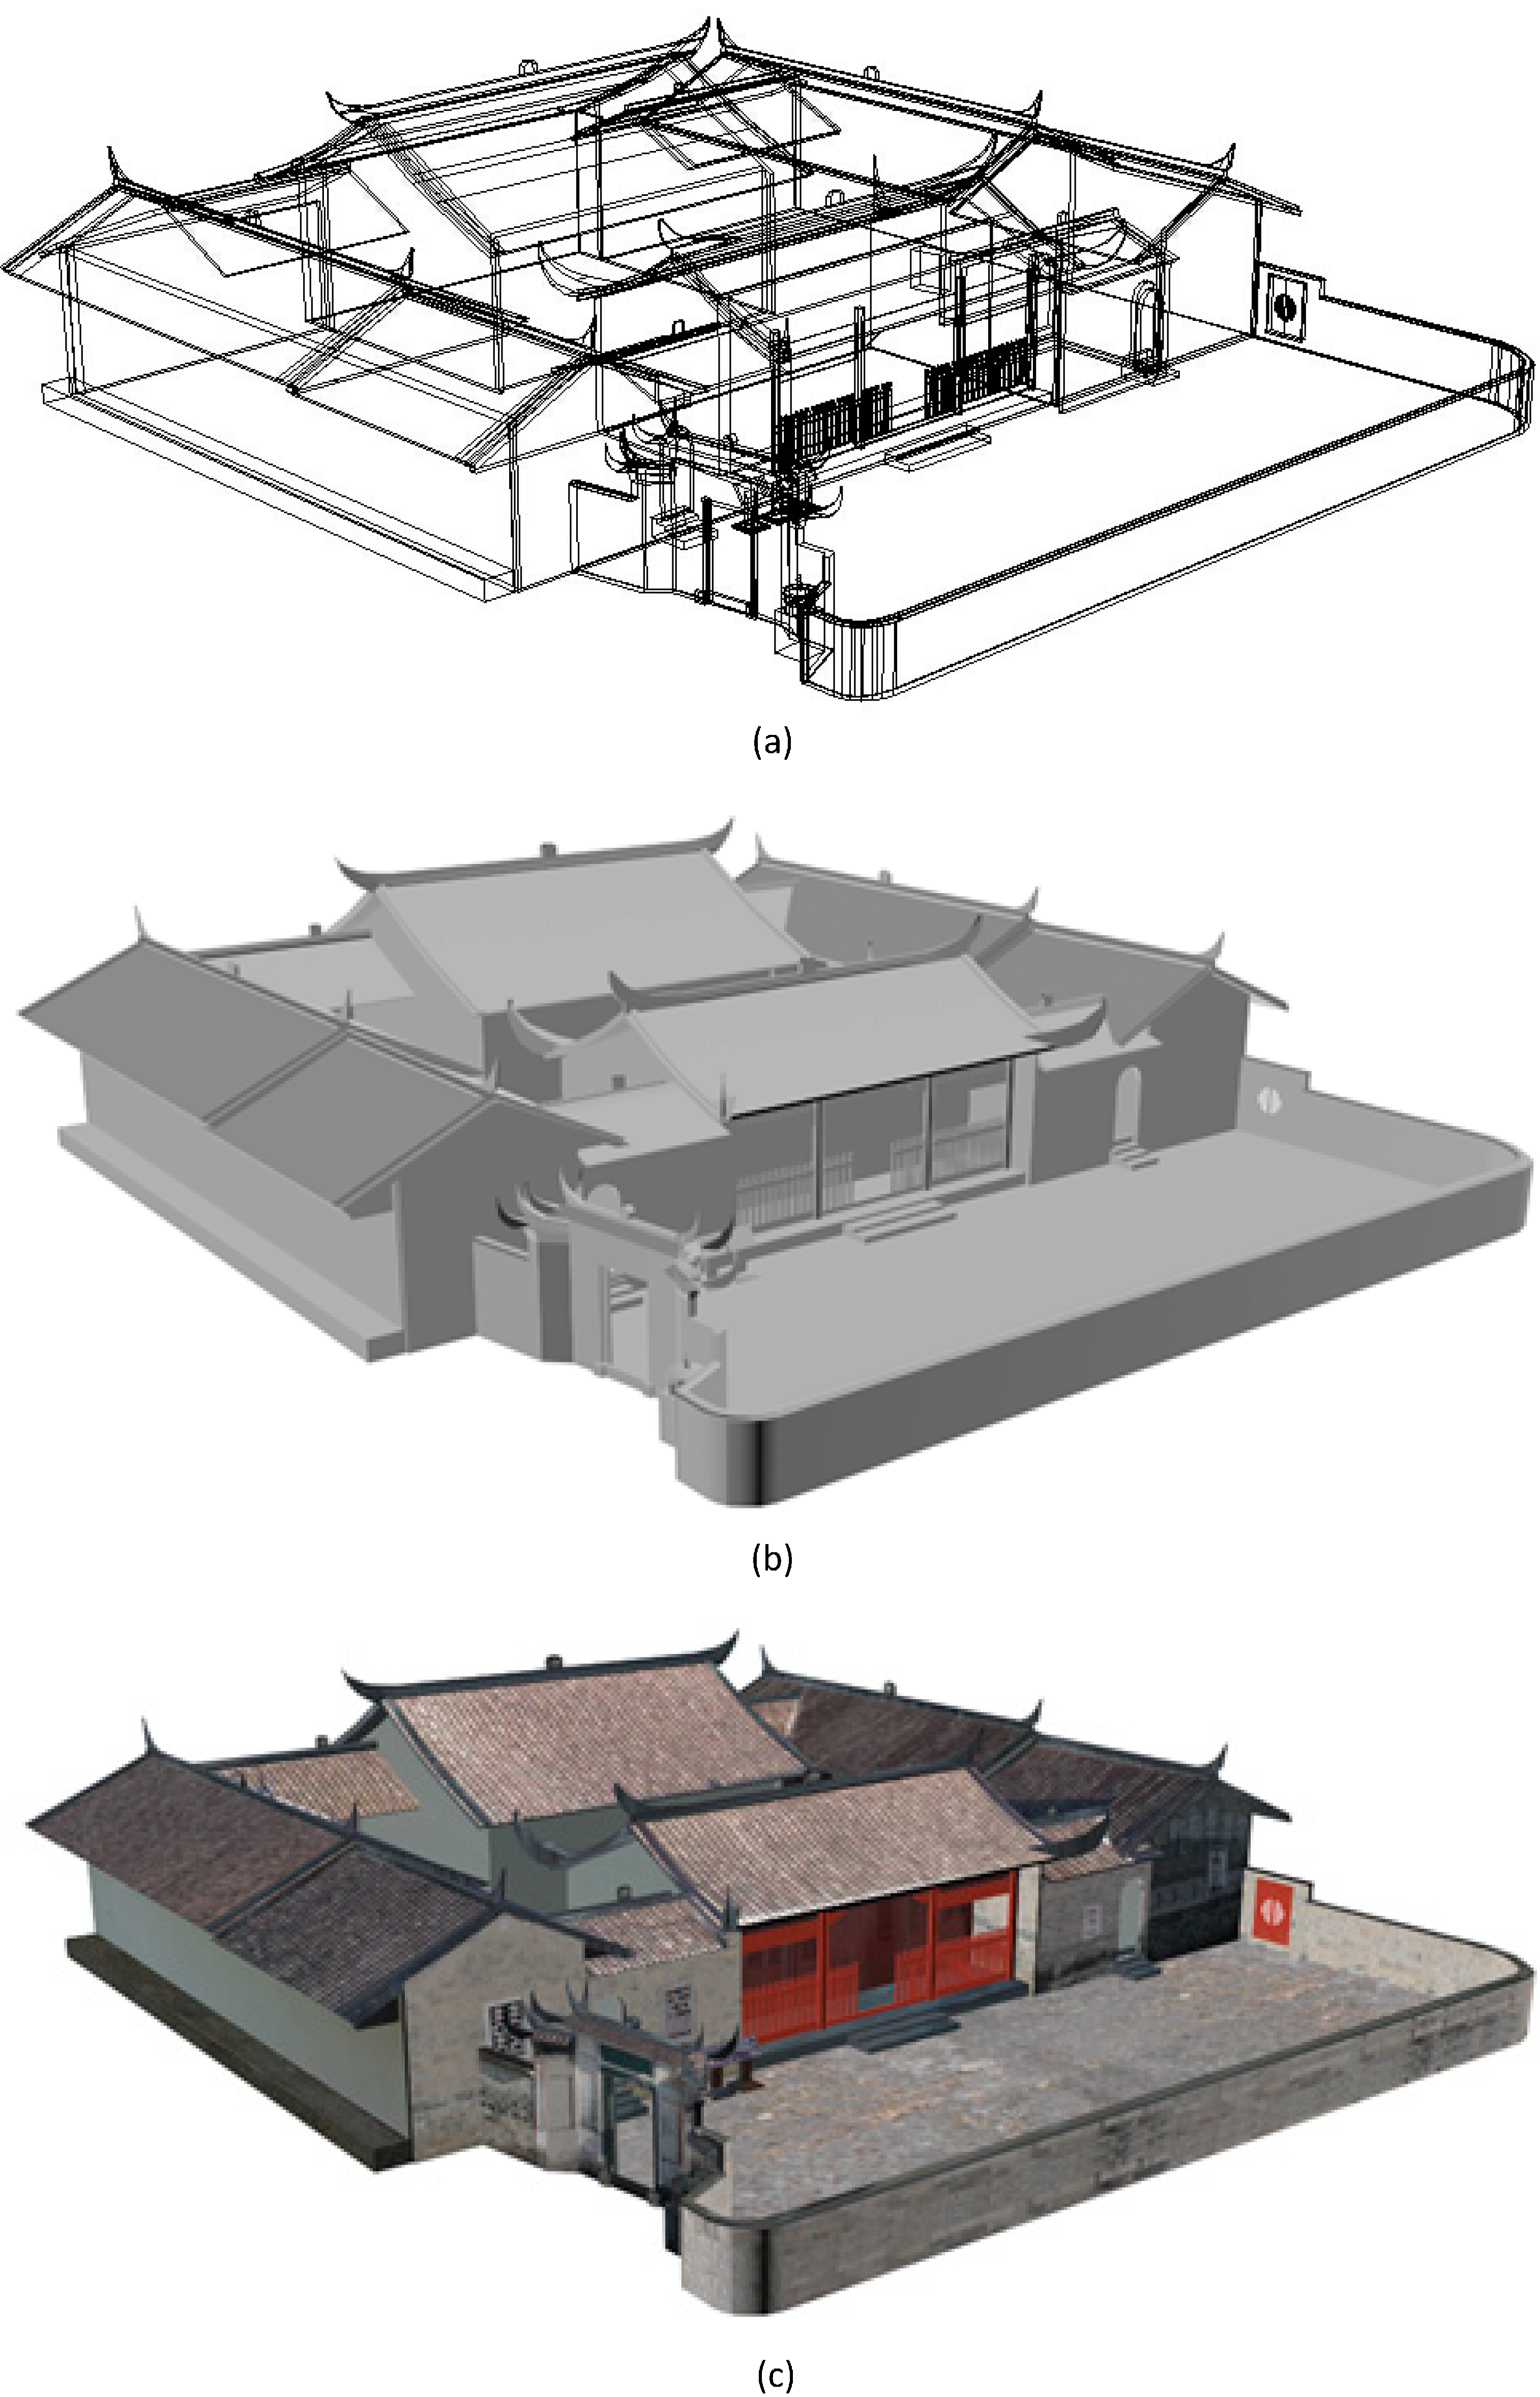
4.3. Co-Registration of Point Clouds from UAV Image Reconstruction and TLS Scanning for 3D Reconstruction


4.4. Performance and Analysis
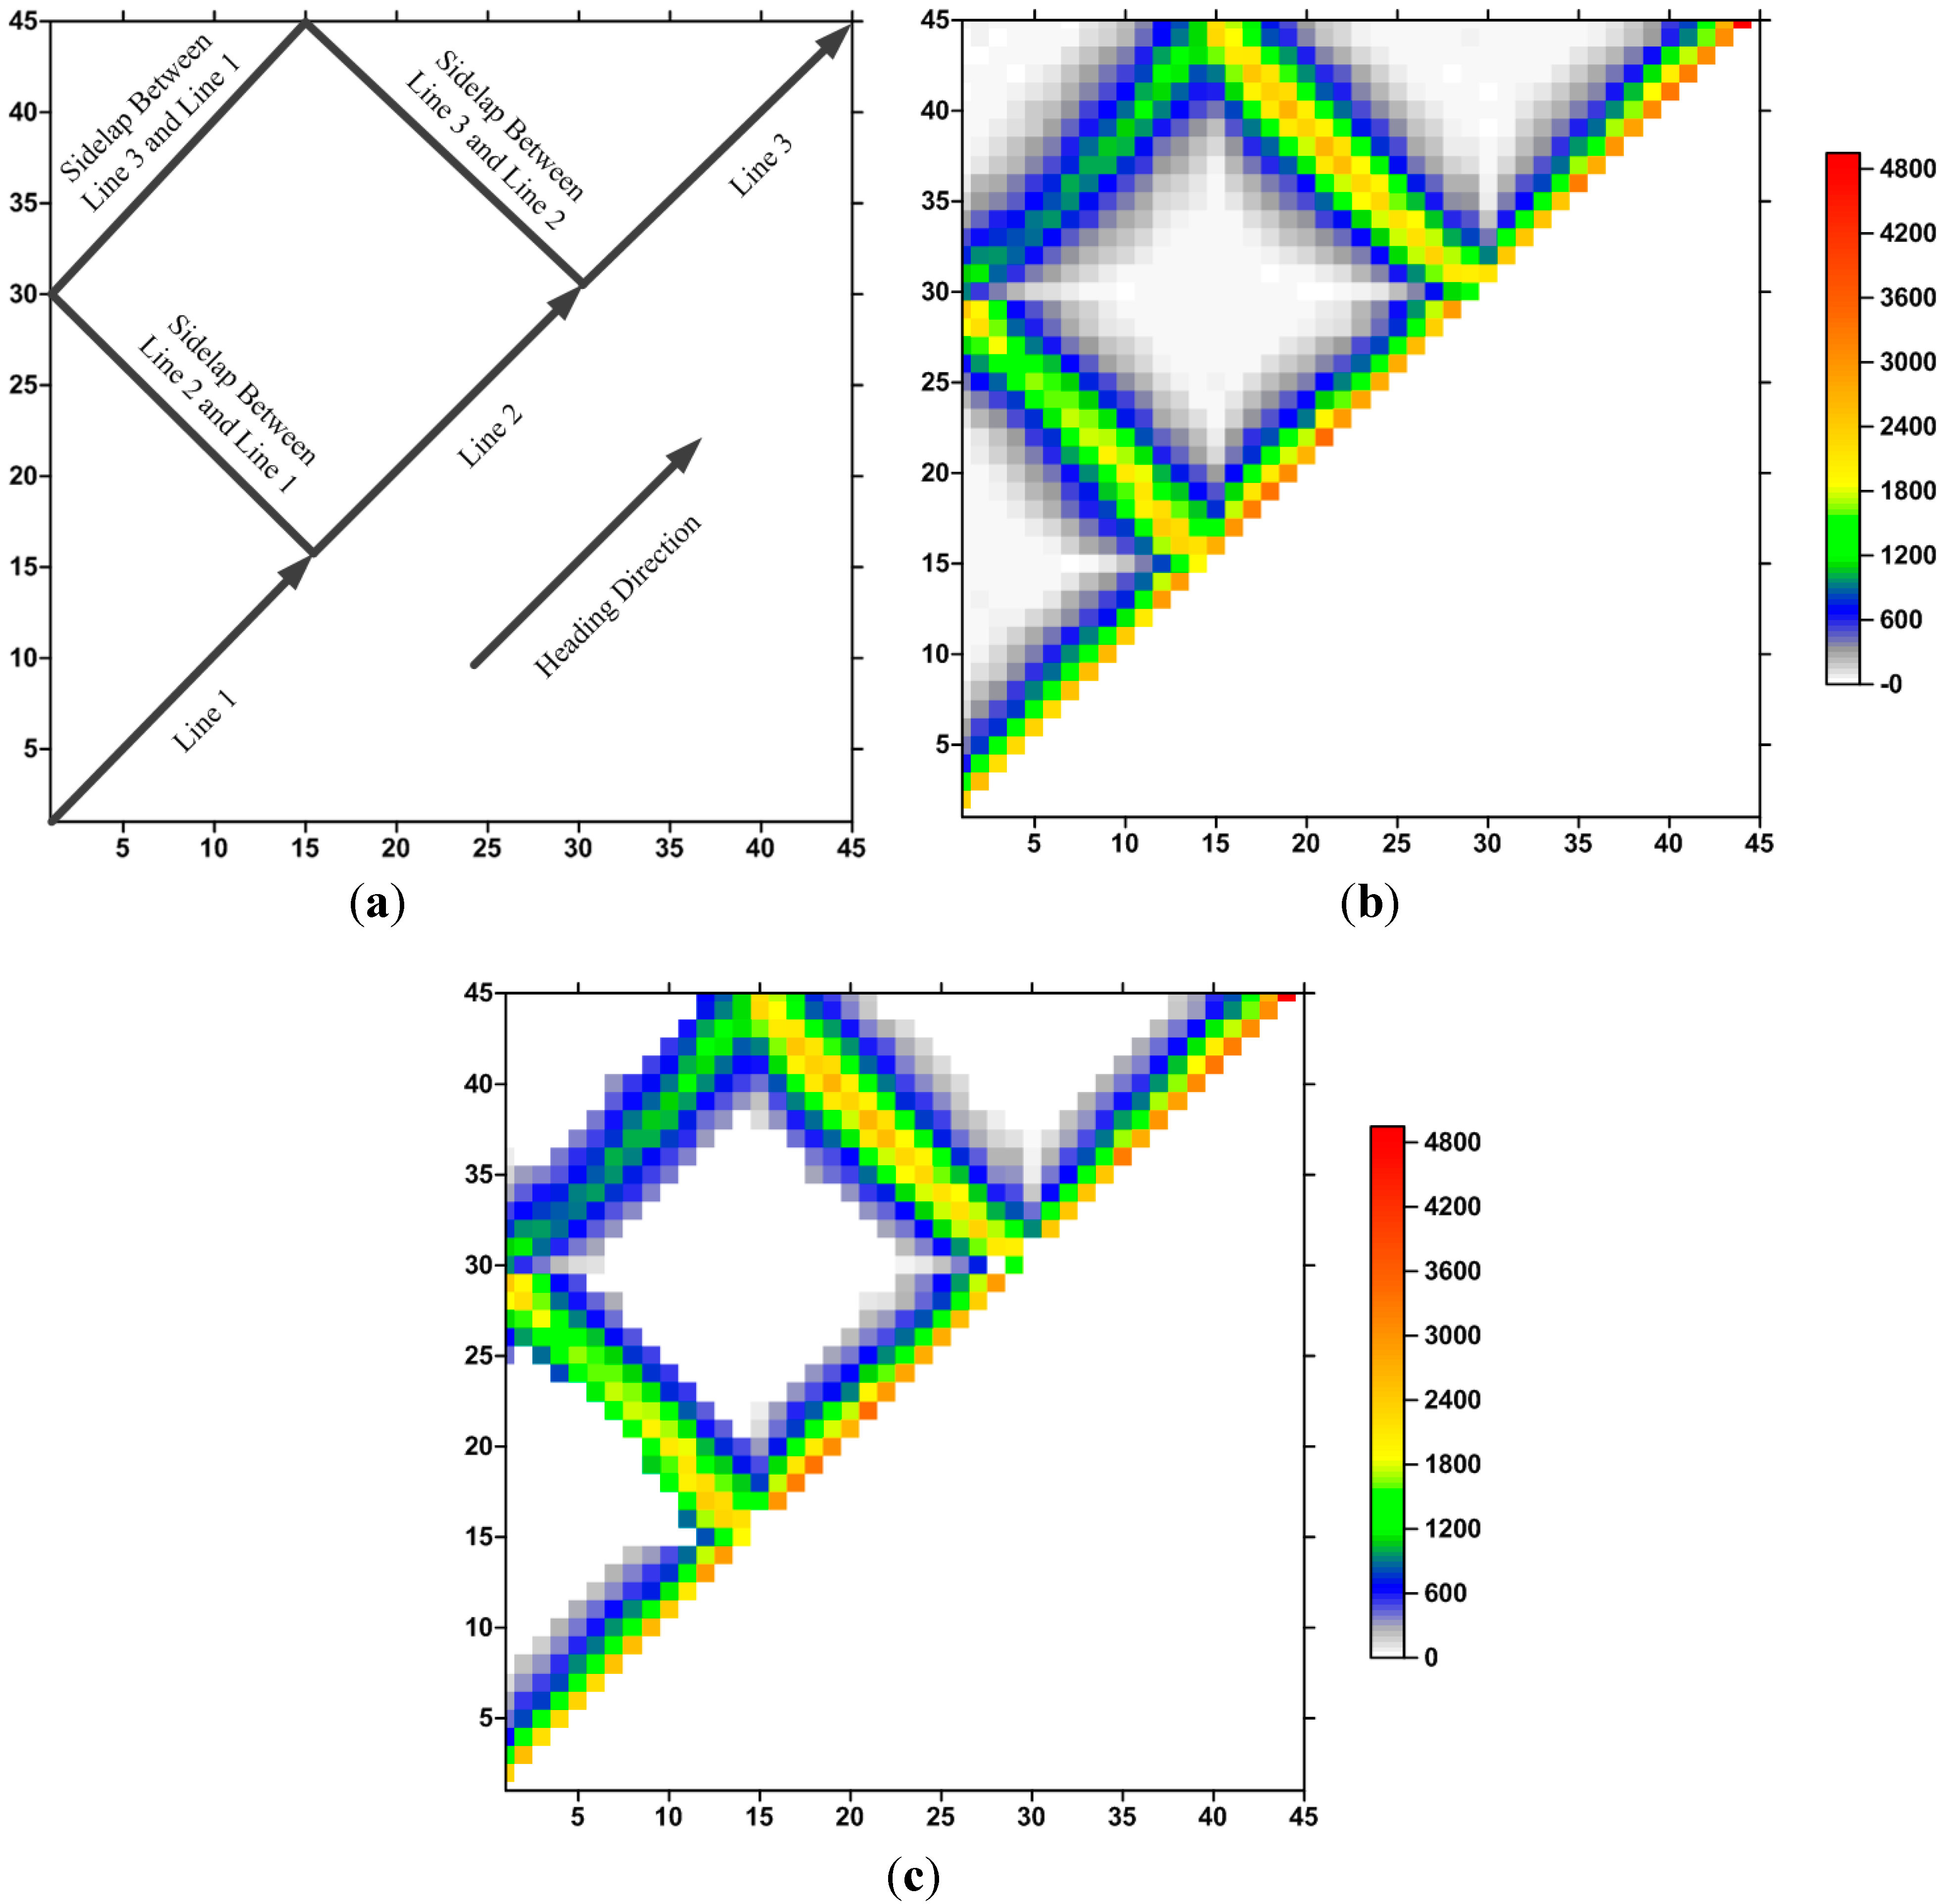
- (1)
- The flight should cover multiple lines and should obtain images with large heading and side overlaps to enhance the stability of image orientation and geometry reconstructed results.
- (2)
- Image resolution affects feature point extraction. Traditionally, an image with a higher resolution will produce more feature points. However, detecting SIFT or SURF features from a low-altitude UAV image generally results in memory explosion because of extremely high sensing resolution. Hence, a sub-divided strategy is introduced in [26].
- (3)
- Airborne positioning accuracy affects the camera network. The navigation precision with the airborne GPS and IMU devices is within ±5 m, which is not as accurate as that of high-quality GNSS/INS devices. However, this accuracy is acceptable when considering the land coverage of each image (approximately 102 m × 68 m at the height of 100 m above the terrain). This precision helps identify the conjunction relationship between nearby images, which will result in insignificant false matches.
- (4)
- Resolution difference should be considered. Point clouds captured from hybrid sensors possess different sensing resolutions and various scales. The integration of hybrid point clouds is based on the principle of feature matching. Hence, resolution difference affects the final result. The cloud, which possesses higher sensing resolution and model accuracy and was thus used as base data in the data integration procedure. Furthermore, GCPs were used to solve the scale problem.
5. Conclusions
Acknowledgments
Author Contributions
Conflicts of Interest
References
- Remondino, F. Heritage recording and 3D modeling with photogrammetry and 3D scanning. Remote Sens. 2011, 3, 1104–1138. [Google Scholar] [CrossRef] [Green Version]
- Yastikli, N. Documentation of cultural heritage using digital photogrammetry and laser scanning. J. Cult. Herit. 2007, 8, 423–427. [Google Scholar] [CrossRef]
- EI-Hakim, S.F.; Beraldin, J.A.; Picard, M.; Godin, G. Detailed 3D reconstruction of large-scale heritage sites with integrated techniques. IEEE Comput. Graph. Appli. 2004, 24, 21–29. [Google Scholar] [CrossRef]
- Remondino, F.; Rizzi, A.; Agugiaro, G.; Girardi, S.; de Amicis, R.; Magliocchetti, D.; Girardi, G.; Baratti, G. Geomatics and geoinformatics for digital 3D documentation, fruition and valorization of cultural heritage. In Proceedings of the EUROMED 2010 Workshop “Museum Futures: Emerging Technological and Social Paradigms”, Lemessos, Cyprus, 8–13 November 2010.
- CARARE Best Practice Network. Available online: http://www.carare.eu (accessed on 29 June 2014).
- 3D-ICONS Pilot Project. Available online: http://3dicons-project.eu (accessed on 29 June 2014).
- 3D-COFORM Consortium. Available online: http://3dcoform.eu (accessed on 29 June 2014).
- Guarnieri, A.; Remondino, F.; Vettore, A. Digital photogrammetry and TLS data fusion applied to cultural heritage 3D modeling. In Proceedings of the ISPRS Commission V Symposium “Image Engineering and Vision Metrology”, Dresden, Germany, 25–27 September 2006; Maas, H.-G., Schneider, D., Eds.; Volume XXXVI. Part 5.
- Böhler, W.; Marbs, A. 3D scanning instruments. In Proceedings of the CIPA WG 6 International Workshop on Scanning for Cultural Heritage Recording, Corfu, Greece, 1–2 September 2002.
- Pieraccini, M.; Guidi, G.; Atzeni, C. 3D digitizing of cultural heritage. J. Cult. Herit. 2001, 2, 63–70. [Google Scholar] [CrossRef]
- Koutsoudis, A.; Vidmar, B.; Ioannakis, G.; Arnaoutoglou, F.; Pavlidis, G.; Chamzas, C. Multi-image 3D reconstruction data evaluation. J. Cult. Herit. 2013, 15, 73–79. [Google Scholar] [CrossRef]
- Gruen, A.; Huang, T.S. Calibration and Orientation of Cameras in Computer Vision; Springer Berlin-Heidelberg: Berlin, Germany, 2001; p. 239. [Google Scholar]
- Remondino, F.; El-Hakim, S. Image-based 3D modelling: A review. Photogramm. Rec. 2006, 21, 269–291. [Google Scholar] [CrossRef]
- Robertson, D.; Cipolla, R. Structure from motion. In Practical Image Processing and Computer Vision; John Wiley: Hoboken, NJ, USA, 2009. [Google Scholar]
- Furukawa, Y.; Ponce, J. Accurate, dense, and robust multiview stereopsis. IEEE Trans. Pattern Anal. Mach. Intell. 2010, 32, 1362–1376. [Google Scholar] [CrossRef] [PubMed]
- Engels, C.; Stewénius, H.; Nistér, D. Bundle adjustment rules. In Proceedings of Photogrammetric Computer Vision (PCV), Bonn, Germany, 20–22 September 2006.
- Snavely, N. Bundler: Structure from Motion for Unordered Image Collections. 2010. Available online: http://www.cs.cornell.edu/~snavely/bundler (accessed on 29 June 2014).
- Snavely, N.; Seitz, S.M.; Szeliski, R. Photo tourism: Exploring photo collections in 3D. ACM Trans. Graph. 2006, 25, 835–846. [Google Scholar] [CrossRef]
- Wu, C.; Agarwal, S.; Curless, B.; Seitz, S.M. Multicore bundle adjustment. In Proceedings of the IEEE Conference on Computer Vision and Pattern Recognition (CVPR), Providence, RI, USA, 20–25 June 2011; pp. 3057–3064.
- Snavely, N.; Seitz, S.M.; Szeliski, R. Skeletal graphs for efficient structure from motion. In Proceedings of the IEEE Conference on Computer Vision and Pattern Recognition (CVPR), Anchorage, AK, USA, 23–28 June 2008.
- Wu, C. VisualSFM: A Visual Structure from Motion System. 2011. Available online: http://ccwu.me/vsfm (accessed on 29 June 2014).
- PhotoModeler Scanner. Available online: http://www.photomodeler.Com/products/pm-scanner.htm (accessed on 29 June 2014).
- Agisoft PhotoScan. Available online: http://www.agisoft.ru (accessed on 29 June 2014).
- Pix4D Simply Powerful. Available online: http://pix4d.com (accessed on 29 June 2014).
- Xu, Z.; Wu, L.; Wang, Z.; Wang, R.; Li, Z.; Li, F. Matching UAV images with image topology skeleton. In Proceedings of the International Geoscience and Remote Sensing Symposium (IGARSS), Melbourne, VIC, Australia, 21–26 July 2013.
- Xu, Z.; Wu, L.; Chen, S.; Wang, R.; Li, F.; Wang, Q. Extraction of image topological graph for recovering the scene geometry from UAV collections. Int. Arch. Photogramm. Remote Sens. Spat. Inf. Sci. 2014, XL, 319–323. [Google Scholar] [CrossRef]
- Alsadik, B.; Gerke, M.; Vosselman, G. Automated camera network design for 3D modeling of cultural heritage objects. J. Cult. Herit. 2013, 14, 515–526. [Google Scholar] [CrossRef]
- Remondino, F.; Rizzi, A. Reality-based 3D documentation of natural and cultural heritage sites—Techniques, problems, and examples. Appl. Geomat. 2010, 2, 85–100. [Google Scholar] [CrossRef]
- Lingua, A.M.; Rinaudo, F. The statue of Ramsete II: Integration of digital photogrammetry and laser scanning technique for 3D modelling. In Proceedings of the 18th International Symposium CIPA, Potsdam, Germany, 18–21 September 2001; pp. 206–211.
- Ioannidis, C.; Tsakiri, M. Laser scanning and photogrammetry for the documentation of a large statue-experiences in the combined use. In Proceedings of the CIPA XIX International Symposium, Athens, Greece, 1–6 October 2003.
- Beraldin, J.-A. Integration of laser scanning and close-range photogrammetry-the last decade and beyond. In Proceedings of the XXth ISPRS Congress, Commission VII, Istanbul, Turkey, 12–23 July 2004; pp. 972–983.
- Böhler, W.; Marbs, A. 3D Scanning and photogrammetry for heritage recording: A comparison. In Proceedings of the 12th International Conference on Geoinformatics, Gävle, Sweden, 7–9 June 2004; pp. 291–298.
- Kadobayashi, R.; Kochi, N.; Otani, H.; Furukawa, R. Comparison and evaluation of laser scanning and photogrammetry and their combined use for digital recording of cultural heritage. Int. Arch. Photogramm. Remote Sens. Spat. Inf. Sci. 2004, XXXV, 401–406. [Google Scholar]
- Remondino, F.; Guarnieri, A.; Vettore, A. 3D modeling of close-range objects: Photogrammetry or laser scanning? Proc. SPIE 2005. [Google Scholar] [CrossRef]
- Lerma, J.L.; Navarro, S.; Cabrelles, M.; Seguí, A.E.; Haddad, N.; Akasheh, T. Integration of laser scanning and imagery for photorealistic 3D architectural documentation. In Laser Scanning, Theory and Applications; Wang, C.C., Ed.; InTech: Rijeka, Croatia, 2011; pp. 413–430. [Google Scholar]
- Pollefeys, M.; van Gool, L.; Vergauwen, M.; Verbiest, F.; Cornelis, K.; Tops, J.; Koch, R. Visual modeling with a hand-held camera. Int. J. Comput. Vis. 2004, 59, 207–232. [Google Scholar] [CrossRef]
- Lowe, D.G. Distinctive image features from scale-invariant keypoints. Int. J. Comput. Vis. 2004, 60, 91–110. [Google Scholar] [CrossRef]
- Douterloigne, K.; Gautama, S.; Philips, W. On the accuracy of 3D landscapes from UAV image data. In Proceedings of the International Geoscience and Remote Sensing Symposium (IGARSS), Honolulu, HI, USA, 25–30 July 2010.
- Besl, P.J.; McKay, N.D. Method for registration of 3-D shapes. IEEE Trans. Pattern Anal. Mach. Intell. 1992, 14, 239–256. [Google Scholar] [CrossRef]
- Pulli, K. Multiview registration for large data sets. In Proceedings of the 2th International Conference on 3-D Digital Imaging and Modeling (3DIM’99), Ottawa, ON, Canada, 4–8 October 1999; pp. 160–168.
- Bae, K.-H.; Lichti, D.D. A method for automated registration of unorganized point clouds. ISPRS J. Photogramm. Remote Sens. 2008, 63, 36–54. [Google Scholar] [CrossRef]
- González-Aguilera, D.; Rodríguez-Gonzálvez, P.; Gómez-Lahoz, J. An automatic procedure for co-registration of terrestrial laser scanners and digital cameras. ISPRS J. Photogramm. Remote Sens. 2009, 64, 308–316. [Google Scholar] [CrossRef]
- Weinmann, M.; Hinz, S.; Jutzi, B. Fast and automatic image-based registration of TLS data. ISPRS J. Photogramm. Remote Sens. 2011, 66, 62–70. [Google Scholar] [CrossRef]
- Alsadik, B.; Gerke, M.; Vosselman, G.; Daham, A.; Jasim, L. Minimal camera networks for 3D image based modeling of cultural heritage objects. Sensors 2014, 14, 5785–5804. [Google Scholar] [CrossRef]
© 2014 by the authors; licensee MDPI, Basel, Switzerland. This article is an open access article distributed under the terms and conditions of the Creative Commons Attribution license (http://creativecommons.org/licenses/by/4.0/).
Share and Cite
Xu, Z.; Wu, L.; Shen, Y.; Li, F.; Wang, Q.; Wang, R. Tridimensional Reconstruction Applied to Cultural Heritage with the Use of Camera-Equipped UAV and Terrestrial Laser Scanner. Remote Sens. 2014, 6, 10413-10434. https://0-doi-org.brum.beds.ac.uk/10.3390/rs61110413
Xu Z, Wu L, Shen Y, Li F, Wang Q, Wang R. Tridimensional Reconstruction Applied to Cultural Heritage with the Use of Camera-Equipped UAV and Terrestrial Laser Scanner. Remote Sensing. 2014; 6(11):10413-10434. https://0-doi-org.brum.beds.ac.uk/10.3390/rs61110413
Chicago/Turabian StyleXu, Zhihua, Lixin Wu, Yonglin Shen, Fashuai Li, Qiuling Wang, and Ran Wang. 2014. "Tridimensional Reconstruction Applied to Cultural Heritage with the Use of Camera-Equipped UAV and Terrestrial Laser Scanner" Remote Sensing 6, no. 11: 10413-10434. https://0-doi-org.brum.beds.ac.uk/10.3390/rs61110413