Article

Using Airborne LiDAR and QuickBird Data for Modelling Urban Tree Carbon Storage and Its Distribution—A Case Study of Berlin

1
Geography Department, Humboldt-Universität zu Berlin, Unter den Linden 6, 10099 Berlin, Germany
2
Chair for Strategic Landscape Planning and Management, Technische Universität München, Emil-Ramann-Str. 6, 85354 Freising, Germany
3
Institute for Advanced Sustainable Studies e.v., IASS Potsdam, Berliner Straße 130, 14467 Potsdam, Germany
*
Author to whom correspondence should be addressed.
Remote Sens. 2014, 6(11), 10636-10655; https://0-doi-org.brum.beds.ac.uk/10.3390/rs61110636
Submission received: 21 May 2014 / Revised: 16 October 2014 / Accepted: 21 October 2014 / Published: 3 November 2014

Abstract

:
While CO2 emissions of cities are widely discussed, carbon storage in urban vegetation has been rarely empirically analyzed. Remotely sensed data offer considerable benefits for addressing this lack of information. The aim of this paper is to develop and apply an approach that combines airborne LiDAR and QuickBird to assess the carbon stored in urban trees of Berlin, Germany, and to identify differences between urban structure types. For a transect in the city, dendrometric parameters were first derived to estimate individual tree stem diameter and carbon storage with allometric equations. Field survey data were used for validation. Then, the individual tree carbon storage was aggregated at the level of urban structure types and the distribution of carbon storage was analysed. Finally, the results were extrapolated to the entire urban area. High accuracies of the detected tree locations were reached with 65.30% for all trees and 80.1% for dominant trees. The total carbon storage of the study area was 20,964.40 t (σ = 15,550.11 t). Its carbon density equaled 13.70 t/ha. A general center-to-periphery increase in carbon storage was identified along the transect. Our approach methods can be used by scientists and decision-makers to gain an empirical basis for the comparison of carbon storage capacities between cities and their subunits to develop adaption and mitigation strategies against climate change.

Graphical Abstract

1. Introduction

Urban areas contribute significantly to global carbon emissions (70% of the global value); forecasted future urbanization will lead to further increases in this proportion [1]. Conversely, the carbon storage level of cities is built upon large artificial and natural sinks like buildings, waste areas, living organisms, soils and vegetation [2,3]. Recent studies in the United States [4,5,6], Europe [2,7,8] and Asia [9,10] reveal that the storage capacity of urban trees represents an important urban carbon sink. For instance, Heath, et al. [11] stated that 14% of the total amount of sequestration by forests in the U.S. is provided by urban forests and Davies et al. [7] reports that 97.3% of the total carbon stored in above-ground vegetation in the city of Leicester, UK, was within trees. However, research on the amount of urban tree carbon storage still lacks automated and area-wide methodological approaches that cover public and private space, allowing a cheap assessment of carbon storage.
Recent developments in remote sensing technologies with an increasing spatial and temporal resolution and the availability of 3D airborne laser scanning data (ALS) seem promising for assessing above-ground carbon storage. Very high resolution multispectral images such as QuickBird enable a detailed separation of vegetation and non-vegetation, even in dense urban areas, and provide an important information source for further combined analysis with airborne LiDAR [10,12,13,14]. Using airborne LiDAR data, tree carbon assessments have been successfully completed for an entire tree stock [15], and for single trees by using neighbored pixel information [16]. In order to measure urban tree carbon stocks, assessment on the single-tree level is particularly important because it accounts for the heterogeneous formations and shapes of trees in urban environments [17]. The carbon content of single trees has been successfully derived from biomass, which can be calculated using allometric equations for dendrometric parameters such as tree height or crown diameter [18,19]. Using airborne LiDAR data improve the derivation of dendrometric parameters of single trees, because the data contains precise geometrical heights as a result of active distance measurements [20]. Methods for assessing individual tree parameters from airborne LiDAR became popular in the forestry sector, with increased spatial resolution and location accuracy in the late 1990s [21,22,23,24]. These approaches mostly assess tree location and crown diameter by using the brightness values in raw airborne LiDAR data (e.g., [25,26]) or height values within a Canopy Height Model (CHM) (e.g., [27,28]). Some of these approaches have been transferred to urban areas and have been frequently augmented by using additional data sets such as terrestrial laser scanning (TLS) to improve the derivation of dendrometric parameters. The effectiveness of the chosen approach was found to vary depending on the local tree stock conditions, the spatial data resolution, and the algorithms used [12,29,30,31].
Only few studies have dealt with carbon quantification of urban trees, and even fewer with their patterns of distribution. The latter is particularly interesting because tree density within urban areas is unevenly distributed, depending on urban planning and architectural types. In Berlin, the built-up area is divided into urban structure types, which are homogeneous regions in terms of spatial structure/morphology [32]. The division of structure units is similar to the type adopted in land utilization plans that exist for almost every municipality in Germany. Strohbach and Haase [8] differentiated above-ground carbon storage in trees for different land use classes in the city of Leipzig and found a decline of carbon storage from intensively to less intensively used industrial, commercial or residential areas. Furthermore, they identified a general increase with greater distance from the urban core, similar to Radford and James [33], and Hutyra, Yoon and Alberti [6].
The aim of this paper is to develop and apply an approach that combines airborne LiDAR and QuickBird to assess the carbon stored in urban trees of Berlin, Germany, and to identify differences between urban structure types. First, an urban transect in Berlin was selected that reflects common heterogeneous carbon distribution patterns on public and private property. Within this transect, dendrometric parameters were derived and calibrated and the carbon storage for urban structure types was estimated. Finally, an initial carbon storage estimate and distribution for the entire urban area was obtained by extrapolating the results for the urban transect to the entire city of Berlin.

2. Material and Methods
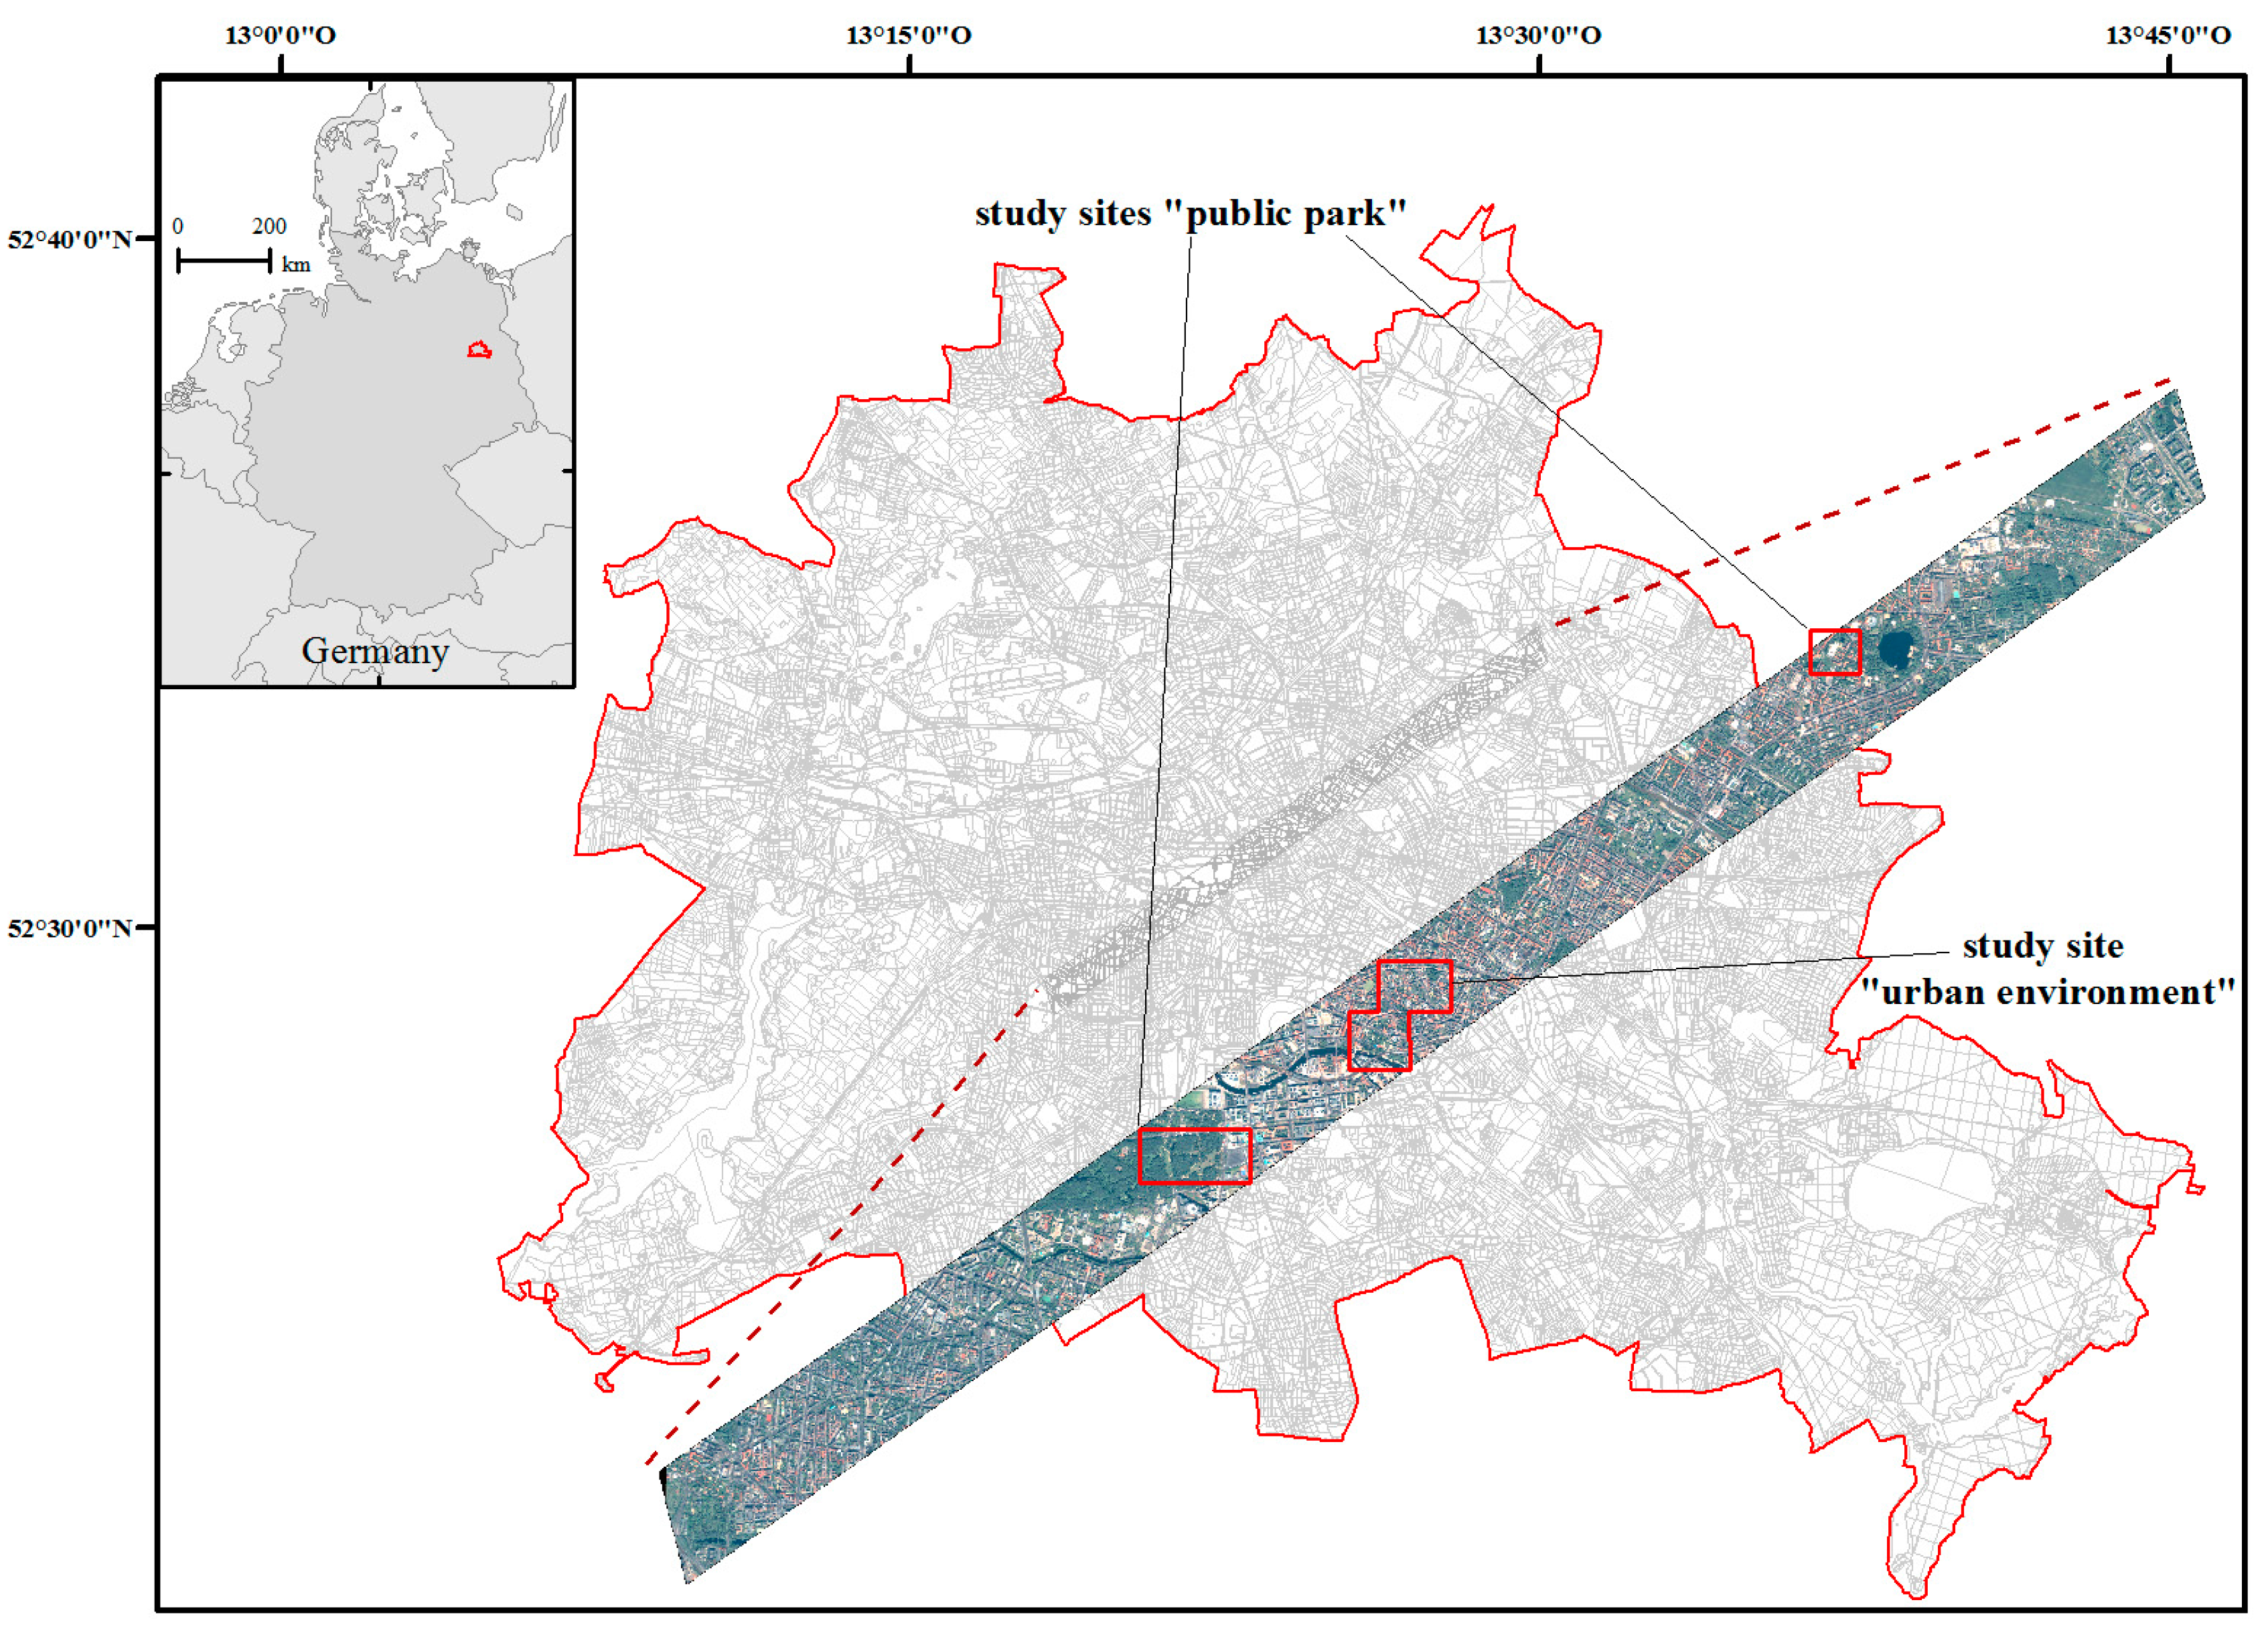
2.1. Study Area

Berlin holds an area of circa 892 km2 of which almost 40% is covered by urban vegetation. Thus, the city comprises the largest urban forest in Germany (~290 km2) [34]. This study focuses on a transect of 15.3 km2 that extends from the Northeast to the Southwest of the city and is characterized by 15 different urban structure types, including street area (Figure 1). About 60% of the transect is private property, with public streets taking up 23%, and public green spaces comprising 17% of the area (Table 1). Sealed surfaces are mixed with various green areas, mainly parks and cemeteries. The central city is characterized by a dense matrix of buildings with five or more stories, mostly constructed in the late 19th and early 20th century, with mixed residential, commercial and/or community use. The outskirts of the city are characterized by complexes of multi-story buildings (up to 20 stories) built since the 1950s and primarily comprised of housing.

2.2. Data and Preprocessing

High resolution multispectral QuickBird and airborne LiDAR data were combined (Table 2) with urban structure type data (Table 1), as well as data from field surveys.
Preprocessed LiDAR height models, a digital surface model (DSM) and a digital terrain model (DTM) were acquired. Both models were based on two wintertime flights from 26–28 November 2007 and from 11–13 January 2008. To derive the height of the surface objects, a normalized Digital Surface Model (nDSM) was calculated by subtracting the DSM from the DTM [35]. Two QuickBird images were used to separate vegetation and artificial area. A multispectral QuickBird image (2.44 m) was pan-sharpened to combine the spectral information of this product with the spatial resolution of a panchromatic image (0.61 m) (Table 2).
Table 1. Building types and structure types within the urban transect (Source: SenStadt 2011).
Building TypeAbbStructure TypeArea
Structure types in predominantly residential use
Block-edge development (1850–1930)S1Late 19th-century block development with wings and rear buildings16.7%
S2Late 19th-century block-edge development with few wings and rear buildings1.2%
S3Late 19th-century block-edge development with major changes5.5%
S41920s and 1930s block-edge development with major changes2.8%
Row & high-rise development (1950–present)S51950s and later row development3.8%
S6Postwar high-rise development0.1%
S71980s and 1990s block-edge and row development in East Berlin5.5%
S8Compact high urban living development of the 1990s0.7%
Development with gardensS9Low Buildings with yards2.6%
S10Villa development with park-like gardens0.2%
Structure types in predominantly commercial, services, small business & industrial use
S11Development with commercial and service use3.9%
S12Low development with small business and industrial use4.1%
S13Heavily built-up with small business and industrial use0.8%
S14Development with public facilities and special use, traffic areas without streets and building lots13.3%
private space 61.3%
Green spaces & streets
S15Green spaces15.5%
S16Streets23.2%
public space38.7%
Figure 1. Urban transect and study sites in the city of Berlin, Germany.
Remotesensing 06 10636 g001
Table 2. Remote sensing data.
ImageryDetails
Airborne LiDAR
- digital surface model (DSM)
- digital terrain model (DTM)
SensorALTM Gemini
Acquiredwintertime 07/08 (leaf-off)
Point densityDSM: 4 points/m2
DTM: 1 point/m2
Swath width0–50°
Wavelength1064 nm
QuickBird satellite
- multispectral image
- panchromatic image
SensorBGIS 2000
AcquiredMay 2009 (leaf-on)
Spatial resolution0.61 m (panchromatic)resampled 1 m (multispectral, pan-sharpened)
Spatial accuracyproduct level 1b (RMSE = 14.00 m)
The pan-sharpened QuickBird image was rectified using 1st order rational polynomial coefficients (RPC), the DSM and 6 additional 3D ground control points (GCPs) to improve the spatial accuracy of default-level 1b imagery (RMSE 1-D = 14 m). The rectified imagery showed a final root-means-square error below 1.9 m (RMSE 1-D). The normalized difference vegetation index (NDVI) was calculated to separate vegetation from artificial surface. For this vegetation mask a threshold of 0.2 was selected, that had been verified with ground-truth data and visual inspection of vegetation [36]. The vegetation mask was smoothed using a 3 × 3 median filter to increase the consistency of the nDSM [16,37]. A tree mask was produced by combining the vegetation mask and a 2 m height threshold of the nDSM, which excluded the majority of trees. Non-tree pixels were set to the value “0” and the vegetation and tree mask were layer-stacked to create a Canopy Height Model (CHM). The vegetation and tree mask were validated by 100 randomly selected points. An overall accuracy of 97% for the vegetation mask and 99% for the tree mask was achieved.
Since complications occurred with artificial objects (e.g., transmission lines) due to mixed pixel problems, these objects were removed by manual filtering of the tree height output using a height threshold of 30 m. Thirty-five samples were taken, in which “trees” with ≥30 m height were compared visually with the QuickBird images. All samples represented not trees but artificial objects. All the remote sensing data used had a common spatial resolution of 1 m (WGS 1984 projection, UTM 33N).
In addition to the remote sensing data, vector data of urban structure types from 2010 were included  [32]. Moreover, two independent tree surveys were conducted in autumn 2011 and summer 2014 to assess ground-truth data for calibration (220 trees) and validation (98 trees) of dendrometric parameters. All data were acquired with high GPS accuracy (Figure 1). In order to allow for comparability between the remote sensing and field data that originate from different years, only reference information on trees that were planted before 2007 were acquired in 2011 and 2014. The selection of trees within the study sites “urban environment” and “public park” reflects the spatial heterogeneity of urban stocks within typical residential areas and public parks. Selected areas comprised public and private property with single, lined and grouped trees. For the trees, diameter at breast height (DBH), or 1.3 m above the ground, was recorded. A tree that covered other tree crowns was defined as dominant.

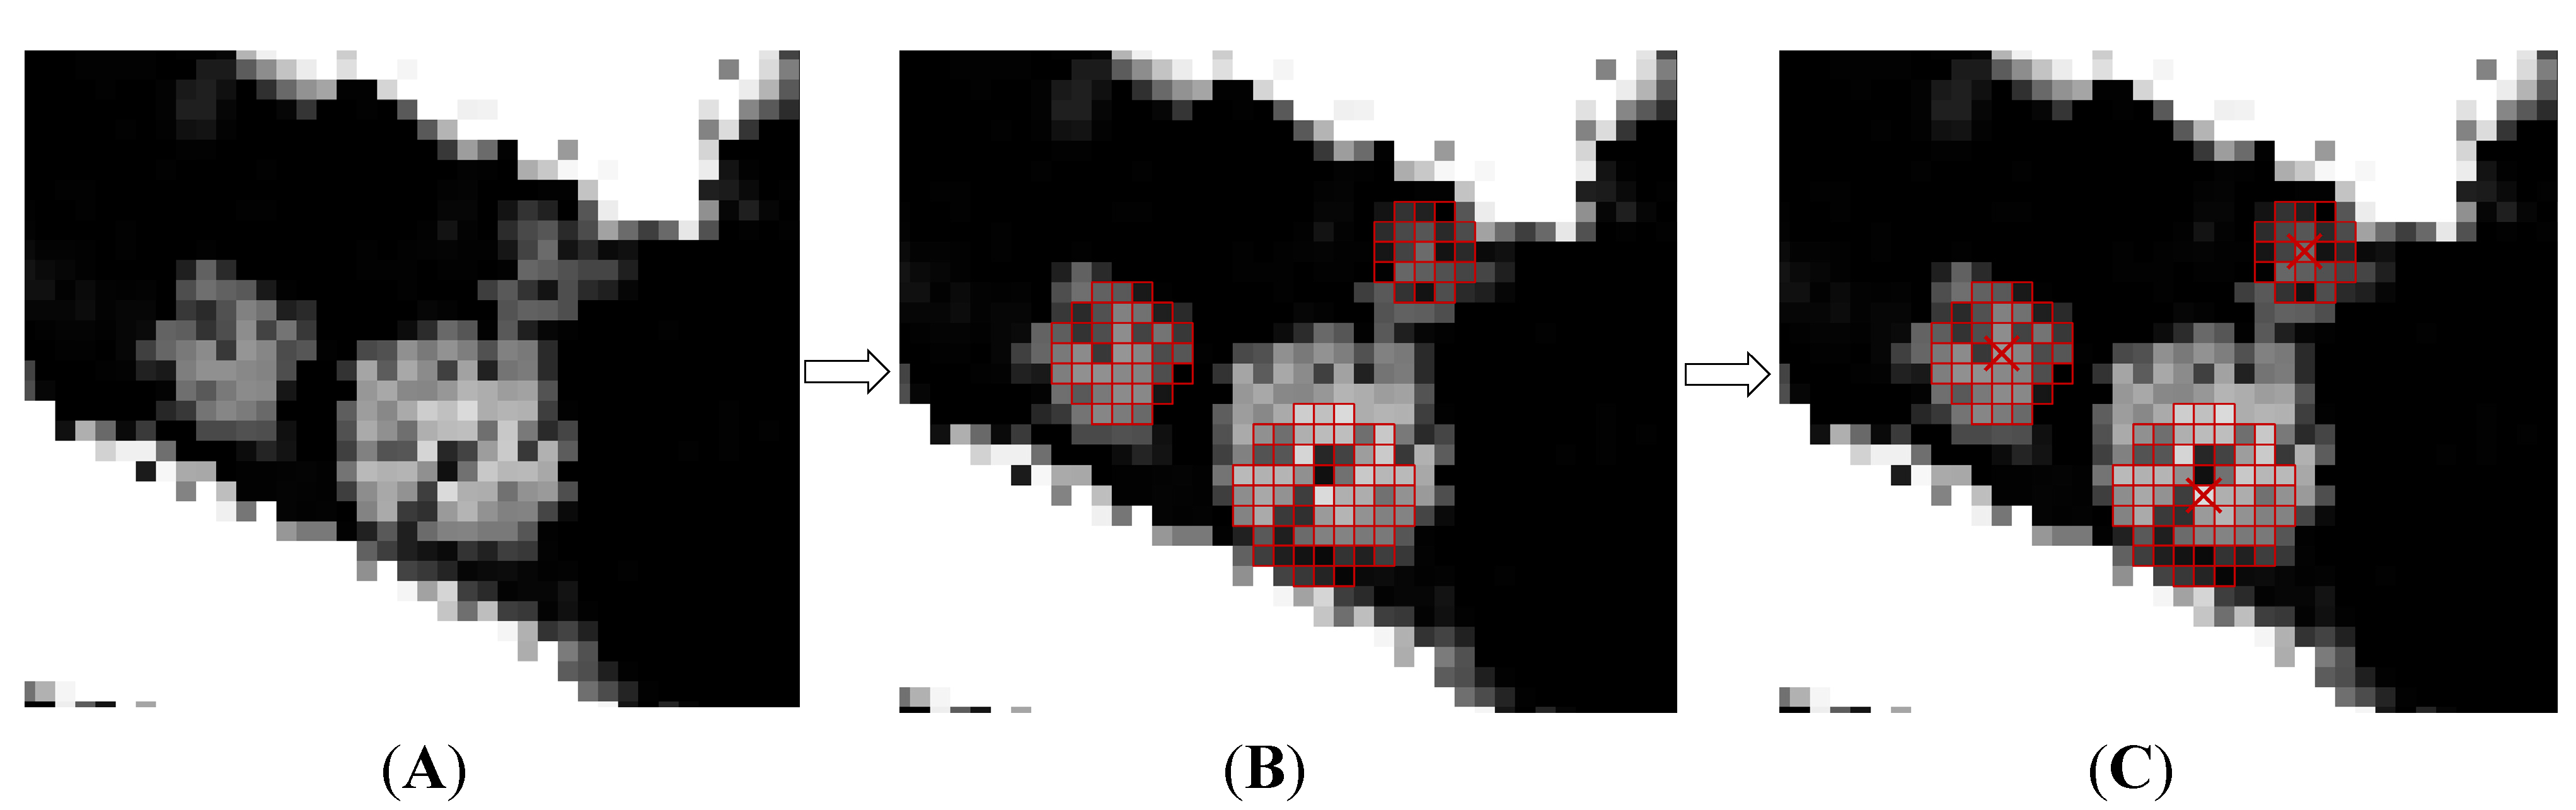
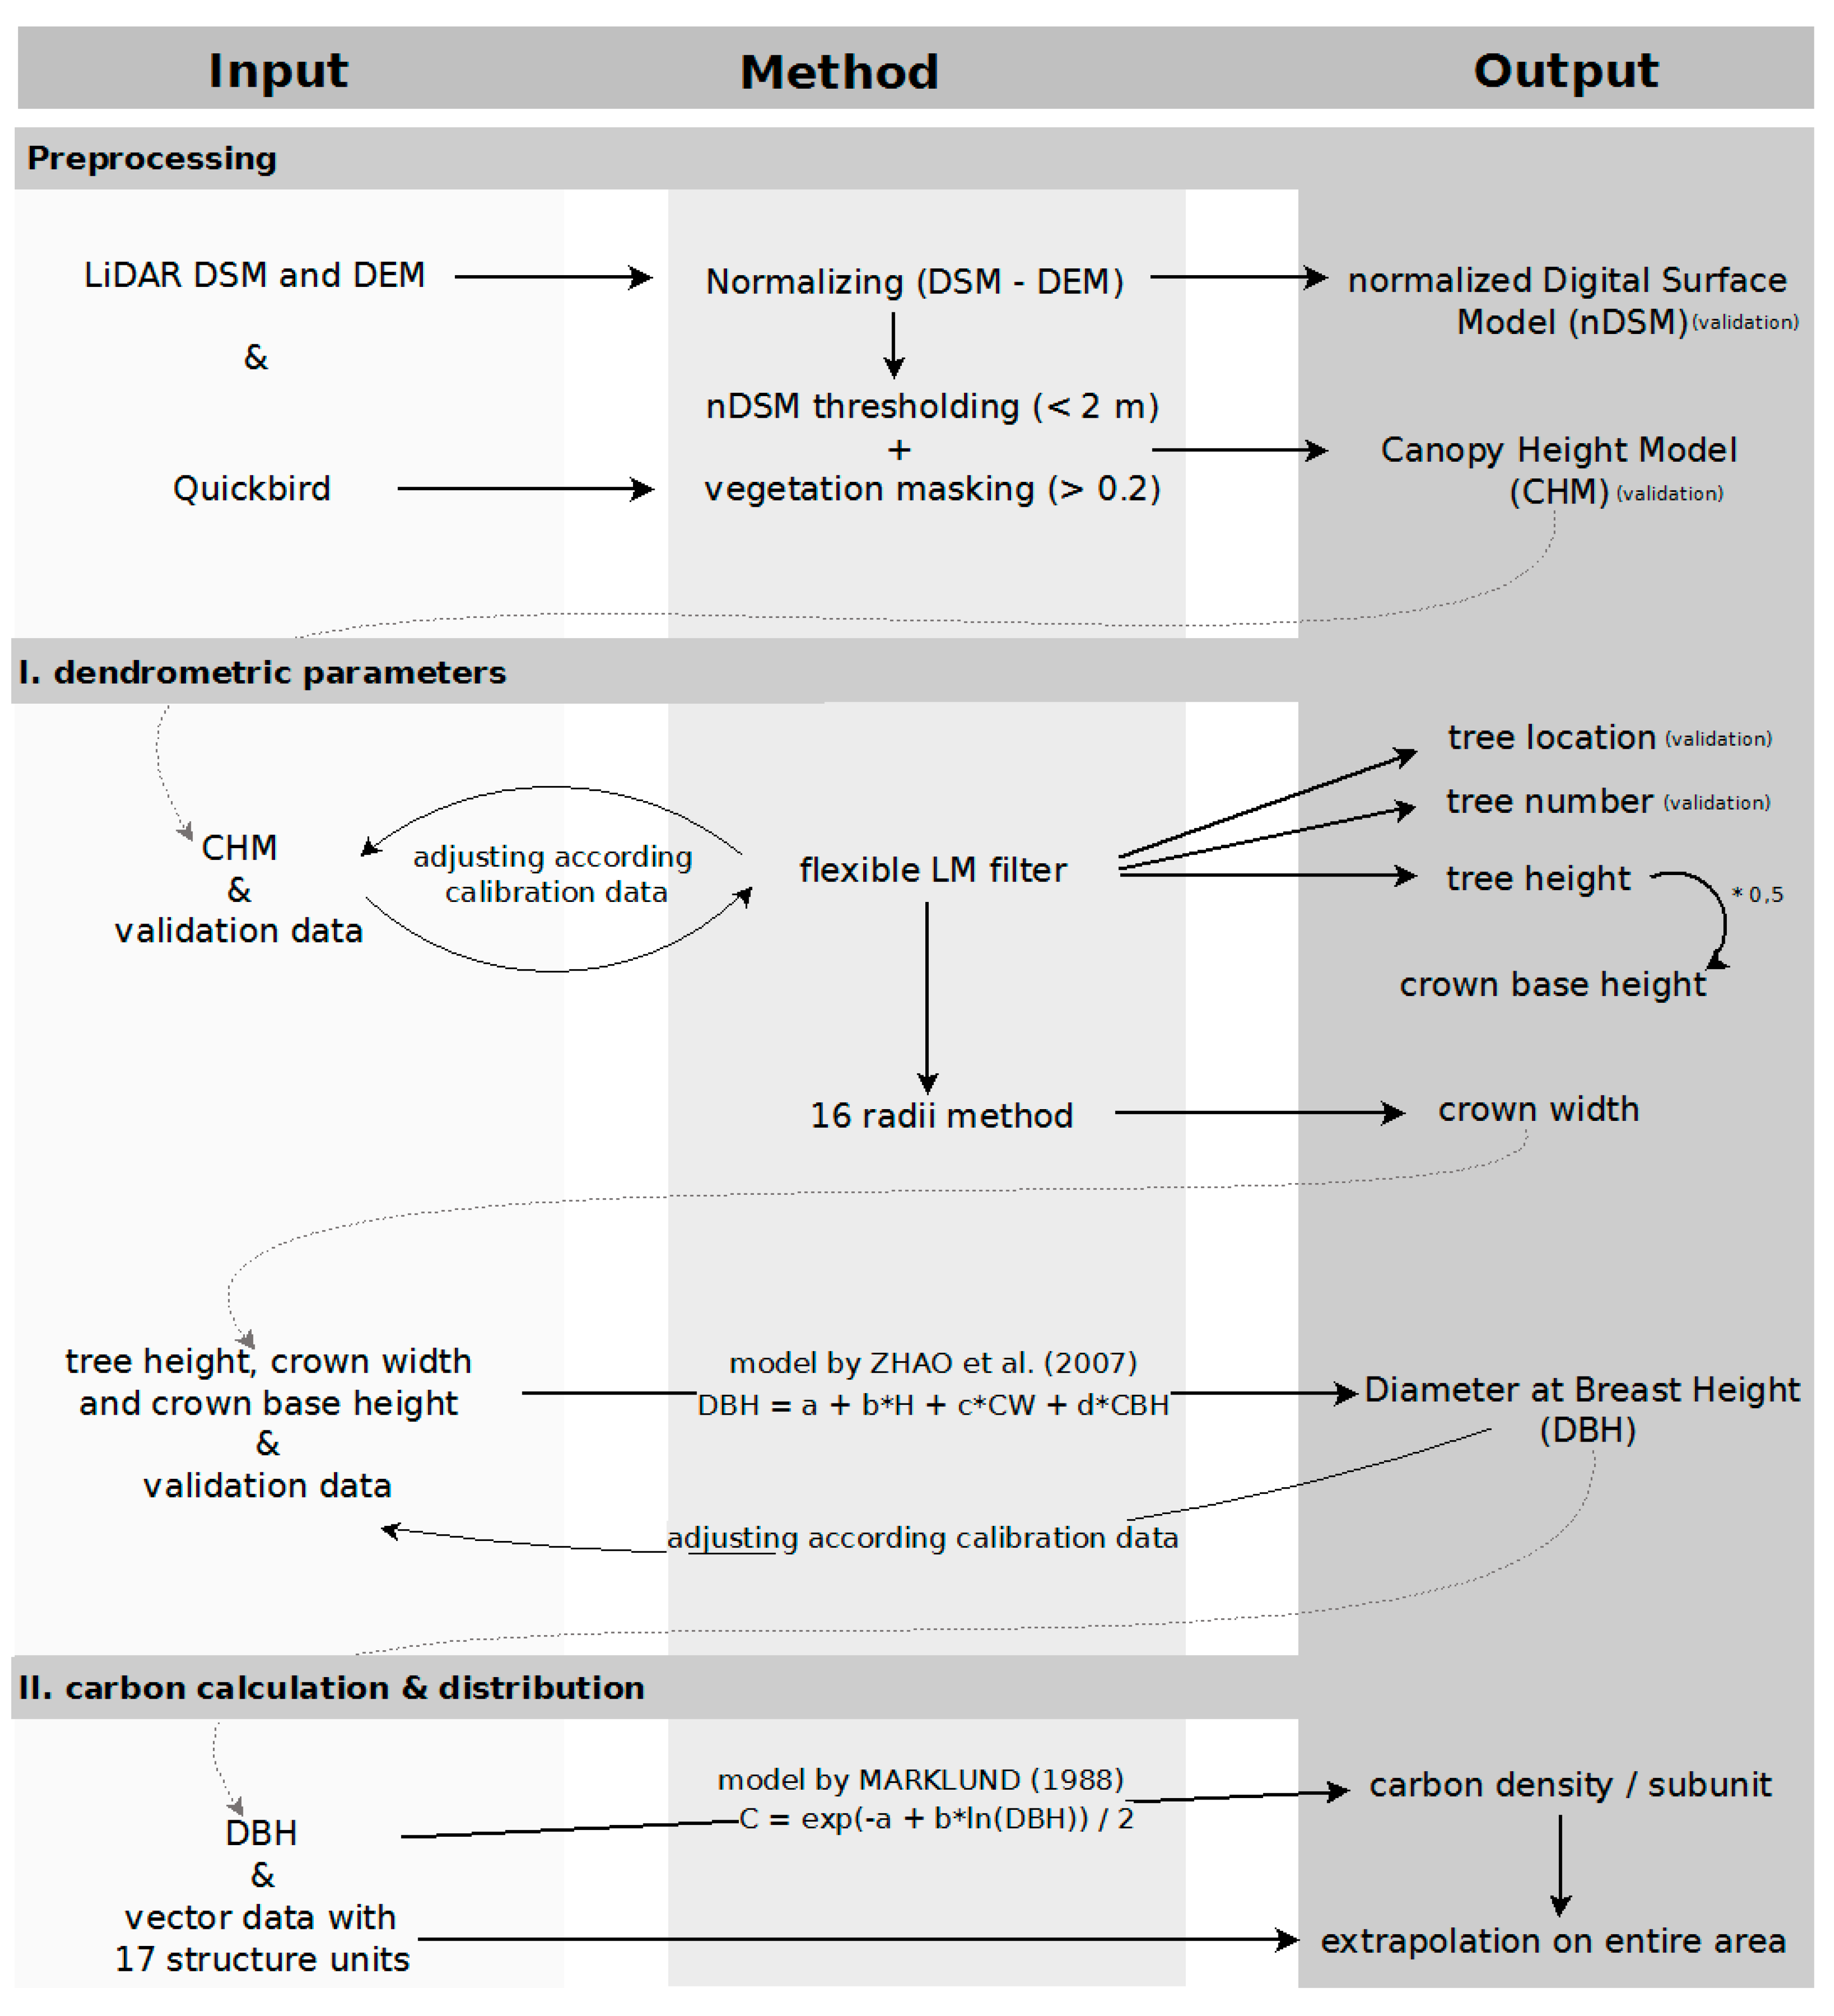
2.3. Analytical Methods

The approach built upon existing methods to estimate the carbon storage of the study area in two main steps [16,31,38,39,40,41]. First, dendrometric parameters (tree height, crown width, crown base height) were derived from the CHM. In addition, all trees were located and counted to assess the total number of trees and the distribution of tree carbon storage in Berlin. To identify tree height, tree locations and total number of trees, local maxima within a moving window were assumed. The moving window shifts over the CHM and identifies the highest z-value within a group of pixels with an odd number (e.g., 3 × 3). This pixel is then assumed to represent the top of a tree crown and can be marked as the position and maximum altitude of a tree. Searching for local maxima via moving windows is a reliable method for detecting tree locations and tree heights. The method is mainly applied in the forestry sector and delivers very good performance in less dense conifer stocks with trees of a similar height [16,26]. In dense stands with various heights the described local maxima algorithm struggles with errors of commission and omission caused by irregular crown shapes and the same filter size for trees with different crown widths. Therefore, Popescu and Wynne [41] developed a flexible filter matrix (Form.1: lm) for vertical and horizontal diverse stands, which can be found on most public parks, graveyards and allotments in Berlin. Because of these similarities this algorithm was chosen for the present study. During application within the CHM, the moving window is adjusted by tree-specific height values (Form.1: H) within the filter matrix   (Figure 2, Step B) and the highest pixel gets stored as the local maxima that represents the tree top and position (Step C, red cross = local maxima).
Figure 2. Functioning of flexible local maxima filter for tree height and location. (A) Canopy height model; (B) Application of height adjusted LM filter; (C) Localization of tree tops.
Remotesensing 06 10636 g002
Constants for deciduous and mixed tree stocks used by Popescu [42] seem the most promising and were both tested within the reference areas. The constants for deciduous trees (3.09632, 0.00895) showed better agreement (81.5%) and thus were used (Form. 1). The single local maxima were stored as individual tree heights.
Remotesensing 06 10636 i001
The methods for assessing crown base heights (CBH) as the distance between the ground and the first living branch on the individual-tree level can be divided into two main approaches: methods that extract vertical profiles [43,44] and voxel-based methods which use the frequency of laser returns within a 3D-space [45,46]. However, these methods require access to the LiDAR point cloud and are computationally intensive for large study areas. Because this study relies on the CHM raster, crown base height was estimated as half the tree height. All described steps are summarized in Figure 3.
Figure 3. Workflow for carbon modeling. (digital surface model = DSM; digital elevation model = DEM; LM = local maxima; DBH = diameter at breast height; H = tree height; CW = crown width; CBH = crown base height; a, b, c & d = constants for mixed boreal forests, C = carbon).
Remotesensing 06 10636 g003
The allometric equation to calculate single tree stem diameter requires the diameter of tree crowns as an input. Most methods for tree crown delineation do not offer the tree crown width as an immediate result, so an unexploited method which has the crown width as a direct output was used [43]. The crown diameters were calculated using the identified local maxima as starting points to extract 16 radii that are 16 cardinal directions radiating from each single tree. A radius was selected when one of the following rules was met: (1) The pixels with the lowest relative height value to the local environment were stored as “local minimums”. If one of the moving radii reached such a pixel, the horizontal distance was outputted as the crown radius. (2) If a sequence of three pixels reached a height less than 66% of the tree height, the horizontal distance from the second point to the local maxima was determined to be the crown radius. Each of the 16 radii was limited by one of these terms and afterwards the tree crown diameter was calculated as the mean of all single-tree profiles (compare also [47]).
The algorithm was implemented with the software FUSION. As a result, the tree locations, the number, and the height of trees were received, as well as the crown base height and crown width. Afterwards the single tree specific diameter at breast height (DBH) was calculated (Form. 2) following Zhao, Popescu and Nelson [40]. The algorithm includes the LiDAR-derived tree height (h), tree crown diameter (CW), crown base height (CBH) and several constants for mixed boreal forests [22].
Remotesensing 06 10636 i002
In comparison to the 220 calibration trees of the first field survey, an underestimation of stem diameter (87%) was derived. A systematic error of underestimation was identified and the ratio of the field-derived and LiDAR-derived DBH was used to calculate a correction factor. A multiplier for the derived diameters was computed by calibrating the average mean value weighted by the number of trees within each area of the field survey (reference areas). First, the average ratios of the reference areas within the central district and the public park were calculated. These ratios (xi) were weighted according to the number of trees within the two reference areas (wi) and were used as an input for calculating an overall weighted arithmetic mean (x) (Moeller 2005). The result (1.36) was applied as a correction factor to all LiDAR-derived diameter at breast height (DBH).
Remotesensing 06 10636 i003
Above-ground carbon storage (cag) from the LiDAR-derived parameters was estimated using an allometric model (Cag = Exp (β and β0) ln dbh) for biomass from Marklund [48] and Marklund and Schoene [49] (Form. 4 & Figure 3, Step II). The function uses the natural logarithm of the previously-calculated DBH and computes the mass of organic material in the trunk, branches and leaves as its exponent of every individual tree. The constants of the equation (β and β0) express the carbon storage of single genera/species and their growth conditions. Since there is no area-wide information on the distribution of genera and species for Berlin, constants on a specified level could not be applied. The large size of the study area did not allow for taking samples of all kinds of the various tree species and to calculate side-specific constants. Genera information listed in the official street tree cadaster from Berlin was used and a similar composition of genera for public and private spaces was assumed. Indigenous genera, including Tilia, Aesculus, Ulmus, Platanus and Robinia, dominate with some additional neophytes, including Magnolia, Junglans or Sorbus (e.g., Sorbus aucuparia). These genera are described by Jenkins’ constants (−2.48 and 2.4835) for mixed deciduous forests of the US [50]. Even though the growth conditions for trees in Jenkins’ study area are different to the ones of Berlin, the authors are not aware of general constants for a similar composition of (urban) trees for European conditions. Thus these numbers represent the best option for the above mentioned genera. The amount of carbon in the dry biomass (with water content <15%) varies between different tree genera and species [51,52] around the value of 50%. Due to the lack of information on the vegetation genus and species, the carbon content in the dry biomass was determined as half of the biomass (Form. 4: expressed by the divisor 2) following previous studies [53,54,55].
Remotesensing 06 10636 i004
To analyze whether carbon storage is linked to urban structure characteristics, the amount of carbon storage was related to the areas of the 16 structure types within the study area. Since the tree characteristics (from visual inspections) and the carbon storage (from own calculations) show only minor variation within a structure type, the urban structure type-specific amount of carbon storage (Csa) was spatially extrapolated to the entire urban area (Cb). To do so, the proportion of the area of each structure type within the transect (STsu) to the overall area of the structure type in the entire study area of Berlin (STb) was calculated (Form. 5). Afterwards, this number was multiplied with the structure type-specific carbon amount to calculate the amount for the entire area of the unit within Berlin.
Cb = STb/STsu × Csa
Finally, the structure types were aggregated to building types (see Table 1) to map the distribution of carbon (Figure 4).

3. Results

3.1. Dendrometric Parameters

In total, 76,690 trees were detected in the entire transect; 65.30% of the trees from the airborne LiDAR data (64 trees) could be assigned to the reference trees (“assignable trees”, Table 3), resulting in a nearly 32% false detection rate of actual tree locations. In comparison, the most trees could be assessed in the Public Park Goldfischteich (72%, 21 of 29 trees) which is characterized by tall trees (up to >25 m) mostly lined-up with great distance to each other in an avenue of the park. Nearly all dominant trees could be identified and correctly localized here (92%, 12 of 13 trees). The identified trees in the public parks James Simon and Monbijou were in dense stands similar to forest areas. Overall, the lowest number of trees could be detected in these two sites (Monbijou: 61% or 11 of 18 trees, James Simon: 67% or 10 of 15 trees). In the Krausnickpark, which is located in a backyard, 75% of the dominant trees could be detected and most trees close to these dominant ones were not identified. In contrast, all of the five trees in a small distance to buildings (2–5 m) could be assigned (Table 3).
For several trees two or three trees were located instead of one. Summed up, in three trees three local maxima were identified and stored as single ones. In six trees two tree tops were detected instead of one per tree.
In the entire transect the average tree height was 8.82 m. It ranged from an 11.66 m average in the green space and the late 19th-century block development with wings and rear buildings, to 5.89 m in 1980s and 1990s block-edge and row development in East Berlin. According to these results, the average crown base height was 4.41 m. The 16 radii method calculated an average crown width of 4.39 m. Similar to the tree heights, the widest mean crown diameter (5.84 m) was located in the green space; the lowest (2.94 m) was measured in areas with predominantly public facilities and special use and traffic areas without streets and building lots.
Table 3. Accuracy of tree assessment.
Field Survey TreesLiDAR TreesAccuracy
Reference areasAll (dominant)AllAssignable trees (dominant)Assignable trees/all treesAssignable dominant trees
Study site “urban environment”
Backyard Krausnickpark 132 (12)29 *22 (9)69%75%
Study sites “public park”
Public Park James Simon15 (6)17 *10 (4)67%67%
Public Park Monbijou18 (6)20 *11 (5)61%83%
Public Park Goldfischteich29 (13)27 *21 (12)72%92%
Sum (no.) or mean value (%)98 (37)9364 (30)65.30%80.10%
* Reference areas with 2 or 3 tops estimated in one tree (Backyard Krausnickpark: 7 tops in 3 trees, Public Park James Simon: 7 tops in 3 trees, Public park Monbijou: 4 tops in 2 trees, Public Park Goldfischteich: 3 tops in 1 tree); 1 The Krausnickpark is a public par located in a backyard. As in a typical Berlin backyard, the tree stock is made of different genus, age and height and trees are often close to buildings.
The derived dendrometric parameters were used as an input for single-tree stem diameter calculation. The results were improved by using a weighted correction factor using 220 calibration trees. As a result of correction, the calculated mean diameter (34.71 cm) was approximated to the reference diameter (40.10 cm) within the reference areas. In the entire transect, the average stem diameter was calculated to be 30.69 cm (σ 6.91 cm). The widest stem diameter was measured in the green spaces (37.25 cm), while the lowest occurred in the 1980s and 1990s block-edge and row developments in East Berlin (27.02 cm).

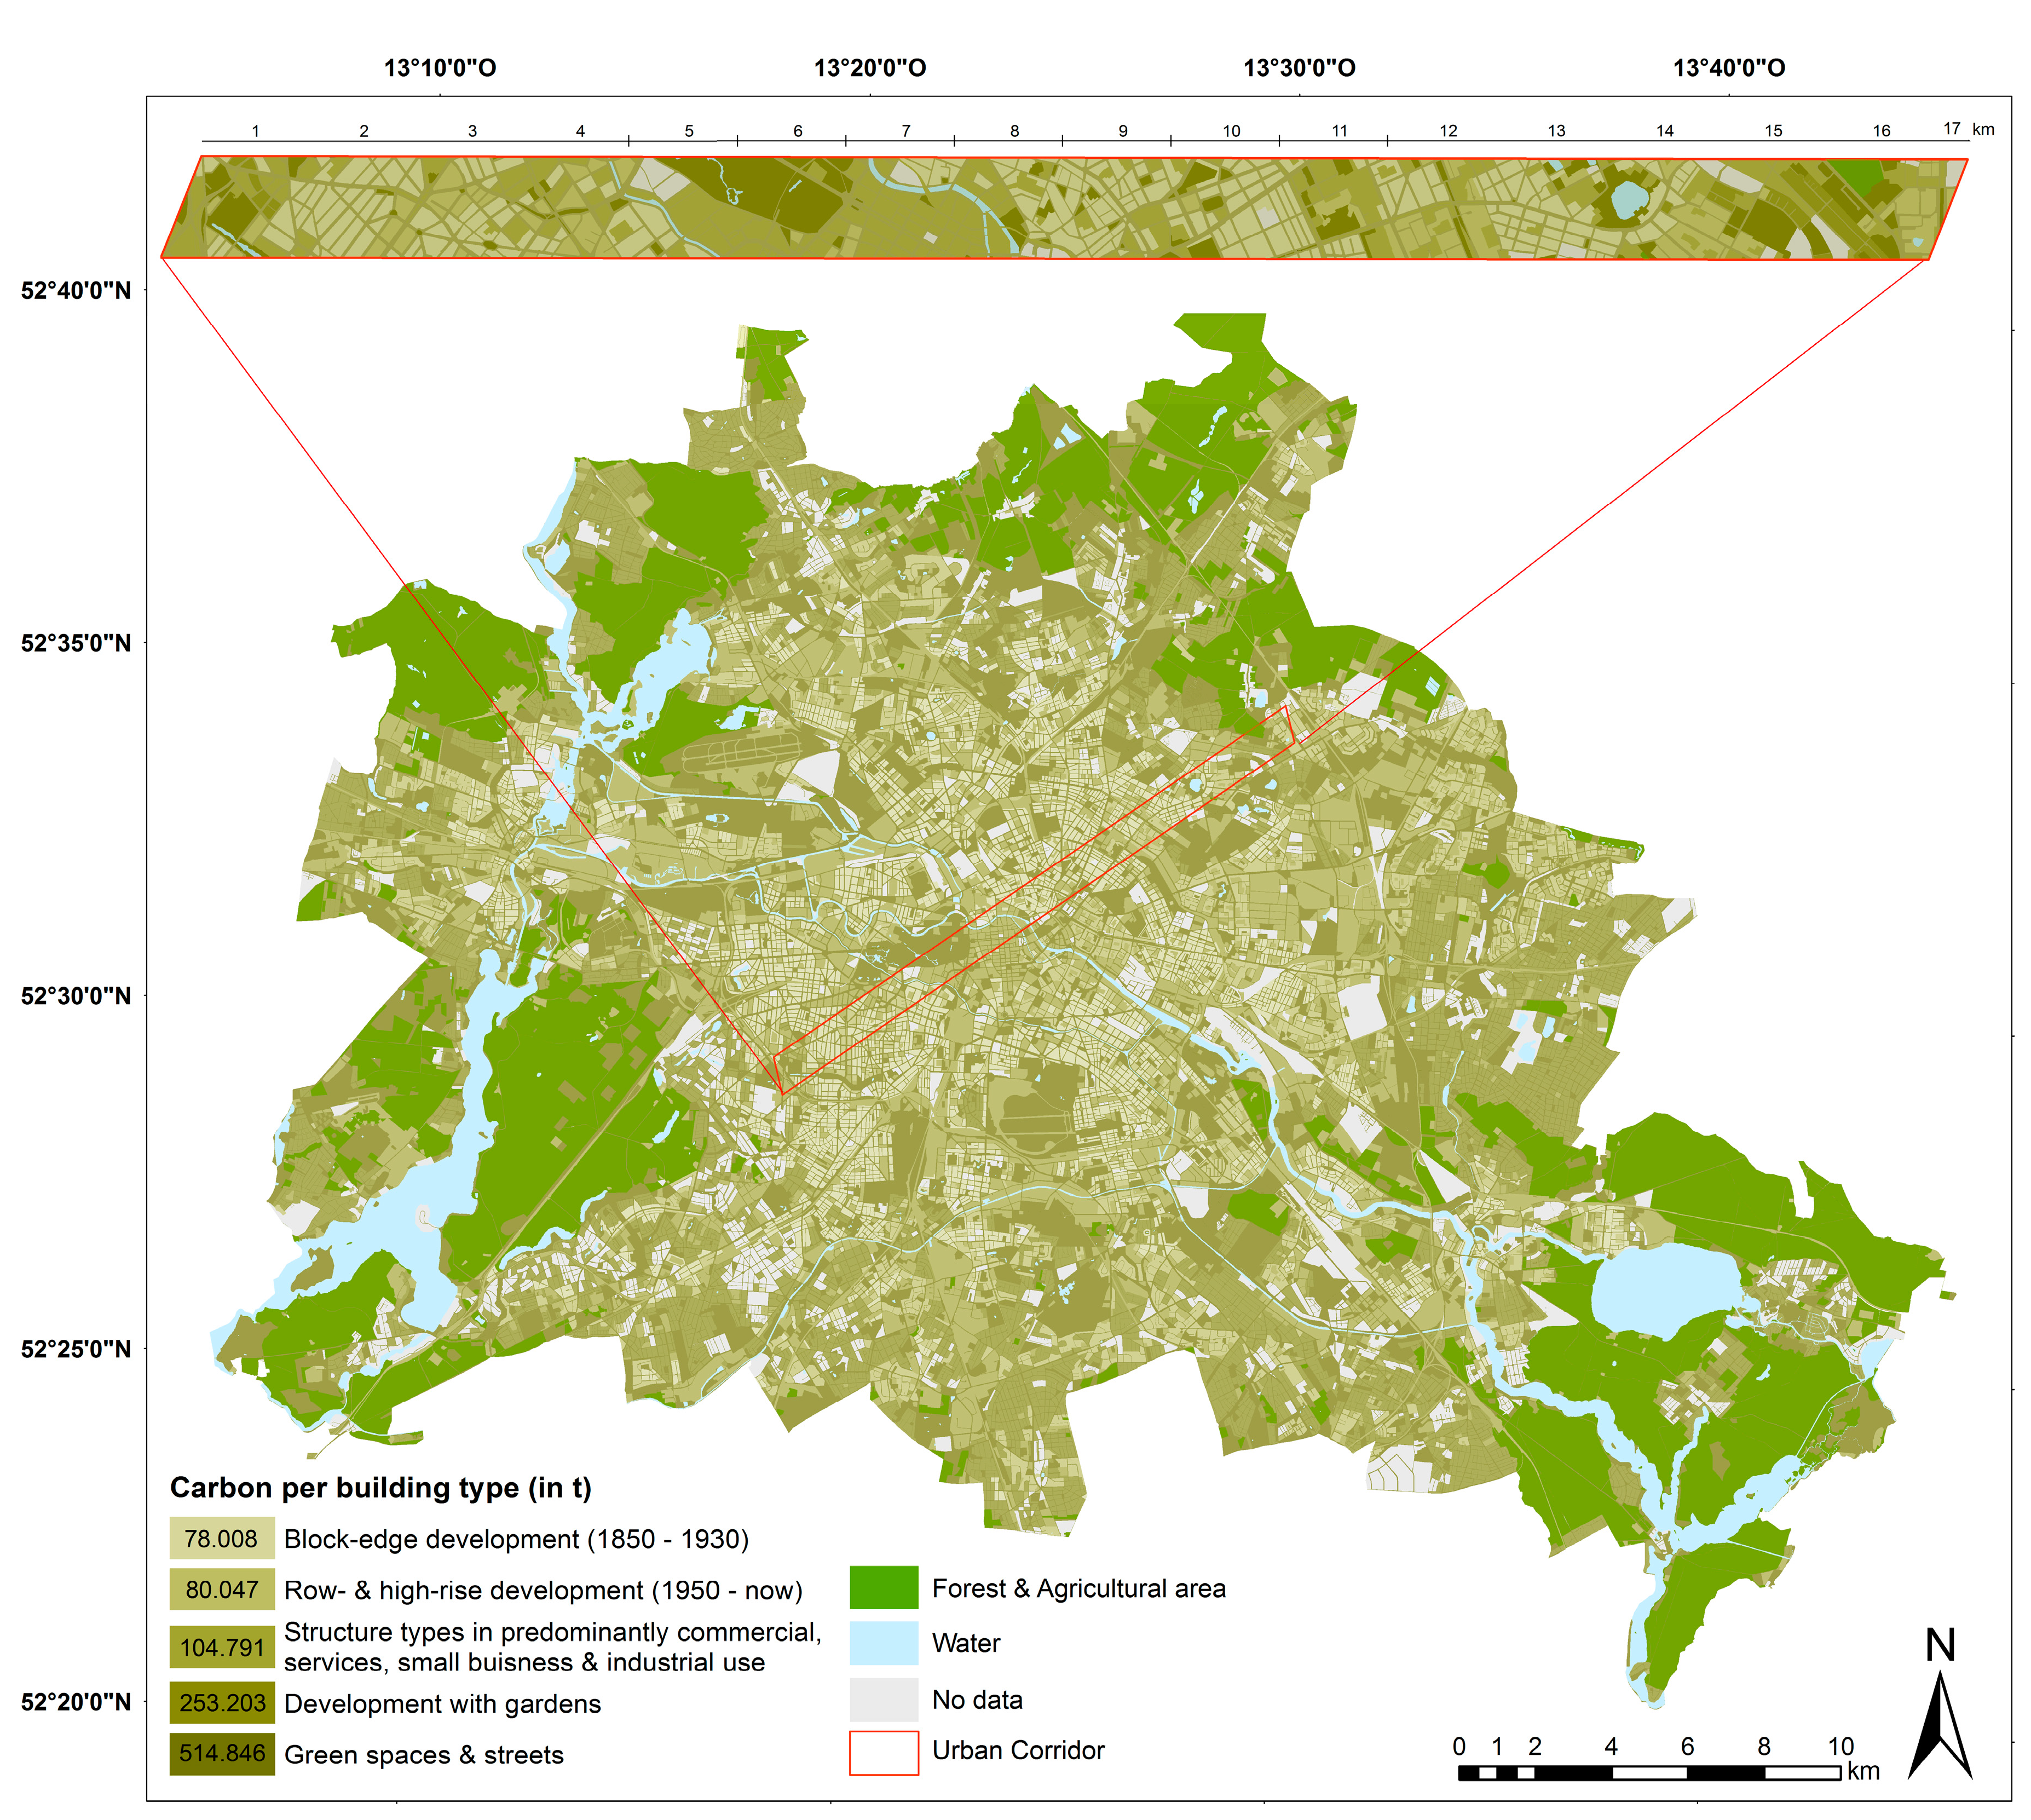
3.2. Carbon Storage and Distribution

The average value for all trees in the transect was 269.98 kg (σ 202.82 kg), resulting in an above-ground carbon storage of 20,964.40 kg (σ 15,550.21 kg). Specific carbon storage capacities for the various structure types were identified (Figure 4). In general, carbon storage is higher in trees in residential as opposed to service, commercial and industrial-use blocks. Green spaces (S15) contain the highest levels of carbon storage related to the area size within the transect. These are followed by block-edge- and row developments from the 1920s–1930s (S4), and low buildings with yards (S9). Without an obvious ranking by architecture and age, the first three places are followed by structure types in predominantly residential areas (in order of relative storage amount: S5, S2, S10, S8, S3, S7). The lowest carbon amount occurs for trees within blocks of predominantly commercial, small business, service, and industrial use, with the exception of areas with public facilities and special use and traffic areas without streets and building lots (S14). Figure 5 outlines the heterogeneity of the different structure units regarding tree sizes. Green spaces share the highest amount of various trees and the highest amount of average carbon storage per tree. All other urban structure types have an average storage amount less than 500 kg/tree.
Figure 4. Extrapolation of carbon storage for the study area of Berlin.
Remotesensing 06 10636 g004
Figure 5. Derived carbon storage per tree (kg) in 16 urban structure types (compare Table 1). The box plots visualize the median, quintiles 1 and 3, maximum and minimum values.
Remotesensing 06 10636 g005

3.3. Carbon Storage for Berlin

In the last step, the results were extrapolated to the entire area of Berlin, which resulted in a total carbon amount of 1,028,427 t with an average amount of 11.53 t/ha. In general, the analysis results concerning the spatial patterns within the study transect can be transferred to the extrapolated results. However, due to the aggregation of single structure types in building types, the ranking appears to be different. Remarkably, carbon storage within the structure types in predominantly commercial, services, small business and industrial use is the third-highest, followed by storage in block-edge and row- and high-rise developments. The division by structure types enables a separation of carbon stocks on public and private property, dividing the urban area into publicly accessible and non-accessible areas. A total of 61.3% of the transect is on private property, including residential housing and developments in commercial, service, industrial and business use, and 38.7% is located on green spaces and streets. Although the private and public spaces vary in size, the trees in the transect (private: 10,589 t, public: 11,043) and the extrapolated area (private: 516,049 t, public: 514,846 t) store a similar amount of carbon.

4. Discussion

This study developed and applied a remote sensing-based approach to assess carbon storage and identify differences between structure units within a heterogeneous transect in Berlin, Germany. The quality of the carbon assessment has to be evaluated according to the accuracy of the dendrometric derivations and in comparison to similar studies since there is no direct validation data for above-ground carbon content in trees available for Berlin. The validation results for tree detection (all detectable trees: 65.30%; dominant detectable trees: 80.10%) seem positive compared to other studies that integrate local maxima filters. Tiede et al. [56] located 51% of all, and 72.2% of the dominant trees by using fixed local maxima filter in natural or near-natural forest conditions; Monnety and Chanussotz [38] located less in a mixed forest (42%). The actual number of trees was slightly underestimated when comparing the number of reference trees (98) with the LiDAR-acquired trees (93). To the 98 reference trees, 64 detected trees could be assigned and in nine of these trees two or three local maxima instead of one were detected, resulting in a detection of 12 false trees. These overestimations were probably a result of rough canopy conditions caused by irregular crown shapes and bifurcations. As a result, the local maxima filter detected two or more peaks [57,58,59]. An increase of the moving window size could not prevent overestimations. In general, a wrong location seems to be less dependent of the area (park, avenue, backyard, streets) than of the site-specific conditions. Isolated trees could be detected with high accuracy, which is likely the main reason for the good overall detection result, and thus indicates the algorithm is suitable for urban applications. Although the validation results in the backyard Krausnickpark has been positive, non-dominant trees in dense stocks and located near rooftops are likely to be overlooked by the local maxima algorithm in several locations of the study transect [12]. These are probably the main reasons for the high underestimations of the reference trees in park groves and backyards and the overall underestimation of 17 trees (93 detected trees − (64 assigned trees + 12 false trees) = 17 trees). To improve the filter results, higher resolution airborne LiDAR data which increase the closeness of the CHM should be tested in future investigations; it is expected that this approach will enhance the localization.
Due to the lack of in-situ reference values for tree height, the results were related to former studies using the same approach that has found an average deviation of about 1.00 m by using the flexible filter matrix [60]. Potential problems measuring height may be the result of mixed pixels, which combine spectral information of small tree crowns with the height information of neighboring rooftops [15,61], and possible false measurements due to disturbed reflection caused by free spaces in the canopy [20,62]. Particularly in non-continuous data, the probability is relatively high that the top of a tree is not “hit” by a laser pulse [59]. This problem is amplified by the foliage condition of the airborne LiDAR data, since the probability of laser pulses penetrating the intermediate region of the branches is higher than in the leafy state [63]. Airborne LiDAR data in leafy conditions, together with additional delineation data (e.g., cadastral data), may improve tree masking and reflectance conditions. The function for calculating tree crown diameter is a new method [47] and has not yet been applied in urban studies. For the present research this approach seems reasonable because it delivers the necessary diameter values for calculating BHD, as opposed to the normally applied watershed segmentation [16,37,64,65]. Popescu, Wynne and Nelson [27] used a similar method and calculated the crown diameter using the average of the extreme values of two 4th degree polynomials and the local minima. As a result, they received an average crown diameter of 5.26 m, which is similar to the average crown diameter (Ø = 4.39 m) calculated in this study. Nevertheless, urban applications of McGaughey’s approach will require further application to derive comparable results.
Concerning the stem diameter, a correcting factor had to be applied because no urban constants were available to complete the previous allometric calculation, according to Zhao, Popescu and Nelson [40]. It is likely that the differences between calculated and measured stem diameter are a result of the generalized derivation of the crown base height. The generalization of the individual crown base height very likely results in a false value on the individual tree level, but seems more reasonable on the transect level, including applicability for various tree sizes.
The results for carbon storage at the individual tree level for the transect (270 kg/tree) are comparable to results from other studies (Table 4). For instance, urban trees in Los Angeles store an average of 329 kg/tree, and in Sacramento 178 kg/tree [66]. Value differences result from varying stock densities, research scales (above-ground carbon content to entire vegetation stock), and different assessment methods. The rather low carbon density of Berlin (13.70 t/ha in transect and 11.53 t/ha for the extrapolated area) is related to the missing storage values for urban forests, which cover an area of 18.3% (163 km2) of the urban area [67]. As this approach was focused on the storage amount and distribution of a typical urban area and also as airborne LiDAR data were not available for the forest areas, the study was limited to Berlin’s urban area. Similar to the calculation of stem diameters, compromises in the biomass/carbon calculations must be made due to the missing constants generated on the species-level, as well as for mid-European climate and urban conditions. Shapes of urban trees may be modified by urban-specific growth conditions such as different nutrient and water availability, light conditions, pollutants and pruning [68,69]. These terms particularly apply to street trees, which occur in 21.88% of the study transect. To increase the comparability between the listed cities in Table 4 it is important to include below-ground carbon assessments in future studies. This calculation was excluded in this study to avoid inaccuracies that would likely increase as a result of modeling below-ground carbon stocks without in-depth knowledge about single trees.
Table 4. Differences in above- and below-ground carbon density of urban trees between cities in Europa, Asia and North America.
CityCarbon Density (t/ha)Carbon StorageReference
Berlin, GER13.70 in transect/11.53 in extrapolationAbove-ground in treesThis study
Karlsruhe, GER32.30Above-ground in treesKändler, Adler and Hellbach [2]
Leipzig, GER11.80Above-ground in treesStrohbach and Haase [8]
Barcelona, ESP11.20Above- and below-ground in treesChaparro and Terradas [70]
Leicester, GBR31.60Above-ground in vegetationDavies, Edmondson, Heinemeyer, Eake and Gaston [7]
Atlanta, US35.74 σ 2.69Above- and below-ground in treesNowak and Crane [5]
Baltimore, US25.28 σ 3.16Above- and below-ground in treesNowak and Crane [5]
Chicago, US14,10 σ 2.14Above- and below-ground in treesNowak and Crane [5]
Jersey City, US5.02 σ 0.68Above- and below-ground in treesNowak and Crane [5]
New York, US15.33 σ 1.89Above- and below-ground in treesNowak and Crane [5]
Sacramento, US46.91 σ 22.64Above- and below-ground in treesMcPherson, et al. [71]
Shenyang, CHN33.22 σ 4.32Above-ground in treesLiu and Li [10]
Beijing, CHN43.70 σ 6.65Above- and below-ground in treesYang, et al. [72]
Until now, only few studies have assessed carbon storage and its distribution in urban trees for European cities using a fully automated approach. Similar to Strohbach and Haase [8], Radford and James [33], and Hutyra, Yoon and Alberti [6] identified a general increase of carbon storage with greater distance to the urban core. Figure 4 reveals that this conclusion can be transferred to the entire urban area with regard to the same exceptions concerning the green spaces. The influence of tree height on carbon storage is evident compared to stock and carbon density and emphasize the benefits of a 3D-based approach. The tree height values differ widely for the streets and the structural types of 1920s–1930s block-edge and row development, low buildings with yards and postwar high-rise developments. The significance of the distribution patterns has to be evaluated in the context of the following potential methodological error. By assuming the same composition of tree species in the entire urban area, the carbon content of certain areas is probably wrongly estimated. The knowledge of the species distribution and the derivation of allometric constants for urban areas are essential for a more accurate analysis. In addition, currently or formerly used airports are also included in the structure unit of green space due to structural unifications; their carbon storage is much lower than the average storage of this unit. Further on, especially in the urban structure unit of the late 19th-century with trees close to dense building designs, overestimations caused by neighboring rooftops are likely to be present.
Even though there are several limitations, most of which are caused by the urban surrounding, heterogeneous vertical structures and the lack of localized constants, our approach demonstrates the usability of a remote sensing-based approach to identify dendrometric parameters in urban areas and to obtain an initial estimation concerning the amount and distribution of carbon storage.

5. Conclusions

This study is one of the few to date that combines remote sensing methods using a combination of airborne LiDAR and QuickBird imagery data with additional field data both to assess above-ground tree carbon storage and to identify patterns of distribution between structure types within a large urban transect. An iterative workflow was used by isolating urban trees, deriving dendrometric parameters at the individual-tree level, calculating carbon storage, and dividing the results into single structure units. The results of this case study demonstrate the usability of a remote sensing-based approach using forestry methods to assess carbon amounts in metropolitan conditions. A high degree of accuracy was attained by deriving tree location and number, with accuracies between 60% and 70%. The best results were achieved for dominant trees (70%–90%) and for isolated trees located far away from surrounding objects. Data-related underestimations and overestimations were likely a result of taller trees covering smaller ones, irregular canopy structures, and spectral mixture with neighbored artificial objects. This study also reveals great differences in carbon storage between different structural units in Berlin. The carbon storage of green spaces, block-edge and row developments from the 1920s and 1930s, as well as low buildings with yards, is higher than the carbon storage of structural types with predominantly commercial, service, trade, and industrial use. This study showed a similar distribution of the tree carbon storage on private and public property within the study corridor and the entire urban area of Berlin, excluding the forested and agricultural used surfaces. Extrapolating the values within the study transect to the entire city level is an initial assessment of real conditions, which can be measured more accurately by single tree storage assessment using airborne LiDAR data on the entire city level. In order to accomplish this and to compare the whole tree carbon storage value of Berlinto other cities, airborne LiDAR data for the entire area of Berlin needs to be acquired. For future assessments, it is of great importance to develop automated methods for identifying tree species to derive city-specific, mid-European allometric equations for the calculation of individual stem diameter and carbon storage.

Acknowledgments

This study was supported by the German Research Foundation (DFG) as part of two graduate programs 1324 “Model-Based Development of Technologies for Self-Organizing Decentralized Information Systems in Disaster Management” (METRIK) and 780 “Perspectives on Urban Ecology”. The authors would like to thank the Berlin Partner GmbH and Virtualcity Systems for providing pre-processed airborne LiDAR data, as well as Thomas Schneider from the Senate administration of Berlin for vector data provision. The authors also thank Dirk Pflugmacher from the Geography Department, Humboldt-Universität zu Berlin, who provided helpful comments on the methodological approach. Moreover, we thank the anonymous reviewers for their very helpful comments on an earlier version of the manuscript.

Author Contributions

Johannes Schreyer developed and applied the methodology and wrote the paper. Jan Tigges contributed to the methodological developing and the data preparation. Galina Churkina reflected on several algorithmic issues. Tobia Lakes supervised the entire process and intensely contributed to manuscript construction and writing.

References

  1. UN. World Urbanization Prospects: The 2009 Revision; United Nations: New York, NY, USA, 2011. [Google Scholar]
  2. Kändler, G.; Adler, P.; Hellbach, A. Wie viel Kohlenstoff speichern Stadtbäume? Eine Fallstudie am Beispiel der Stadt Karlsruhe [How much carbon is stored by urban Trees—A case study from the city of Karlsruhe]. FVA Einblick 2011, 2, 7–10. (In German) [Google Scholar]
  3. Rena, Y.; Weia, X.; Weid, X.; Panb, J. Relationship between vegetation carbon storage and urbanization: A case study of Xiamen, China. For. Ecol. Manag. 2011, 261, 1214–1223. [Google Scholar] [CrossRef]
  4. Nowak, D.J.; Greenfield, E.J.; Hoehn, R.E.; Lapoint, E. Carbon storage and sequestration by trees in urban and community areas of the United States. Environ. Pollut. 2013, 178, 229–236. [Google Scholar] [CrossRef]
  5. Nowak, D.J.; Crane, D.E. Carbon storage and sequestration by urban trees in the USA. Environ. Pollut. 2002, 116, 381–389. [Google Scholar] [CrossRef]
  6. Hutyra, L.R.; Yoon, B.; Alberti, M. Terrestrial carbon stocks across a gradient of urbanization: A study of the Seattle, WA region. Glob. Chang. Biol. 2010, 2, 1–15. [Google Scholar] [CrossRef]
  7. Davies, Z.G.; Edmondson, J.L.; Heinemeyer, A.; Eake, J.R.; Gaston, K.J. Mapping an urban ecosystem service: Quantifying above-ground carbon storage at a city-wide scale. J. Appl. Ecol. 2011, 48, 1125–1134. [Google Scholar] [CrossRef]
  8. Strohbach, M.W.; Haase, D. Above-ground carbon storage by urban trees in Leipzig, Germany: Analysis of patterns in a European city. Landsc. Urban Plan. 2012, 104, 95–104. [Google Scholar] [CrossRef]
  9. Zhao, S.Q.; Zhu, C.; Zhou, D.C.; Huang, D.; Werner, J. Organic Carbon Storage in China’s Urban Areas. PLoS One 2013, 8. [Google Scholar] [CrossRef]
  10. Liu, C.; Li, X. Carbon storage and sequestration by urban forests in Shenyang, China. Urban For. Urban Green. 2012, 11, 121–128. [Google Scholar] [CrossRef]
  11. Heath, L.S.; Smith, J.E.; Skog, K.E.; Nowak, D.J.; Woodall, C.W. Managed Forest Carbon Estimates for the US Greenhouse Gas Inventory. J. For. 2011, 109, 167–173. [Google Scholar]
  12. Huang, Y.; Yu, B.L.; Zhou, J.H.; Hu, C.L.; Tan, W.Q.; Hu, Z.M.; Wu, J.P. Toward automatic estimation of urban green volume using airborne LiDAR data and high resolution Remote Sensing images. Front. Earth Sci. 2013, 7, 43–54. [Google Scholar] [CrossRef]
  13. Imai, Y.; Setojima, M.; Yamagishi, M. Tree-Height Measuring Characteristics of Urban Forests by LiDAR Data Different in Resolution. Available online: http://www.isprs.org/proceedings/XXXV/congress/comm7/papers/100.pdf (accessed on 21 May 2014).
  14. Kim, J.; Müller, J.P. Tree and building detection in dense urban environments using automated processing of IKONOS image and LiDAR data. Int. J. Remote Sens. 2011, 32, 2245–2273. [Google Scholar] [CrossRef]
  15. Hecht, R.; Meinel, G.; Buchroither, M. Estimation of urban green volume based on last pulse LiDAR data at leaf-off aerial flight times. In Proceedings of the 1st EARSeL Workshop of the SIG Urban Remote Sensing, Humboldt University, Berlin, Germany, 2–3 March 2006; pp. 1–8.
  16. Hyyppä, J.; Hyyppä, H.; Leckie, D. Review of methods of small-footprint airborne laser scanning for extracting forest inventory data in boreal forests. Int. J. Remote Sens. 2008, 29, 1339–1366. [Google Scholar] [CrossRef]
  17. MacFaden, S.W.; O’Neil-Dunne, J.P.M.; Royar, A.R.; Lu, J.W.T.; Rundle, A.G. High-resolution tree canopy mapping for New York City using LIDAR and object-based image analysis. J. Appl. Remote Sens. 2012, 6. [Google Scholar] [CrossRef]
  18. McHale, M.R.; Burke, I.C. Lefsky urban forest biomass estimates: Is it important to use allometric relationships developed specifically for urban trees? Urban Ecosyst. 2009, 12, 95–113. [Google Scholar] [CrossRef]
  19. Edson, C.; Wing, M.G. Airborne Light Detection and Ranging (LiDAR) for individual tree stem location, height, and biomass measurements. Remote Sens. 2011, 3, 2494–2528. [Google Scholar] [CrossRef] [Green Version]
  20. Kwak, D.A.; Lee, W.K.; LeeE, J.H.; Biging, G.S.; Gong, P. Detection of individual trees and estimation of tree height using LiDAR data. J. For. Res. 2007, 12, 425–434. [Google Scholar] [CrossRef]
  21. Hyyppä, J.; Inkinen, M. Detection and estimating attributes for single trees using laser scanner. Photogramm. J. Finl. 1999, 16, 27–42. [Google Scholar]
  22. Hyypä, J.; Kelle, O.; Lejikonen, M.; Inkinen, M. A segmentation-based method to retrieve stem volume estimates from 3-D tree height models produced by laser scanners. IEEE Trans. Geosci. Remote Sens. 2001, 39, 969–975. [Google Scholar] [CrossRef]
  23. Brandtberg, T. Automatic Individual Tree-Based Analysis of High Spatial Resolution Remotely Sensed Data. Ph.D. Thesis, Swedish University of Agricultural Sciences, Uppsala, Sweden, 1999. [Google Scholar]
  24. Ziegler, M.; Konrad, H.; Hofrichter, J.; Wimmer, A.; Ruppert, G.S.; Schardt, M.; Hyyppae, J.M. Assessment of forest attributes and single-tree segmentation by means of laser scanning. Proc. SPIE 2000, 4035, 73–84. [Google Scholar]
  25. Morsdorf, F.; Meier, E.; Kotz, B.; Itten, K.I.; Dobbertin, M.; Allgower, B. LIDAR-based geometric reconstruction of boreal type forest stands at single tree level for forest and wildland fire management. Remote Sens. Environ. 2004, 92, 353–362. [Google Scholar] [CrossRef]
  26. Solberg, S.; Naesset, E.; Hanssen, K.H.; Christiansen, E. Mapping defoliation during a severe insect attack on Scots pine using airborne laser scanning. Remote Sens. Environ. 2006, 102, 364–376. [Google Scholar] [CrossRef]
  27. Popescu, S.C.; Wynne, R.; Nelson, R. Measuring individual tree crown diameter with LiDAR and assessing its influence on estimating forest volume and biomass. Can. J. Remote Sens. 2003, 29, 564–577. [Google Scholar] [CrossRef]
  28. Persson, A.; Holmgren, J.; Soderman, U. Detecting and measuring individual trees using an airborne laser scanner. Photogramm. Eng. Remote Sens. 2002, 68, 925–932. [Google Scholar]
  29. Secord, J.; Zakhor, A. Tree detection in urban regions using aerial LiDAR and image data. IEEE Geosci. Remote Sens. Lett. 2007, 4, 196–200. [Google Scholar] [CrossRef]
  30. Tseng, Y.H.; Hsiao, C.Y. Estimation of urban tree canopy volume using airborne LiDAR data and remote sensing imagery: A case study on the NCKU campus. In Proceedings of the 8th Asian Conference on Remote Sensing 2007 (ACRS 2007), Kuala Lumpur, Malaysia, 12–16 November 2007; pp. 1–6.
  31. Qiu, F. LiDAR and hyperspectral imagery based urban tree inventory. In Proceedings of the Sustainable Communities Conference, Dallas, TX, USA, 9–11 March 2009; p. 50.
  32. Senatsverwaltung für Stadtentwicklung und Umwelt Berlin (SenStadt). Umweltatlas-06. Flächennutzung. [Senate administration of Berlin. Atlas of environment-06. Land use]. . Available online: http://www.stadtentwicklung.berlin.de/umwelt/umweltatlas/dinh_06.htm (accessed on 20 August 2013).
  33. Radford, K.G.; James, P. Changes in the value of ecosystem services along a rural–urban gradient: A case study of Greater Manchester, UK. Landsc. Urban Plan. 2013, 109, 117–127. [Google Scholar] [CrossRef]
  34. Amt für Statistik Berlin-Brandenburg. Statistisches Jahrbuch 2013 Berlin-Brandenburg; [Agency of statistics. Yearbook of statistics 2013 for Berlin-Brandenburg]; Amt für Statistik Berlin-Brandenburg: Potsdam, Germany, 2013. [Google Scholar]
  35. Hyyppä, J.; Hyyppä, H.; Litkey, P.; Yu, X.; Haggren, H.; Rönnholm, P.; Pyysalo, U.; Pitkänen, J.; Maltamo, M. Algorithms and methods of airborne laserscanning for forset measurements. Int. Arch. Photogramm. Remote Sens. Spat. Inf. Sci. 2004, 36, 82–89. [Google Scholar]
  36. Demir, N.; Baltsavias, E.; Poli, D. Extraction of trees and buildings using images and LiDAR data. Int. Arch. Photogramm. Remote Sens. Spat. Inf. Sci. 2008, 37, 313–318. [Google Scholar]
  37. Larsen, M.; Eriksson, M.; Descombes, X.; Perrin, G.; Brandtberg, T.; Gougeon, F.A. Comparison of six individual tree crown detection algorithms evaluated under varying forest conditions. Int. J. Remote Sens. 2011, 32, 5827–5852. [Google Scholar] [CrossRef]
  38. Monnety, J,-M.; Chanussotz, R. Tree top detection using local maxima fltering: A parameter sensitivity analysis. In Proceedings of the Silvilaser 2010, 10th International Conference on LiDAR Applications for Assessing Forest Ecosystems, Freiburg, Germany, 14–17 September 2010.
  39. Wulder, M.A.; Bater, C.W.; Coops, N.C.; Hilker, T.; White, J.C. The role of LiDAR in sustainable forest management. For. Chron. 2008, 84, 807–826. [Google Scholar] [CrossRef]
  40. Zhao, K.; Popescu, S.; Nelson, R. LiDAR remote sensing of forest biomass: A scale-invariant estimation approach using airborne lasers. Remote Sens. Environ. 2007, 113, 182–196. [Google Scholar] [CrossRef]
  41. Popescu, S.C.; Wynne, R.H. Seeing the trees in the forest: Using LiDAR and multispectral data fusion with local filtering and variable window size for estimating tree height. Photogramm. Eng. Remote Sens. 2004, 70, 589–604. [Google Scholar] [CrossRef]
  42. Popescu, S.C. Estimating Plot-Level Forest Biophysical Parameters Using Small Footprint Airborne LiDAR Measurements. Available online: http://scholar.lib.vt.edu/theses/available/etd-04222002-111533/unrestricted/SorinPopescu_Dissertation.pdf (accessed on 12 April 2012).
  43. Holmgren, J.; Persson, Å. Identifying species of individual trees using airborne laser scanner. Remote Sens. Environ. 2004, 90, 415–423. [Google Scholar]
  44. Reutebuch, S.E.; Andersen, H.-E.; McGaughey, R.J. Light Detection and Ranging (LiDAR): an emerging tool for multiple resource inventory. J. Forest. 2005, 103, 286–292. [Google Scholar]
  45. Wu, B.; Yu, B.L.; Yue, W.H.; Shu, S.; Tan, W.Q.; Hu, C.L.; Huang, Y.; Wu, J.P.; Liu, H.X. A voxel-based method for automated identification and morphological parameters estimation of individual street trees from mobile laser scanning data. Remote Sens. 2013, 5, 584–611. [Google Scholar] [CrossRef]
  46. Popescu, S.C.; Zhao, K. A voxel-based LiDAR method for estimating crown base height for deciduous and pine trees. Remote Sens. Environ. 2008, 112, 767–781. [Google Scholar] [CrossRef]
  47. McGaughey, R.J. FUSION/LDV: Software for LiDAR Data Analysis and Visualization; U.S. Department of Agriculture, Pacific Northwest Research Station: Washington, DC, USA, 2014. [Google Scholar]
  48. Marklund, L.G. Biomass Functions for Pine, Spruce and Birch in Sweden; Report 45; Department of Forest Survey, Swedish University of Agricultural Sciences: Umea, Sweden, 1988. [Google Scholar]
  49. Marklund, L.G.; Schoene, D. Global Assessment of Growing Stock, Biomass and Carbon Stock; Forest Resources Assessment Working Paper 106/E; Forest Resources Assessment Programme: Rome, Italy, 2006. [Google Scholar]
  50. Jenkins, J.C.; Chojnacky, D.C.; Heath, L.S.; Birdsey, R.A. Comprehensive Database of Diameter-Based Biomass Regressions for North American Tree Species; U.S. Department of Agriculture: Washington, DC, USA, 2004. [Google Scholar]
  51. Brack, C.L. Pollution mitigation and carbon sequestration by an urban forest. Environ. Pollut. 2002, 116, 195–200. [Google Scholar] [CrossRef]
  52. García, M.; Riaño, D.; Chuvieco, E.; Danson, F.M. Estimating biomass carbon stocks for a Mediterranean forest in central Spain using LiDAR height and intensity data. Remote Sens. Environ. 2010, 114, 816–830. [Google Scholar] [CrossRef]
  53. Specht, A.; West, P.W. Estimation of biomass and sequestered carbon on farm forest plantations in northern New South Wales, Australia. Biomass Bioenergy 2003, 25, 363–379. [Google Scholar] [CrossRef]
  54. Muukonen, P. Generalized allometric volume and biomass equations for some tree species in Europe. Eur. J. For. Res. 2007, 126, 157–166. [Google Scholar] [CrossRef]
  55. Zell, J. Methoden für die Ermittlung, Modellierung und Prognose der Kohlenstoffspeicherung in Wäldern auf Grundlage permanenter Großrauminventuren (Methodologies for the Identification, Modeling and Forecasting of Carbon Storage in Forests on the Basis of Permanent Inventories); Albert-Ludwigs-Universität: Freiburg im Breisgau, Germany, 2008. [Google Scholar]
  56. Tiede, D.; Hochleitner, G.; Blaschke, T. A full GIS-based workflow for tree identification and tree crown delineation using Laser scanning. In Proceedings of the ISPRS Workshop, CMRT 05, Vienna, Austria, 29–30 August 2005; pp. 9–14.
  57. Vauhkonen, J.; Ene, L.; Gupta, S.; Heinzel, J.; Holmgren, J.; Pitkänen, J.; Solberg, S.; Wang, Y.; Weinacker, H.; Hauglin, K.M.; et al. Comparative testing of single-tree detection algorithms under different types of forest. Forestry 2012, 85, 27–40. [Google Scholar]
  58. Shan, J.; Sampath, A. Urban Terrain and building extraction from airborne laser scanning. In Urban Remote Sensing; Weng, Q., Quattrochi, D.A., Eds.; CRS Press: West Lafayette, IN, USA, 2006; pp. 21–42. [Google Scholar]
  59. Lehrbass, B.; Wang, J.F. Urban tree cover mapping with relief-corrected aerial imagery and LiDAR. Photogramm. Eng. Remote Sens. 2012, 78, 473–484. [Google Scholar] [CrossRef]
  60. Kaartinen, H.; Hyyppä, J.; Yu, X.; Vastaranta, M.; Hyyppä, H.; Kukko, A.; Holopainen, M.; Heipke, C.; Hirschmugl, M.; Morsdorf, F.; et al. An international comparison of individual tree detection and extraction using airborne laser scanning. Remote Sens. 2012, 4, 950–974. [Google Scholar]
  61. Singh, K.K.; Vogler, J.B.; Shoemaker, D.A.; Meentemeyer, R.K. LiDAR-landsat data fusion for large-area assessment of urban land cover: Balancing spatial resolution, data volume and mapping accuracy. ISPRS J. Photogramm. Remote Sens. 2012, 74, 110–121. [Google Scholar] [CrossRef]
  62. Heurich, M.; Schadeck, S. Forest perameter deriviation from DTM/DSM generated from LiDAR and digital modular camera. Remote Sens. Environ. 2004, XXXV, 84–89. [Google Scholar]
  63. Liu, X.Y. Airborne LiDAR for DEM generation: some critical issues. Prog. Phys. Geogr. 2008, 32, 31–49. [Google Scholar] [CrossRef]
  64. Ke, Y.H.; Quackenbush, L.J. A review of methods for automatic individual tree-crown detection and delineation from passive remote sensing. Int. J. Remote Sens. 2011, 32, 4725–4747. [Google Scholar] [CrossRef]
  65. Rahman, M.Z.A.; Gorte, B. Individual tree detection based on densities of high points of high resolution ariborne data. In GEOBIA 2008—Pixels, Objects, Intelligence—GEOgraphic Object Based Image Analysis for the 21st Century; Hay, G.J., Blaschke, T., Marceau, D., Eds.; International Society for Photogrammetry and Remote Sensing: Calgary, AB, Canada, 2008; Volume Voulume 38. [Google Scholar]
  66. McPherson, E.G.; Xiao, Q.; Aguaron, E. A new approach to quantify and map carbon stored, sequestered and emissions avoided by urban forests. Landsc. Urban Plan. 2013, 120, 70–84. [Google Scholar] [CrossRef]
  67. Statistisches Bundesamt (Destatis). Landwirtschaftliche Bodennutzung und pflanzliche Erzeugung; [Federal Statistical Office. Land use and crop production]; Federal Statistical Office (Destatis): Wiesbaden, Germany, 2013. [Google Scholar]
  68. Nowak, D.J. Atmospheric carbon reduction by urban trees. J. Environ. Manag. 1992, 37, 207–217. [Google Scholar] [CrossRef]
  69. Sukopp, H. Stadtökologie—Das Beispiel Berlin [Urban Ecology—The Case Study of Berlin]; Sukopp, H., Ed.; Reimer Verlag: Berlin, Germany, 1990. [Google Scholar]
  70. Chaparro, L.; Terradas, J. Ecological Services of Urban Forest in Barcelona; Àrea de Medi Ambient Institut Municipal de Parcs i Jardins: Ajuntament de Barcelona, Spain, 2009. [Google Scholar]
  71. McPherson, E.G.; Simpson, J.R.; Station, P.S.R. Carbon Dioxide Reduction through Urban Forestry: Guidelines for Professional and Volunteer Tree Planters; U.S. Dept. of Agriculture, Forest Service, Pacific Southwest Research Station: Wshington, DC, USA, 1999. [Google Scholar]
  72. Yang, J.; McBride, J.; Zhou, J.; Sun, Z. The urban forest in Beijing and its role in air pollution reduction. Urban For. Urban Green. 2005, 3, 65–78. [Google Scholar] [CrossRef]

