Article

Combination of Conventional and Advanced DInSAR to Monitor Very Fast Mining Subsidence with TerraSAR-X Data: Bytom City (Poland)

by
Maria Przyłucka
1,2,*,
Gerardo Herrera
2,3,4,
Marek Graniczny
1,
Davide Colombo
5 and
Marta Béjar-Pizarro
2,3,4
1
Polish Geological Institute—National Research Institute, Rakowiecka no. 4, 00-975 Warsaw, Poland
2
Earth Observation and Geohazards Expert Group (EOEG), EuroGeoSurveys, the Geological Surveys of Europe, 36-38, Rue Joseph II, 1000 Brussels, Belgium
3
Geohazards InSAR Laboratory and Modeling group (InSARlab), Geoscience Research Department, Geological Survey of Spain (IGME), Alenza 1, E-28003 Madrid, Spain
4
Radar Interferometry Terrain Motion Research Unit (UNIRAD, IGME-UA), University of Alicante, P.O. Box 99, E-03080 Alicante, Spain
5
Tele-Rilevamento Europa—T.R.E. s.r.l., Ripa di Porta Ticinese, 79, I-20143 Milan, Italy
*
Author to whom correspondence should be addressed.
Remote Sens. 2015, 7(5), 5300-5328; https://0-doi-org.brum.beds.ac.uk/10.3390/rs70505300
Submission received: 12 September 2014 / Revised: 17 April 2015 / Accepted: 22 April 2015 / Published: 27 April 2015

Abstract

:
In this work, the analysis of TerraSAR-X satellite images combining both conventional and advanced Differential Synthetic Aperture Radar Interferometry (DInSAR) approaches has proven to be effective to detect and monitor fast evolving mining subsidence on urban areas in the Upper Silesian Coal Basin (Poland). This region accounts for almost three million inhabitants where mining subsidence has produced severe damage to urban structures and infrastructures in recent years. Conventional DInSAR approach was used to generate 28 differential interferograms between 5 July 2011 and 21 June 2012 identifying 31 subsidence troughs that account up to 245 mm of displacement in 54 days (equivalent to 1660 mm/year). SqueeSARTM processing yielded a very dense measurement point distribution, failing to detect faster displacements than 330 mm/year, which occur within the subsidence troughs detected with conventional DInSAR. Despite this limitation, this approach was useful to delimit stable areas where mining activities are not conducted and areas affected by residual subsidence surrounding the detected subsidence troughs. These residual subsidence mining areas are located approximately 1 km away from the 31 detected subsidence troughs and account for a subsidence rate greater than 17 mm/year on average. The validation of this methodology has been performed over Bytom City were underground mining activity produced severe damages in August 2011. Conventional DInSAR permitted to successfully map subsidence troughs between July and August 2011 that coincide spatially and temporally with the evolution of underground mining excavations, as well as with the demolition of 28 buildings of Karb district. Additionally, SqueeSARTM displacement estimates were useful to delimit an area of 8.3 km2 of Bytom city that is affected by a residual mining subsidence greater than 5 mm/year and could potentially suffer damages in the midterm. The comparison between geodetic data and SqueeSARTM for the common monitoring period yields and average absolute difference of 7 mm/year, which represents 14% of the average displacement rate measured by the geodetic benchmarks. These results demonstrate that the combined exploitation of high-resolution satellite SAR data through both conventional and advanced DInSAR techniques could be crucial to monitor fast evolving mining subsidence, which may severely impact highly populated mining areas such as the Upper Silesia Coal Basin (USCB).

Graphical Abstract

1. Introduction

Subsidence is one of the most important hazards related to underground mining activities. Ground surface displacement is triggered due to the excavation or failure of mining exploitations, and may produce severe damages to urban structures and infrastructures located within the area of exploitation. The impact of mining subsidence depends on many factors related to the type and the size of the mine, the type and the size of the structure, as well as the subsidence rate itself. Due to their complexity, values of critical ground movements have not been determined analytically. Instead, most of the established criteria to assess subsidence impact are based on empirical observation of ground movements and building damages [1]. Subsidence resulting from longwall coal mining follows the advance of the working face and is immediate. The surface area potentially affected by mining subsidence, subsidence trough, is greater than the area worked in the seam. The boundary of this surface is defined by the angle of draw or angle of influence, which extends upwards and outwards from the working face and varies from 8° to 45° depending on the coalfield [2,3]. In Poland mining subsidence phenomena has been studied by [4,5,6,7,8,9].
Upper Silesian Coal Basin (USCB) in Poland is one of the largest hard coal mining areas in Europe. It is located in Southern Poland and covers an area of over 6000 km2. The Upper Carboniferous coal-bearing formations are the most significant in the geological structure of the Upper Silesian Coal Basin. There are Precambrian, Cambrian, Devonian and Carboniferous formations in their basement. The Carboniferous overburden includes Quaternary, Miocene and Triassic rocks, and, in the southernmost part also, rocks of the Carpathian overthrust; Permian and Jurassic deposits are less common. The coal-bearing formations of the USCB include several lithostratigraphic series, reaching 8500 m of thickness. These series are featured by a gradual reduction of their thickness toward the east and southeast [10,11,12]. Mining activity started in the 19th century and operates till now. During the period 1945–1979, on average, 200 million tons of coal were exploited yearly [7]. From the late 1980s, a steady decrease of the mining activity resulted in 65 million tons of coal production in 2012 [13].
Urban growth was parallel to mining industry development, reaching 37 towns with almost three million inhabitants nowadays. The most common operating system in USCB is longwall coal mining. Usually, the excavated coal layer is 2.5 m thick, 250 to 400 m long, and about 680 m deep. According to [7] subsidence can reach up to 70% of the excavated coal layer, which represents a 0.75–2.0 m displacement for every layer. Taking into account that multi-layer exploitation is common, subsidence depressions up to 40 m are found in USCB. Geodetic measurements were deployed by [14] to document a 27 m subsidence depression as a result of a 33-year period of mining exploitation. Mining extraction operations are usually concentrated on 3–4 neighbor coal walls per year. This strategy concentrates the exploitation in a reduced aerial extent that is immediately affected by severe subsidence 6 to 18 months after the excavation starts [4]. It is estimated that an area of more than 300 km2 is already affected by mining subsidence [15] (Figure 1, “coal mine”). Even if most of these areas are used as agricultural and forest lands, ground deformation recurrently damages urban structures and infrastructures such as buildings, roads, drainage networks, pipelines, etc.
Ground deformation is monitored using traditional geodetic leveling and occasionally differential analysis of Light Detection and Ranging (LIDAR)-derived Digital Elevation Models (DEMs). The rapid development of remote sensing methods allows exploring the possibilities of their use for monitoring ground surface deformation. Among these methods, Differential Synthetic Aperture Radar Interferometry (DInSAR) has proven to be particularly useful to monitor mining subsidence [16,17,18,19,20]. Similar studies were conducted in Poland [21,22,23,24,25,26,27]. These studies exploited C-band satellite radar imagery with Permanent Scatterers Interferometry (PSInSAR) technique permitting only to detect up to 40 mm per year. However, the conventional DInSAR approach, elaborating L-band interferograms, was very helpful to detect deformation signals up to 30 cm in 45 days. The recent availability of very high-resolution satellites like TerraSAR-X (TSX), with short revisiting time (11 days) and a higher horizontal resolution (3 m pixel) enables new research focusing on the monitoring of very fast subsidence, which is common in active mining areas such as USCB. The objective of this paper is to assess the performance of X-band satellite data to detect and monitor very fast mining-induced subsidence, in a scale of decimeters per month. For this purpose both conventional and advanced DInSAR techniques have been combined in order to detect and monitor the spatial and temporal evolution of ground surface displacements related to USCB mining activities.

2. Bytom City Study Area

Bytom city is located in the USCB in a highly recognized coal mining area (Figure 1). Coal mining started in 1902, concentrating the greatest production in the period 1945–1979 that led to the largest urban development when Miechowice, Stroszek or Szombierki districts (Figure 1) were formed. Ever since then coal has been exploited under the city at 19 levels located between 700 and 1000 m below the surface, triggering a 7 m subsidence in the center of the city [28]. Nowadays Bobrek Centrum mine owns the concession until 2040, concentrating its activity on a 17.73 km2 area underneath 25% of Bytom City urban area and 75% of its peripheral areas [29]. The mine operates through the longwall system employing a working force of 2245 m.
Figure 1. Geographical setting of the study area with TerraSAR-X data frame and the boundaries of coal mining areas in Upper Silesia Coal Basin [30]. On the right Bobrek-Centrum mine, which caused subsidence over Karb district (red rectangle) located in Bytom mining area.
Remotesensing 07 05300 g001
Between 2011 and 2012, two mining operations exploiting a 2.0 m thick coal wall at about 700 m deep, triggered subsidence in two districts of Bytom City. In the Miechowice district semestral geodetic measurements (monitoring period from November 2010 to November 2012) recorded 24 cm to 147 cm subsidence, whereas in the western part of the Karb district subsidence reached 90 cm only in 2011. In this same district, subsidence only reached 11 cm in 2012 due to the mining labors abandonment [31,32].
Polish geological and mining law requires careful planning of mining exploitation and ground deformation monitoring, in order to demonstrate that mining subsidence rates are within predefined predictive models ensuring an acceptable impact on urban structures and infrastructures. The assessment of buildings service limit state is performed through the calculation of the tilt, radius of curvature and horizontal deformation [33,34]. The parameters are calculated based on periodic geodetic measurements of the horizontal and vertical displacements carried out by the mines. The categories are number from 0 to V depending on the expected impact on the buildings. According to the Table 1, damages will occur to buildings when horizontal deformations exceed category III (i.e., horizontal deformation > 6 mm/m).
Table 1. Current existing categories of mining areas due to the continuous surface deformation [33].
Category of the InfluenceTiltRadius of CurvatureHorizontal DeformationPotential Damage
T, mm/mR, kmε, mm/m
0T ≤ 0.540 ≤ |R||ε| ≤ 0.3protection no required
I0.5 < T ≤ 2.520 ≤ |R| < 400.3 < |ε| ≤ 1.5may arise small, harmless damage
II2.5 < T ≤ 512 ≤ |R| < 201.5 < |ε| ≤ 3may arise damage easy to remove
III5 < T ≤ 106 ≤ |R| < 123 < |ε| ≤ 6protection required
IV10 < T ≤ 154 ≤ |R| < 66 < |ε| ≤ 9serious protection required
V15 < T|R| < 49 < |ε|high probability of occurrence of discontinuous displacement (sinkholes)
In the case of Bytom city, horizontal deformations on urban structures were within the acceptable limits for category I (1.5 mm/m) and II (3 mm/m), being consistent with the mining plan approved by the major of Bytom, following Polish geological and mining law [31,32]. Only in five apartment blocks located in Konstytucji Street within the Karb district expected horizontal deformations exceeded category III (3–6 mm/m), which is unacceptable. Despite the fact that recorded subsidence seemed to be acceptable within the operation plan, serious damage was caused in buildings located on the streets of Pocztowa, Techniczna and Falista (Figure 2).
Figure 2. Location of the demolished buildings in the Karb settlement.
Remotesensing 07 05300 g002
Between July and October 2011, 28 buildings located in Pocztowa Street were gradually evacuated upon the Inspector of Building Control’s request. Buildings clearly exceeded service limit state: walls crashed, floors buckled, stairs bulged out and broke away from each other. As a result, 600 people from Pocztowa and Techniczna streets were moved to new houses [28]. These were mostly old pre-world war II buildings, which were subjected firstly to tensile stress and then compression, weakening their structure and constructive materials prior to failure. The damages produced by the mining activity led to the evacuation of the entire building estate for the first time in Poland. Despite these negative consequences, the Mining Supervision Office issued a statement saying that building damages were not attributed to irregularities in the ongoing operation of the mine. In fact, exploitation was carefully planned, ground deformation was monitored in accordance with Polish geological and mining law and subsidence rates were compatible with predictive models [28].

3. Methods

3.1. Conventional DInSAR Processing

Conventional Differential Synthetic Aperture Radar Interferometry (DInSAR) uses pairs of Synthetic Aperture Radar (SAR) images acquired over the same area at different times to generate maps of ground deformation, exploiting the fact that difference in the phase is eventually proportional to surface deformation [35,36]. The displacement is presented in the form of interferograms. The interferometric fringes (phase cycles that correspond to a displacement of half of the sensor wavelength) are related to the surface deformation occurred in the area during the period between the acquisition of these two images. The informative content of such maps is heavily dependent on the radar coherence during the acquisition period. As a consequence, change in land coverage and the presence of atmospheric disturbances limit the measurement precision to cm [37]. However, such maps are successfully used to map earthquake and seismic deformation patterns, volcanism and heavy subsidence bowls [38,39,40].
In this work, low temporal baseline (11 days) interferograms are used to characterize fast surface displacement. This small temporal baseline was chosen to minimize the loss of deformation in our final interferograms due to the high deformation rate of the study area. For this purpose, 30 radar images taken by TerraSAR-X satellites have been processed. Acquisition started 5 July 2011 and stopped 21 June 2012, covering approximately 900 km2 in USCB between the cities: Tarnowskie Gory (NW), Dabrowa Gornicza (NE), Zabrze (SW), and Sosnowiec (SE) (Figure 1). Native resolution of the imagery is ~3 m × 3 m, being acquired with TerraSAR-X in Stripmap mode (SM010) descending orbits. As TerraSAR-X acquisitions are distributed as Single Look Complex (SLC—already focused) advanced registration has been carried out in order to assemble a homogeneous stack with respect to the master image. Then, high quality differential interferograms were generated. A simulated phase image corresponding to the topographic phase had to be computed from an external Digital Elevation Model (DEM). In this work a simple Shuttle Radar Topography Mission (SRTM) DEM with a pixel spacing of three arc second was used. As in any PSI approach, topographical error computation, i.e., the difference between topographical phase and external DEM phase, is one of the outputs of the processing avoiding any mayor inference into SqueeSARTM results. This image was then subtracted from the interferometric phase image. In order to discriminate between displacement and atmospheric phase the latter was assumed to be correlated on a spatial window of a few km in size, whereas for the former we considered typical dimensions of a few hundreds of meters. The atmospheric contribution was then removed by applying a low pass filter to the differential interferograms.

3.2. Advanced DInSAR Processing

At the beginning of the XXI century, new approaches were developed to address the limitations of conventional DInSAR by processing multiple acquisitions in time, generally referred as Persistent Scatterer Interferometry (PSInSAR, PSI) techniques [41,42], which unlike the convention processing are based on not two but a stack of images. The basis of the PSInSAR technique is the separation of the different components of the interferometric phase: displacement, topographic error, atmospheric effects and the uncertainties in the sensor orbit information. Through the processing of a large dataset (usually more than 20 images), a selected subset of pixel is used to estimate atmospheric phase screen, allowing measuring surface deformation with millimetric accuracy [43]. For each pixel selected by the PSI method, the Line of Sight (LOS) deformation time series and the LOS velocity are obtained. The PS method can measure surface motions at a level of <1 mm/year and can resolve very small-scale motion not previously recognized in traditional SAR interferometry [44]. PSI datasets have been widely used due to their capability to map subtle surface displacements, but information can be lost when heavy non-linear subsidence patterns occur—like those supposedly induced by longwall mining [27]. Nonetheless various advanced DInSAR processing techniques were successfully used in the coalfield areas in Europe [45,46]. New algorithms significantly improved the density of measurement points, leading to the more complete mapping of motion related to the underground exploitation.
SqueeSARTM is the most recent evolution in the field of PSI techniques, as it exploits both point scattering (PS) and distributed scattering (DS). Simple, basic mechanisms originated by single, double or trihedral reflection from material whose electromagnetic characteristics do not vary with time are typically referred to as deterministic scatterers. PS typically belong to this family and corresponds to dominant scatterers within their resolution cells, exhibiting a very stable value of reflectivity as a function of time and acquisition geometry. On the contrary, DS are identified from homogeneous ground, scattered outcrops, debris flows, non-cultivated lands and desert areas. DS typically correspond to natural targets and originate by a multitude of individual scattering centers distributed over a volume or a surface. The joint exploitation of both PS and DS results in a significant increase in the number of measurement points (MP) identified [47], allowing for a better characterization of the displacement phenomena affecting the area of interest.
The same dataset as for conventional DInSAR has been processed by means of the SqueeSARTM algorithm (30 images, descending orbits, time span: 5 July 2011–21 June 2012). SqueeSARTM take advantage of a sophisticated approach for the estimation of a target motion based on Model Order Selection (MOS) algorithms. MOS algorithms allow the automatically set the most appropriate model for displacement time series, based on the observations. The algorithms automatically select, for instance, a seasonal component only when it can best fit the data with respect to other models. The procedure is spatially adaptive, i.e., the best model is selected on a pixel-by-pixel basis. Being the aim of this approach to detect at regional scale, residual subsidence around the subsidence troughs detected with conventional DInSAR, we decide to process the defined network of targets (PS and DS) all together in a single inversion. Hence in this work both PS and DS measurements will be named measurement points (MPs).

4. Results

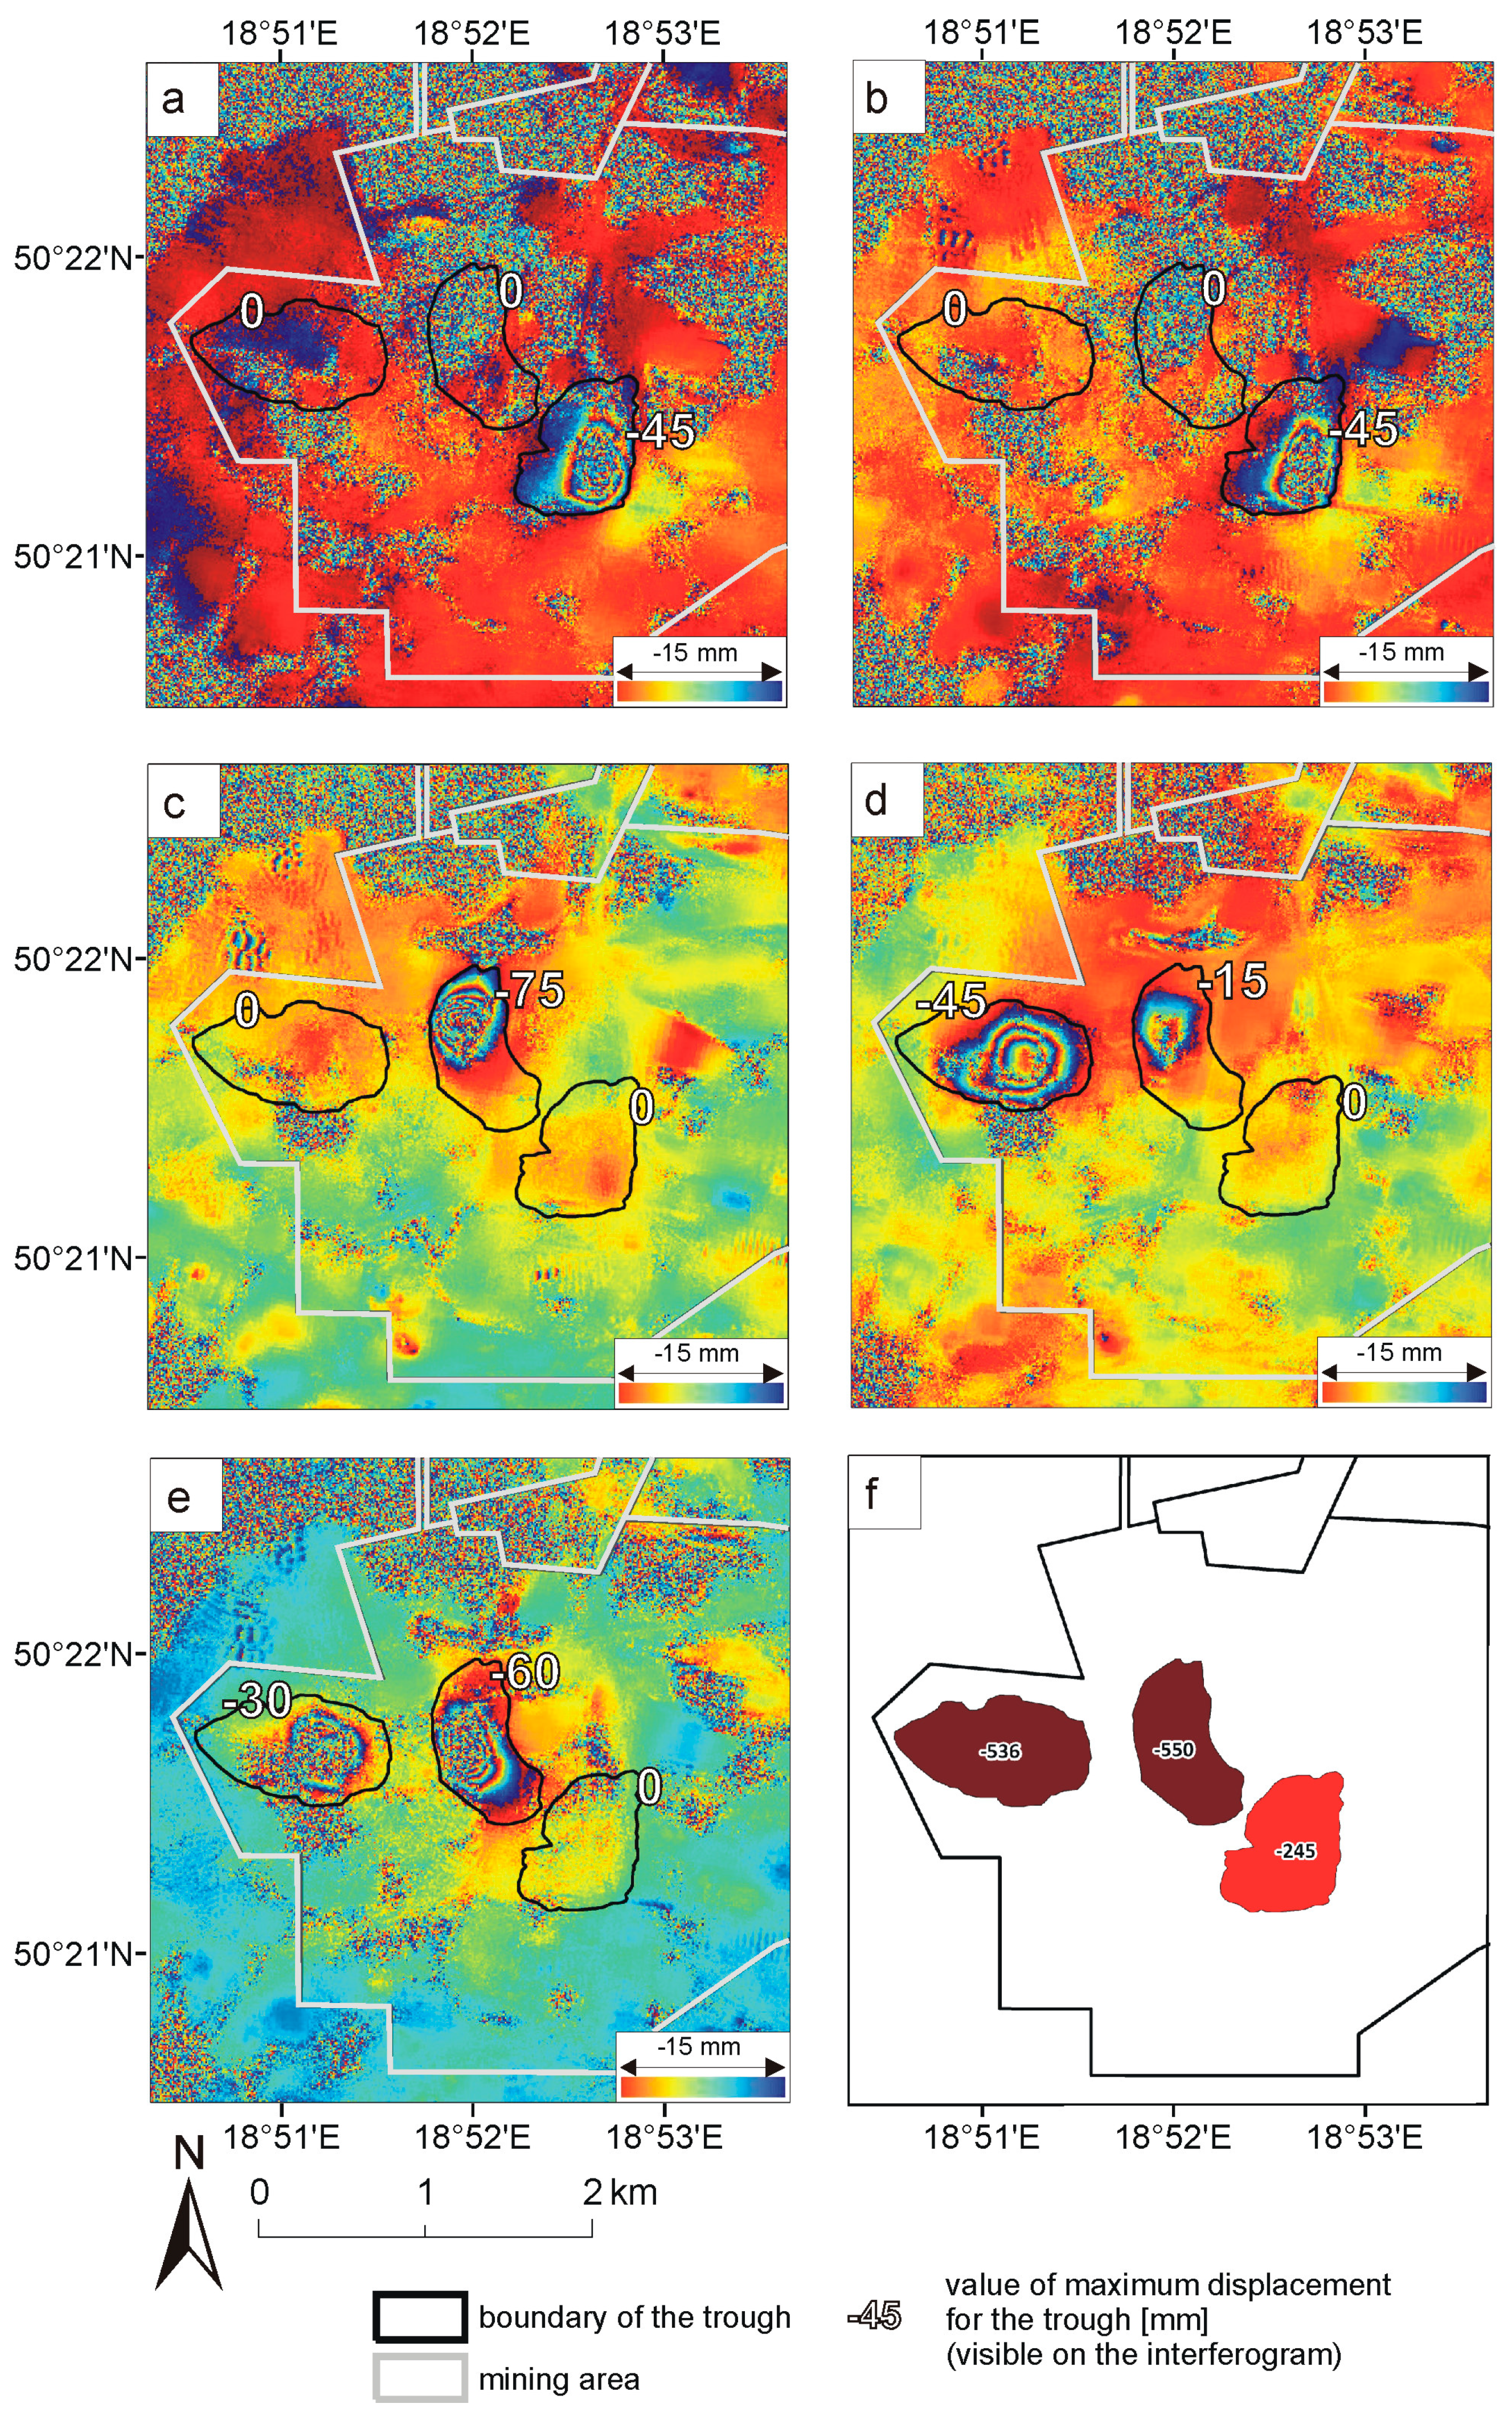
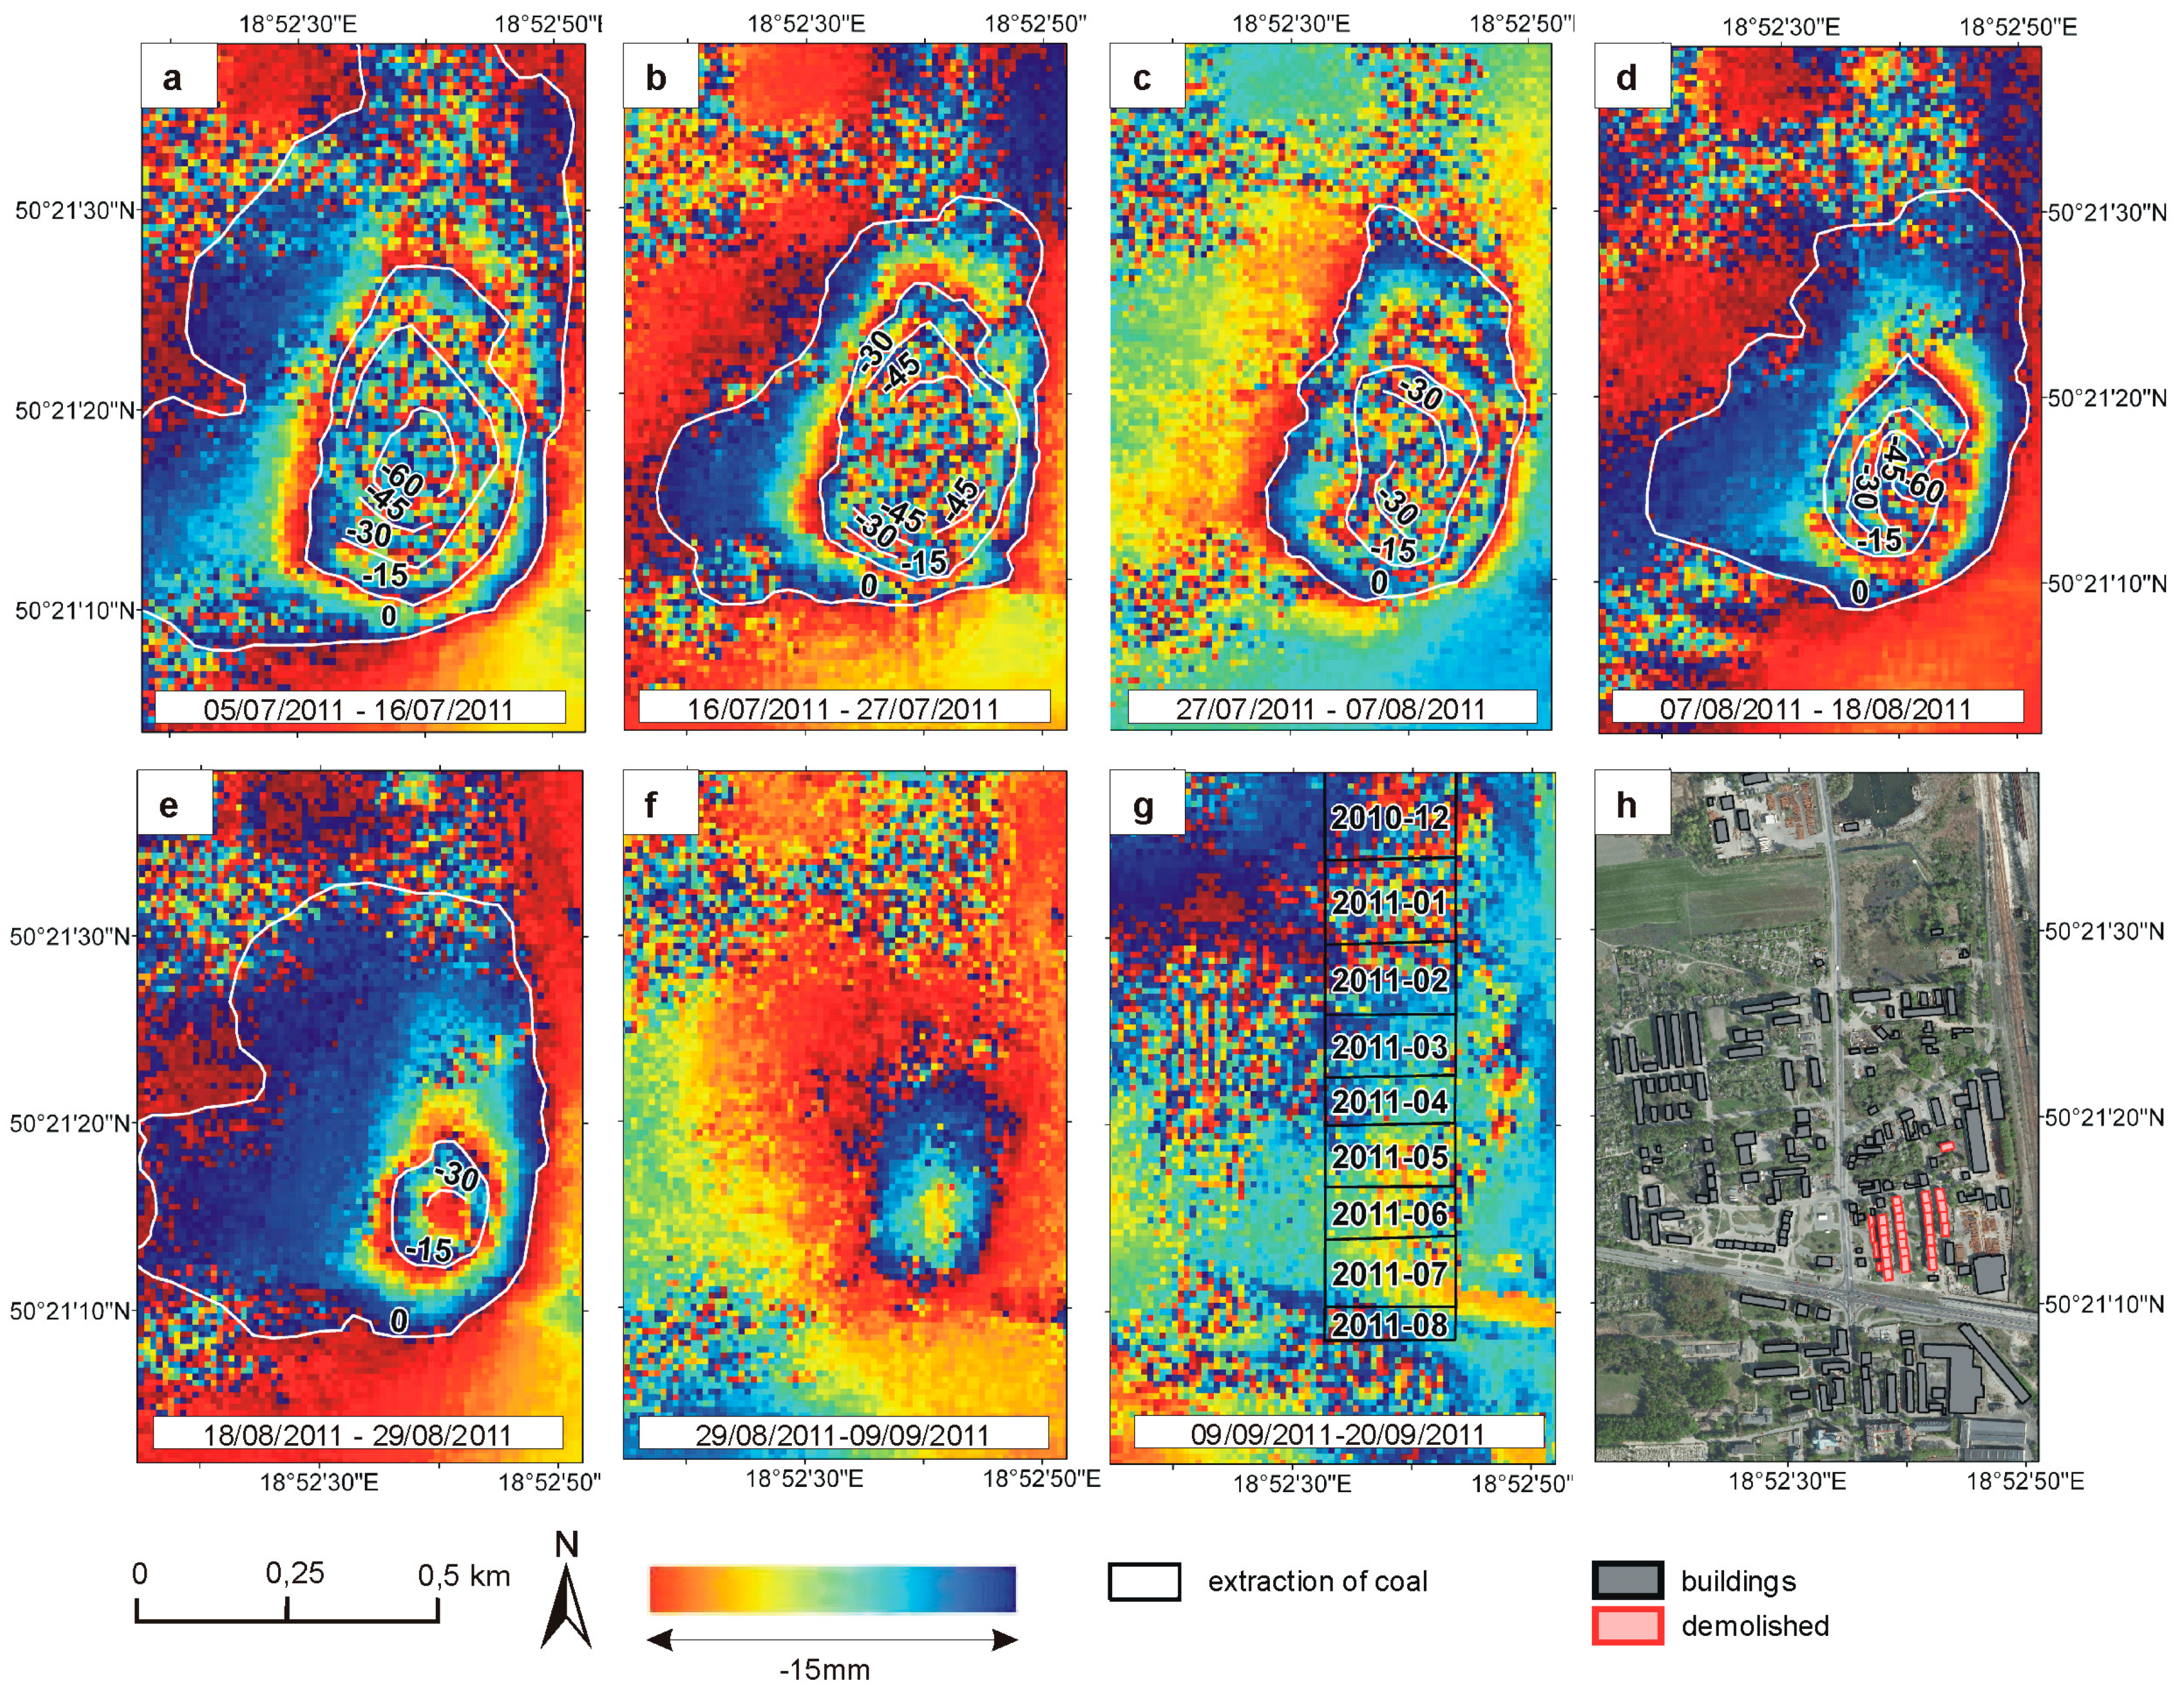
4.1 Conventional DInSAR Results

The conventional DInSAR processing strategy has yielded 28 interferograms with 11 days interval (Table 2). Such maps, notwithstanding the fact that are affected by some atmospheric artifacts, are finally employed for a large-scale motion survey, determining the position, extent, contour, and approximate velocity of mining areas. In the next step phase unwrapping should be performed, allowing recovering unambiguous phase values from phase data that are measured modulo 2π rad in the wrapped interferogram. The presence of fast displacement bowls prevents the processor from a robust and automated spatial unwrap of every interferogram. On the other hand, while automatic unwrap poses few challenges, in this particular case, it is often possible to count fringes to estimate several centimeters of displacement. In Figure 3 one out of twenty eight interferograms is shown, reveling the most active mining subsidence areas. More than 20 active areas are clearly identified in this interferogram, represented by closed circular shaped fringes. The location of these active areas (subsidence basins) corresponds with the location of coal mining areas, suggesting a clear relationship between the mining activity and measured deformation.
Table 2. TerraSAR-X interferograms considered in our analysis. The time interval is 11 days.
Date 1Date 2Perpendicular Baseline [m]Date 1Date 2Perpendicular Baseline [m]
05 July 201116 July 20111306 December 201117 December 2011133
16 July 201127 July 20118517 December 201128 December 201157
27 July 201107 August 20111710 February 201221 February 201241
07 August 201118 August 20115021 February 201203 March 2012138
18 August 201129 August 20115803 March 201214 March 201251
29 August 201109 September 20114414 March 201225 March 201253
09 September 201120 September 201128525 March 201205 March 201281
20 September 201101 October 201125205 April 201216 April 20122
01 October 201112 October 201111616 April 201227 April 2012218
12 October 201123 October 201111327 April 201208 May 2012259
23 October 201103 November 201111008 May 201219 May 201259
03 November 201114 November 201123619 May201230 May 201227
14 November 201125 November 20119530 May201210 June 201259
25 November 201106 December 20113010 June 201221 June 2012200
Figure 3. TerraSAR-X (TSX) X-band differential interferogram with boundaries of coal mining areas in Upper Silesia Coal Basin. Start and end dates of the interferogram are 25 November 2011–06 December 2011.
Remotesensing 07 05300 g003

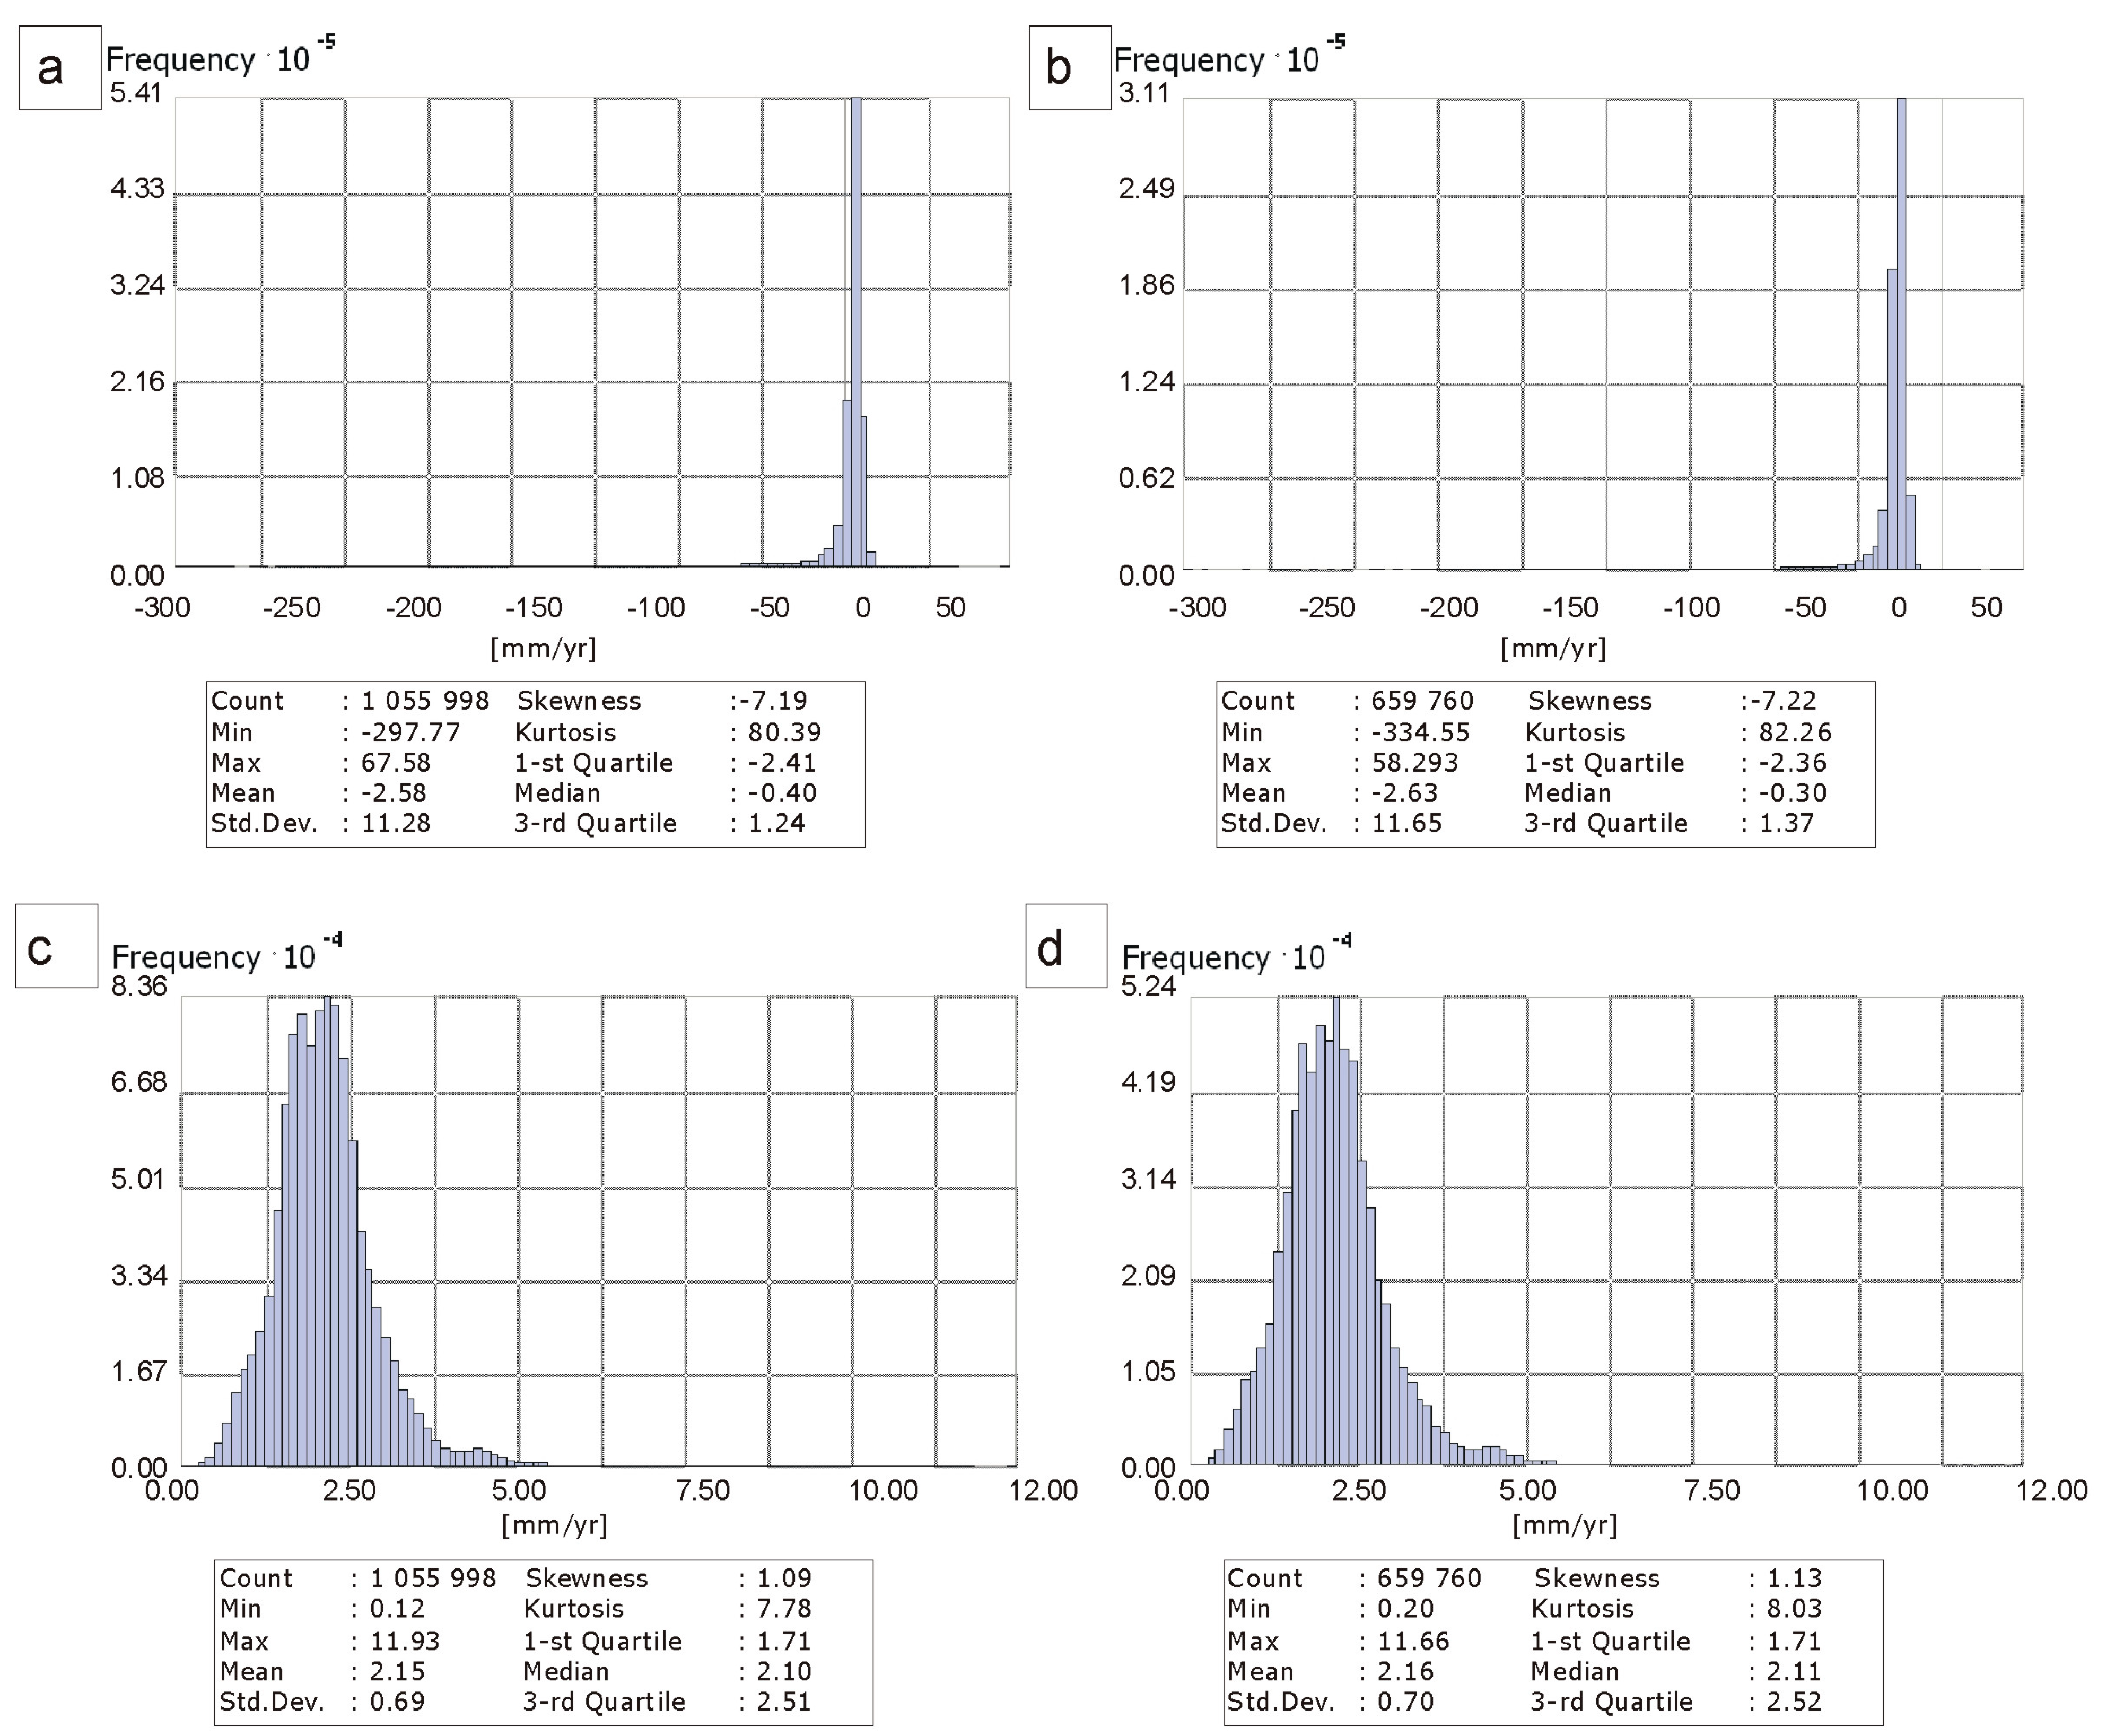
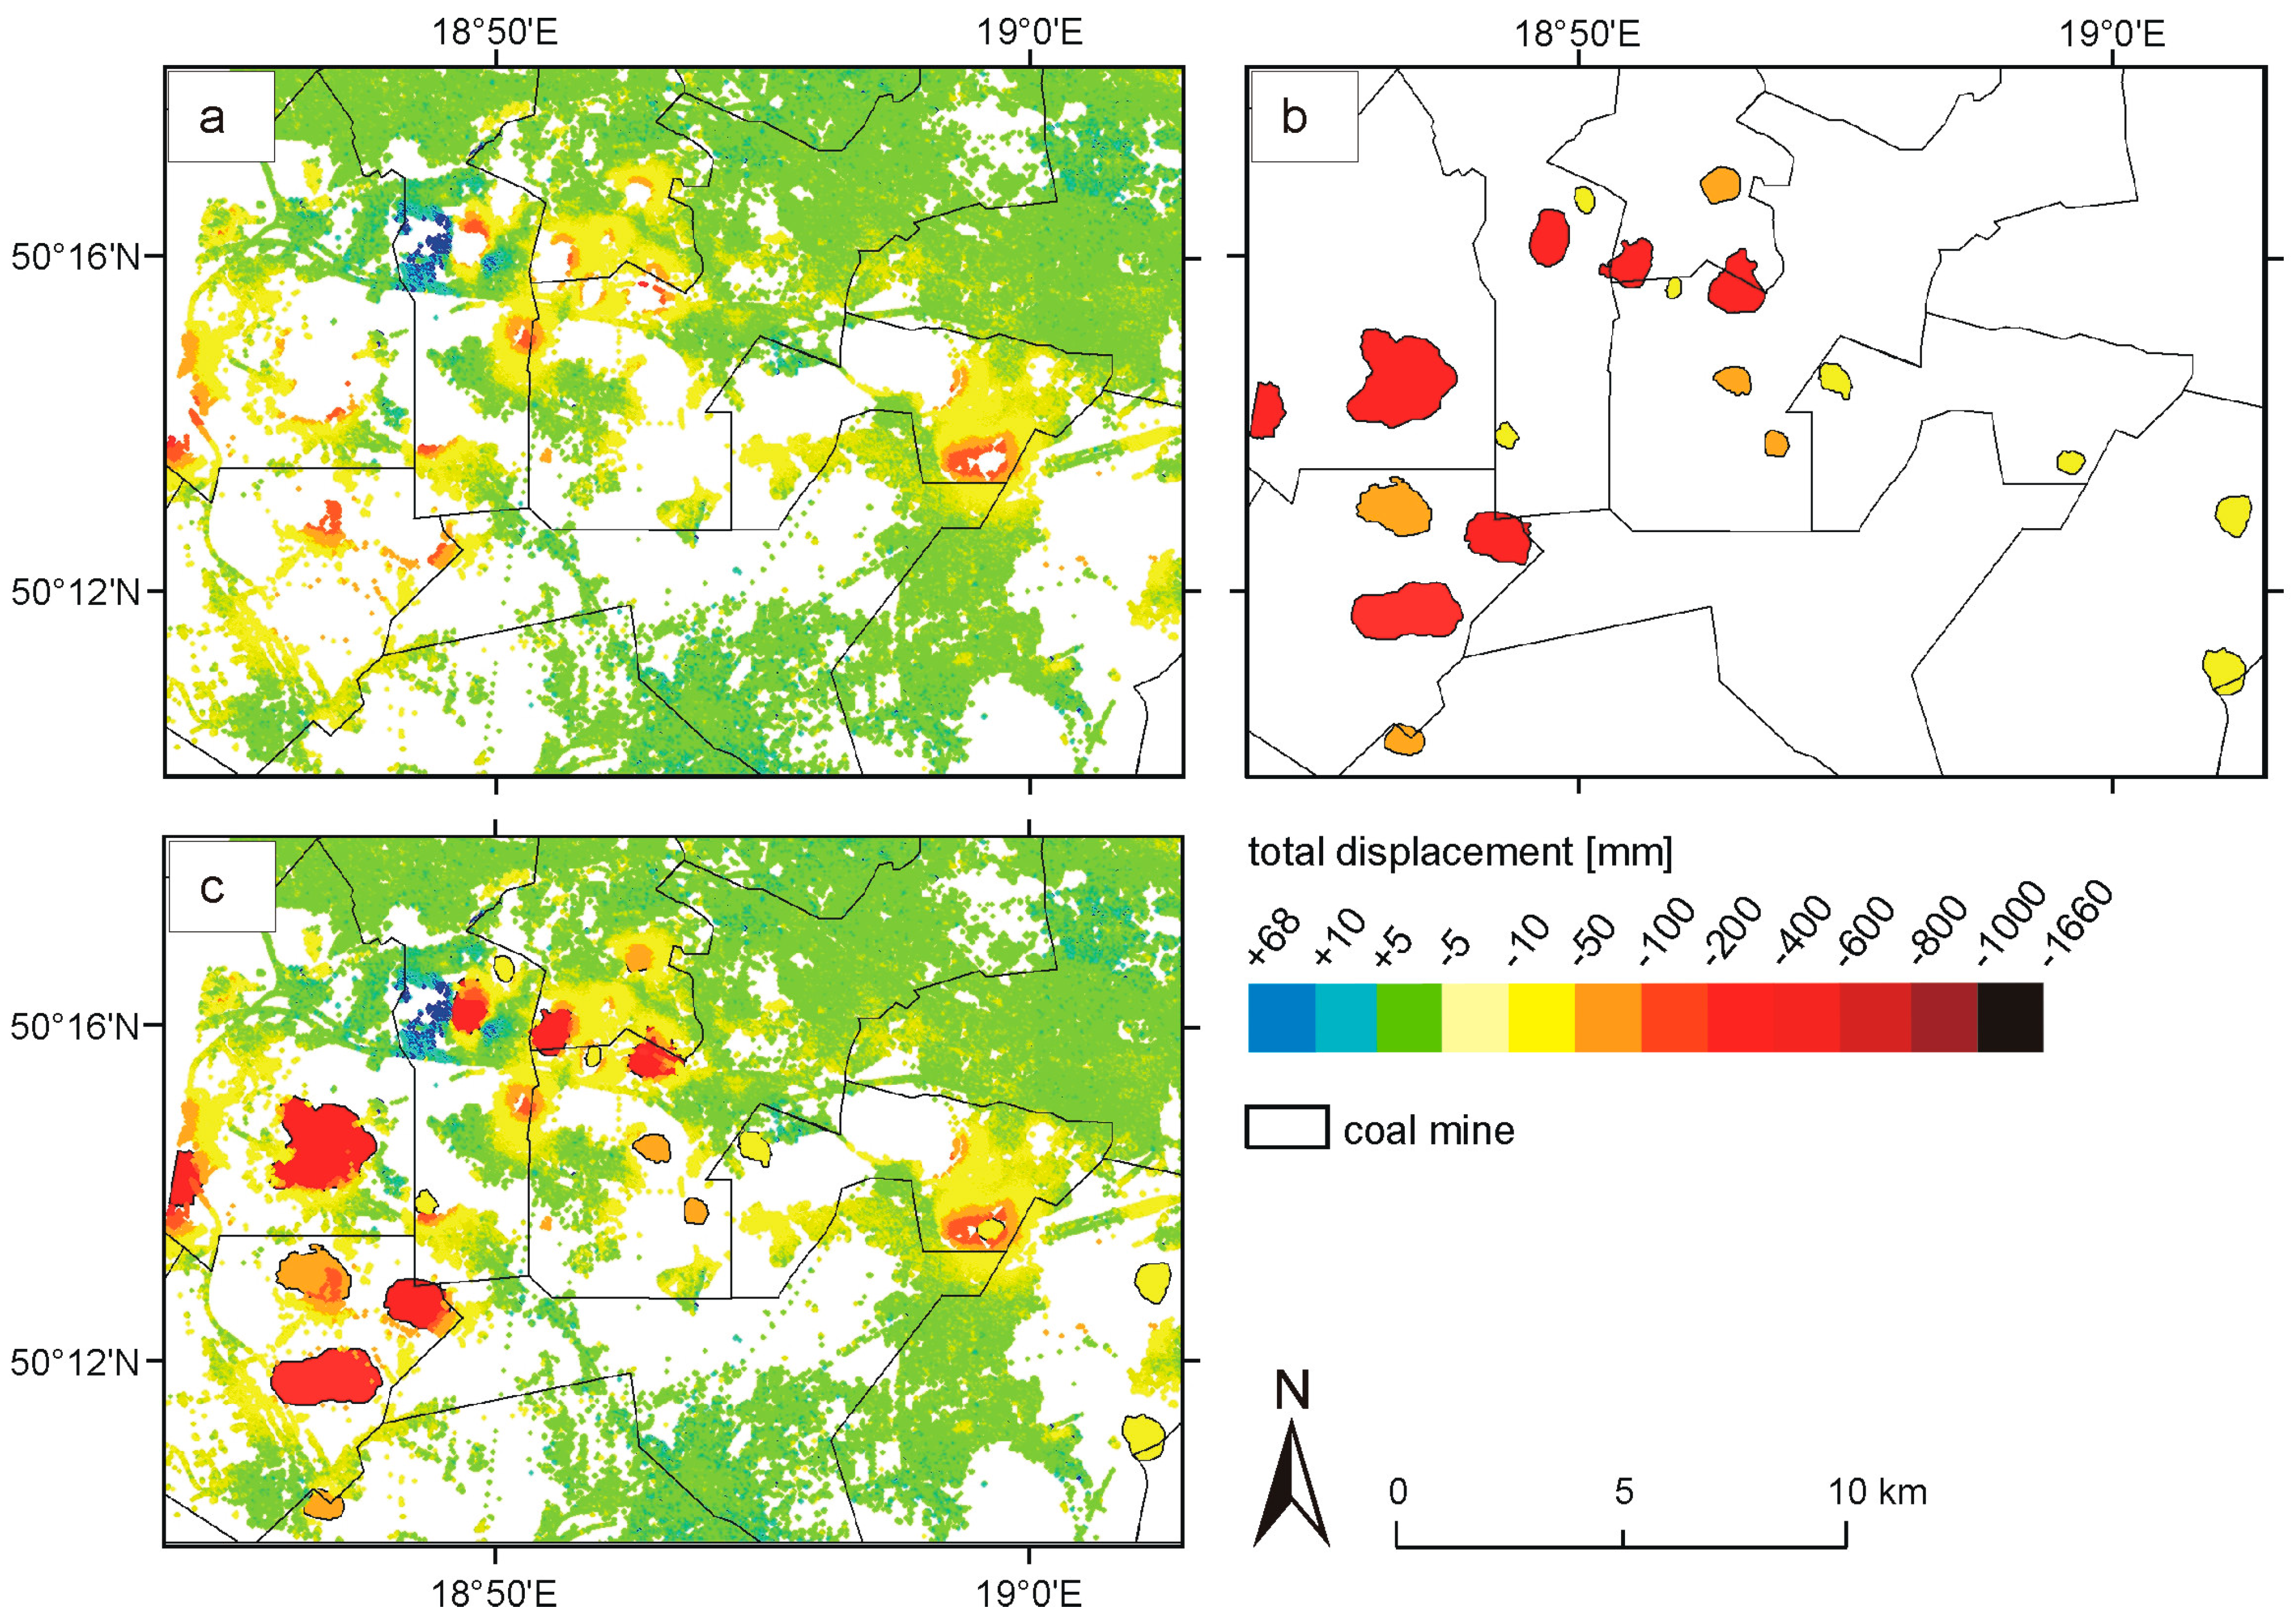
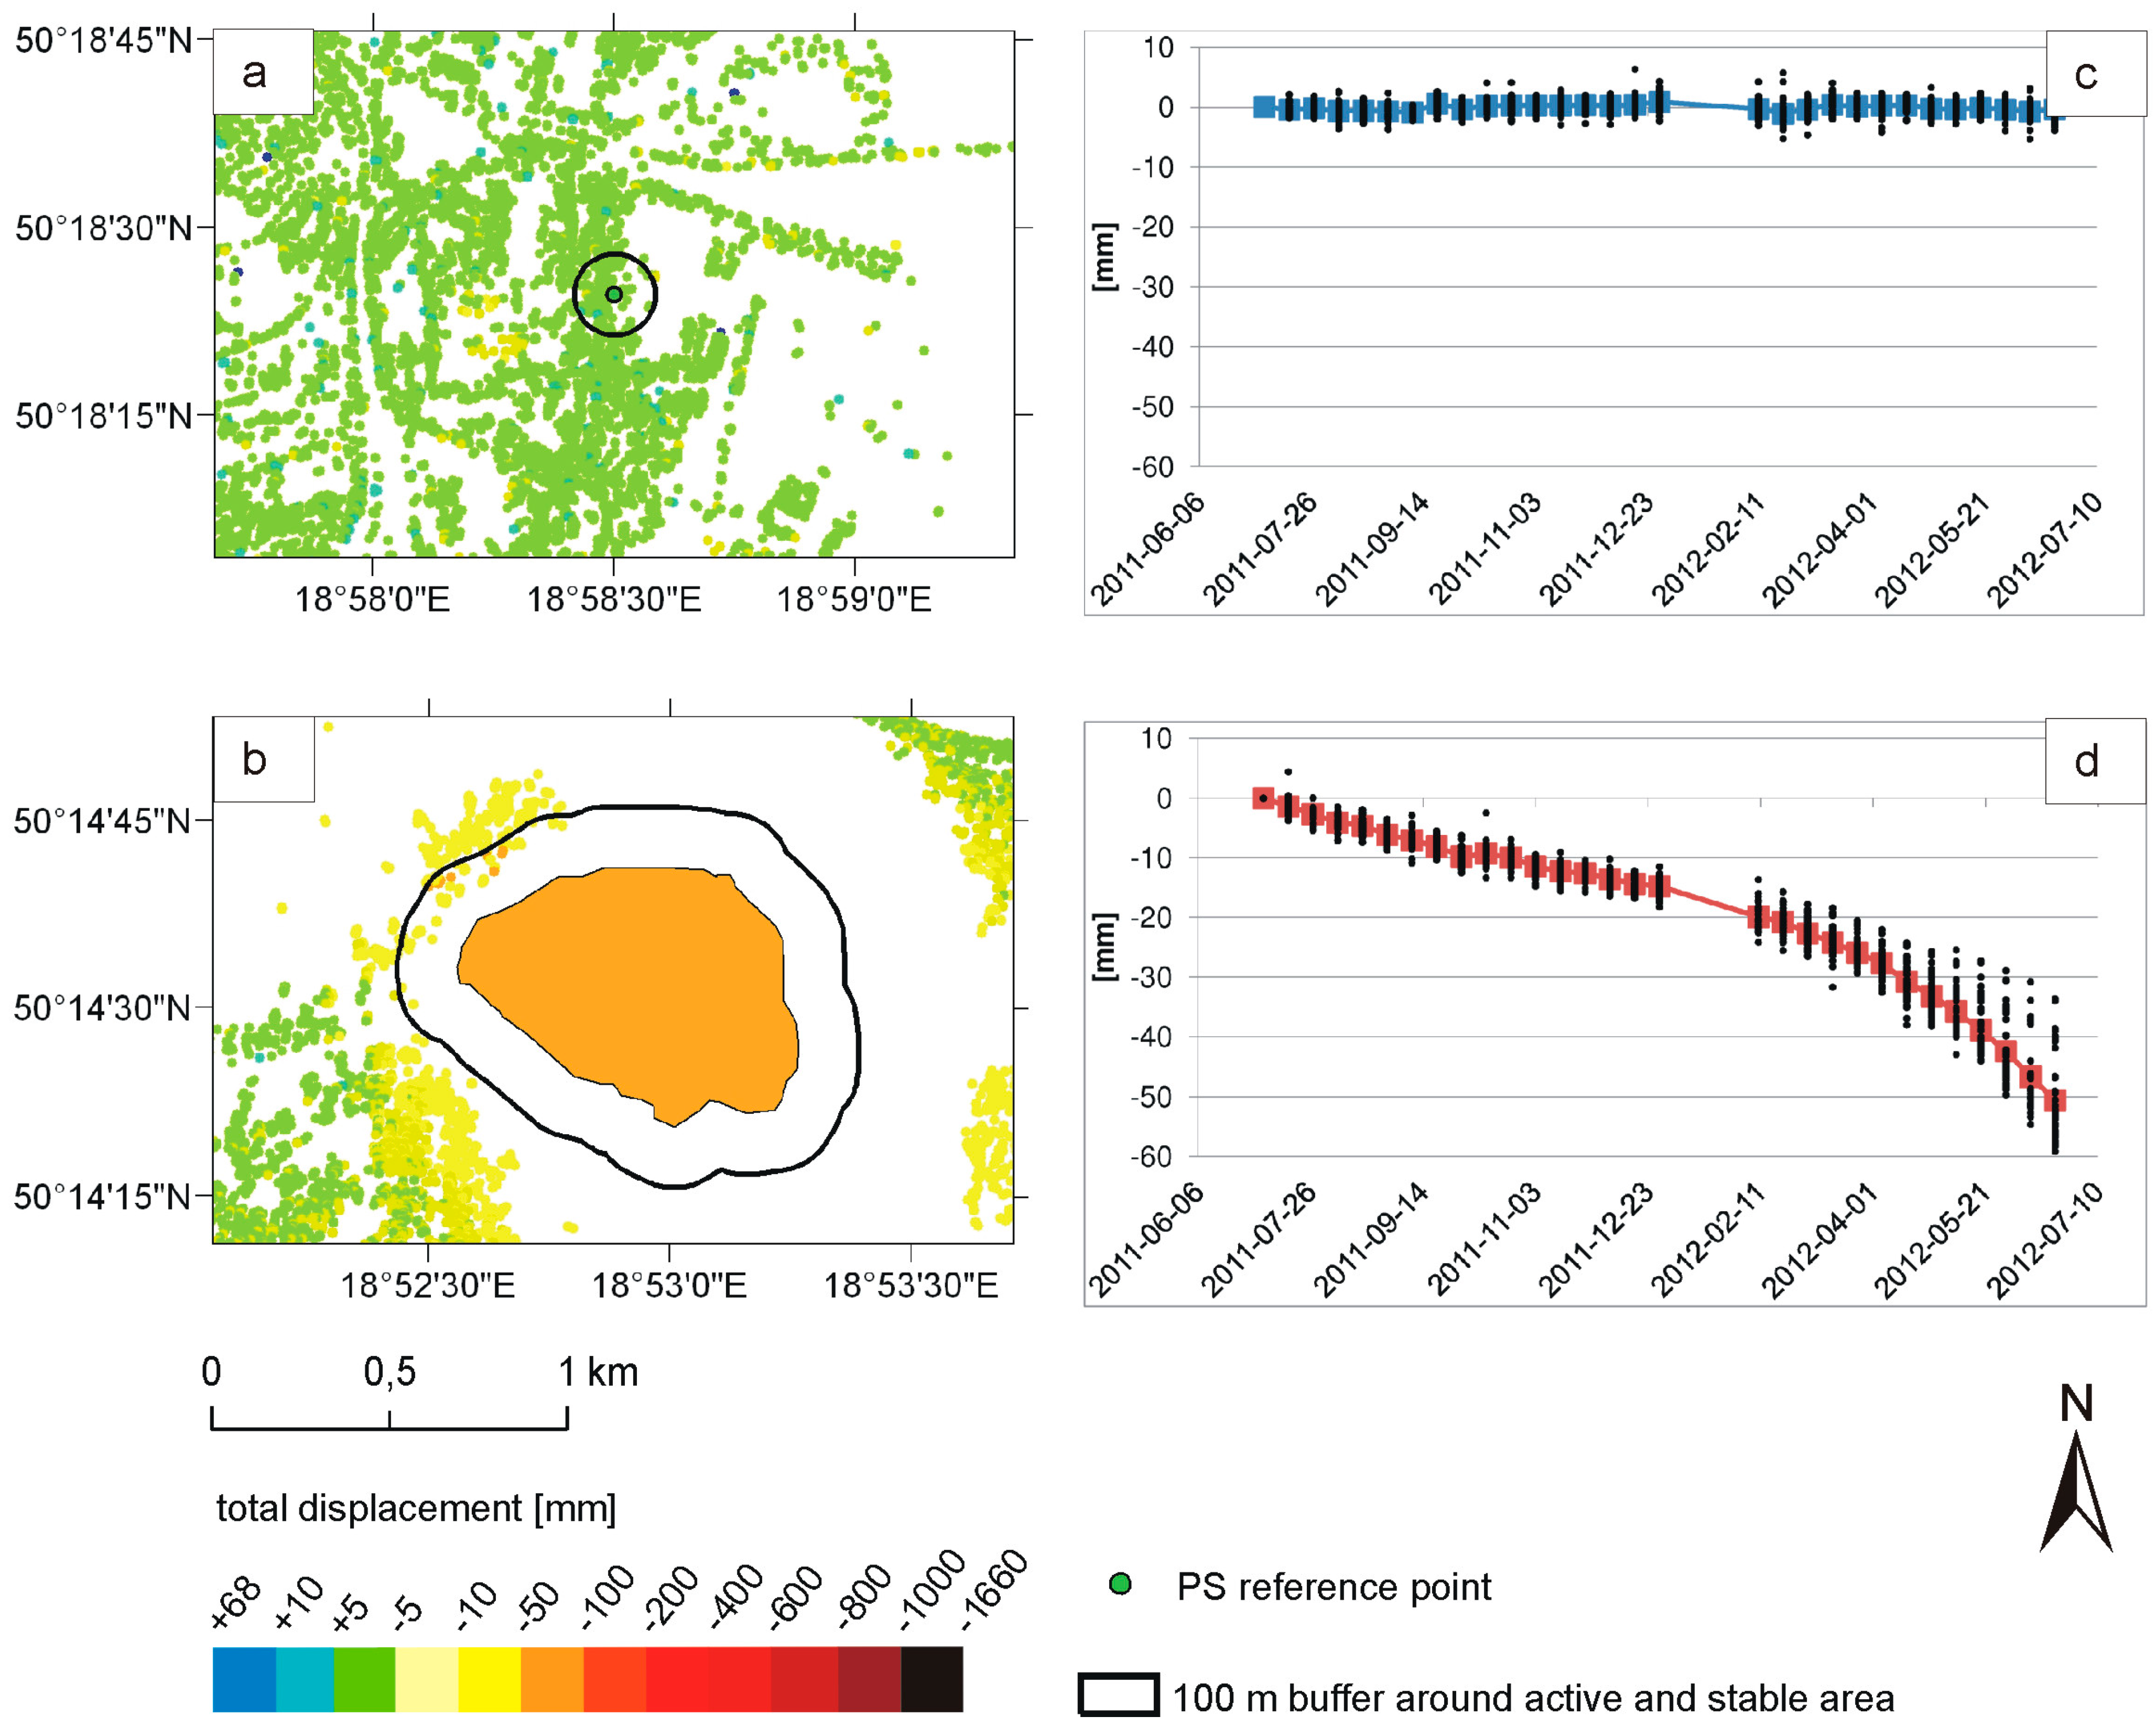
4.2. SqueeSARTM Results

The SqueeSARTM processing of the USCB study area yielded 1.7 million of both PS and DS measurement points. Each of them has several attributes, being the most important the line-of-sight (LOS) velocity and the time series of cumulated displacement value, which is relative to the chosen master image acquired in 01 October 2011. Note that every displacement estimate is relative to one automatically chosen reference point, which is expected to be stable for the whole period of acquisition (Figure 4). As it was explained in section three, the SqueeSARTM approach exploits both PS and DS for the estimation of the displacement field. The observation of the retrieved results for the two types of measurement point (LOS velocities and standard deviation maps) reveals almost the same spatial (Figure 4a–d) and statistical (see histograms in Figure 5) distribution of estimated displacements. In Figure 6, four examples of PS and DS distribution are presented over urban and rural areas. It can be observed that the spatial distribution and the magnitude of estimated LOS velocities are very similar in urban areas. On the other hand, in rural environments, due to the intrinsic difference of the nature of PS and DS points, a greater amount of DS points are detected where PS points are not visible.
Figure 4. SqueeSARTM Line of Sight (LOS) velocity in mm per year results displayed in a color scale, where green values are stable, blue uplift, and yellow, orange and red are subsidence. (a) LOS velocity of point scatterers (PS); (b) LOS velocity of distributed scatterers (DS); (c) standard deviation map of the LOS velocity of PS; (d) standard deviation map of the LOS velocity of DS; (e) dataset before ramp removal; and (f) dataset after ramp removal.
Remotesensing 07 05300 g004
Figure 5. Permanent Scatterers Interferometry (PSI) dataset histograms. (a) Histogram of point scatterers (PS) Line of Sight (LOS) velocity; (b) histogram of distributed scatterers (DS) LOS velocity; (c) histogram of PS velocity standard deviation; and (d) histogram of DS velocity standard deviation.
Remotesensing 07 05300 g005
Taking into account the regional target of our study focusing on urban areas affected by underground mining subsidence, and the similar results obtained for both PS and DS measurement points; we will jointly analyze PS and DS points as measurement points (MP). A total of 1,715,758 MPs were detected measuring velocities between −338 and 68 mm/year with mean −4 and standard deviation 12 mm/year (Figure 5). Orbital errors were corrected by removing a linear polynomial ramp from the PSI dataset through a multiple regression analysis using the least squares method. For that purpose, we assumed zero deformation in the far field (since deformation is localized in the interferogram) and flatten the whole dataset (see Figure 4e,f). The main characteristics of the SAR datasets can be found in Table 3.
Figure 6. Point scatterers (circles) and distributed scatterers (squares) location over selected areas. Both measurement point (MP) types are presented in the same color scale by their Line of Sight velocity values. (a) Crossroad of national road no. 94 and Nowaka-Jeziorańskiego street in Bytom; (b) Popiełuszki street in Bytom; (c) Agricultural area in Będzin; (d) Agricultural area in Stara Kuźnia. See location of these areas in Figure 4.
Remotesensing 07 05300 g006
The negative skewness in LOS velocity histogram is explained by the dominant subsidence detected in the USCB. The mean standard deviation, 2 mm/year, is consistent with the precision of the PSI techniques. Occasional and scattered higher values of standard deviation up to 11.93 mm per year are observed far away from the reference point (edges of the data frame) as well as in strongly subsiding areas (Figure 4c,d). As in all geodetic networks, the precision of the measurements tends to decrease as the distance from the reference point increases, because of error propagation (uncompensated atmospheric noise). Localized high standard deviation values in areas of motion, have a different explanation: since the average velocity standard deviation is computed from the residual of a linear model fitted to the data, these values indicate that motion is non linear.
Table 3. Main characteristics of the Synthetic Aperture Radar (SAR) dataset and the SqueeSARTM results (after ramp removal).
BandX
Wavelength3 cm
Incidence angle37°
Orbital track108
Acquisition modeDescending
Resolution of the image3 m × 3 m
Min. temporal span between two acquisitions11 days
Max. theoretical measurement point (MP) velocitymeasurable between neighboring pixels250 mm/year
Temporal span05 July 2011–21 June 2012
Master image01 October 2011
No. SAR images30
No. of interferograms28
Max. spatial baseline285 m
Reference point coordinates50.307 N, 18.975 E
Total study areaNo. of MPs1,715,758
µ ± σ−3 ± 11 mm/year
VELMIN/VELMAX−334/+68 mm/year
Bytom study areaNo. of MPs36,342
µ ± σ−4 ± 12 mm/year
VELMIN/VELMAX−147/+ 22 mm/year

5. Discussion

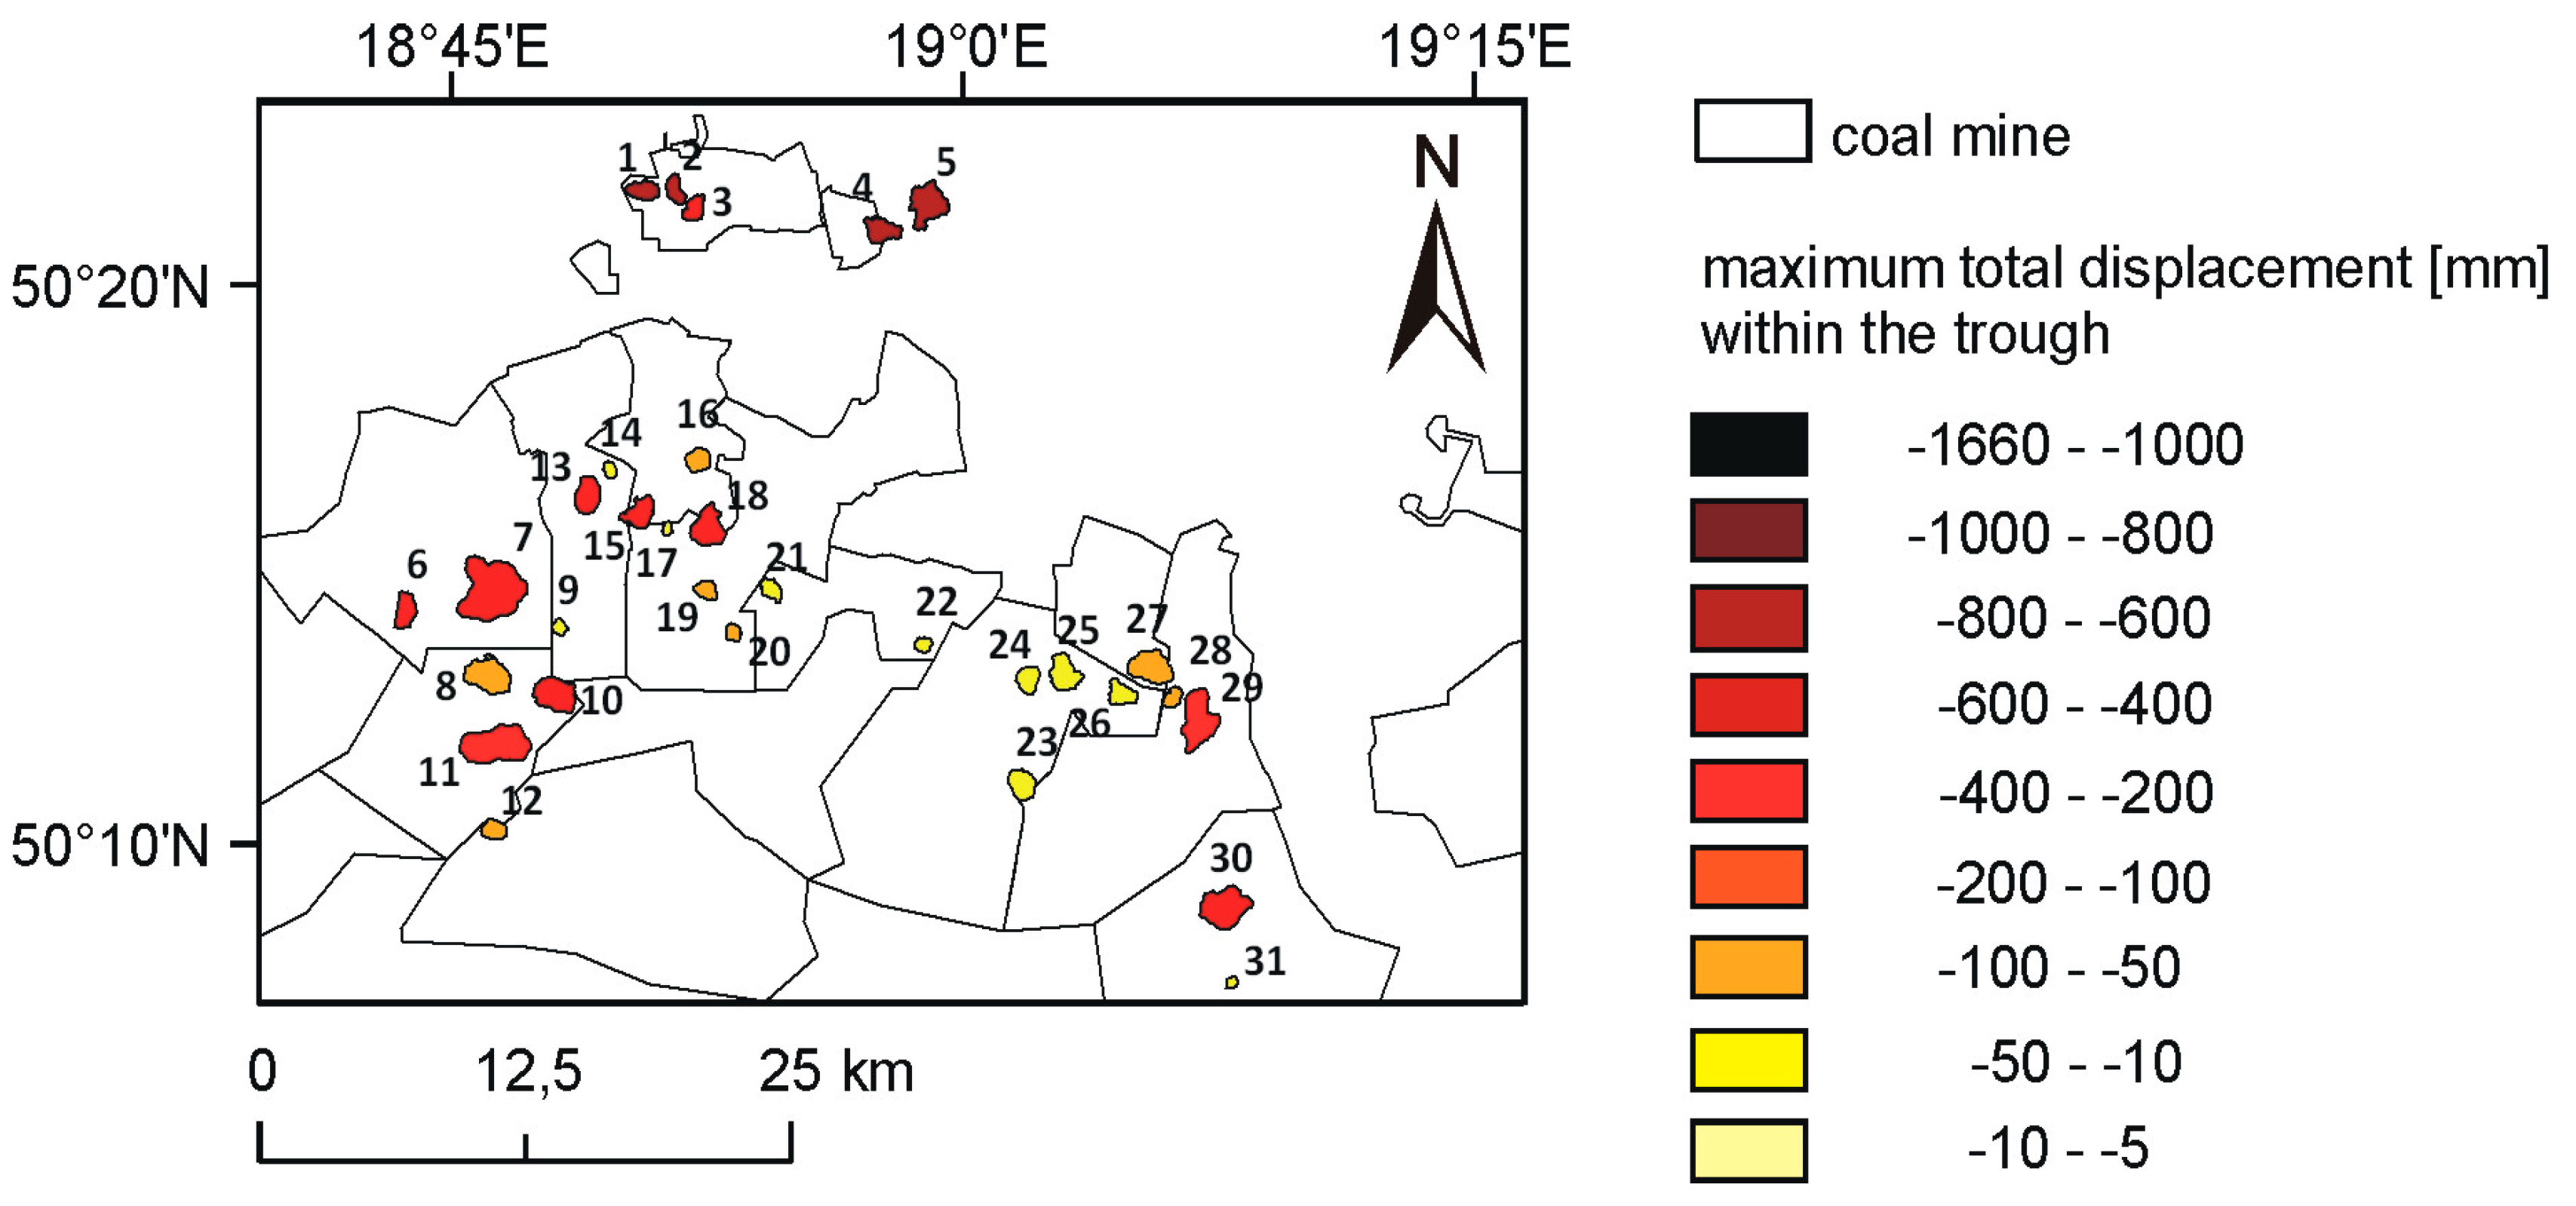
5.1. Analysis of DInSAR Results

The analysis of the 28 interferograms permitted detecting 31 active areas or subsidence troughs where deformation occurred recurrently between 05 July 2011 and 21 June 2012 (Table 4). It should be noted that one year monitoring period allows for the identification of the ground movements directly related to the coal exploitation of that particular time. To be able to infer long-term trends in surface deformation, a longer monitoring period is recommended. For each of the detected active areas we calculate the greatest subsidence (maximum negative displacement along the line of sight—LOS) measured in each of the interferograms based on fringes count. The color scale represents phase cycles that correspond to 1.5 cm in terms of ground displacement, i.e., half of the band wavelength (3 cm). In Figure 7a–e, five representative interferograms are shown corresponding to Bytom area. It is observed that up to five fringes (i.e., 7.5 cm) can be counted before the interferogram is decorrelated. Most of the deformation signals present decorrelation in the central area probably due to the magnitude of the displacement, which could be beyond the detection threshold of the TerraSAR-X sensor (for this satellite, maximum theoretical detectable displacement between two fringes is 1.5 cm every 3 m, i.e., pixel resolution). Note that a subsidence trough triggered by underground excavation works suffers the greatest deformation in its central part, being attenuated towards the border limits [4]. Taking into account this assumption, the generated interferograms were useful to quantify the maximum deformation affecting the subsidence trough and to define its spatial extension (Figure 7f). An alternative approach to extract the deformation in the decorrelated areas due to fast deformation (not used in this work) is the use of SAR amplitude information [48].
Figure 7. Interferograms (5 out of 28) from Bytom study area: (a) 05 July 2011–16 July 2011, (b) 16 July 2011–27 July 2011, (c) 23 October 2011–03 November 2011, (d) 17 December 2011–28 December 2011, and (e) 14 March 2012–25 March 2012. (f) Summed values of maximum displacement measured for each interferogram generated in the period 05 July 2011–21 June 2012. The values of maximum displacement are reported in the labels over the boundaries of the troughs. Resulting three areas in picture (f) correspond to the troughs labeled 1, 2 and 3 on Figure 7.
Remotesensing 07 05300 g007
The sum of the deformation estimates derived from the fringes count on each interferogram provides the cumulated maximum total displacement measured in the period 05 July 2011–21 June 2012 occurred within every subsidence trough. In Figure 8 the resulting cumulated total displacement is shown for the whole USCB study area. A total amount of 31 subsidence troughs have been identified (Table 4). Even though the determination of the displacement is rather qualitative due to the fringes count, it can be clearly seen that, at least during the TSX monitoring period, mining activity was reduced or stopped in the central part of the USCB area. Note that few small troughs exhibit cumulated subsidence below 50 mm, which correspond to fringes only visible for one month in different periods. Contrarily the northern, western and eastern part of the USCB area exhibits numerous subsidence troughs ranging from 100 to 660 mm that coincide with ongoing mining excavation works.
Figure 8. Resulting maximum cumulated total displacement measured in the subsidence troughs detected from the interferograms analysis in the Upper Silesia Coal Basin area during the period 05 July 2011–21 June 2012.
Remotesensing 07 05300 g008
Moreover, the analysis of the maximum values of cumulated displacement (Table 4, column “Total Displacement”) obtained for each trough in combination with the time interval when the fringes were visible (Table 4, column “Period with Fringes”), allows the calculation of the displacement rate (Table 4, column “Velocity”), e.g., for the “Karb” district in the neighborhood of the Karb settlement (Table 4, row No. 3), 245 mm were measured within 54 days, being equivalent to 1659 mm per year. Even though the observed deformation phenomenon is highly nonlinear due to the nature of the underground excavation works, the calculation of subsidence rate in millimeter per year units allows the comparison of deformation occurring in different places. Therefore, the maximum subsidence recorded within 239 days for the trough “Bantka” (Table 4, row No. 2) is 550 mm, which is equivalent to a subsidence rate of 842 mm/year. Thus, although the value of deformation is greater than the one in the “karb” trough, the rate is almost two times lower, which suggests that the deformation on “karb” district was potentially more dangerous for urban structures and infrastructures. Furthermore, velocity calculation allows for the comparison of the displacement estimates retrieved from the analysis of 11-day interferograms with those obtained from the SqueeSARTM analysis at the MPs (see last two columns of Table 4).
Table 4. Main characteristics of the subsidence troughs identified in the interferograms. In bold the area of the Karb settlement in Bytom.
Conventional DInSAR: InterferogramsAdvanced DInSAR: SqueeSARTM Results on a 1 km Buffered Area around Every Subsidence Trough
No.DistrictDate of First FringesDate of Last FringesPeriod with Fringes [Days]Total Displacement [mm]LOS Velocity [mm/year]MP density per km2Mean Total Displacement [mm]Max. Total Displacement [mm]Mean LOS Velocity [mm/year]
1Miechowice25 November 201110 June 2012196−536−9971501−4−131−4
2Brantka12 October 201110 June 2012239−550−842726−23−64−23
3Karb05 July 201129 August 201154−245−16591167−12−66−12
4Brzeziny05 July 201128 December 2011173−629−1326977−13−71−11
5Dolki05 July 201121 June 2012346−664−6971268−4−82−2
6Gieraltowice10 February 201210 June 2012121−271−819740−57−312−55
7Paniowki05 July 201110 June 2012336−330−360533−17−183−18
8Chudow25 November 201121 June 2012206−92−163487−36−197−42
9Borowa16 April 201227 April 201211−16−545743−28−220−31
10Paniowy09 September 201119 May 2012250−277−405421−38−150−44
11Ornantowice27 July 201128 December 2011151−173−419392−21−88−23
12Pelcowka12 October 201128 December 201176−60−287609−4−40−4
13Bielszowice16 July 201110 June 2012325−345−3861734−5−200−5
14Park_strzelnica14 March 201205 April 201222−29−4891479−12−60−12
15Wirek09 September 201121 June 2012282−317−4092495−15−133−16
16Ruda_slaska16 July 201128 December 2011162−83−1862242−8−75−10
17Wirek208 May 201230 May 201222−33−5421485−29−65−30
18Kochlowice05 July 201130 May 2012325−219−2451717−13−281−14
19Klodnica17 December 201116 April 2012119−60−184779−10−51−13
20Stare_panewniki14 November 201114 March 2012120−66−202121−23−34−27
21Radoszowy03 March 201216 April 201243−49−419969−1−13−6
22Ligota23 October 201103 November 201111−16−5232894−36−195−35
23Murcki07 August 201105 April 2012239−33−5195−11−25−13
24Staw_barbara25 November 201128 December 201133−48−529348−9−59−10
25Giszowiec25 March 201205 April 201211−16−544800−10−76−11
26Stara_wesola25 March 201205 April 201211−17−571428−12−58−11
27Myslowice23 October 201110 June 2012228−94−150180−13−55−12
28Wesola29 August 201105 April 2012217−89−149625−28−66−32
29Morgi05 July 201112 October 201197−103−388796−22−197−23
30Ledziny05 July 201128 December 2011173−256−541920−13−113−12
31Ledziny_halda16 April 201227 April 201211−16−5295140−1000

5.2. Analysis of Advanced DInSAR Results

The SqueeSARTM analysis of TerraSAR-X data for the period 05 July 2011–21 June 2012 provides a dense spatial cover of superficial displacement measurements (3400 MP/km2), reaching up to 334 mm/year in the LOS (Figure 4). Uncovered areas by MP targets related to the loss of coherence, can be explained by either the presence of a vegetated land cover or to very fast displacements out of the detection threshold of SqueeSARTM technique. Statistical analysis of MP distribution reveals that the MP density is almost double in urban areas than in rural/vegetated areas (4296 MP/km2 versus 2673 MP/km2). Furthermore, taking into account that the theoretical maximum detection threshold of advanced DInSAR techniques for a continuous 11 day TerraSAR-X dataset is approximately 250 mm/year between neighboring pixels (depending on the spatial and temporal pattern of points and the shape of the deformation itself) [49], SqueeSARTM can only detect deformation on the boundaries of the subsidence trough, failing to measure decimetric displacement measured in its inner parts, as shown in the previous section. The main advantages of SqueeSARTM for mining subsidence monitoring are the spatial delimitation of the subsidence trough boundaries and the quantification, with millimetric accuracy, of the residual subsidence that affects the area surrounding the subsidence trough. Even though the most intense subsidence is produced within the subsidence trough, the residual subsidence may affect a few kilometers around the subsidence trough.
The integration of SqueeSARTM results with conventional DInSAR, permits to fully exploit TerraSAR-X monitoring capacities for very fast mining subsidence phenomena (Figure 9). In the USCB study area conventional DInSAR permits to delimit areas affected by cumulated subsidence from 20 to 660 mm with a centimetric resolution (Figure 8, Figure 9b), whereas SqueeSARTM results permit to define areas affected by subsidence from 5 to 312 mm with a millimetric resolution (Figure 9a). Therefore, the integration of both results derived from the same TerraSAR-X dataset with different DInSAR approaches, permits to provide the most complete picture of the mining subsidence occurred in the study area (Figure 9c). For this purpose, considering that visual recognition of the detected subsidence troughs shows that approximately 1 km away from them subsidence estimates are residual (less than 1 cm of cumulated displacement), average cumulated displacement values were calculated 1km around every subsidence trough. This analysis demonstrates the existence of a residual subsidence area around the 31 detected subsidence troughs that accounts on average a 17 mm/year subsidence rate. Thus, the closer the MP (measurement points) are to the troughs, the faster subsidence (up to 334 mm/year), coinciding in some cases with the outer fringes detected by conventional DInSAR. No SqueeSARTM results are obtained in the central part of the subsidence troughs, where the subsidence gradient is greater. At certain specific locations an uplift displacement reaching 66 mm maximum is recorded from SqueeSARTM analysis. In several areas, these positive displacements coincide with neighboring areas of active mining areas where strong subsidence gradients have been measured. A plausible explanation of this uplift could be the abandonment of underground mining labors inundated by groundwater triggering superficial positive displacements. Other possibilities should be analyzed in future works, such as different phases of tectonic stressing and distressing. As it is expected, stable areas coincide with areas where mining activities are not conducted or stopped in the nineties (e.g., as it is shown on Figure 10a).
Figure 9. Cumulated displacements in the Upper Silesia Coal Basin, Katowice and Ruda Ślaska area. (a) Permanent Scatterers Interferometry (PSI) cumulated displacement; (b) cumulated displacement measured for the subsidence troughs derived from conventional Differential Synthetic Aperture Radar Interferometry (DInSAR); and (c) PSI cumulated displacement values superimposed on the subsidence troughs derived from conventional DInSAR. Common color scale is used both for PSI and the troughs cumulated displacement value, with this remark that for the trough (b,c), the value refer only to the maximum detected subsidence within the whole active area.
Remotesensing 07 05300 g009
The SqueeSARTM results also provide time series of every PSI point, which significantly improve the understanding of the motion. In Figure 10 two examples are shown. PSI cumulated displacements reveal a stable behavior around the reference point (Figure 10a, see location in Figure 4). Time series of all the MP located within 100 m distance of the reference point also supports this statement (Figure 10c). On the other hand, the MP located around the detected subsidence trough (Figure 10b) reveal a significant nonlinear motion in the averaged time series (Figure 10d). Note that fringes were only visible since 17 December 2011 (trough No. 19 in Table 4), coinciding with the acceleration of the cumulated displacement observed on the MP time series since the beginning of 2012.
Figure 10. (a) Cumulated displacement measured on Permanent Scatterers Interferometry (PSI) points in the area of the reference point (Figure 4); (b) cumulated displacement measured for the subsidence trough no. 19 “Klodnica” (Figure 8, Table 4) superimposed on the PSI cumulated displacement; (c) time series of PSI around 100 m of the reference point. In blue squares the averaged value; and (d) time series of PSI around 100 m of the subsidence trough from (b). In red squares the averaged value.
Remotesensing 07 05300 g010

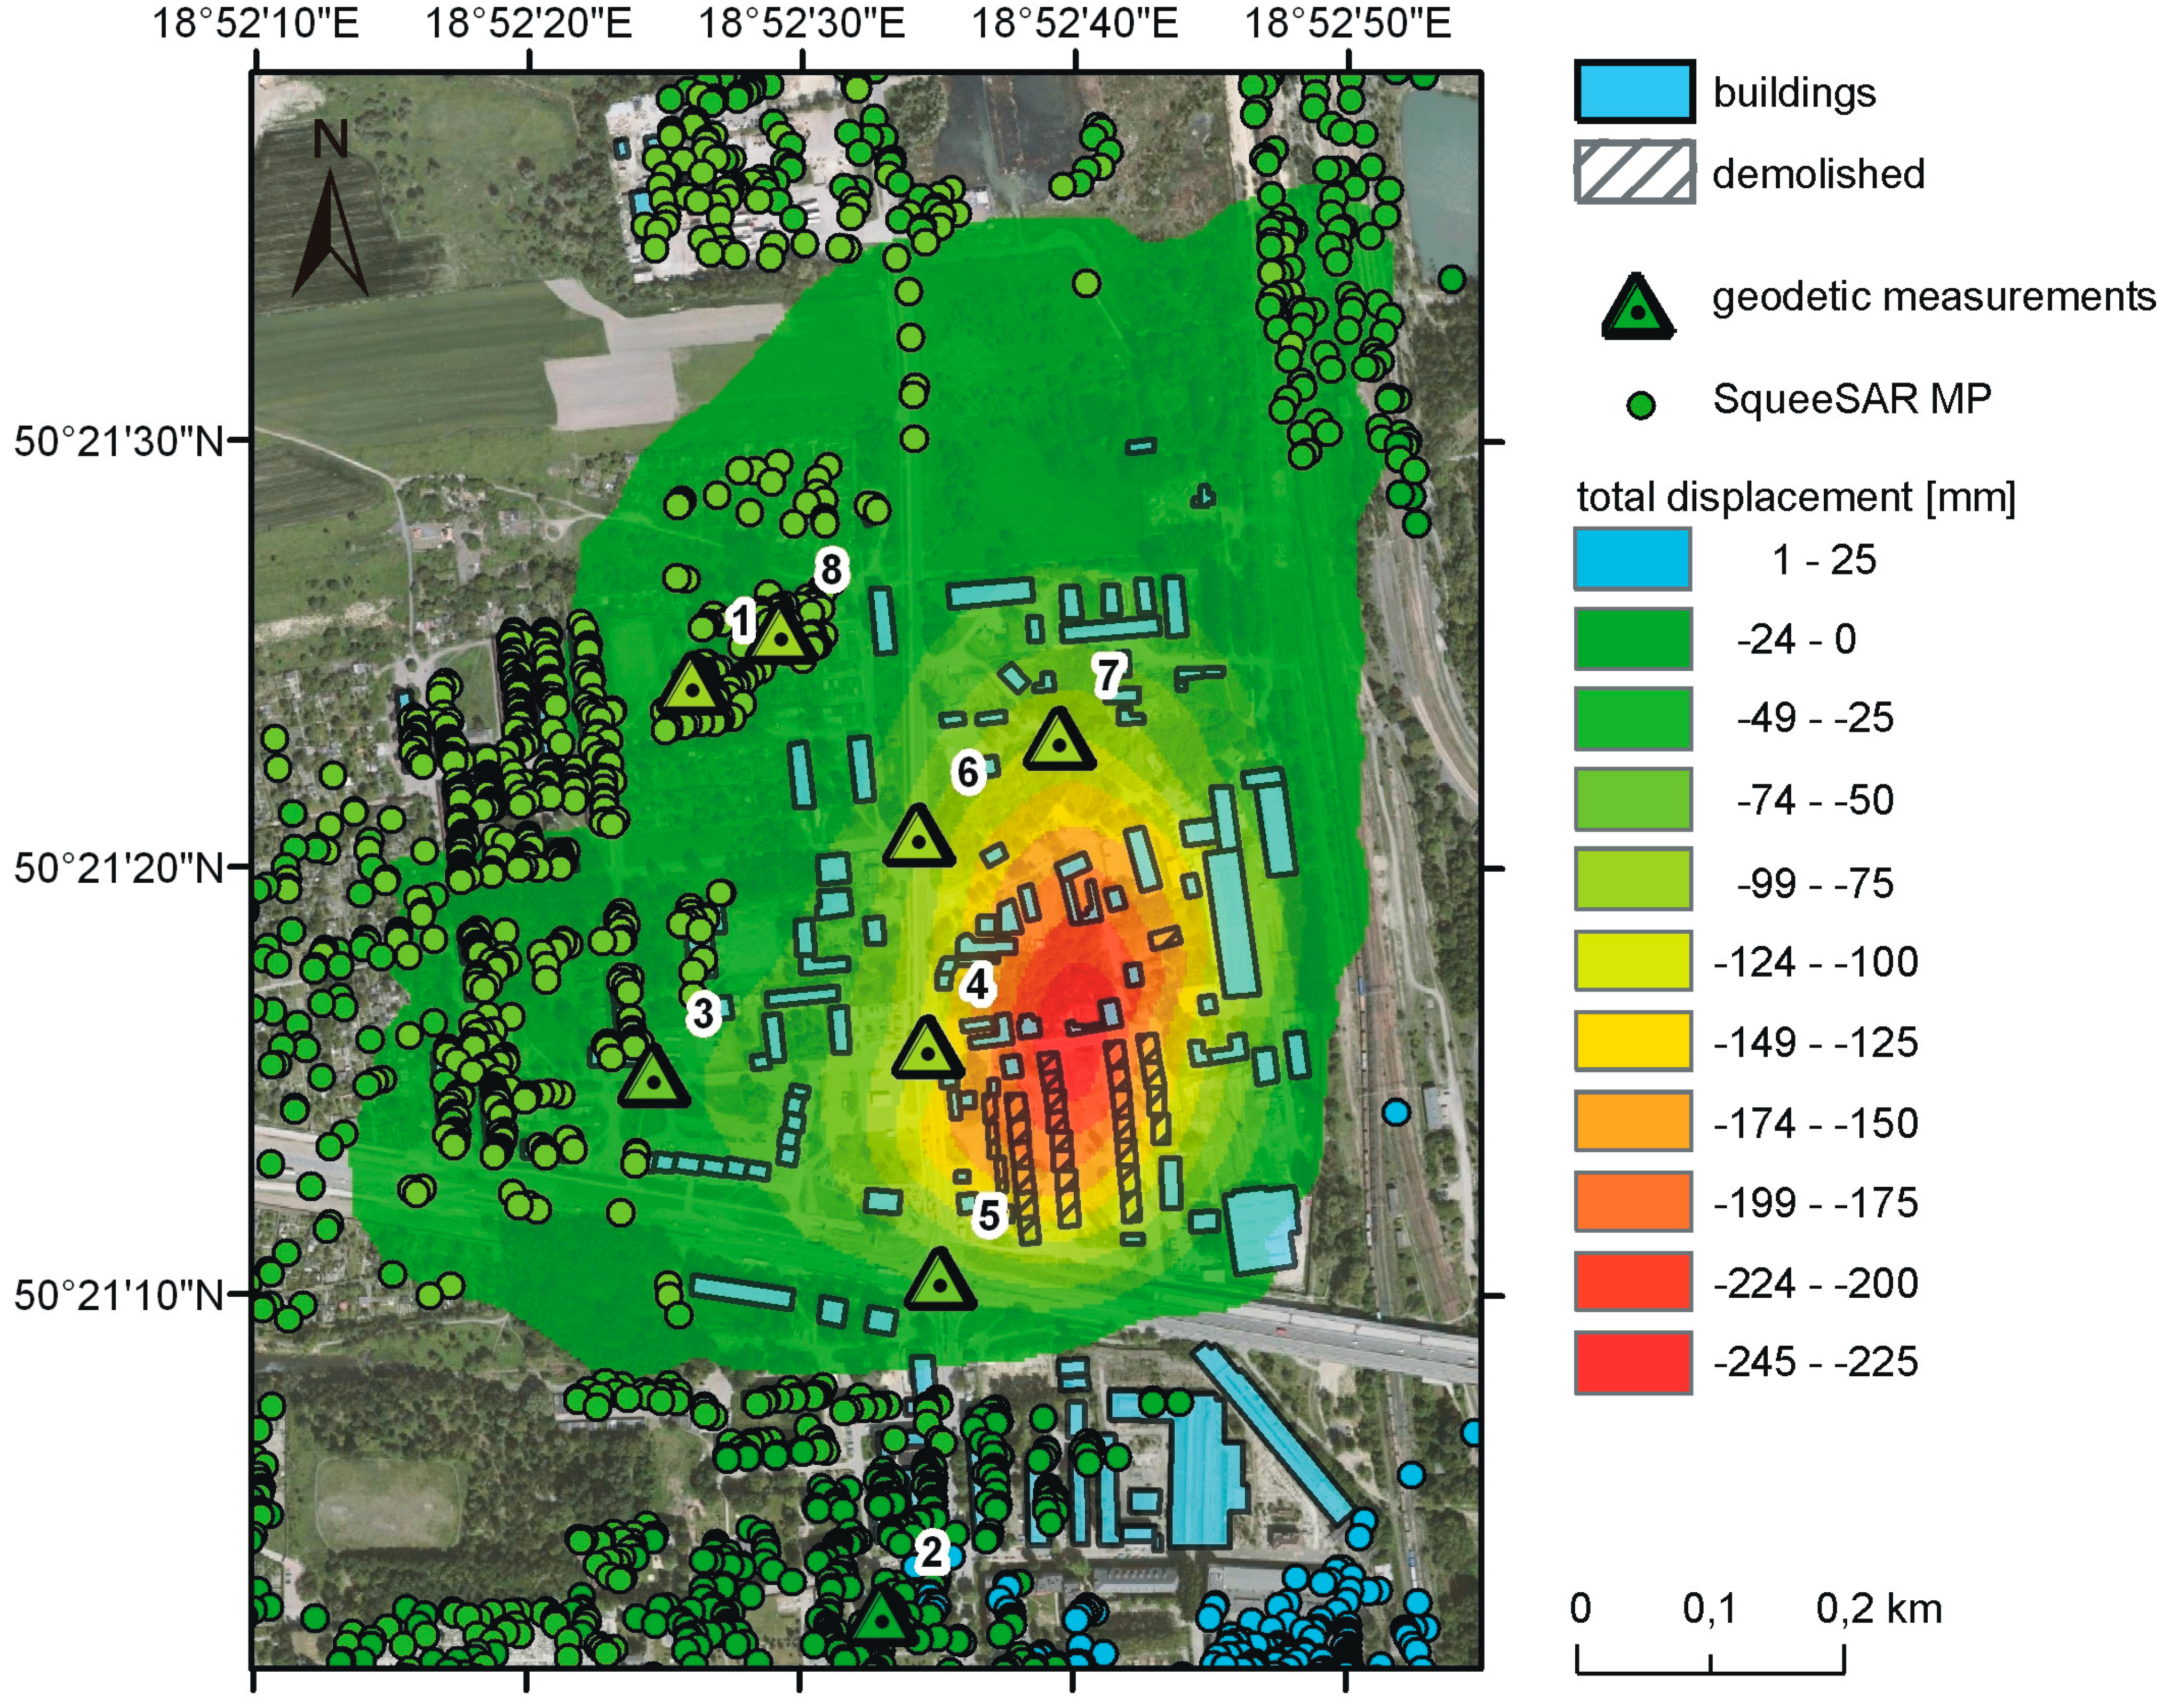
5.3. Analysis and Validation of the Results in the Bobrek-Centrum Mining Area

A detailed study of Bobrek-Centrum mining area is presented in order to validate retrieved conventional DInSAR and SqueeSARTM displacement results. This will be achieved through: (1) the analysis of the relationship between the temporal evolution of detected displacements, underground mining excavation progress and damages produced in Karb urban settlement; and (2) a semi-quantitative comparison of DInSAR displacement estimates and available geodetic data for part of the monitoring period. This local analysis highlights the usefulness of the proposed combined approach between conventional and advanced DInSAR to monitor fast deformation phenomena in mining areas.
SqueeSARTM results in Bobrek-Centrum yielded 1533 MP/km2, measuring superficial displacements between −147 and +22 mm/year in the period 05 July 2011–21 June 2012. It is observed that MP targets are detected in the external part of the subsidence troughs and in the surrounding nearby areas (Figure 11a), being affected by a residual subsidence below 150 mm/year (−4 mm/year on average).
Figure 11. (a) Permanent Scatterers Interferometry (PSI) cumulated displacement map with the boundary of PSI points moving faster than −5 mm/year (red line). Common color scale is used both for PSI and the troughs cumulated displacement value. Note that in the case of the troughs the value refers to the maximum detected subsidence within the whole period of observation. (b) Areas of probable influence of the mining activity, named: Bytom VI, Bytom III and Bytom-Centrum (green, orange and blue lines respectively) according to [50].
Remotesensing 07 05300 g011
In order to delimitate the area affected both by the subsidence trough and its related residual settlement we interpolate MP data. Based on several examples of geostatistical modeling over subsiding or mining areas [51,52,53], simple Kriging method was chosen, applying a Normal Score Transformation with a Spherical model (sill of 0.87 mm/year in combination with a nugget 0.15 mm/year). From the interpolation results a contour line was derived for those pixels with a subsidence rate greater than 5 mm/year, which defines the influence area (8.5 km2) of mining subsidence. This contour refers to the area that was subjected to ground movements caused by operational work in Bobrek-Centrum and EKO-Plus mines in period July 2011–June 2012. Within this contour three polygons indicate the subsidence troughs distinguished on the interferograms (see Figure 7). Likewise, within the region delimited by this contour, three areas of probable influence of both Bobrek-Centrum and EKO-Plus mines were defined by [50] (Figure 11b). These areas are referred to as Bytom-Centrum and Bytom III areas for Bobrek-Centrum, whereas Bytom VI is the area of influence of EKO-Plus mine [50]. Analysing both conventional and advanced DInSAR results on these areas we observe that the greatest displacement is clearly concentrated in the former mine, where in addition to the detected subsidence troughs, MP subsidence rate reach up to 147 mm/year.
Subsidence troughs could only be detected with conventional DInSAR (i.e., interferograms analysis) due to the magnitude of the subsidence rate (Figure 7 and Figure 8). The subsiding troughs are detected on top of Bobrek-Centrum mining area, measuring up to 245 mm in 54 days, which is equivalent to 1659 mm/year on Karb urban settlement within the 05 July 2011–21 June 2012 monitoring period. Focusing on this particular deformation signal, we observe that all superficial displacement was detected in six subsequent interferograms from 05 July 2011 to 29 August 2011 with 11 day temporal sampling (Figure 12a–f). This deformation signal is strongly correlated spatially and temporally with the temporal evolution of underground works, provided by Bobrek-Centrum mine, shown in Figure 12g. This works started in September 2010 in the northern area progressing to the south, being stopped immediately after the evacuation of residents in August 2011.
Figure 12. (af) Six subsequent X-band differential interferograms over Karb settlement; (g) seventh X-band interferogram and the location of the coal extraction work plan executed under Karb settlement from December 2010 to August 2011; and (h) location of the demolished buildings (Figure 2). The values of detected displacement are reported in the labels over the interferogram fringes.
Remotesensing 07 05300 g012
In these interferograms several fringes can be appreciated even if the signal is clearly decorrelated towards the center of the subsidence area. This is probably due to a faster displacement, characteristic from mining subsidence phenomenon, which overpass the detection threshold of TerraSAR-X satellite. Note that if we only consider the first interferogram, measured displacement from 5–16 July 2011 is 60 mm, which is equivalent to 1991 mm/year. Gradually towards September a reduction of the fringes (i.e., subsidence velocity) is appreciated. From 29 August–9 September 2011 less than 15 mm can be measured (<500 mm/year), whereas in the next 11 days, until 20 September 2011, superficial displacements are undetectable. Since then, and until the end of the acquisition period in June 2012, no fringes are identified (Figure 12g) in the inferferograms. Based on the interferogram analysis and assuming that the real displacement could have been greater due to the above-mentioned decorrelation, the cumulated displacement measured between July and August 2011 reached 245 mm (1659 mm/year). This peak of subsidence rate is temporally and spatially correlated with the temporal evolution of the coal excavation shown in Figure 12g, and with the evacuation of residents occurred in August 2011.
The addition of the different subsidence isolines detected in every interferogram, permits estimating the minimum cumulated displacement affecting the Karb urban between July and August 2011, which was responsible for the demolition of 28 buildings (Figure 12h, Figure 13). However, some buildings located on the northern part of the most deformed area were not severely damaged (Figure 13). This can be explained by the fact that demolished buildings exhibit the weakest structural response to mining subsidence (most of them were pre-II World War), and they are probably the closest to the area where the strongest subsidence occurred, which is probably out of the detection range of the interferograms generated with X-band images.
Geodetic measurements are only available from November 2011 to November 2012, i.e., after the strongest subsidence occurred leading to the evacuation of people and the demolition of several buildings (Figure 13). Therefore the temporal span covered by satellite and in situ data is only coinciding since November 2011 to June 2012 and therefore only a semi-quantitative comparison can be made. The geodetic measurements were performed by the mine using precise leveling on eight locations over Karb settlement [32], four of them coincide with MPs detected with SqueeSARTM approach away from the center of the subsidence through, and the rest coincide with deformation signals detected with DInSAR interferograms in the center of the subsidence trough (Figure 13). The comparison between ground truth data and SqueeSARTM has been made averaging the subsidence rate of all the MPs located at a 50 m distance from the geodetic points. According to Table 5 the average absolute difference between SqueeSARTM and geodetic measurements projected to TSX LOS is 7 mm/year that represents 14% of the average displacement rate measured by the geodetic benchmarks. This is a good agreement between both datasets if we assume that the common temporal span is a six-month period. The estimated error in line with previous works that demonstrate the usefulness of advanced DInSAR techniques (SqueeSARTM in this case) to monitor a moderate subsidence phenomena providing high precision and spatial accuracy [54,55,56,57,58]. Therefore retrieved SqueeSARTM results seem to be reliable for the regional detection of residual subsidence surrounding the subsidence troughs produced by underground mining excavation works. The comparison between geodetic benchmarks and subsidence isolines derived from the interferograms is more qualitative since the latter are related to the period July–August 2011, where no geodetic data is available and the greatest subsidence occurred. Assuming this temporal mismatch the average absolute error would be of 25 mm, which is 41% of the average displacement rate measured by the geodetic benchmarks.
Figure 13. Integrated subsidence map over Karb settlement covering period 05 July 2011–29 August 2011.
Remotesensing 07 05300 g013
Table 5. Comparison of the results from Synthetic Aperture Radar Interferometry (InSAR) and geodetic measurements projected to TerraSAR-X Line of Sight over Karb settlement. Monitoring period for InSAR was 05 July 2011–21 June 2012, whereas for geodetic measurements November 2011–November 2012.
No.SqueeSARTM (mm/year)Geodesy (mm/year)ErrorNo.DInSAR (mm)Geodesy (mm)Error
1−66−7264−105−6441
2−13−855−33−5623
3−67−56116−65−641
8−69−6457−100−6436
Average53.75507 75.756225

6. Conclusions

Differential Radar Interferometry has been used to detect and monitor very fast mining-induced subsidence over Upper Silesian Coal Basin in Poland. A total of 30 TerraSAR-X satellite images have been processed using both DInSAR and advanced DInSAR techniques (i.e., SqueeSARTM). At a regional scale over a 900 km2 area, retrieved deformation signals have been compared with the location of mining districts in order to identify those mining areas producing the greatest surficial subsidence and to delimit spatially and temporarily the extent of the area affected by mining subsidence. At a local scale in the Bobrek-Centrum mining area, DInSAR results were compared with the spatial and temporal evolution of underground mining excavation works and induced damages, as well as with available geodetic data.
Conventional DInSAR approach was used to generate 28 differential interferograms identifying 31 subsidence troughs in a 900 km2 study area between 05 July 2011 and 21 June 2012. Within this 12 month period, the high resolution and short TerraSAR-X revisiting time allowed for the detection of up to 245 mm of displacement in 54 days (equivalent to 1660 mm/year) and up to 660 mm of cumulated displacements for certain subsidence troughs. However, even faster displacements could have potentially occurred within the center of the mining bowl area that could not be detected due to interferometric decorrelation. Overall the USCB area, the northern, western and eastern parts exhibit numerous subsidence troughs ranging from 100 to 660 mm of cumulated subsidence that coincide with ongoing mining excavation works.
SqueeSARTM processing yielded a very dense measurement point distribution, failing to detect faster displacements than 330 mm/year, which occur within the subsidence troughs detected with conventional DInSAR. Despite this limitation, the millimetric precision achieved with SqueeSARTM permitted to detect and monitor residual mining subsidence surrounding the detected subsidence troughs. Hence, the real extent of the mining influence area could be identified defining urban and sub-urban areas affected by mining subsidence. In this sense, it has been demonstrated the existence of a residual subsidence of 17 mm/year on average around the 31 detected subsidence troughs, which decreases below 10 mm/year 1 km away from them. On the other hand, as it is expected, stable areas coincide with areas where mining activities are not conducted or stopped in the nineties.
The combined approach between conventional and advanced DInSAR has been validated over Bytom City were Bobrek-Centrum mine activity produced severe damages to urban fabric. Conventional DInSAR permitted to successfully map subsidence troughs between July and August 2011 (up to 1660 mm/year). This deformation signals coincide spatially and temporally with the evolution of underground mining excavations, which was responsible for the demolition of 28 buildings of Karb district. Additionally, SqueeSARTM displacement estimates were useful to delimit an area of 8.3 km2 of Bytom city that is affected by a residual mining subsidence greater than 5 mm/year and could potentially suffer damages in the midterm. The comparison between geodetic data and SqueeSARTM for the common monitoring period yield and average absolute difference of 7 mm/year that represents 14% of the average displacement rate measured by the geodetic benchmarks.
In this work the analysis of TerraSAR-X satellite images combining both conventional and advanced DInSAR approaches has proven to be effective to detect the extent and the magnitude of mining subsidence impact on urban areas. Conventional DInSAR was useful to detect the most active mining subsidence areas, whereas advanced DInSAR permitted to delimit residual mining subsidence surrounding the detected subsidence troughs. Further studies will focus on the understanding on the direction of movement through the combination of InSAR measurements with geodetic in-situ surveys (e.g., GPS data) [59,60].
Consequently, the methodology presented in this work has demonstrated to be crucial for the detection and monitoring of mining subsidence in urban areas such as the USCB, an area inhabited by three million people where subsidence directly impacts on urban structures and infrastructures service limit state.

Acknowledgements

This project was funded by Doris project, granted by the European Commission under FP7/2007–2013 Grant Agreement n. 242212. Additional funding was obtained from Spanish Research Program through the project ESP2013-47780-C2-2-R and Polish Geological Institute—National Research Institute statutory activities through the project 61-2506-1401-00-0.

Author Contributions

Maria Przyłucka and Gerardo Herrera developed the main idea that led to this paper. Marek Graniczny contributed to the analysis and the discussion. Davide Colombo provided InSAR processing and its description. Marta Béjar-Pizarro contributed to the final discussion. All authors read and approved the final manuscript.

Conflicts of Interest

The authors declare no conflict of interest.

References

  1. Bell, F.G.; Stacey, T.R.; Genske, D.D. Mining subsidence and its effect on the environment: Some differing examples. Environ. Geo. 2000, 40, 135–152. [Google Scholar] [CrossRef]
  2. Crowell, D.L. The hazards of mine subsidence. In Ohio Geology; Ohio Department of Natural Resources: Columbus, OH, USA, 1995; pp. 1–5. [Google Scholar]
  3. Ren, G.; Li, J. A study of angle of draw in mining subsidence using numerical modelling techniques. Electron. J. Geotech. Eng. 2008, 13, 1–14. [Google Scholar]
  4. Borecki, M. Ochrona powierzchni przed szkodami górniczymi; Śląsk: Katowice, Poland, 1980; p. 967. [Google Scholar]
  5. Kwiatek, J. Ochrona Obiektów Budowlanych na Terenach Górniczych; GIG: Katowice, Poland, 1997; p. 726. [Google Scholar]
  6. Paleczek, W. Metoda obliczania wartości promienia zasięgu wpływów głównych z wykorzystaniem danych geomechanicznych skal. Zeszyty Naukowe Politechniki Czestokowskich. Budownictwo 2009, 15, 19–36. [Google Scholar]
  7. Konopko, W. Wydobycie węgla i destrukcja górotworu w Górnośląskim Zagłębiu Węglowym. Przegląd Górniczy 2010, 66, 1–10. [Google Scholar]
  8. Dulias, R. Impact of mining subsidence on the relief of the Rybnik Plateau, Poland. Z. Geomorphologie, Suppl. Issues 2011, 55, 25–36. [Google Scholar] [CrossRef]
  9. Helios Rybicka, E. Impact of mining and metallurgical industries on the environment in Poland. Appl. Geochem. 1996, 1, 3–9. [Google Scholar]
  10. Buła, Z.; Kotas, A. Atlas Geologiczny Górnośląskiego Zagłębia Węglowego. Mapy Strukturalne. Cz. 3; PIG: Warsaw, Poland, 1994. [Google Scholar]
  11. Buła, Z.; Jachowicz, M.; Zaba, J. Principal characteristics of the Upper Silesian Block and Malopolska Block border zone (Southern Poland). Geol. Mag. 1997, 134, 669–677. [Google Scholar] [CrossRef]
  12. Buła, Z.; Habryn, R.; Krieger, W.; Kurek, S.; Markowiak, M.; Woźniak, P. Geological Atlas of the Palaeozoic without the Permian in the Border Zone of the Upper Silesian and Małopolska Blocks. Explanatory Text; PIG: Warsaw, Poland, 2002. [Google Scholar]
  13. Szufilcki, M.; Malon, A.; Tymiński, M. Bilans Zasobów Złóż Kopalin w POLSCE wg Stanu na 31 XII 2012 r; PGI-NRI: Warsaw, Poland, 2013; p. 49. (In Polish) [Google Scholar]
  14. Klabis, L.; Kowalski, A. Eksploatacja górnicza w filarze ochronnym dla śródmieścia Bytomia, historia i teraźniejszość. In Proceedings of the V konferencja naukowo szkoleniowa GIG, Bezpieczeństwo i ochrona obiektów budowlanych na terenach górniczych, Karpacz, Poland, 15–17 October 2014.
  15. Białecka, B. Tereny zdegradowane działalnością górniczą—Geneza. In Tereny pogórnicze—Szanse, Zagrożenia. Analiza Przypadku; Białecka, B., Biały, W., Eds.; Panova SA: Gliwice, Poland, 2014; p. 14. [Google Scholar]
  16. Carnec, C.; Delacourt, C. Three years of mining subsidence monitored by SAR interferometry, Near Gardanne, France. J. Appl. Geophys. 2000, 43, 43–54. [Google Scholar] [CrossRef]
  17. Wegmuller, U.; Werner, C.; Strozzi, T.; Wiesmann, A. Monitoring mining induced surface deformation. IEEE Proc. Geosci. Remote Sens. Symp. 2004, 3, 1933–1935. [Google Scholar]
  18. Herrera, G.; Tomás, R.; Vicente, F.; Lopez-Sanchez, J.M.; Mallorquí, J.J.; Mulas, J. Mapping ground movements in open pit mining areas using differential SAR interferometry. Int. J. Rock Mech. Min. Sci. 2010, 47, 1114–1125. [Google Scholar] [CrossRef]
  19. Benecke, N.; Bateson, L.; Browitt, C.; Declercq, P.; Graniczny, M.; Marsh, S.; Zimmermann, K. Perspectives concerning satellite EO and geohazard risk management: The way forward—Community paper concerning inactive mines hazards. In Proceedings of the The InternatIonal Forum on Satellite EO and Geohazardas, Forum on Satellite EO and Geohazards, Santorini, Greece, 21–23 May 2012.
  20. Engelbrecht, J.; Inggs, M. Differential interferometry techniques on L-band data employed for the monitoring of surface subsidence due to mining. S. Afr. J. Geomatics. 2013, 2, 82–93. [Google Scholar]
  21. Perski, Z. Applicability of ERS-1 and ERS-2 InSAR for land subsidence monitoring in the Silesian coal mining region, Poland. Int. Arch. Photogramm. Remote Sens. 1998, 32, 555–558. [Google Scholar]
  22. Perski, Z.; Jura, D. ERS SAR interferometry for land subsidence detection in coal mining areas. Earth Obs. Quart. 1999, 63, 25–29. [Google Scholar]
  23. Popiolek, E.; Hejmanowski, R.; Krawczyk, A.; Perski, Z. Application of Satellite Radar Interferometry to the examination of the areas of mining exploitation. Surf. Mining Braunkhole Other Miner. 2002, 54, 74–82. [Google Scholar]
  24. Graniczny, M.; Kowalski, Z.; Lesniak, A.; Czarnogorska, M.; Piatkowska, A. Analysis of the PSI data from the Upper Silesia—SW Poland. In Proceedings of the International Geohazard Week, ESA-ESRIN, Frascati, Rome, Italy, 5–6 November 2007.
  25. Graniczny, M. Sosnowiec, Poland. In The Terrafirma Atlas—The Terrain-Motion Information Service for Europe; Capes, R., Marsh, S., Eds.; ESA: Frascati, Italy, 2009; p. 34. [Google Scholar]
  26. Leśniak, A.; Porzycka, S. Impact of tectonics on ground deformations caused by mining activity in the north-eastern part of the Upper Silesian Coal Basin. Gospodarka Surowcami Mineralnymi 2009, 25, 227–238. [Google Scholar]
  27. Graniczny, M.; Colombo, D.; Kowalski, Z.; Przyłucka, M.; Zdanowski, A. New results on ground deformation in the Upper Silesian Coal Basin (Southern Poland) obtained during the DORIS Project (EU-FP 7). Pure Appl. Geophys. 2014. [Google Scholar] [CrossRef]
  28. Zdunska Wola, nasze miesto. Available online: http://zdunskawola.naszemiasto.pl/ (accessed on 27 June 2012). (In Polish)
  29. Bobrek-Centrum. Oddział KWK “Bobrek—Centrum”. Available online: http://www.kwsa.pl/ (accessed on 14 March 2014).
  30. GIG. Obszary Górnicze Kopalń Podziemnych oraz Płytkie Eksploatacje rud i Węgla Kamiennego w Górnośląskim Zagłębiu Węglowym; Mapy Ścienne, Beata Piętka: Katowice, Poland, 2012. [Google Scholar]
  31. Skrzypczyk-Kogut, B. Raport o Stanie Miasta Bytom 2011; Urząd Miasta Bytom: Bytom, Poland, 2012; pp. 120–123. [Google Scholar]
  32. Domagała, I. Raport o Stanie Miasta Bytom 2012; Urząd Miasta Bytom: Bytom, Poland, 2013; pp. 124–126. [Google Scholar]
  33. Dobak, P.; Dragowski, A.; Frankowski, Z.; Frolik, A.; Kaczynski, R.; Kotyrba, A.; Pininska, J.; Rybicki, S.; Wozniak, H. Zasady Dokumentowania Warunków Geologiczno-Inżynierskich dla Celów Likwidacji Kopalń; Polish Ministry of Enviroment: Warsaw, Poland, 2009; pp. 12–14.
  34. Popiołek, E. Warunki prowadzenia eksploatacji górniczej z uwagi na ochronę powierzchni. Przegląd Górniczy 2011, 67, 148–152. [Google Scholar]
  35. Curlander, J.C.; McDonough, R.N. Synthetic Aperture Radar: Systems and Signal Processing; John Wiley and Sons: New York, NY, USA, 1991; p. 647. [Google Scholar]
  36. Massonnet, D.; Feigl, K.L. Radar interferometry and its applications to changes in the earth’s surface. Rev. Geophys. 1998, 36, 441–500. [Google Scholar] [CrossRef]
  37. Ferretti, A.; Novali, F.; Bürgmann, R.; Hilley, G.; Prati, C. InSAR Permanent Scatterer analysis reveals ups and downs in San Francisco Bay area. Eos 2004, 85, 317–324. [Google Scholar] [CrossRef]
  38. Stramondo, S.; Chini, M.; Bignami, C.; Salvi, S.; Atzori, S. X-, C-, and L-band DInSAR investigation of the April 6, 2009, Abruzzi earthquake. IEEE Geoscie. Remote Sens. Lett. 2011, 8, 49–53. [Google Scholar] [CrossRef]
  39. Chaussard, E.; Falk, A. Precursory inflation of shallow magma reservoirs at west Sunda volcanoes detected by InSAR. Geophys. Res. Lett. 2012, 39. [Google Scholar] [CrossRef]
  40. Hay-Man Mg, A.; Chang, H.C.; Ge, L.; Rizos, C.; Omura, M. Assessment of radar interferometry performance for ground subsidence monitoring due to underground mining. Earth Planets Space 2009, 61, 733. [Google Scholar] [CrossRef]
  41. Ferretti, A.; Prati, C.; Rocca, F. Nonlinear subsidence rate estimation using Permanent Scatteres in Differential SAR Interferometry. IEEE Trans. Geosci. Remote Sens. 2000, 38, 2202–2212. [Google Scholar] [CrossRef]
  42. Ferreti, A.; Prati, C.; Rocca, F. Permanent Scatterers InSAR Interferometry. IEEE Trans. Geosci. Remote Sens. 2001, 39, 8–20. [Google Scholar] [CrossRef]
  43. Vasco, D.W.; Rucci, A.; Ferretti, A.; Novali, F.; Bissell, R.C.; Ringrose, P.S.; Mathieson, A.S.; Wright, I.W. Satellite-based measurements of surface deformation reveal fluid flow associated with the geological storage of carbon dioxide. Geophys. Res. Lett. 2010, 37. [Google Scholar] [CrossRef]
  44. Colesanti, C.; Ferretti, A.; Novali, F.; Prati, C.; Rocca, F. SAR monitoring of progressive and seasonal ground deformation using the Permanent Scatterers technique. IEEE Trans. Geosci. Remote Sens. 2003, 4, 1685–1701. [Google Scholar] [CrossRef]
  45. Bateson, L.; Cigna, F.; Boon, D.; Sowter, A. The application of the Intermittent SBAS (ISBAS) InSAR method to the South Wales Coalfield, UK. Int. J. Appl. Earth Obs. Geoinf. 2015, 34, 249–257. [Google Scholar] [CrossRef]
  46. Samsonov, S.; d’Oreye, N.; Smets, B. Ground deformation associated with post-mining activity at the French–German border revealed by novel InSAR time series method. Int. J. Appl. Earth Obs. Geoinf. 2013, 23, 142–154. [Google Scholar] [CrossRef]
  47. Ferretti, A.; Fumagalli, A.; Novali, F.; Prati, C.; Rocca, F.; Rucci, A. A new algorithm for processing interferometric data-stacks: SqueeSAR. IEEE Trans. Geosci. Remote Sens. 2011, 49, 3460–3470. [Google Scholar] [CrossRef]
  48. Manconi, A.; Casu, F.; Ardizzone, F.; Bonano, M.; Cardinali, M.; de Luca, C.; Guzzetti, F. Brief communication: Rapid mapping of event landslides: The 3 December 2013 Montescaglioso landslide (Italy). Nat. Hazards Earth Syst. Sci. Discuss. 2014, 2, 1465–1479. [Google Scholar] [CrossRef]
  49. Nitti, D.O.; Nutricato, R.; Bovenga, F.; Refice, A.; Chiaradia, M.T.; Guerriero, L. TerraSAR-X InSAR multipass analysis on Venice (Italy). Proc. SPIE 2009, 7477. [Google Scholar] [CrossRef]
  50. PGI-NRI. Midas service. Avaiable online: http://geoportal.pgi.gov.pl/portal/page/portal/MIDASGIS/start (accessed on 23 June 2014).
  51. Devleeschouwer, X.; Declercq, P.Y.; Flamion, B.; Brixko, J.; Timmermans, A.; Vanneste, J. Uplift revealed by radar interferometry around Liège (Belgium): A relation with rising mining groundwater. In Proceedings of the Post-Mining Symposium, Nancy, France, 6–8 February 2008; pp. 1–13.
  52. Strzelczyk, J.; Porzycka, S.; Lesniak, A. Analysis of ground deformations based on parallel geostatistical computations of PSInSAR data. In Proceedings of 2009 17th International Conference on Geoinformatics, Fairfax, VA, USA, 12–14 August 2009. [CrossRef]
  53. Sanabria, M.P.; Guardiola-Albert, C.; Tomás, R.; Herrera, G.; Prieto, A.; Sánchez, H.; Tessitore, S. Subsidence activity maps derived from DInSAR data: Orihuela case study. Nat. Hazards Earth Syst. Sci. 2014, 14, 1341–1360. [Google Scholar] [CrossRef]
  54. Lagios, E.; Sakkas, V.; Novali, F.; Bellotti, F.; Ferretti, A.; Vlachou, K.; Dietrich, V. SqueeSAR™ and GPS ground deformation monitoring of Santorini Volcano (1992–2012): Tectonic implications. Tectonophysics 2013, 594, 38–59. [Google Scholar] [CrossRef]
  55. Ferretti, A.; Savio, G.; Barzaghi, R.; Borghi, A.; Musazzi, S.; Novali, F.; Prati, C.; Rocca, F. Submillimeter accuracy of InSAR time series: experimental validation. IEEE Trans. Geosci. Remote Sens. 2007, 45, 1142–1153. [Google Scholar] [CrossRef]
  56. Raucoules, D.; Bourgine, B.; de Michele, M.; le Cozannet, G.; Closset, L.; Bremmer, C.; Veldkamp, H.; Tragheim, D.; Bateson, L.; Crosetto, M.; et al. Validation and Intercomparison of Persistent Scatterers Interferometry: PSIC4 project results. J. Appl. Geophys. 2009, 68, 335–347. [Google Scholar] [CrossRef]
  57. Herrera, G.; Tomás, R.; Lopez–Sanchez, J.M.; Delgado, J.; Vicente, F.; Mulas, J.; Cooksley, G.; Sánchez, M.; Duro, J.; Arnaud, A.; et al. Validation and comparison of advanced differential interferometry techniques: Murcia metropolitan area case study. ISPRS J. Photogramm. Remote Sens. 2009, 64, 501–512. [Google Scholar] [CrossRef]
  58. Bitelli, G.; Bonsignore, F.; del Conte, S.; Novali, F.; Pellegrino, I.; Vittuari, L. Integrated Use of Advanced InSAR and GPS Data for Subsidence Monitoring. Eng. Geol. Soc. Terr. 2015, 5, 147–150. [Google Scholar]
  59. Manconi, A.; Giordan, D.; Allasia, P.; Baldo, M.; Lollino, G. Surface displacements following the Mw 6.3 L’Aquila earthquake: One year of continuous monitoring via Robotized Total Station. Ital. J. Geosci. 2012, 131, f3. [Google Scholar]
  60. Bock, Y.; Wdowinski, S.; Ferretti, A.; Novali, F.; Fumagalli, A. Recent subsidence of the Venice Lagoon from continuous GPS and interferometric Synthetic Aperture Radar. Geochem. Geophys. Geosyst. 2012, 13. [Google Scholar] [CrossRef]

