
Remote Sensing of River Delta Inundation: Exploiting the Potential of Coarse Spatial Resolution, Temporally-Dense MODIS Time Series

 , ,
, ,
Abstract
:
1. Introduction: Background and Scope of This Paper
- Does inundation occur on the land surface in the respective deltas?
- Which area and which percentage of the river delta is affected by inundation and what is driving these inundation patterns?
- How often are certain areas inundated, and does rare or long-term inundation prevail?
- What are the advantages and disadvantages of coarse resolution optical data for inundation mapping?
2. Study Areas and Data

| Delta | Country | Area | Population | Climate (Köppen-Geiger) |
|---|---|---|---|---|
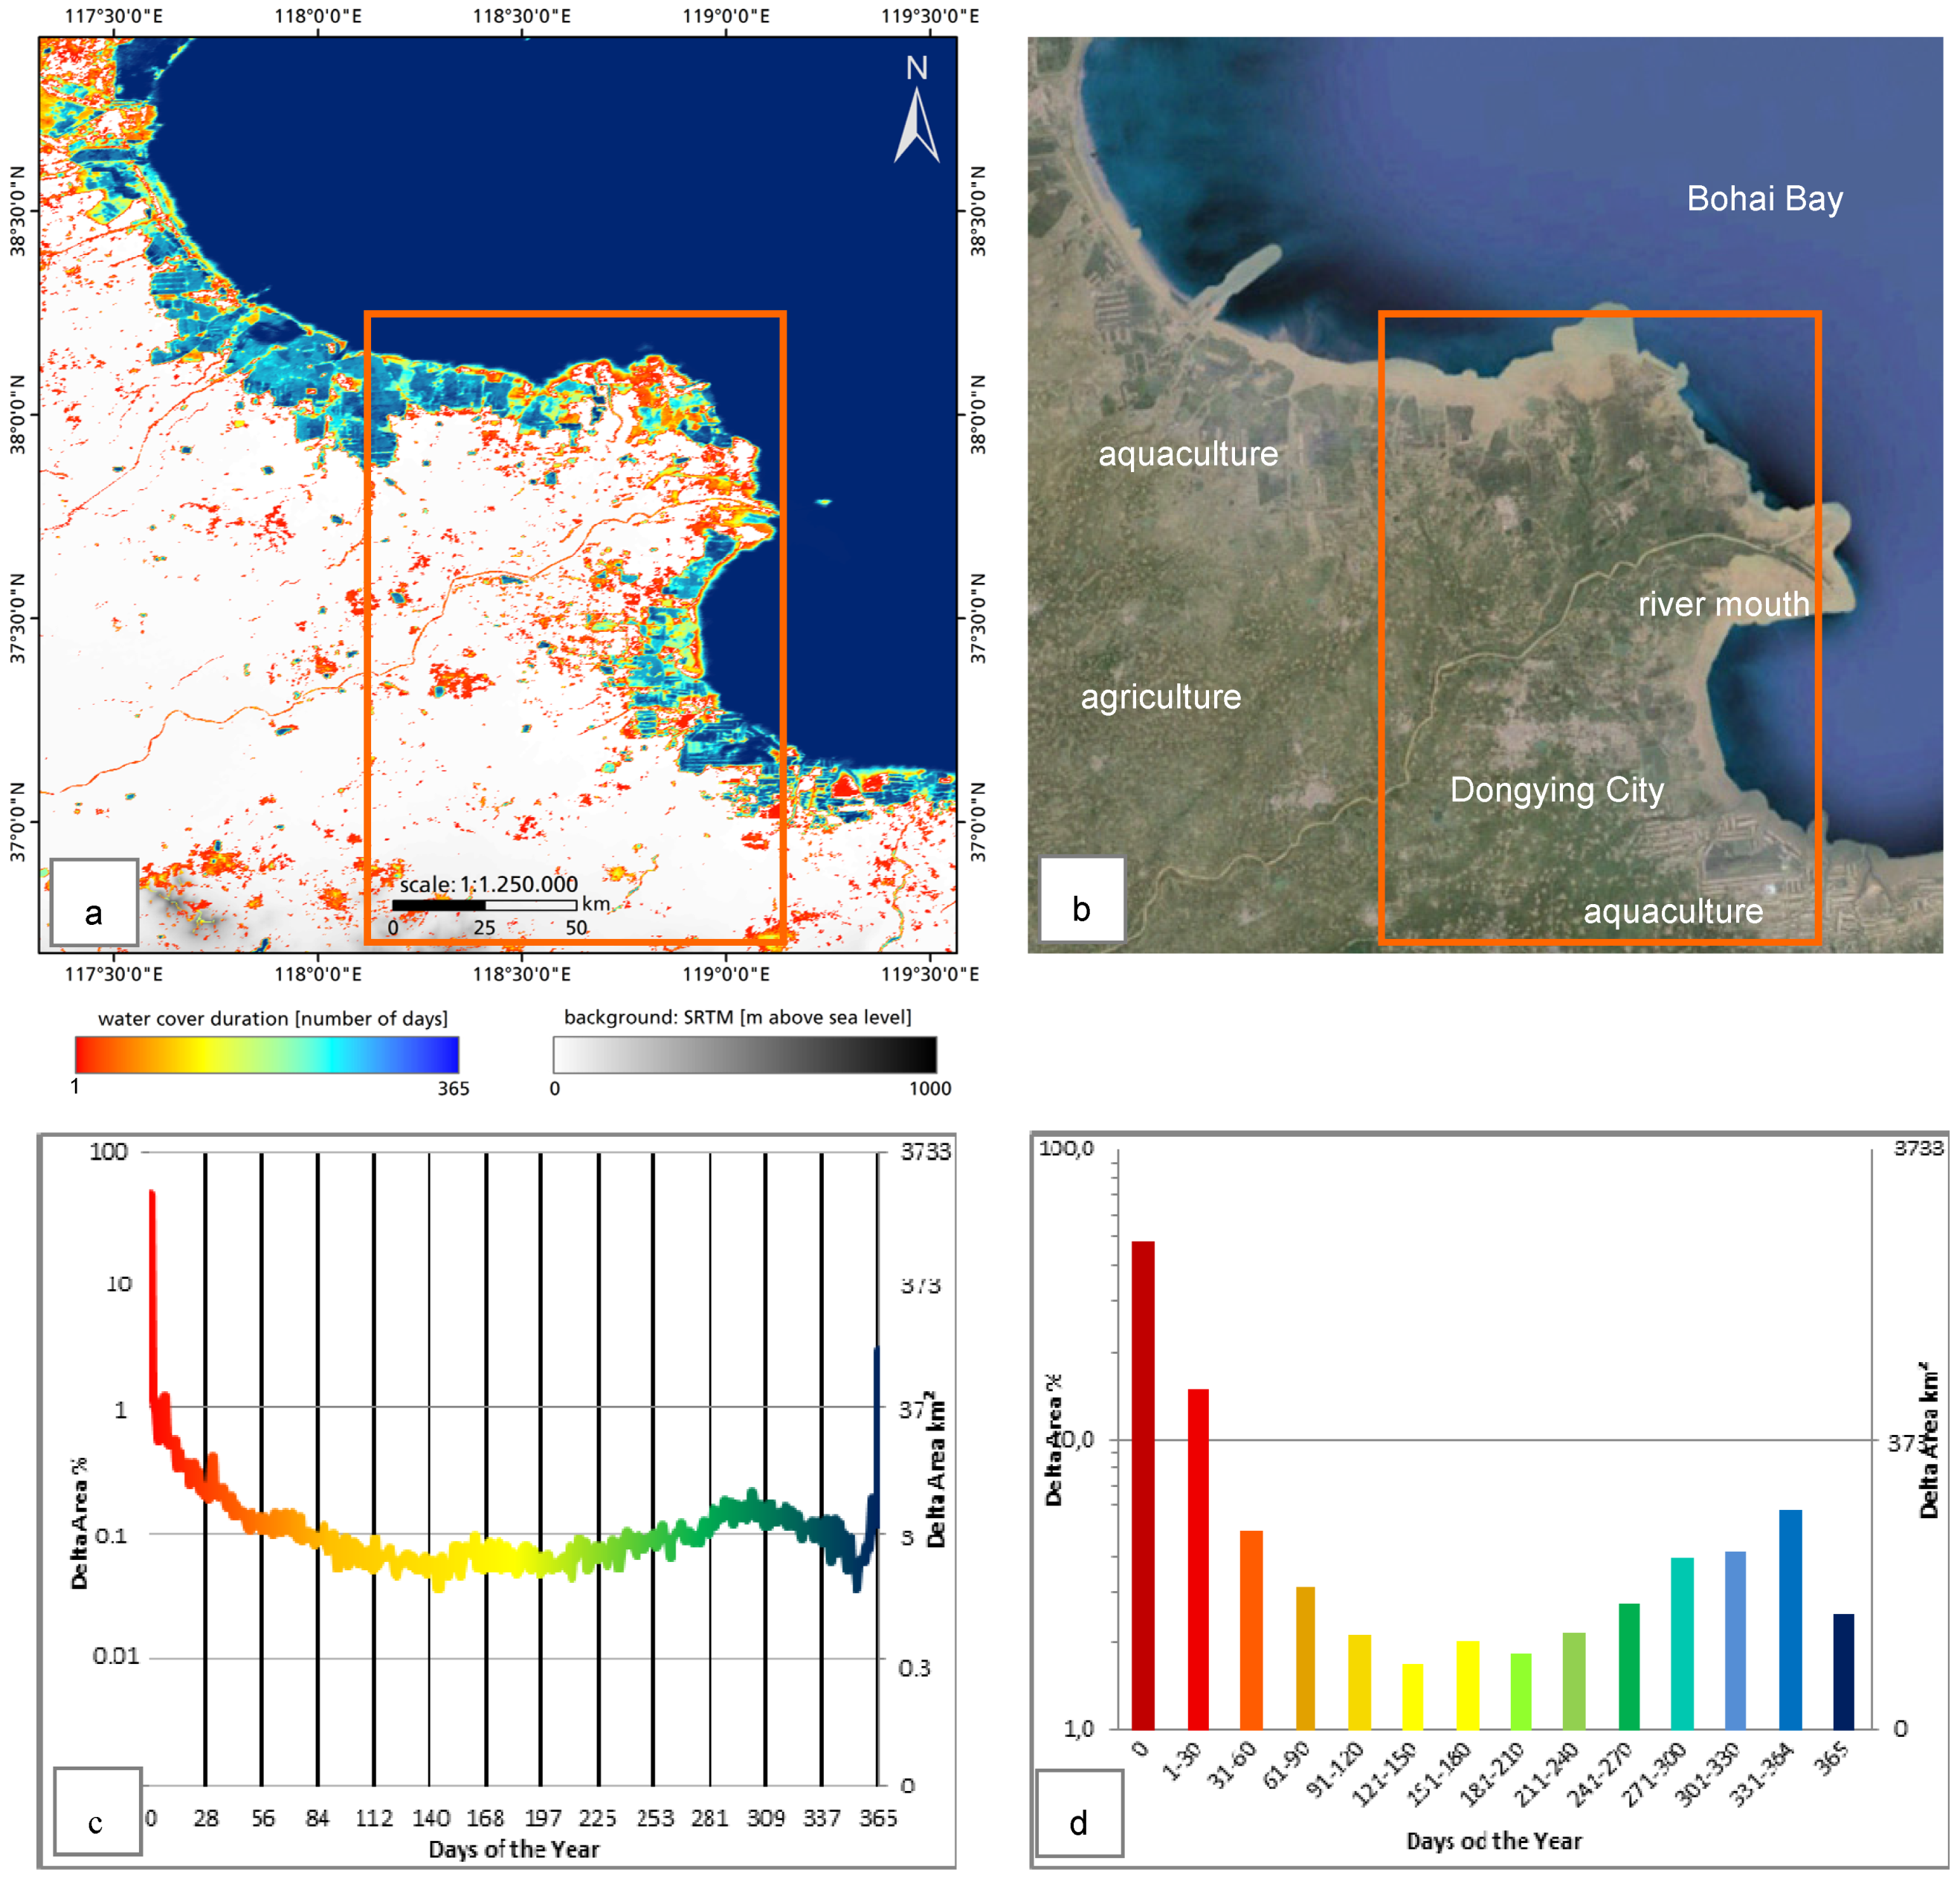
| Yellow River Delta | China | 10,000 km2 | 6,000,000 | Snow, winter dry, hot summer (Dwa) |
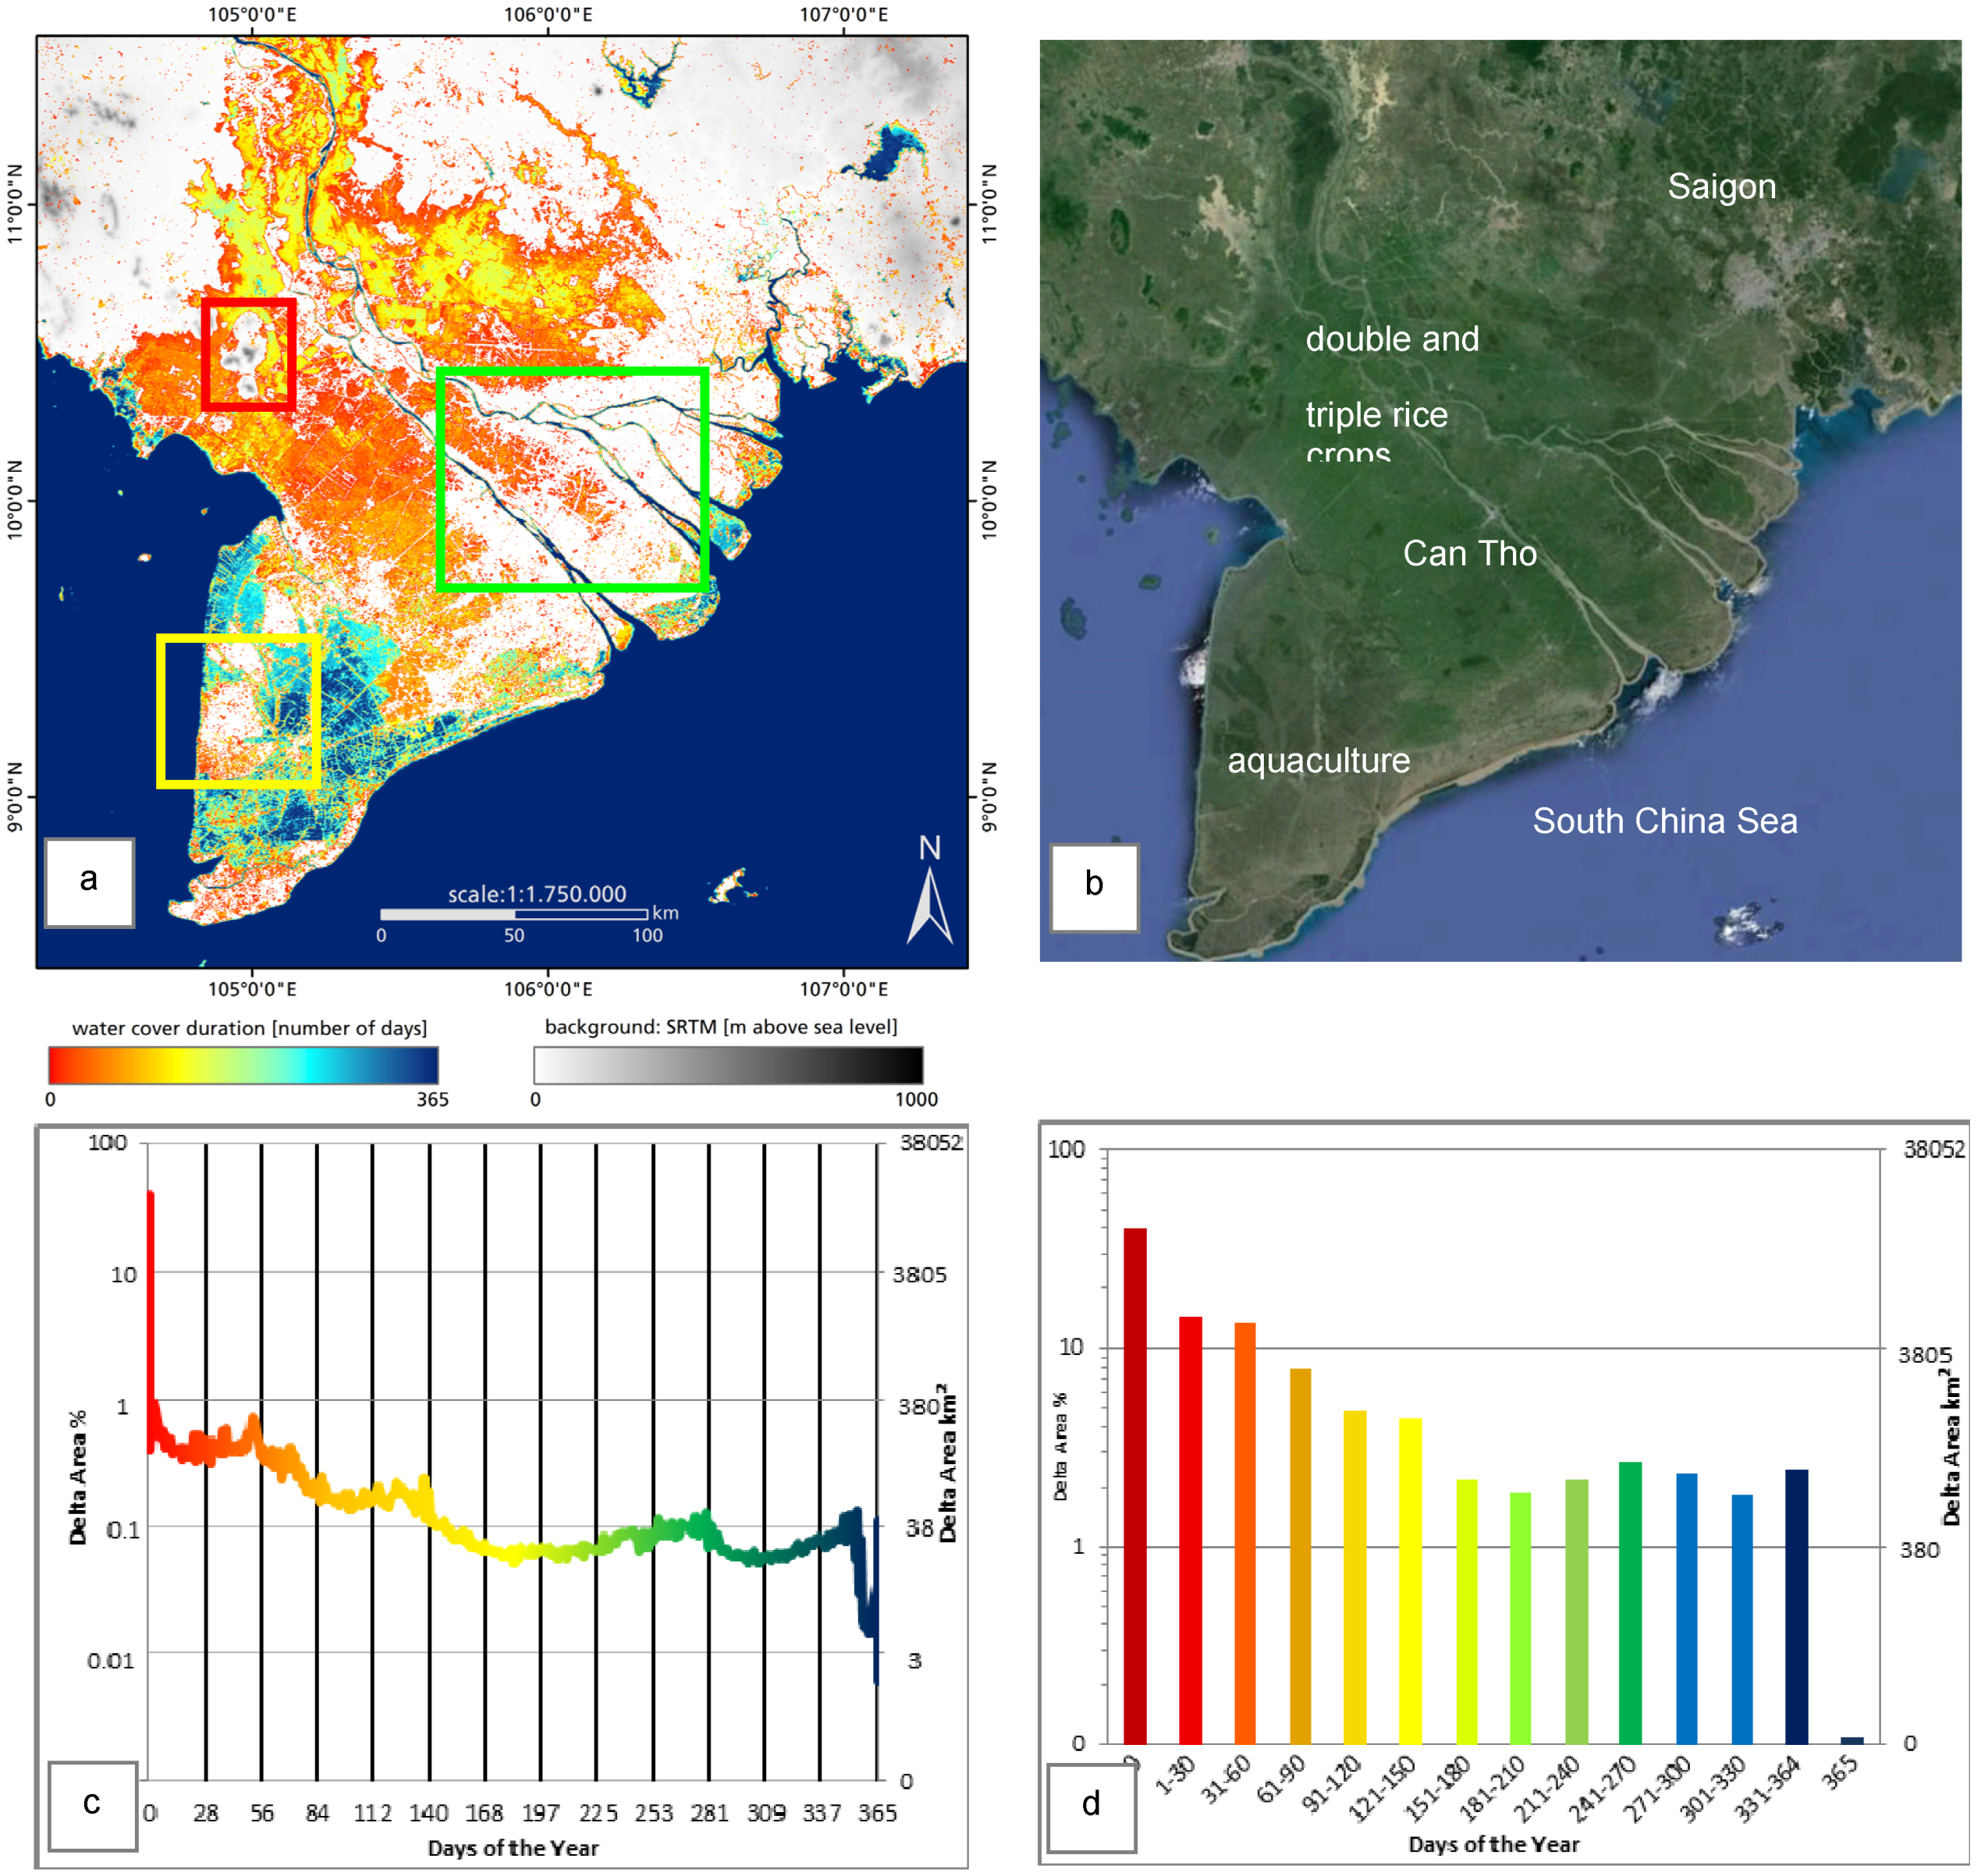
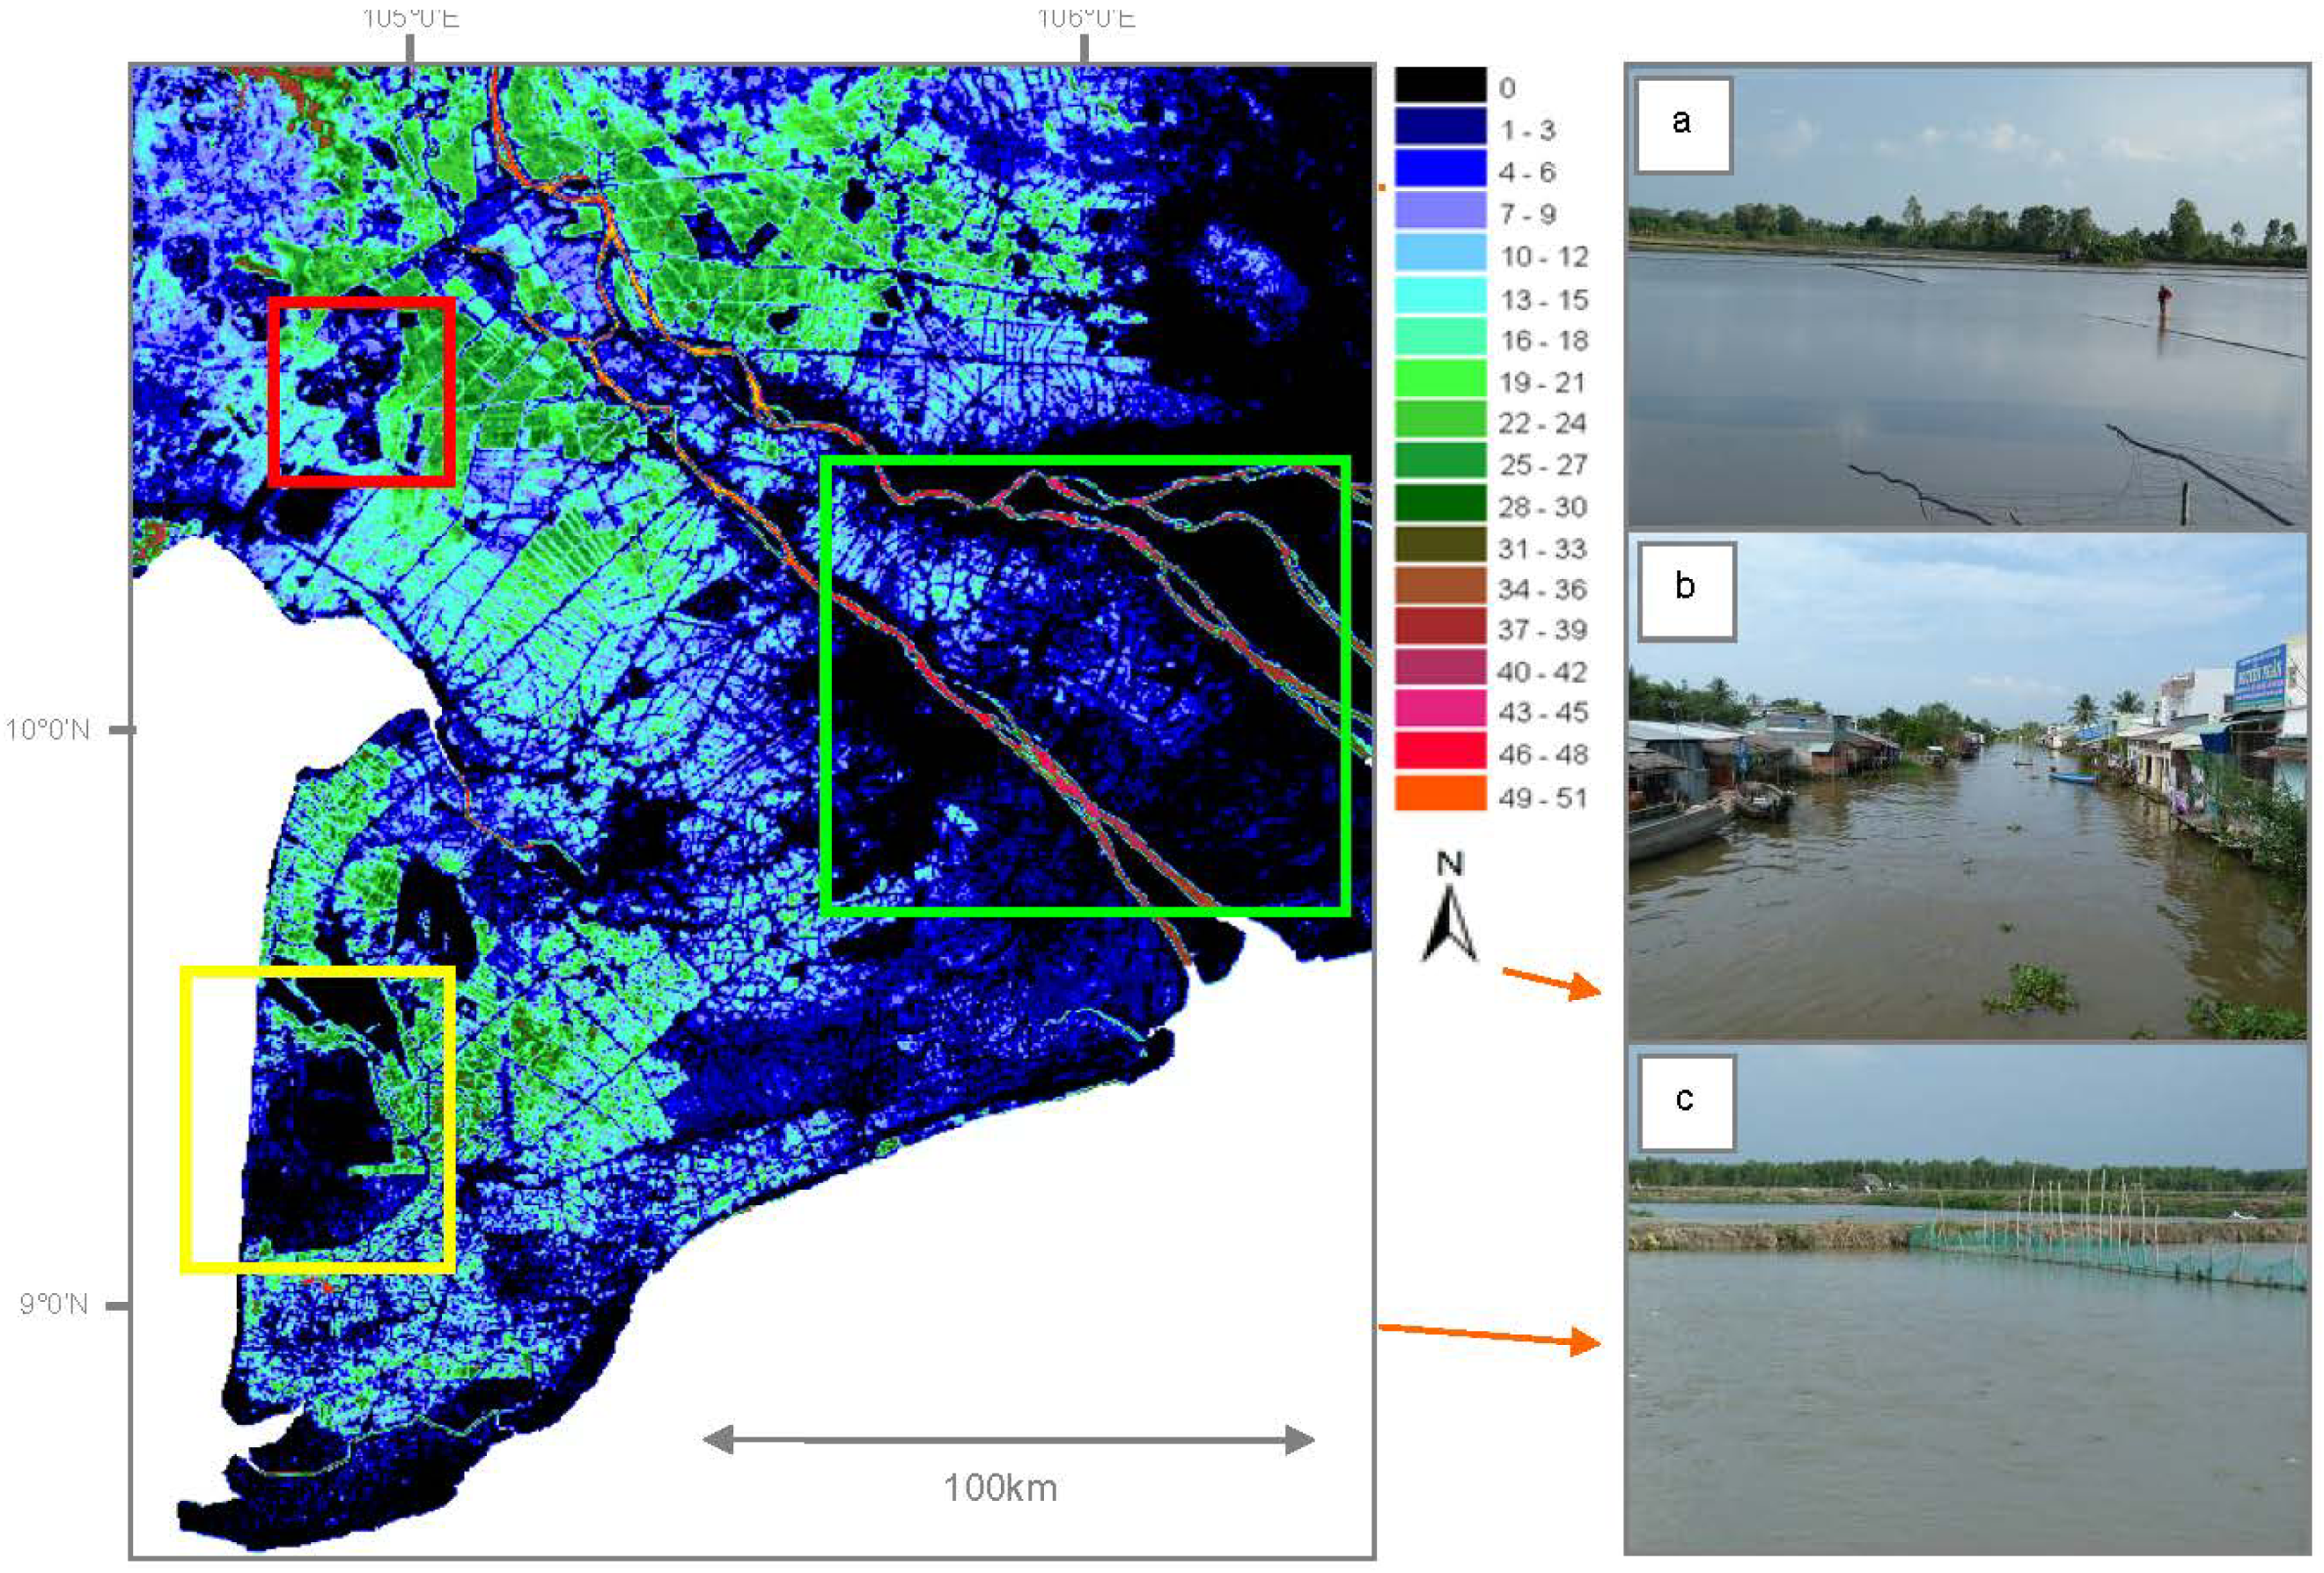
| Mekong Delta | Vietnam | 39,000 km2 | 17,000,000 | Equatorial-monsoonal (Am) |
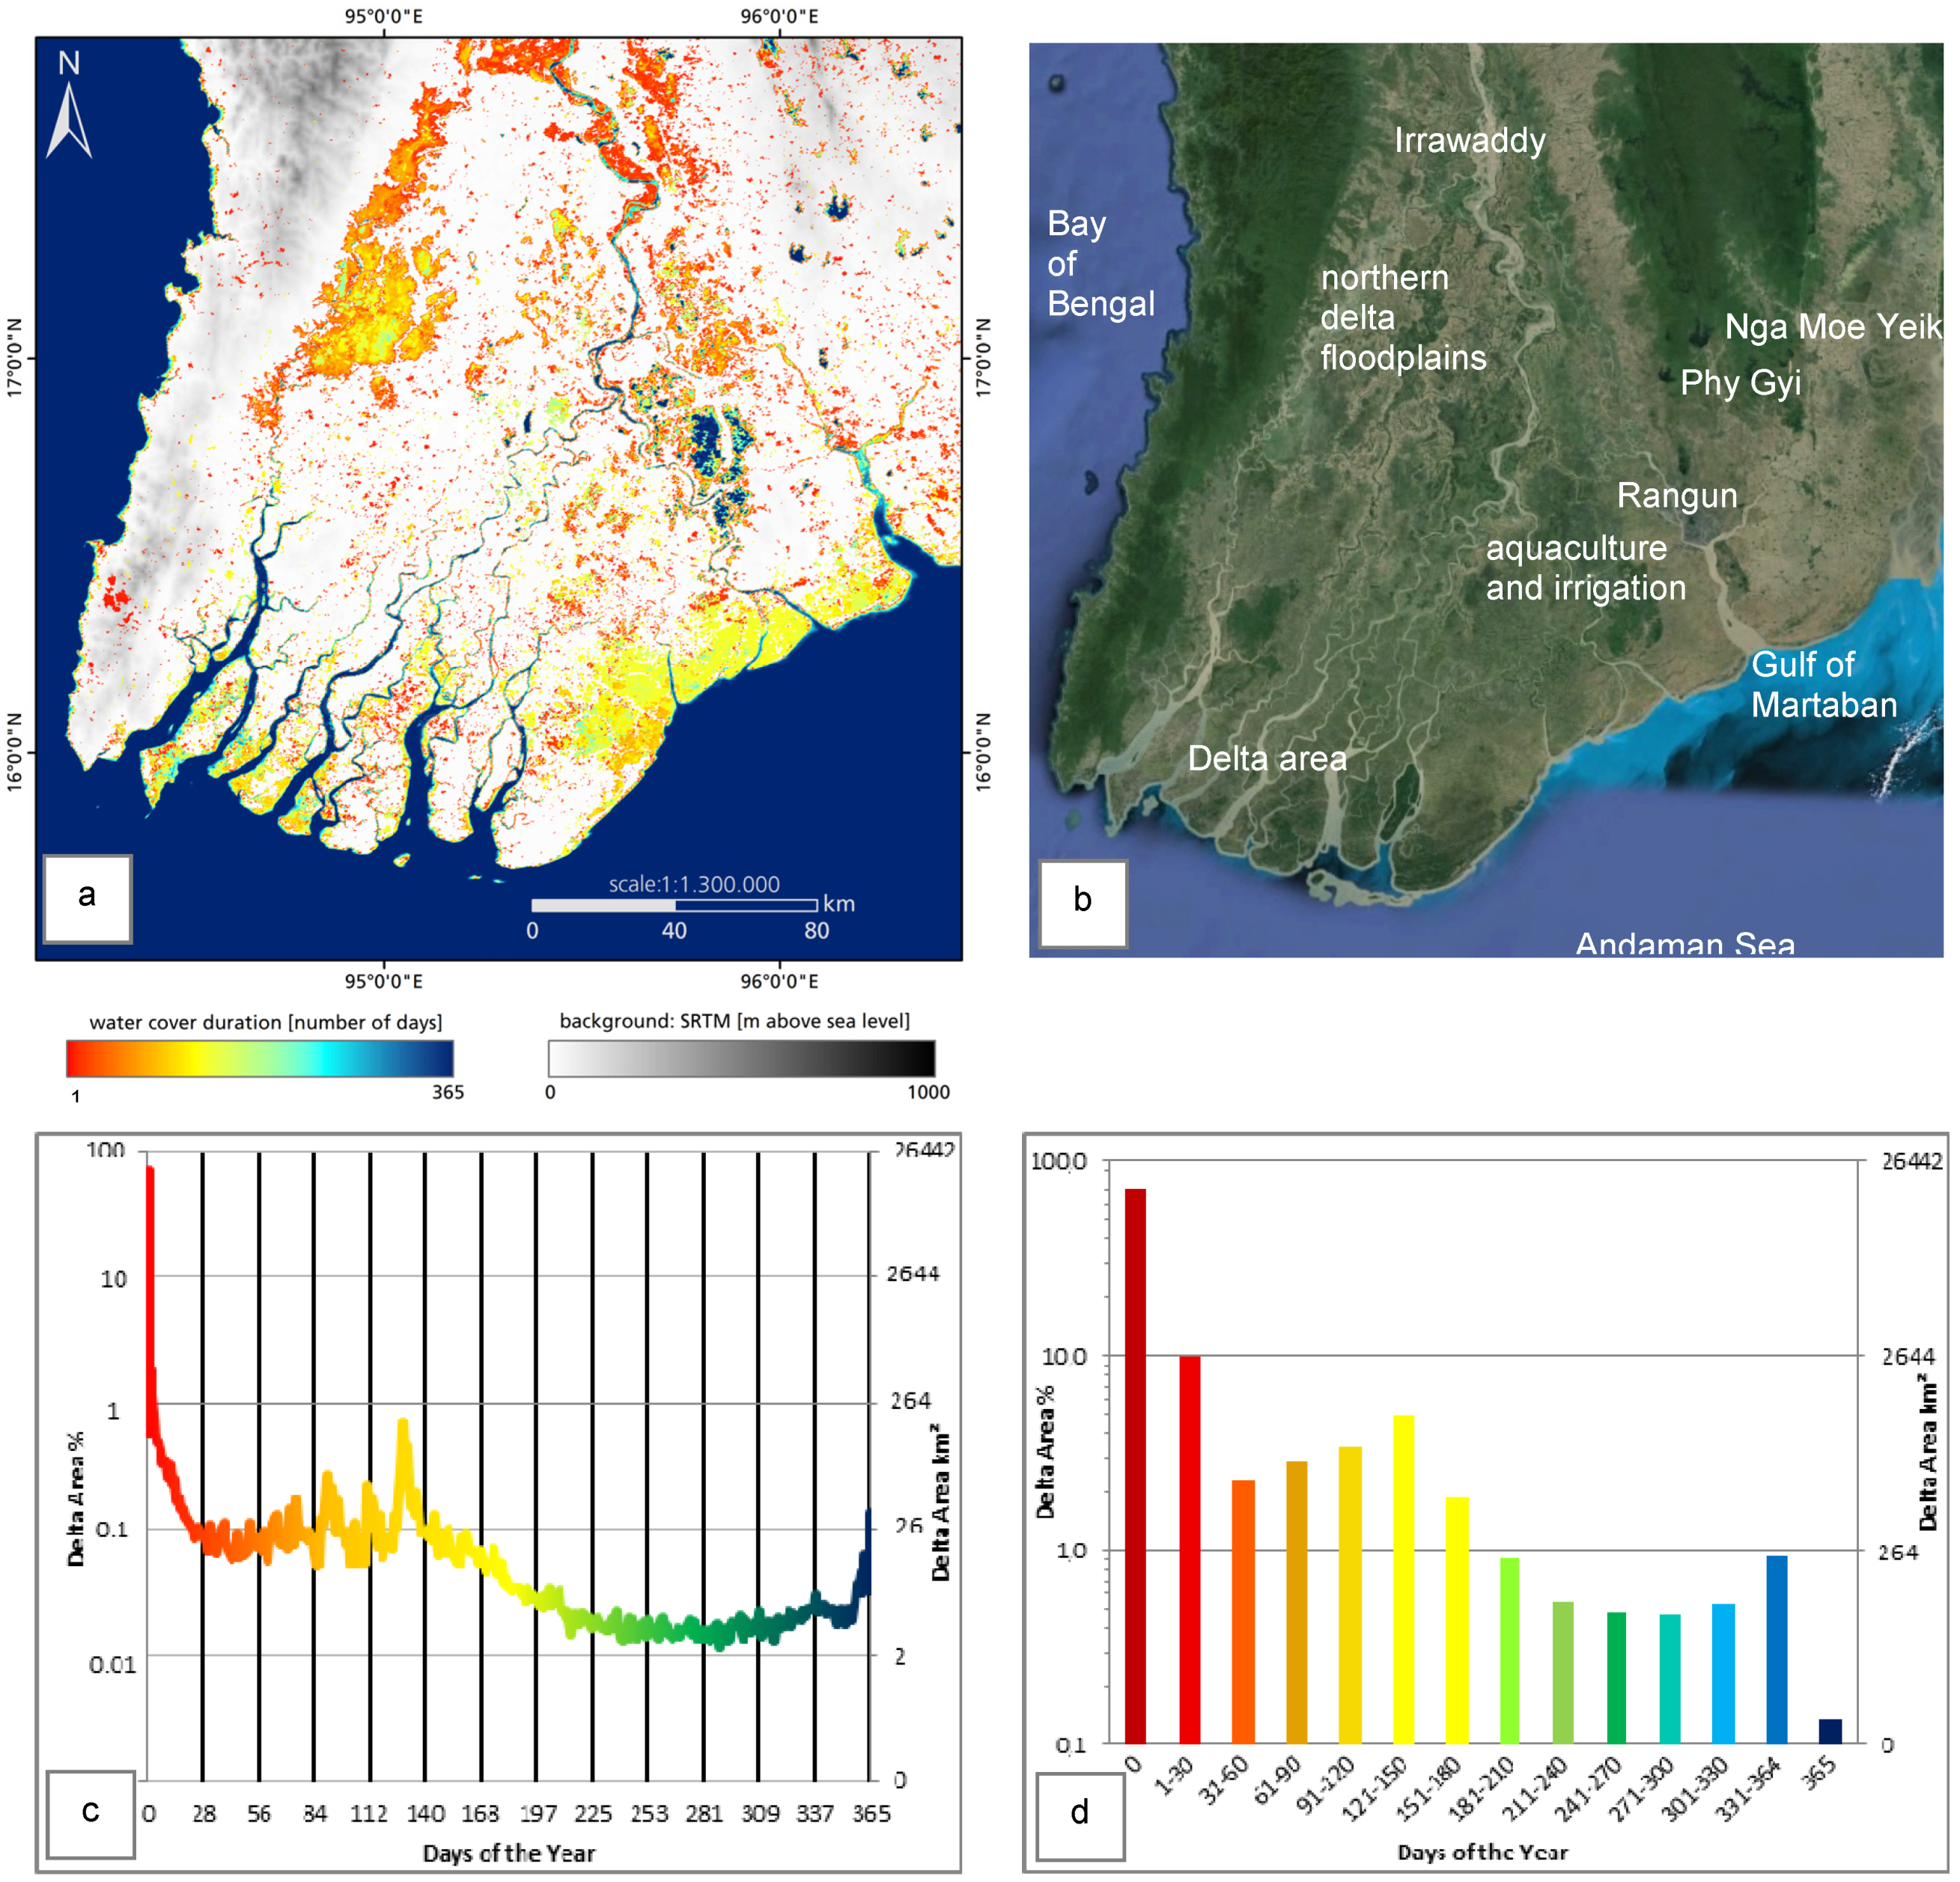
| Irrawaddy Delta | Myanmar | 40,000 km2 | 3,500,000 | Equatorial-monsoonal (Am) |
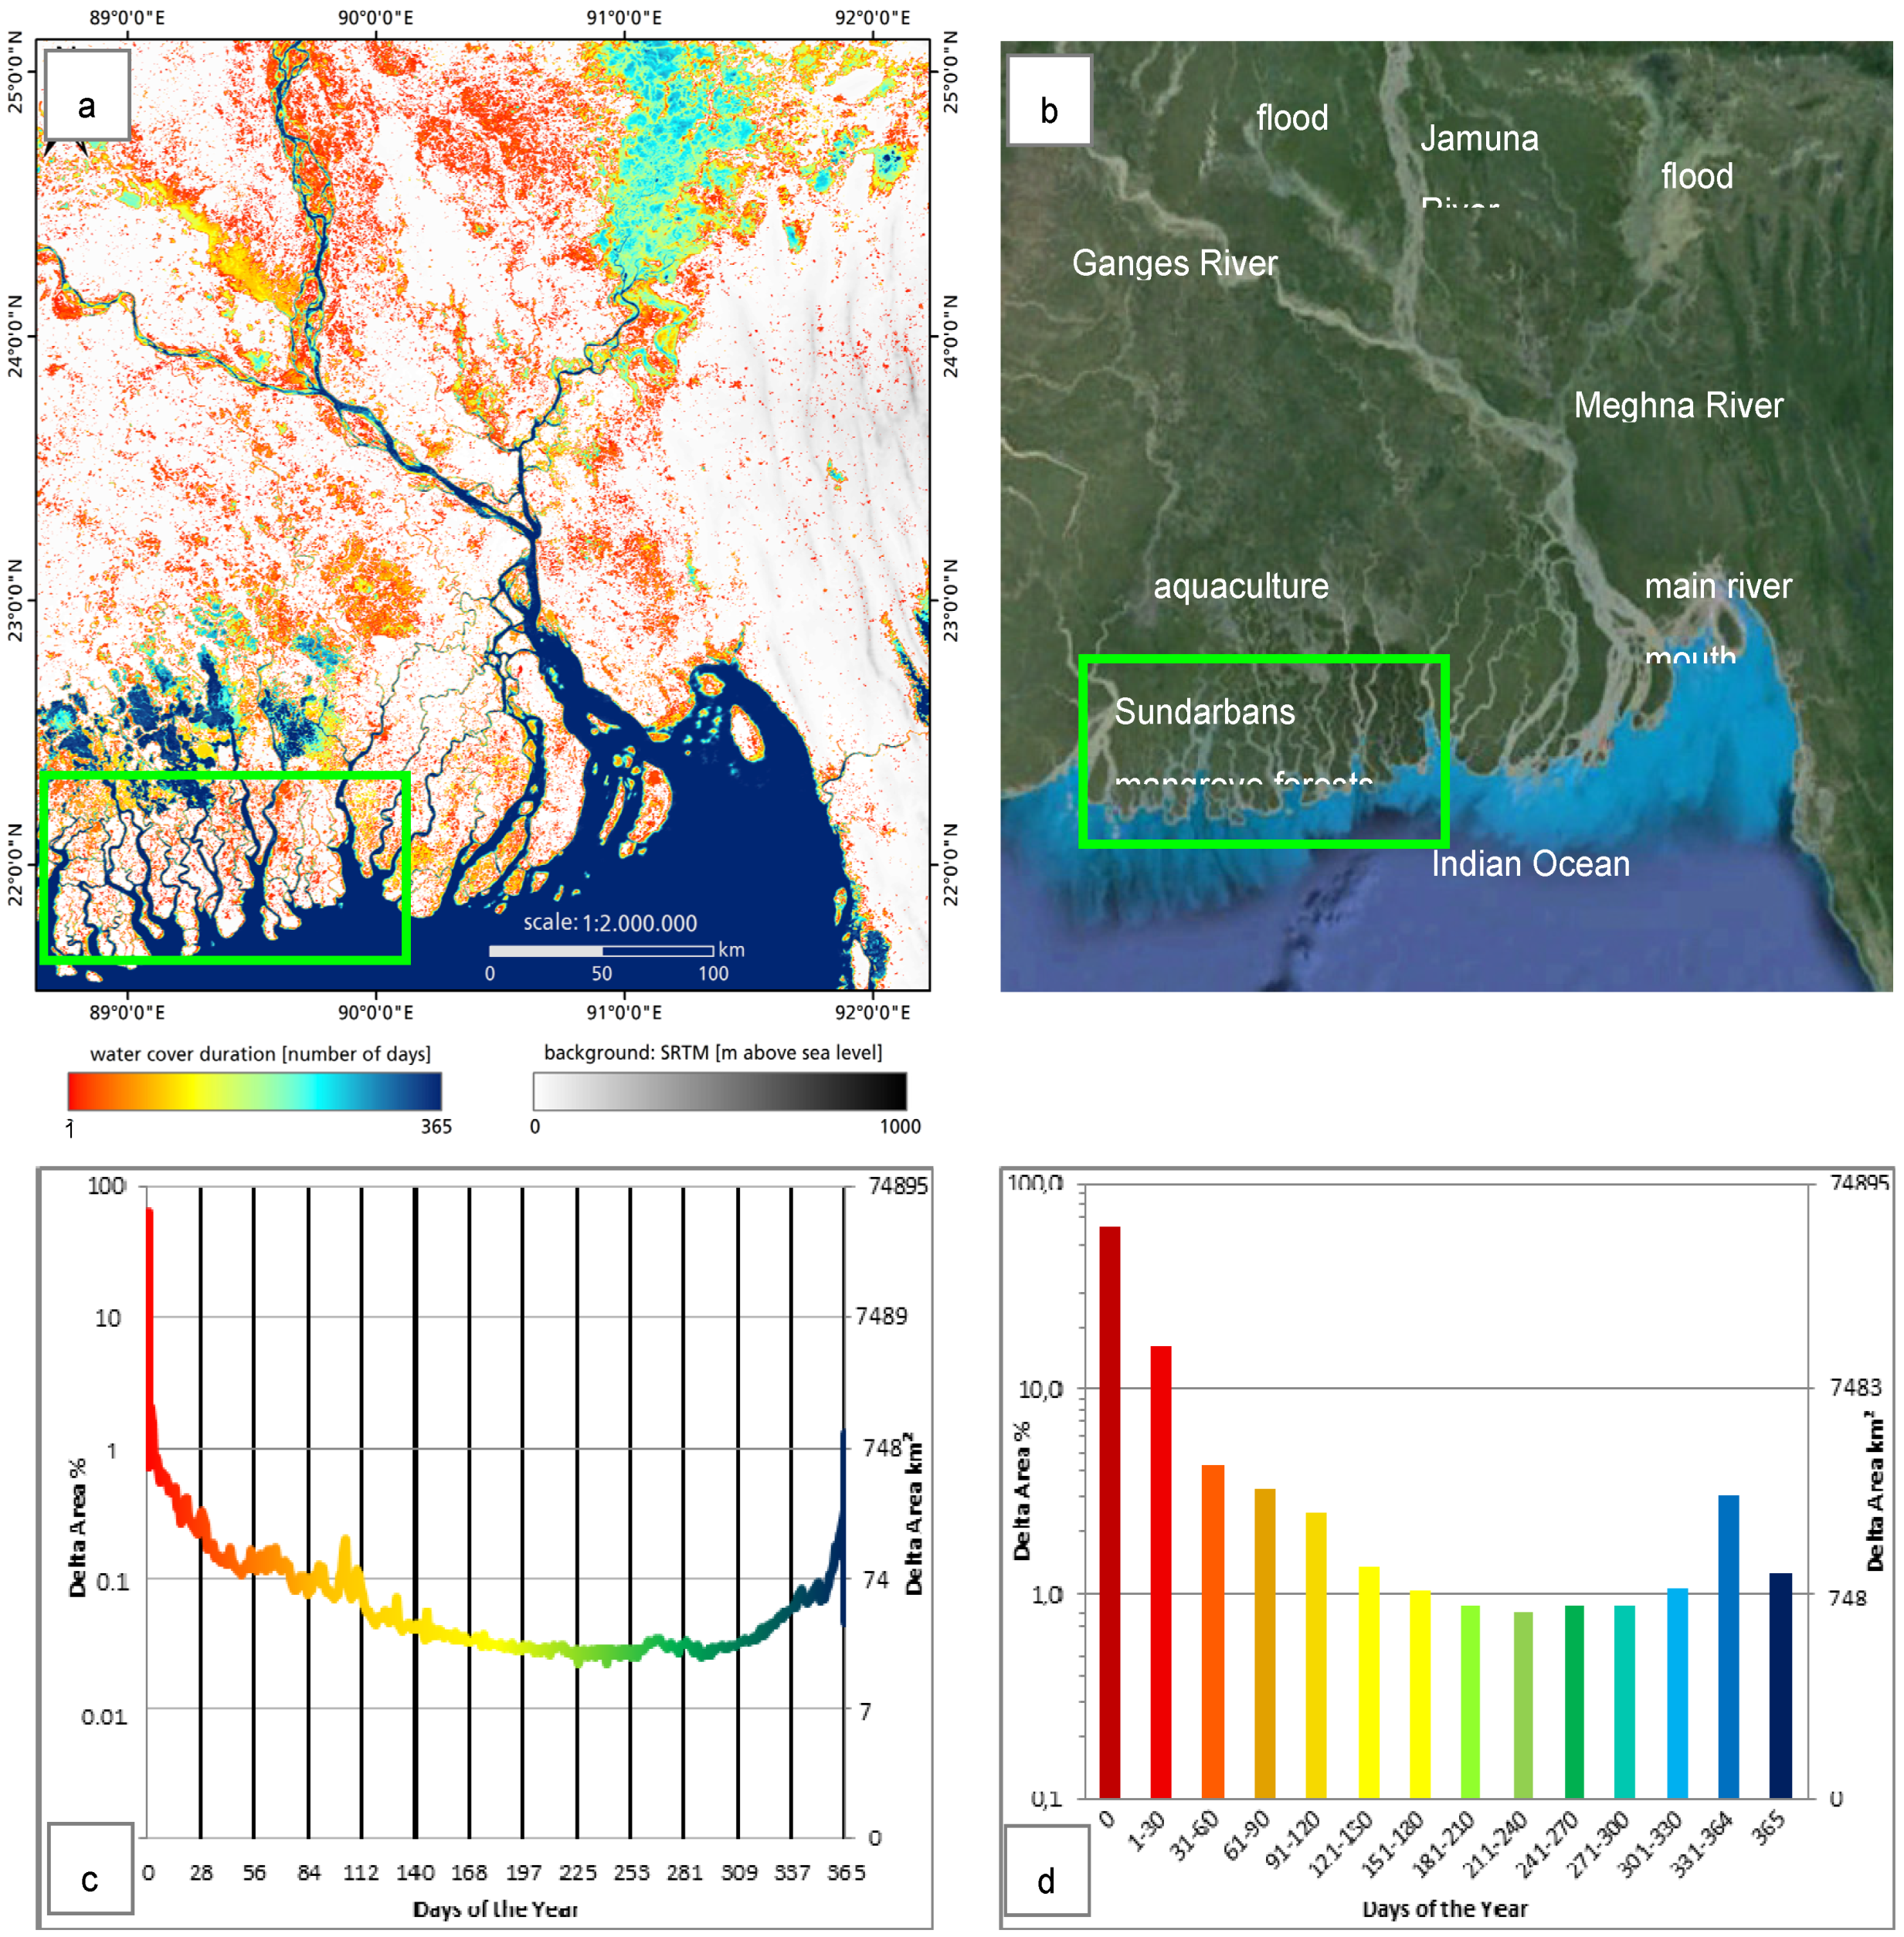
| Ganges-Brahmaputra Delta | India/Bangladesh | 80,000 km2 | 143,000,000 | Equatorial-monsoonal, winter dry (Am, Aw) |
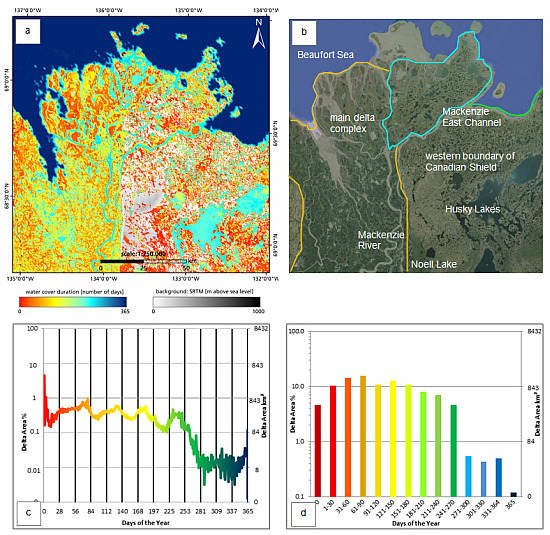
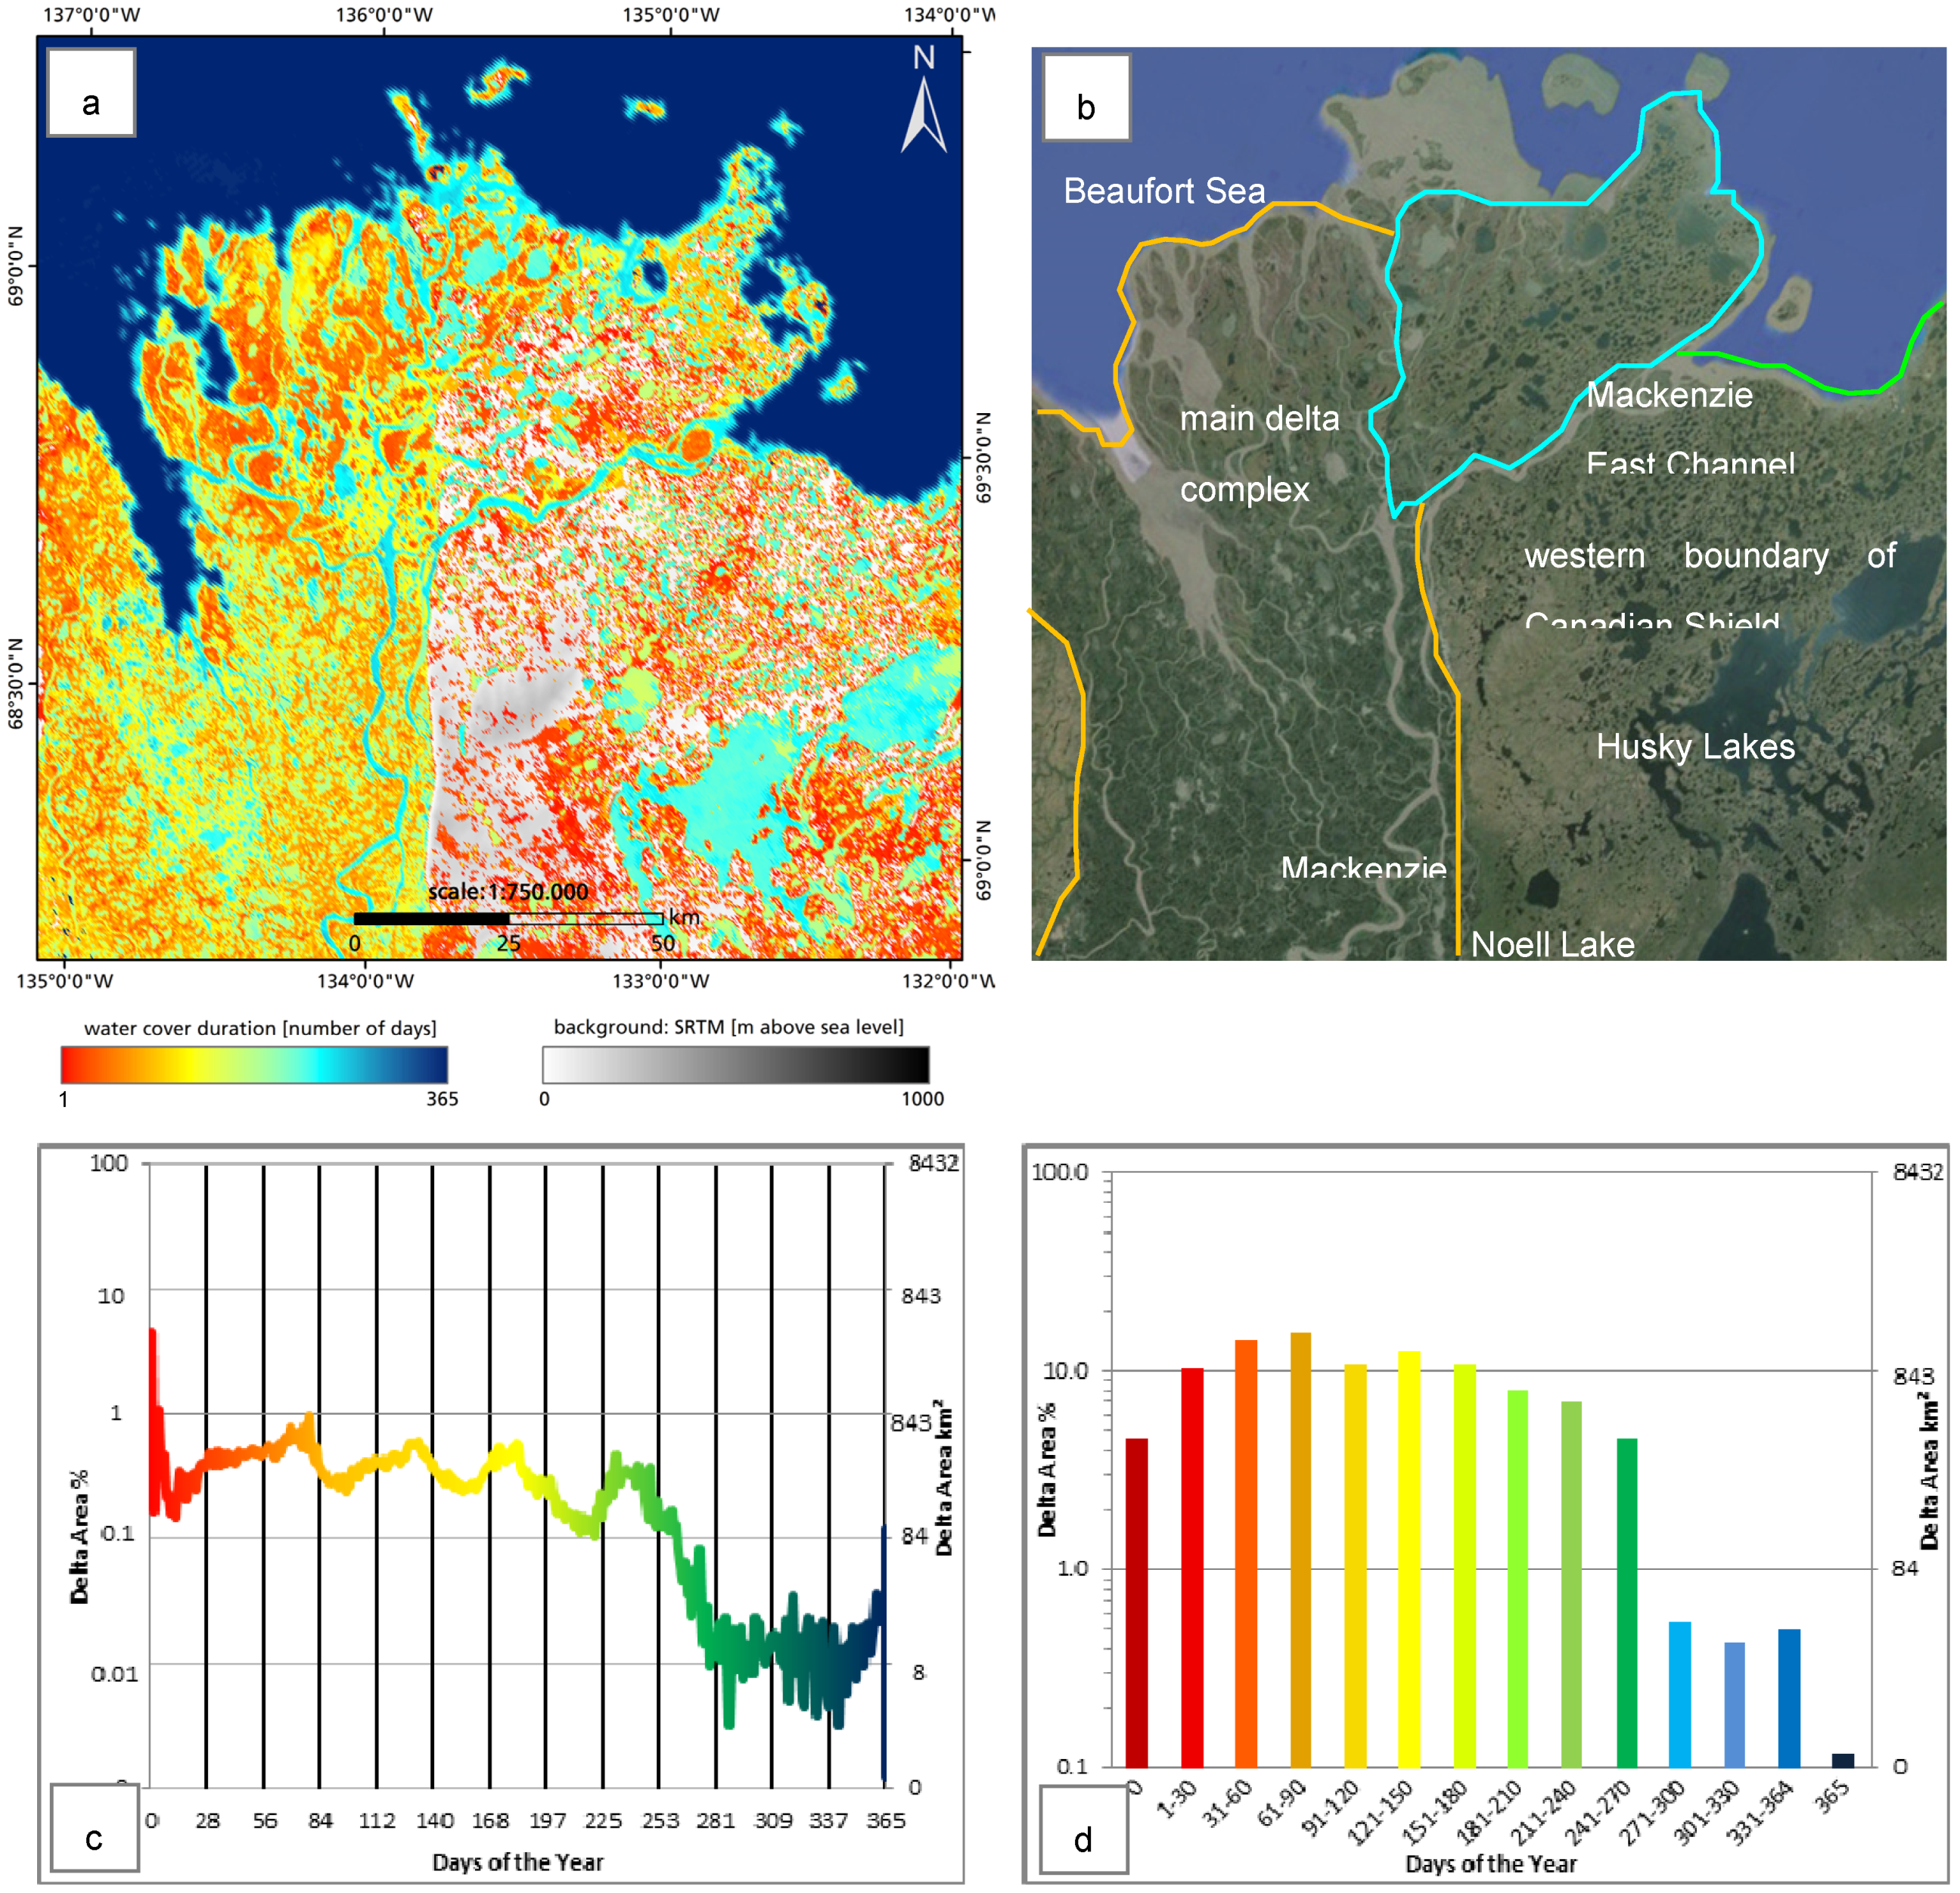
| Mackenzie Delta | Canada | < 10,000 | Polar tundra (ET) |
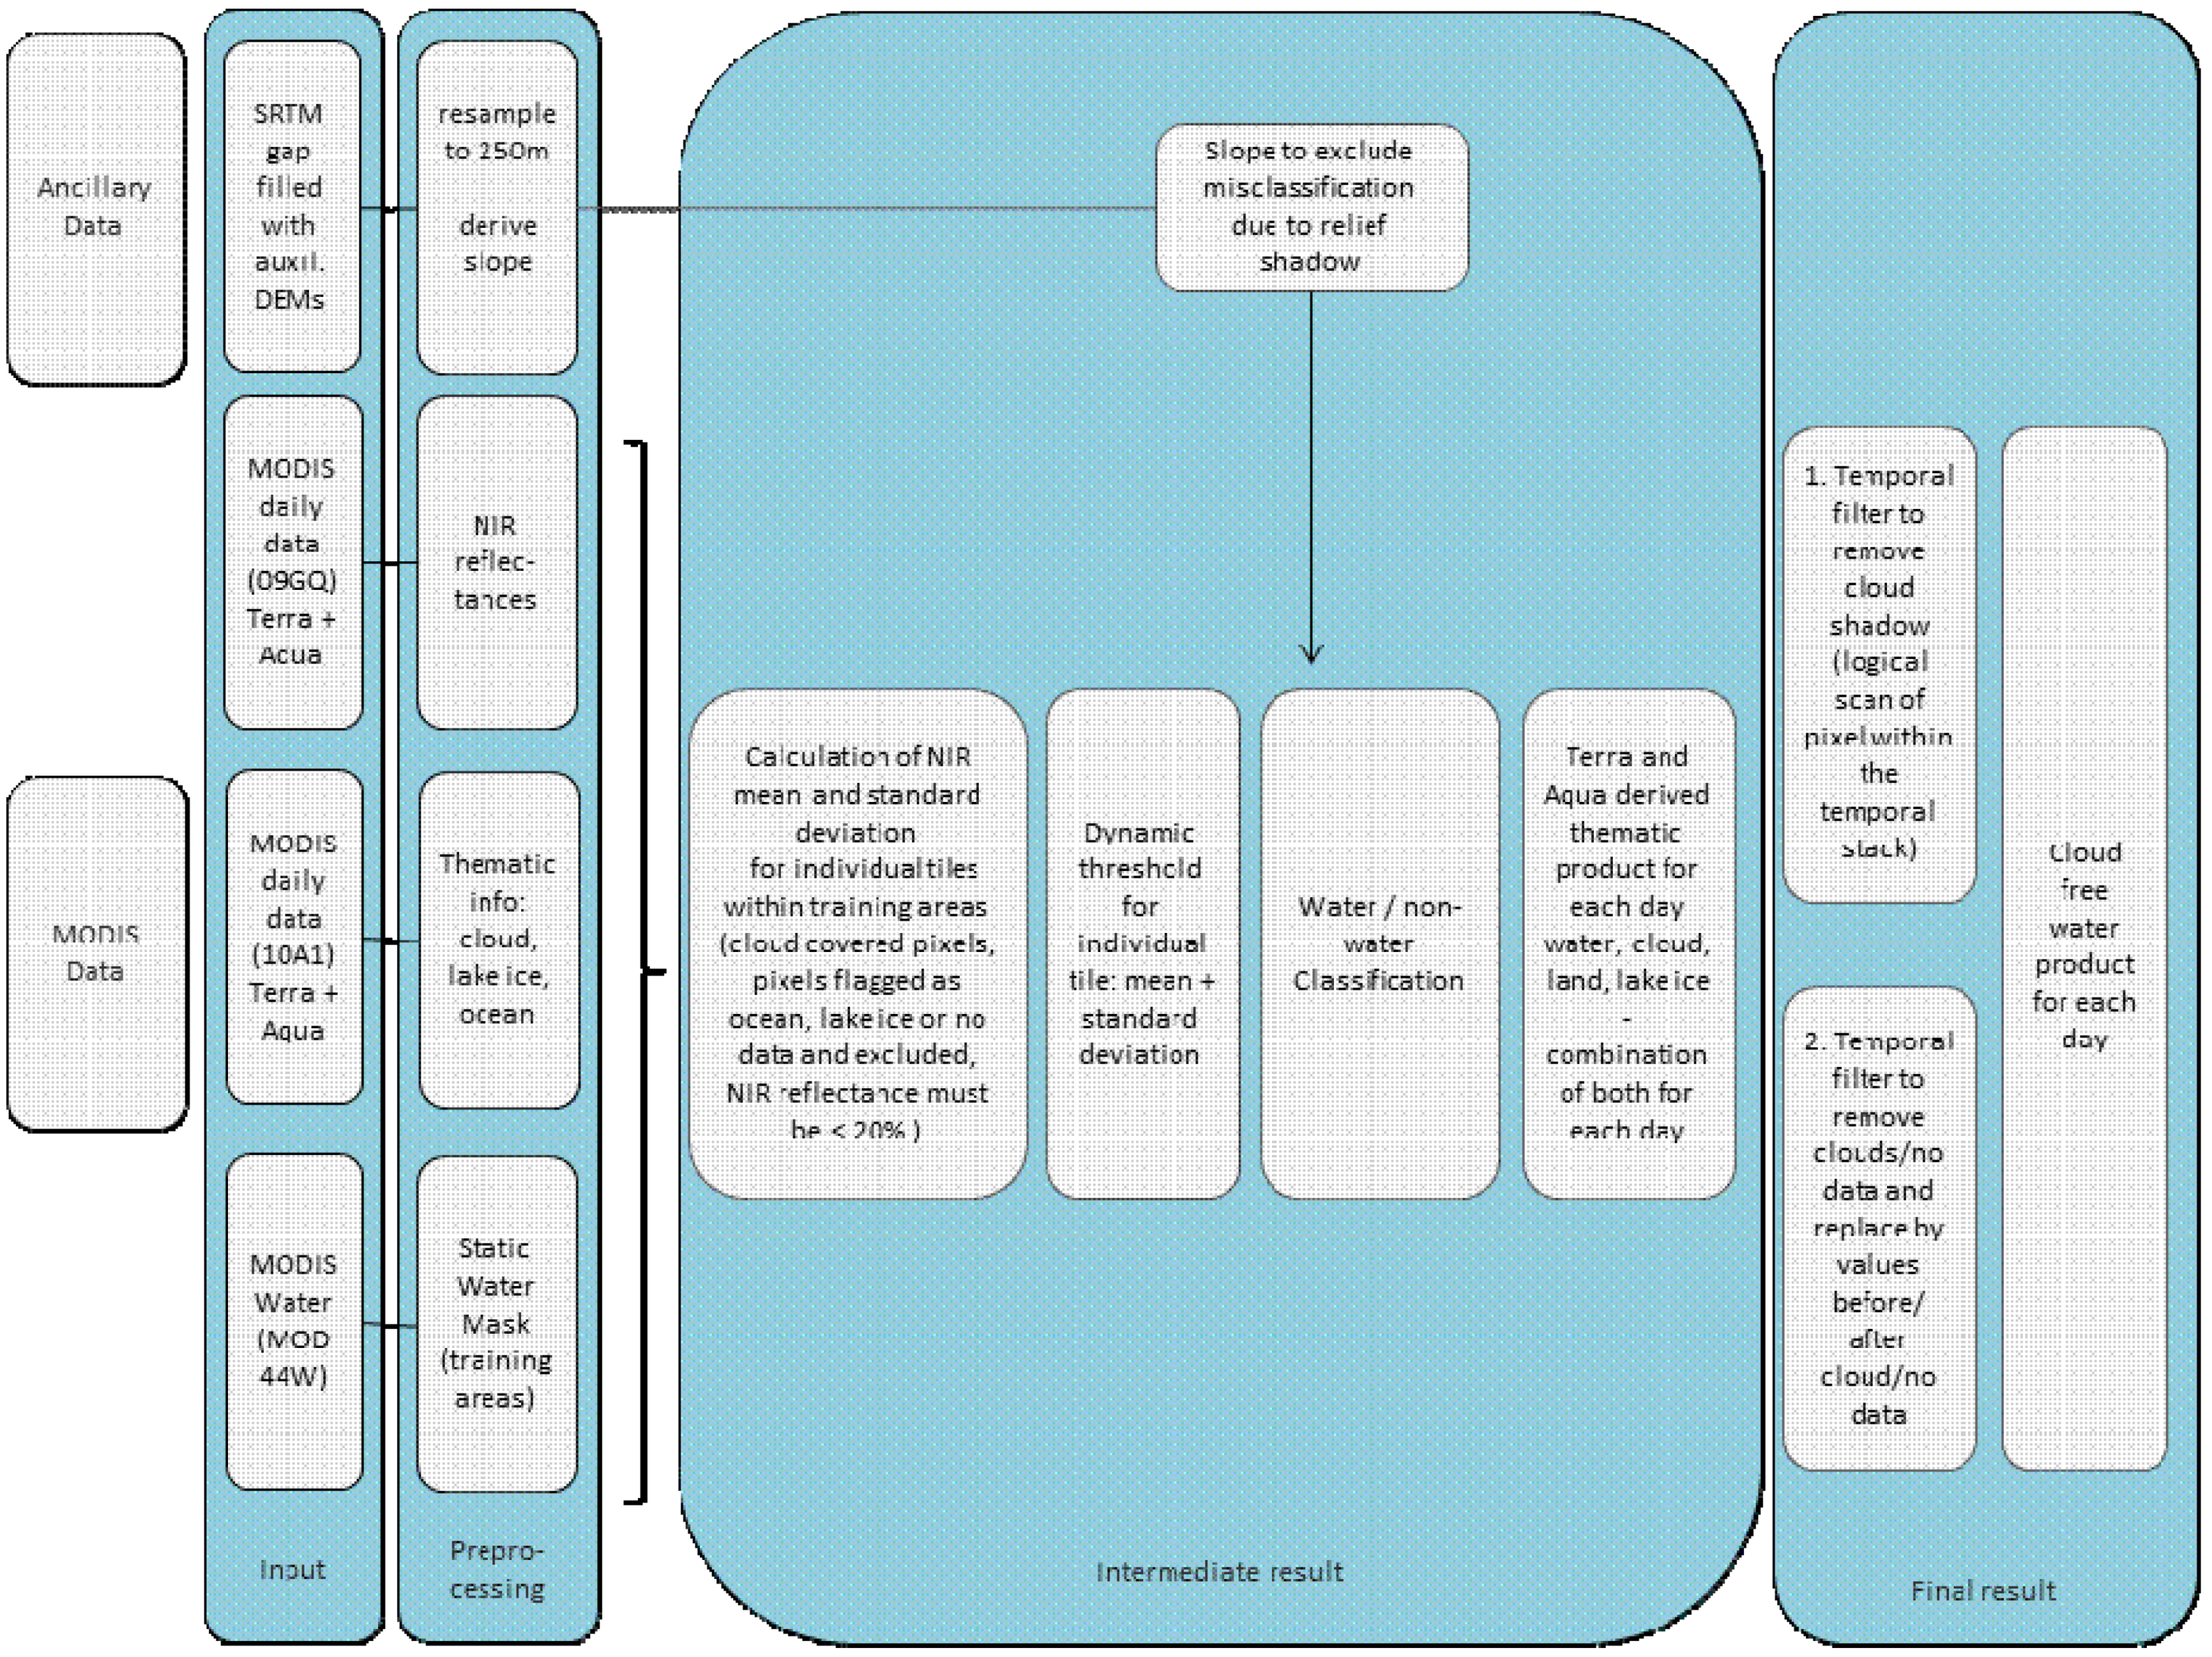
3. Method Applied for Inundation Derivation Based on MODIS Time Series Data

4. Results


| Yellow River Delta | Mekong Delta | Irrawaddy Delta | Ganges Delta | Mackenzie Delta | |
|---|---|---|---|---|---|
| Overall area | 3732.16 km2 (100%) | 38052.22 km2 (100%) | 26443.31 km2 (100%) | 74897.79 km2 (100%) | 8431.36 km2 (100%) |
| Never inundated | 1813.22 km2 (48.58%) | 15223.97 km2 (40.01%) | 18742.39 km2 (70.88%) | 47187.34 km2 (63.00%) | 385.53 km2 (4.57%) |
| 1–30 times | 556.34 km2 (14.90%) | 5443.21 km2 (14.30%) | 2612.13 km2 (9.88%) | 11977.9 km2 (15.99%) | 880.05 km2 (10.44%) |
| 31–60 days | 181.81 km2 (4.87%) | 5079.20 km2 (13.35%) | 615.10 km2 (2.33%) | 3165.73 km2 (4.23%) | 1193.02 km2 (14.15%) |
| 61–90 days | 116.88 km2 (3.13%) | 2990.62 km2 (7.86%) | 757.10 km2 (2.86%) | 2490.95 km2 (3.33%) | 1331.37 km2 (15.79%) |
| 91–120 days s | 80.49 km2 (2.16%) | 1849.23 km2 (4.86%) | 885.04 km2 (3.35%) | 1899.83 km2 (2.54%) | 912.03 km2 (10.82%) |
| 121–150 days | 63.10 km2 (1.69%) | 1689.58 km2 (4.44%) | 1299.70 km2 (4.92%) | 1020.32 km2 (1.36%) | 1069.27 km2 (12.68%) |
| 151–180 days | 74.86 km2 (2.01%) | 816.67 km2 (2.15%) | 496.67 km2 (1.88%) | 775.83 km2 (1.04%) | 907.25 km2 (10.76%) |
| 181–210 days | 67.89 km2 (1.82%) | 717.17 km2 (1.88%) | 238.27 km2 (0.90%) | 655.78 km2 (0.88%) | 676.39 km2 (8.02%) |
| 211–240 days | 81.19 km2 (2.18%) | 815.33 km2 (2.14%) | 144.14 km2 (0.55%) | 605.01 km2 (0.81%) | 587.31 km2 (6.97%) |
| 241–270 days | 101.64 km2 (2.72%) | 1017.00 km2 (2.67%) | 127.88 km2 (0.48%) | 647.14 km2 (0.86%) | 388.16 km2 (4.60%) |
| 271–300 days | 146.45 km2 (3.92%) | 879.30 km2 (2.31%) | 124.66 km2 (0.47%) | 647.89 km2 (0.87%) | 45.67 km2 (0.54%) |
| 301–330 days | 154.07 km2 (4.13%) | 692.22 km2 (1.82%) | 139.85 km2 (0.53%) | 804.48 km2 (1.07%) | 36.38 km2 (0.43%) |
| 331–364 days | 215.41 km2 (5.77%) | 916.32 km2 (2.41%) | 243.10 km2 (0.92%) | 2278.3 km2 (3.04%) | 41.97 km2 (0.50%) |
| Constantly inundated | 93.86 km2 (2.51%) | 41.16 km2 (0.11%) | 35.37 km2 (0.13%) | 932.36 km2 (1.24%) | 10.14 km2 (0.12%) |
| Drivers of inundation | Aquaculture, water storage, irrigation agriculture, wetlands | Irrigation agriculture, aquaculture, river and overland flooding | River floodplains, irrigation agriculture, limited aquaculture | Irrigation agri- and aquaculture, wetlands, inlets and pools | Thermokarst lakes and pools, snowmelt, wetland swamps |
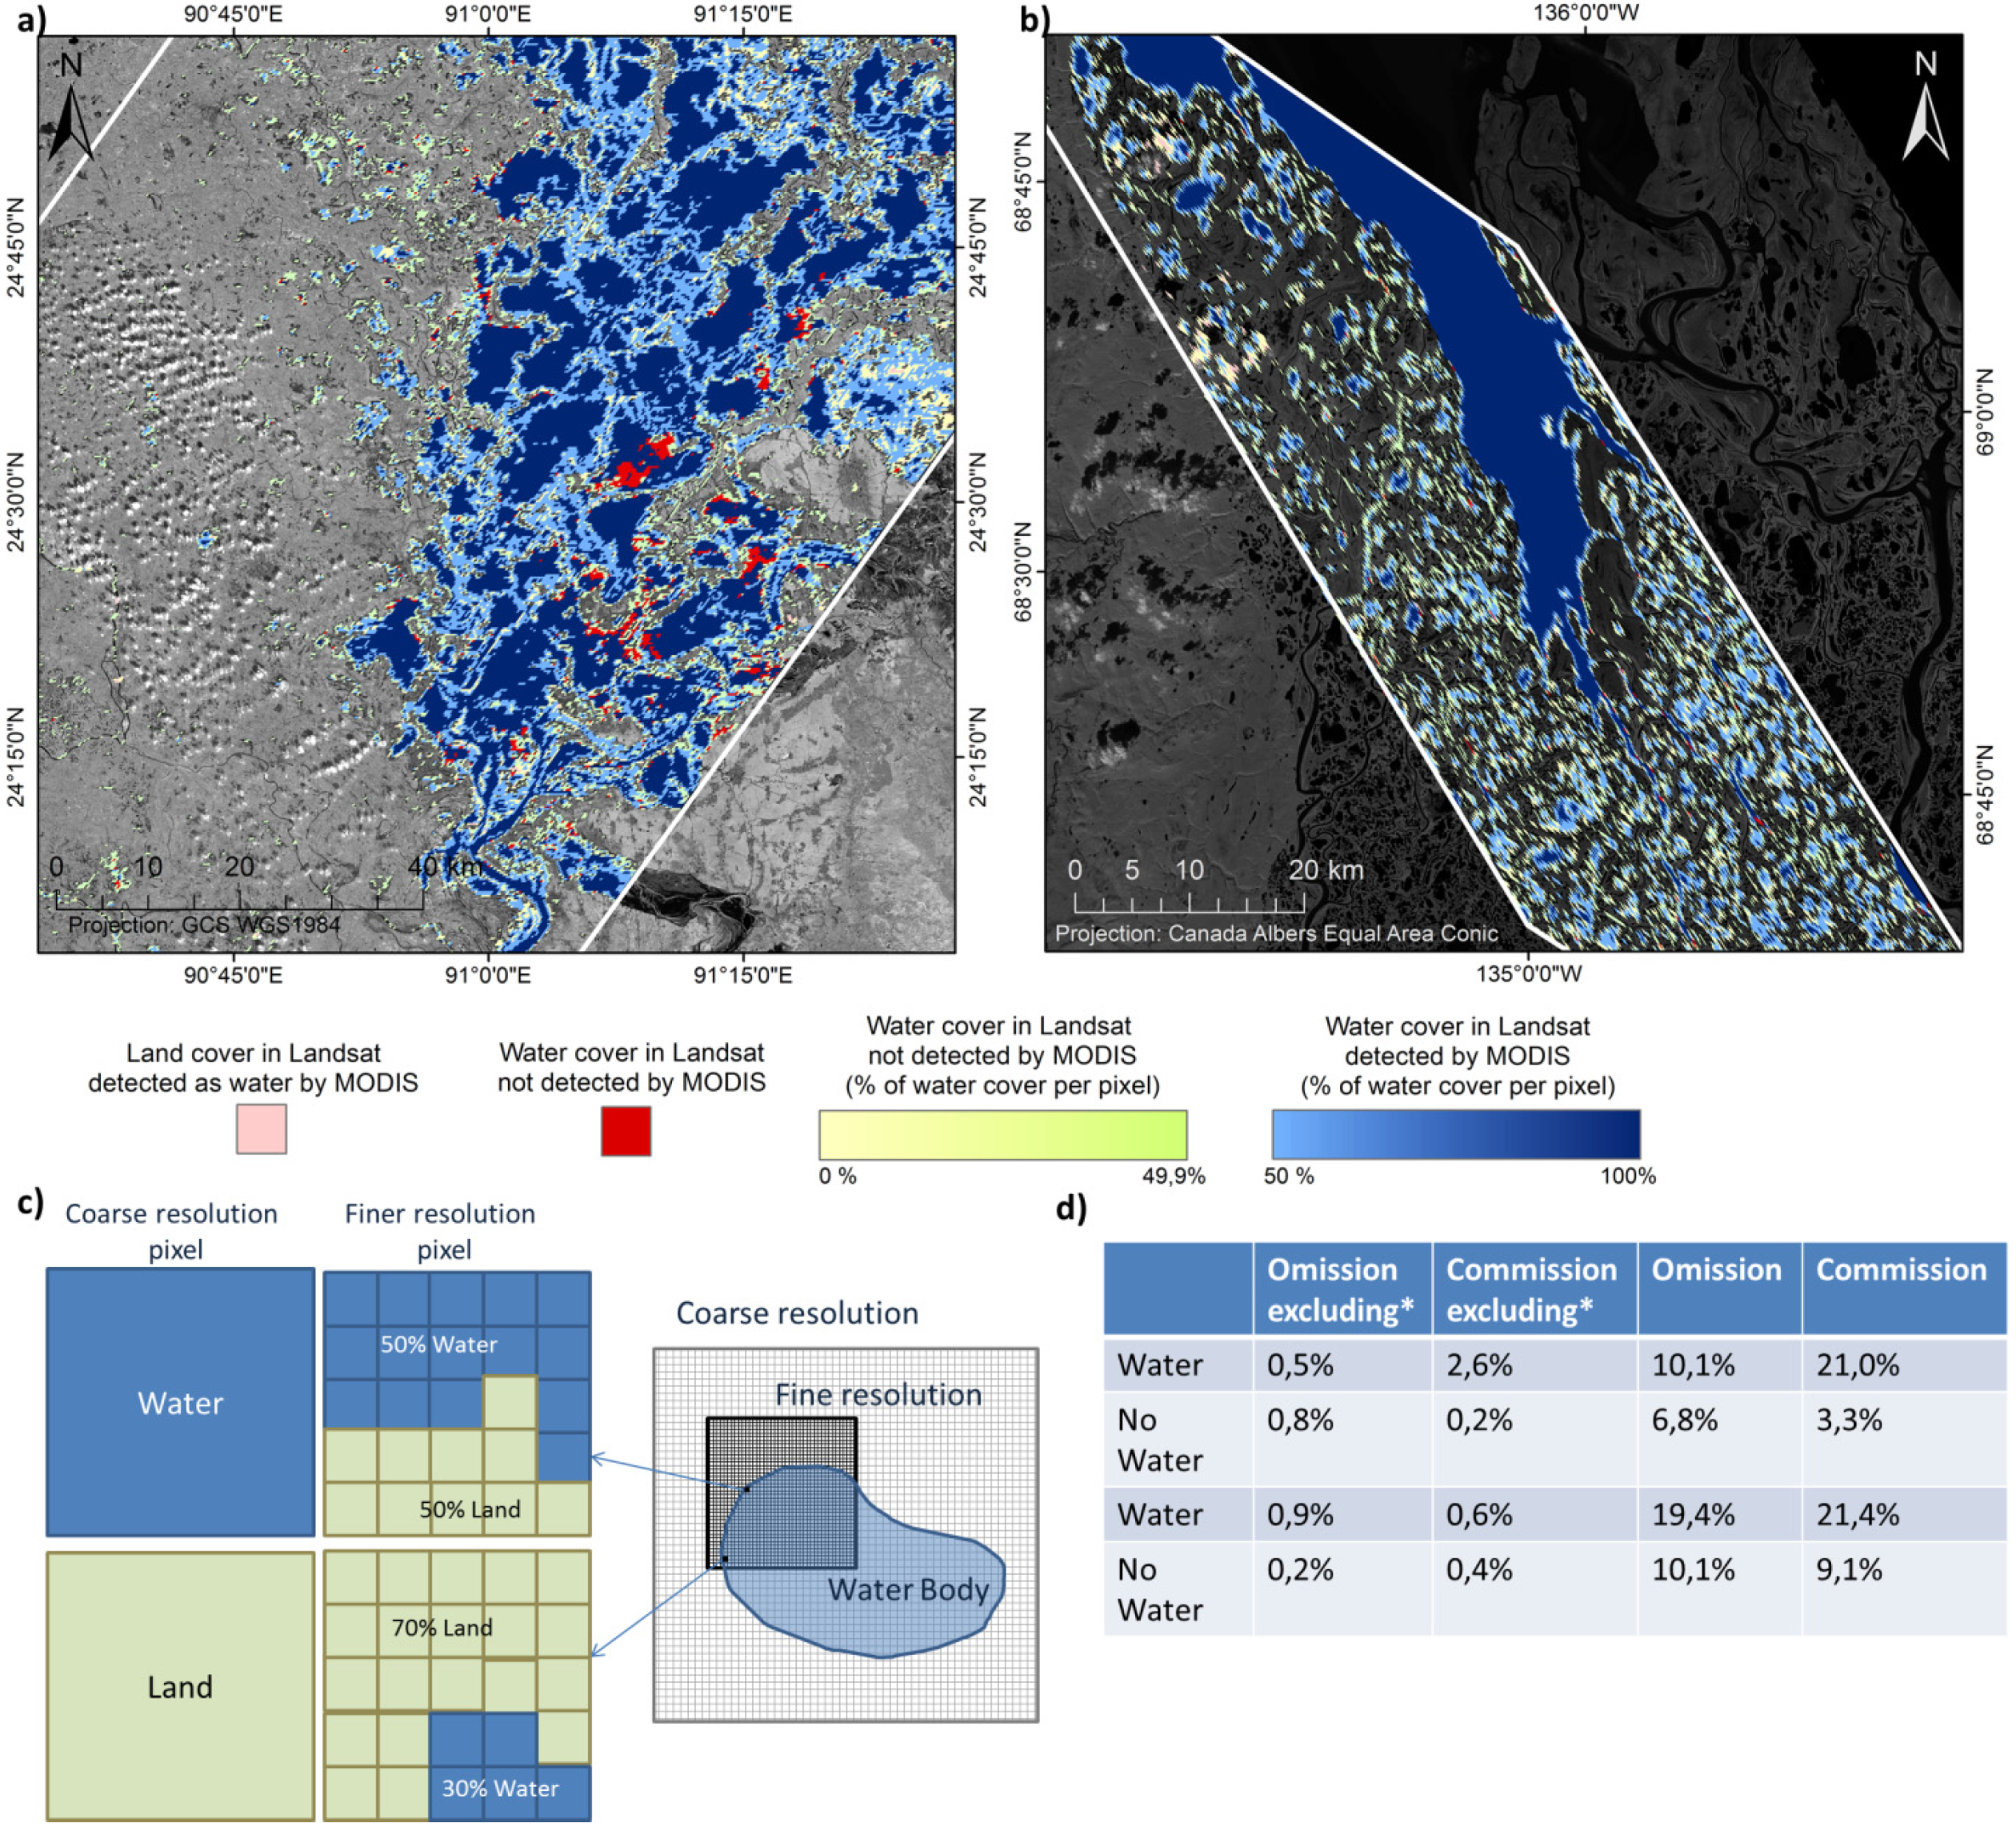
| Error Matrix Excluding Transition Zone (Landsat Water Fraction > 50%) | |||||
| Landsat/MODIS | Water | No Water | Total | Omission | Commission |
| Water | 540,420 | 2660 | 543,080 | 0.5% | 2.6% |
| No Water | 14,190 | 1,732,430 | 1,746,620 | 0.8% | 0.2% |
| Total | 554,610 | 1,735,090 | 2,272,850 | ||
| Error Matrix taking the transition zone into account (Landsat fraction < 50%) | |||||
| Landsat/MODIS | Water | No Water | Total | Omission | Commission |
| Water | 540,420 | 60,460 | 600,580 | 10.1% | 21.0% |
| No Water | 126,150 | 1,732,430 | 1,858,580 | 6.8% | 3.3% |
| Total | 666,570 | 1,792,890 | 2,272,850 | ||
| Error Matrix Excluding Transition Zone (Landsat Water Fraction > 50%) | |||||
| Landsat/MODIS | Water | No Water | Total | Omission | Commission |
| Water | 171,400 | 1560 | 172,960 | 0.9% | 0.6% |
| No Water | 960 | 407,540 | 408,500 | 0.2% | 0.4% |
| Total | 172,360 | 409,100 | 578,940 | ||
| Error Matrix taking the transition zone into account (Landsat fraction < 50%) | |||||
| Landsat/MODIS | Water | No Water | Total | Omission | Commission |
| Water | 171,400 | 41,240 | 212,640 | 19.4% | 21.4% |
| No Water | 45,520 | 407,540 | 453,060 | 10.1% | 9.1% |
| Total | 216,920 | 448,780 | 578,940 | ||
5. Discussion
6. Conclusions and Outlook
Acknowledgments
Author Contributions
Conflicts of Interest
References
- Martinis, S.; Twele, A.; Kersten, J. A fully automated TerraSAR-X based flood service. ISPRS J. Photogramm. 2014. [Google Scholar] [CrossRef]
- Jawak, S.D.; Luis, A.J. A rapid extraction of water body features from antarctic coastal oasis using very high-resolution satellite remote sensing data. Aquati. Procedia 2015, 4, 125–132. [Google Scholar] [CrossRef]
- Greifeneder, F.; Wagner, W.; Sabel, D.; Naeimi, V. Suitability of SAR imagery for automatic flood mapping in the Lower Mekong basin. Int. J. Remote Sens. 2014, 35, 2857–2874. [Google Scholar] [CrossRef]
- Henry, J.-B.; Chastanet, P.; Fellah, K.; Desnos, Y.-L. Envisat multi-polarized ASAR data for flood mapping. Int. J. Remote Sens. 2006, 27, 1921–1929. [Google Scholar] [CrossRef]
- Hoque, R.; Nakayama, D.; Matsuyama, H.; Matsumoto, J. Flood monitoring, mapping and assessing capabilities using RADARSAT remote sensing, GIS and ground data for Bangladesh. Nat. Hazards 2010, 58, 525–548. [Google Scholar] [CrossRef]
- Gstaiger, V.; Gebhardt, S.; Huth, J.; Wehrmann, T.; Kuenzer, C. Multi-sensoral and automated derivation of inundated areas using TerraSAR-X and ENVISAT ASAR data. Int. J. Remote Sens. 2012, 33, 7291–7304. [Google Scholar] [CrossRef]
- Hess, L.L.; Melack, J.M.; Filoso, S.; Wang, Y. Delineation of inundated area and vegetation along the amazon floodplain with the SIR-C synthetic aperture radar. IEEE Trans. Geosci. Remote Sens. 1995, 33, 896–904. [Google Scholar] [CrossRef]
- Hess, L.L.; Melack, J.M.; Novo, E.M.L.M.; Barbosa, C.C.F.; Gastil, M. Dual-season mapping of wetland inundation and vegetation for the central Amazon basin. Remote Sens. Environ. 2003, 87, 404–428. [Google Scholar] [CrossRef]
- Kuenzer, C.; Knauer, K. Remote sensing of rice crop areas—A review. Int. J. Remote Sens. 2013, 34, 2101–2139. [Google Scholar] [CrossRef]
- Mason, D.C.; Speck, R.; Devereux, B. Flood detection in urban areas using TerraSAR-X. IEEE Trans. Geosci. Remote Sens. 2010, 48, 882–893. [Google Scholar] [CrossRef]
- Kiage, L.M.; Walker, N.D.; Balasubramanian, S.; Babin, A.; Barras, J. Applications of Radarsat-1 synthetic aperture radar imagery to assess hurricane-related flooding of coastal Louisiana. Int. J. Remote Sens. 2005, 26, 5359–5380. [Google Scholar] [CrossRef]
- Lang, M.W.; Kasischke, E.S.; Prince, S.D.; Pittman, K.W. Assessment of C-band synthetic aperture radar data for mapping and monitoring Coastal Plain forested wetlands in the Mid-Atlantic Region, U.S.A. Remote Sens. Environ. 2008, 112, 4120–4130. [Google Scholar] [CrossRef]
- Kasischke, E.S.; Smith, K.B.; Bourgeau-Chavez, L.L.; Romanowicz, E.A.; Brunzell, S.; Richardson, C.J. Effects of seasonal hydrologic patterns in south Florida wetlands on radar backscatter measured from ERS-2 SAR imagery. Remote Sens. Environ. 2003, 88, 423–441. [Google Scholar] [CrossRef]
- Kuenzer, C.; Huth, J.; Martinis, S.; Lu, L.; Dech, S. SAR time series for the analysis of inundation patterns in the Yellow River Delta, China. In Remote Sensing Time Series: Revealing Land Surface Dynamics; Kuenzer, C., Dech, S., Wagner, W., Eds.; Springer Netherland: Dordrecht, The Netherlands, 2015. [Google Scholar]
- Kuenzer, C.; Guo, H.; Leinenkugel, P.; Huth, J.; Li, X.; DECH, S. Flood mapping and flood dynamics of the Mekong Delta: An ENVISAT-ASAR-WSM based time series analyses. Remote Sens. 2013, 5. [Google Scholar] [CrossRef] [Green Version]
- Kuenzer, C.; Guo, H.; Schlegel, I.; Vo, Q.T.; Li, X.; DECH, S. Scale and the capability of Envisat ASAR-WSM, TerraSAR-X Scansar, and TerraSAR-X Stripmap data to assess urban flood situations: A case study in Can Tho Province of the Mekong Delta. Remote Sens. 2013, 5, 5122–5142. [Google Scholar] [CrossRef]
- Ulaby, F.T.; Long, D.G. Microwave Radar and Radiometric Remote Sensing; University of Michigan Press: Ann Arbor, MI, USA, 2014. [Google Scholar]
- Werle, D.; Martin, T.C.; Hasan, K. Flood and coastal zone monitoring in Bangladesh with Radarsat ScanSAR: Technical experience and institutional challenges. J. Hopkins APL Tech. D 2001, 21, 148–154. [Google Scholar]
- Matgen, P.; Hostache, R.; Schumann, G.; Pfister, L.; Hoffman, L.; Svanije, H.H.G. Towards and automated SAR based flood monitoring system: Lessons learned from two case studies. Phys. Chem. Earth 2011, 36, 241–252. [Google Scholar] [CrossRef]
- Pierdicca, N.; Pulvirenty, L.; Chini, M.; Guerriero, L.; Candela, L. Observing floods from space: Experience gained from COSMO-SkyMed observations. Acta Astronautica 2013, 80, 122–133. [Google Scholar] [CrossRef]
- Martinis, S.; Twele, A. A hierarchical spatio-temporal Markov model for improved flood mapping using multi-temporal X-band SAR data. Remote Sens. 2010, 2, 2240–2258. [Google Scholar] [CrossRef]
- Martinis, S.; Twele, A.; Voigt, S. Unsupervised extraction of flood-induced backscatter changes in SAR data using Markov image modeling on irregular graphs. IEEE Trans. Geosci. Remote Sens. 2011, 49, 251–263. [Google Scholar] [CrossRef]
- Martinis, S.; Twele, A.; Voigt, S. Towards operational near-real time flood detection using a split-based automatic thresholding procedure on high resolution TerraSAR-X data. Nat. Hazard. Earth Sys. 2009, 9, 303–314. [Google Scholar] [CrossRef]
- Kuenzer, C.; Ottinger, M.; Liu, G.; Sun, B.; Dech, S. Earth observation-based coastal zone monitoring of the Yellow River Delta: Dynamics in China’s second largest oil producing region over four decades. Appl. Geogr. 2014, 55, 92–107. [Google Scholar] [CrossRef]
- Zhou, C.; Luo, J.; Yang, C.; Li, B.; Wang, S. Flood monitoring using multi-temporal AVHRR and Radarsat imagery. Photogramm. Eng. Remote Sens. 2000, 66, 633–638. [Google Scholar]
- Chaouch, N.; Temimi, M.; Hagen, S.; Weishampel, J.; Medeiros, S.; Khanbilvardi, R. A synergetic use of satellite imagery from SAR and optical sensors to improve coastal flood mapping in the Gulf of Mexico. Hydrol. Process. 2011, 26, 1617–1628. [Google Scholar] [CrossRef]
- Klein, I.; Dietz, A.J.; Gessner, U.; Galayeva, A.; Myrzakhmetova, A.; Kuenzer, C. Evaluation of seasonal water body extents in Central Asia over the past 27 years derived from medium-resolution remote sensing data. Int. J. Appl. Earth Obs. 2014, 26, 335–349. [Google Scholar] [CrossRef]
- Auynirundronkool, K.; Chen, N.; Peng, C.; Yang, C.; Gong, J.; Silapathong, C. Flood detection and mapping of the Thailand Central plain using Radarsat and MODIS under a sensor web environment. Int. J. Appl. Earth Obs. 2012, 14, 245–255. [Google Scholar] [CrossRef]
- Sakamoto, T.; Nguyen, N.V.; Kotera, A.; Ohno, H.; Ishitsuka, N.; Yokozawa, M. Detecting temporal changes in the extent of annual flooding within the Cambodia and the Vietnamese Mekong Delta from MODIS time-series imagery. Remote Sens. Environ. 2007, 109, 295–313. [Google Scholar] [CrossRef]
- Dietz, A.; Kuenzer, C.; CONRAD, C. Snow cover variability in Central Asia between 2000 and 2011 derived from improved MODIS daily snow cover products. Int. J. Remote Sens. 2013, 34, 3879–3902. [Google Scholar] [CrossRef]
- Kuenzer, C.; Renaud, F. Climate change and environmental change in river Deltas Globally. In The Mekong Delta System—Interdisciplinary Analyses of a River Delta; Renaud, F., Kuenzer, C., Eds.; Springer Netherland: Dordrecht, The Netherlands, 2012; pp. 7–48. [Google Scholar]
- Kuenzer, C.; van Beijma, S.; Gessner, U.; Dech, S. Land surface dynamics and environmental challenges of the Niger Delta, Africa: Earth observation based analyses spanning three decades (1986–2013). Appl. Geogr. 2014, 53, 354–368. [Google Scholar] [CrossRef]
- Ericsson, J.P.; Vörösmarty, C.J.; Dingman, S.L.; Ward, L.G.; Meybeck, M. Effective sea-level rise and deltas: Causes of change and human dimension implications. Glob. Planet. Chang. 2006, 50, 63–82. [Google Scholar] [CrossRef]
- Renaud, F.; Syyvistski, J.P.M.; Sebesvari, S.; Werners, S.; Kremer, H.; Kuenzer, C.; Jeuken, A.; Ramachandran, R.; Friedrich, J. Tipping from the Holocene to the Anthropocene: How threatened are major world deltas? Curr. Opin. Environ. Sustain. 2014, 5, 644–654. [Google Scholar] [CrossRef]
- Ye, Q.; Liu, G.; Tian, G.; Chen, S.; Huang, C.; Chen, S.; Liu, Q.; Chang, J.; Shi, Y. Geospatial-temporal analysis of land-use changes in the Yellow River Delta during the last 40 years. Earth Sci. 2004, 47, 1008–1024. [Google Scholar] [CrossRef]
- Zhang, T.T.; Zhao, B. Impact of anthropogenic land-uses on salinization in the Yellow River Delta, China: Using RS-GIS statistical model. Int. Arch. Photogramm. Remote Sens. Spat. Inf. Sci. 2010, 38, 545–561. [Google Scholar]
- Higgins, S.; Overeem, I.; Tanaka, A.; Syvistski, J. Land subsidence at aquaculture facilities in the Yellow River delta, China. Geophys. Res. Lett. 2013, 40, 3898–3902. [Google Scholar] [CrossRef]
- Bi, X.; Wang, B.; Lu, Q. Fragmentation effects of oil wells and roads on the Yellow River Delta, North China. Ocean Coast. Manag. 2011, 54, 256–264. [Google Scholar] [CrossRef]
- Ottinger, M.; Kuenzer, C.; Liu, G.; Wang, S.; Dech, S. Monitoring land cover dynamics in the Yellow River Delta from 1995 to 2010 based on Landsat 5 TM. Appl. Geogr. 2013, 44, 53–68. [Google Scholar] [CrossRef]
- Renaud, F.; Kuenzer, C. The water-development nexus: Importance of knowledge, information and cooperation in the Mekong Delta. In The Mekong Delta System—Interdisciplinary Analyses of A River Delta; Renaud, F., Kuenzer, C., Eds.; Springer Netherland: Dordrecht, The Netherlands, 2012; pp. 445–458. [Google Scholar]
- Kuenzer, C.; Campbell, I.; Roch, M.; Leinenkugel, P.; Vo Quoc, T.; Dech, S. Understanding the impacts of hydropower developments in the context of upstream-downstream relations in the Mekong River Basin. Sustain. Sci. 2013, 8, 565–584. [Google Scholar] [CrossRef]
- Kummu, M.; Varis, O. Sediment-related impacts due to upstream reservoir trapping of the Lower Mekong River. Geomorphology 2007, 85, 275–293. [Google Scholar] [CrossRef]
- Moder, F.; Kuenzer, C.; Xu, Z.; Leinenkugel, P.; van Bui, Q. IWRM for the Mekong Basin. In The Mekong Delta System—Interdisciplinary Analyses of a River Delta; Renaud, F., Kuenzer, C., Eds.; Springer Netherland: Dordrecht, The Netherlands, 2012; pp. 133–166. [Google Scholar]
- Aung, T.T.; Mochida, Y.; Than, M.M. Prediction of recovery pathways of cyclone-disturbed mangroves in the Mega delta of Myanmar. Forest. Ecol. Manag. 2013, 293, 103–113. [Google Scholar] [CrossRef]
- Islam, G.M.; Islam, A.K.M.; Shopan, A.A.; Rahman, M.M.; Lázár, A.N.; Mukhopadhyay, A. Implications of agricultural land use change to ecosystem services in the Ganges delta. J. Environ. Manag. 2014. [Google Scholar] [CrossRef]
- Ullmann, T.; Schmitt, A.; Roth, A.; Duffe, J.; Dech, S.; Hubberten, H.W.; Baumhauer, R. Land cover characterization and classification of arctic tundra environments by means of Polarized Synthetic Aperture X- and C-Band Radar (PolSAR) and Landsat 8 multispectral imagery—Richards Island, Canada. Remote Sens. 2014, 6, 8565–8593. [Google Scholar]
- Slater, J.A.; Garvey, G.; Johnston, C.; Haase, J.; Heady, B.; Kroenung, G.; Little, J. The SRTM data finishing process and products. Photogramm. Eng. Remote Sens. 2006, 72, 237–247. [Google Scholar] [CrossRef]
- Lehner, B.; Doell, P. Development and validation of a global database of lakes, reservoirs and wetlands. J. Hydrol. 2004, 296, 1–22. [Google Scholar] [CrossRef]
- Carroll, M.L.; Townshend, J.R.; DiMiceli, C.M.; Noojipady, P.; Sohlberg, R.A. A new global raster water mask at 250 m resolution. Int. J. Digit. Earth 2009, 2, 291–308. [Google Scholar] [CrossRef]
- Verpoorter, C.; Kutser, T.; Seekell, D.A.; Tranvikm, L.J. A global inventory of lakes based on high-resolution satellite imagery. Geophys. Res. Lett. 2014, 41, 1–7. [Google Scholar] [CrossRef]
- Vermote, E.F.; Vermeulen, A. Algorithm Technical Background Document Atmospheric Correction Algorithm: Spectral Reflectances (MOD09). Available online: http://modis.gsfc.nasa.gov/data/atbd/atbd_mod08.pdf (accessed on 7 September 2011).
- Klein, I.; Dietz, A.; Gessner, U.; Kuenzer, C. Global WaterPack: Intra-annual assessment of spatio-temporal variability of inland water bodies. In Remote Sensing Time Series: Revealing Land Surface Dynamics; Kuenzer, C., Dech, S., Wagner, W., Eds.; Springer Netherland: Dordrecht, The Netherlands, 2015; pp. 99–119. [Google Scholar]
- Riggs, G.A.; Hall, D.K.; Salomonson, V.V. MODIS Snow Products User Guide to Collection 5; National Snow and Ice Data Center: Boulder, CO, USA, 2006. [Google Scholar]
- CGIAR. Available online: http://www.cgiar-csi.org/data/srtm-90m-digital-elevation-database-v4–1 (accessed on 7 April 2015).
- Sheng, Y.; Su, Y.X.Q. Challenging the cloud contamination problem in flood monitoring with NOAA/AVHRR imagery. Photogramm. Eng. Remote Sens. 1998, 64, 191–198. [Google Scholar]
- Gao, B. NDWI: A normalized difference water index for remote sensing of vegetation liquid water from space. Remote Sens. Environ. 1996, 58, 257–266. [Google Scholar] [CrossRef]
- Ji, L.; Zhang, L.; Wylie, B. Analysis of dynamic thresholds for the normalized difference water index. Photogramm. Eng. Remote Sens. 2009, 75, 1307–1317. [Google Scholar] [CrossRef]
- McFeeters, S.K. The use of the Normalized Difference Water Index (NDWI) in the delineation of open water features. Int. J. Remote Sens. 1996, 17, 1425–1432. [Google Scholar] [CrossRef]
- Xu, H. Modification of Normalised Difference Water Index (NDWI) to enhance open water features in remotely sensed imagery. Int. J. Remote Sens. 2006, 27, 3025–3033. [Google Scholar] [CrossRef]
- Feyisa, G.L.; Meilby, H.; Fensholt, R.; Proud, S.R. Automated water extraction index: A new technique for surface water mapping using Landsat imagery. Remote Sens. Environ. 2014, 140, 23–35. [Google Scholar] [CrossRef]
- Ryu, J.-H.; Won, J.-S.; Min, K.D. Waterline extraction from Landsat TM data in a tidal flat: A Case study in Gomso Bay, Korea. Remote Sens. Environ. 2002, 83, 442–456. [Google Scholar] [CrossRef]
- Klein, I.; Dietz, A.; Gessner, U.; Dech, S.; Kuenzer, C. Results of the Global WaterPack: A novel product to assess inland water body dynamics on a daily basis. Remote Sens. Lett. 2015, 6, 78–87. [Google Scholar] [CrossRef]
- Vermote, E.F.; Kotchenova, S. Atmospheric correction for the monitoring of land surfaces. J. Geophys. Res. 2008, 113. [Google Scholar] [CrossRef]
- McCullough, I.M.; Loftin, C.S.; Sader, S.A. High-frequency remote monitoring of large lakes with MODIS 500 m imagery. Remote Sens. Environ. 2012, 124, 234–241. [Google Scholar] [CrossRef]
- Niu, Z.G.; Gong, P.; Cheng, X.; Guo, J.H.; Wang, L.; Huang, H.B.; Shen, S.Q.; Wu, Y.Z.; Wang, X.F.; Wang, X.W.; et al. Geographical characteristics of China’s wetlands derived from remotely sensed data. Sci. China Ser. D 2009, 52, 723–738. [Google Scholar] [CrossRef]
- Vo, Q.T.; Kuenzer, C.; Oppelt, N. How remote sensing supports mangrove ecosystem service valuation: A case study in Ca Mau Province, Vietnam. Ecosyst. Serv. 2015, 14, 67–75. [Google Scholar]
- Vo, Q.T.; Oppelt; Kuenzer, C. Remote sensing in mapping mangrove ecosystems—An object-based approach. Remote Sens. 2013, 5, 183–201. [Google Scholar] [CrossRef]
- Hill, P.; Hequette, A.; Ruz, M.; Jenner, K. Geological Investigations of the Canadian Beaufort Sea Coast; Open File 2387 of Natural Resources Canada; Geological Survey of Canada: Dartmouth, NS, Canada, 1991; p. 365. [Google Scholar]
- Burn, C.R.; Kokelj, S.V. The environment and permafrost of the Mackenzie Delta Area. Permafr. Periglac. Process. 2009, 20, 83–105. [Google Scholar] [CrossRef]
- Kuenzer, C.; Bluemel, A.; Gebhardt, S.; Vo Quoc, T.; Dech, S. Remote sensing of mangrove ecosystems: A review. Remote Sens. 2011, 3, 878–928. [Google Scholar] [CrossRef]
- Wang, H.; Yang, Z.; Bi, N.; Li, H. Rapid shifts of the river plume pathway off the Huanghe (Yellow) River mouth in response to water-sediment regulation scheme in 2005. Chin. Sci. Bull. 2005, 50, 2878–2884. [Google Scholar]
- Ogilvie, A.; Belaud, G.; Delenne, C.; Bailly, J.S.; Bader, J.C.; Oleksiak, A.; Ferry, L.; Martin, D. Decadal monitoring of the Niger Inner Delta flood dynamics using MODIS optical data. J. Hydrol. 2015, 523, 368–383. [Google Scholar] [CrossRef]
- Crétaux, J.; Bergen-Nguyen, M.; Leblan74c, M.; Del Rio Abarca, R.; Delclaux, F.; Mognard, N.; Lion, C.; Pandey, R.K.; Tweed, S.; et al. Flood mapping inferred from remote sensing data. Int. Water Technol. J. 2011, 1, 46–58. [Google Scholar]
- Leauthaud, C.; Belaud, G.; Duvail, S.; Moussa, R.; Grünberger, O.; Albergel, J. Characterizing floods in the poorly gauged wetlands of the Tana River Delta, Kenya, using a water balance model and satellite data. Hydrol. Earth Syst. Sci. 2013, 17, 3059–3075. [Google Scholar] [CrossRef] [Green Version]
© 2015 by the authors; licensee MDPI, Basel, Switzerland. This article is an open access article distributed under the terms and conditions of the Creative Commons Attribution license (http://creativecommons.org/licenses/by/4.0/).
Share and Cite
Kuenzer, C.; Klein, I.; Ullmann, T.; Georgiou, E.F.; Baumhauer, R.; Dech, S. Remote Sensing of River Delta Inundation: Exploiting the Potential of Coarse Spatial Resolution, Temporally-Dense MODIS Time Series. Remote Sens. 2015, 7, 8516-8542. https://0-doi-org.brum.beds.ac.uk/10.3390/rs70708516
Kuenzer C, Klein I, Ullmann T, Georgiou EF, Baumhauer R, Dech S. Remote Sensing of River Delta Inundation: Exploiting the Potential of Coarse Spatial Resolution, Temporally-Dense MODIS Time Series. Remote Sensing. 2015; 7(7):8516-8542. https://0-doi-org.brum.beds.ac.uk/10.3390/rs70708516
Chicago/Turabian StyleKuenzer, Claudia, Igor Klein, Tobias Ullmann, Efi Foufoula Georgiou, Roland Baumhauer, and Stefan Dech. 2015. "Remote Sensing of River Delta Inundation: Exploiting the Potential of Coarse Spatial Resolution, Temporally-Dense MODIS Time Series" Remote Sensing 7, no. 7: 8516-8542. https://0-doi-org.brum.beds.ac.uk/10.3390/rs70708516