1. Introduction
In China, the burning of coal accounts for about 70% of primary energy consumption [
1]. As a result of long-term and large-scale mining activities, more than 1 × 10
6 ha of land have been destroyed. Most mining areas face significant challenges, such as the monitoring and control of mining-related subsidence to prevent disasters, the restoration of the ecological environment after mining activity has ended, and the reclamation of abandoned land. An important key for solving these problems is to determine the mechanism that is responsible for mining-induced subsidence.
A mining subsidence basin will be formed after a working coal face has been exploited (
Figure 1). The range and value of the subsidence is related to factors such as mining depth, coal seam thickness, dip angle, size of working face, overlying strata characteristics,
etc. [
2]
. To exploit and extract coal easily, the mining direction generally follows the strike direction. The center of the mining subsidence basin is not above the center of the working face when the coal seam has a dip angle.
Figure 1.
Profiles of the mining subsidence basin in the strike and dip directions [
3].
H0 is the average depth of mining, m is the average thickness of coal seam, and α is the dip angle.
Figure 1.
Profiles of the mining subsidence basin in the strike and dip directions [
3].
H0 is the average depth of mining, m is the average thickness of coal seam, and α is the dip angle.
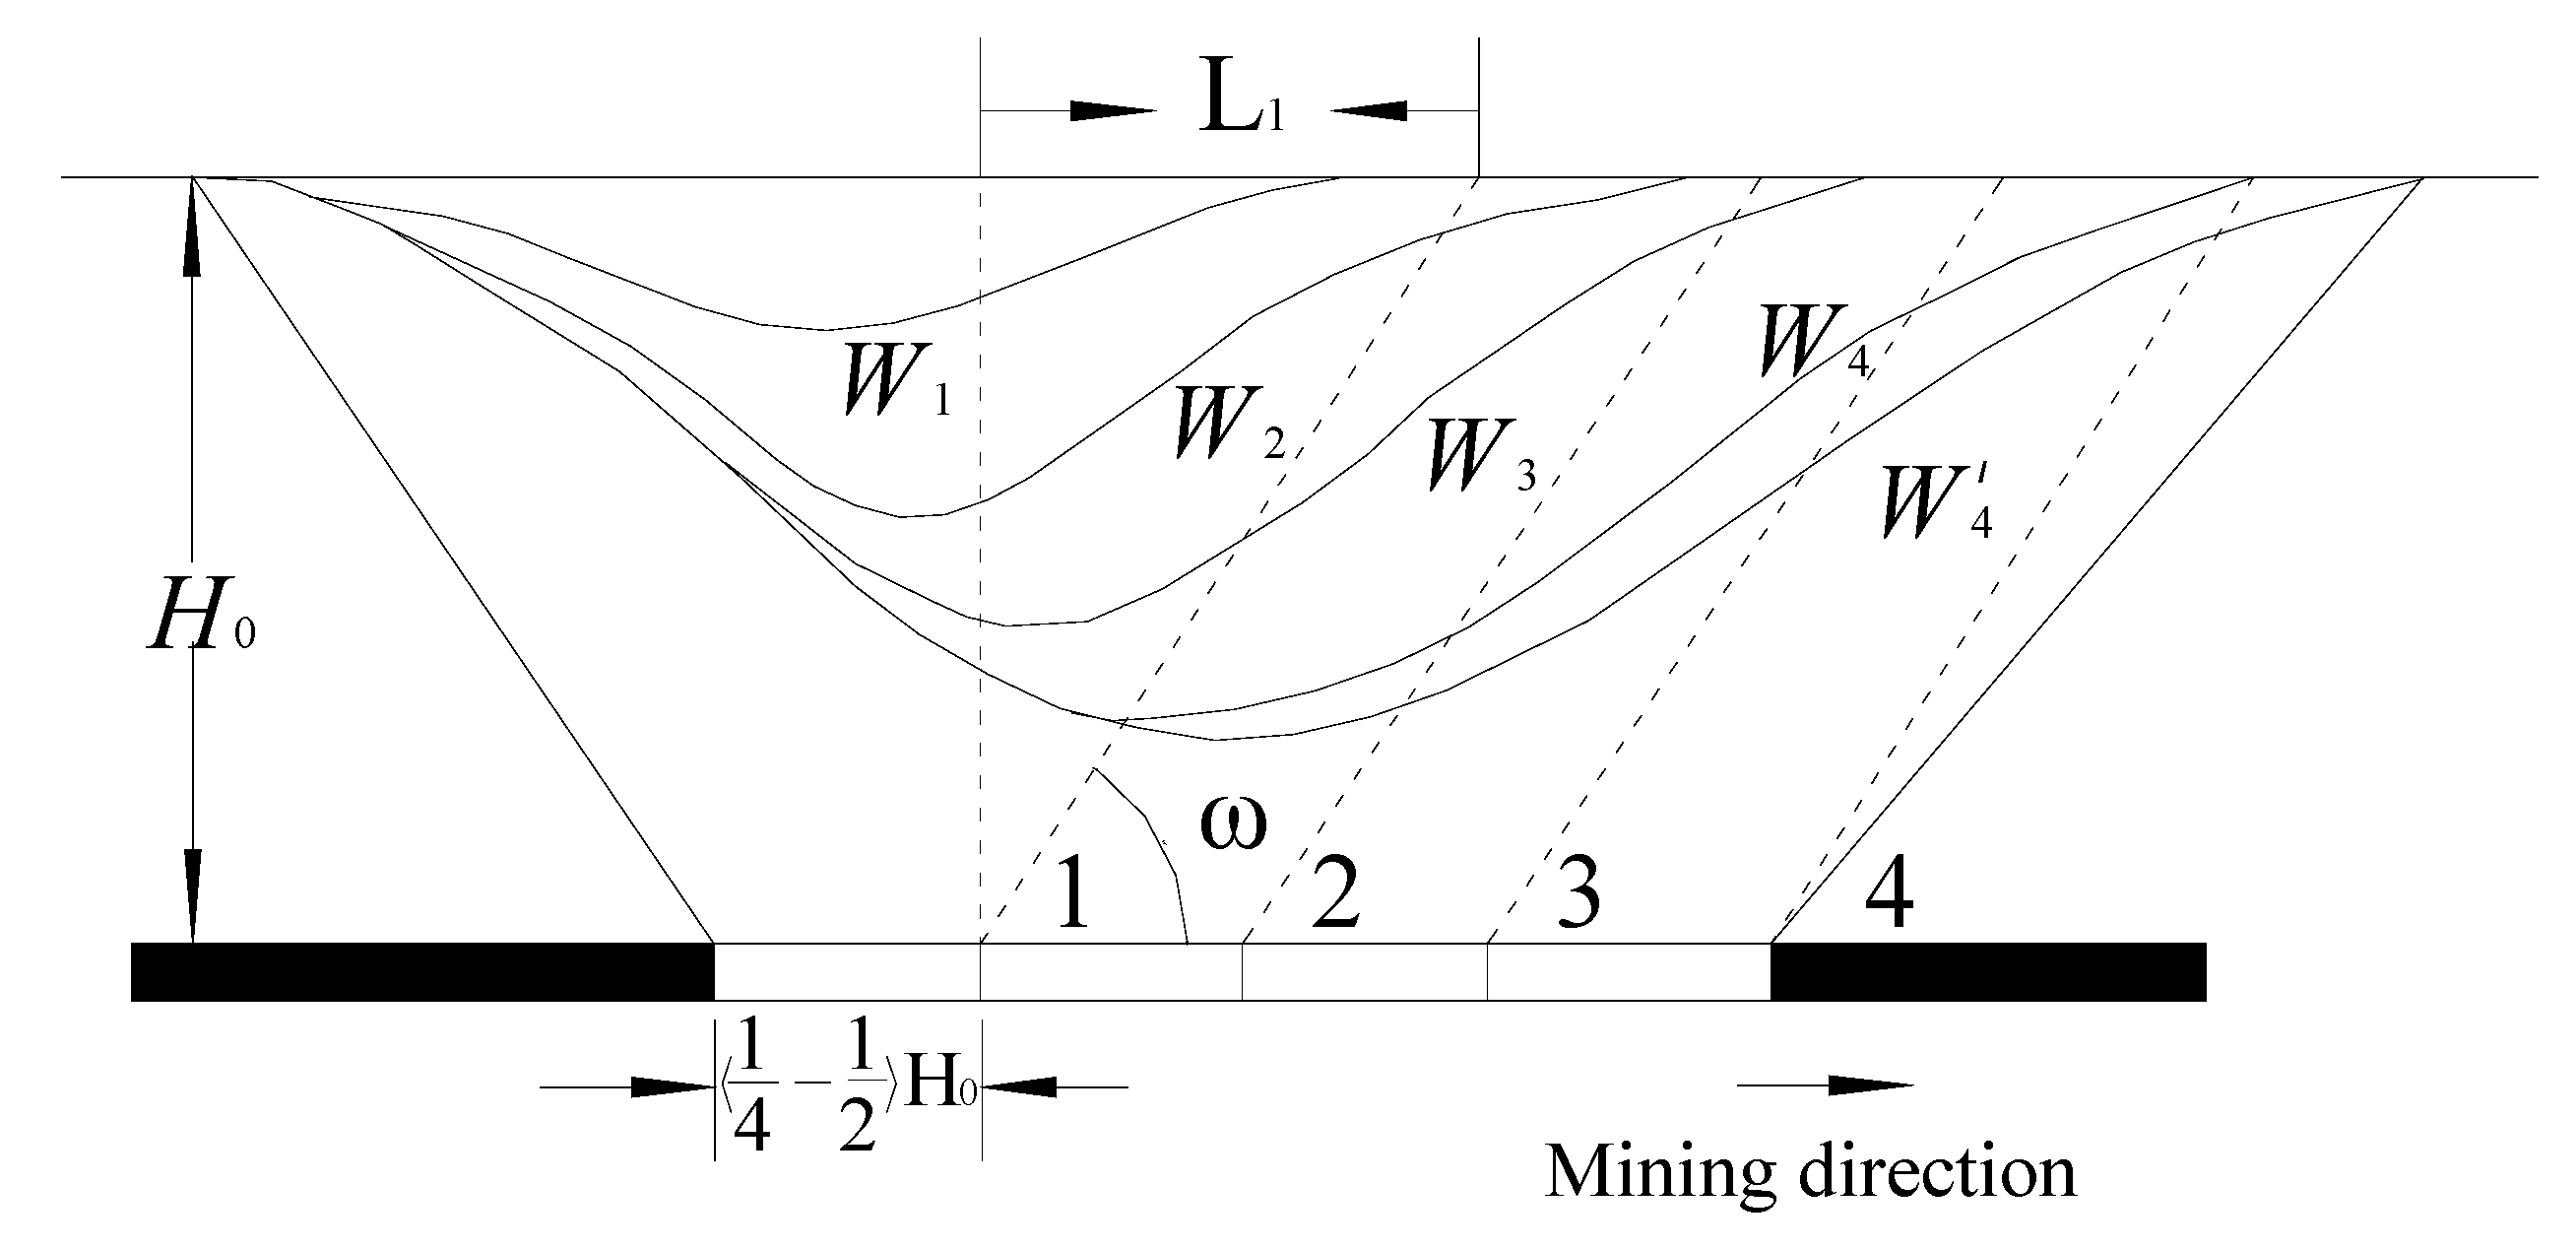
In the strike direction, the surface will begin to subside when the coal has been exploited over a certain distance, generally 0.25
H0–0.5
H0 (
Figure 2).
Figure 2 assumes that the coal seam is horizontal and that
W1–
W4 are the dynamic subsidence curves. When the mining plane arrives at point 1, subsidence curve
W1 is formed. As the coal continues to be exploited, the curve expands to be
W2, resulting in a greater area of subsidence. When mining of the working face is complete, curve
W4 is formed. The process from
W1 to
W4 is that of dynamic deformation. The subsidence then gradually becomes residual deformation, and
W′
4 represents the final mining subsidence basin in which almost no land movement occurs. The advance distance of influence (
L1), a dynamic subsidence parameter, is defined as the horizontal distance between the mining position and the point at which the ground surface starts to move (defined as −10 mm) ahead of the mining direction. The advance angle of influence (ω) can be expressed as ω = arctan(
H0/
L1) [
3,
4]. These two parameters can be used to predict the range of mining subsidence so that action can be taken to prevent buildings from being damaged or other measures taken to control potential disasters.
Figure 2.
Formation of a mining subsidence basin [
3].
H0 is the average depth of mining; ω and
L1 are the advance angle and distance of influence, respectively; 1–4 are the mining positions;
W1–
W4 are the subsidence curves during the exploitation of coal; and
W′
4 is the final subsidence curve when no surface movement occurs.
To monitor the subsidence related to mining, observation stations are arranged along the strike and inclination (dip) directions above the working coalface. Several methods have been used to determine the subsidence of these observation points, including leveling, global positioning system (GPS), and total station measurements. However, there are some limitations to these methods, including the need to measure subsidence on a point-by-point basis, the high costs involved, and the fact that these methods are labor intensive.
Differential interferometric synthetic aperture radar (D-InSAR) is a well-known technique that can be used to monitor subsidence over a large area; it has an accuracy of the order of centimeters or millimeters [
5]. It has been used in many applications, such as the determination of the deformation caused by earthquakes [
6,
7], monitoring the surface subsidence caused by groundwater exploitation [
8,
9], detecting movement in volcanos [
10,
11], measuring the deformation resulting from landslides [
12] and measuring mining-induced subsidence [
13,
14]. However, four problems have prevented the use of D-InSAR in monitoring land subsidence [
15]: (1) spatial decorrelation caused by a long baseline between SAR image pairs; (2) time decorrelation resulting from a loss of coherence due to vegetation and changes in the land surface; (3) variations in signal delays caused by atmospheric delay; and (4) phase unwrapping errors [
16].
It is more difficult to use D-InSAR to determine mining-induced subsidence in China than to determine the subsidence caused by groundwater exploitation for the following reasons:
- (1)
In China, fully mechanized longwall caving techniques are widely used in underground coal mines to maximize safety and productivity. However, these techniques result in rapid and large-scale land subsidence. For example, in the coal mine shown in this study, some areas subsided by 3 m within 11 days. With such large gradient deformations, the subsidence is not obtained correctly using the phase unwrapping algorithm [
16].
- (2)
There is often a lot of vegetation on the surface above working faces, so the coherence among SAR images is too low for strong temporal decorrelation.
- (3)
In spite of the widespread use of advanced D-InSAR methods, such as the Permanent Scatterer-InSAR [
17], the small baseline subset approach (SBAS) [
18], the interferometric point target analysis (IPTA) [
19], the Stanford method for Persistent Scatterers (StaMPS) [
20] and the SqueeSAR [
21], these methods are unlikely to be suitable for monitoring mining subsidence for a number of reasons. These reasons include the presence of only a few permanent scatterers on the surface above the working face and large non-linear deformations. The methods all consider that the main characteristic of land subsidence is linear.
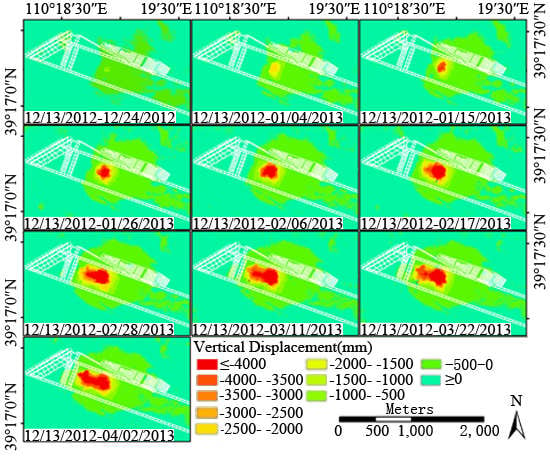
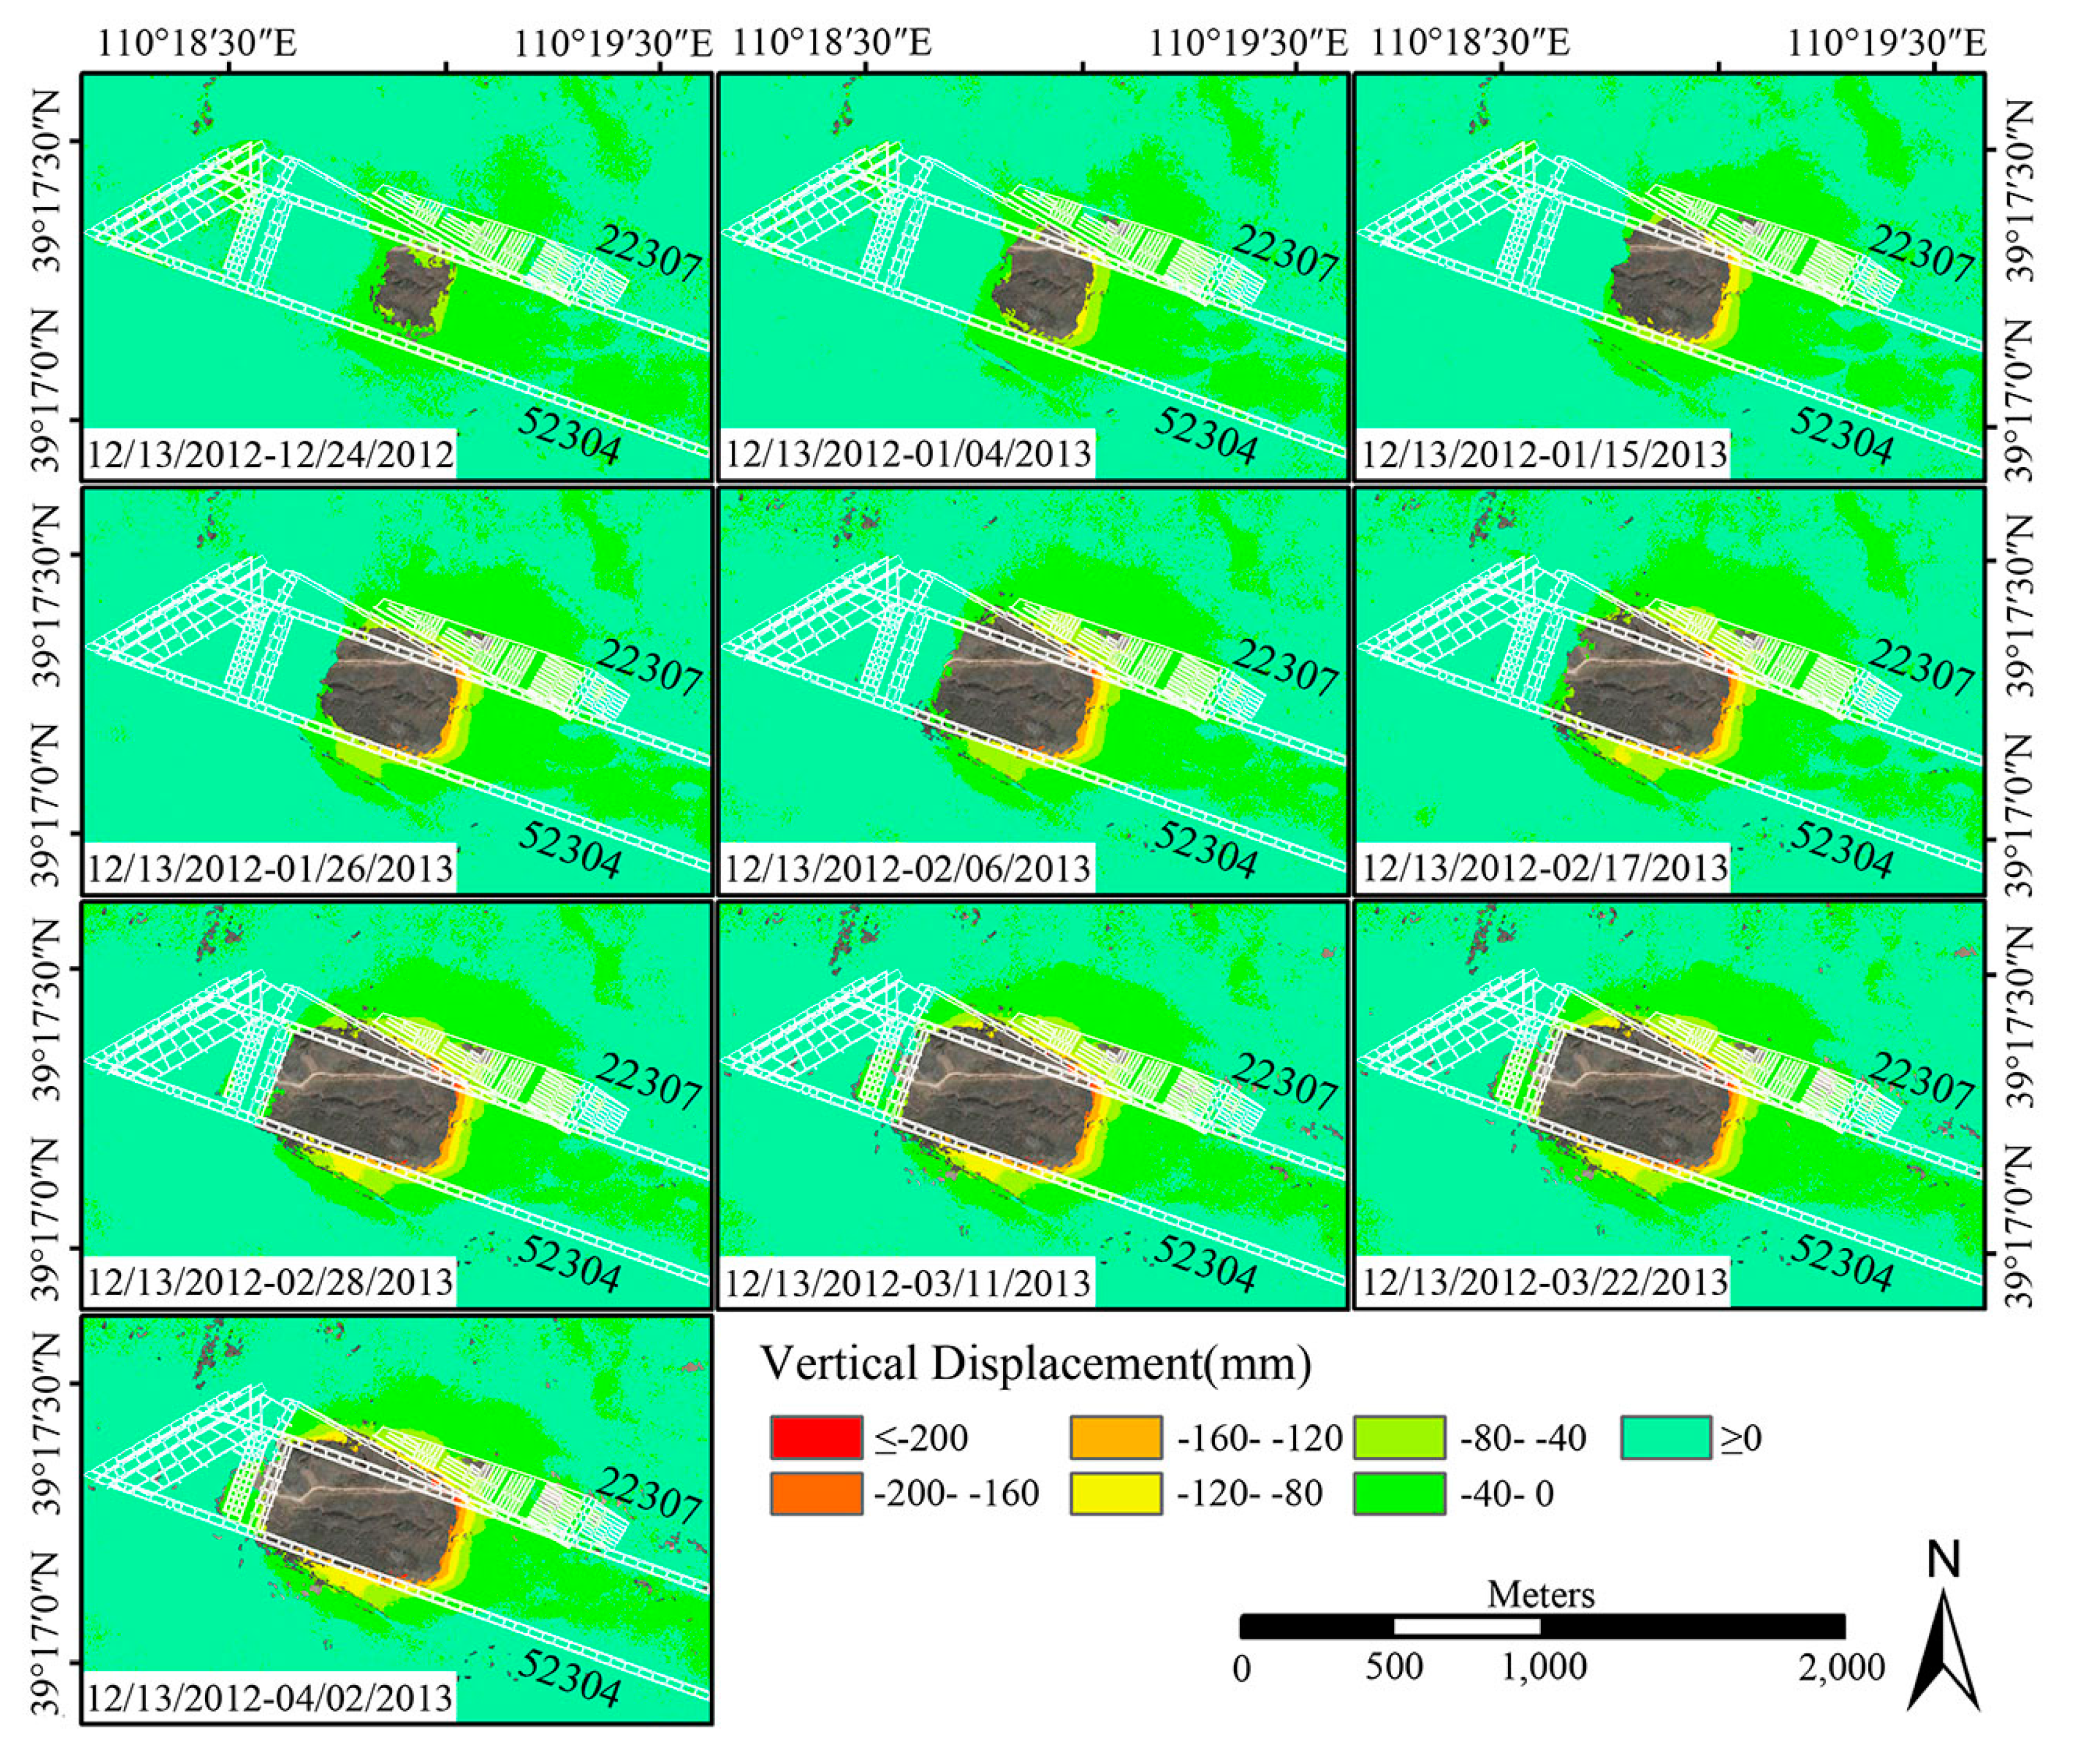
We report here an approach that uses phase-stacking and offset-tracking methods to obtain time-series data for mining-induced subsidence. The mining area was divided into regions with small and large deformations. The land subsidence for areas of small deformation was calculated using two-pass D-InSAR [
22], which is good for detecting small amounts of subsidence. Eleven TerraSAR-X (TSX) images were processed. Differential interferograms with an 11-day interval were generated and then accumulated to calculate a time-series subsidence. For the areas with a larger degree of deformation, a sub-pixel offset-tracking technique was used to obtain the subsidence with a large spatial gradient deformation. Finally, a time-series development of the whole subsidence basin was generated from the results of these two methods. The monitoring accuracy and the relationship between deformation and mining progression were analyzed.
2. Study Area
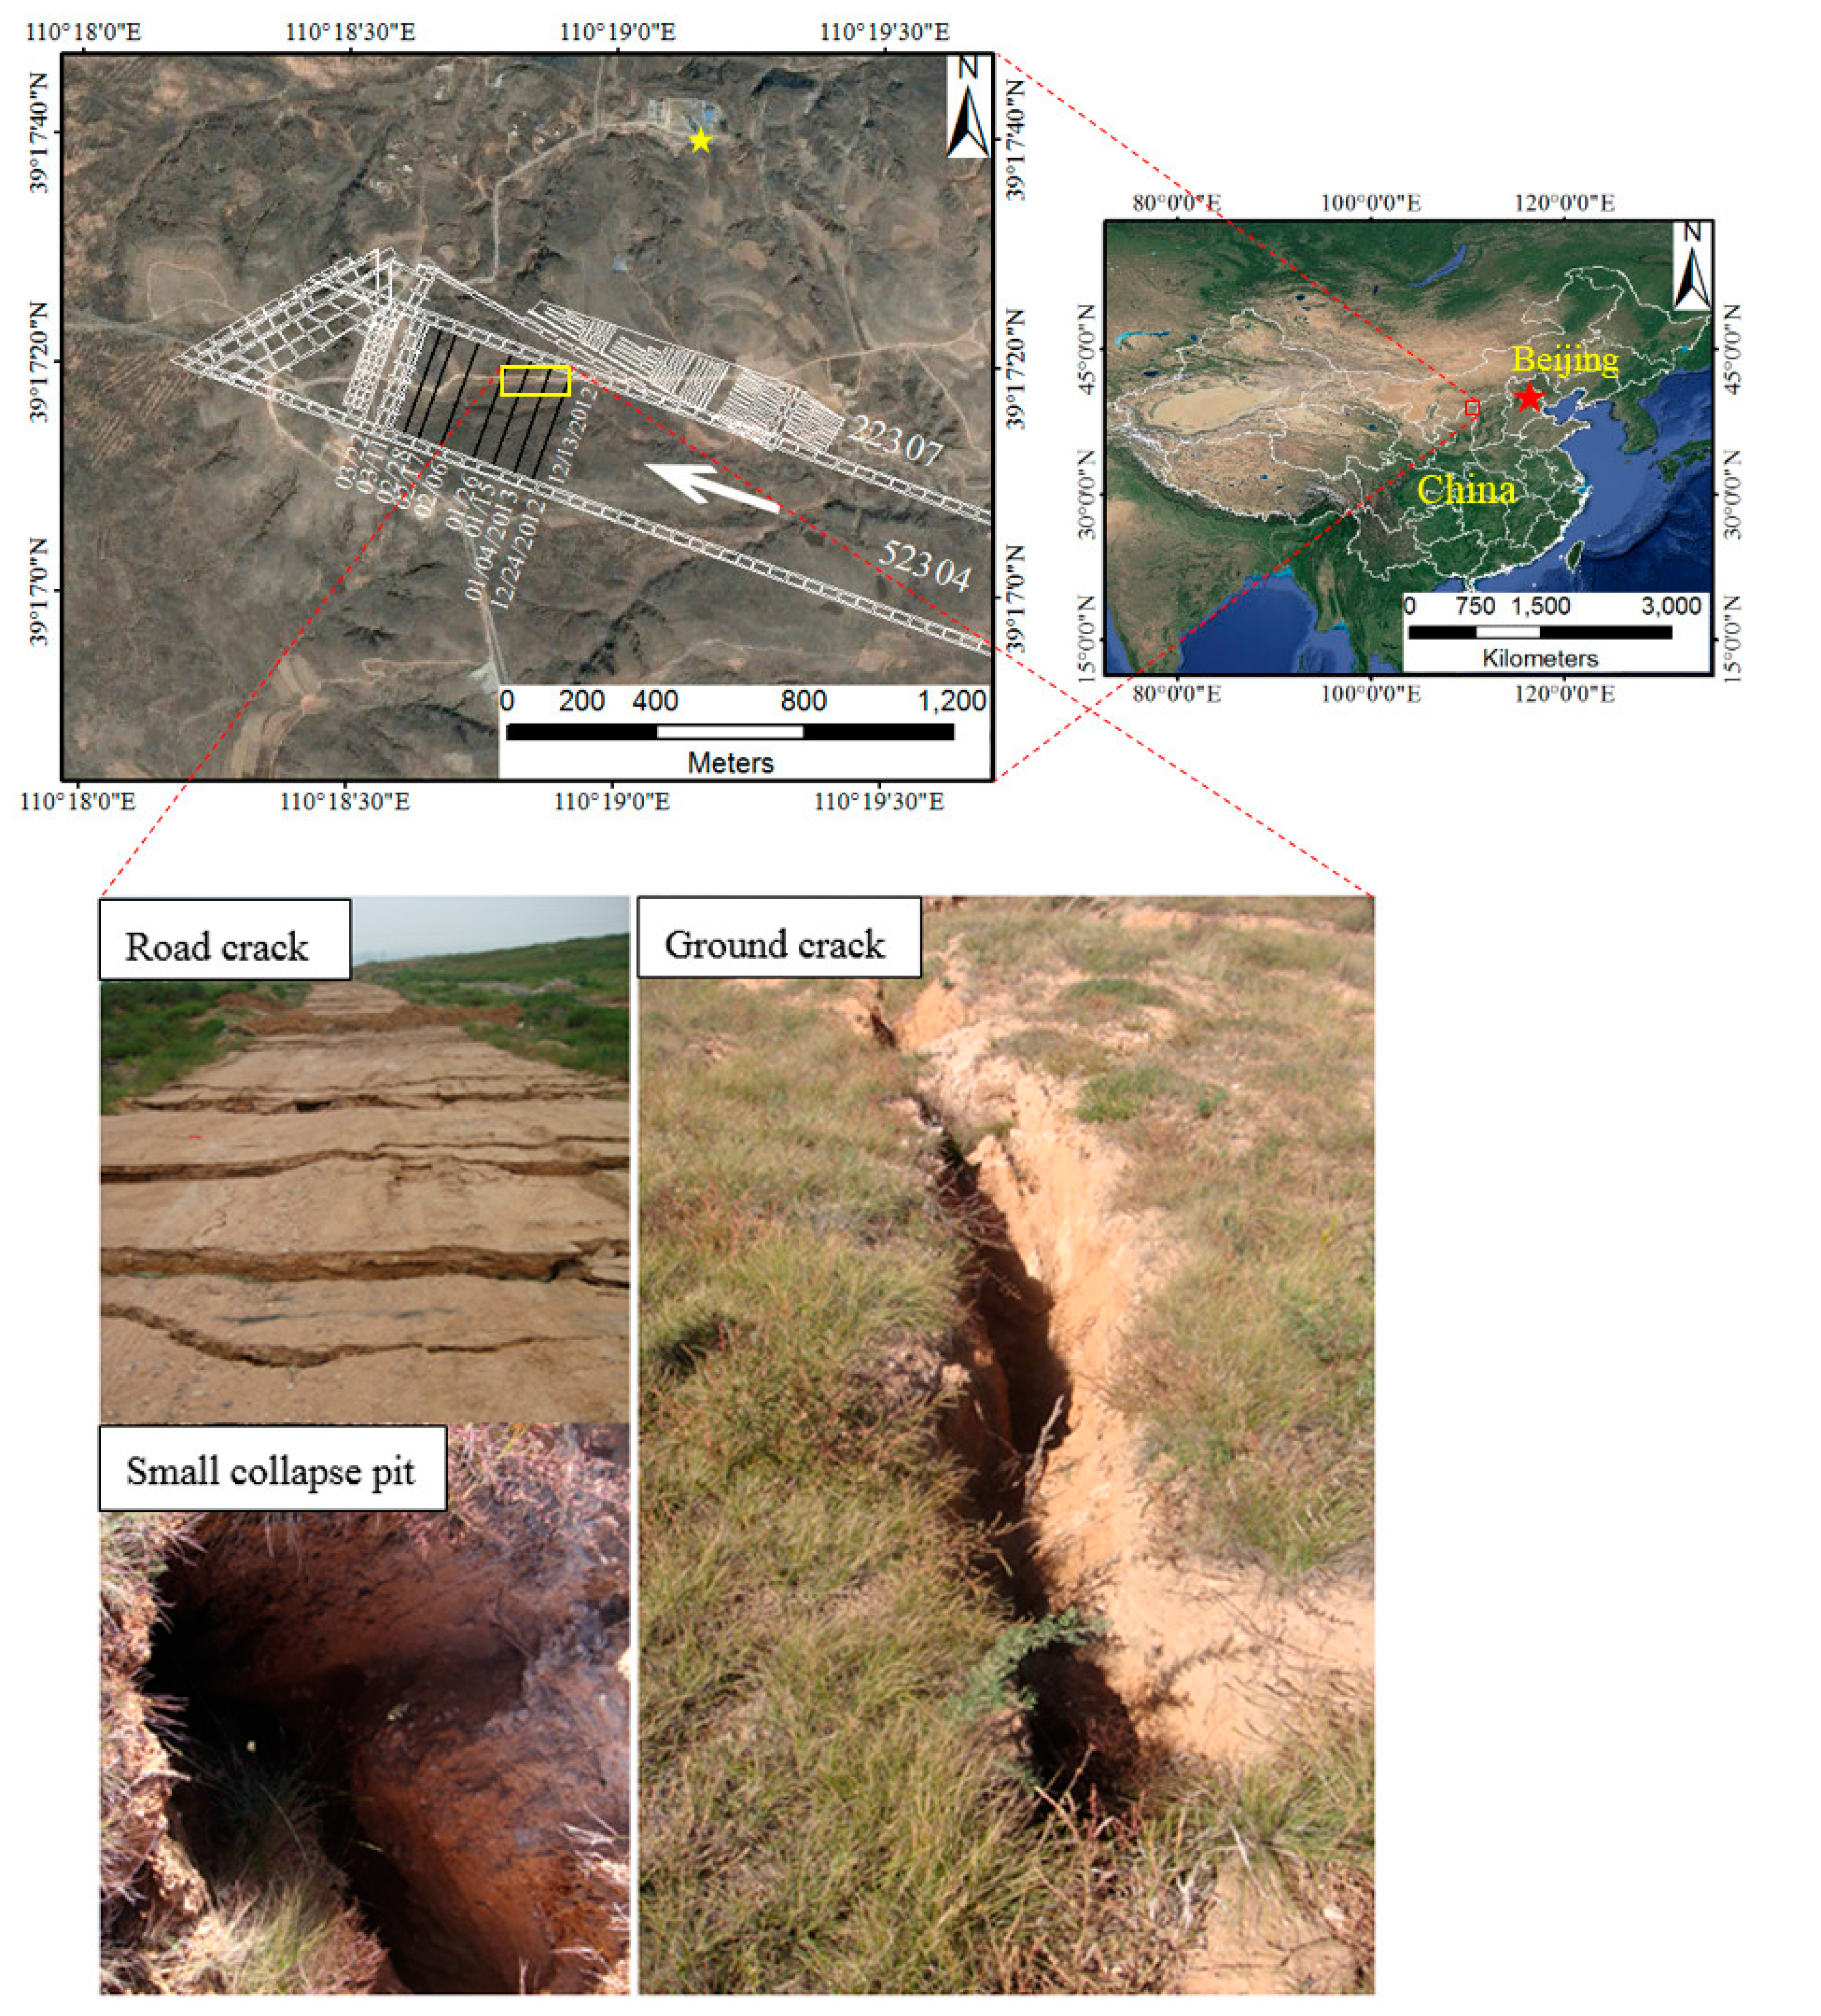
The study area was located in Yulin city in Shanxi Province, northwest China (
Figure 3), which is one of the largest areas for coal exploitation in China. The area is located in the transition zone between the Mu Us Desert and the Loess Plateau; it has an arid climate and few water resources. With the development of coal mining, ground cracking and collapse pits have occurred, and there have also been earthquakes and landslides, all of which have damaged the already fragile ecological environment.
Figure 3 also shows two working faces: 52304 and 22307. The 22307 working face, which was mined using a pillar and room method, was completely finished in 2005, and the residual land subsidence was very small. Therefore, there was very little contribution from this working face to the mining subsidence captured by the SAR images from 13 December 2012 to 2 April 2013. The 52304 working face was mined from 1 November 2011 to 25 March 2013, and the black lines show the mining position when the SAR images were captured. The mining conditions of the 52304 working face were as follows: the altitudes of the land surface varied in the range 1154.8 m–1269.9 m above sea level; the mining depth was 235 m; the strike and dip lengths were 4548 m and 301 m, respectively; the average thickness of coal seam was 6.94 m; and the dip angle was 1°–3°. The white arrow shows the direction of mining. A fully mechanized longwall caving technique was used, and the rate and spatial extent of subsidence were both large.
Figure 3.
Location of the study area in Yulin, Shanxi Province, northwest China, and the photographs of road cracks, a ground crack and a small collapse pit caused by coal mining activity, which were taken in July 2013. The white lines indicate the coal roadway, and the black lines and corresponding dates indicate the positions of the mining schedule.
3. Methodology
In this work, we used the phase-stacking and sub-pixel offset-tracking methods to generate the mining subsidence basin. Eleven repeat-pass TSX images, provided by the German Aerospace Centre, were used. The pixel spacing in the range and azimuth directions were 0.91 m and 0.85 m, respectively. The parameters of the TSX images used in this work are shown in
Table 1. Compared with the images of the advanced land observing satellite 1 (ALOS-1) and Envisat, the advantages of TSX data are higher spatial and temporal resolutions, so TSX data are suitable for monitoring mining subsidence.
Table 1.
Parameters of TSX images used in this work.
Table 1.
Parameters of TSX images used in this work.
| No. | Image Date | Perpendicular Baseline/m | Time Baseline/days |
|---|
| 1 | 13 Dec 2012 | 0 | 0 |
| 2 | 24 Dec 2012 | 97.46 | 11 |
| 3 | 4 Jan 2013 | 158.08 | 22 |
| 4 | 15 Jan 2013 | 232.29 | 33 |
| 5 | 26 Jan 2013 | 169.66 | 44 |
| 6 | 6 Feb 2013 | 149.38 | 55 |
| 7 | 17 Feb 2013 | 31.49 | 66 |
| 8 | 28 Feb 2013 | 123.32 | 77 |
| 9 | 11 Mar 2013 | 201.35 | 88 |
| 10 | 22 Mar 2013 | 266.11 | 99 |
| 11 | 2 Apr 2013 | 110.97 | 110 |
The phase-stacking method used in this work was based on the two-pass D-InSAR technique. Subsidence with a small deformation gradient can be generated at a high accuracy by D-InSAR, but in some coal mines, the center of the mining subsidence basin cannot be detected by this method because it is a too fast movement. We therefore used the D-InSAR technique to calculate the unwrapped phases between the two SAR images with a high time resolution (an 11-day interval for TSX), in which only the phases with high coherence were retained. In this method, the slave image in the first differential interferogram becomes the master image in the next. For example, the images captured on 13 and 24 December 2012—the master and slave images respectively—were the first interferometric pair. In the next interferometric pair (24 December 2012 and 4 January 2013), the image acquired on 24 December 2012 became the master image. After all the unwrapped differential interferograms had been calculated (e.g. φ
1,2, φ
2,3 … φ
n-1,n), these phases were added one by one to generate time-series accumulations (e.g. φ
1,n = φ
1,2 + φ
2,3 + … + φ
n-1,n) which were finally converted into deformation values. All the images should be registered to the same coordinate, and all the unwrapped phases should be relative to the same spatial reference point (or some other stable point); this point is shown in
Figure 3 as a yellow star symbol at the north of the working face. In addition, the phase points for accumulation should be present in all the differential interferograms.
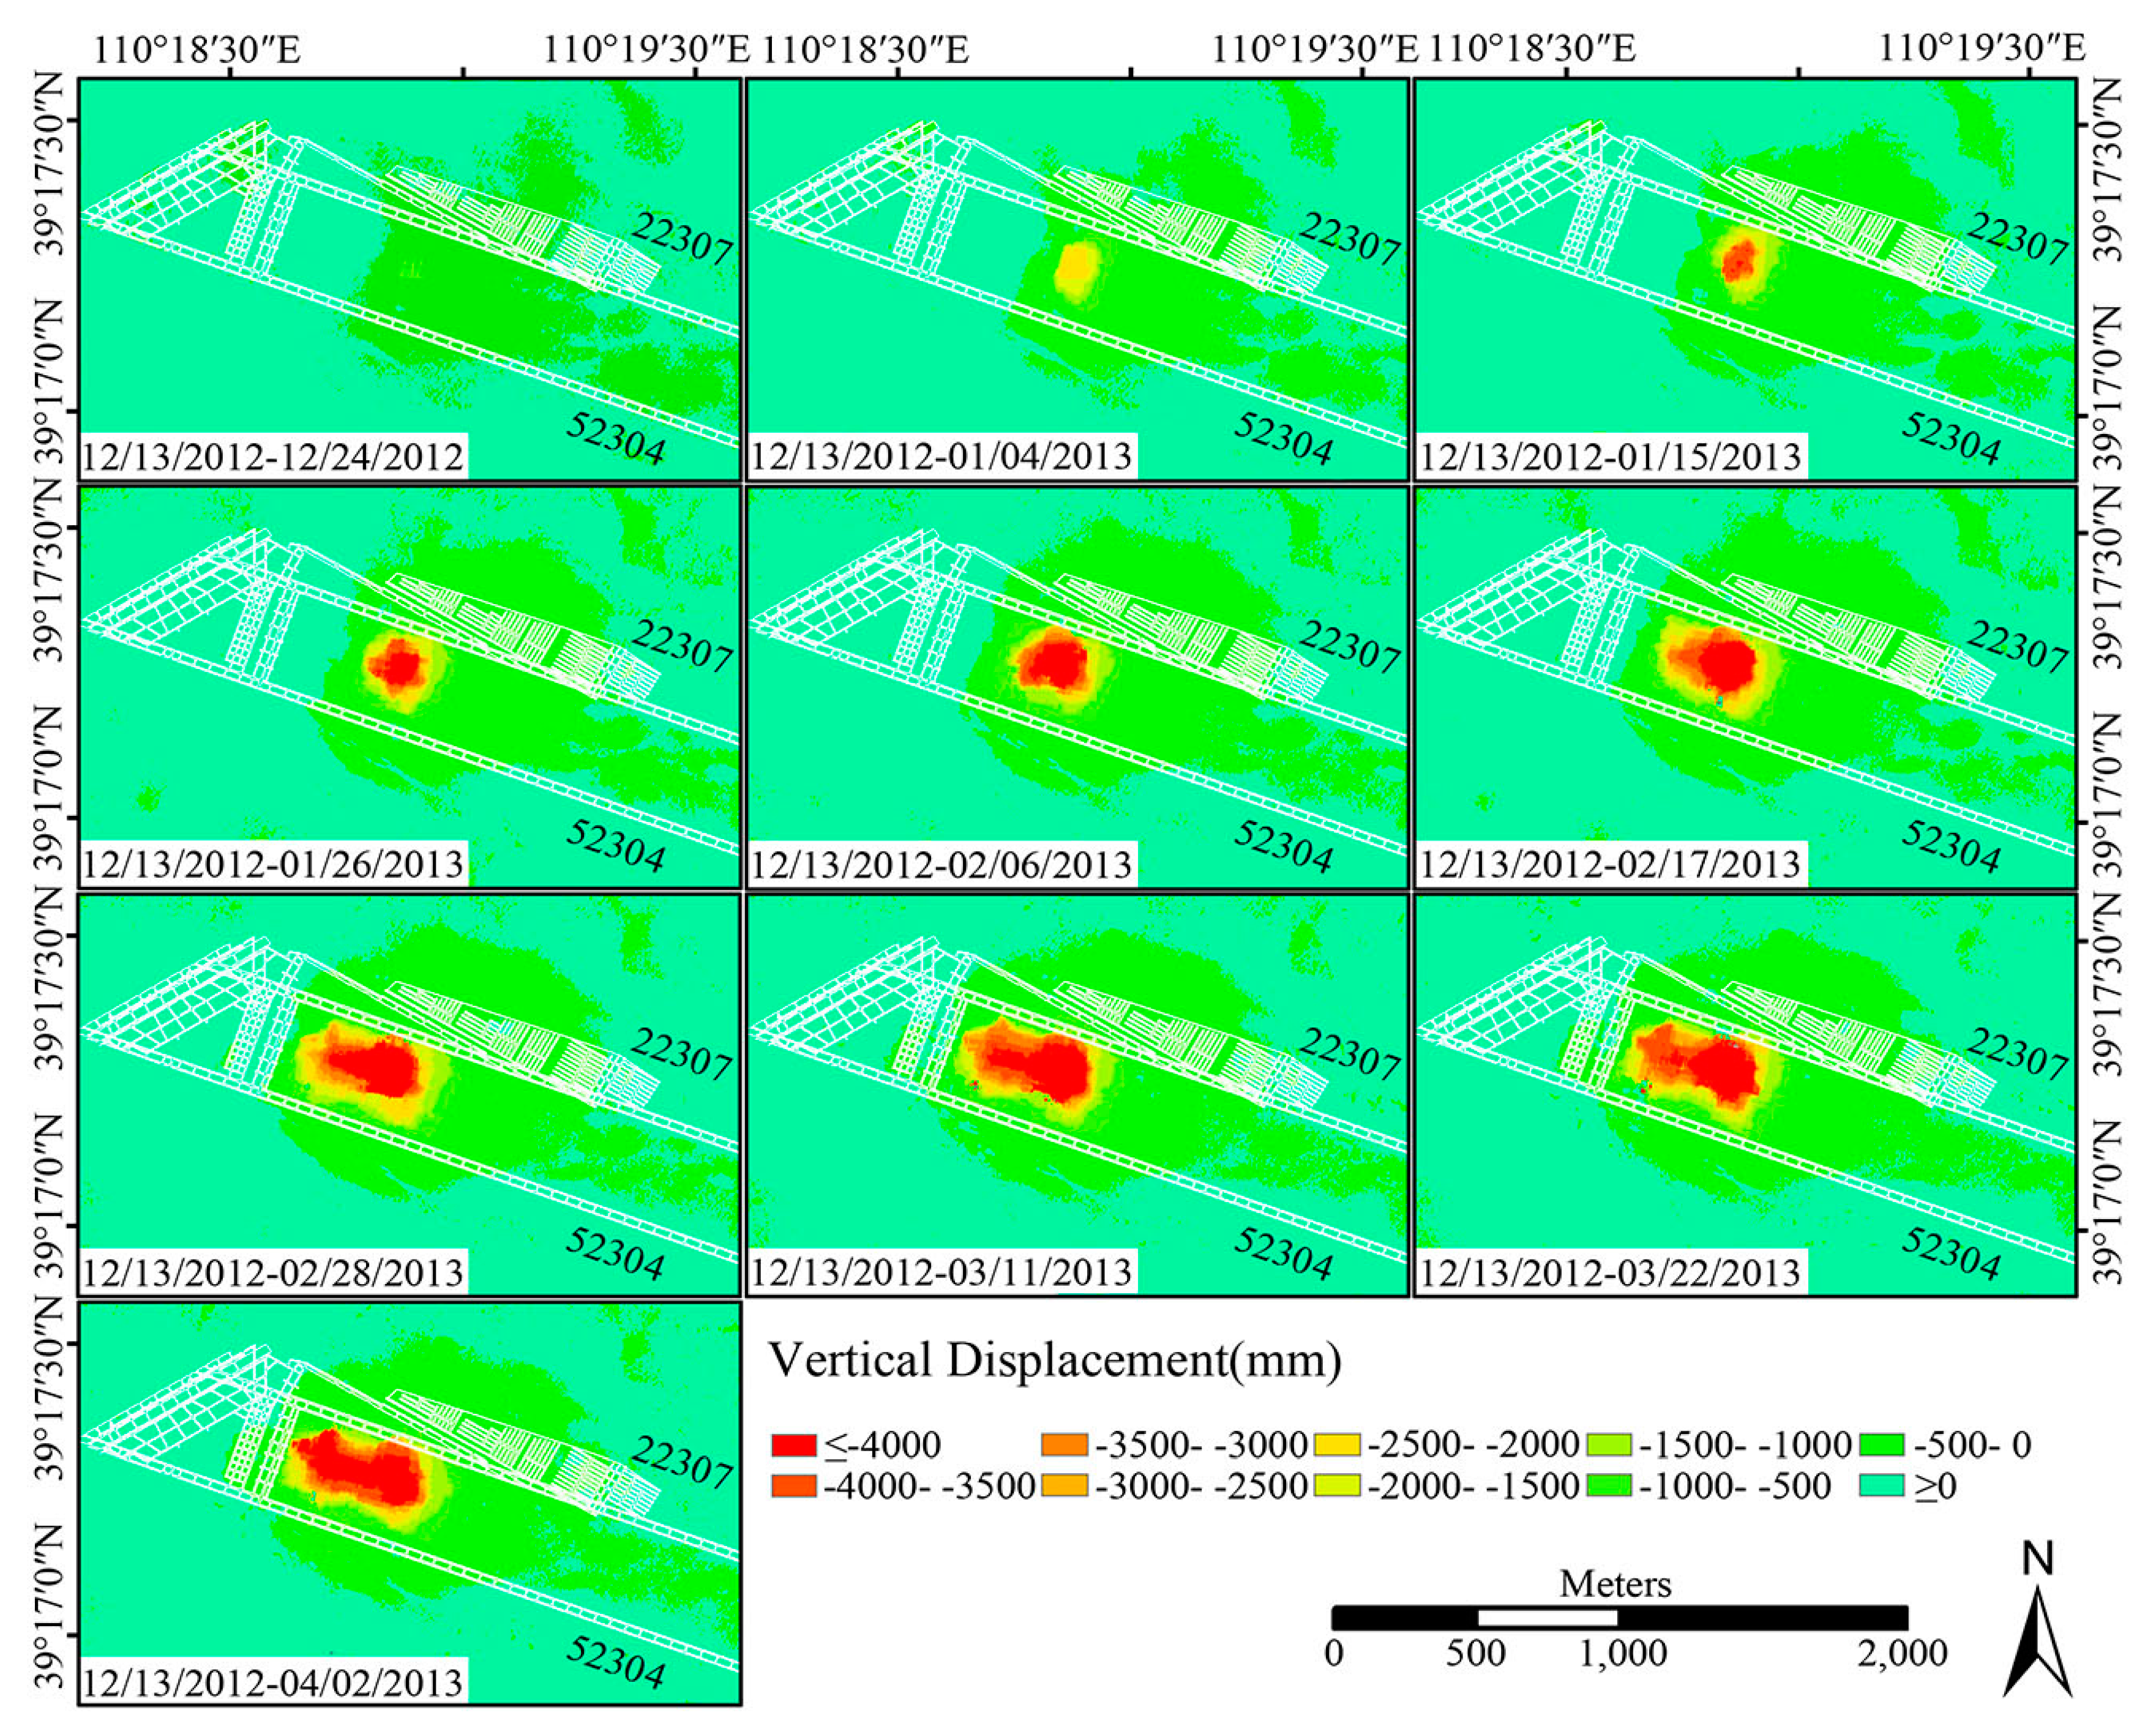
The sub-pixel offset-tracking method can be used to measure the two-dimensional deformations in both the slant range (line-of-sight of the satellite) and the azimuth (along the orbit of the satellite) directions. Although the accuracy of this method is lower than that of the D-InSAR technique, it does not require phase unwrapping and high coherence. This method can be used to overcome the limitations of D-InSAR in monitoring subsidence with a large deformation gradient. It has been successfully used to monitor the deformation due to earthquakes [
23], volcanos [
24], landslides [
25], and the movement of glaciers [
26,
27]. There are two sub-pixel offset-tracking methods. The intensity offset-tracking method is based on the cross-correlation of the image intensity, and the coherence offset-tracking method is based on fringe visibility. The former method was used in this work because it can adapt to the low coherence level between two SAR images.
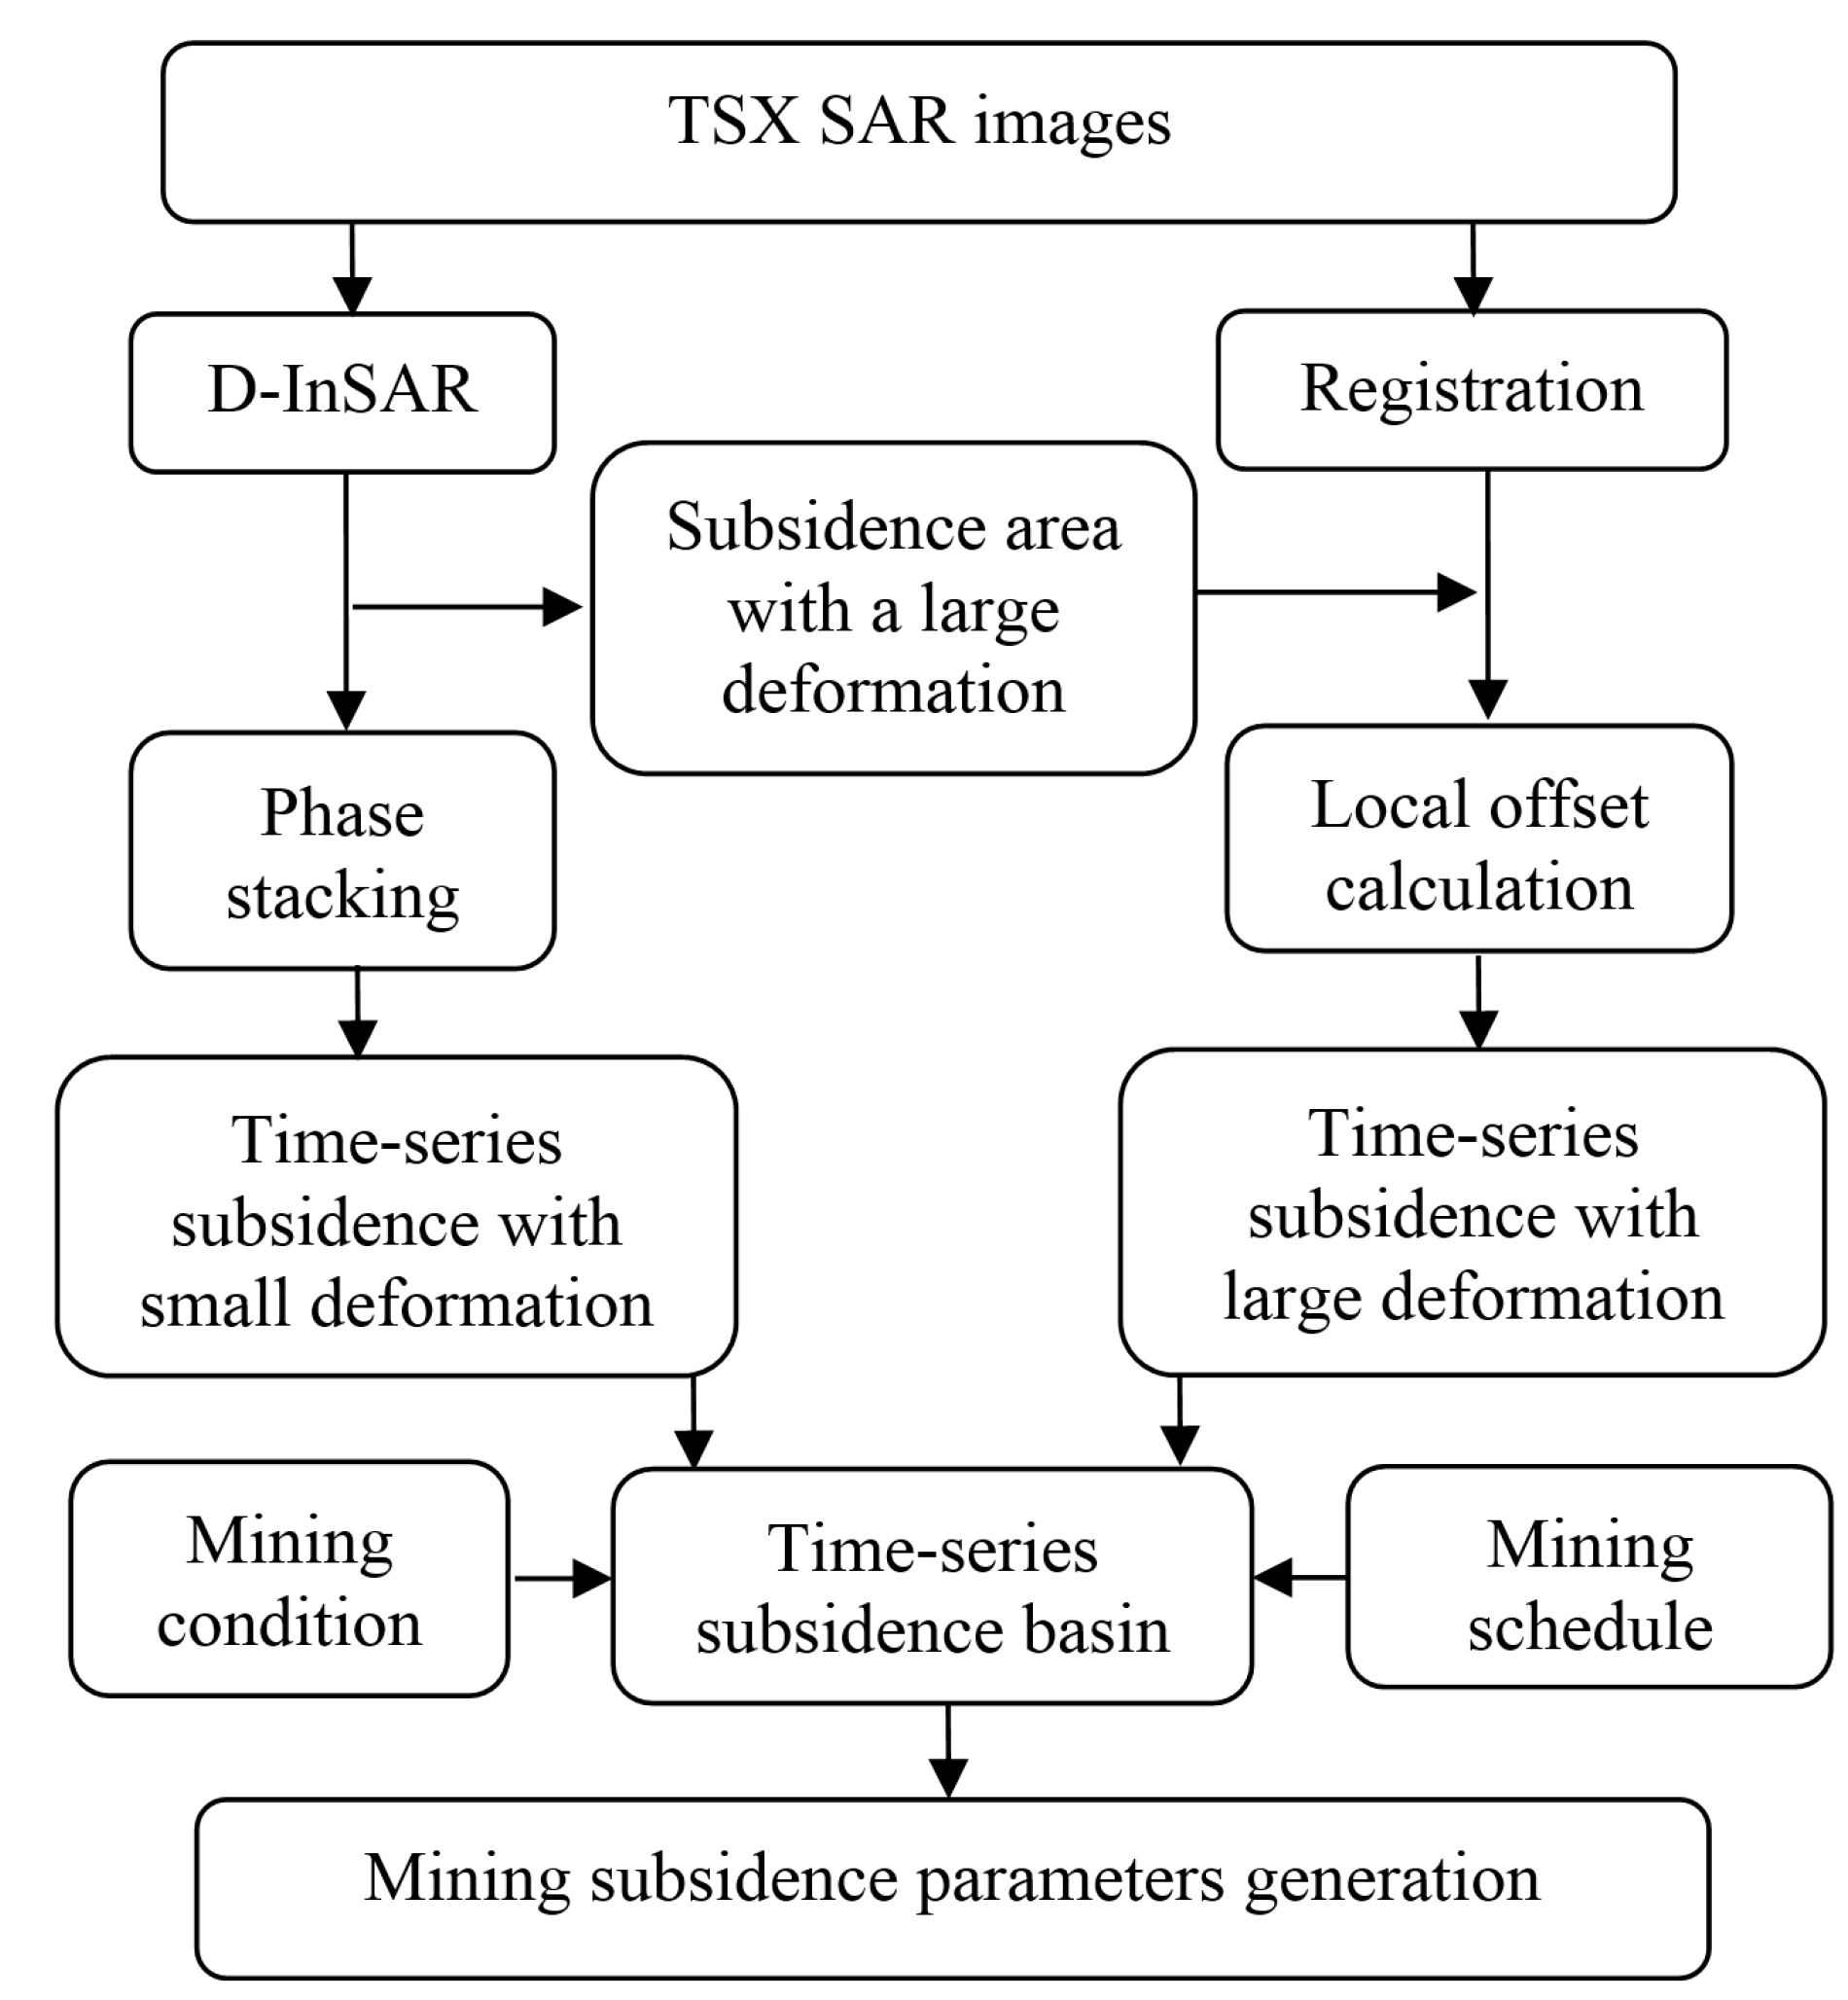
Figure 4.
Flow chart for the monitoring method.
Figure 4.
Flow chart for the monitoring method.
The key to the intensity offset-tracking method is to find the location of the peak for the two-dimensional cross-correlation function of two SAR image patches. The differences in the coordinates of the locations in the range and azimuth directions are the offsets. To increase the accuracy of the estimation, the pixels in the patches should be oversampled at the sub-pixel level; the correlation function around the peak can then be modeled by a two-dimensional interpolation regression fit. The confidence level of each offset is estimated using the signal-to-noise ratio [
28]. A threshold should be set for the signal-to-noise ratio when the SAR image pairs are registered, and only the values for the signal-to-noise ratio of the patches above the threshold should be used to calculate the offsets. Some factors influence the accuracy of these offsets, including orbit separation, topography, displacement, and ionospheric effects. To estimate the surface movement, these effects need to be separated. In the region studied in this work, there was little subsidence over most of the area and the offsets were nearly the same as those caused by the orbit. We used these offsets to calculate the orbital offsets by fitting a bilinear polynomial function [
28]. We did not consider ionospheric effects in this work for three reasons. The first is that the area is located in the transition zone between the Mu Us Desert and the Loess Plateau, where there is a lack of water resources and rain. The second is that the area is only approximately 2.2 × 2.4 km
2, and due to the spatial correlation, we think that the influence of atmospheric signal delay is nearly the same across the entire area. The third is that the subsidence caused by coal mining in this area is much larger than the influence of the atmospheric phase screen. The offsets estimated in the range and azimuth directions were then transformed into a value for the subsidence.
Both the range offsets and D-InSAR data used to calculate the deformation were in the line-of-sight (LOS) direction, so the final time series for mining subsidence was a combination of the small deformation generated using the phase-stacking method (D-InSAR) and the large deformation calculated using the sub-pixel offset-tracking method (in the range direction).
Figure 4 shows the flow chart for the monitoring method. In this method, the small and large deformations were relative to the same spatial reference point shown in
Figure 3 (yellow star symbol), and then the subsidence generated by the offset-tracking method was used to fill the area with low coherence, where the subsidence values cannot be obtained by the phase-stacking method. Finally, according to the mining condition and schedule, some mining subsidence parameters can be generated and analyzed.
5. Discussion
The deformation mechanisms of land subsidence caused by underground mining need to be studied in order to prevent and control potential disasters. Mining subsidence usually occurs over about two years, during which time there may be serious and progressive residual subsidence. However, we only obtained SAR data over a four-month period, so we can only analyze some of the parameters in the mechanisms of mining subsidence that occurred during coal exploitation.
5.1. Advance Angle of Influence
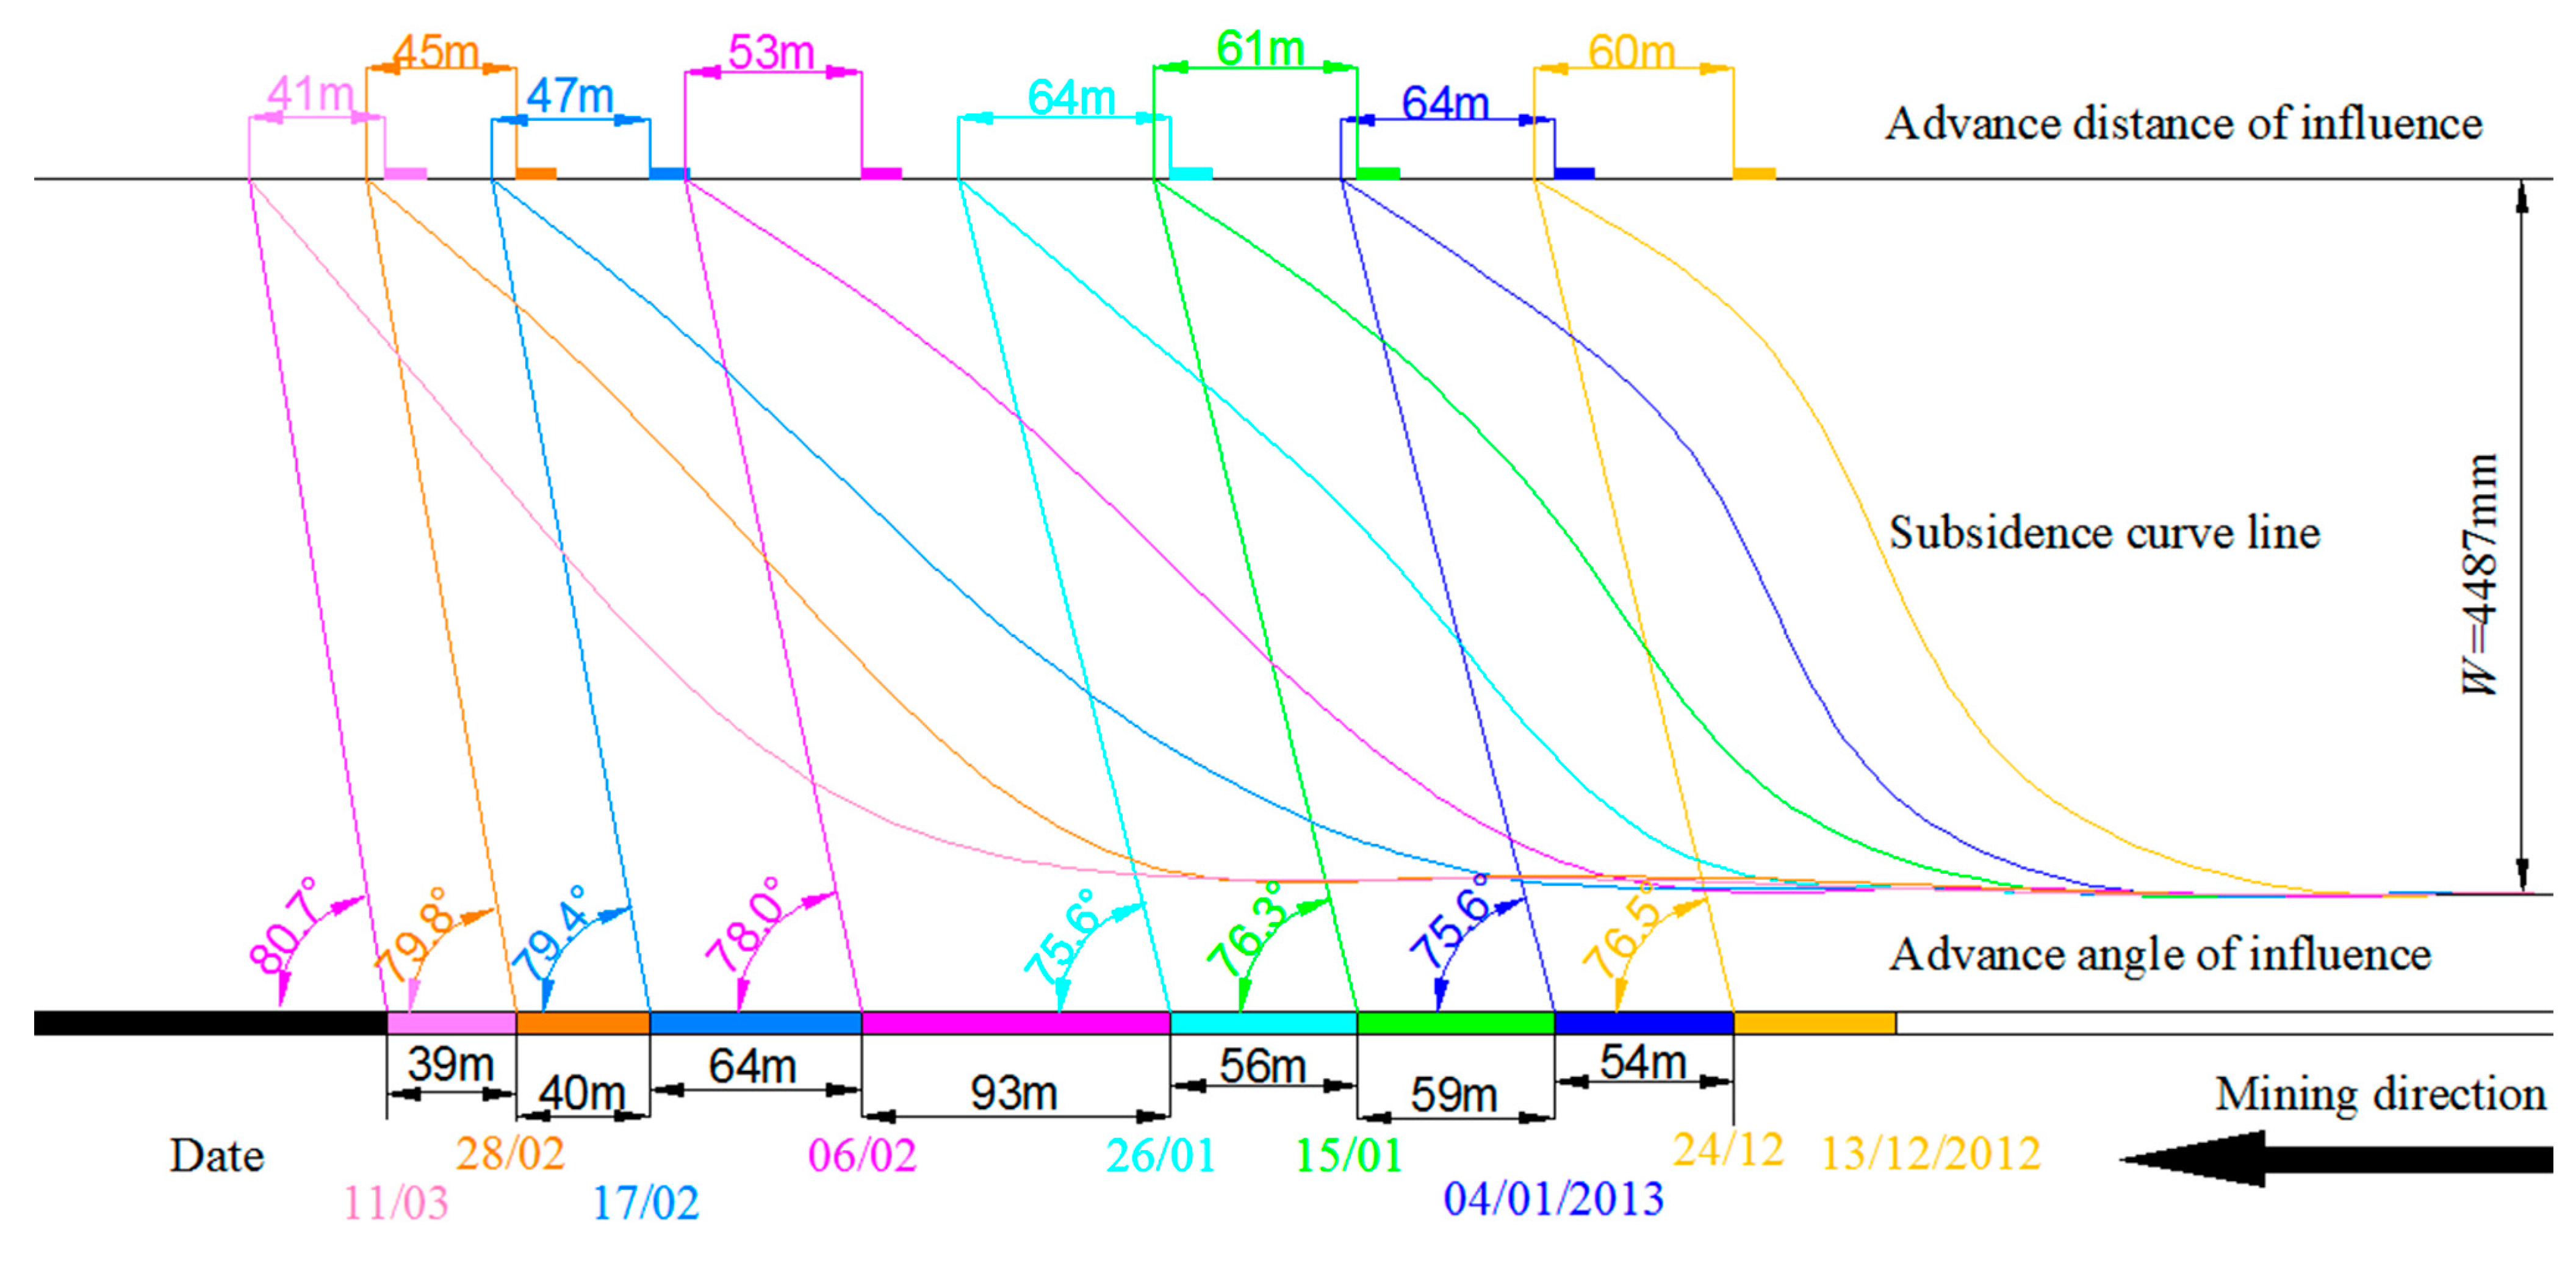
As a result of the differences in mining velocity, the advance angle of influence is variable. In this study, the angle changed from 75.6° to 80.7° between 13 December 2012 and 11 March 2013. In
Figure 10, the labels with the same color represent a group of information. Taking the blue as an example, the mining length was about 54 m from 24 December 2012 to 4 January 2013, the advance angle and distance of influence were 75.6° and 64 m, respectively, and the blue curved line was the subsidence basin. From
Figure 10, we can see that the advance angles of influence increased with mining velocity before 6 February 2013, which was compatible with experience [
2]. However, the angle increased with the reduction of mining velocity from 6 February to 11 March 2013. The reason is that the altitudes of the land surface increased from 1253.9 m to 1269.9 m, and the land deformation caused by mining subsidence moved in the downhill direction (to the east). These parameters can be used to predict the dynamic mining subsidence and to direct coal exploitation for the other working faces in this mining area. Using the InSAR technique to calculate the advance angle of influence was also introduced in reference [
4], where the angles were calculated using D-InSAR only, and the results were of a low accuracy for serious decorrelation between SAR image pairs. The improvement in this paper is that the angles were calculated by D-InSAR and offset-tracking methods, and the whole mining subsidence basin could be generated. By contrast, the accuracy is much better for high coherence between the image pairs.
Figure 10.
Advance angle and distance of influence calculated using the time-series mining subsidence. The labels with the same color represent a group of information, which includes mining date, mining length, advance angle of influence, subsidence curve, and advance distance of influence from bottom to top in this figure.
5.2. Generation of Probability Integral Predicting Parameters and Three Dimensional Deformation
In references [
1,
2,
3,
13], the probability integral method was introduced to predict mining subsidence. The subsidence of any surface point (x,y) caused by coal mining can be expressed as:
where,
q is the subsidence coefficient;
r is the main influence radius,
r =
H0 / tanβ;
H0 is the average mining depth; θ is the mining influence angle;
tanβ is the tangent of the main influence angle; (
xi,yi) are the planar coordinates of mining unit i; (
x,y) are the coordinates of any surface point; and m is the thickness of the coal seam.
In mining subsidence prediction theory, the parameters of the probability integral method are
q,
tanβ, θ, and
b. Here,
b was the parameter of horizontal movement, and it was usually assumed to be 0.3 using past experience to calculate the relationship between mining subsidence and land horizontal movement [
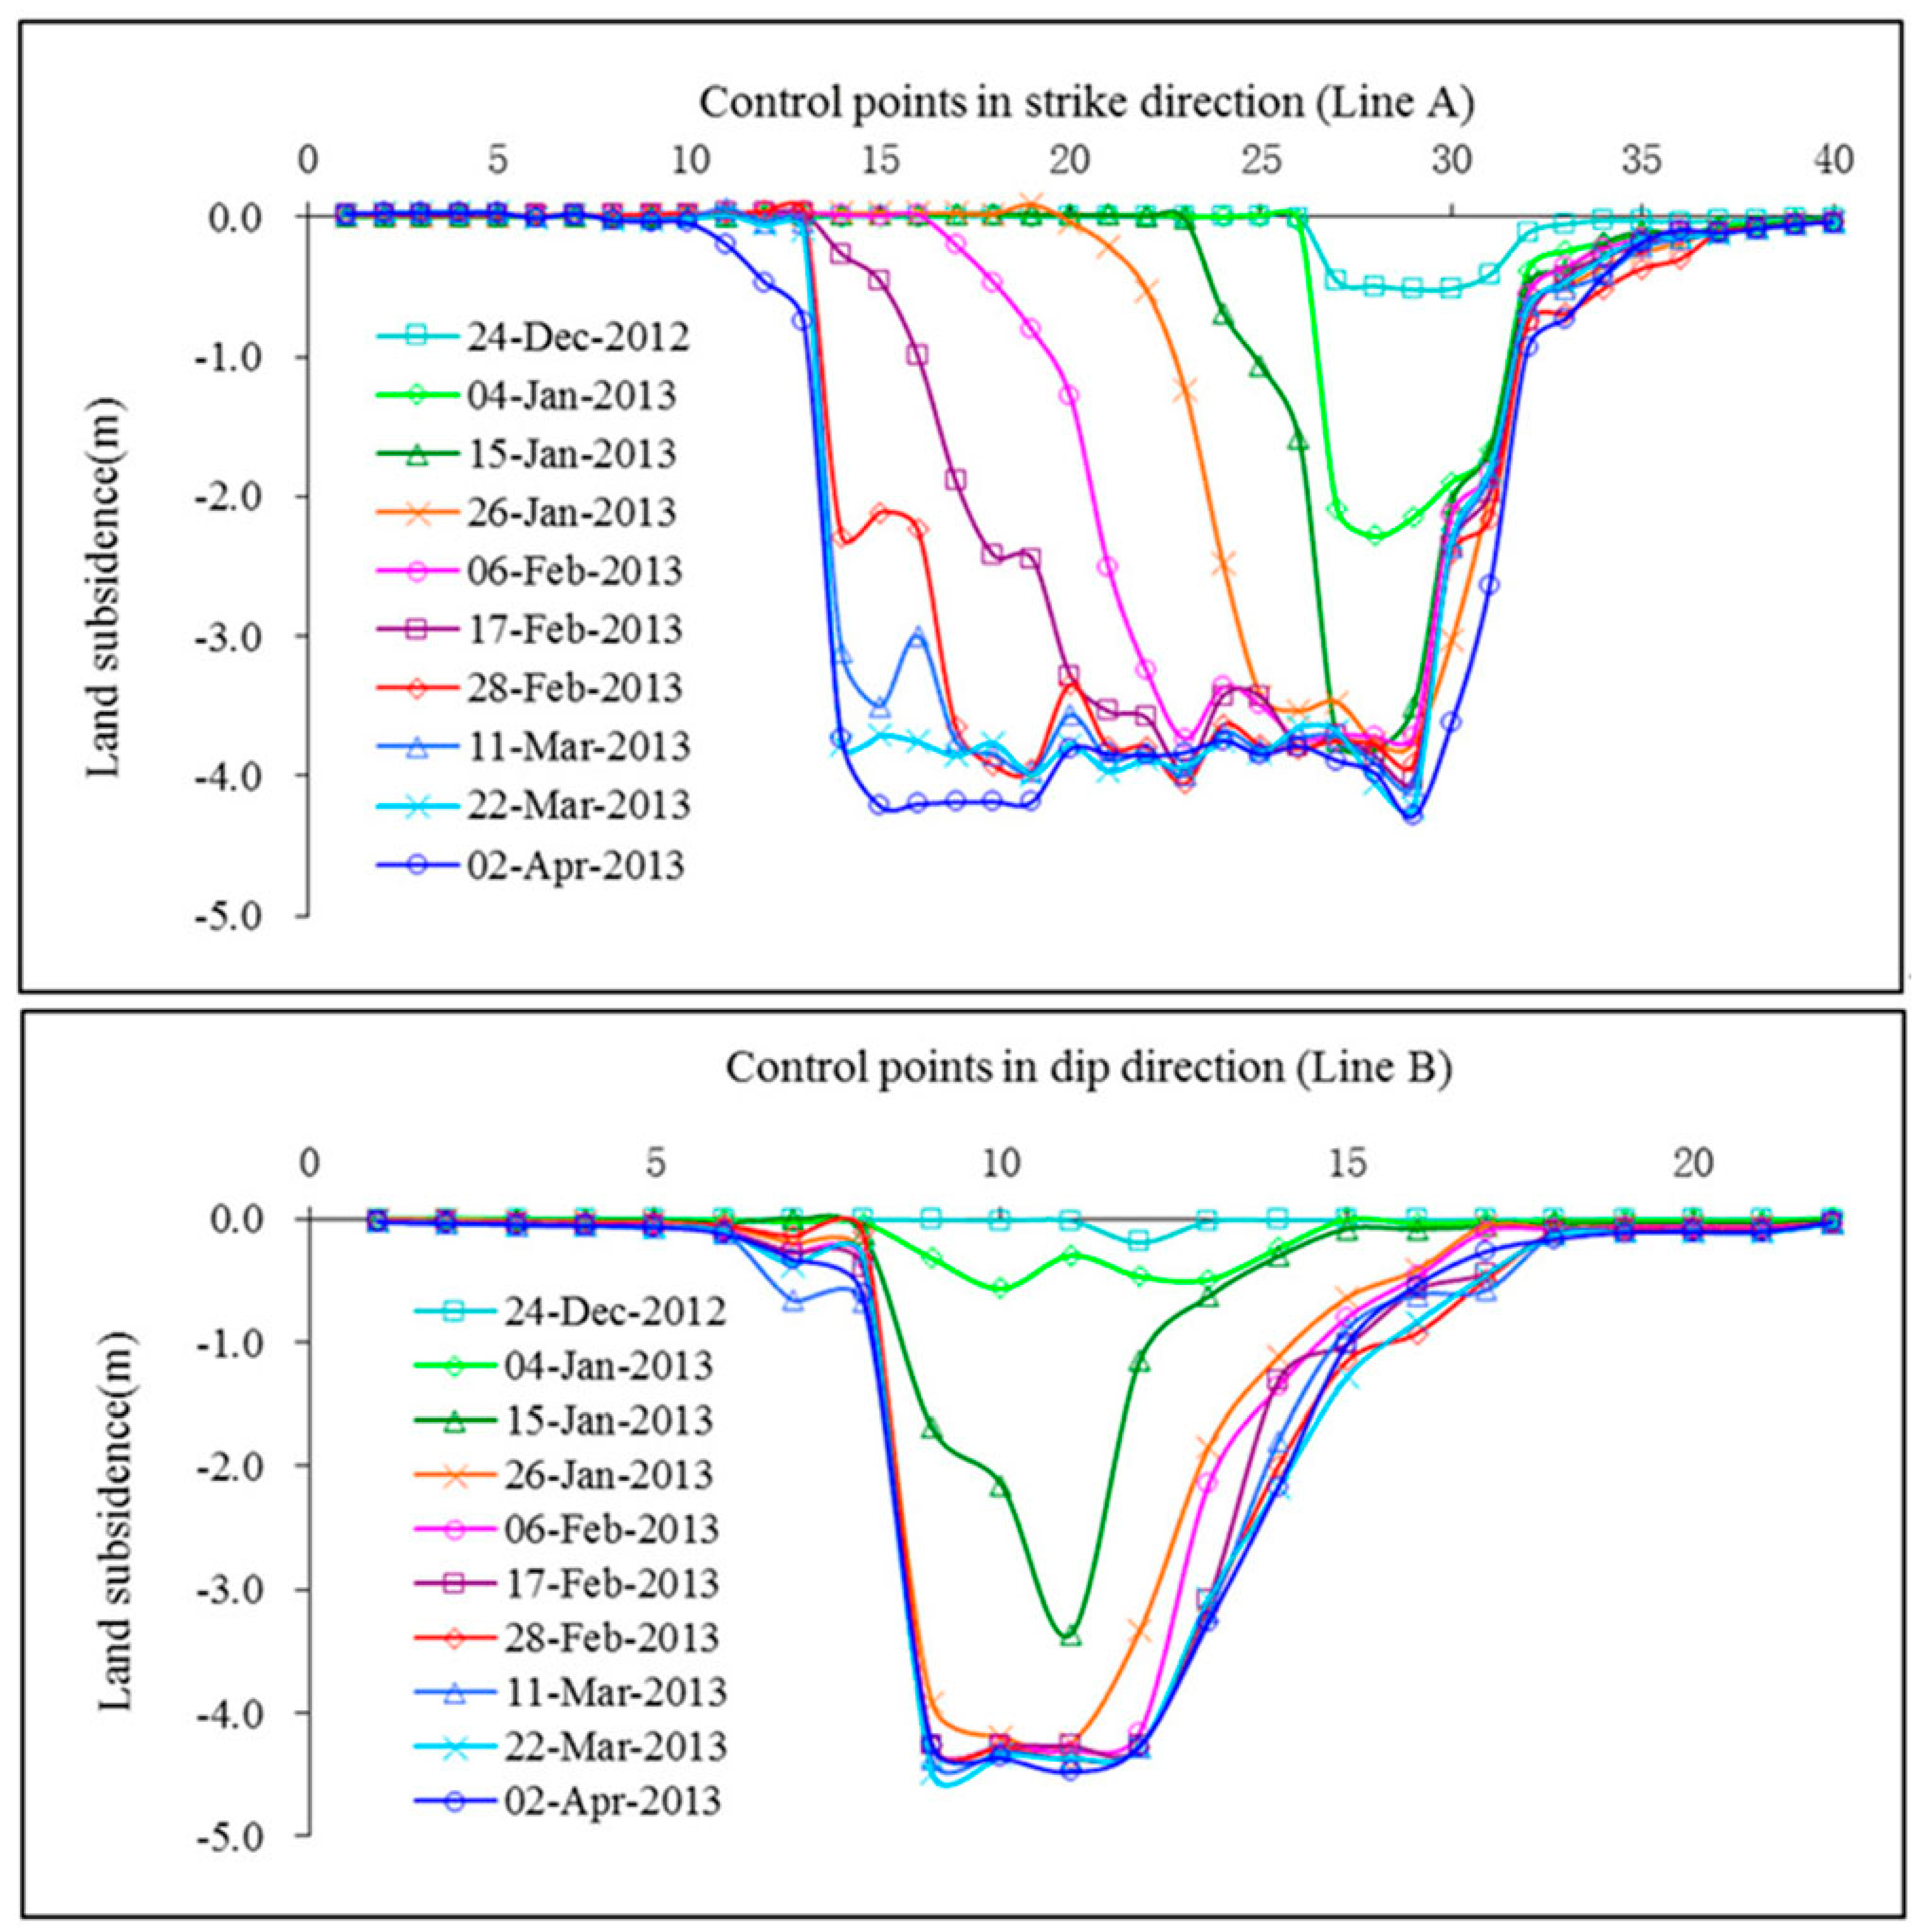
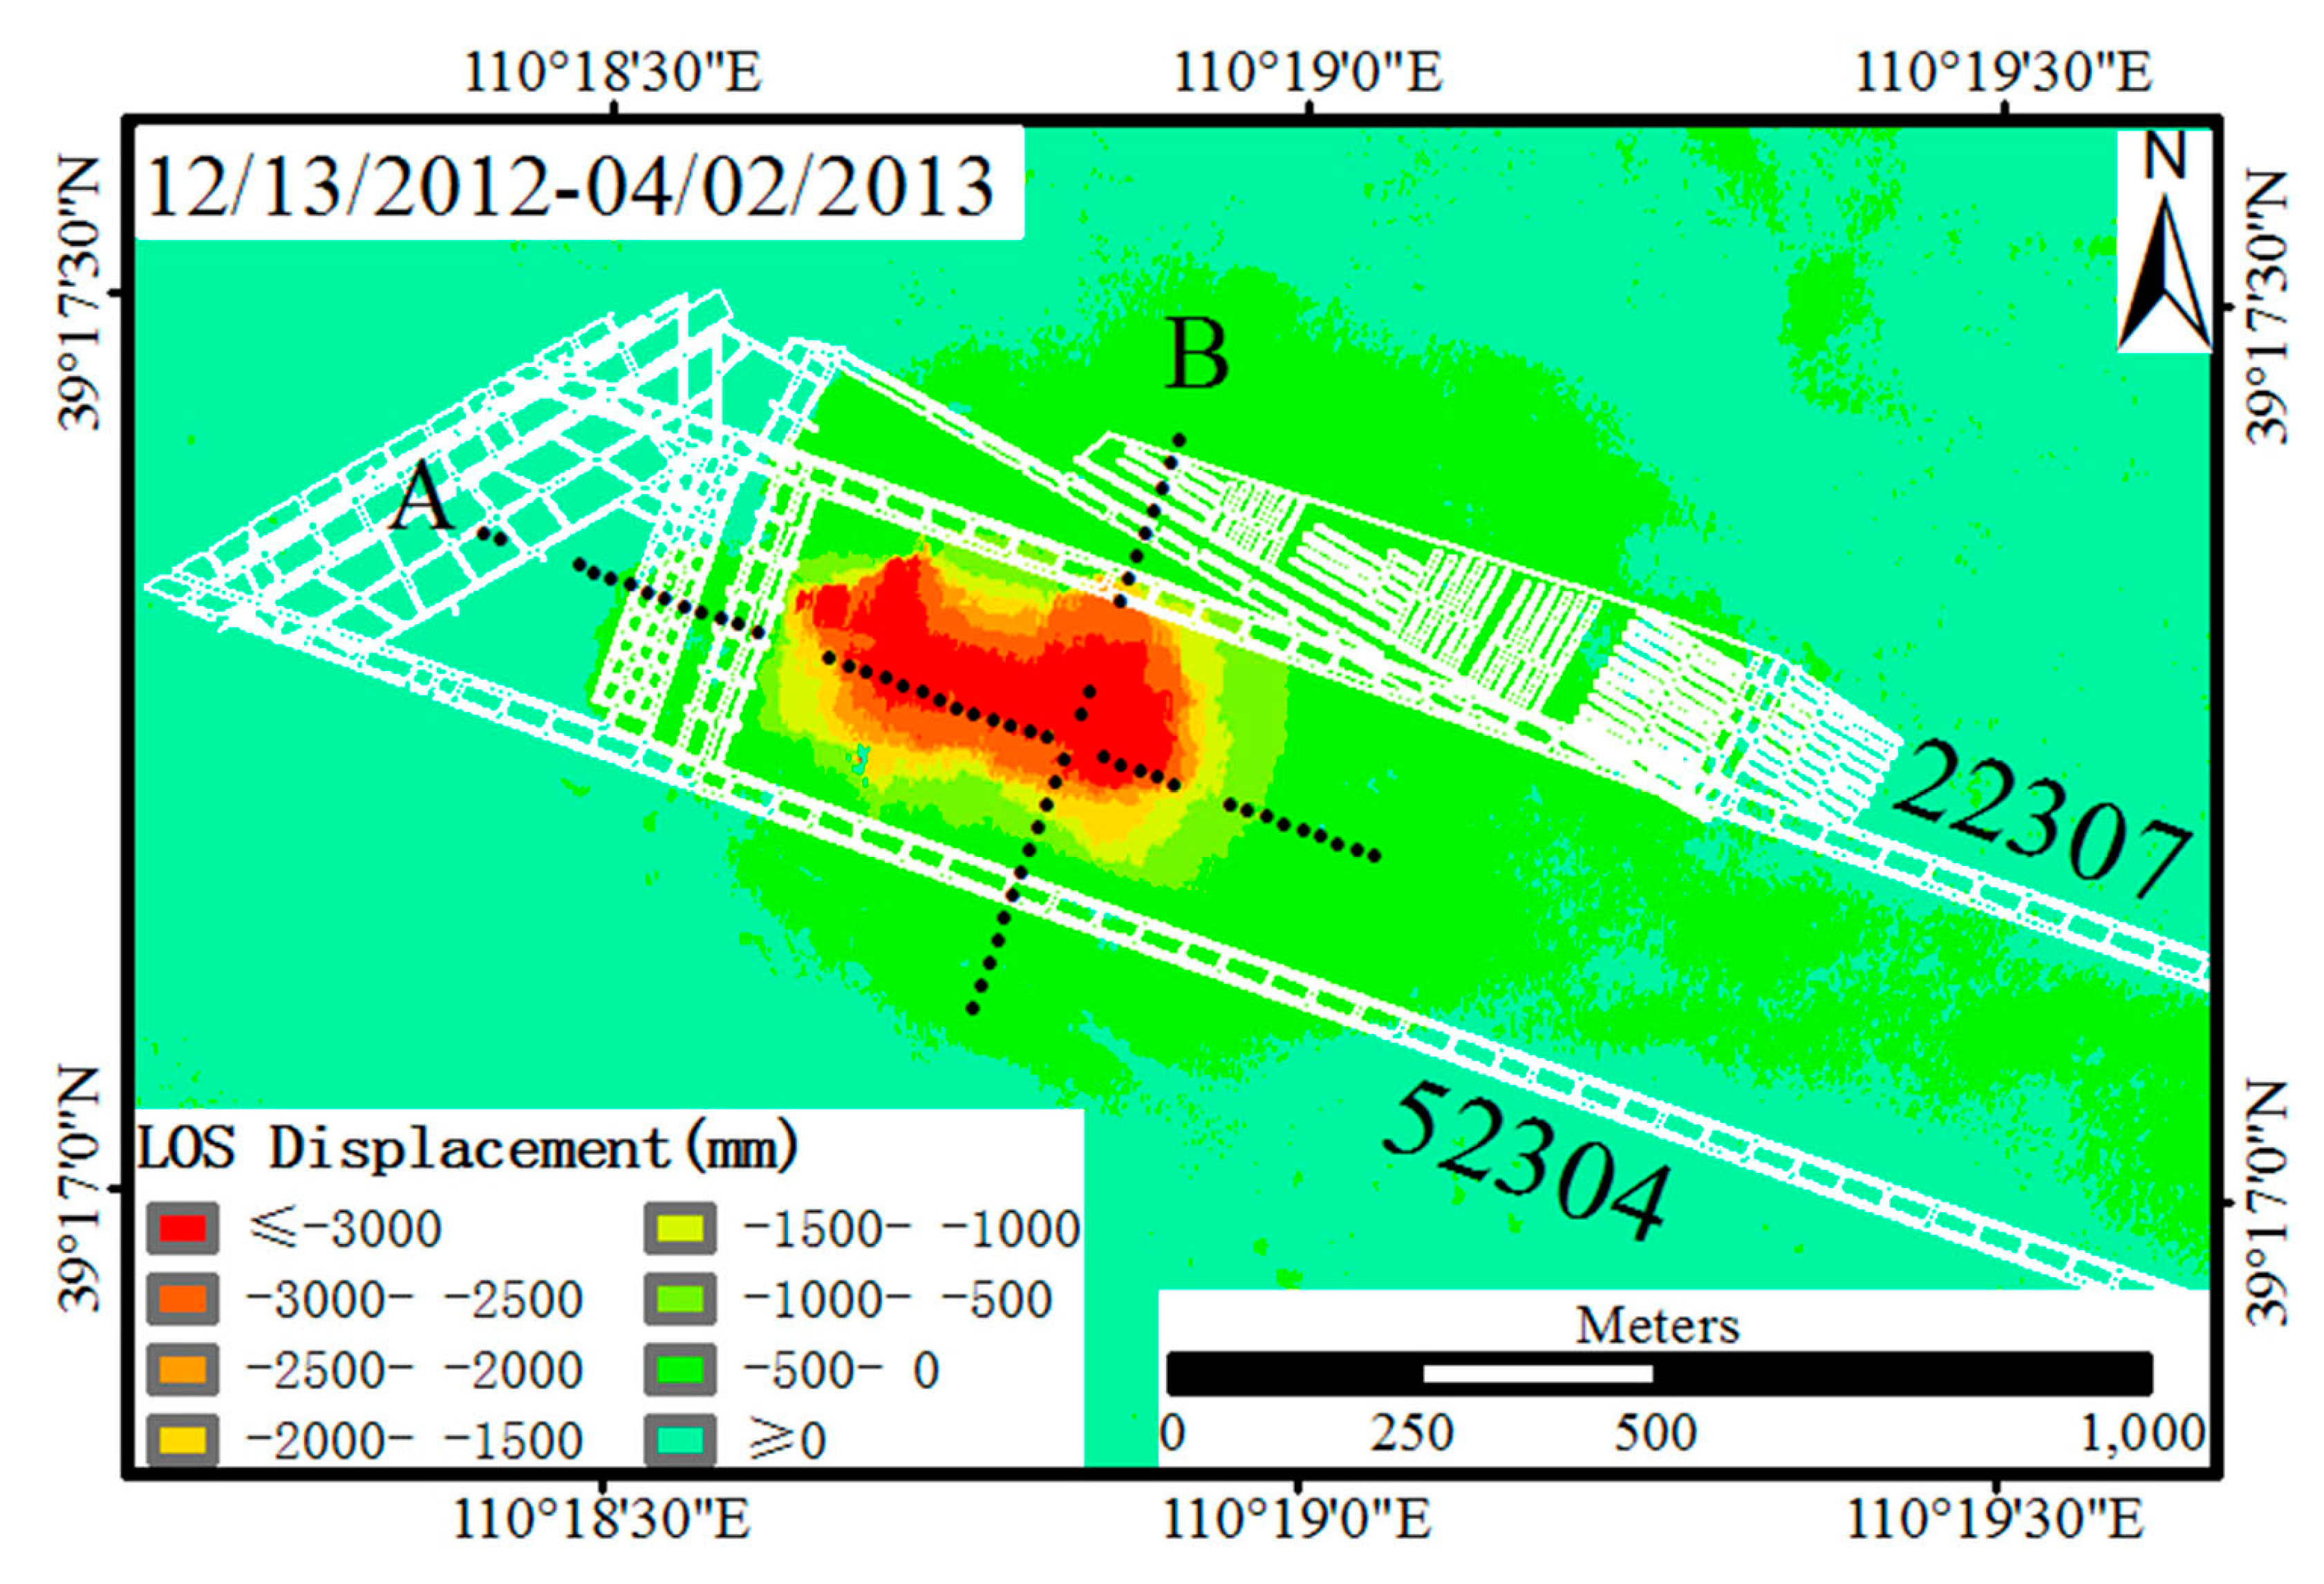
13]. These parameters can be calculated using the subsidence values of some observations and mining conditions by formula (1). In this paper, we used the results of the phase-stacking and offset-tracking methods along Lines A and B to calculate these parameters, and the results were
q = 0.65,
tanβ = 2.2, b = 0.3 and θ = 87°. The parameters are very important for this mine, as they can be used to predict land deformation caused by coal exploitation, especially for the working coalfaces that will be exploited in the future, in order to predict potential disasters. Considering the subsidence above the abandoned goaf generated by the phase-stacking method,
q in this area was set as 0.05, and the other parameters were not changed.
Compared with the method and results of references [
1,
13], one improvement of this paper is that the subsidence with a large deformation gradient was calculated using the offset-tracking method, and the whole of the mining subsidence basin could be generated; the other improvement is that the land horizontal movements in two directions were calculated using the prediction parameters that were generated by SAR images only.
Using these parameters, the three-dimensional deformation between 13 December 2012 and 11 March 2013 was generated, as shown in
Figure 11. In the east direction, the maxima of the horizontal movement were near the start and end mining lines, and the values were about 1.1 m and 1.3 m respectively. The minima of the horizontal movement were located in the center of mining subsidence basin, and the residual deformations above the abandoned goaf were less than 50 mm. In the north direction, the maxima of the horizontal movement were about 1.3 m, which were located near the coal walls. The minima of the land horizontal movement were also located in the center of the mining subsidence basin. The residual deformations above the abandoned goaf were larger than 100 mm, which were located near the southern coal wall.
Compared with the final picture of
Figure 6, the values and distribution of the mining subsidence are nearly the same. From
Figure 11, we can see that the subsidence curves and color are smoother than the results calculated by SAR data, the maximum of the mining subsidence was about 4.4 m, and the residual subsidence above the abandoned goaf was less than 0.5 m. To obtain the three-dimensional deformation, we constructed an overlap of the vector map of the horizontal movement and mining subsidence. The lengths of the arrows represented the values of the horizontal movement, and the heads of arrows were the positions of the movement points. In the large land deformation area, all the arrows were directed toward the center of the mining subsidence basin, and the maximum was about 1.3 m. We can also see that there was nearly no horizontal movement in the area with subsidence larger than 4 m; this indicated that the center of the mining subsidence basin was nearly stable.
Figure 11.
Three-dimensional (3D) deformation (13 December 2012 to 11 March 2013).
Figure 11.
Three-dimensional (3D) deformation (13 December 2012 to 11 March 2013).
In the area of the abandoned goaf, the horizontal movements were less than 0.15 m, and all the arrows were directed toward the center of the working face. Compared with traditional measurement, this is the only method to generate historical land deformation using the InSAR technique without any field observation points, and it can supply the basis data to study the deformation and stability of the abandoned goaf. Although the abandoned goaf (especially in the pillar and room mining method) had reached its stress balance and there was almost no residual surface movement, if a new adjacent working coalface was exploited, then the area of land subsidence would increase. Hence, if buildings or roads are built on the abandoned goaf, it is important to estimate and treat the stability of the foundations. The range of influence of the adjacent mining panels on the deformation should be predicted before constructions commence.
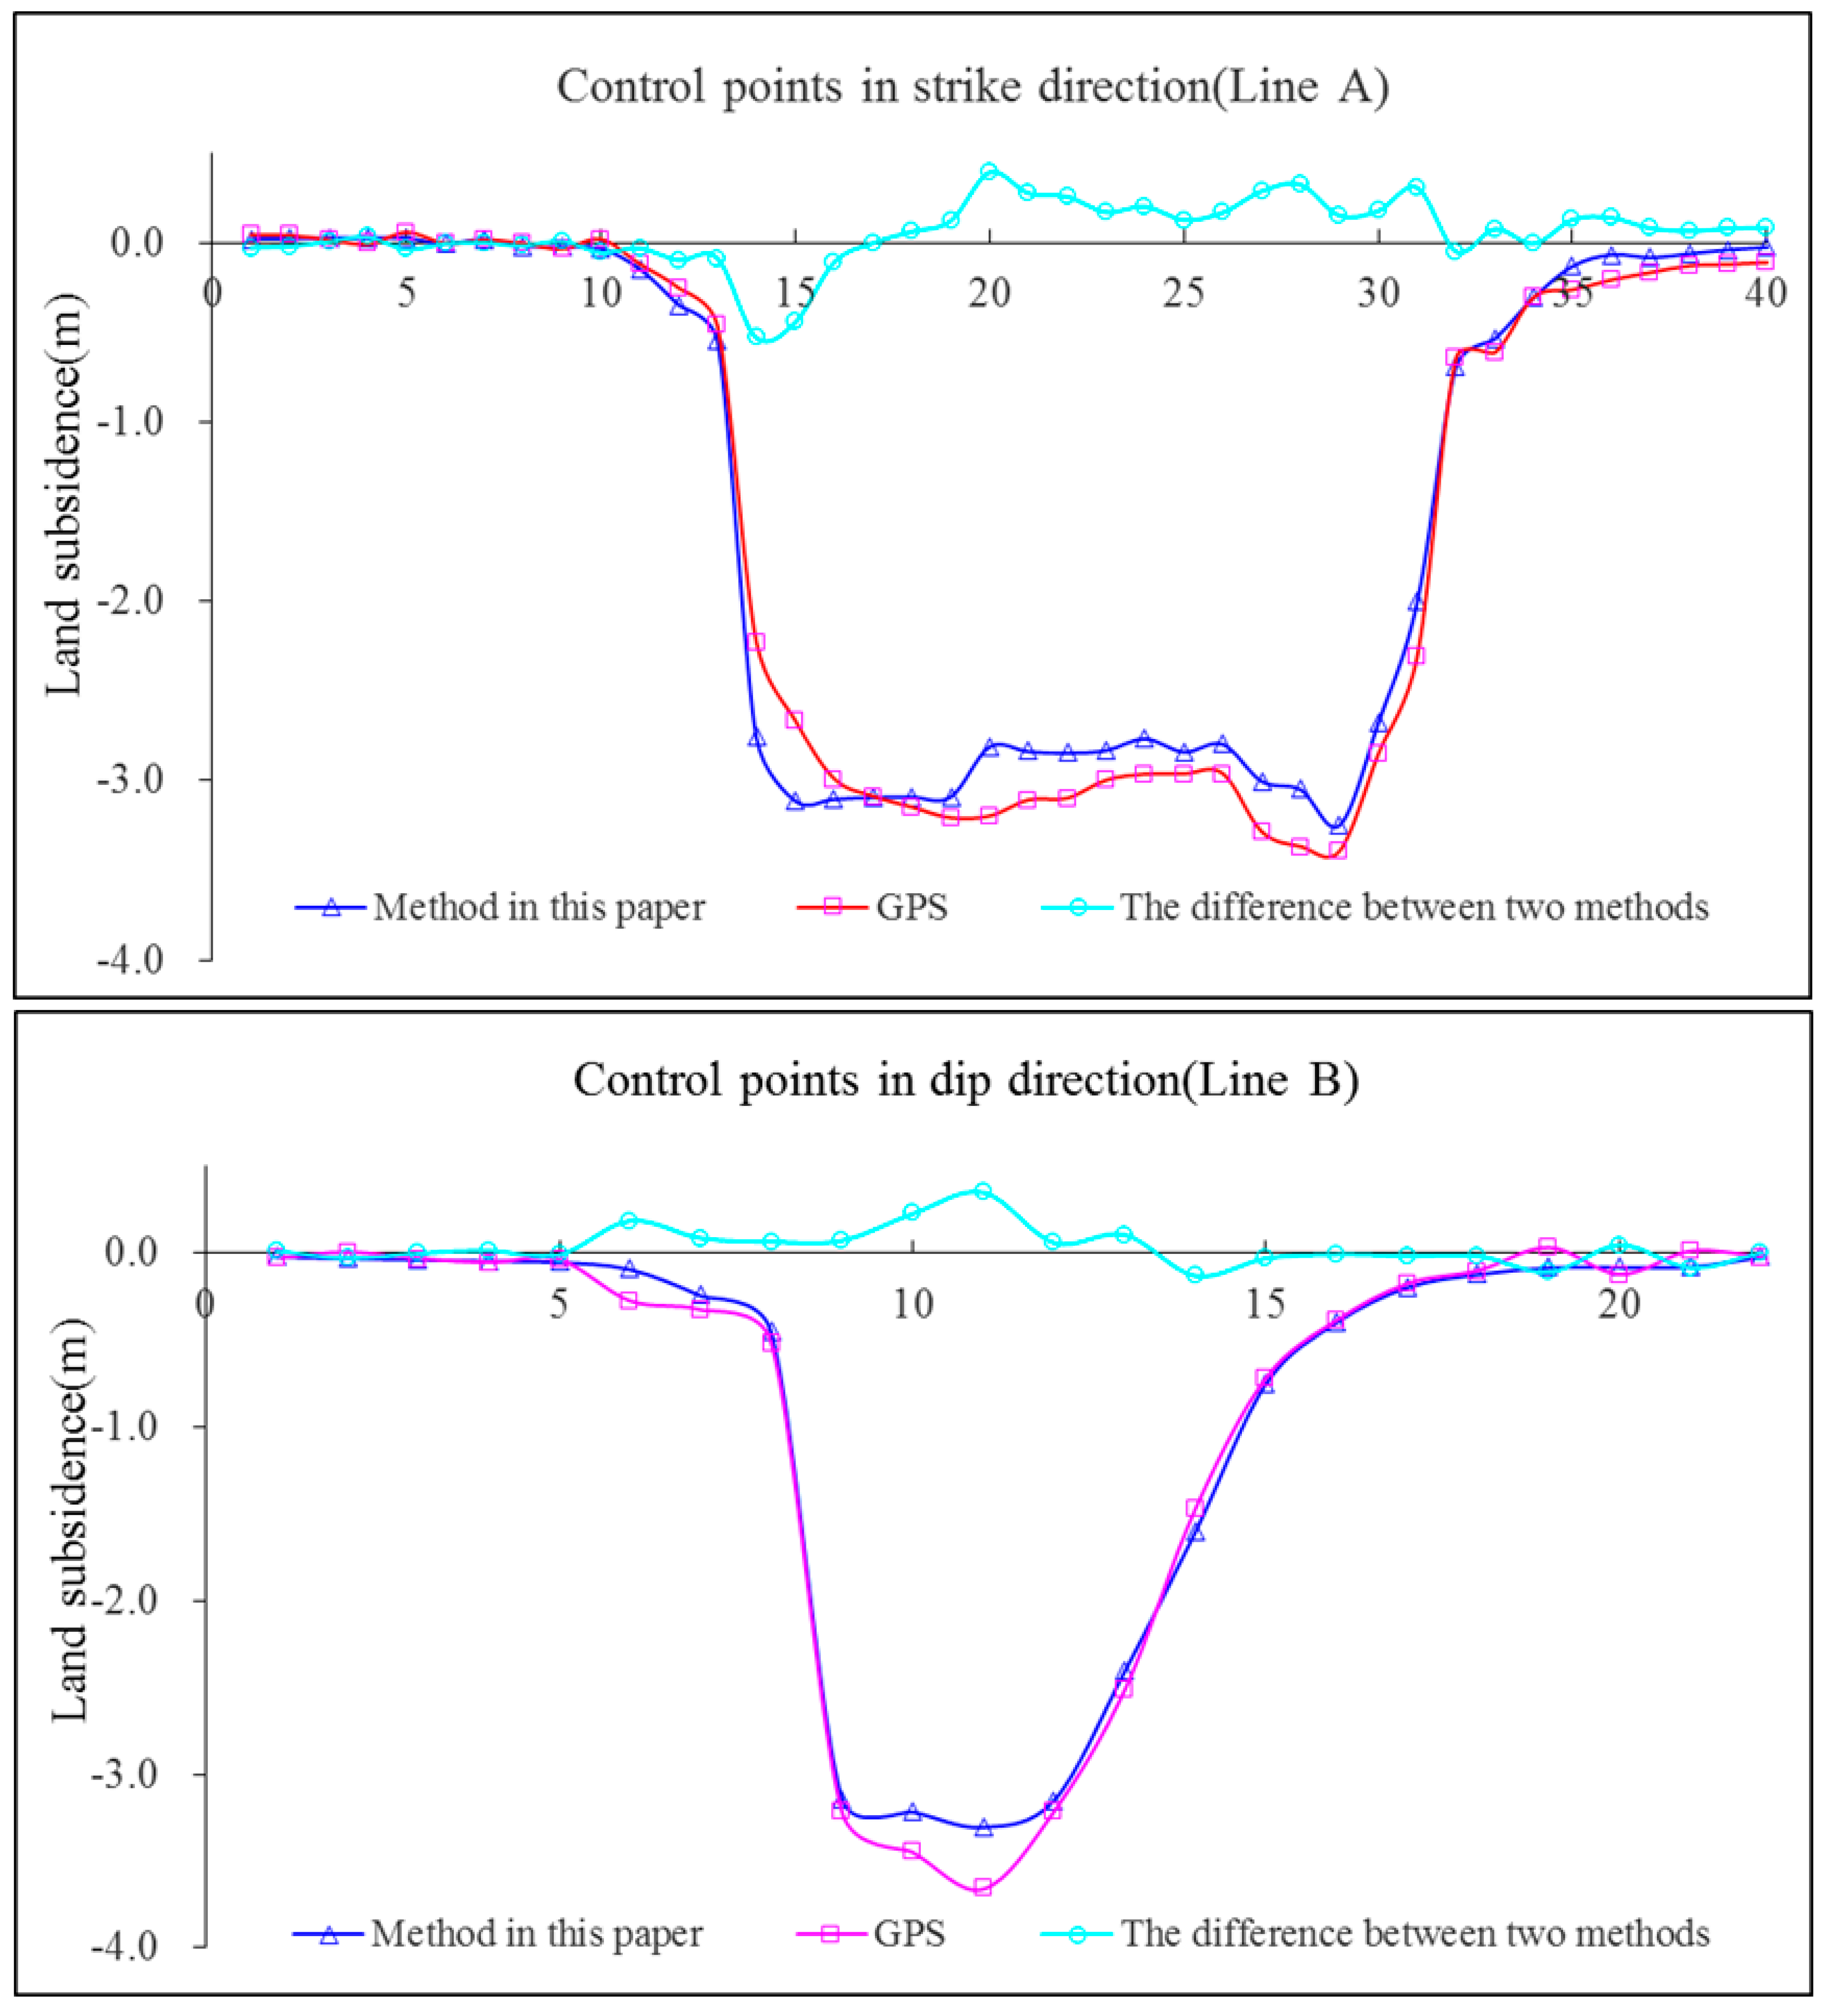
To verify the results, the GPS observations and the correspondent predicting deformations were transformed into the LOS direction; the RMSEs of Lines A and B were about 0.21 m and 0.17 m, respectively. Although these errors are larger than expected, these results may be acceptable in estimating some disasters caused by coal exploitation in this area.
6. Conclusions
In this paper, a new approach, combining the phase-stacking and sub-pixel offset-tracking methods for detecting and monitoring long-term and large land deformation caused by coal exploitation, has been presented. Time-series deformations in the vertical direction of the Yulin coal mining area in China were generated during the period 13 December 2012 to 2 April 2013 by 11 TerraSAR-X satellite images. Within this four-month period, the combined approach detected 4.478 m of displacement (equivalent to 40 mm/day), which has gone far beyond the capabilities of measuring deformations using the differential interferometric synthetic aperture radar methods. The results were compared with global positioning system data, and the root mean square errors of the results of two profile lines in the strike and dip directions were 0.16 m and 0.11 m, respectively. This approach has proven to be effective to detect the extent and magnitude of mining subsidence with a large deformation gradient.
According to the time-series deformation, the paper obtains two important results for verifying the mining subsidence mechanisms. In this coal mine, the results show that the advance angle of influence changed from 75.6° to 80.7° and the prediction parameters of mining subsidence were q = 0.65, tanβ = 2.2, b = 0.3 and θ = 87°. These can be used to predict the process of dynamic mining subsidence in this area, and can also be used to predict the occurrence of mining accidents and to help in the restoration of the ecological environment after mining activities have ended.
In addition, based on the synthetic aperture radar data and the probability integral model, this study calculates the land’s three-dimensional deformation. The results show that the maxima of horizontal movements in the east and north directions were both about 1.3 m. This method can resolve the problem that it is difficult to use differential interferometric synthetic aperture radar technique to generate horizontal deformations in the mining area due to the lack of synthetic aperture radar acquisitions with different viewing angles and orbit headings at the same time.


