1. Introduction
Okmok is located at the northeastern end of Umnak Island, in the central Aleutian arc, and is one of the most active volcanoes in Alaska [
1,
2] (
Figure 1). Catastrophic pyroclastic eruptions that have 14C radiocarbon ages of about 12,000 and 2050 years formed two overlapping calderas [
2,
3,
4,
5,
6] and numerous subsequent eruptions from vents spread across the caldera floor have produced a number of cones, lava flows, craters, and other features [
1,
7] (
Figure 1). The younger caldera is well preserved about 10 km in diameter, and 500–800 m in depth [
1,
2,
3,
4,
5,
6].
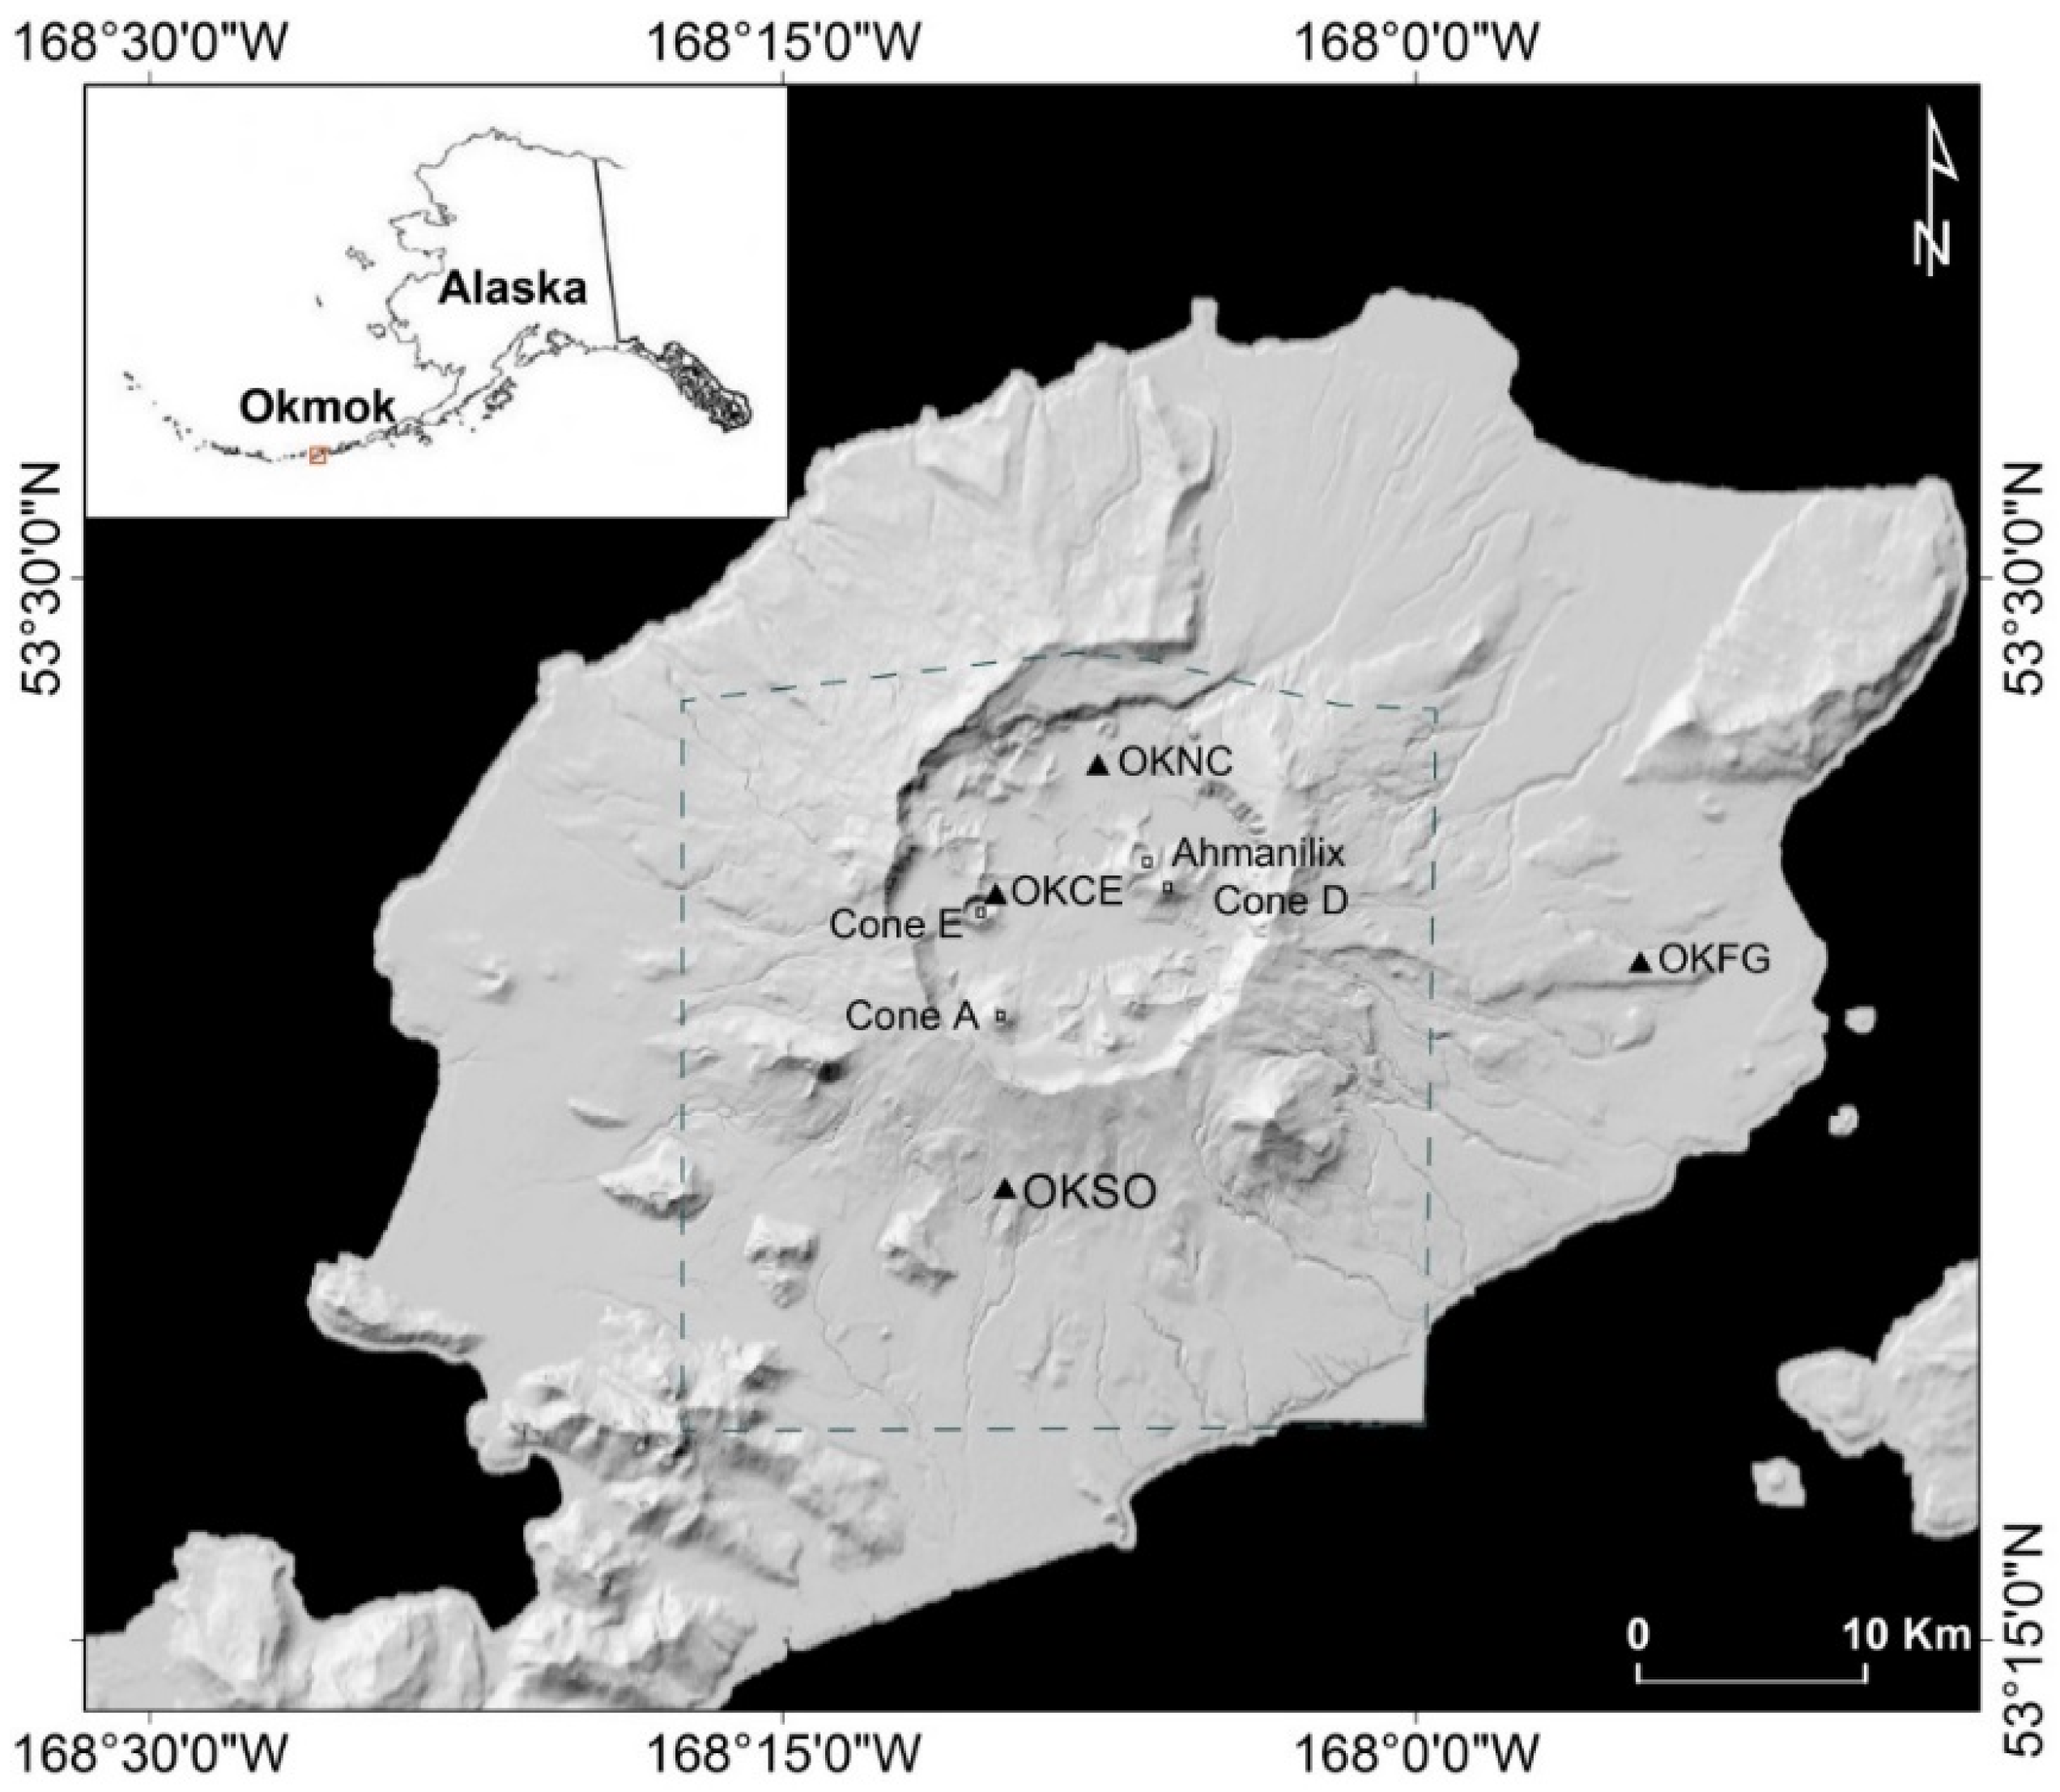
Figure 1.
Shaded relief image of Okmok volcano, with some of the intra-caldera cones labelled. Cone A was the vent for historical eruptions prior to 2008, while Ahmanilix is the new cone formed during the 2008 eruption. OKSO, OKFG, OKNC, and OKCE are continuous GPS stations. The dashed blue frame shows the area of the DEM created from 21 January 2010 with Worldview imagery [
8], while the remaining area topography is from the 1-arc-second (~30 m) SRTM DEM. Inset shows the location of Okmok in the central Aleutian volcanic arc.
The historical eruptions of Okmok are poorly documented due to its remote location and the small population of Umnak Island. Minor ash eruptions have been reported eight times since the 1930s, and blocky basalt flows were extruded along with ash emissions during eruptions in 1945, 1958, and 1997; a larger, explosive eruption occurred in 2008 [
1,
7]. From the 1930s to 1997, all eruptions at Okmok occurred from Cone A, which is located on the southwestern edge of the caldera (
Figure 1) [
9]. In 2008, however, the eruption occurred from a new vent, positioned near Cone D towards the center of the caldera and about 5 km northeast of Cone A (
Figure 1) [
1,
7,
10,
11]. The 1997 and 2008 eruptions are extremely well-documented thanks, in part, to the advent of space-based observations—especially the Synthetic Aperture Radar (SAR) interferometry (InSAR) technique. The 1997 eruption, which began in early February 1997 and ended in late April 1997, was preceded by several years of inflationary deformation amounting to tens of centimeters, accompanied by over a meter of subsidence, and followed by tens of cm of re-inflation [
1,
6,
12,
13,
14,
15]. Based on these InSAR-derived displacement patterns, Lu
et al. [
16] modeled the deformation as due to a point source or spherical magma reservoir located beneath the center of the caldera at a depth of 2.6–3.2 km below sea level [
17]. The latest eruption at Okmok, during July–August 2008, was by far the largest and most explosive since at least the early 19th century. The eruption was strongly hydrovolcanic in nature and produced a new tuff cone (named “Ahmanilix”) roughly 240 m high, dramatically altering the caldera landscape. Deformation patterns inferred from InSAR and GPS suggest that a magma reservoir, probably an interconnected network of magma bodies of varying sizes located beneath the caldera and centered ~3 km below sea level (BSL), was responsible for volcano-wide inflation before and after, and subsidence during, the 2008 eruption—similar to results associated with the 1997 eruption [
1,
11,
18,
19,
20].
InSAR is a frequently-used tool in monitoring volcano activities, providing ground deformation measurements over broad regions with excellent spatial resolution e.g., [
1,
21,
22]. Various multi-temporal InSAR (MTI) analysis methods, such as Persistent Scatterers InSAR (PSInSAR), Small Baseline Subset (SBAS) InSAR, and SqueeSAR, have been developed to map land surface displacements by overcoming temporal/spatial decorrelation and minimizing the artifacts that affect individual interferograms, like atmospheric and orbital anomalies e.g., [
23,
24,
25,
26,
27].
Okmok Volcano is one of the most intensively studied volcanoes in the Aleutian arc. Deformation at the volcano has been thoroughly examined with InSAR and GPS, while field and remote sensing investigations have characterized both historic and prehistoric eruptive activities e.g., [
1,
9,
10,
11,
12,
13,
14,
15,
16,
18,
19,
20,
28,
29,
30,
31]. Although the general geometry of deformation is relatively constant over time, suggesting a persistent source, deformation rates varied greatly in time, which suggests changes in magma supply of the volcano’s shallow reservoir system [
1,
11,
20]. New data and more advanced InSAR processing methods are needed to test the extent of spatial stability and temporal variability of deformation at Okmok. This paper addresses the deformation of Okmok Caldera following its 2008 eruption until 2014 with InSAR observations. We combine data from two satellites and four independent viewing geometries using multi-temporal InSAR, which compensates for the poor coherence at the center of Okmok caldera (where deformation rates are the highest). These results, aided by a technique for phase unwrapping of interferograms with high fringe density, allow us to model the location, geometry, and volume change of the deformation source over time. We find that the deformation source at Okmok during 2008–2014 is similar to that found by other studies of previous time periods, and that the rate of magma accumulation continues to fluctuate.
2. InSAR Processing and Analysis
Conventional InSAR, combining two SAR images to make an interferogram, is limited by spatial and temporal decorrelation between SAR acquisitions e.g., [
32]. In addition, the accuracy of InSAR measurements can be significantly reduced by orbital errors and atmospheric artifacts. MTI methods developed to improve InSAR results when correlation is poor fall into two broad categories: PSInSAR e.g., [
23] and SBAS e.g., [
25]. The PSInSAR technique aims at identifying persistent scatterers (PSs) that dominate the background scattering in individual pixels and therefore maintain high levels of coherence. An alternative approach is to minimize the time between images that form interferograms, thus minimizing temporal decorrelation. Pixels with phase values that, when filtered, decorrelate little over short time intervals are referred to as slow-varying filtered-phase (SFP) pixels and are the targets of SBAS processing [
33]. To study post-2008 deformation of Okmok, we use the MTI method developed by Hooper
et al. [
33] that incorporates both PSInSAR and SBAS to maximize interferometric correlation. Decorrelation has been a persistent problem at Okmok since the 2008 eruption, which deposited ash in the caldera center that causes significant coherence loss. This MTI method has generated promising results in other volcanic settings, such as Katla volcano, Iceland [
34], Popocatepetl and Colima volcanoes, Mexico [
35], and Three Sisters [
36] and Medicine Lake Volcano [
37], USA.
2.1. Multi-Temporal InSAR Algorithm
2.1.1. PSInSAR Processing
The PSInSAR technique utilizes a time series of radar images to detect coherent Persistent Scatterer (PS) points, with the goal of recognizing coherent radar signals from normally-incoherent areas. For PSInSAR processing, we employ the Stanford Method for Persistent Scatterers (StaMPS) [
22], which uses both amplitude and phase analyses to determine the probability of PSs in each pixel. An initial selection of PS is based on amplitude analysis [
23], and then the phase analysis is applied to estimate the PS probability in an iterative process [
22,
38]. An estimate of the decorrelation noise, γ
x, which is a representation of variations in the residual phase at the PS candidate pixel [
22,
33,
38] is proposed as the iteration stopping criterion:
where N is the number of interferograms,
is the wrapped phase of pixel x in the i
th interferogram,
is the estimated spatially-uncorrelated look angle error term and
is the estimate of the spatially-correlated term. The root-mean-square change in γ
x (Equation (1)) is calculated within each iteration. When the value is no longer decreasing, the solution has converged and the iteration stops. More details about StaMPS can be found in Hooper
et al. [
22,
38] and Hooper [
33].
2.1.2. SBAS Processing
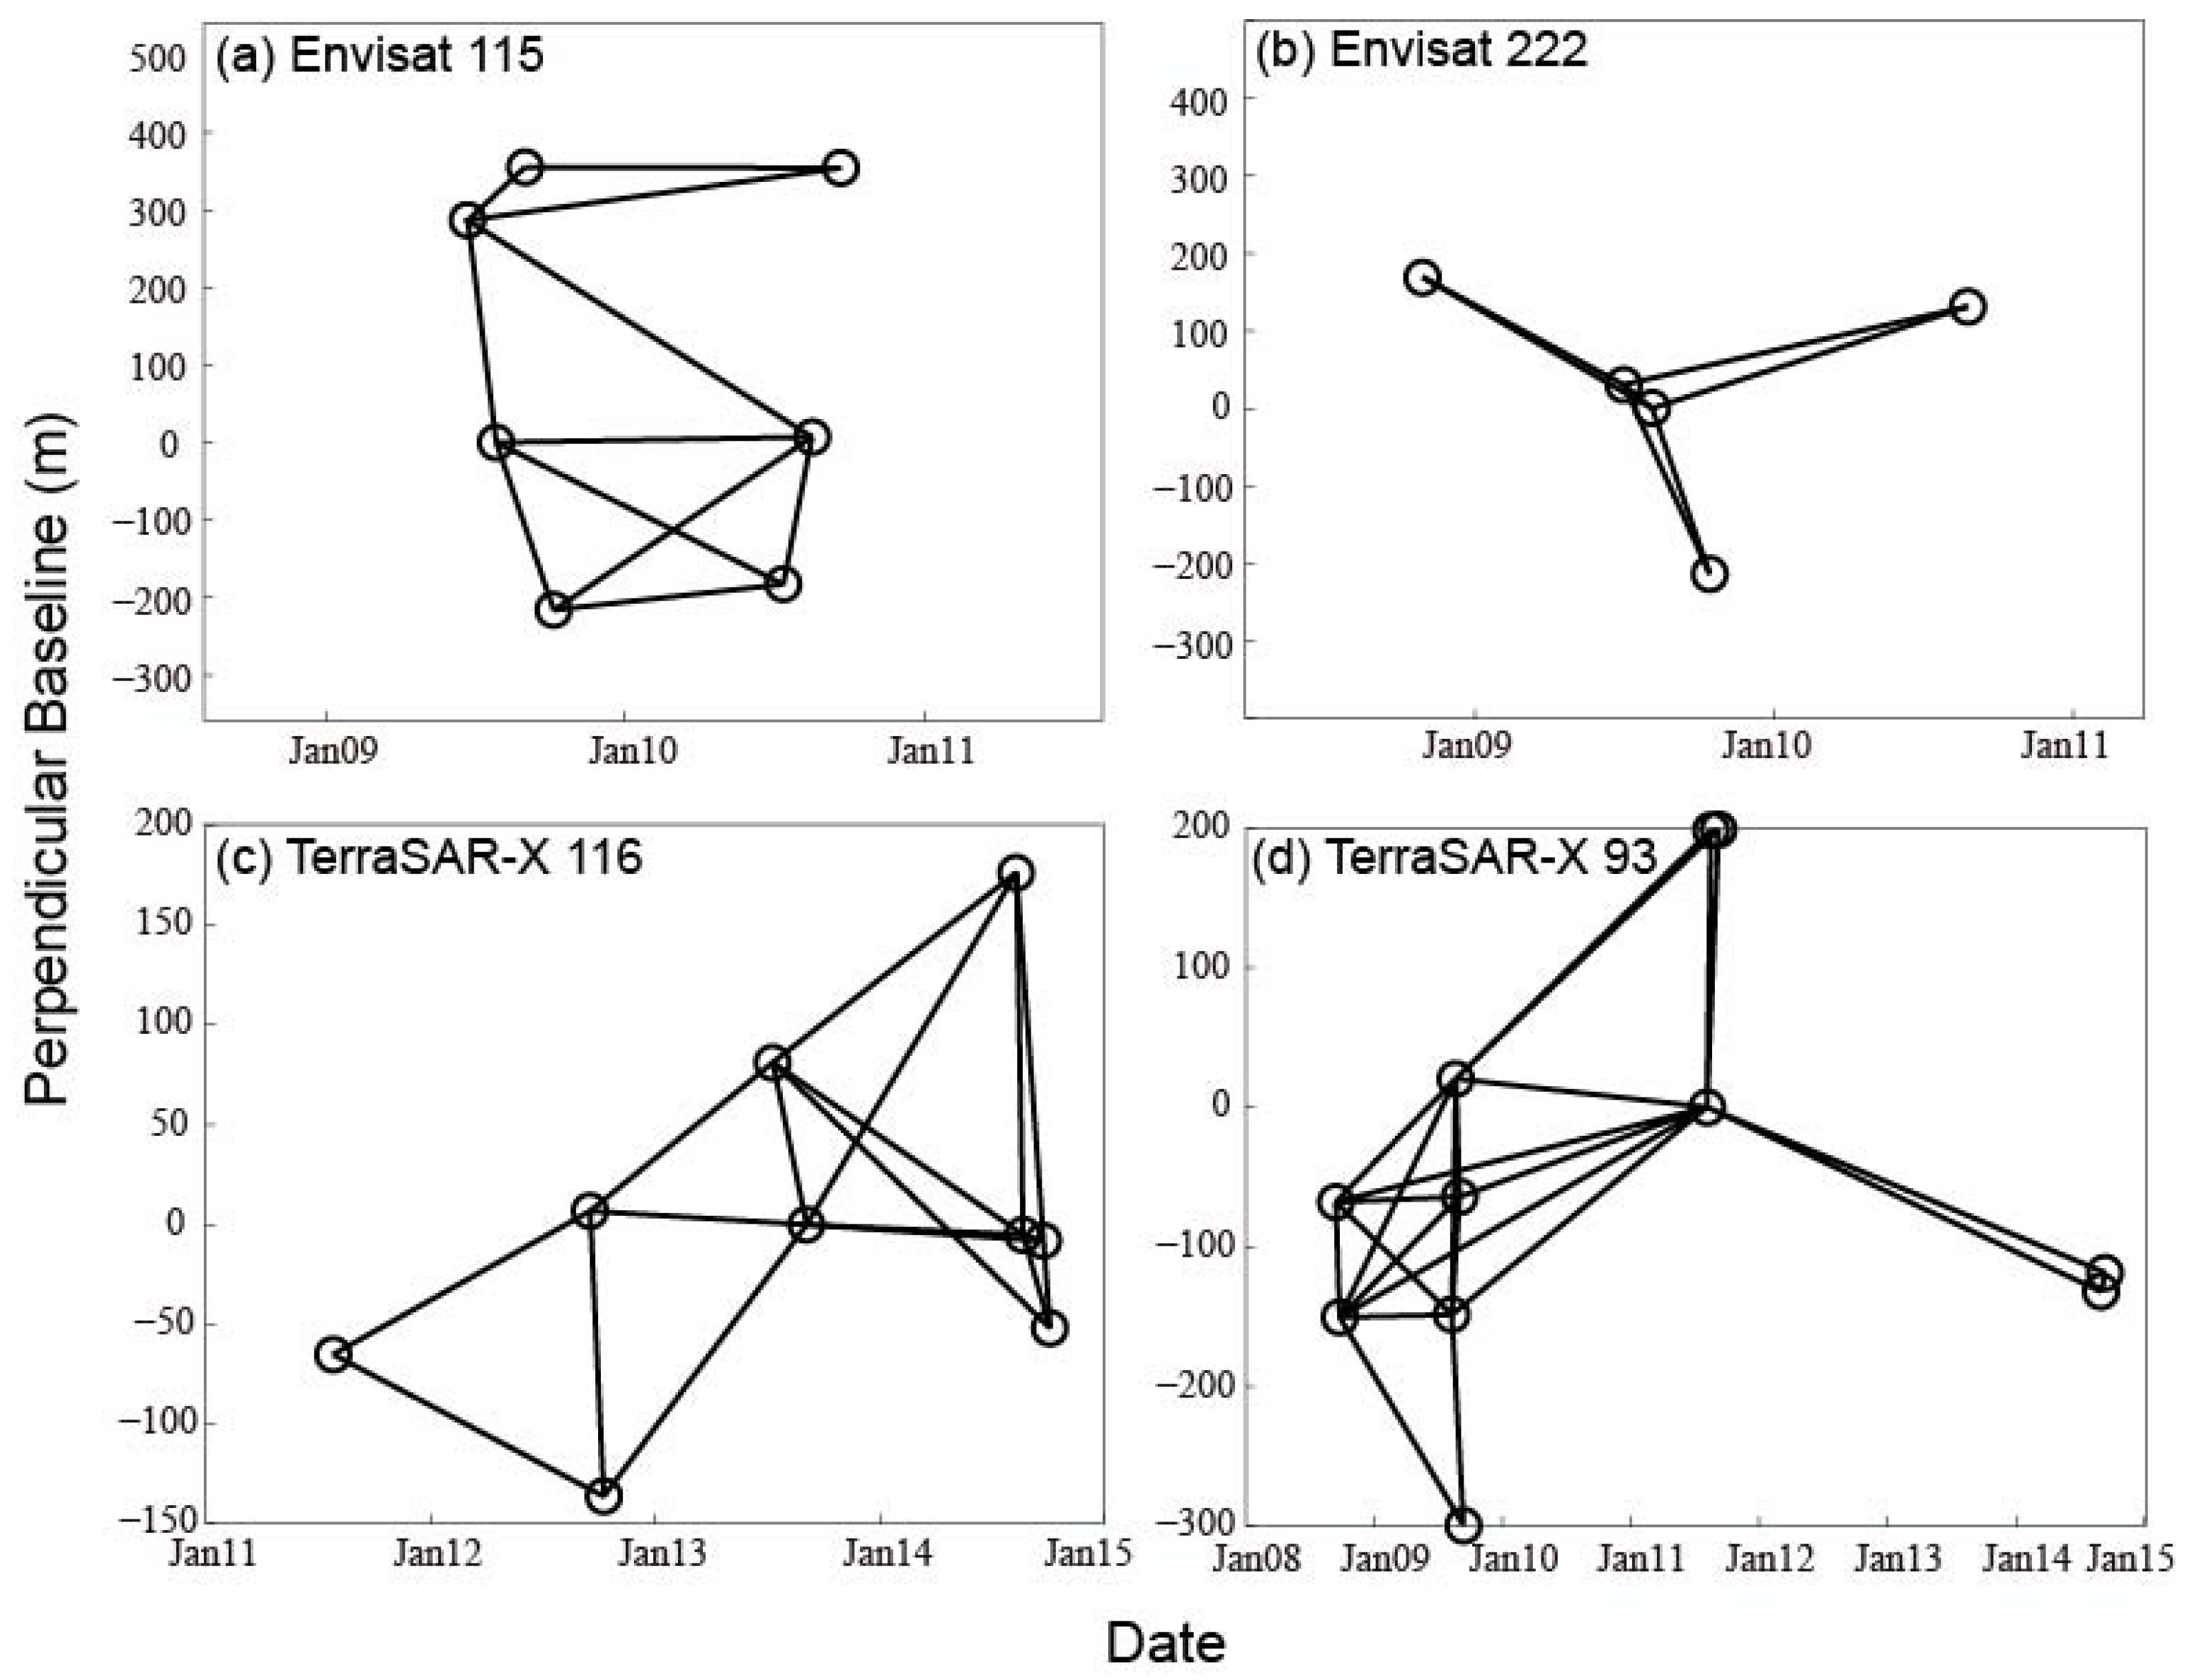
The SBAS method seeks to minimize the separation among temporal and spatial baselines and Doppler frequency of interferograms in order to maximize interferometric coherence. We select image pairs whose Doppler, perpendicular, and temporal separations are below given thresholds, while ensuring that there are no isolated clusters within the resultant network of image pairs so that the interferograms are all connected in the temporal and spatial domains (
Figure 2) [
33]. Interferograms are filtered in both range and azimuth to reduce the effect of geometric decorrelation and to exclude non-overlapping Doppler spectrum. SFP pixels are identified amongst the candidate pixels in the similar way as for PS pixels [
33]. Note that the PS pixels are selected based on single-master interferograms with no spectral filtering, while SFP pixels are chosen based on multiple-master small-baseline interferograms with spectral filtering.
2.1.3. MTI Processing
After selection, the PS and SFP datasets are combined before phase unwrapping to maximize the reliability of the unwrapped phase. We calculate the equivalent SBAS interferogram phases for PS pixels by recombining the corresponding single-master interferogram phases [
33],
where
is the single-master phase for the SBAS slave,
is the single-master phase for the SBAS master, and
is the wrapping operator. A combined dataset of SBAS interferometric phases can be created from both PS and SFP pixels (for simplicity, we subsequently refer to the combined PS and SFP pixels as “PS”). So the combination of PS and SFP pixels is followed with steps of three-dimensional (3D) phase unwrapping and deformation phase extraction [
39]. We estimate the atmospheric artifact and baseline error by high-pass filtering of the unwrapped phase data in time then low-pass filtering in space [
22]. The unwrapped phases of the SBAS interferograms are then inverted to form a time series of phases at each pixel. As there are no isolated clusters of interferograms, we invert the unwrapped phase using a least-squares method.
2.2. Datasets and Processing
The Okmok Volcano is covered by five scenes from ascending Envisat track 222, seven scenes from descending Envisat track 115, 11 scenes from ascending TerraSAR-X track 93, and nine scenes from descending TerraSAR-X track 116. A minimum of five acquisitions are required to use the PS/SBAS-combined MTI processing technique [
33]. The radar satellite travels from approximately north to south and looks to the west during the descending track; it travels from south to north and looks to the east during the ascending track. Envisat SAR operates at C-band (5.7 cm wavelength), while TerraSAR-X operates at X-band (3.1 cm wavelength). More detailed characteristics of SAR data used in this study can be found in
Table 1. To remove topographic phase from interferograms formed using these data, we use a Digital Elevation Model (DEM) that is derived from a combination of 1-arc-second (~30 m) Shuttle Radar Topography Mission (SRTM) data and more up-to-date elevation data from the caldera area created from 21 January 2010, Worldview imagery [
8] (
Figure 1). DORIS precise orbit data is used to improve the accuracy of satellite positions and interferogram baseline estimates for Envisat data.
We construct a total of 59 SBAS interferograms, including seven from Envisat track 222, 11 from Envisat track 115, 18 from TerraSAR-X track 116, and 23 from TerraSAR-X 93 (
Table 1;
Figure 2). Each slave image is resampled to the master geometry and corrected for the difference in position of the master and slave sensor, using the WGS84 reference ellipsoid. The four datasets are then processed using the MTI method described above.
Figure 2.
Temporal-spatial baseline distributions of interferograms for the four datasets: (a,b) interferograms with perpendicular baselines less than 300 m for ENVISAT C-band data, and (c,d) interferograms with perpendicular baselines less than 200 m for TerraSAR-X X-band data.
Figure 2.
Temporal-spatial baseline distributions of interferograms for the four datasets: (a,b) interferograms with perpendicular baselines less than 300 m for ENVISAT C-band data, and (c,d) interferograms with perpendicular baselines less than 200 m for TerraSAR-X X-band data.
Table 1.
SAR data characteristics in Okmok.
Table 1.
SAR data characteristics in Okmok.
| Sensor | Envisat ASAR | TerraSAR-X |
|---|
| Band | C | X |
| Polarization | VV | HH |
| Wavelength (cm) | 5.7 | 3.1 |
| Track | 222 | 115 | 93 | 116 |
| Heading (˚) | −16.4 | −163.5 | 350 | 192.1 |
| Incidence angle (˚) | 22.5 | 22.8396 | 41.9804 | 24.625 |
| Number of used scenes | 5 | 7 | 11 | 9 |
| Number of pairs | 7 | 11 | 23 | 18 |
| Date range (yyyymmdd) | 20081029–20100825 | 20090623–20100921 | 20080914–20140912 | 20110727–20141005 |
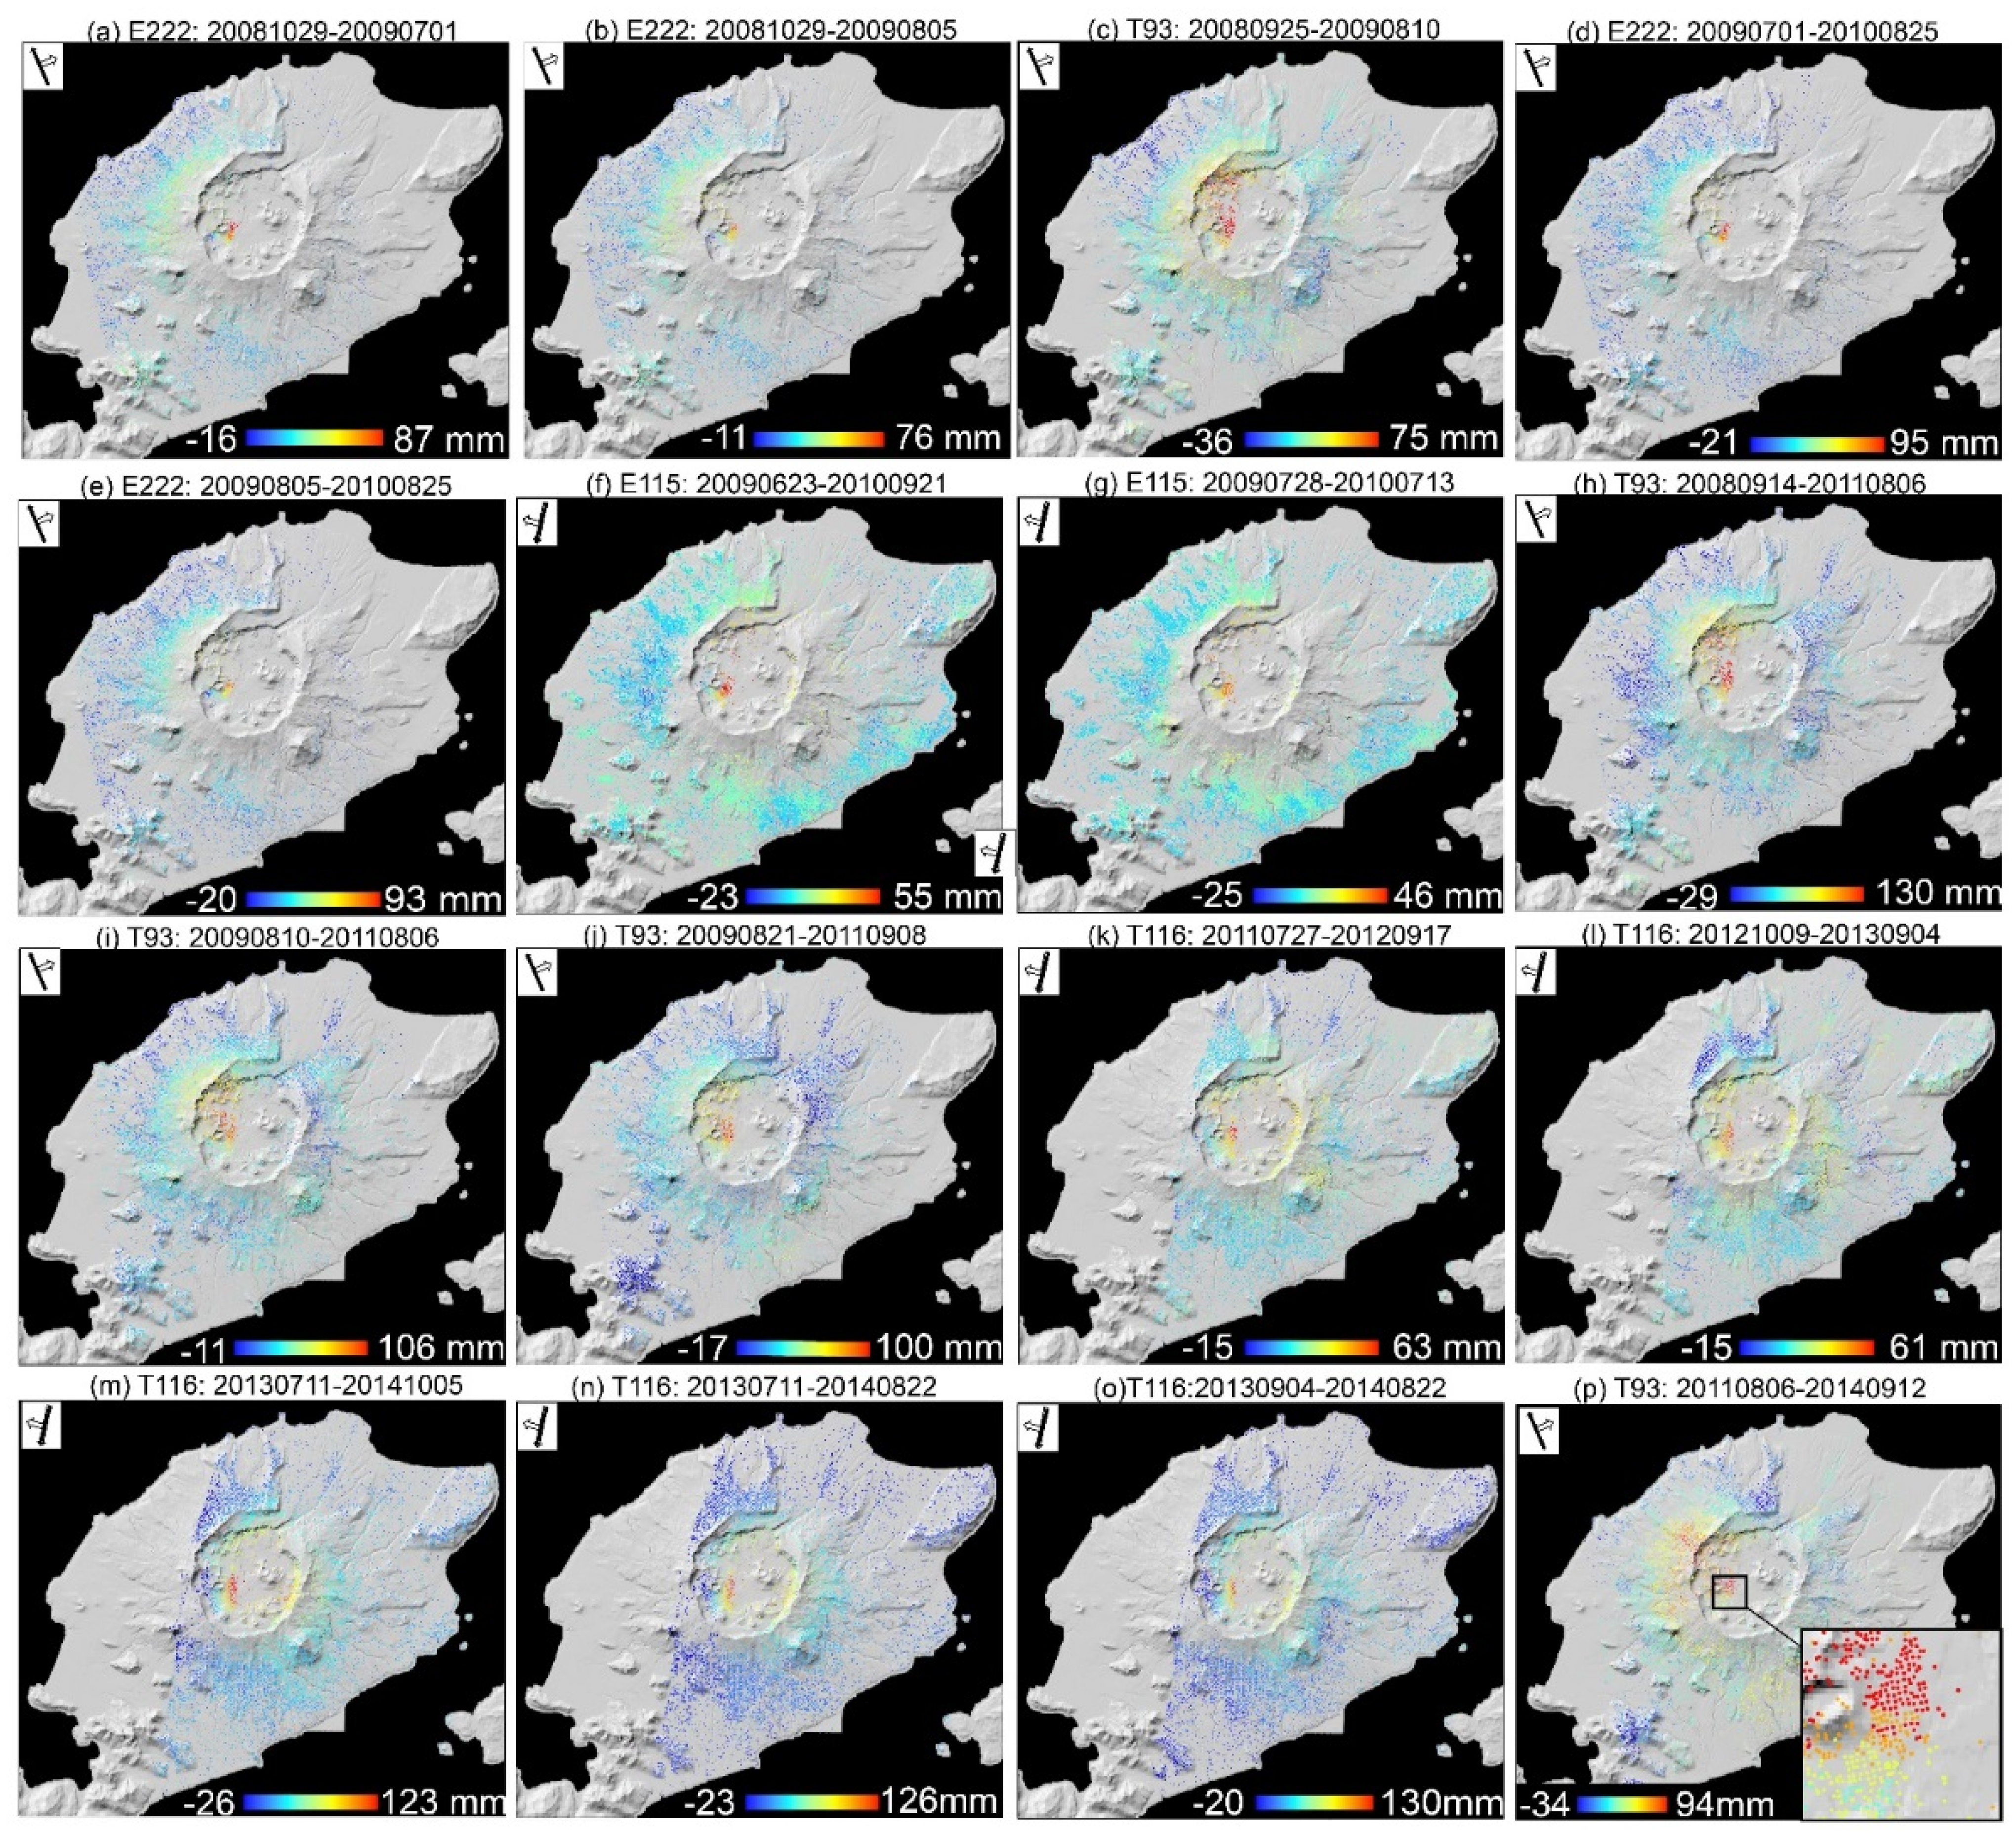
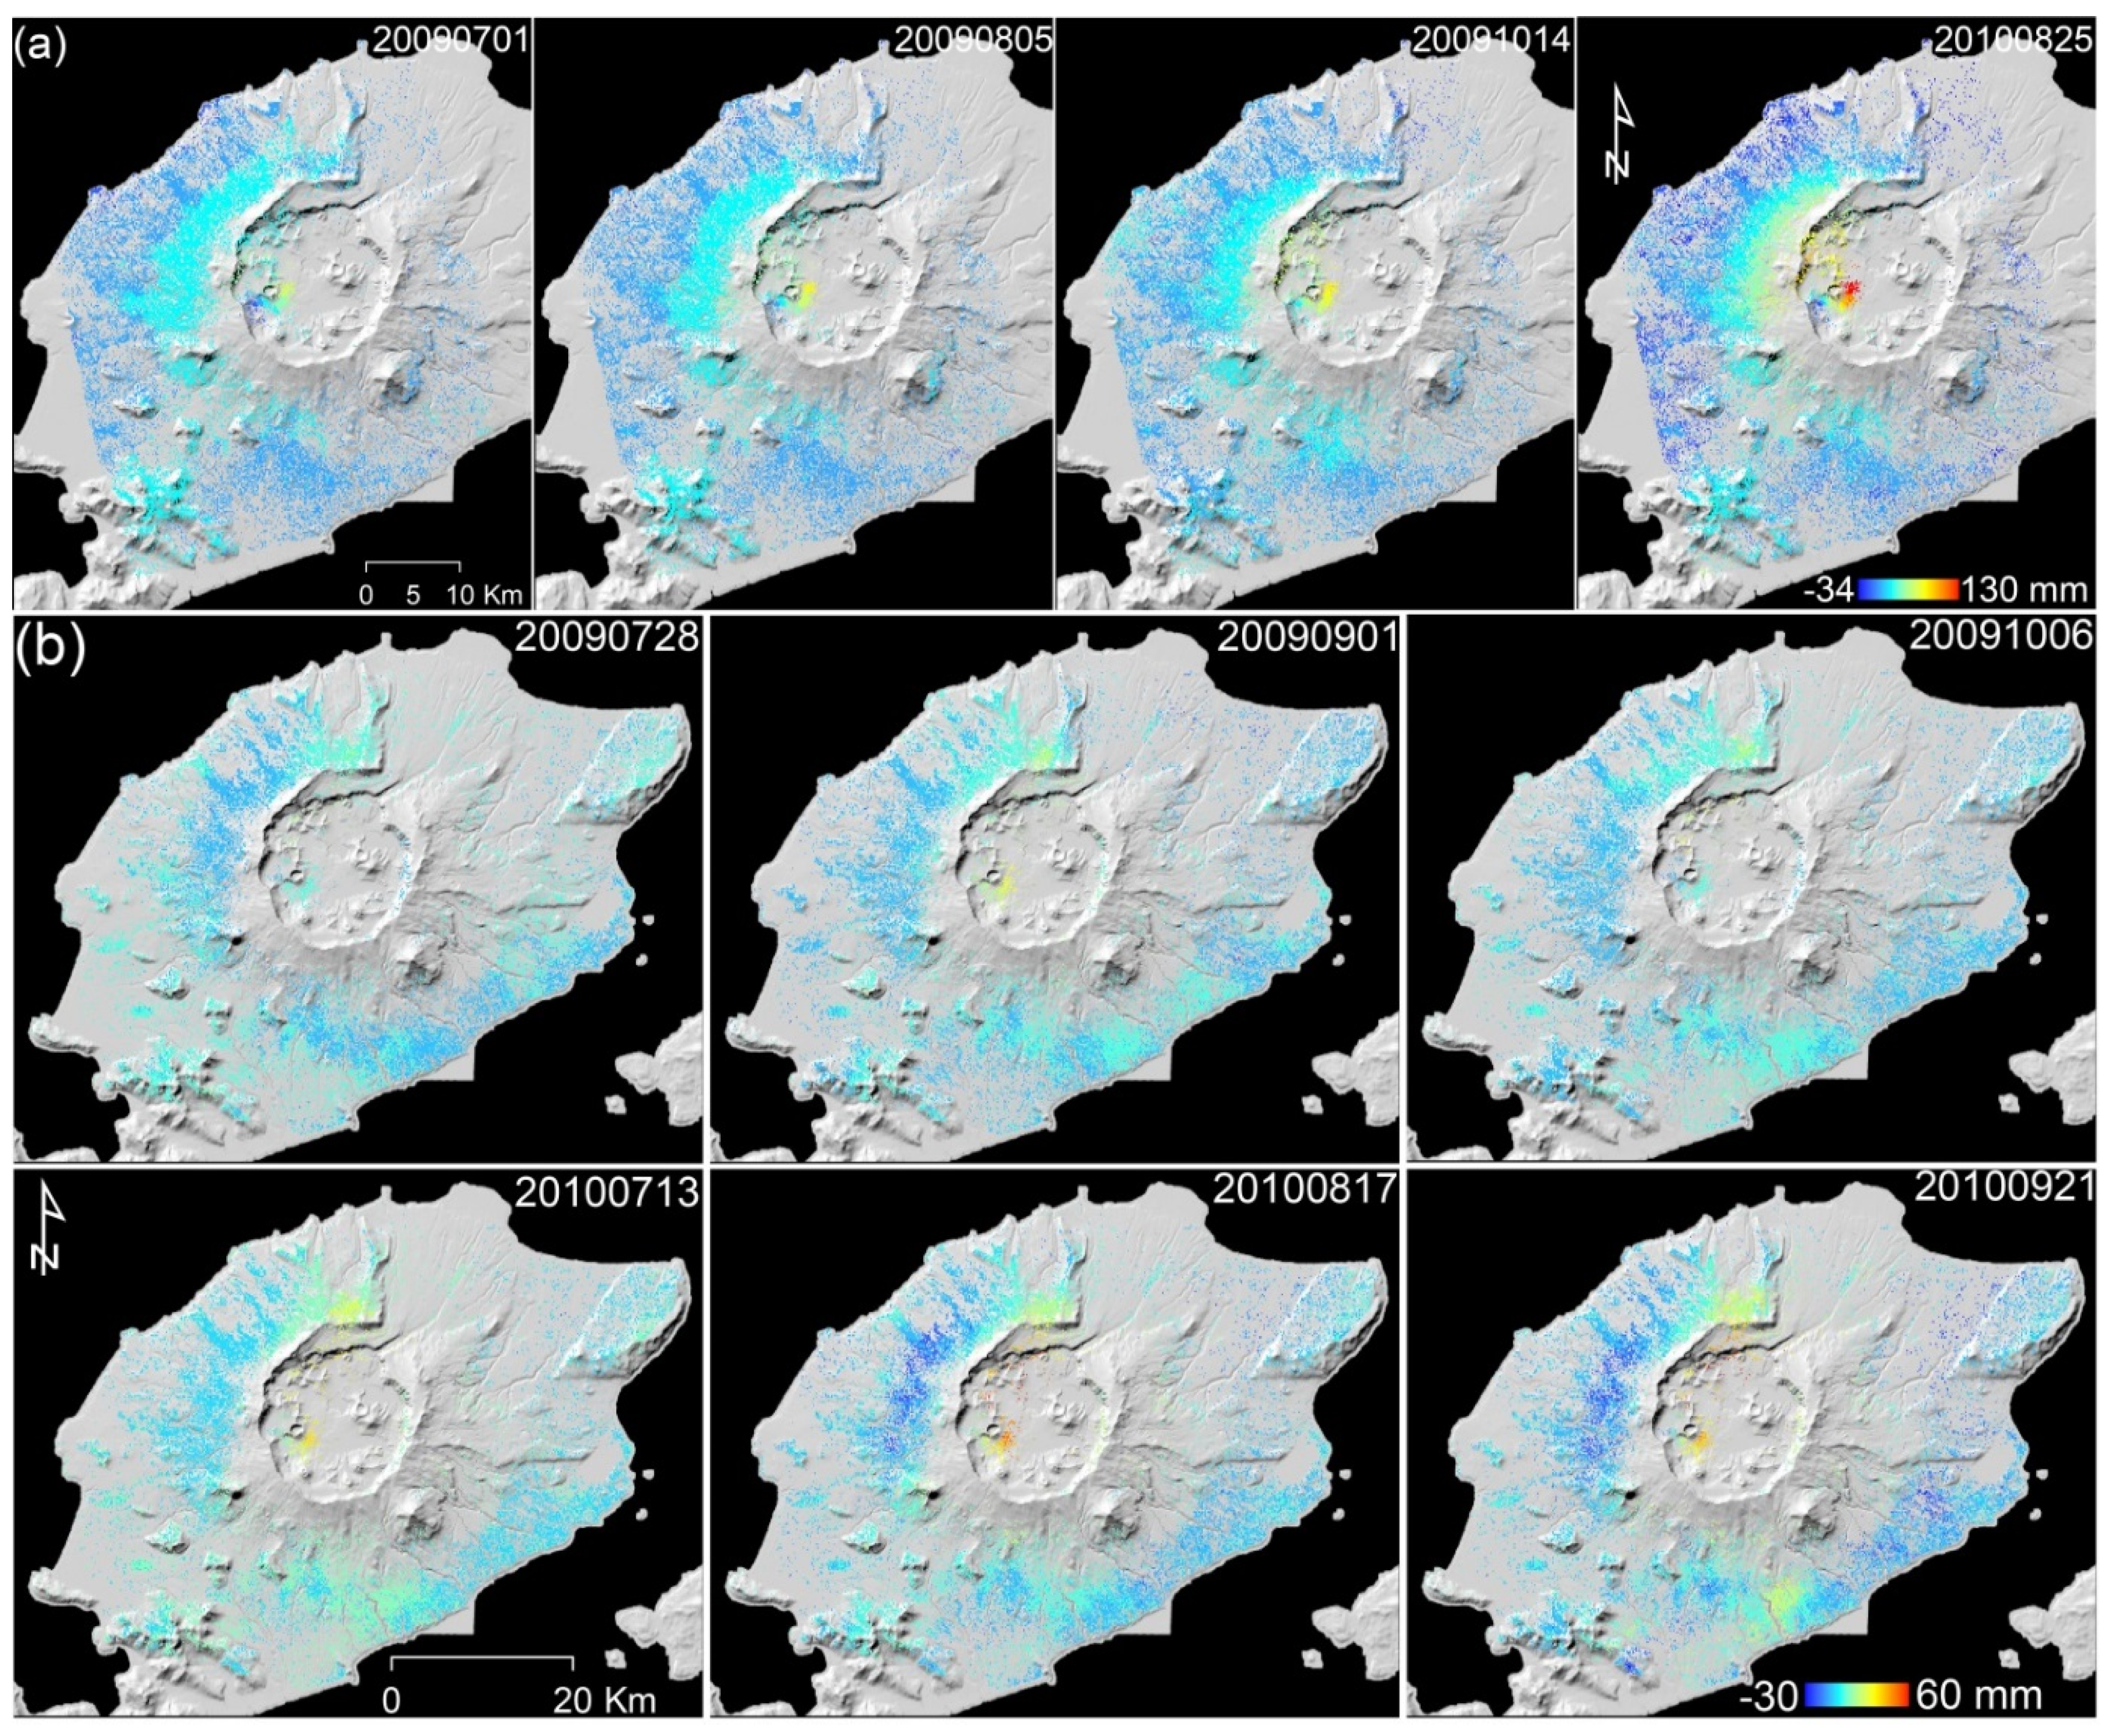
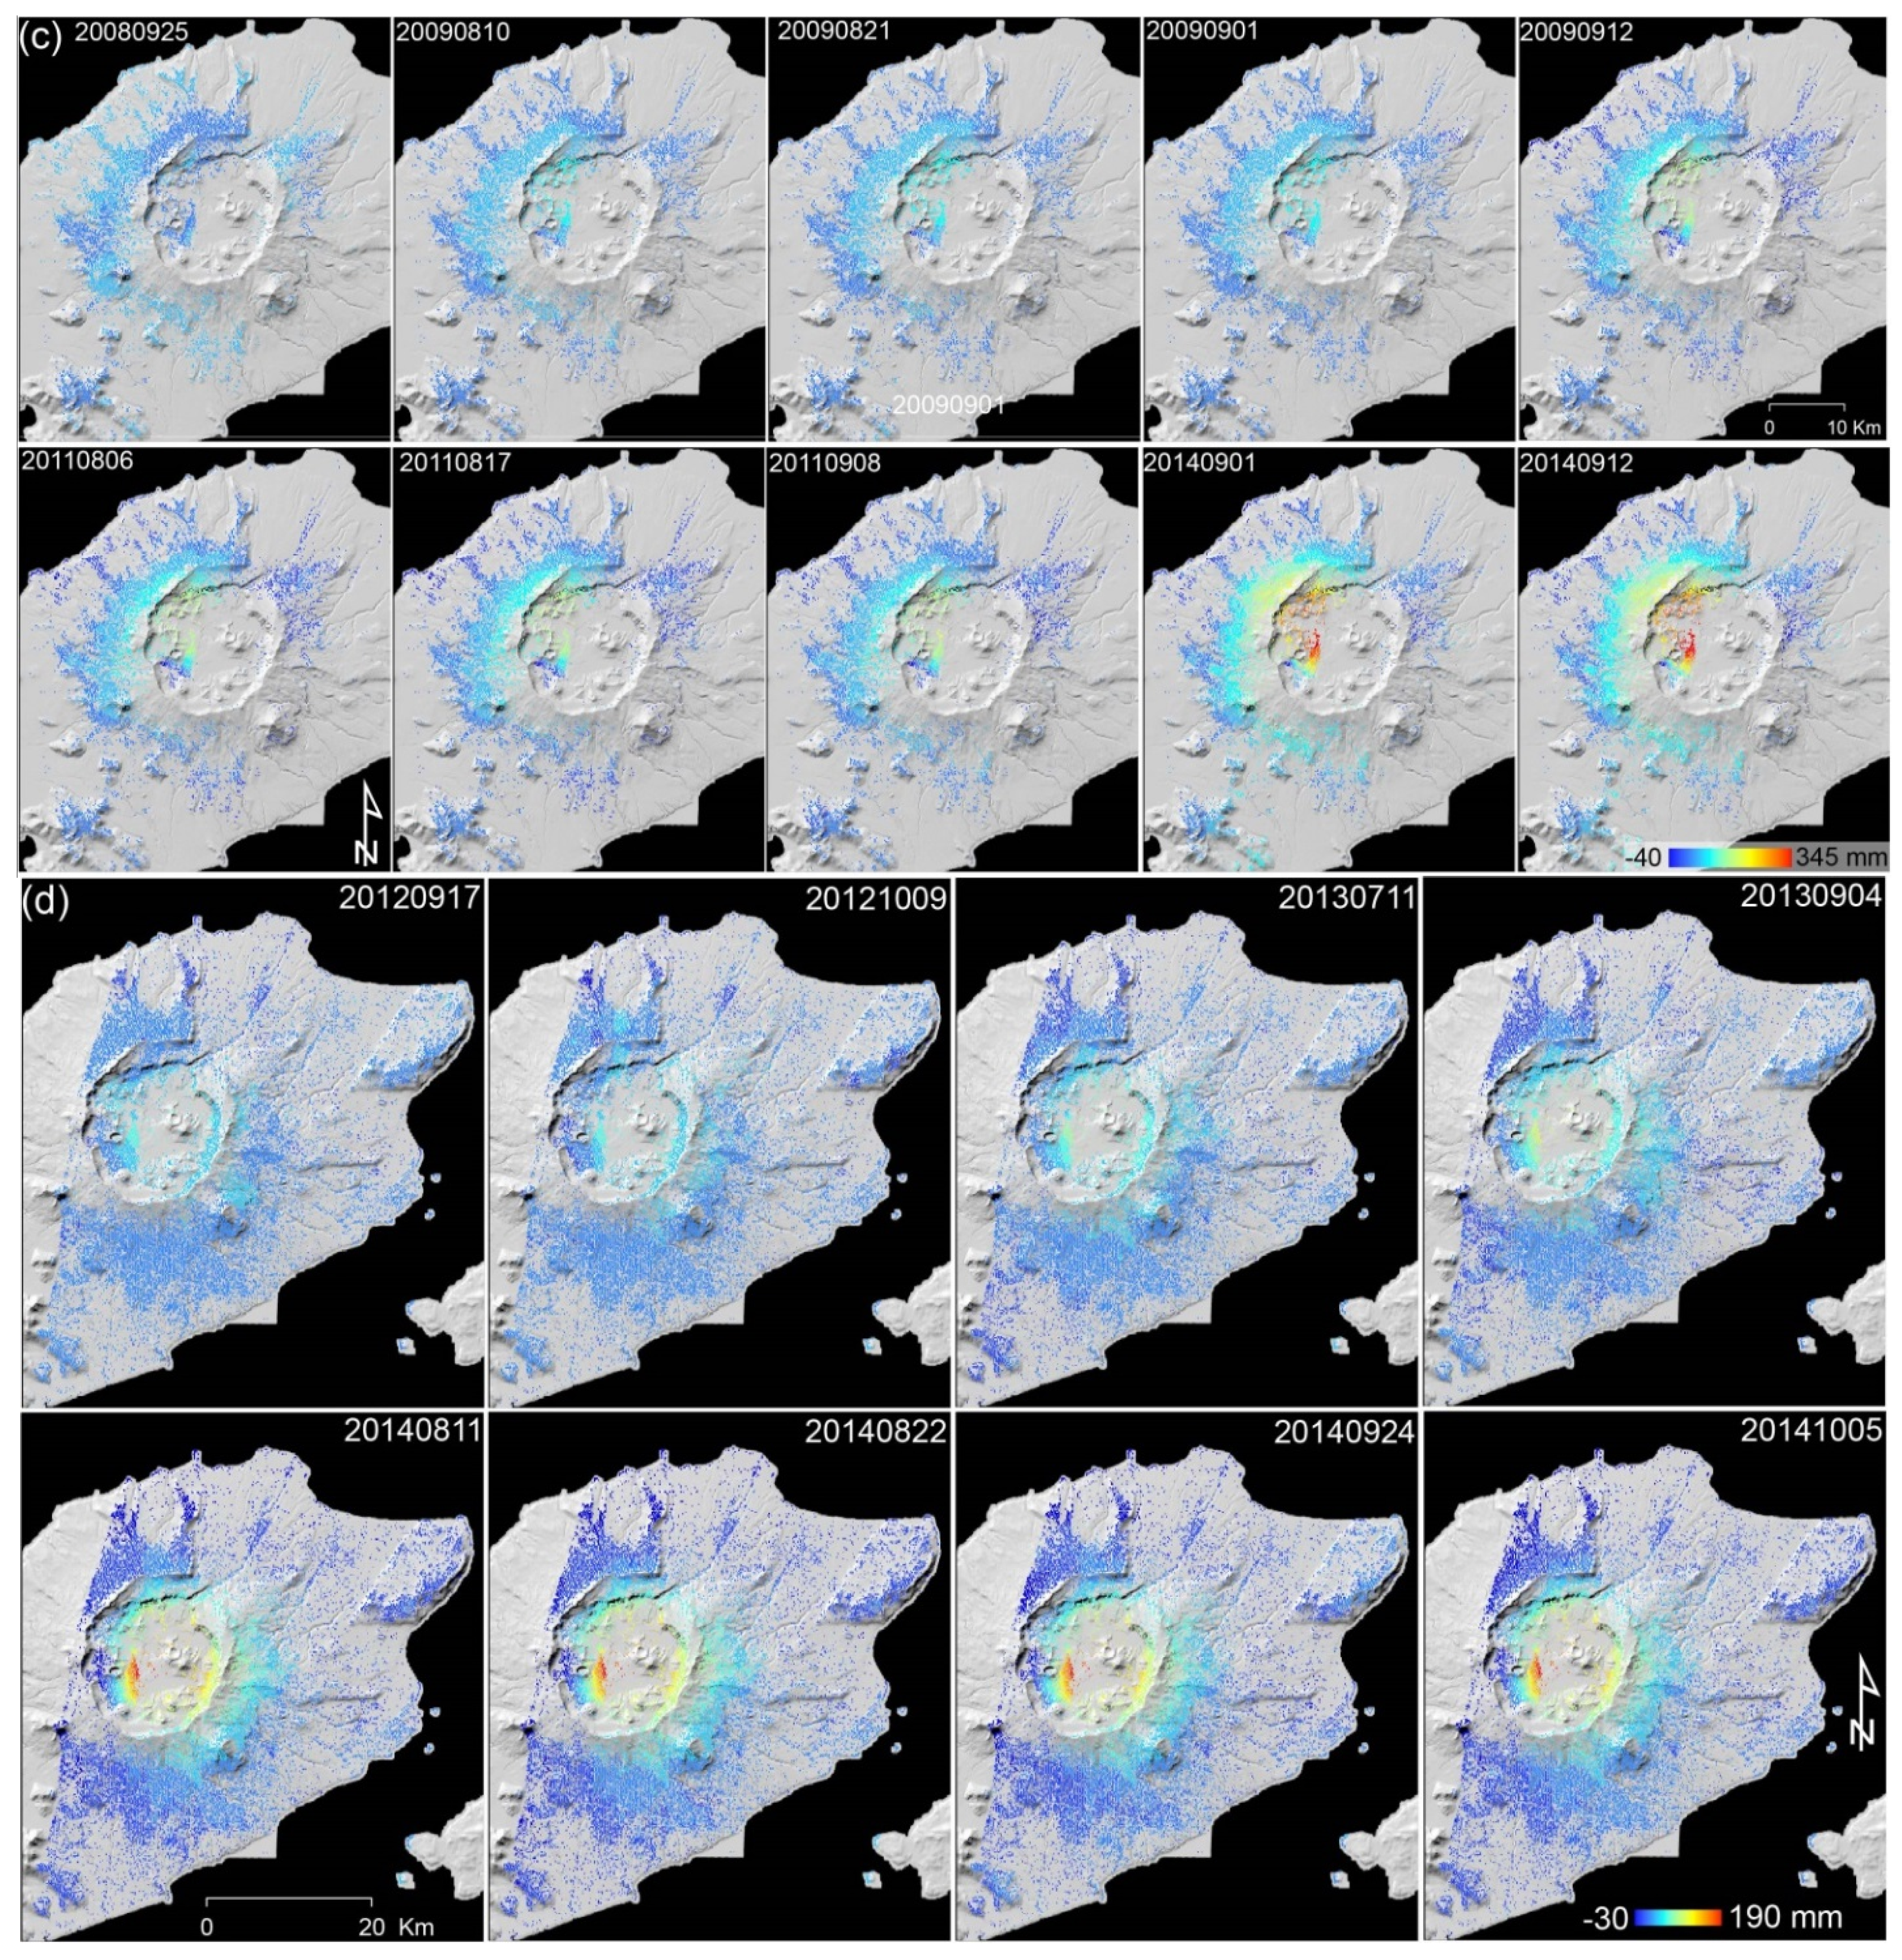
Figure 3.
Selected interferograms showing surface deformation of Okmok volcano from 2008 to 2014 ordered by start date: (a) 20081029–20090701 (Envisat 222), (b) 20081029–20090805 (Envisat 222), (c) 20080925–20090810 (TerraSAR-X 93), (d) 20090701–20100825 (Envisat 222), (e) 20090805–20100825 (Envisat 222), (f) 20090623–20100921 (Envisat 115), (g) 20090728–20100713 (Envisat 115), (h) 20080914–20110806 (TerraSAR-X 93), (i) 20090810–20110806 (TerraSAR-X 93), (j) 20090821–20110908 (TerraSAR-X 93), (k) 20110727–20120917 (TerraSAR-X 116), (l) 20121009–20130904 (TerraSAR-X 116), (m) 20130711–20141005 (TerraSAR-X 116), (n) 20130711–20140822 (TerraSAR-X 116), (o) 20130904–20140822 (TerraSAR-X 116), (p) 20110806–20140912 (TerraSAR-X 93). Satellite ID (E is Envisat and T is TerraSAR-X), satellite flight direction, and radar look direction are labelled. The total amounts of LOS displacements vary among InSAR images due to the time-varying deformation nature and different time-spans of interferograms, so different color scales are used to highlight the deformation in subfigures.
![Remotesensing 07 15839 g003]()
2.3. InSAR Results
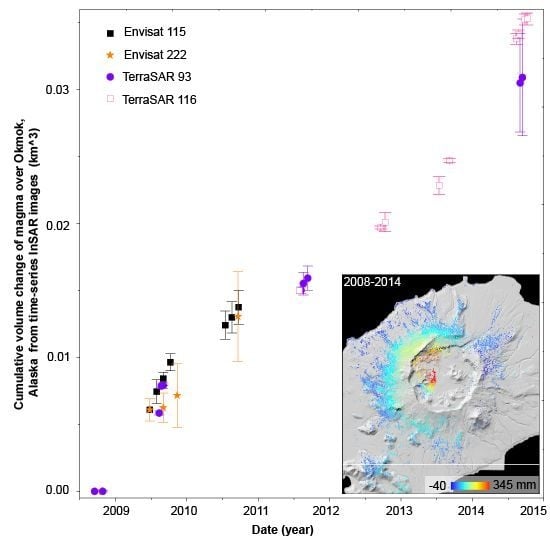
The 59 interferograms analyzed here have temporal separations of ~1–3 years. The results from all data sets indicate that post-eruptive inflation at Okmok continued throughout the 2008–2014 time period (
Figure 3), but at a time-varied rate [
40]. The maximum annual line-of-sight (LOS) displacement measured in any one year was ∼130 mm during 2013–2014 (
Figure 3). Sequential ~1–3-year interferograms show that during 2008 to 2010 the annual inflation decreased with time from ∼80 mm during 2008–2009 (
Figure 3a–c) to ~50 mm during 2009–2010 (
Figure 3d–g), held steady at 50–60 mm during 2010–2013, then increased sharply to ~130 mm during 2013–2014 (
Figure 3m–o). Because the deformation varied with time and the interferograms span different time intervals, different color scales are used to highlight the deformation in interferograms (
Figure 3). This temporal pattern of inflations is similar to that observed after the 1997 eruption [
18]. There are also localized patches of deflation on the western side of Cone A and Cone E and the area between Cone A and Cone E (up to 10–30 mm/y) that are superimposed on the volcano-wide inflation during the whole time span.
3. Model-Assisted Phase Unwrapping
Due to the shorter wavelength of X-band data and greater deformation rate during 2013–2014, the fringe rate is quite high in long-temporal-baseline TerraSAR-X interferograms. The denser fringes make phase unwrapping much more difficult and can cause unwrapping errors [
41]. There are only two scenes acquired in 2014 by TerraSAR-X on track 93, and no other data are available on this track prior to 2011 (
Figure 2), meaning that only three-year interferograms can be generated spanning this period. In such interferograms, only about 94 mm of LOS inflation was apparent (
Figure 3p), which is not consistent with other observations (e.g., track 116;
Figure 3m–o). It is obvious from close inspection of the track 93 interferograms that there are several phase discontinuities towards the center of the caldera,
i.e., phase unwrapping error (
Figure 3p, lower right corner).
To resolve the problem of phase discontinuities in unwrapped long-temporal-baseline track 93 interferograms, we employ a “model-assisted” phase unwrapping method. First, we model the deformation in TerraSAR-X track 116 interferograms. We then subtract this modeled phase from the long-temporal-baseline track 93 interferograms, thus reducing the fringe rate in these images. The residual phase, after the modeled deformation phase removal, becomes much smoother and is easily unwrapped. Below, we discuss the deformation modeling and “model-assisted” phase unwrapping method in more detail.
3.1. Deformation Modelling and Analysis
We processed SAR images from four different datasets (
Table 1) using the MTI procedure described above to generate LOS deformation rate maps and time series over the Okmok region for the following observation periods: 2008.10–2010.8 (Envisat track 222;
Figure 4a), 2008.9–2011.9 (TerraSAR-X track 93;
Figure 4d), 2009.6–2010.9 (Envisat track 115;
Figure 4g), and 2011.7–2014.10 (TerraSAR-X track 116;
Figure 4j). All four tracks indicate that Okmok started inflating soon after the end of 2008 eruption (
Figure 3a,d and g).
The MTI dataset was used to constrain numerical models of the subsurface deformation source. Although we have results spanning 2011–2014 from TerraSAR-X track 93, we did not include these in modeling of source geometry because of the presence of numerous unwrapping errors. Deformation at Okmok has been modeled using a point source within a homogenous isotropic elastic half-space [
17] in previous studies e.g., [
1,
9,
10,
16,
18,
28,
30,
42]. Lu
et al. [
18] concluded that the synthetic interferograms for the best fit Mogi source are indistinguishable from those for the best fit prolate spherical sources; therefore, the Mogi [
17] source is employed in the current analysis for computational simplicity. For each annual deformation, we determined best fit parameters for the location (position and depth) and “strength” (volume or pressure change) of the deformation source (note that we assume that the magma filling the reservoir is incompressible, so our volume estimates represent the volume changes in the chamber). To account for the effect of topography on the observed deformation field, we used the simple approach proposed by Williams and Wadge [
43]. The downhill simplex method and Monte Carlo simulations [
44] were applied to estimate the optimal parameters and the root mean-square error (RMSE) between observed and modeled interferograms. During the model inversion we masked the subsiding region inside the caldera, which is supposedly impacted by the lava flows from historical eruptions.
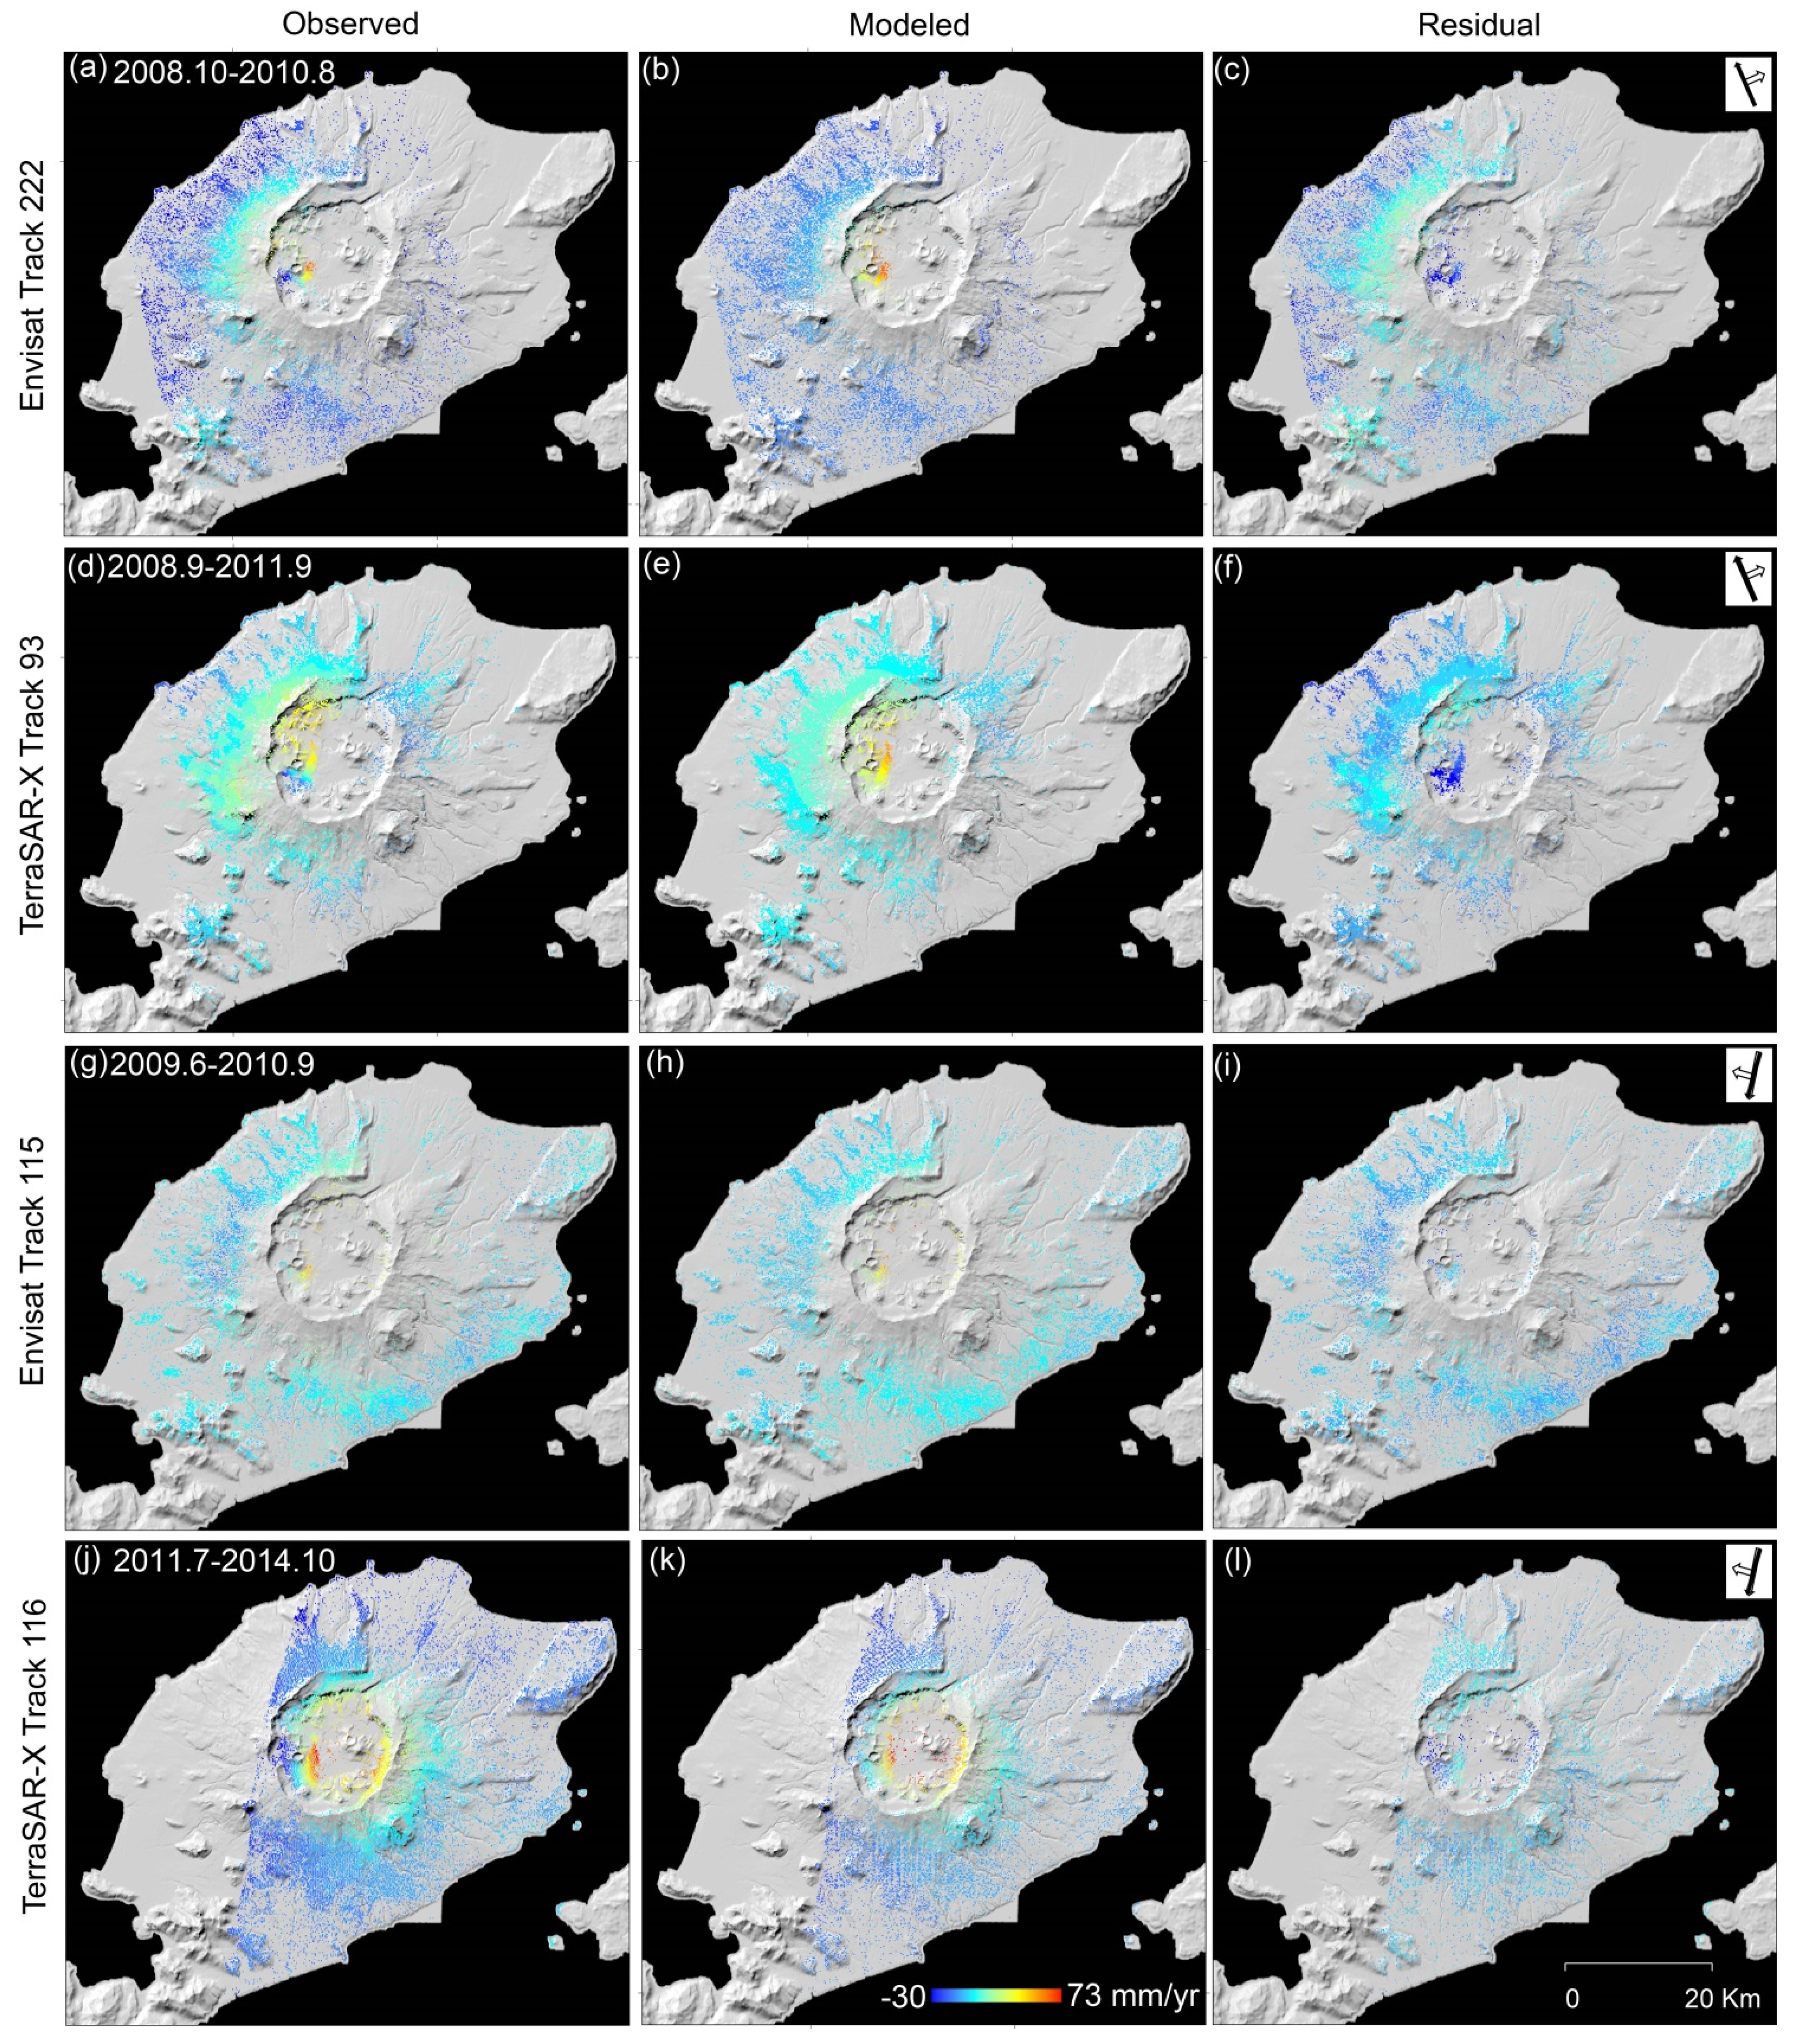
Figure 4 shows observed, modeled, and residual deformation maps for each independent track. Examination of the residual deformation maps shows that the source model fits the volcano-wide deformation reasonably well. However, the InSAR result from E222 is worse than those from other tracks due to the relatively small number of scenes and larger baselines, so the inversion result of track E222 is also not as good as others. In addition, large deflections remain inside the caldera, which suggests LOS subsidence by as much as 20–30 mm/y in the vicinities of Cone A and Cone E. The anomalous subsidence is similar in character regardless of dataset, time interval, and perpendicular baseline, which suggests that the signal represents real deformation and not atmospheric, orbital, or DEM errors. We therefore conclude that localized subsidence is occurring within the caldera, most notably involving the 1954 and 1997 lava flows as has previously been recognized [
1,
7].
Figure 4.
Observed (
Left), modeled (
Middle), and residual (
Right) average LOS deformation maps for the four independent tracks of InSAR data during September 2008 to October 2014 (
Table 1). Satellite flight direction and radar look direction are labelled. The cold colors (blue to yellow) represent subsidence,
i.e., incremental displacement away from the satellite, to low-rate uplift,
i.e., displacement towards the satellite, and the hot-colored points show high-rate uplift. The color scale is the same for all images.
3.2. Phase Unwrapping Error Deduction
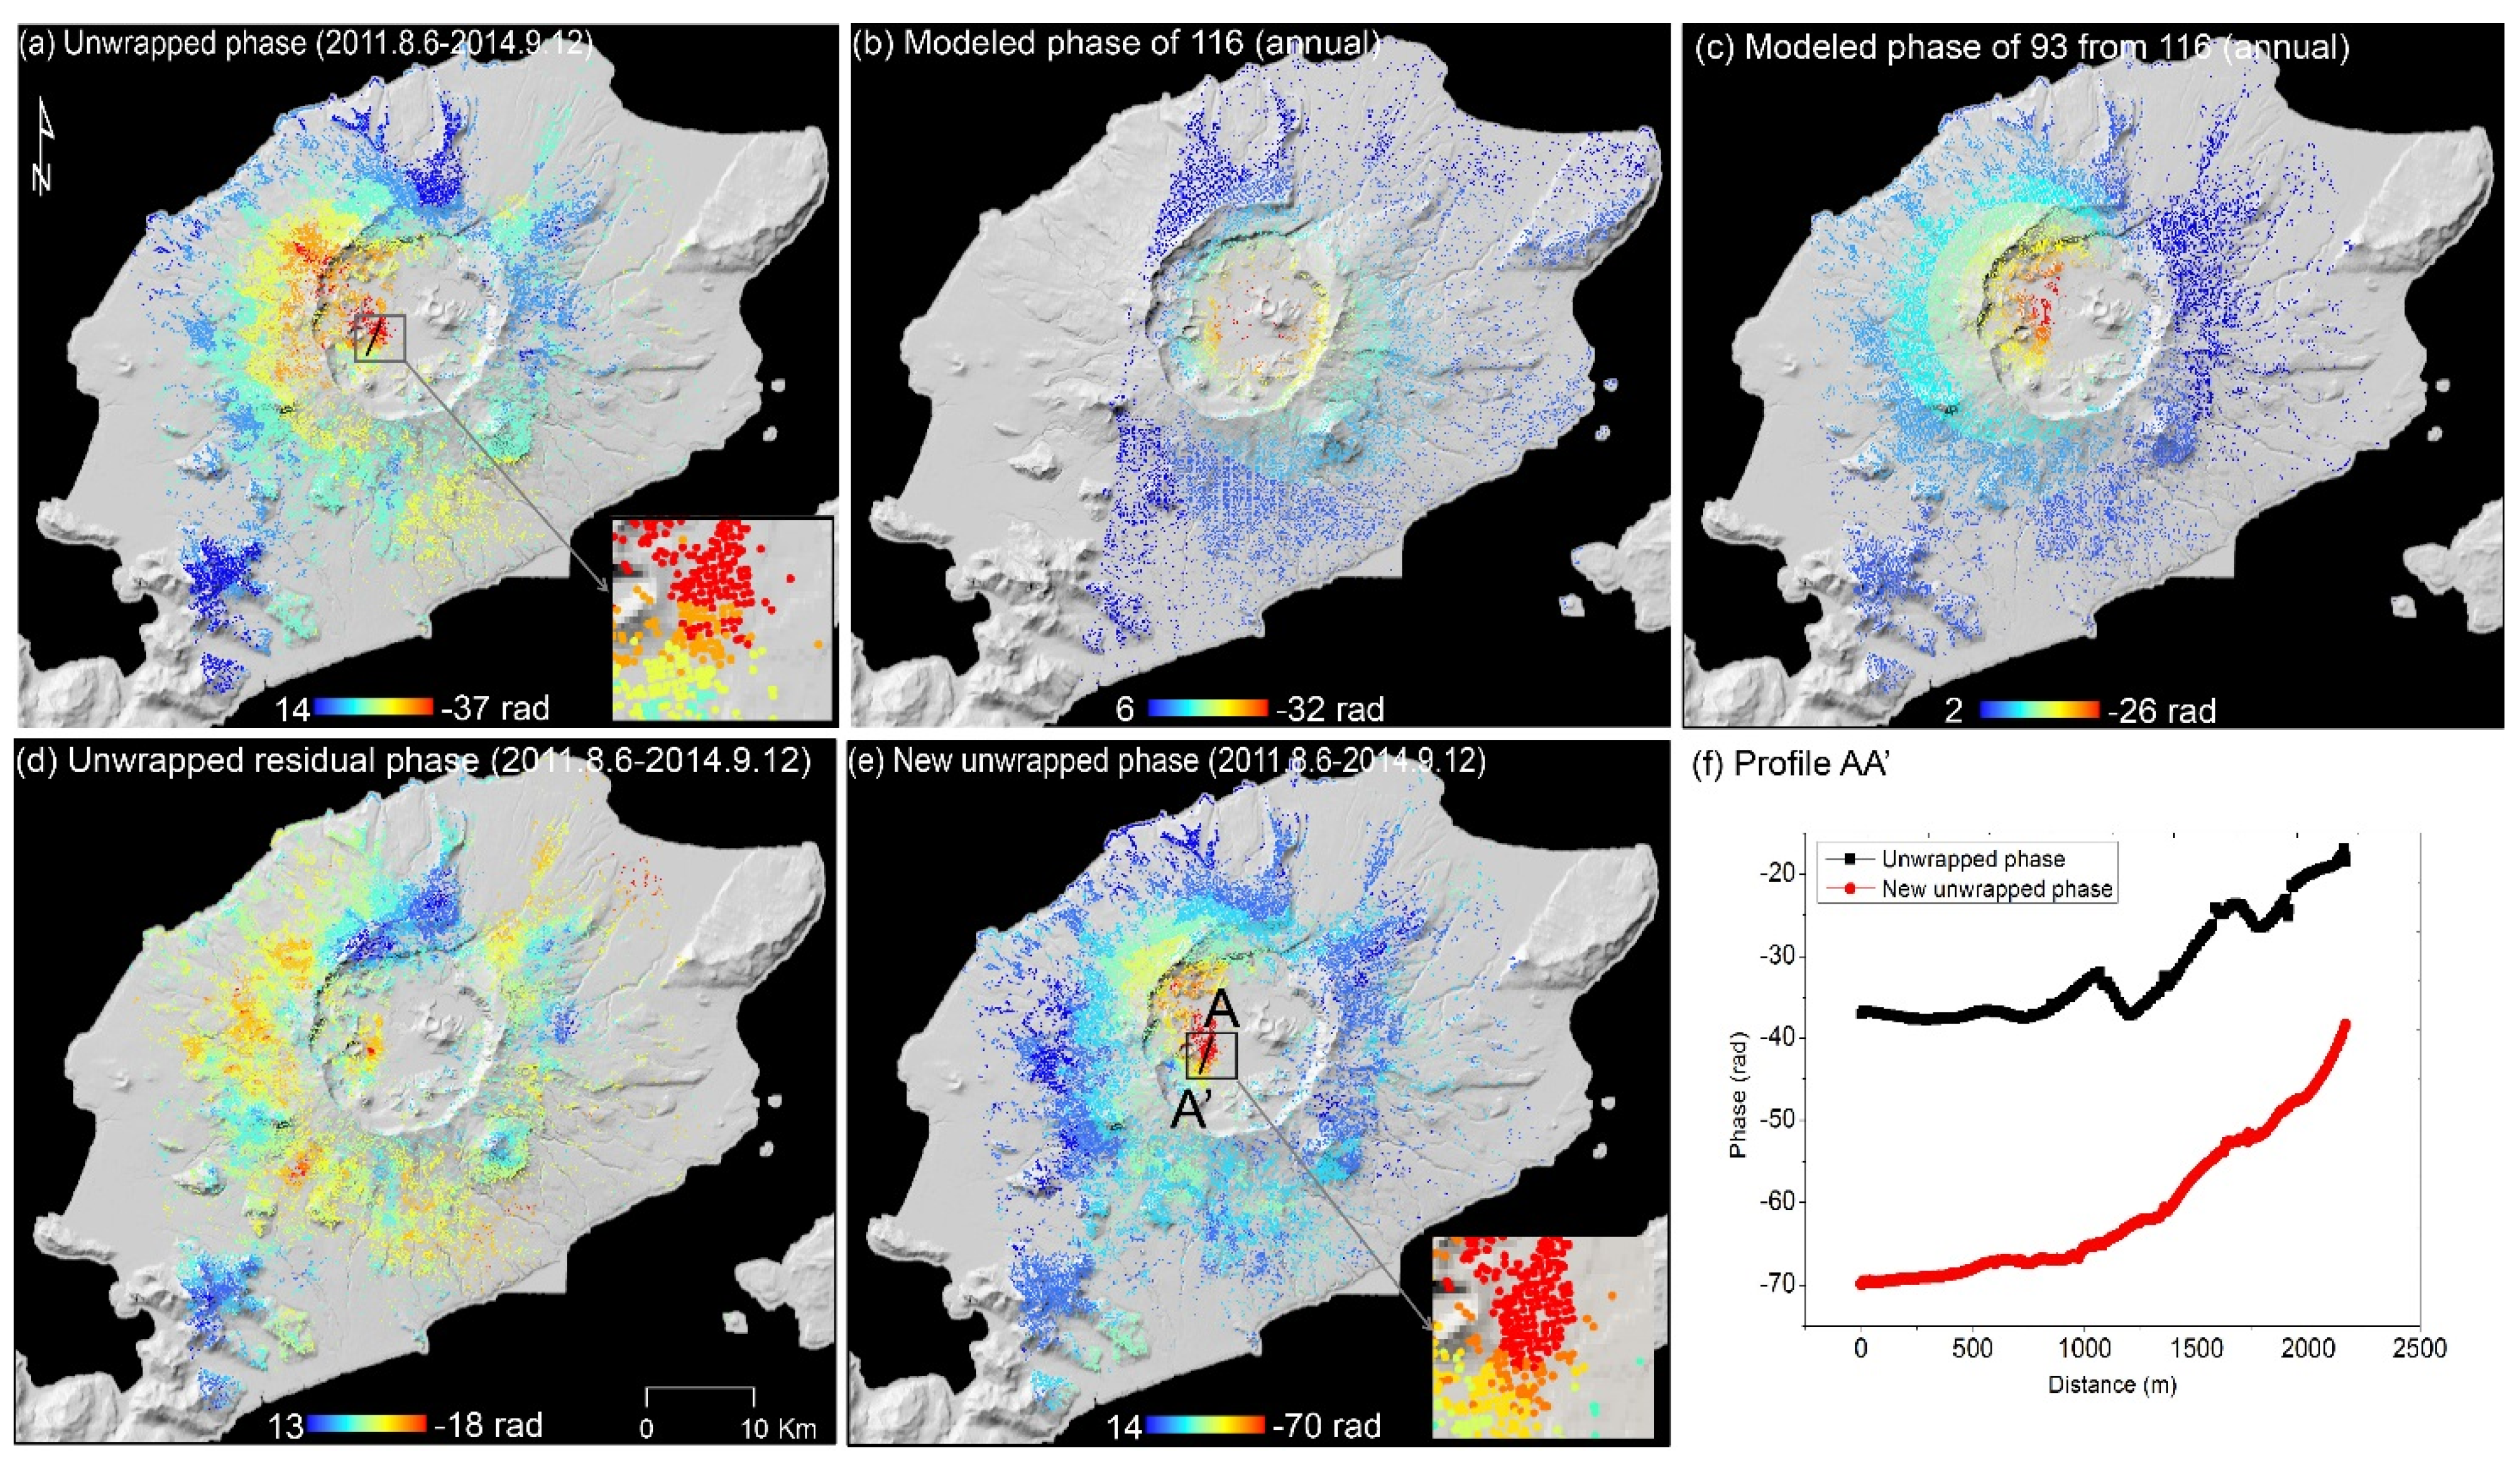
It is obvious that numerous errors were introduced by phase unwrapping of TerraSAR-X track 93 interferograms spanning 2011–2014 (enlargement in
Figure 5a). These errors were caused by large-magnitude deformation that resulted in a high fringe density in a relatively small area, over which unwrapping is difficult. When the deformation rate is relatively steady, one way to quantify unwrapping errors would be to perform the time series inversion and to represent the difference between the original unwrapped phase and the reconstructed unwrapped phase obtained after time series inversion. However, because of the time-variant nature of the observed deformation at Okmok, phase unwrapping based on time-series inversion results skewed the unwrapped phases of X-band interferograms. Therefore, we used a “model-assisted” phase unwrapping strategy to reduce unwrapping errors in long-temporal-baseline interferograms. The TerraSAR-X track 93 interferogram spanning 20110806–20140912 (perpendicular baseline 118 m, temporal baseline 1133 days) is used as an example here. Data from TerraSAR-X track 116 spans a slightly shorter temporal interval between master and slave images. We therefore removed the track 116 modeled deformation (
Figure 4k) from the track 93 interferogram by generating a synthetic interferogram using the track 116 model parameters and the track 93 geometry (
Figure 5b). The modeled source strength was converted from average volume per year to fit the time spanned by the track 93 interferogram, and the synthetic deformation field was sampled to match the location’s PS phase (
Figure 5c). The modeled phase was then subtracted from the interferometric phase, producing a residual with far less phase change than the raw interferogram and making phase unwrapping far less prone to errors (
Figure 5d). The modeled phase was added back to the unwrapped residual phase, resulting in a more reliable unwrapped phase for the interferogram (
Figure 5e).
Figure 5.
(a) Original unwrapped phase of interferogram 20110806–20140912 from TerraSAR track 93, with inset enlarging area marked by black rectangle. (b) Modeled phase from TerraSAR track 116 during the period 2011–2014. (c) Modeled phase for TerraSAR track 93 during 2011–2014 as derived from track 116 model parameters. (d) Unwrapped residual phase for TerraSAR-X track 93 found by subtracting the modelled (c) from the observed (a) phase. (e) New unwrapped phase for interferogram 20110806–20140912 based on addition of residual (d) and modeled (c) phase. (f) LOS deformation along profile A-A’ (e) from unwrapped phase produced using standard (black; part a) and model-assisted (red; part e) techniques.
A profile (A-A’) across the area of densest fringes within the caldera (
Figure 5a,e) highlights the difference in results between the standard and model-assisted unwrapping method. Two phase jumps are obvious in the original unwrapped phase, but no such jumps appear in the model-assisted profile (
Figure 5f). The LOS inflation observed in the TerraSAR-X track 93 interferogram spanning 20110806–20140912 is about 173 mm, which is consistent with the track 116 data spanning a similar cumulative time period (
Figure 4k). After applying this method to the two track 93 interferograms spanning 2011–2014, we used the resulting deformation field to estimate time series deformation.
5. Discussion
Our analysis indicates that the source location responsible for surface deformation at Okmok during 2008–2014 is very close to—effectively the same as—that active before, during, and after the 1997 and 2008 eruptions [
1,
10,
11,
16,
18,
19,
20,
42]. Additionally, similar to deformation trends during 1992–2008, the source strength varied over time during 2008–2014, reflecting changes in the rate of supply to the shallow magma storage zone beneath the volcano. Assuming that deformation was elastic and ignoring any differences in strength or compressibility between the magma reservoir and its host rock, the source volume change associated with the 1997 eruption was 0.047 ± 0.005 km
3 [
16] and that associated with the 2008 eruption was 0.14 ± 0.01 km
3 [
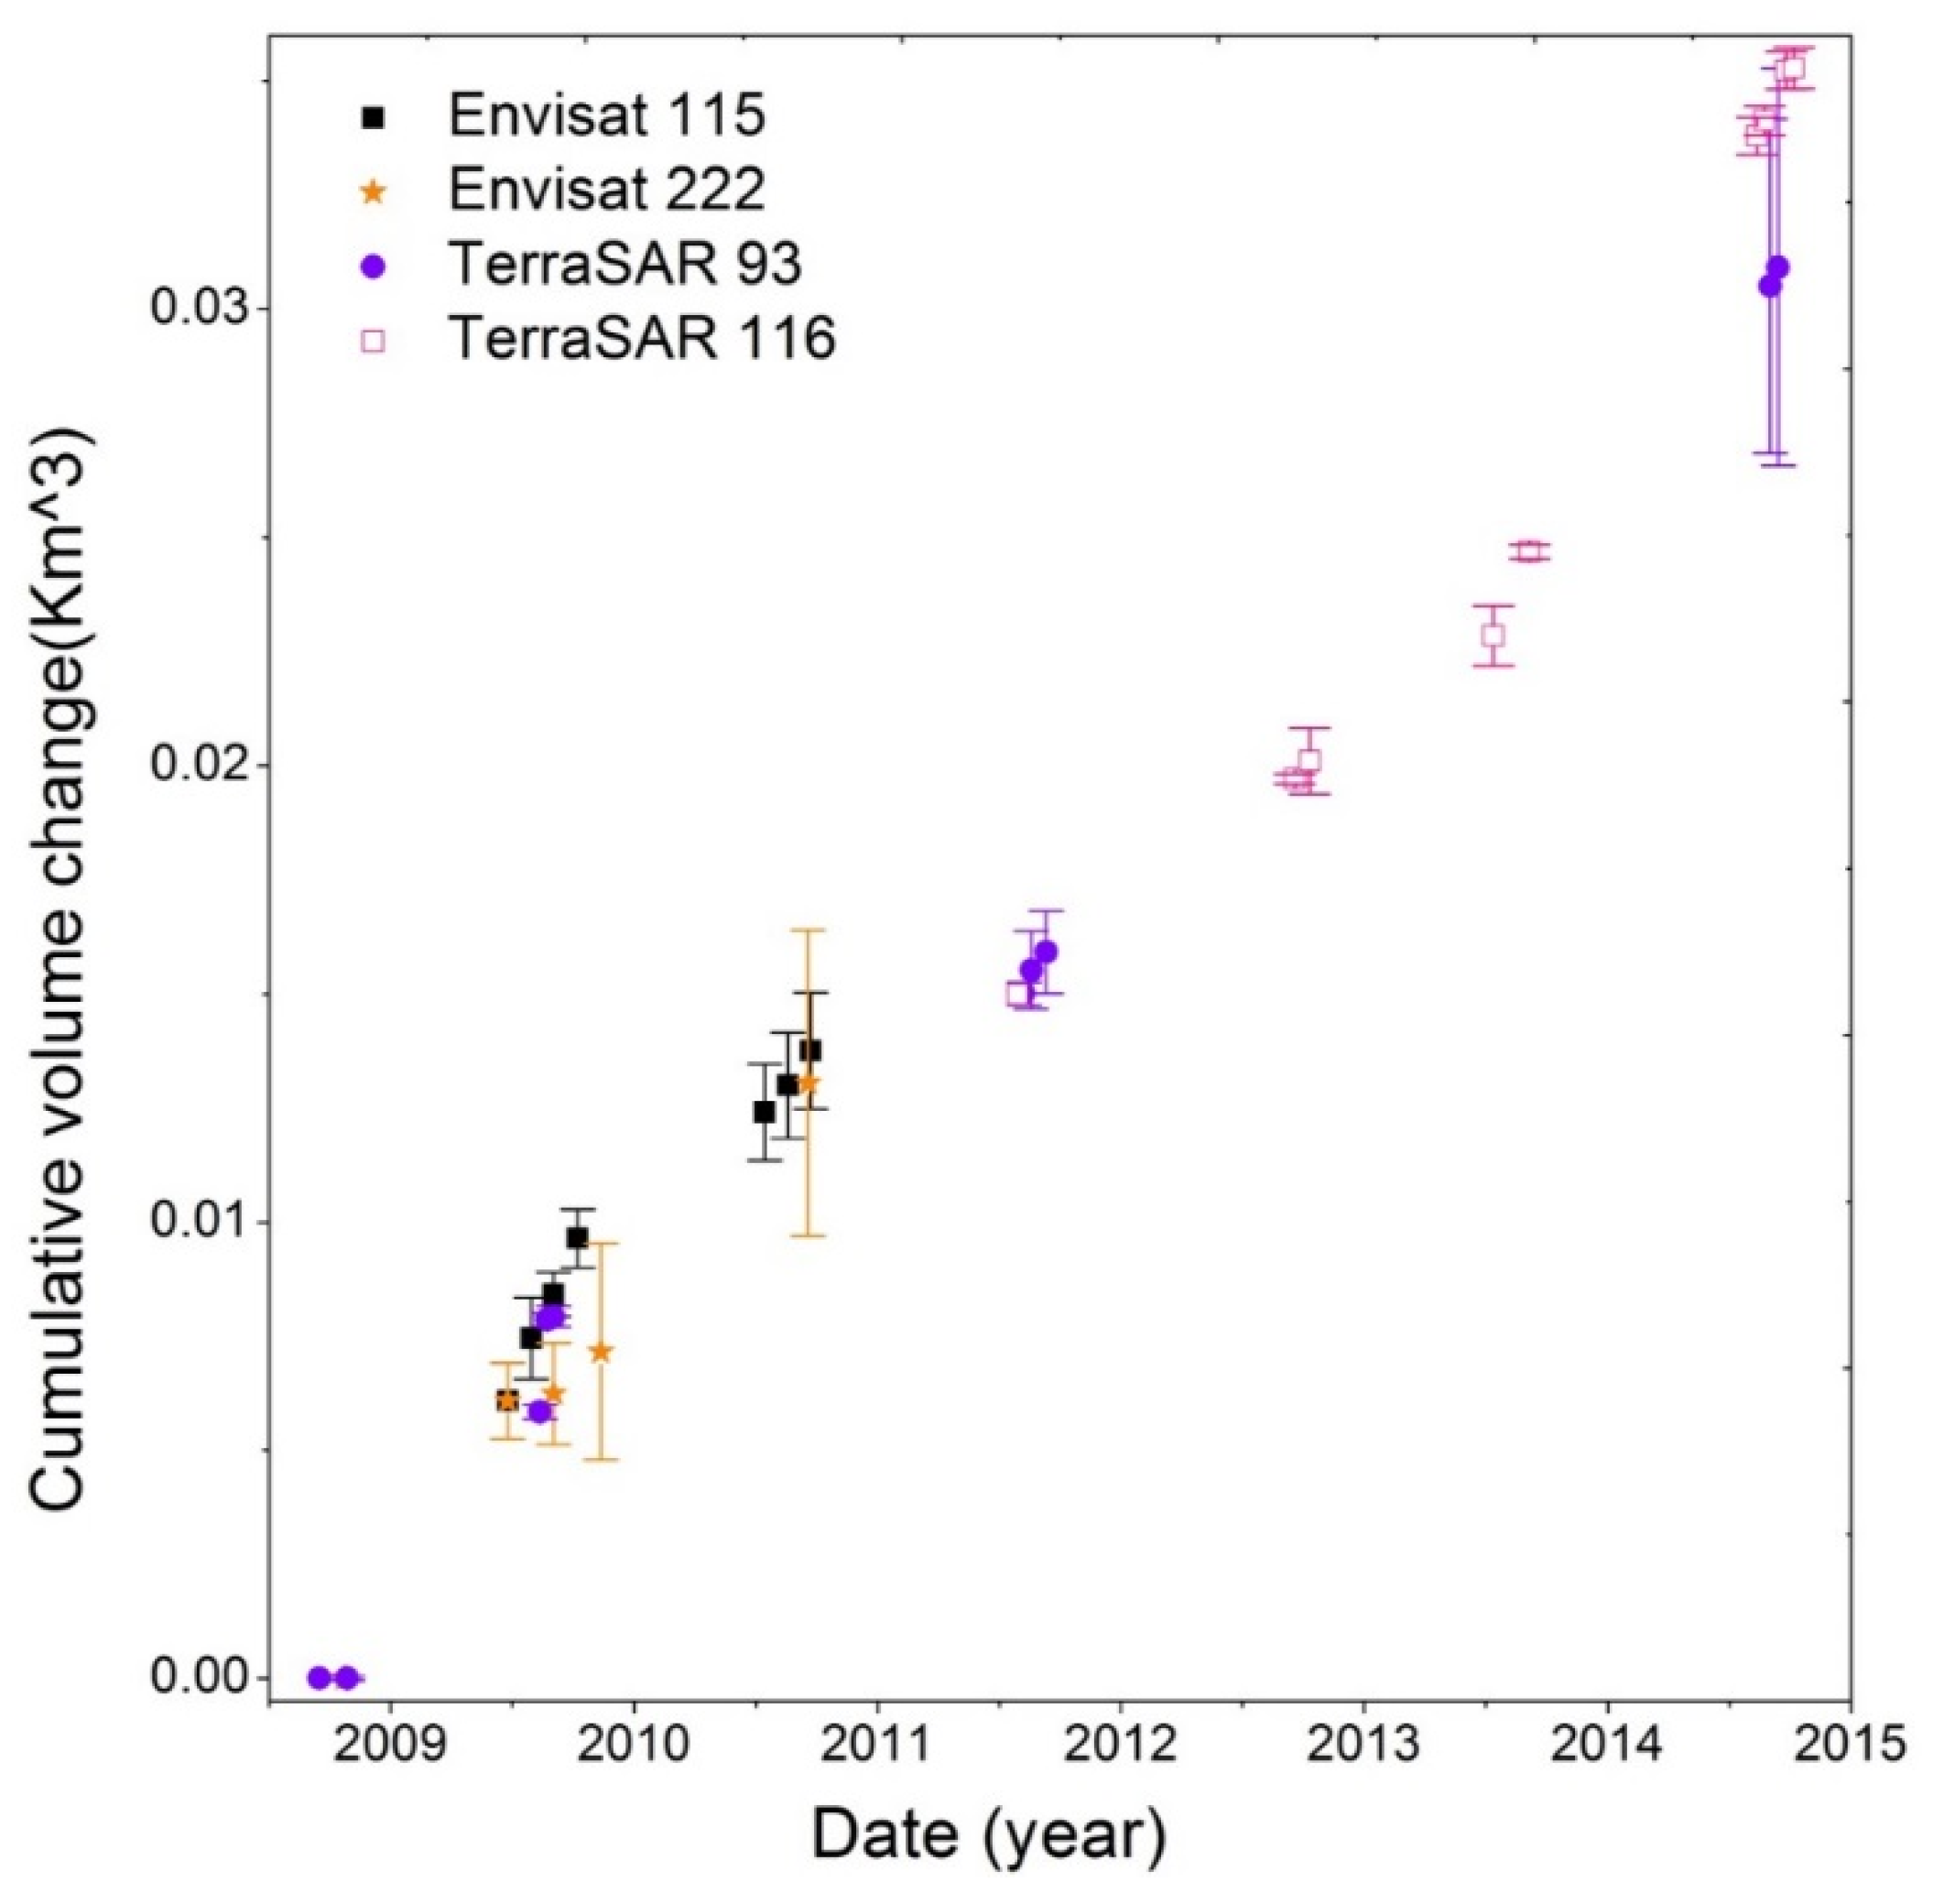
18]. The modeled volume of magma accumulated in the reservoir during 2008–2014 is ~0.035 km
3, which is ~75% of the 1997 eruption volume or ~25% of the 2008 eruption volume. We estimate that the post-2008 refilling rate was about 30% more rapid than the post-1997 refilling rate, which required about nine years to recover a similar volume. It should be noted that the time-varying post-eruption inflations could also be due to magma crystallization and degassing and other factors [
45].
The timing of the onset of inflation following the 2008 eruption is difficult to constrain. Continuous GPS stations were damaged by the eruption, and inflation was occurring by the time site OKCE, near the center of the caldera, was repaired in September 2008 [
11]. Freymueller
et al. [
11] inferred that the reinflation of Okmok began within three weeks of the end of ash emissions (before 11 September 2008) by analyzing the OKCE time series. Three interferograms on independent tracks span time periods immediately after the last ash emission (20 August 2008): 20080820–20080924 (E222), 20080916–20081021(E115), and 20080914–20080925 (T93). None of these interferograms show any signs of broad deflation, but the ENVISAT data show significant decorrelation throughout the caldera. Fortunately, the 11-day TerraSAR-X interferogram spanning 20080914–20080925 is sufficiently coherent to identify ~2–3 mm of LOS inflation, suggesting that post-eruptive inflation started no later than 20080914. This observation and GPS data indicate that the shallow magma body beneath Okmok transitioned from feeding a violent eruption to refilling in a matter of days to weeks.
6. Conclusions
Multi-temporal InSAR processing is used to map deformation of Okmok volcano after the end of the 2008 eruption, constraining the time series of surface displacements by minimizing artifacts that plague conventional interferograms and compensating for poor coherence. InSAR imagery from the C-band Envisat and X-band TerraSAR-X satellites indicate that Okmok started inflating soon after the end of 2008 eruption at a variable rate of ~48–130 mm/y, consistent with GPS measurements. A “model-assisted” phase unwrapping method was used to unwrap long-temporal-baseline interferograms, which solved unwrapping problems associated with areas of dense fringes. A Mogi point pressure source in an elastic half-space provides a good fit to the deformation time series and suggests shallow magma storage ~3.9 km below sea level near the center of Okmok caldera, which is essentially the same location responsible for uplift and subsidence during 1992–2008. Magma accumulation beneath Okmok has occurred at a variable rate, initially high after the 2008 eruption, slightly lower during 2010–2013, and high again during 2013–2014. The modeled volume of magma accumulation during 2008–2014 is ~0.035 km3, which is approximately 75% of the 1997 eruption volume and 25% of the 2008 eruption volume.
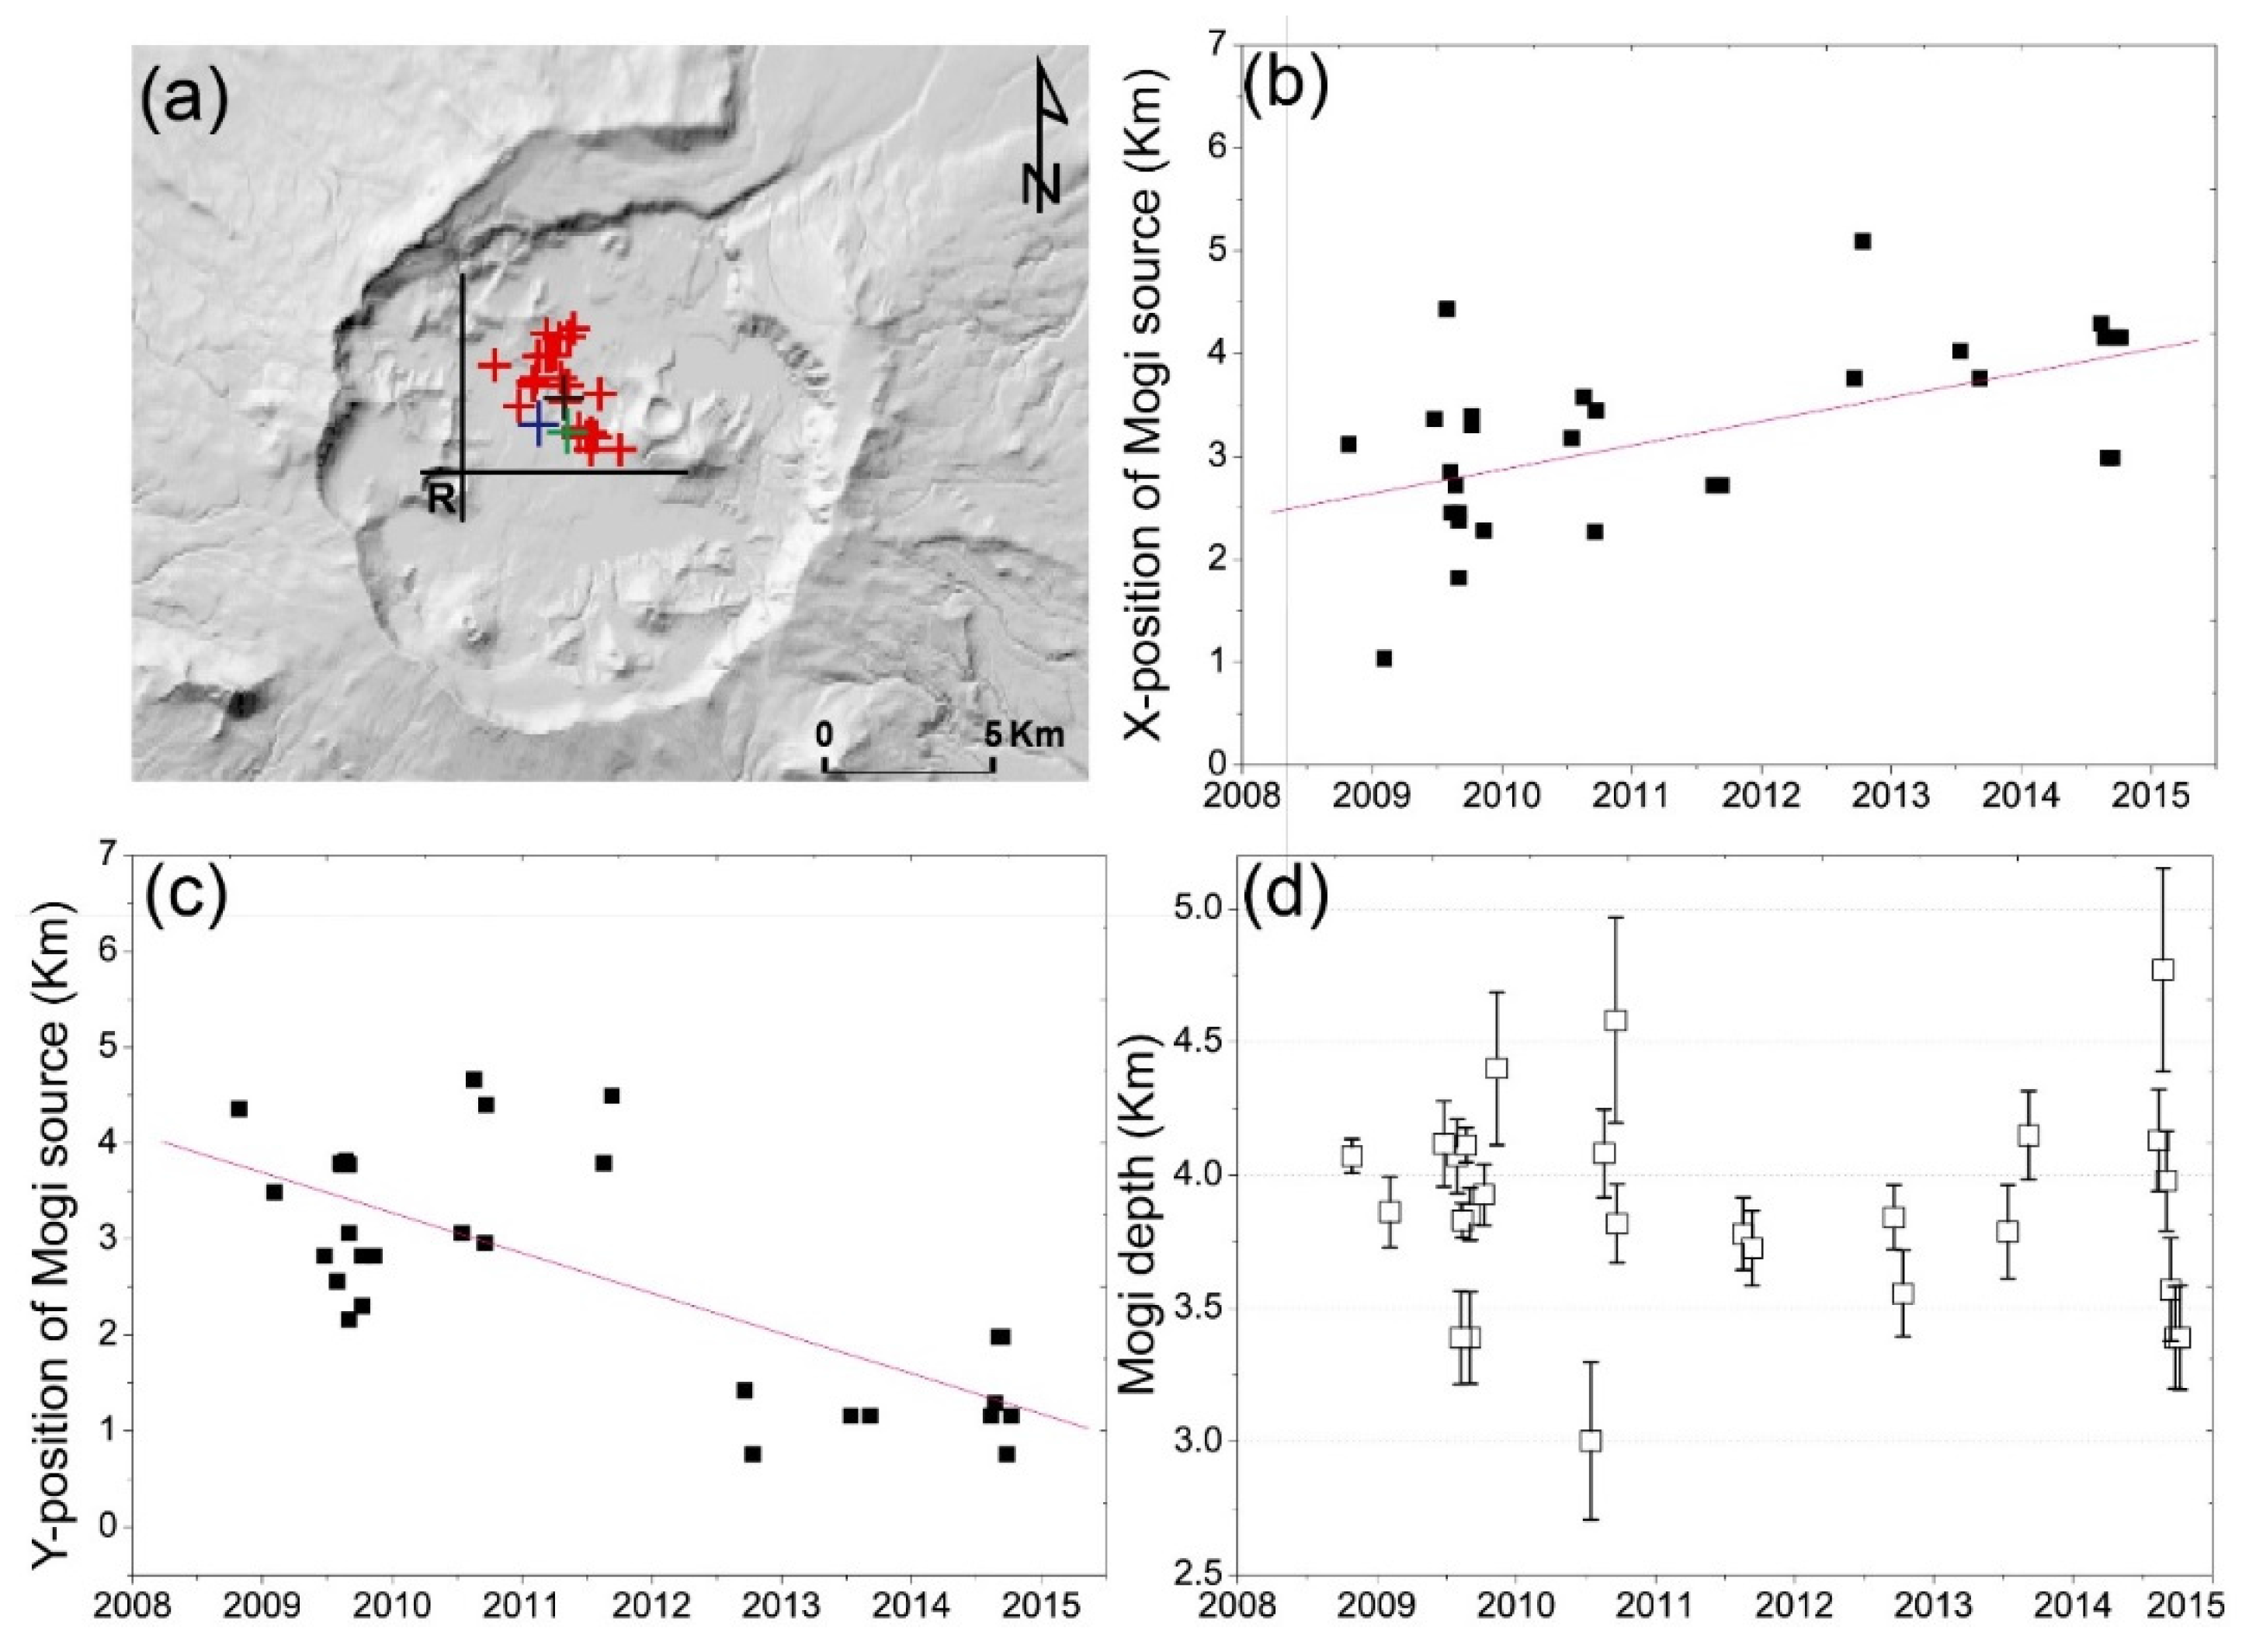
The MTI technique used in this study has enabled us to conduct the latest InSAR analysis for the post-eruption deformation trend of Okmok caldera. However, the apparent trends in both X and Y directions of the estimated shallow magma source position need further investigation. The offset in the position of maximum LOS displacement rate on the caldera between ascending and descending geometries indicate that there is horizontal displacement. Thus, the three-dimensional position of the source will be investigated in the further study when we have some new radar satellites (Sentinel-1, TerraSAR-X, and ALOS PALSAR-2) involved in our study.


 ,
, 


