1. Introduction
The seismic vulnerability assessment of urban environments is an operational issue that concerns the comprehensive knowledge about both geometrical and structural building features, as well as soil geophysical parameters. It represents a very challenging task, especially for areas prone to natural and/or anthropogenic disasters (e.g., earthquakes, landslides, fires, flooding, and so on) [
1,
2]. The issue of urban assessment is essentially identifying a methodology able to process and classify the original data taking into account the different spatial scales, the geometrical features, and the properties of heterogeneous materials used within urban areas. It can provide value-added information to support several application fields, such as the local mapping of built up areas and structures, the material and biotope mapping, the identification of hazardous materials, and the change detection at the building/material level. In this framework, a multi-disciplinary approach should be used to provide both an effective assessment of urban resources and synthetic parameters for managing pre- and post-crisis events, restoration activities, and search and rescue operations [
2,
3].
It is worth noting that the vulnerability assessment of seismically-prone urban areas is an ill-structured problem,
i.e., it has multiple solutions and contains uncertainties about the concepts, the rules, and the principles aimed at reaching meaningful results [
4,
5]. In this regard, some limitations must be taken into account, such as the lack of both appropriate large data volumes and reliable methods able to describe urban environments and seismic phenomena. Moreover, the ongoing difficulty to fulfill user requirements and provide consistent results, easily understandable and manageable by several stakeholders (
i.e., indexes, maps, or synthetic descriptors of the seismic assessment), still represents an open issue [
5]. Along with this rationale, a holistic approach could be suitable to effectively meet the requirements of a multi-scale vulnerability reduction strategy and overcome the above-mentioned constraints [
6,
7]. In detail, the joint use of urban environment information, urban changing conditions, and site seismic effects might be needed to accomplish this task [
8].
Within such a framework, airborne remote sensing and geographic information systems (GIS) represent key tools able to supply specific monitoring needs for seismic mitigation purposes.
On the one hand, airborne remote sensing sensors and techniques can offer different technological solutions (in temporal, spatial, and spectral domains), which can adequately address vulnerability concepts and corresponding application fields [
9]. They allow gathering sub-meter spatial resolution, real-time and near-real-time operability, daily revisit-time, and sub-meter measurement accuracy. In addition, the sensor maintenance, repairing, and scheduling make the airborne remote sensing a very operational solution beyond some inherent limitations (e.g., the weather conditions, the high cost per unit area of ground coverage, the turnaround time, and the platform stability). In this context, Light Detection and Ranging (LiDAR) and hyperspectral sensors have demonstrated to be powerful active and passive remote sensing tools, respectively. Their joint use can provide value-added parameters for the three-dimensional (3D) analysis of urbanized areas in terms of topographic settings (e.g., terrain height and slope, land cover and land use mapping), building properties (e.g., building height, typology, coverage, density, and distribution) and road characteristics (e.g., size, blockage, and practicability) [
10].
On the other hand, GIS platforms represent key software solutions able to manage remote sensing products through powerful spatial and temporal approaches for vulnerability assessment analysis [
11,
12]. They offer several benefits in terms of time-consuming and spatial processing analysis, user-friendly interfaces, as well as the collection, the management, and the integration of heterogeneous data represented as overlapping/interconnected layers.
On these bases, the joint use of airborne remotely-sensed measurements and GIS tools could be very useful for multi-risk assessment purposes. In fact, the exploitation and the availability of airborne remotely-sensed measurements (e.g., hyperspectral ones) would offer several potentialities and possibilities for the seismic vulnerability mitigation of urban areas, especially considering the actual lack of widely and freely available high-resolution space-borne remote sensing imagery. Moreover, one of the best ways to convey information at urban managers, decision-makers, and other stakeholders, is the use of thematic maps able to identify, locate, and characterize interesting objects and materials, with high resolution and accuracy. Accordingly, remote sensing and GIS experts are challenged to design procedures able to extract different “sensor-independent” maps for a wide range of urban applications (e.g., mapping, monitoring, security, and emergency preparedness).
Based on this rationale, in this study, the operational benefits obtained by combining airborne LiDAR and hyperspectral measurements within a GIS platform are shown to support the vulnerability assessment of urban seismic areas. In detail, airborne LiDAR measurements are used to provide the digital elevation models, as well as the geometrical characteristics of both buildings and roads. Moreover, airborne hyperspectral information is used to improve the basic knowledge of the urban area through the analysis of its spectral content, performed by supervised classification algorithms. The products provided by LiDAR and hyperspectral image processing analyses are then combined within a GIS platform to evaluate the intrinsic properties of buildings (e.g., perimeter, area, height, and type of roofs) and roads (e.g., width and position, with respect to the buildings) together with the topographic features of the surrounding area (e.g., morphology and slope). The objective of the proposed approach is providing synthetic parameters and thematic maps for: (i) the identification of steep slope areas for topographic assessment purposes; (ii) the analysis of building roof typology for supporting the evaluation of structural load conditions, together with the detection of critical structures (e.g., asbestos roofs); and (iii) the identification and the analysis of primary road conditions for supporting search and rescue operations, especially after building collapses. Experimental results are gathered for the historical center of Cosenza, Italy, to show the benefits of the proposed approach for seismic assessment and mitigation purposes.
The paper is organized as follows. In
Section 2, the test area is presented. In
Section 3, the airborne remote sensing techniques and sensors used in this study are described. In
Section 4, the methodology that is proposed to integrate active and passive remotely-sensed measurements for supporting seismic vulnerability assessment analysis, is presented. In
Section 5, some meaningful experimental results are provided and discussed for the case study of Cosenza in the Calabria Region, Italy. Finally some thoughtful conclusions are drawn in
Section 6.
2. Case Study
The case study is the urban area of Cosenza city (South Italy), which is one of the most important municipalities within the Calabria Region with a population of about 70,000 people and a density of 1800/km2. Cosenza is the administrative center of the homonymous province, which includes a great number of municipalities (about 155) and occupies the entire central and northern part of the region. It comprises a great number of mobility and transport facilities, such as the main junctions of the Calabria road systems (e.g., the motorway A3 Salerno-Reggio Calabria) and the connections to the other provinces of the region.
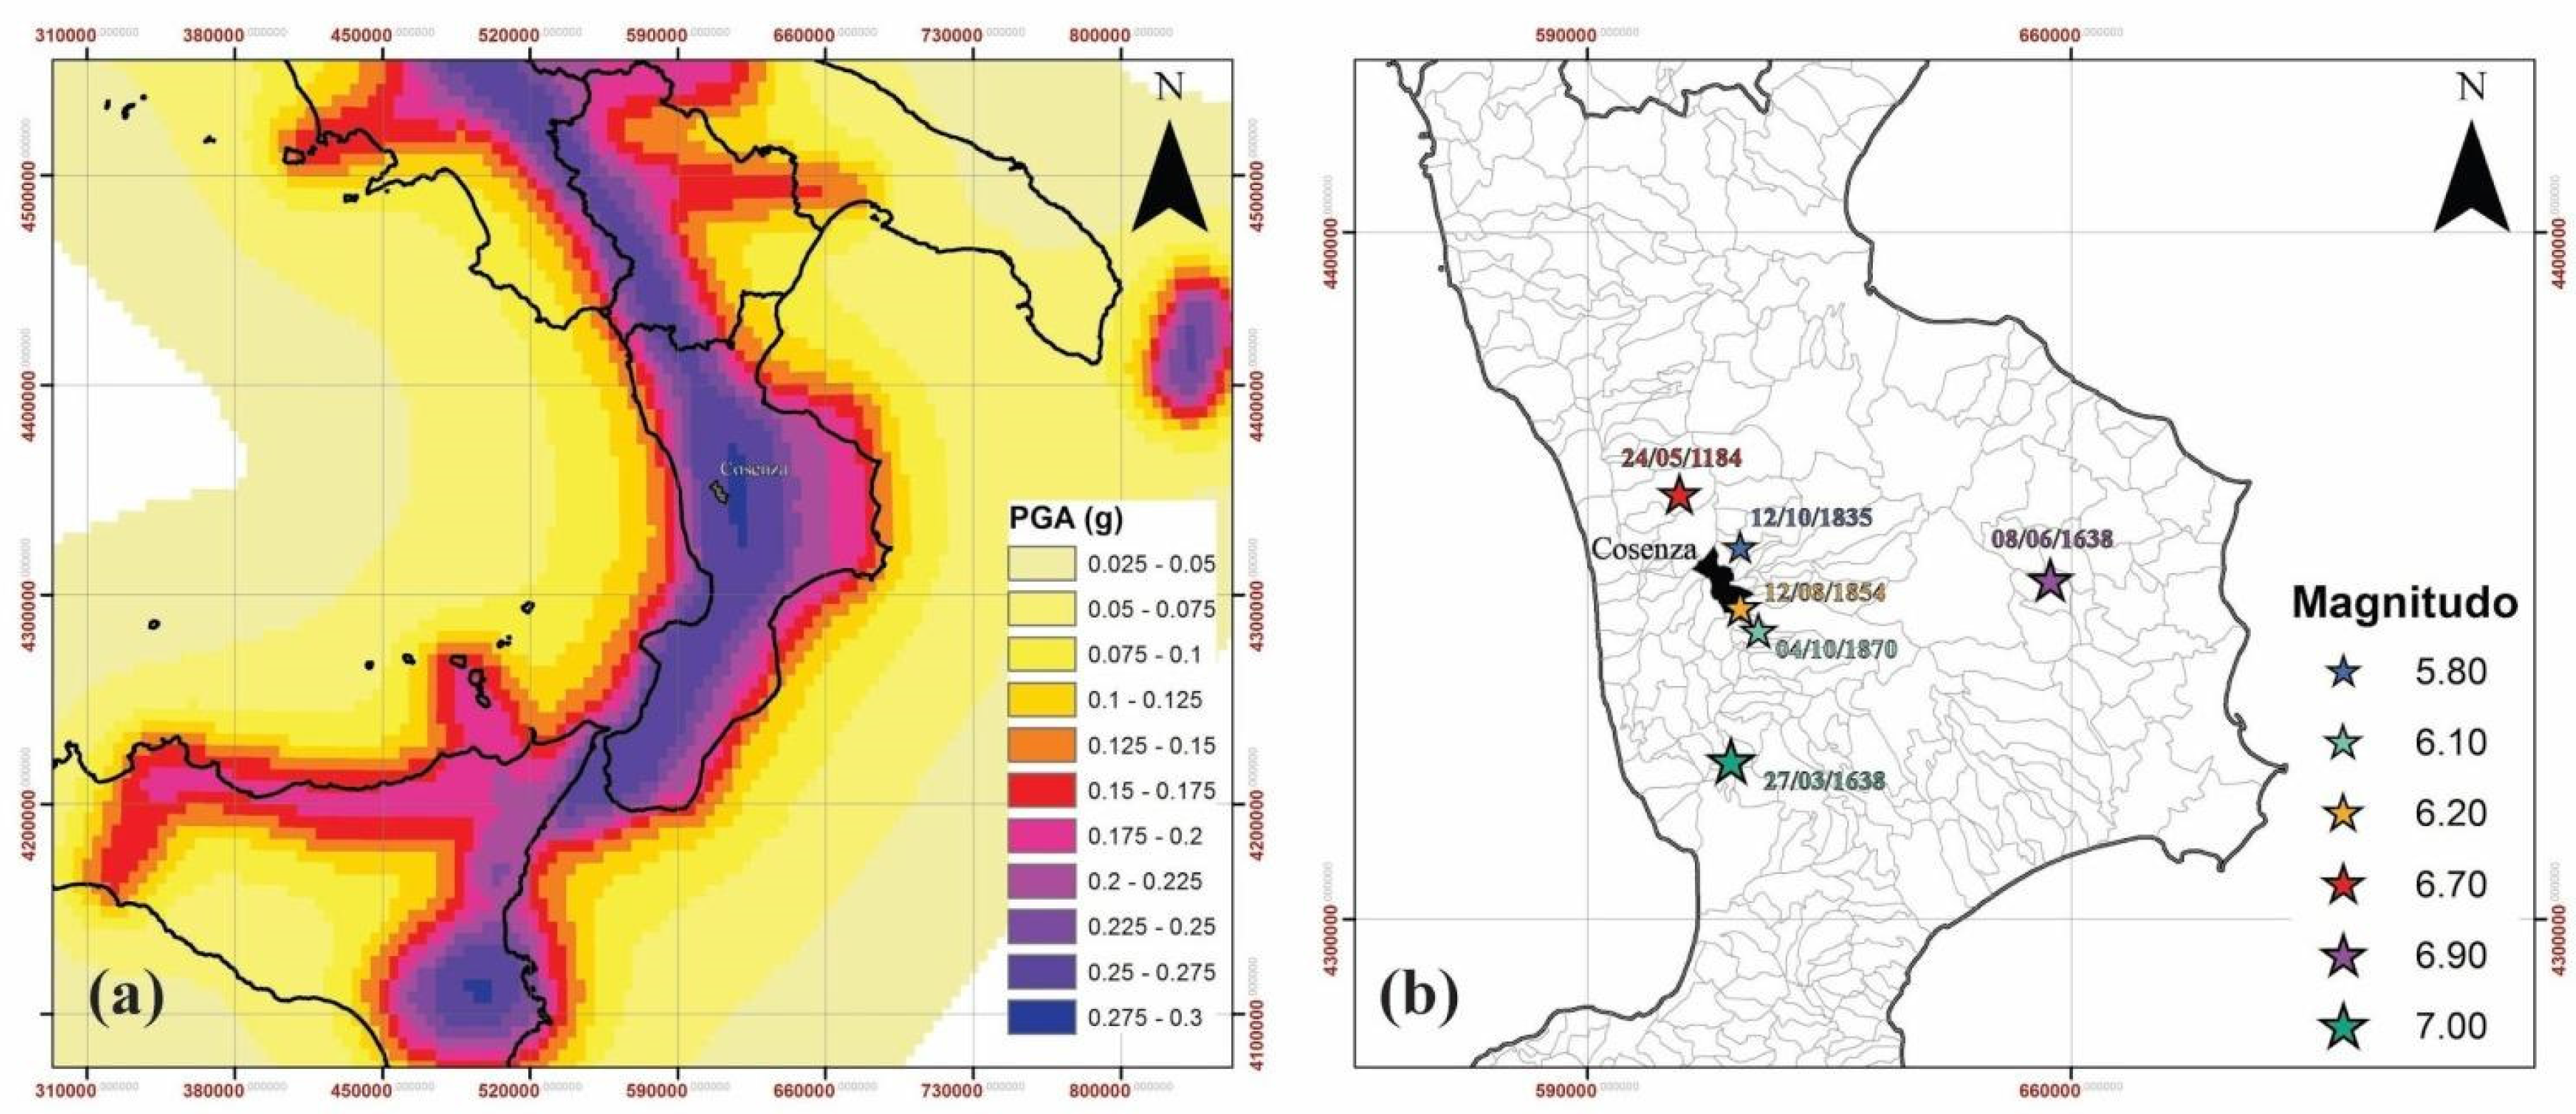
From the morphological viewpoint, the Cosenza urban area is located in a large valley at the confluence of two rivers (the Busento and the Crati) between the Sila plateau and the coastal range of mountains in the north of the region. The whole urbanized area is built between a flat area and surrounding hills, representing the more recent buildings and the ancient nucleus, respectively. The old town, dominated by its Norman castle, descends from the hilly area to the Crati river valley. The elevation of the terrain varies from about 220 m above the sea level, in the valley, up to 460 m, over the surrounding hills. The municipal territory falls in one of the most hazardous seismic areas of Italy (
Figure 1a), insomuch as the wide historical center of Cosenza has been subject to several architectural and structural renovations due to earthquake damages. In fact, the geological and topographic settings, combined to the fragility of built-up areas, have exposed the city to the seismic effects over the years, as witnessed during strong earthquakes occurred in Calabria on 1184, 1638, 1835, 1854, and 1870 [
13]. The
Figure 1b shows the distribution of these earthquakes, demonstrating that Cosenza suffered damage for seismic events with medium-to-high magnitude and epicentral distances between a few to tens of kilometers from the built-up area [
14]. This makes the whole area an interesting test case for structural and environmental monitoring studies.
Within such a framework, the proposed work aims at assessing the topographic settings and the building features of the Cosenza urban area, which can be used to support deeper seismic assessment analyses. The research activity and the results presented in this study match the project objectives of Programma Operativo Nazionale (PON) MASSIMO, namely Monitoraggio in Area Sismica di SIstemi MOnumentali. The scope of this project is the development of a multi-sensor (i.e., in situ measurements, ground-based, airborne and space-borne platforms), multi-disciplinary (i.e., environmental and infrastructural analysis) investigation methodology for the multi-temporal and the multi-spatial monitoring of cultural heritages in response to seismic stress.
Figure 1.
(
a) Map of the peak ground acceleration values (PGA, g) with 10% probability of being exceeded in 50 years (modified by [
15]). (
b) Map of the epicenters referred to the historical earthquakes, which produced damage to the built-up area of Cosenza.
Figure 1.
(
a) Map of the peak ground acceleration values (PGA, g) with 10% probability of being exceeded in 50 years (modified by [
15]). (
b) Map of the epicenters referred to the historical earthquakes, which produced damage to the built-up area of Cosenza.
3. Sensors and Survey Techniques
In this section, the description of the physical principles at the basis of the proposed techniques (i.e., airborne LiDAR and hyperspectral remote sensing) is provided, together with the technical specifications of each sensor used in this study.
3.1. Airborne LIDAR Remote Sensing
Airborne LiDAR is a powerful remote sensing technology, which is widely used in literature for the 3D measurement and mapping of elevation about Earth’s surface and objects, with high vertical and temporal accuracies [
16]. It uses a laser scanner transmitting up to 400,000 pulses of light per second, which records the time delay between a light pulse transmission and reception to calculate elevation values of surface targets. The latter are integrated with both information from the aircraft’s Global Positioning System (GPS) and orientation (pitch, roll, and yaw) data from inertial measurement technology. The final output is a point cloud data representing the elevation of located targets, each one recorded with precise position, elevation, and other attribute values [
16]. Some interesting products, provided by airborne LiDAR measurements, include the digital terrain model (DTM) and the digital surface model (DSM) of observed scenarios.
In this study work, the airborne LiDAR survey is carried out with the RIEGL LMS-Q680i sensor (Horn, Lower Austria, Austria). It is able to interface with the GNSS/INS NOVATEL SPAN/SE receiver (Calgary, AB, Canada), providing continuous position and altitude of surface targets even when satellite signals are blocked. For each received pulse, the sensor provides information of both position and radiometric intensity.
The airborne LiDAR data have been, firstly, pre-processed through the dedicated RIEGL
© software package to extract the unclassified point clouds from received light pulses. Therefore, following the removal of point cloud outliers (both low- and high-altitude points), the point-cloud classification has been performed by the Terrascan
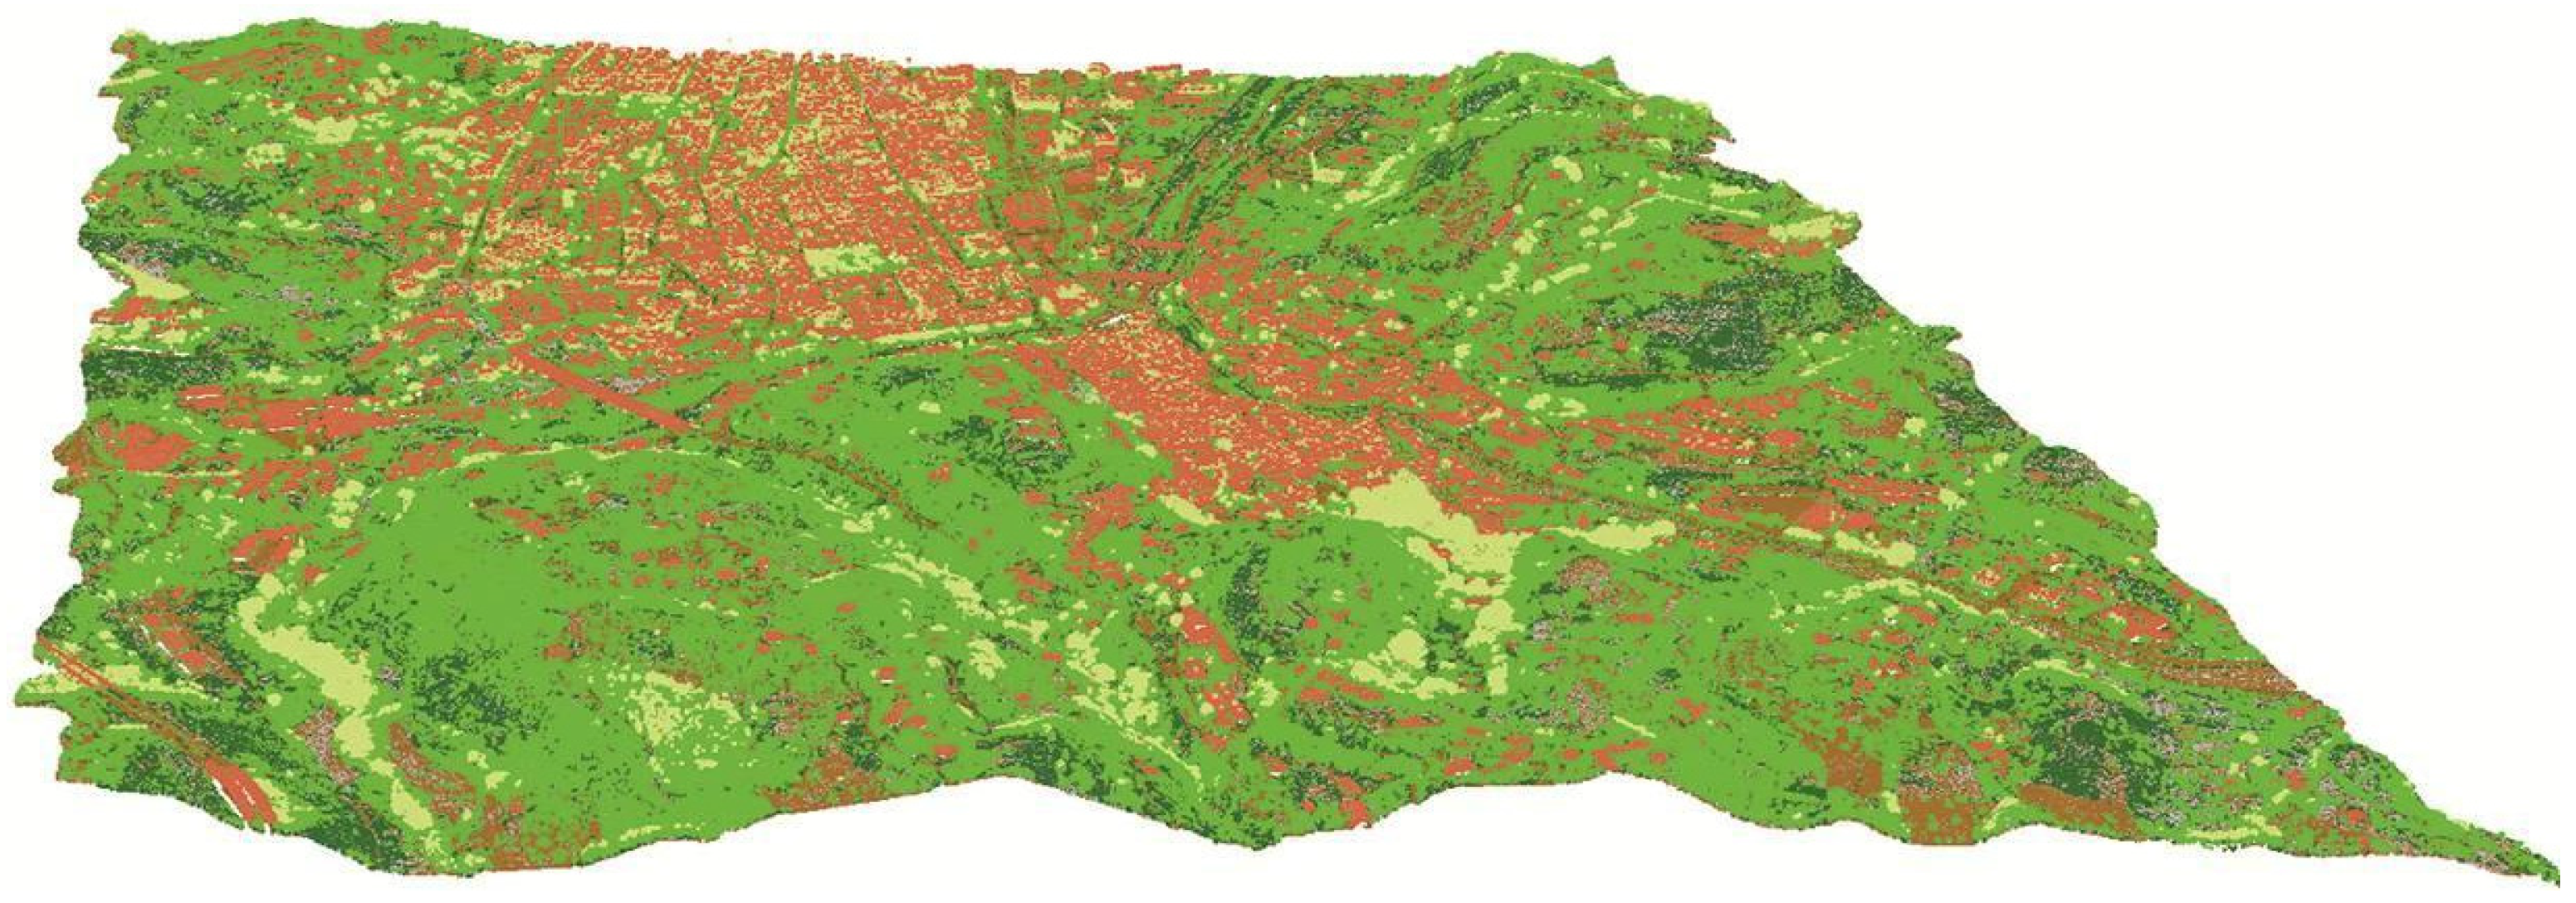
© software package to distinguish vegetation, buildings, ground, and model key points. In
Figure 2 it is provided the 3D LiDAR-based point clouds of the Cosenza urban area, referred to the classification schemes defined by American Society for Photogrammetry and Remote Sensing (ASPRS) for the data category. The classification map, projected over the 3D topographic profile of the case study, allows identifying and detecting the vegetated areas against the urbanized features of Cosenza city (see green and orange point clouds, respectively, in
Figure 2).
Figure 2.
Classification LiDAR-based point clouds of the Cosenza urban area.
Figure 2.
Classification LiDAR-based point clouds of the Cosenza urban area.
3.2. Airborne Hyperspectral Remote Sensing
Airborne hyperspectral remote sensing represents a valuable source to extract detailed information about Earth surface phenomena and objects through the analysis of their spectral features. In addition to the benefits provided by using airborne platforms, hyperspectral technology makes use of visible, near-infrared, and short-wave infrared sensors to form images of the Earth’s surface by detecting the solar radiation reflected from targets on the ground [
17]. Different materials reflect and absorb differently the sunlight illumination at different wavelengths, thus providing different spectral signatures in remote sensing images. Hyperspectral sensors are characterized by a very high spectral resolution that usually results in hundreds of narrow spectral channels. The latter allow gathering a better characterization of targets without any prior knowledge of observed areas [
18]. However, the analysis of hyperspectral imaging data is very complex due to the large spatial variability of the signature for each land cover category, as well as the atmospheric effects and the huge band dimensionality. Conversely, the recent technological advances have enabled hyperspectral imagery with spatial coverage up to 10-km scales, high spatial resolution up to sub-meter scale, hundreds of bands, and daily revisit-time [
19,
20]. These advances make the data suitable to support land-monitoring analysis for vulnerability mitigation purposes.
In this work, IMSpectorV10E visible and near-infrared (VNIR) measurements have been acquired by the airborne IPERGEO sensor and then processed through supervised classification algorithms for the land-use and the land-cover mapping of the Cosenza urban area. This analysis allows supporting the understanding and the formulation of vulnerability assessment procedures for seismic mitigation purposes. The system is mounted onboard of an airborne platform that flies at an altitude of about 500 m. Referring to the VNIR hyperspectral working range, the sensor provides the sample spectrum in 503 bands, with a nominal bandwidth of 2 nm covering a spectral range of 400–1000 nm.
An
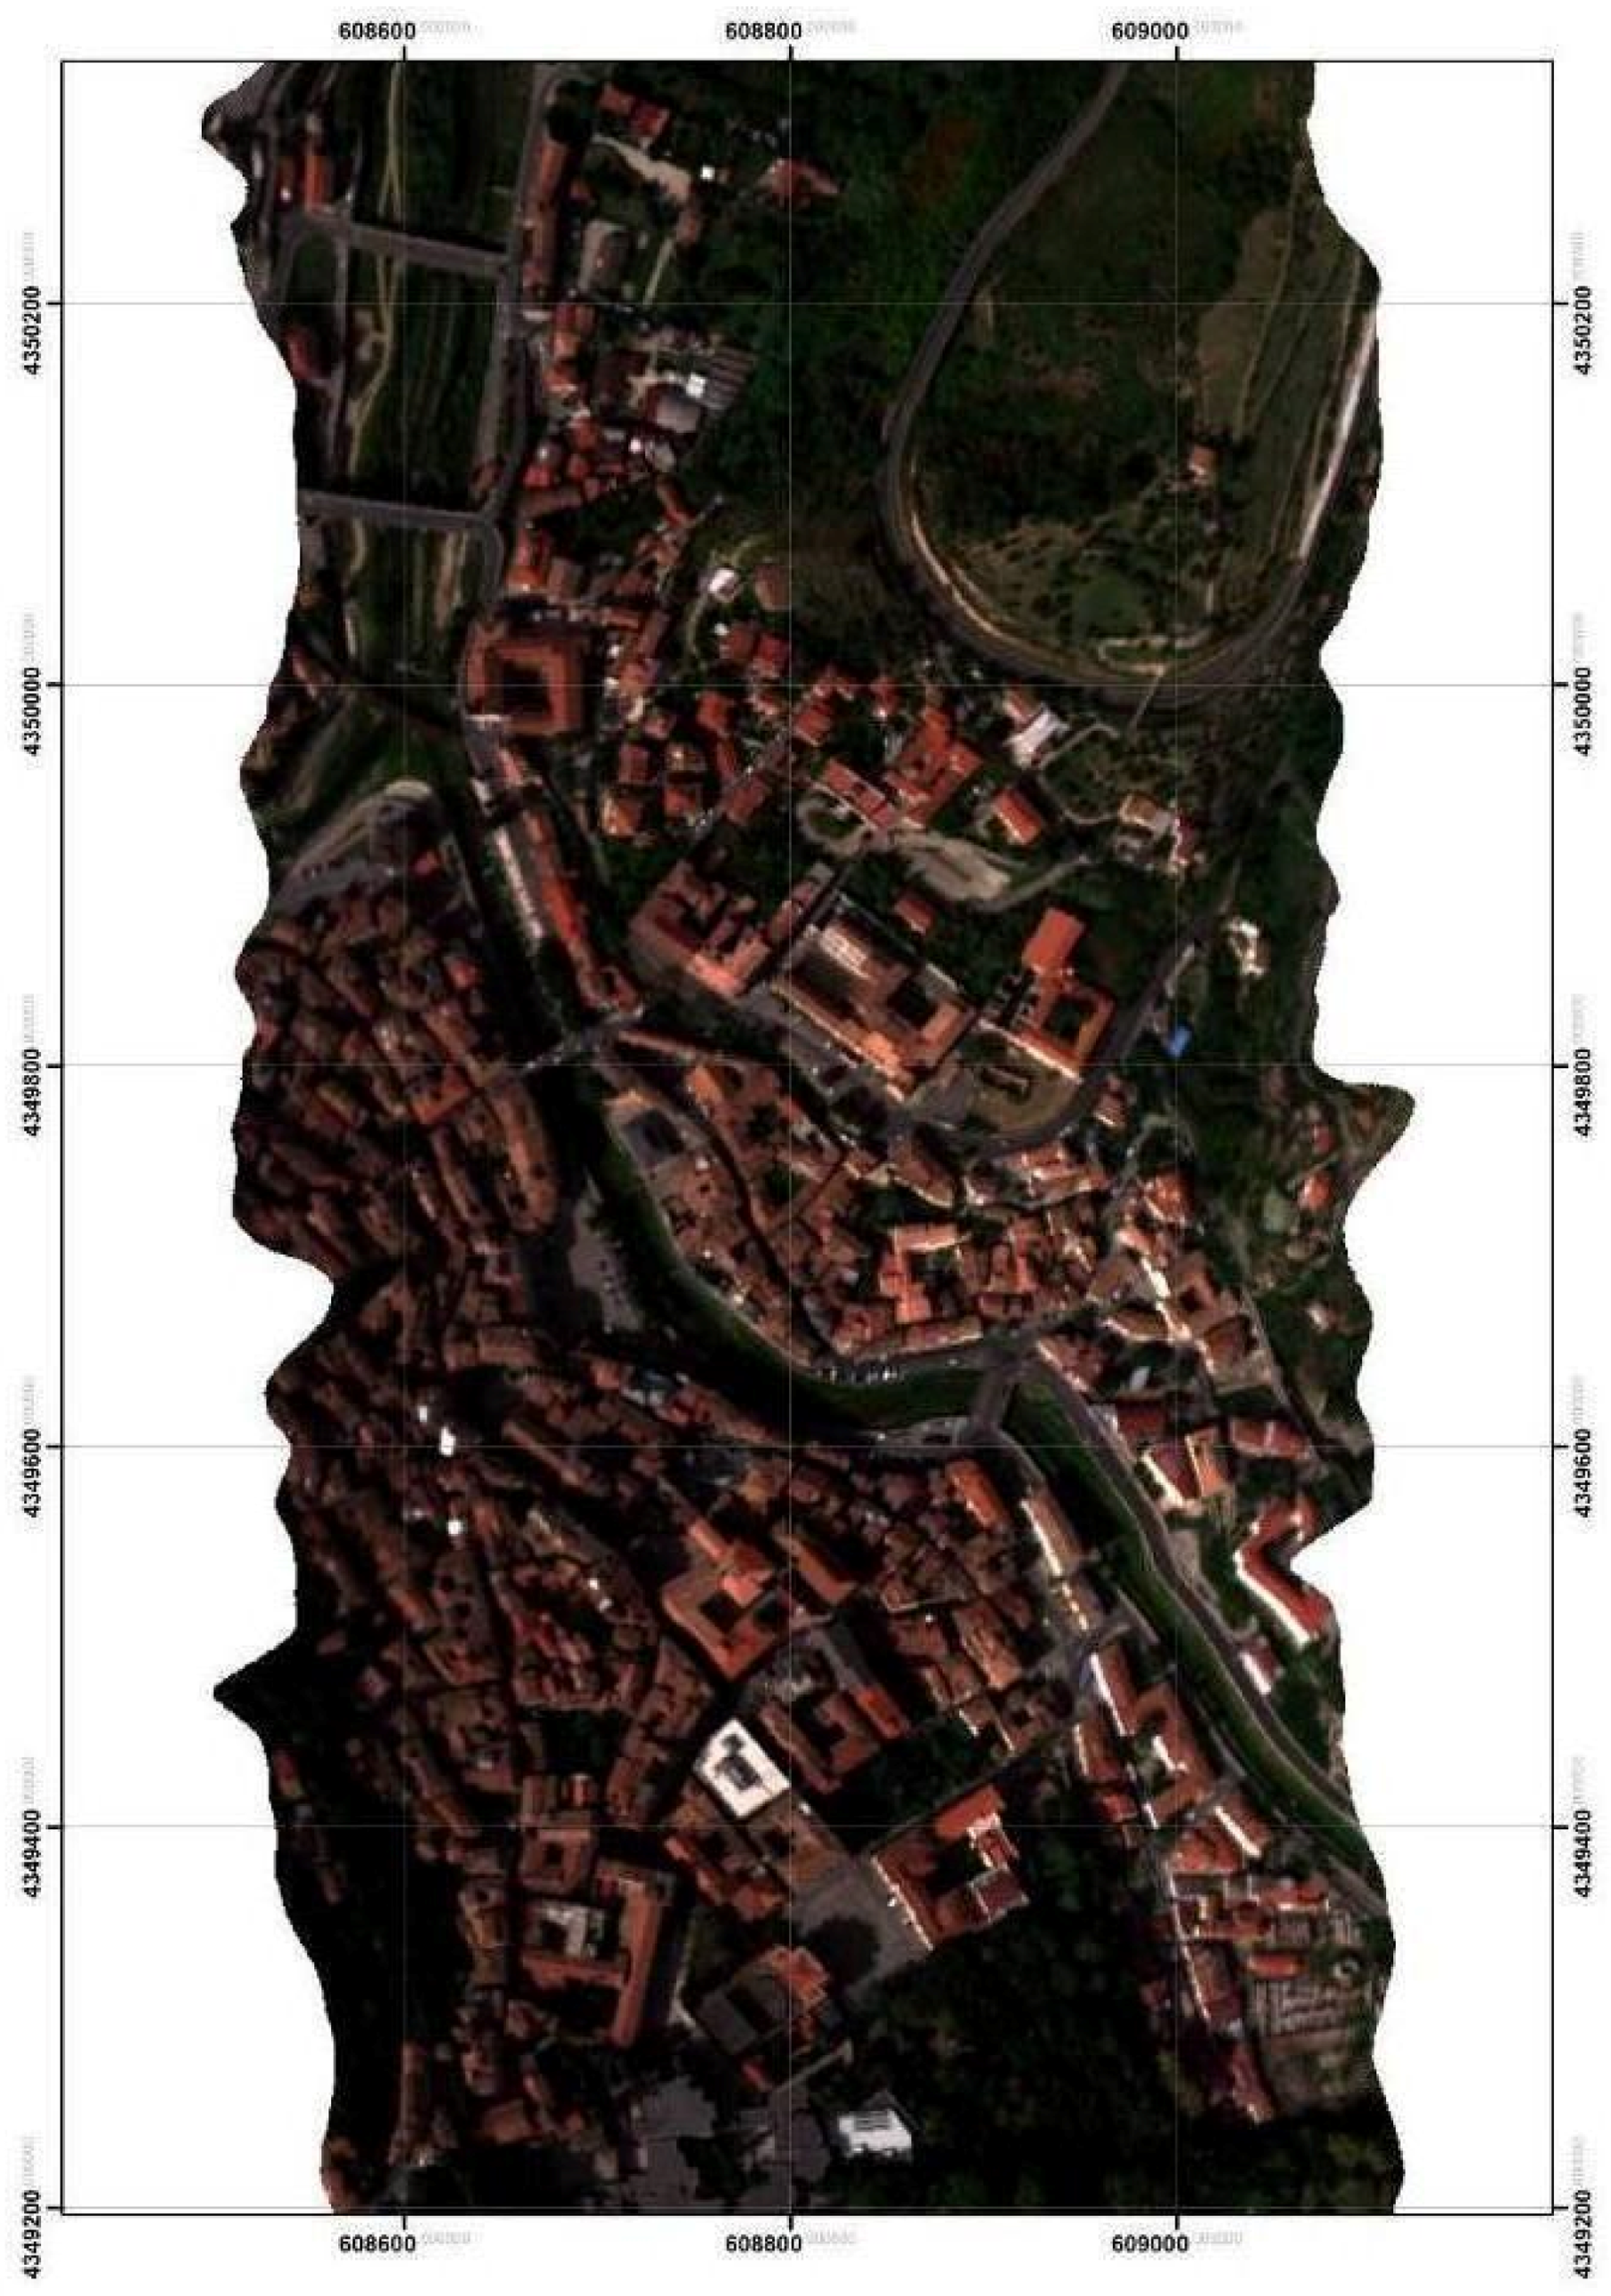
ad hoc pre-processing of the hyperspectral measurements have been firstly implemented to provide geocoded reflectance measurements of targets within the observed scenario: in detail, the measurements have been radiometrically corrected, geocoded, and geometrically calibrated, then converted in Band Interleaved by Line (BIL) format and, finally, corrected for atmospheric effects. A sample output of the pre-processing step is provided in
Figure 3, showing a sketch of the Cosenza historic city center in the Red Green Blue (RGB) color-composite imagery.
Figure 3.
Sketch of a RGB hyperspectral image, related to the Cosenza urban area.
Figure 3.
Sketch of a RGB hyperspectral image, related to the Cosenza urban area.
4. Proposed Approach
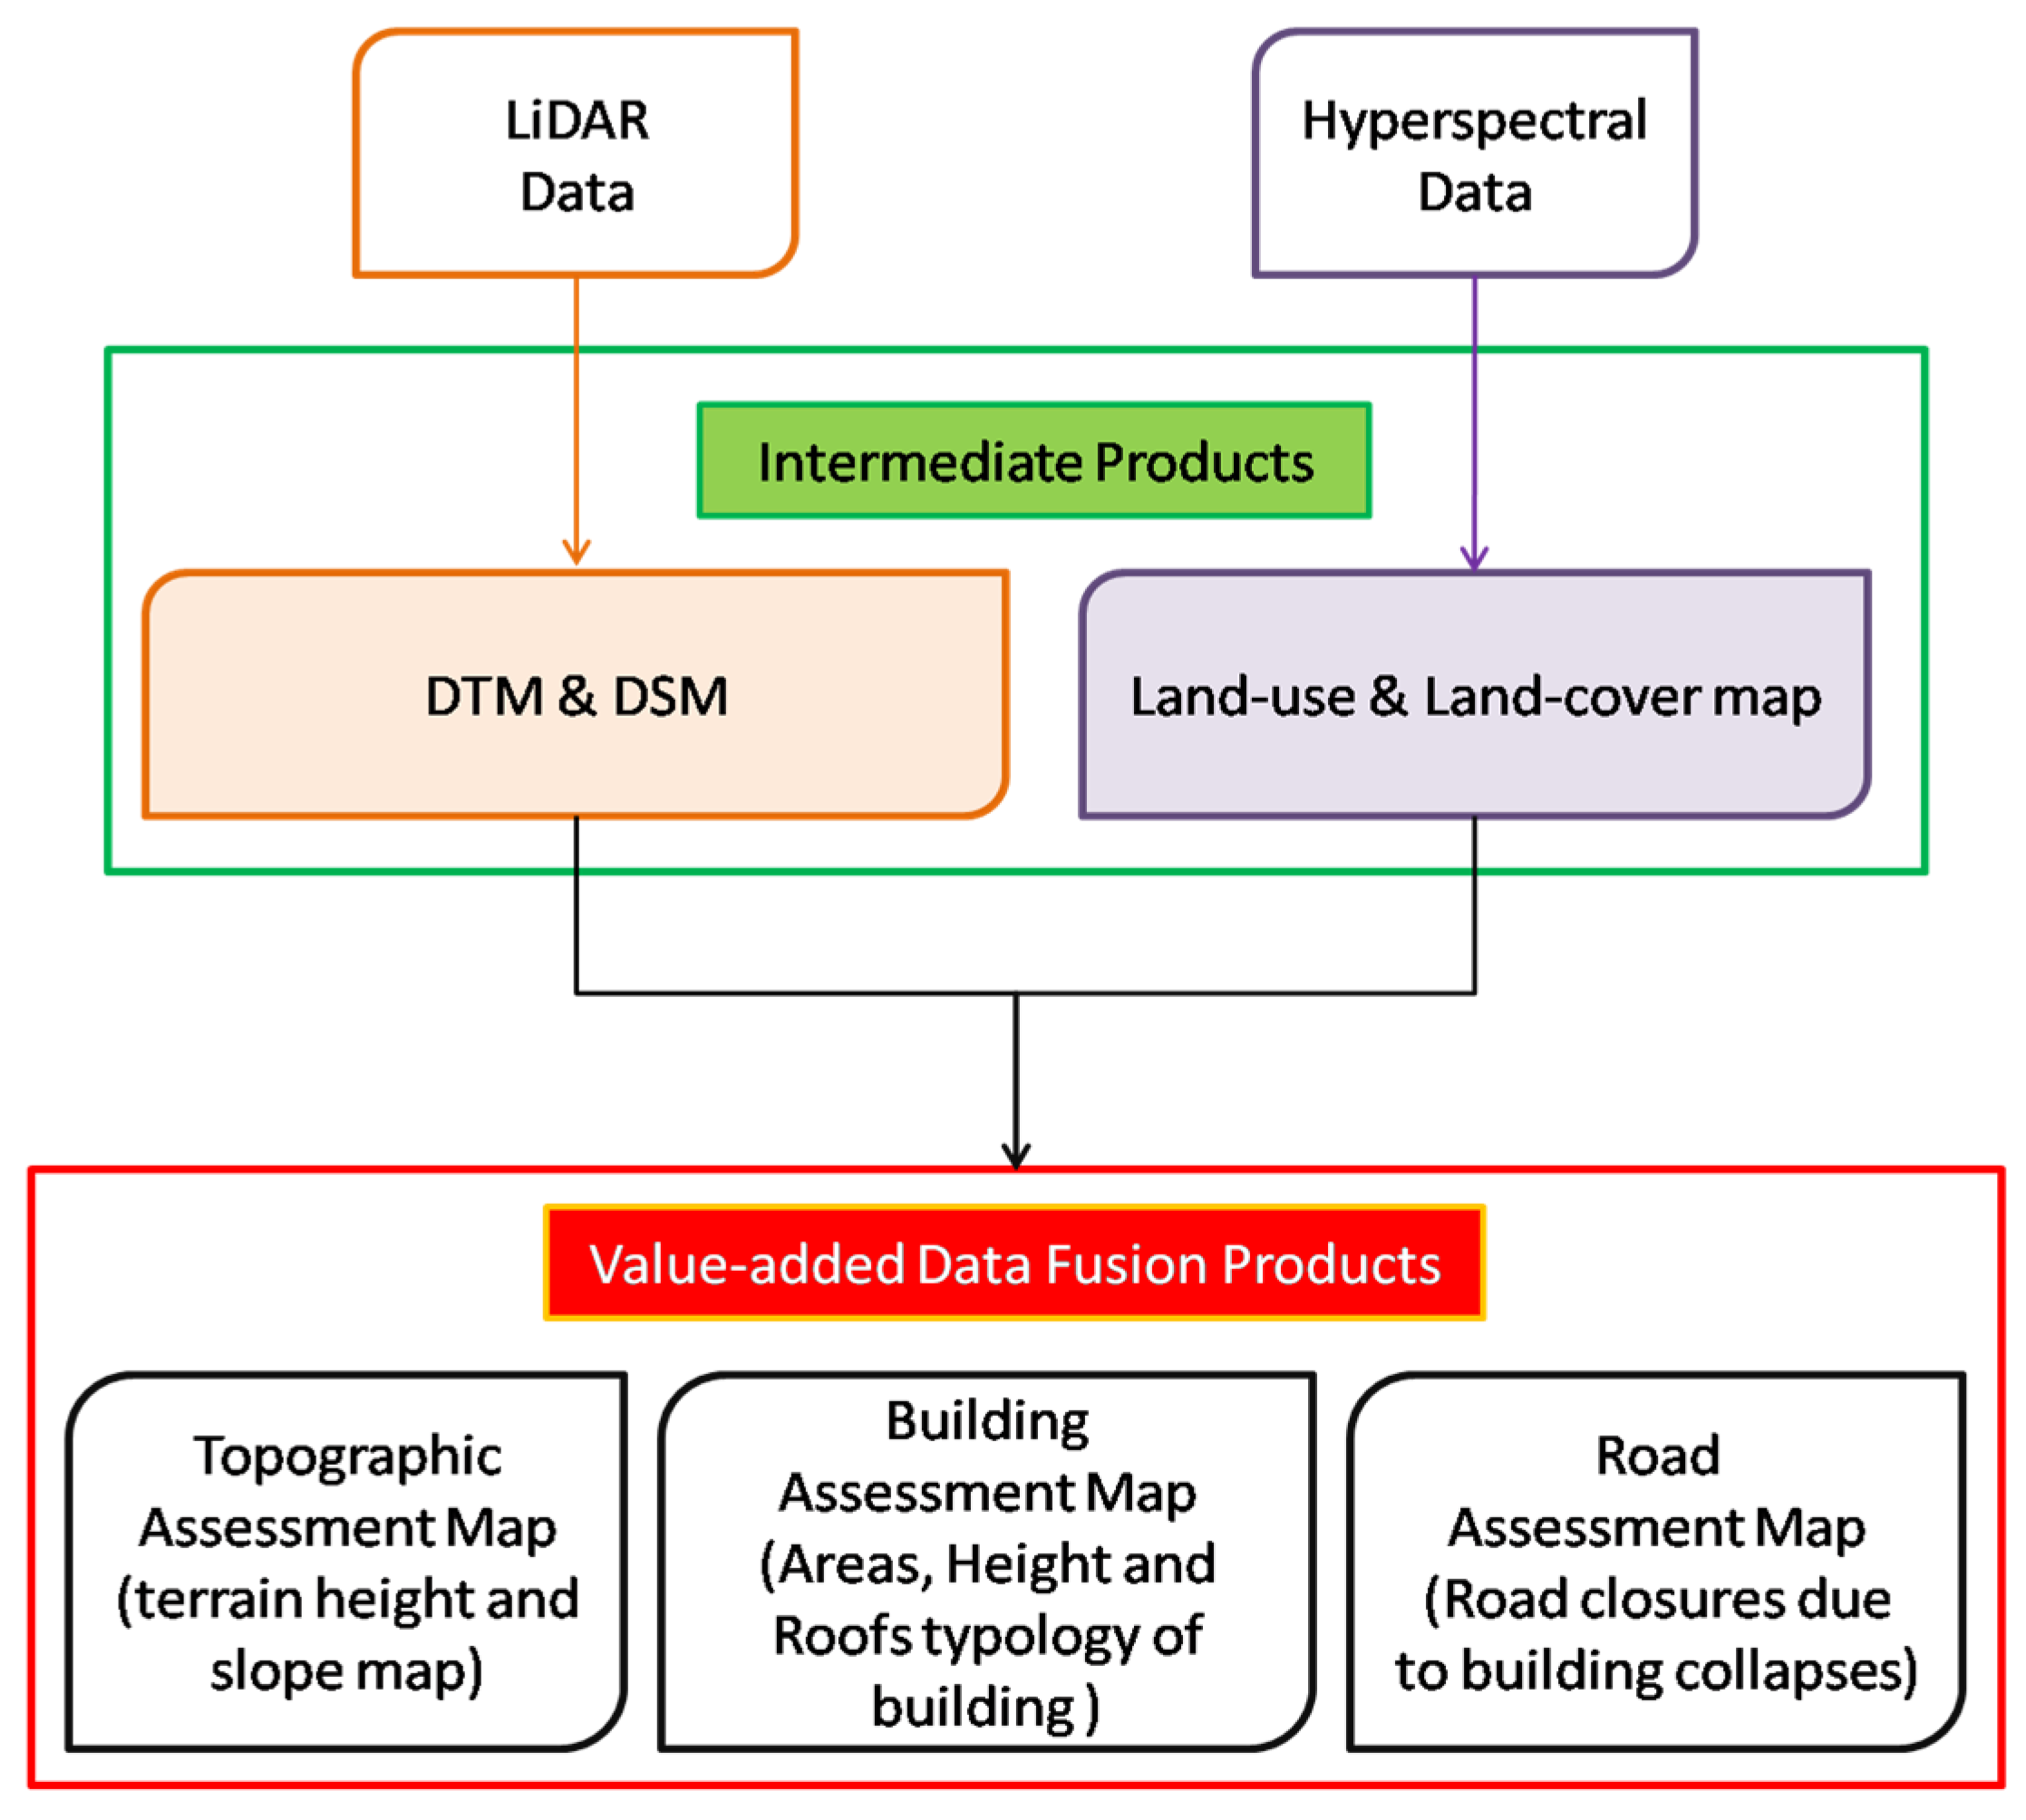
The rationale at the base of the proposed approach is described according to the block scheme of
Figure 4: in detail, LiDAR and hyperspectral data are processed in a two-step procedure to provide two different kinds of products,
i.e., the intermediate and the value-added data fusion ones.
Figure 4.
Block scheme of the methodology proposed to integrate airborne LiDAR and hyperspectral measurements.
Figure 4.
Block scheme of the methodology proposed to integrate airborne LiDAR and hyperspectral measurements.
The intermediate products, which concern the first step of the proposed methodology, have been obtained by processing LiDAR and hyperspectral measurements through classical signal techniques and spectral-based supervised classification algorithms, respectively. These products include the DTM, the DSM, the land-use, and the land-cover maps of the selected case study.
The value-added data fusion products, which concern the second step of the proposed methodology, have been obtained by combining and integrating the intermediate products within a GIS platform. In detail, a general frame of assessment has been considered, where the intermediate products are related to the main features of the urban environment (i.e., the surface topography, the built-up structures, and the road network facilities) useful for the evaluation and the management of seismic vulnerability assessment in both pre- and post-seismic phases. In fact, the combined use of both digital surface models and land-cover classification maps allow to describe/exploit (i) the topographic features and anomalies of the observed area, which can be used to evaluate the topographic amplification factor for assessing the seismic vulnerability of land surface; (ii) the properties of the built-up area (e.g., geometry, area, volume, roof coverage), which can be used to estimate the damage levels, as well as the capacity and the response of buildings to seismic events; and (iii) the road network typology and serviceability, which can be used together with building information to evaluate the risk of road blockage due to damaged construction, thus assisting post-earthquake operations. Expected outputs include the topographic, the building, and the road assessment maps of the test area to perform environmental and infrastructural analyses in support of the seismic vulnerability assessment.
In the following, the processing chains, adopted to provide intermediate products and value-added data fusions maps, are described separately.
4.1. Intermediate Products: Digital Models, Land-Cover, and Land-Use Map
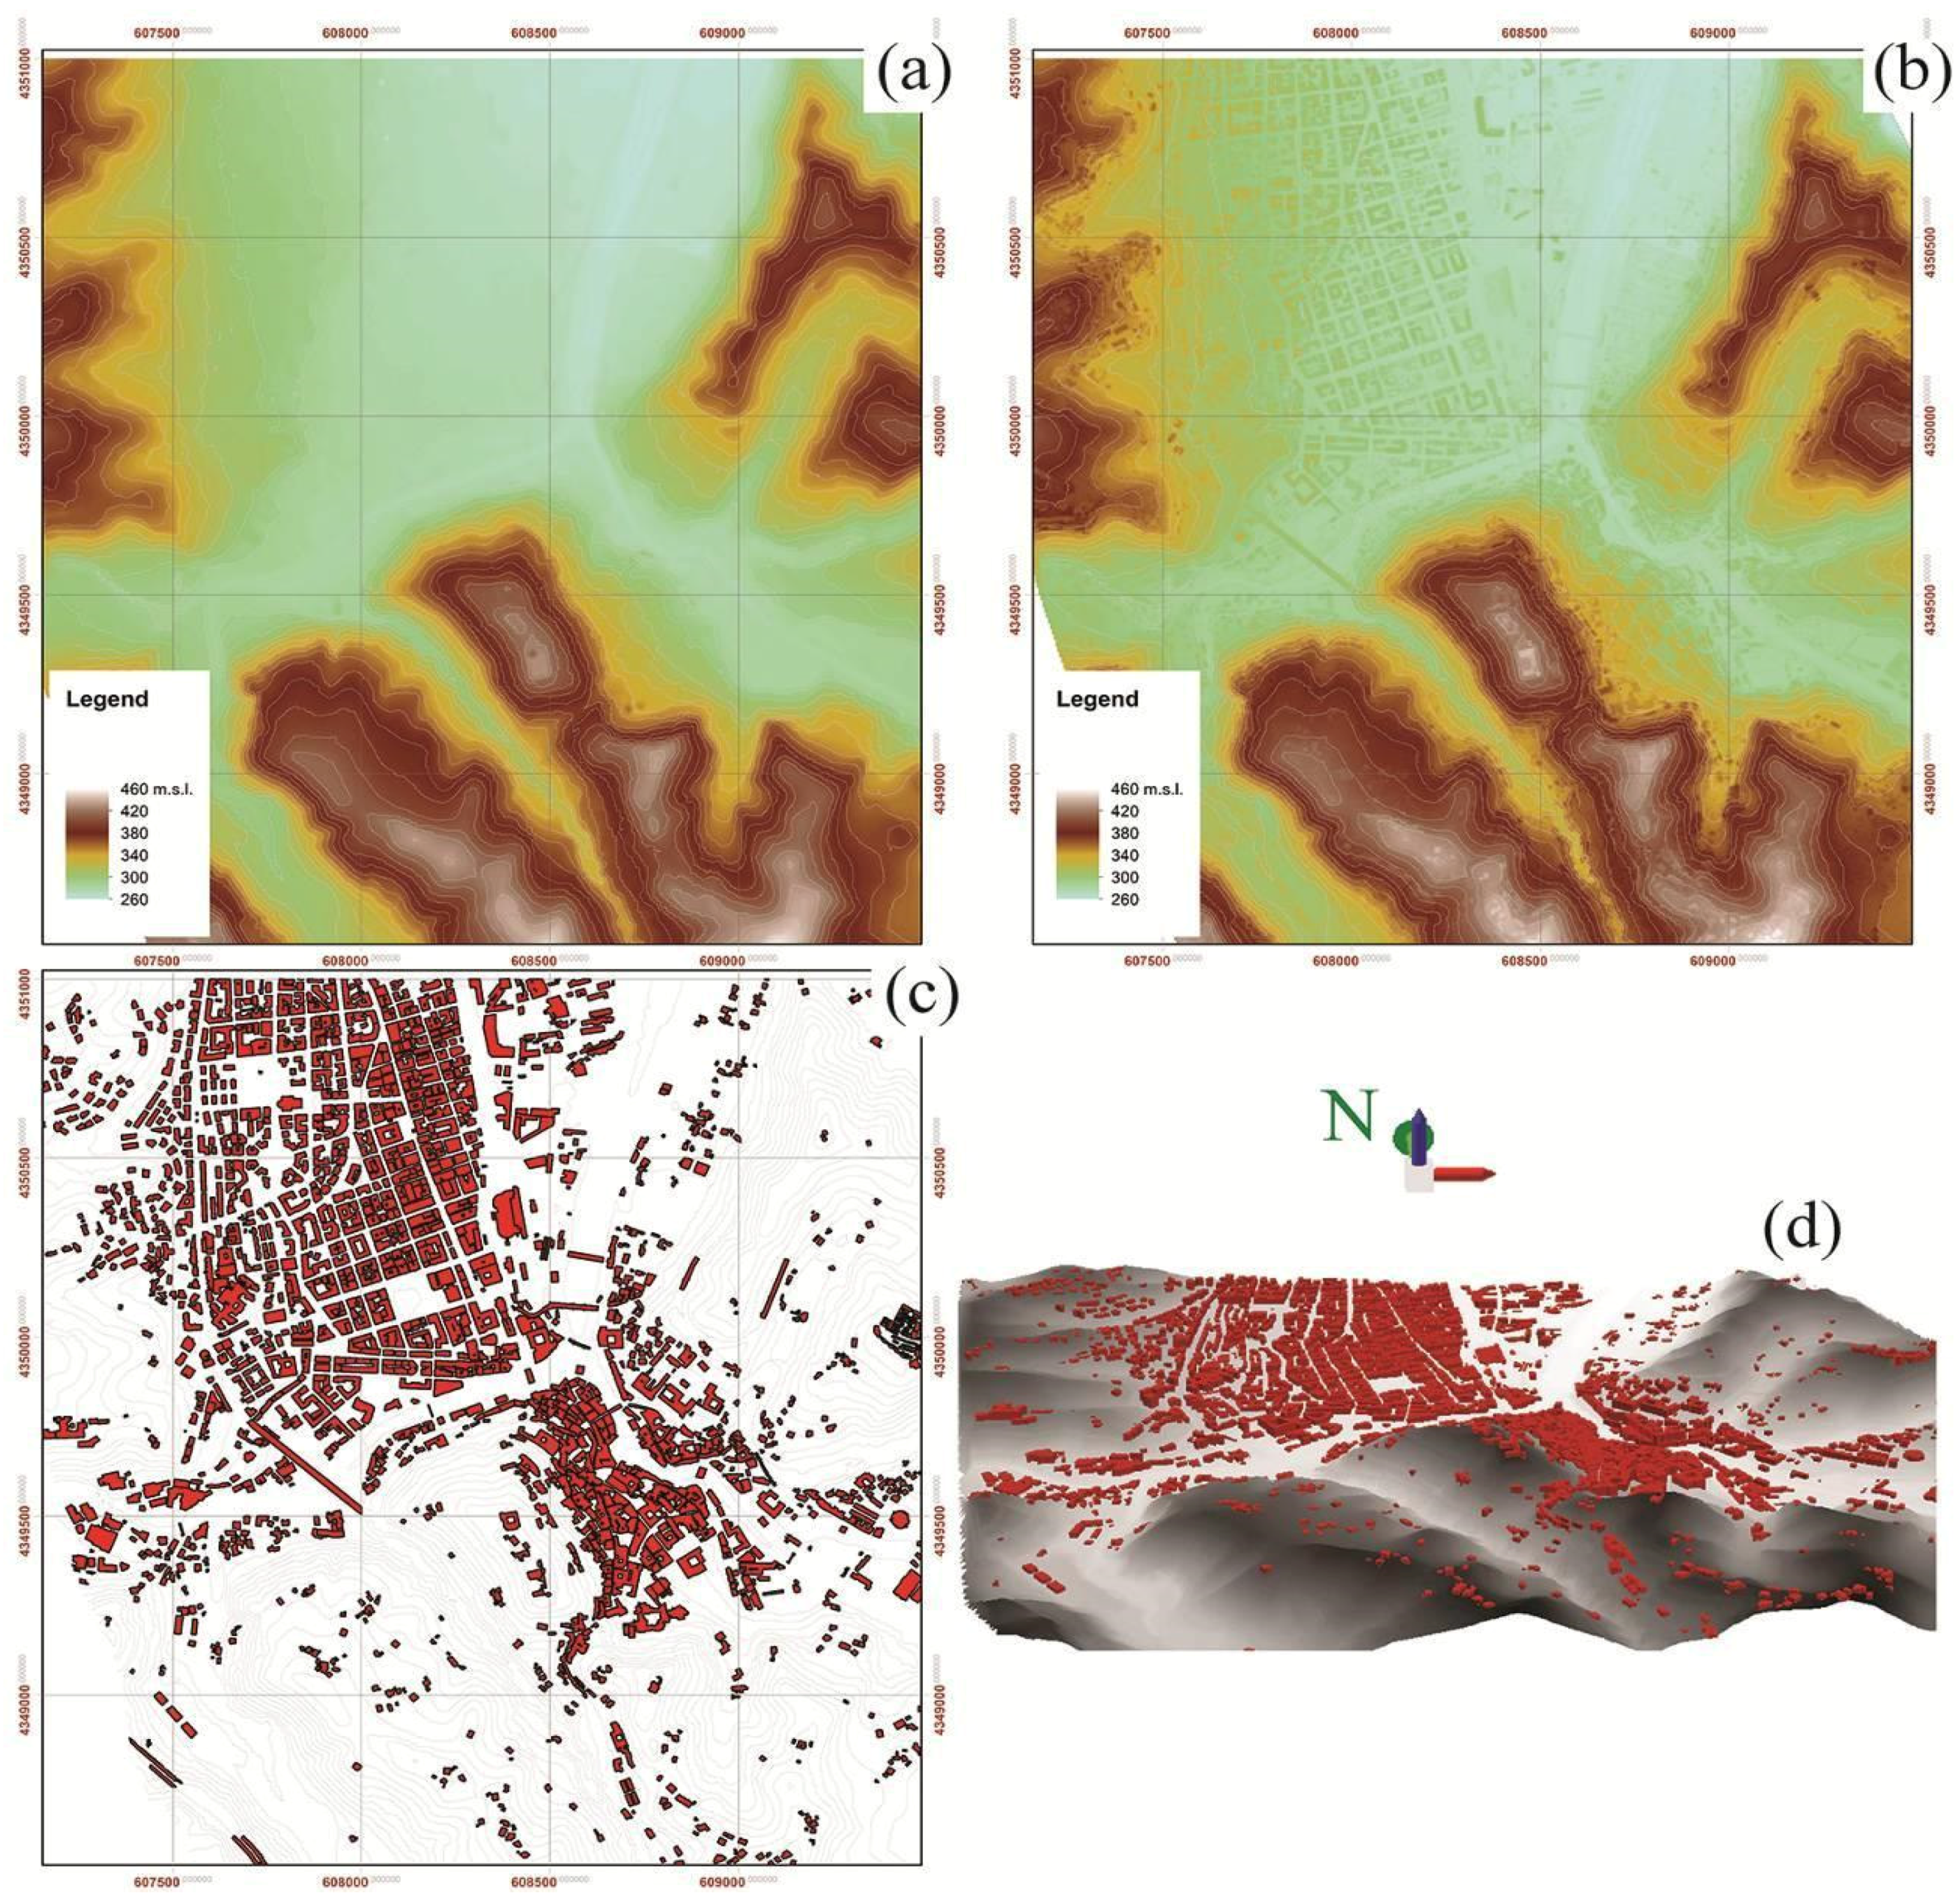
Referring to the airborne LiDAR measurements and following their pre-processing step, these data have been processed through classical interpolation techniques to provide the DTM and DSM of the test area (see
Figure 5a,b, respectively). Based on these models, two typologies of LiDAR-based products have been extracted in a GIS environment and properly shown in
Figure 5c,d: (i) the topographic characterization of the urban environment; and (ii) the location of the built areas over the 3D topographic profile of Cosenza.
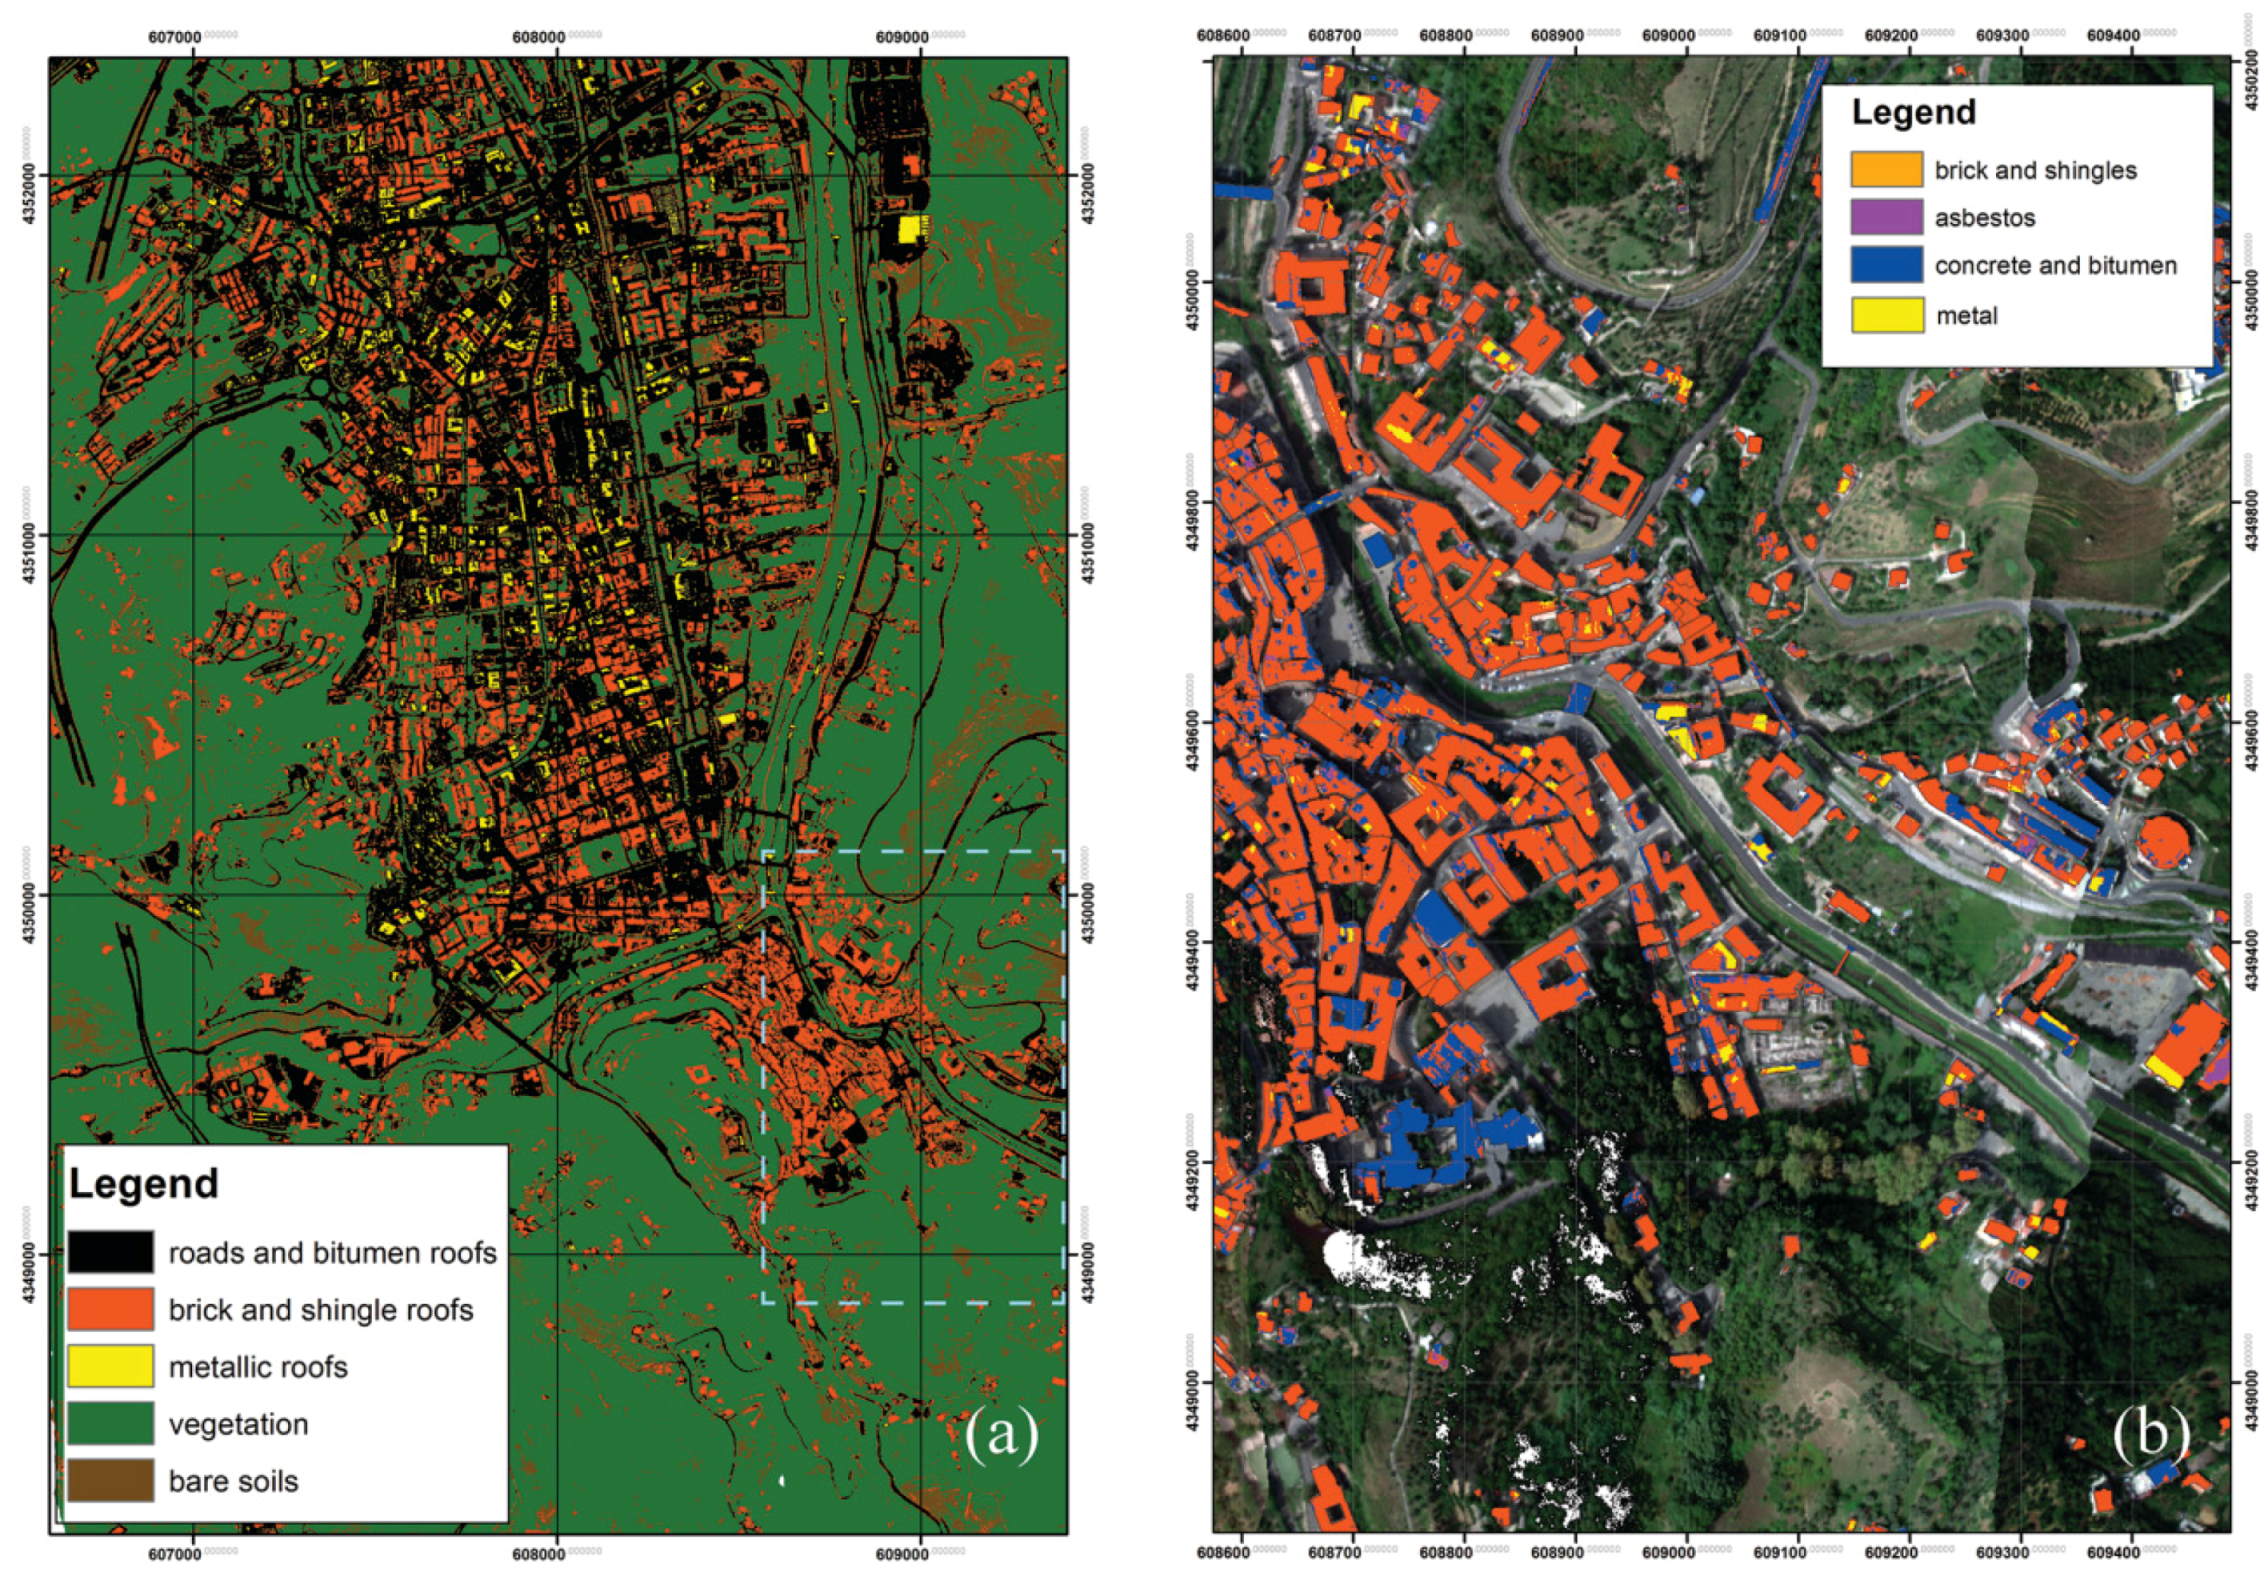
Referring to the airborne hyperspectral data and following their pre-processing step, these images have been fully processed within the ENVI-IDL
© computing environment through a supervised classification algorithm. In particular, the Spectral Angle Mapper (SAM) technique has been used [
21] to provide high-resolution classification maps of the test area (see
Figure 6a). The algorithm allows a rapid classification by calculating the spectral similarity between image and reference reflectance spectra. The latter can be provided either by region of interest (ROI) selected within the hyperspectral imagery or by reference spectra provided in ENVI-IDL
© libraries. In this framework, some classification categories have been chosen in a supervised manner, considering the main building roof typologies (brick and shingles, concrete and bitumen, metallic building roofs) and environmental features (vegetation and bare soil) of the observed area. For each classification category, different training ROIs have been selected with different pixel numbers, considering ground-truth data provided by
in situ cadastral information. These ROIs have been used to train the SAM algorithm and test its capabilities over hyperspectral imagery for land classification purposes. The expected output is the high-resolution land-use and land-cover mapping of the observed scenario (
i.e., the Cosenza urban area, see
Figure 6a). It allows identifying and detecting the natural environmental classes (
i.e., vegetated and terrain rural areas)
versus the urbanized features of the area (
i.e., roads and the main building roof typologies).
Figure 5.
Intermediate products by airborne LiDAR data: (a) DTM; (b) DSM; (c) map of built areas; and (d) 3D view of the buildings projected on the DTM.
Figure 5.
Intermediate products by airborne LiDAR data: (a) DTM; (b) DSM; (c) map of built areas; and (d) 3D view of the buildings projected on the DTM.
A quantitative assessment analysis has been carried out to evaluate the soundness of ROI-based spectral profiles, as well as the effectiveness and the performances of the SAM classifier for land-use mapping. To this purpose, classification results obtained by using training ROIs have been compared with those gathered through reference ENVI-IDL
© spectra in terms of confusion matrices. In detail, four basic measures of accuracy have been considered:
the overall accuracy (in %)—it measures the accuracy of the whole classification image without indicating the accuracy of the individual classification categories. It represents the total number of correctly classified samples divided by the total number of samples;
the Kappa coefficient—it is a discrete multivariate analysis parameter, which evaluates the accuracy of classifier from the error matrix and measures how the classification performs compared with the reference data (i.e., training ROIs);
the producer’s accuracy (in %)—it measures the error of omission and represents the number of correctly classified samples of a particular category divided by the total number of reference training samples for that category; and
the user’s accuracy (in %)—it measures the error of commission and is calculated by considering the number of correctly classified samples of a particular category divided by the total number of samples classified into that category. As a result, it also takes into account the wrongly classified points in the image for a particular category, thus providing a better assessment of the classification quality.
Figure 6.
SAM-based supervised classification analyses of Cosenza. (a) Land-cover and land-use map; and (b) construction materials map of the building roofs.
Figure 6.
SAM-based supervised classification analyses of Cosenza. (a) Land-cover and land-use map; and (b) construction materials map of the building roofs.
Table 1.
Comparison between ROIs and ENVI-IDL© spectral-based SAM classification accuracies at different numbers of training sample pixels. Overall Accuracy (%) and Kappa coefficients.
Table 1.
Comparison between ROIs and ENVI-IDL© spectral-based SAM classification accuracies at different numbers of training sample pixels. Overall Accuracy (%) and Kappa coefficients.
| | ROI-Based SAM | Spectral-Based SAM |
|---|
| Number of training pixels | Overall Accuracy (%) | Kappa Coefficient | Overall Accuracy (%) | Kappa Coefficient |
|---|
| Tens of pixels | 99.07 | 0.98 | 100 | 1 |
| Hundreds of pixels | 93.55 | 0.92 | 94.38 | 0.93 |
| Thousands of pixels | 93.79 | 0.90 | 93.68 | 0.91 |
Table 2.
ROI-based SAM classification accuracy at different numbers of training sample pixels. Producer’s Accuracy (%) and User’s Accuracy (%).
Table 2.
ROI-based SAM classification accuracy at different numbers of training sample pixels. Producer’s Accuracy (%) and User’s Accuracy (%).
| Classes | Producer’s Accuracy (%) | User’s Accuracy (%) |
|---|
| | Tens of Pixels | Hundreds of Pixels | Thousands of Pixels | Tens of Pixels | Hundreds of Pixels | Thousands of Pixels |
|---|
| Roads and bitumen roofs | 100 | 100 | 84.36 | 95.23 | 100 | 75.93 |
| Brick and shingles roofs | 100 | 77.66 | 100 | 98.15 | 84.13 | 98.76 |
| Metallic roofs | 96.15 | 100 | 94.05 | 100 | 100 | 96.60 |
| Vegetation | 100 | 100 | 92.94 | 100 | 100 | 100 |
| Bare soils | 98.28 | 86.61 | 99.42 | 100 | 76.60 | 67.18 |
Table 3.
ENVI-IDL© spectral-based SAM classification accuracy at different numbers of training sample pixels. Producer’s Accuracy (%) and User’s Accuracy (%).
Table 3.
ENVI-IDL© spectral-based SAM classification accuracy at different numbers of training sample pixels. Producer’s Accuracy (%) and User’s Accuracy (%).
| Classes | Producer’s Accuracy (%) | User’s Accuracy (%) |
|---|
| | Tens of Pixels | Hundreds of Pixels | Thousands of Pixels | Tens of Pixels | Hundreds of Pixels | Thousands of Pixels |
|---|
| Roads and bitumen roofs | 100 | 100 | 97.19 | 100 | 100 | 88.71 |
| Brick and shingles roofs | 100 | 76.53 | 98.52 | 100 | 84.13 | 99.52 |
| Metallic roofs | 100 | 100 | 86.85 | 100 | 100 | 99.34 |
| Vegetation | 100 | 100 | 97.19 | 100 | 100 | 97.93 |
| Bare soils | 100 | 86.61 | 85.80 | 100 | 79.60 | 81.47 |
An overall accuracy and a Kappa coefficient always greater than 90% and 0.9 are obtained, respectively, using both ROIs and reference ENVI-IDL
© spectral profiles with different numbers of training pixels (see
Table 1). These results allow to evaluate the high accuracy of both the whole classification image and the supervised SAM classifier, independently of training pixel numbers and individual classification categories, respectively. Moreover, they show the very good agreement between classification results obtained through pixel-based ROIs and reference ENVI-IDL
© spectra.
A producer’s accuracy always greater than about 75% is observed for all of the classification categories, using both ROIs and reference ENVI-IDL
© spectral profiles (see
Table 2 and
Table 3). This result confirms the good performances of the classifier, providing low omission errors and, hence, a low probability that ground sample points for each category were classified incorrectly.
A user’s accuracy always greater than 75% is further observed for almost all of the classification categories, using both ROIs and reference ENVI-IDL
© spectral profiles (
Table 2 and
Table 3). The only exception is represented by the “bare soils” category with a training ROI of thousands of pixels, where the user’s accuracy is about 67%. These results show the low commission error of the proposed approach for almost all the classification categories, both in case of ROIs and ENVI-IDL
© spectral profiles. Conversely, commission errors increase in case of “bare soils” class, thus meaning an increasing probability that pixels classified as bare soils may not actually exist on the ground.
Following the classification accuracy assessment, the spectral profiles obtained through selected ROIs have been used to construct an
ad hoc hyperspectral library for describing the built-up classification categories of the observed area. Subsequently, the SAM-based classifier has been implemented to recognize the construction materials of building roofs. This analysis has the two-fold purpose of executing a preliminary screening on the ancient buildings located within the historic city center and to detect potentially dangerous materials for the environment (e.g., asbestos). To this purpose, some roof typologies have been selected considering the roof construction features of the South Italy landscape,
i.e., brick and shingles, concrete and bitumen, metallic, and asbestos building roofs. Experimental results are shown in
Figure 6b and summarized in
Table 4. They agree with the previous ones showing an overall accuracy of 94.94%, a Kappa coefficient equal to 0.92, a producer’s accuracy greater than 75%, and an user’s accuracy greater than 85%. They demonstrate the soundness of both spectral profiles and SAM classifier in terms of high specificity, high accuracy, and low commission and omission errors, for effectively classifying different building roof categories.
Table 4.
ROI-based SAM classification accuracy of building roof categories. Producer’s Accuracy (%) and User’s Accuracy (%).
Table 4.
ROI-based SAM classification accuracy of building roof categories. Producer’s Accuracy (%) and User’s Accuracy (%).
| Classes | Producer’s Accuracy (%) | User’s Accuracy (%) |
|---|
| Concrete and bitumen roofs | 100 | 87.99 |
| Brick and shingles roofs | 100 | 99.88 |
| Asbestos | 75.80 | 100 |
| Metal | 99.79 | 100 |
To improve the quality assessment of the land cover mapping, quantitative statements on the geometric and positional accuracy of the hyperspectral-based classification have been performed with respect to a reference source of information. In this framework, the ad hoc coregistration of the geocoded SAM-based classification output has been carried out with respect to LiDAR-based products through the spline-based georeferencing processing within GIS environment. Then, some image control points corresponding to the borders of building footprints have been selected in the coregistered classification map and their coordinates have been compared to those of the same points (i.e., ground control points) determined from the LiDAR-based map of built-up area. Finally, the positional deviation of the image control points in reference to the ground control points has been calculated and given as the Root Mean Square Error (RMSE). Experimental results provide RMSE values of 0.04 m and 0.33 m along longitude and latitude coordinates in the Universal Transverse Mercator (UTM) reference system, respectively. They demonstrate the high positional and the geometrical accuracy of the coregistered classification map with respect to the reference LiDAR-based DSM product.
4.2. Topographic Assessment Map
An important factor that must be taken into account when evaluating and assessing the seismic vulnerability of land surfaces (e.g., for seismic microzonation analysis) is the topographic amplification factor,
i.e., the amplification of seismic waves in the presence of topographic irregularities. The latter is often advocated as one of the possible causes of damage concentration during earthquakes, as well as in the (re)activation of landslides, rockslides, and rock-falls during seismic events. This factor depends on several variables such as, in particular, the directivity effects of the seismic source, the land morphologies, and the slopes. All these factors are relevant when referring to hilly and steep relief areas, such as in the interesting case of the Italian territory. The engineering relevance of this problem is even greater when considering that several historical towns, with precious (architectural, historic, and religious) heritages, are often located at the cliff crest (e.g., [
22]).
In order to evaluate the topographic amplification factor, the European Technical Code (EC8) provides four types of morphologies:
T1—Flat surfaces, isolated slopes, or reliefs with average inclination β ≤ 15°;
T2—Slopes with average inclination β > 15°;
T3—Reliefs with ridge top width much smaller than the base, and average inclination 15° ≤ β ≤ 30°;
T4—Reliefs with ridge top width much smaller than the base, and average inclination β > 30°;
In this framework, a procedure to assess the topographic classification on territorial bases is proposed. It takes into account both landforms and slopes, based on the LiDAR-based DTM products.
The morphological analysis has been performed according to the method proposed by [
23] and modified by [
24], computing the Topographic Position Index (TPI). The latter is defined as the difference between the elevation at each surface point and the average elevation of the surrounding area within a predefined radius. It is calculated according to the following equation:
In Equation (1),
Hc is the elevation in the central point;
Havg and
Hstd are the elevation average and standard deviation values, respectively, calculated on a circular area surrounding the same central point. This area is defined by the radius (
R); therefore, the TPI depends on this distance. Positive TPI values indicate that the central point is located higher than its average surroundings, while negative values indicate a lower position with respect to the surrounding average. Moreover, the range of TPI values depends on both elevation differences and the selected reference radius [
24]. In fact, large radius values mainly reveal major landscape units, while smaller ones highlight smaller features, such as minor valleys and ridges. The procedure suggests to use two different TPIs characterized by short (R
S) and long (R
L) radii, respectively; hence, a combination of values assumed by two TPIs allow the determination of the landforms, following the scheme reported in
Table 5.
Table 5.
Values of TPIs to landform classification [
21,
22].
Table 5.
Values of TPIs to landform classification [21,22].
| Values of TPI (RS) | Values of TPI (RL) | Landform Class |
|---|
| TPI(RS) ≤ −100 | TPI(RL) ≤ −100 | canyons |
| −100 < TPI(RS) < 100 | TPI(RL) ≤ −100 | shaped valleys |
| TPI(RS) ≤ −100 | −100 < TPI(RL) < 100 | mid-slope drainages or shallow valleys |
| TPI(RS) ≤ −100 | TPI(RL) ≥ 100 | upland drainage or headwaters |
| −100 < TPI(RS) < 100 | −100 < TPI(RL) < 100 (Slope) ≤ 5 | plains small |
| −100 < TPI(RS) < 100 | −100 < TPI(RL) < 100 (Slope) > 5 | open slopes |
| TPI(RS) ≥ 100 | −100 < TPI(RL) < 100 | mid-slope ridges or small hills in plains |
| −100 < TPI(RS) < 100 | TPI(RL) ≥ 100 | upper slopes |
| TPI(RS) ≥ 100 | TPI(RL) ≤ −100 | local ridges or hills in valley |
| TPI(RS) ≥ 100 | TPI(RL) ≥ 100 | mountain tops or high ridges |
To assess the topographic amplification on the area and accordance to the technical code, the average slope β is further required. Similarly to the analysis carried out for the TPI, the mean slope βavg has been calculated as the average of neighborhood values in a circular area with a radius equal to 100 m, which can be considered as the area of influence on the examined pixel. This parameter represents the useful situation for pixels along the hillside; whereas for a central point near or over the hilltop, the average value is strongly influenced by neighborhood pixels with lower slopes located on the top. As a result, to guarantee reliable results for pixels classified in terms of morphology as upper slope, local ridge, or mountain top, the maximum value of the average slopes βmax has been taken into account in the same neighborhood. The analysis has been further performed only for reliefs with significant height, as suggested by technical code, considering those pixels whose difference value between average elevations on RS and RL radii is higher than 30 m.
Summarizing, the coupling of landform and slope maps is able to classify each pixel of the area and, hence, defining its topographic amplification class according to the criteria reported in
Table 6.
Table 6.
Criteria to assess the topographic amplification class following the EC8 code.
Table 6.
Criteria to assess the topographic amplification class following the EC8 code.
| Landform Class | Criterion to Assign the EC8 Class |
|---|
| open slopes | if β avg ≥ 15° then T2 class |
| mid-slope ridges or small hills in plains | if β avg ≥ 15° then T2 class |
| upper slopes | if β max ≥ 30° then T4 class |
| else if β max ≥ 15° then T3 class |
| else UC class (unclassified) |
| local ridges or hills in valley | if β max ≥ 30° then T4 class |
| else if β max ≥ 15° then T3 class |
| else UC class (unclassified) |
| mountain tops or high ridges | if β max ≥ 30° then T4 class |
| else if β max ≥ 15° then T3 class |
| else UC class (unclassified) |
| Other | T1 class |
4.3. Building Assessment Maps
In order to outline the main features of the built-up area, airborne LiDAR data have been processed to extract the position, the geometry, and the height of the buildings for the selected case study. In particular, for either single structures or aggregate buildings located in the historical center of Cosenza, a digital model has been developed solely with the points classified as buildings. Their footprints have been further detected through polygons in a vector file. For each detected building, both the average and the maximum heights have been calculated through the difference between DSM and DTM, and then stored in a dedicated GIS table. In this processing, all digital models have been obtained by interpolating surface points at a sampling rate of 1 m in both range and azimuth directions. This allows evaluating the detailed geometry of building footprints and the accurate values of corresponding heights. Afterwards, the information on the areas and the average height of each building has been combined to estimate the relevant volumes. The latter can be correlated to the exposition level of built structures in case of a seismic event, both with reference to the occupant people and the economic value of the structure. These building features could be further used to retrieve the vibration frequencies of structures and correlate them to the analyses of the site seismic response for assessing the earthquake-related effects due to the double resonance phenomenon. In fact, according to literature studies [
25,
26], the geometrical properties of a building can be combined to ground-motion parameters for evaluating the fundamental period of building vibration at different limit states, hence assessing potential building deformation and vulnerability. Moreover, the building geometric information provided by the airborne LiDAR survey (e.g., building height, shape, coverage, geometry) represents an important parameter to characterize the seismic capacity and response of the observed structure [
27]. It allows defining the class of buildings to evaluate their damage levels for seismic vulnerability assessment procedures [
27]. On the other hand, it is fundamental to evaluate the area and the volume of damaged constructions (buildings and supply network) in post-earthquake events [
28].
Following the results of the land classification carried out by using hyperspectral data, the detected buildings have been also characterized on the basis of their roof typology. This additional information is very important to assess the presence of dangerous materials (e.g., asbestos) in the case of damaging seismic events. Moreover, it allows evaluating the building loads produced by roof coverage. In this context, the constructive experience in the South Italy suggests (i) the use of shingles for roofs with high slope (generally included between 30% and 45%) to ensure a good building isolation; (ii) the use of impermeable materials (e.g., bituminous membranes) for concrete roofs with low slopes (less than 5%) to reduce infiltration phenomena of rainwater; and (iii) the use of steel panels for industrial warehouses or wide civil buildings with intermediate slopes.
The building assessment information gathered through the proposed approach is useful for both pre- and post-seismic hazards [
28]. In fact, it allows identifying built-up area for evaluating the physical vulnerability of the population (the low-vulnerability buildings usually protect the lives of the occupants). Moreover, it conveys information for both administrative purposes (e.g., search and rescue operations, temporary accommodation, security, and order management) and technical provision forecasts (e.g., inventor of built-up environments, emergency interventions). Furthermore, the whole information provided by airborne LiDAR and hyperspectral measurements could be integrated with other building and environmental surveys to (i) identify/evaluate the building technical condition/building resistance capacity, in order to back up the decision to use these buildings; and (ii) identify and delimit the areas presenting risk of collapse of some seriously damaged buildings and to limit/forbid the access to these areas [
28]. As a result, the proposed approach can support, integrate, and improve existing vulnerability assessment approaches in the fields of seismology, structural vulnerability, and civil engineering [
29].
4.4. Road Assessment Map
A risk analysis has been performed in order to define a road assessment map of the selected case study, i.e., a suitable pattern of roads not covered by building ruins in case of strong earthquakes. To accomplish this task, some parameters have been defined and a relevant index has been estimated.
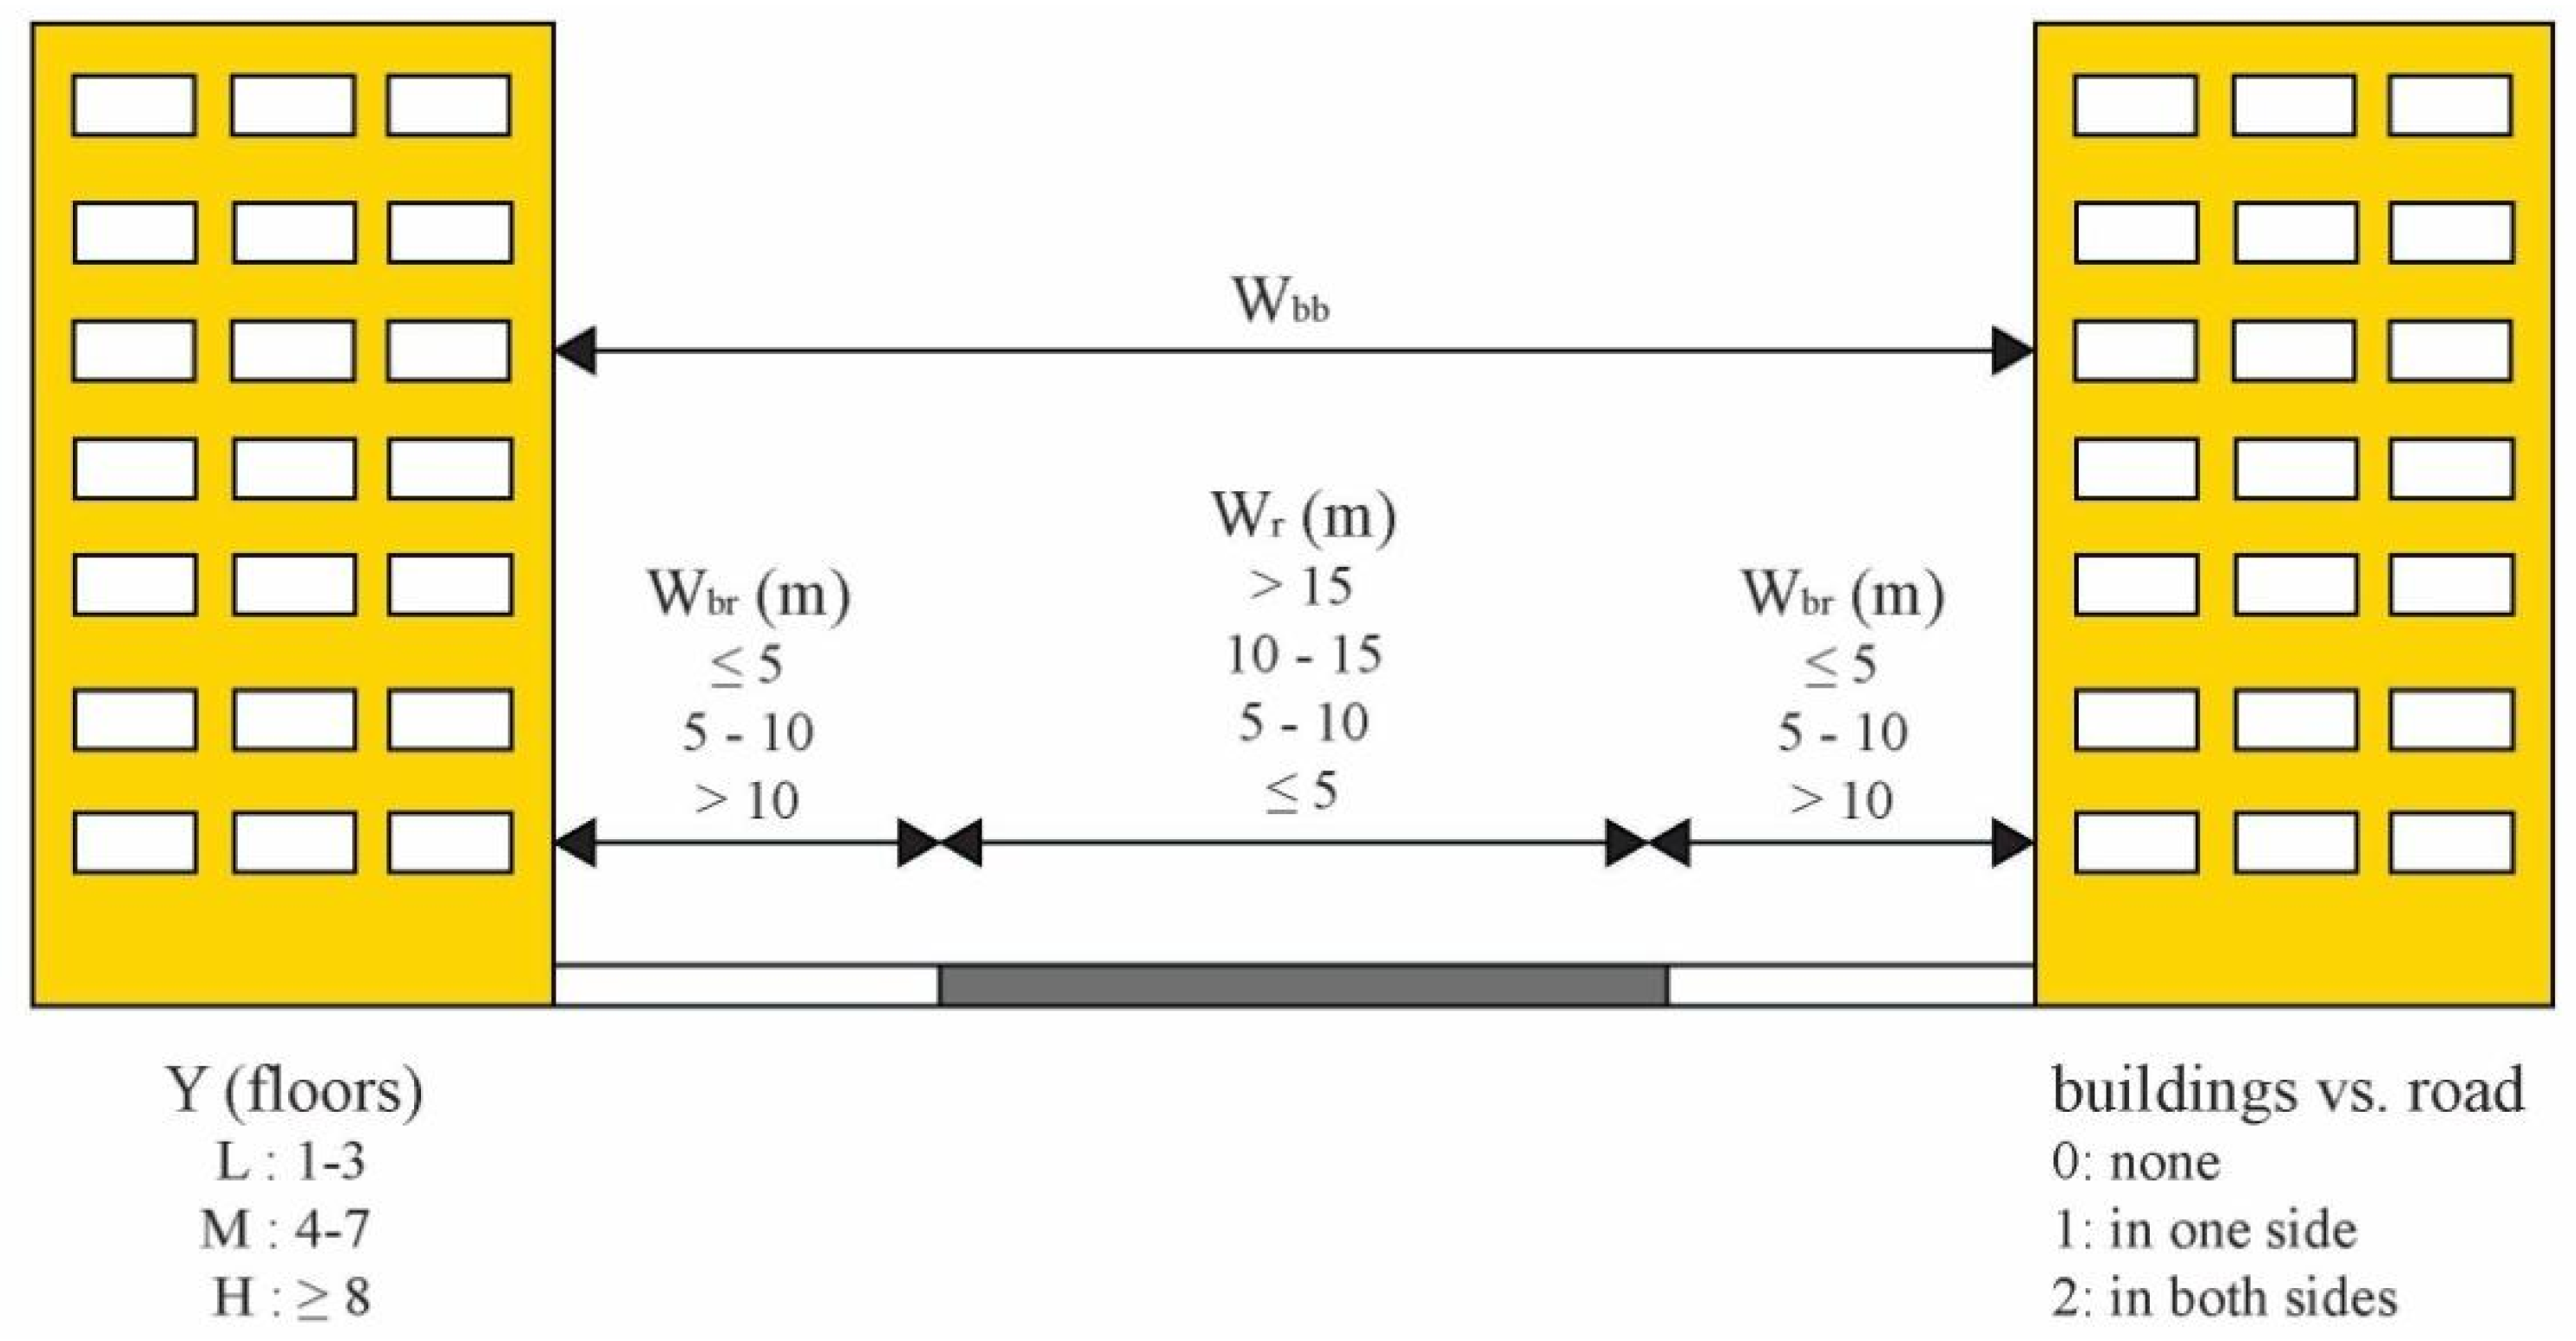
The proposed approach assumes a building collapse ratio equal to 100% and no directional collapse of the structures, together with the evaluation of relevant parameters useful for the road assessment analysis, namely the road width and the building heights. On the one hand, the location of roads has been derived by classifying hyperspectral images through ITT-ENVI© software package, whilst the road width has been estimated by suitable analysis in a GIS environment. On the other hand, the building heights have been derived through the building assessment map of the observed area, by using and processing airborne LiDAR measurements within a GIS platform. Referring to the most typical height of buildings for the Cosenza urban area, three different building classes have been defined: (i) “low buildings” with 1–3 floors (height between 3–10 m), (ii) “medium buildings” with 4–7 floors (height between 13–22 m), and (iii) “high buildings” with 8 or more floors (height ≥ 25 m).
Figure 7 shows a sketch where the distance between opposite buildings is provided together with the width of both roads and sidewalks. According to this scheme, the road width can be estimated through the following expression:
where
Wbr is the distance between building and road,
Wbb is the distance between opposite buildings,
Wr is the width of the road.
Figure 7.
Features of urban roads for their typological description versus building collapse.
Figure 7.
Features of urban roads for their typological description versus building collapse.
It is suitable to approximate the Wr value in excess, in order to not generate false positives in the mapping (i.e., areas marked with a low risk of blocking when, conversely, they show high risk).
For the case study of the Cosenza urban area, and based on the local municipal regulations, the heights of opposite buildings located along a road axis have usually shown to have similar values. However, along the road axes either where the heights of opposite buildings are not similar or where buildings are present only on one side, the characteristic building height (Y) has been calculated according to the following decision criteria:
- i
Y = 10 m, for “low buildings” on both sides;
- ii
Y = 22 m, for “medium buildings” on both sides;
- iii
Y = 25 m, for “high buildings” on both sides;
- iv
Y is equal to the average height, for buildings with two different heights on both sides;
- v
Y is equal to the 50% of the height, for buildings only on one side of the road; and
- vi
Y is the one that dominates more than 60% of the buildings, for multiple buildings with different heights in the stretch.
On these bases, to evaluate the risk of road blockage in case of building collapse, a roadblock risk index D
HR has been calculated to relate the characteristic height of the buildings (Y) with the distance from the road (Wbr) according to the following equation:
Assuming threshold values for the closing risk of the roads, three classes have been identified on the basis of Equation (3):
- i
Low risk for DHR ≤ 2.0;
- ii
Moderate risk for 2.0 ≤ DHR ≤ 4.0;
- iii
High risk for DHR > 4.0.
The proposed approach allows taking into account the interactions between the buildings and the road network facilities, especially in the case of post-seismic events. According to the current literature [
30,
31], the emergency response to earthquake strikes needs both short- and long-term interventions. In the short-term, it is important to have a good road network topology, and then evaluate the risk of road blockage due to collapsed buildings in order to facilitate public services for imminent search and rescue operations (e.g., fire services and ambulances), as well as for local evacuation measures. In the longer term, the road typology and serviceability are important to be assessed, especially for the post-earthquake management phase. In addition to this, the proposed approach can be implemented within a general frame of seismic vulnerability assessment procedures, where both the prioritization of intervention zones and the efficient allocation of search-and-rescue resources are needed [
31]. This analysis can be applied for training simulations about both the dynamic disaster environment and resources allocation in a pre-earthquake phase. Moreover, it can be used for decision process modeling through software agents concerning multiple tasks in a post-seismic phase.
5. Results and Discussion
In this section some meaningful experimental results relevant to the application of the proposed approach are presented and discussed for the case study of Cosenza city.
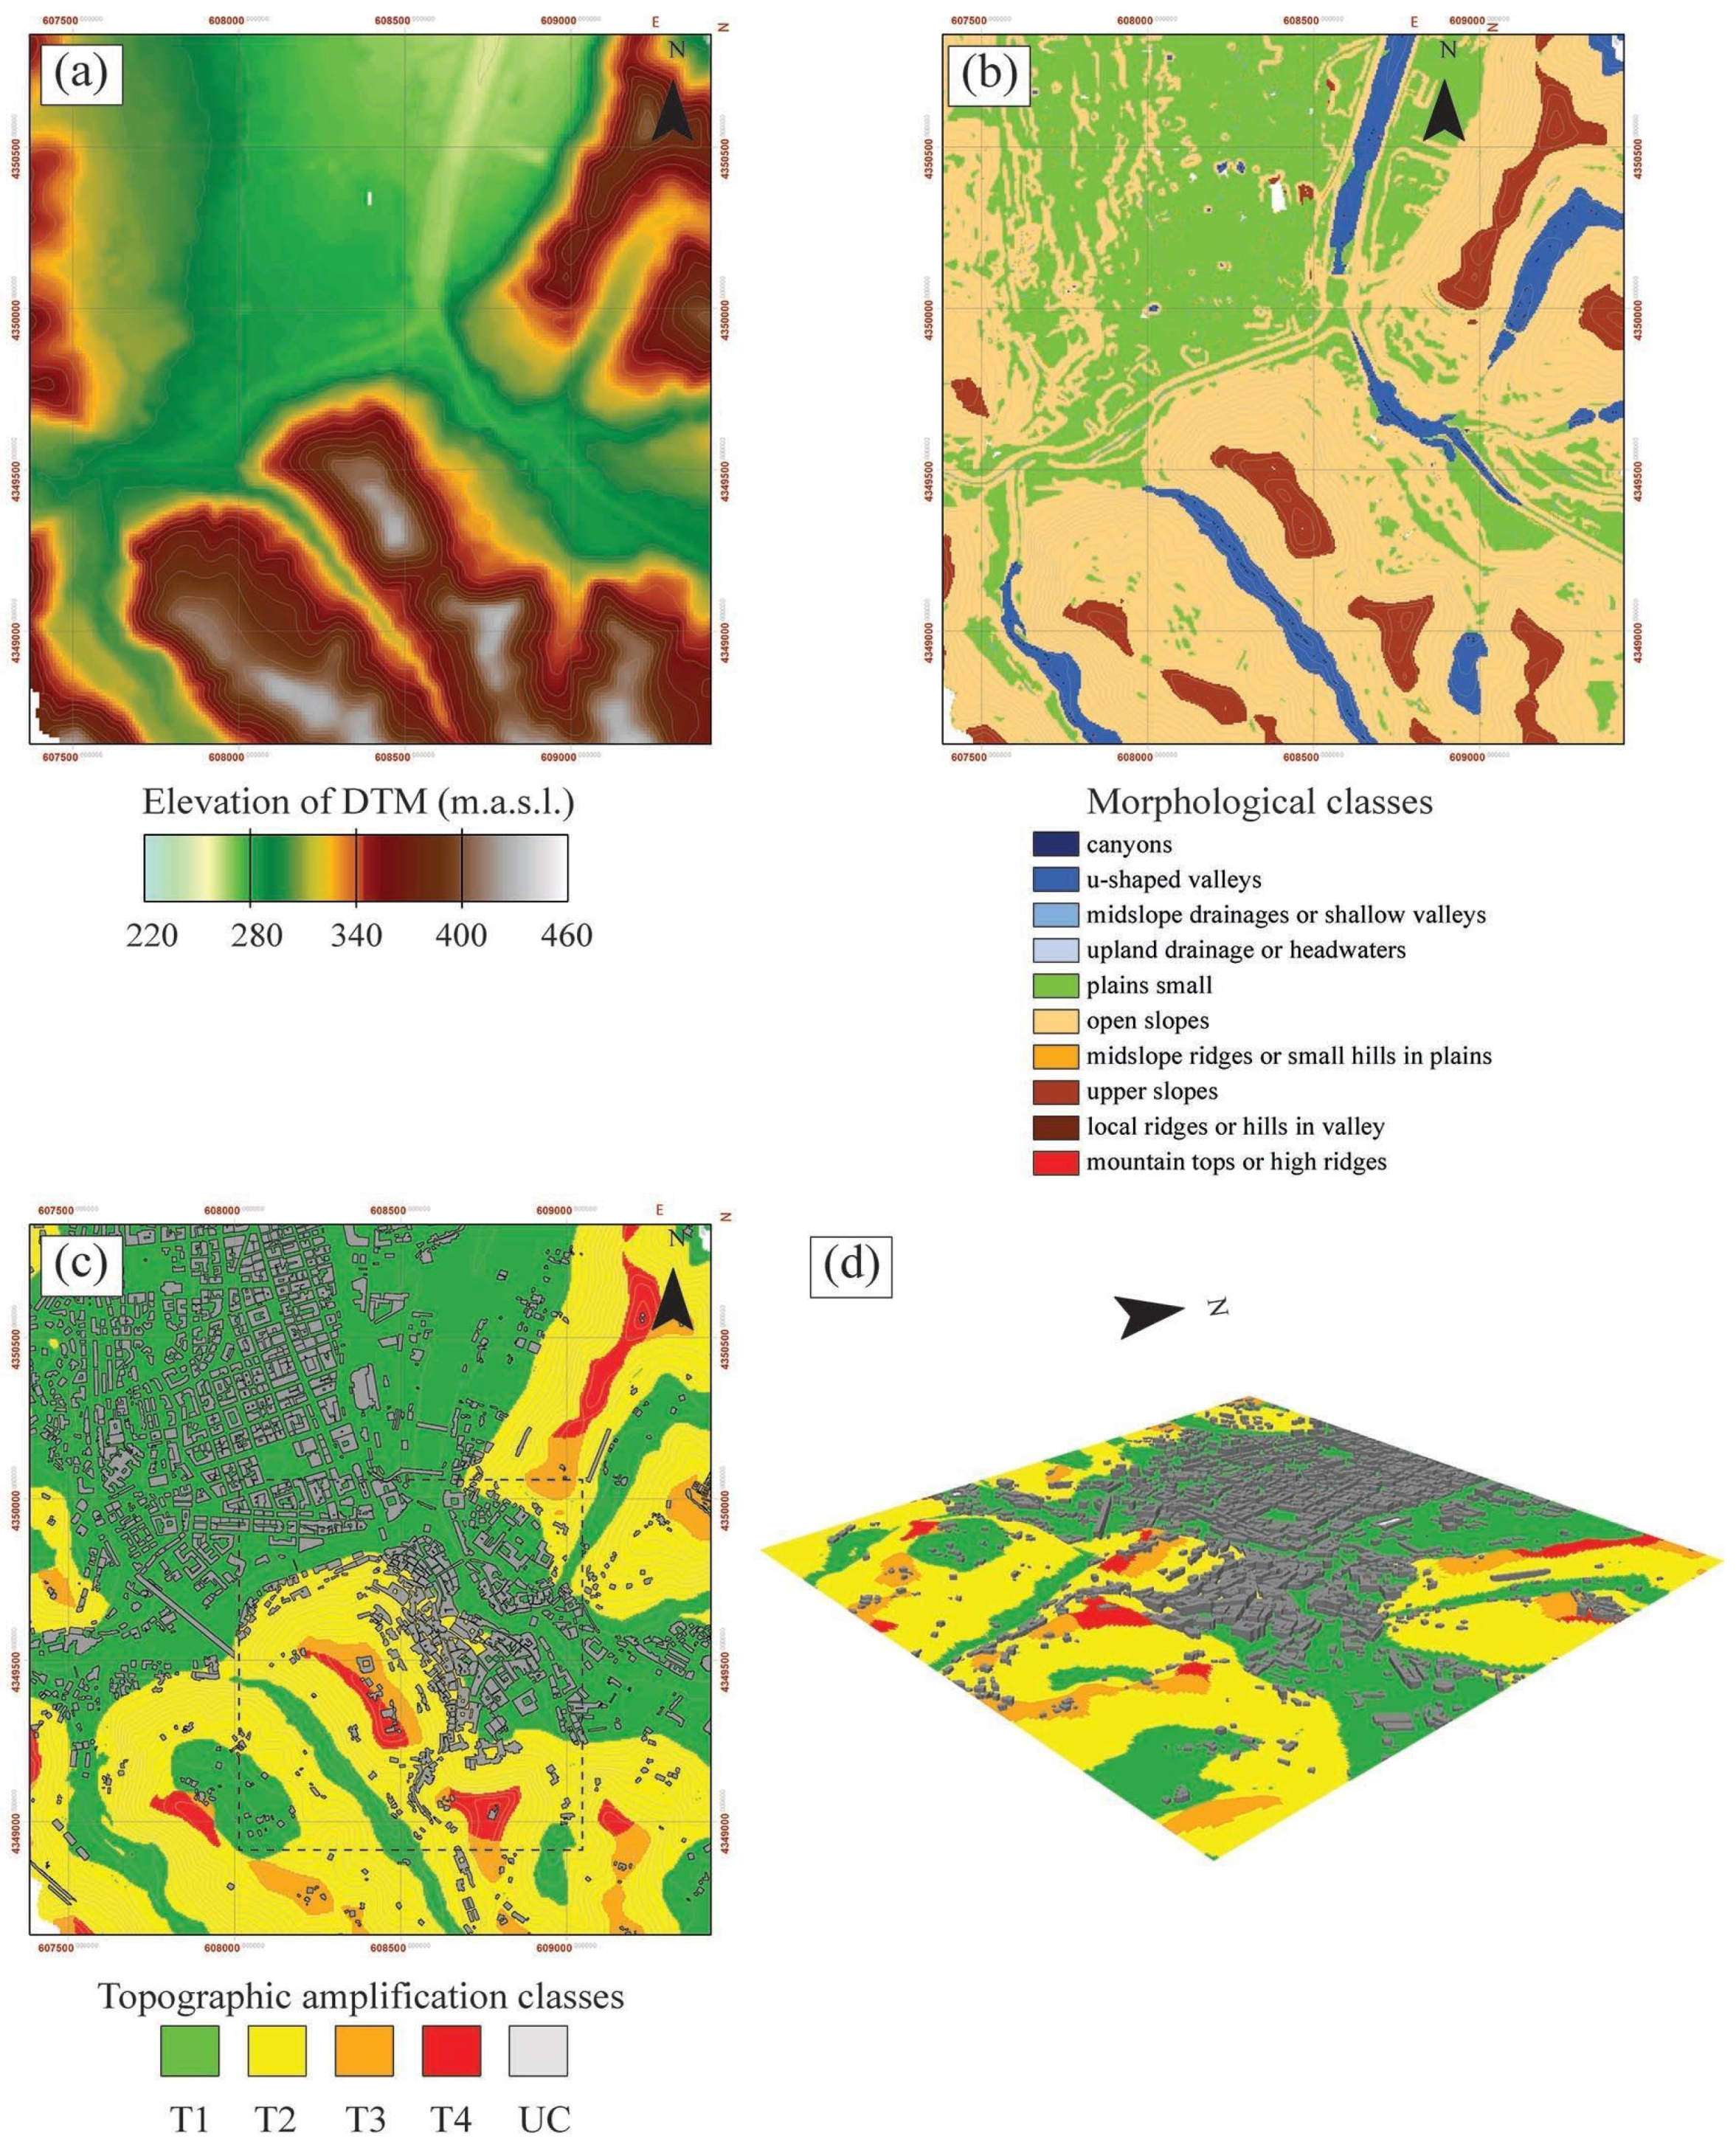
Referring to the topographic assessment analysis, the DTM has been provided by, firstly, interpolating airborne LiDAR data at a pixel size of 5 m × 5 m (
Figure 8a); hence, it has been processed through a low-pass filter in order to reduce topographic outliers. In
Figure 8b the morphological classification is mapped according to the modified Weiss approach. The average of the height values around each central point has been calculated using a radius of 250 m. Conversely, maximum and average slopes have been evaluated by considering a radius of 100 m, in order to identify the different classes defined by the EC8. In particular, the flat earth component and the open slopes have been classified through the average slope; whereas, for the middle-upper slopes, isolated hills and crests of cliffs, the maximum slope has been taken into account for evaluating the more appropriate topographic class. In
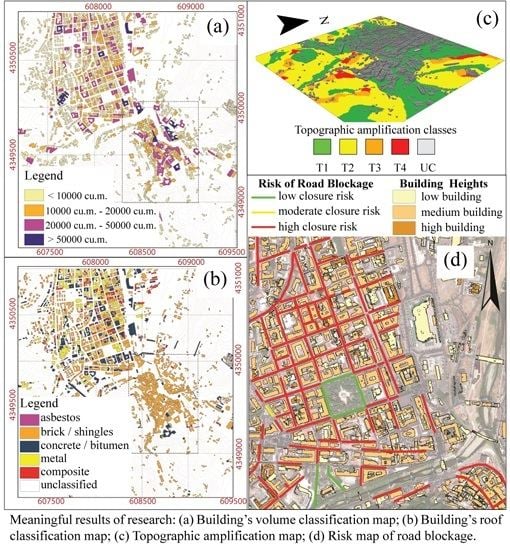
Figure 8c, the topographic assessment map of the Cosenza urban area is shown in terms of topographic classes proposed by the technical code. In
Figure 8d a 3D view of this classification analysis is projected on the local DTM, where the building positions are further provided. Experimental results clearly show that 54% of the whole observed area is characterized by flat surfaces and, hence, classified as T1 class (see the green-colored areas in
Figure 8c,d). Conversely, 38% of the study area is characterized by high-slope (greater than 15%) and, hence, classified as T2 (see the yellow-area in
Figure 8c,d). Moreover, 6% and 2% of the observed scenario represent areas at the top of reliefs with surrounding slopes lower and greater than 15%, respectively, and then classified as T3 or T4 classes (respectively, the orange and red areas in
Figure 8c,d). In summary, for T2 and T3 classes, the EC8 code suggests considering a topographic amplification factor greater than 1.2, which represents a constant scaling multiplier for all the ordinates of the elastic design response spectrum. Conversely, the amplification factor increases up to 1.4 for T4 class. In detail, it can be observed that the historic center of Cosenza is susceptible to non-negligible phenomena of topographic amplification (see dashed box in
Figure 8c), thereby exposing the observed area to high risk in case of hazardous earthquakes.
Figure 8.
LiDAR-based topographic assessment analysis according to EC8. (a) DTM; (b) morphological classification according to the modified Weiss procedure; (c) 2D map; and (d) 3D view of the topographic amplification classes based on the indications of EC8 code.
Figure 8.
LiDAR-based topographic assessment analysis according to EC8. (a) DTM; (b) morphological classification according to the modified Weiss procedure; (c) 2D map; and (d) 3D view of the topographic amplification classes based on the indications of EC8 code.
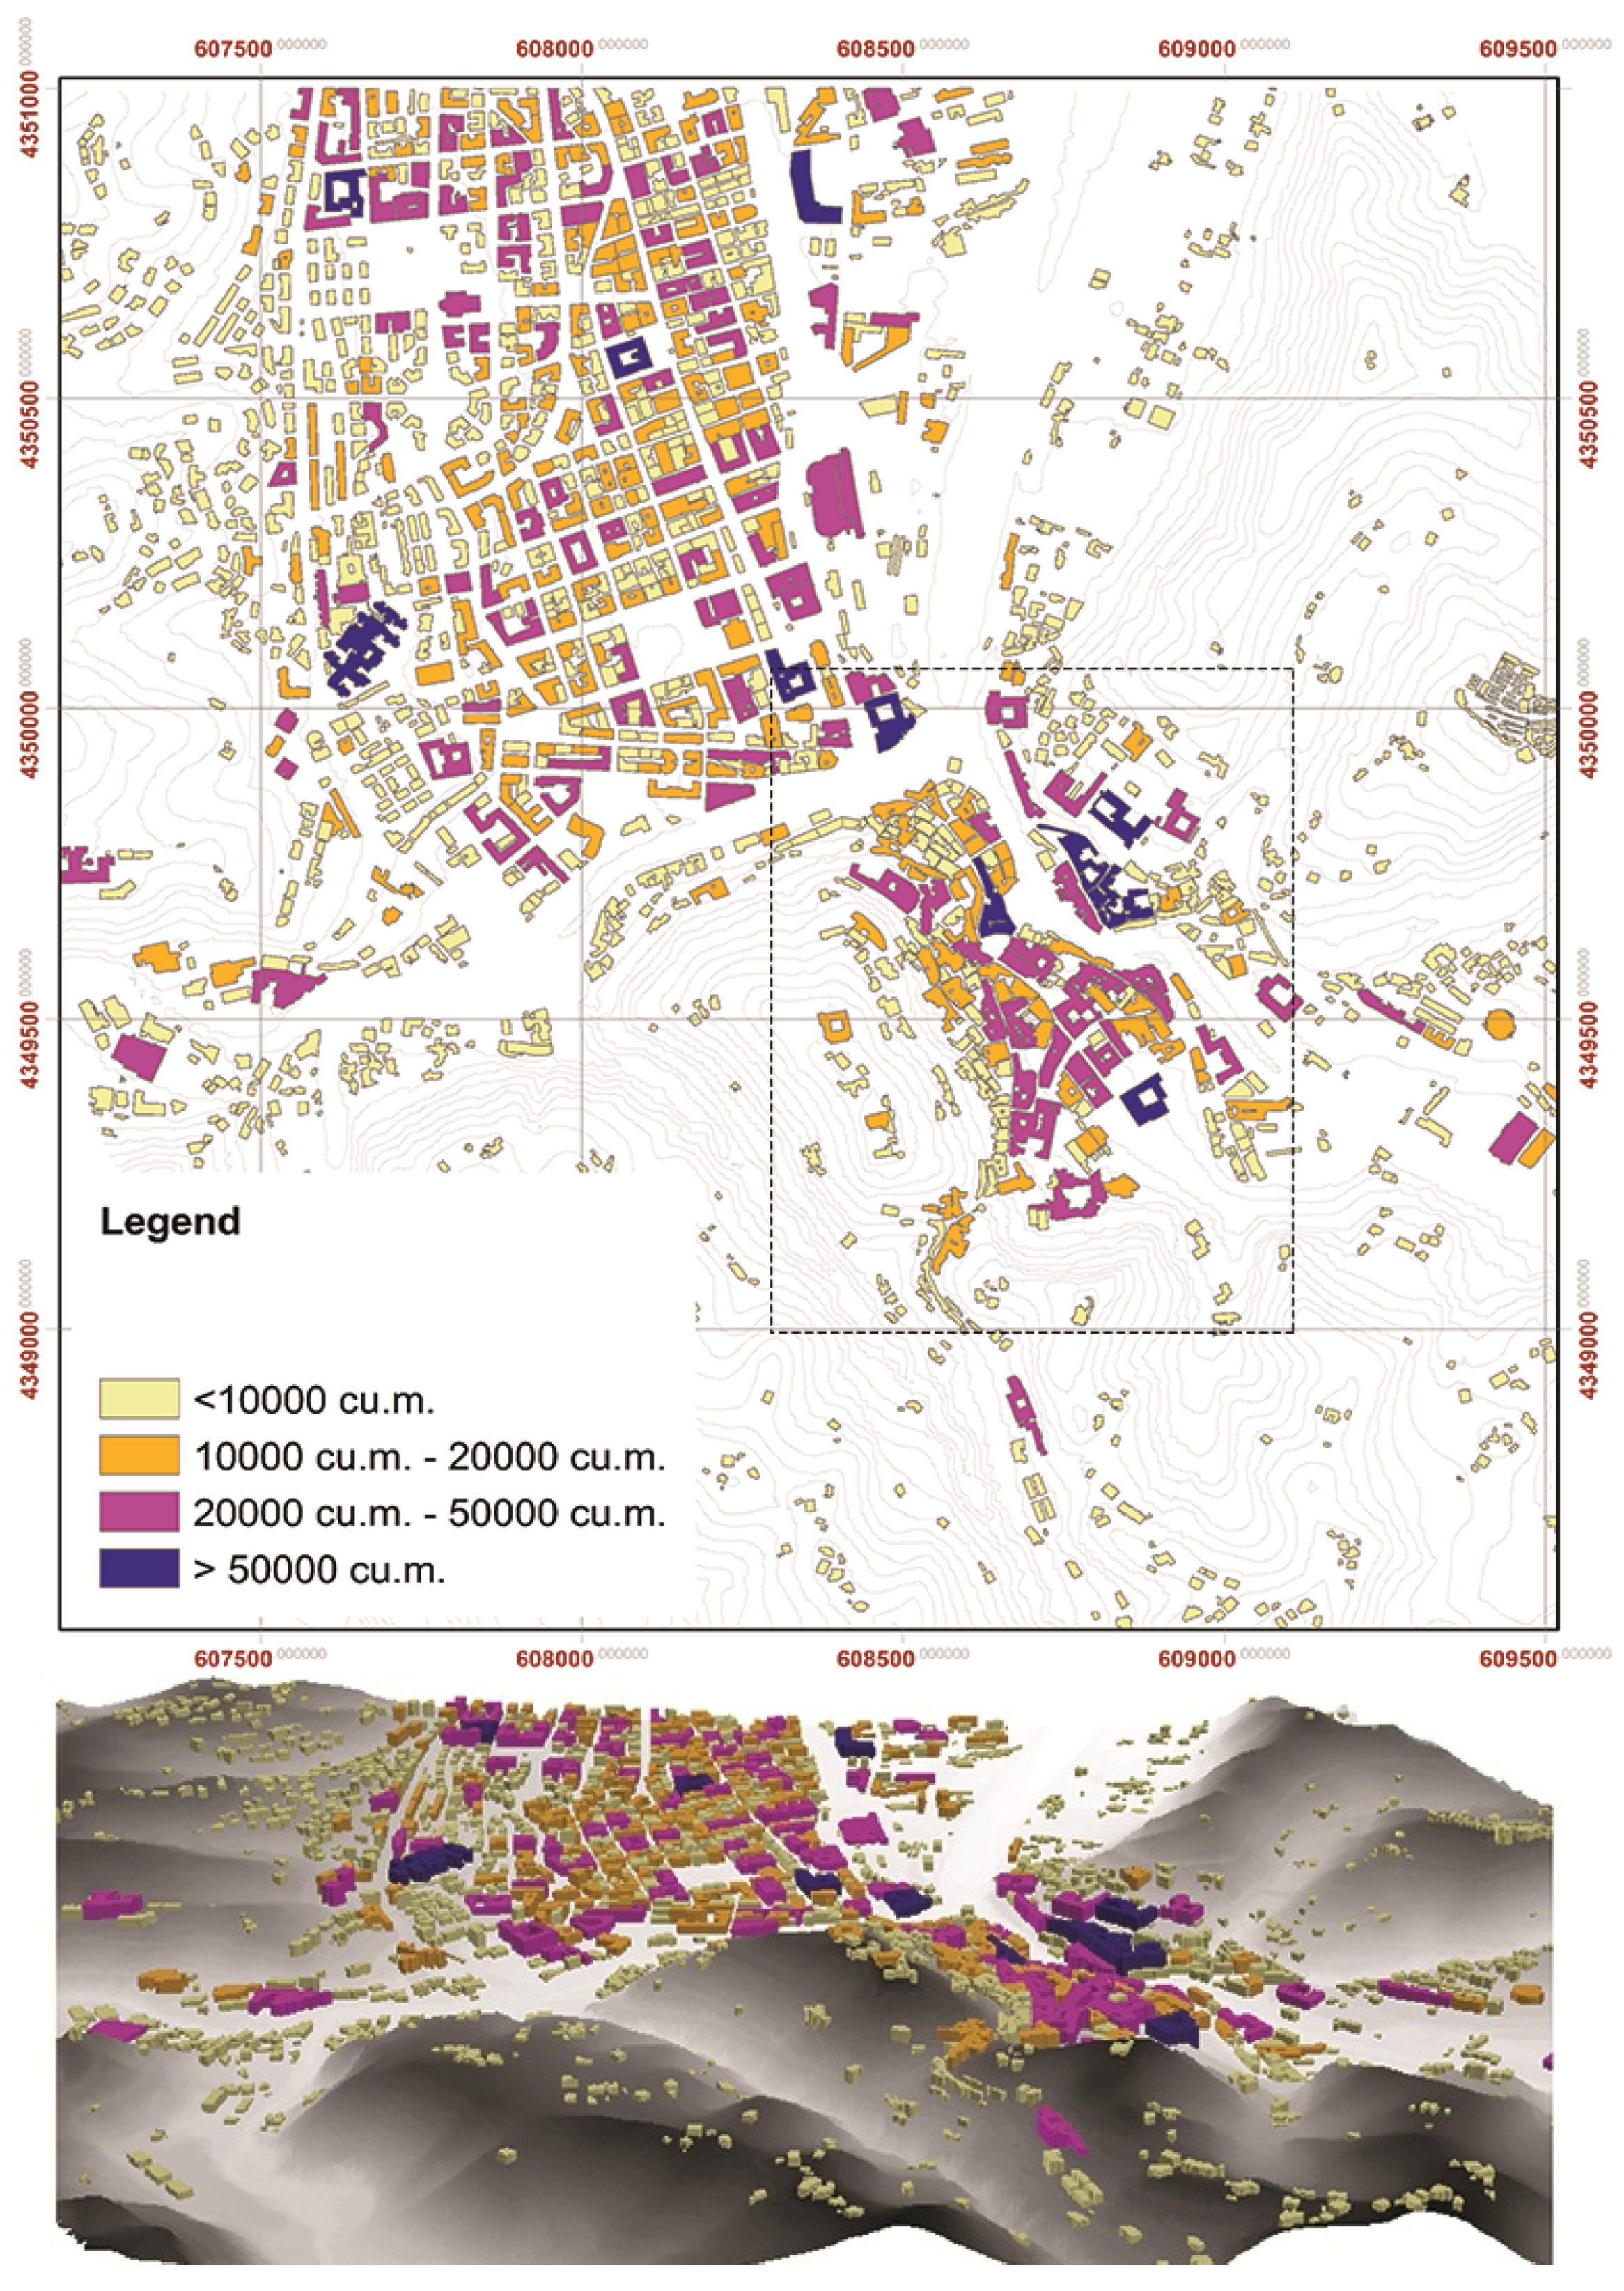
In
Figure 9, the building assessment map is shown in terms of building footprints together with full and empty volumes (in cubic meter, cu.m.) occupied by each structure. Experimental results show that the greatest part of the buildings have volumes lower than 50,000 cu.m. with the exception of some structures (e.g., hospital, prefecture, and buildings that host strategic functions), which exhibit wide extension in area coverage and/or height. Referring to the city historical center (see dashed box in
Figure 9), a great number of buildings show volumes greater than 20,000 cu.m. due to aggregate structures and significant heritage of the area (
i.e., theatre and religious compounds).
Figure 9.
Classification of the buildings in the urban area of Cosenza based on the volumes’ (upper panel) 2D map, and (lower panel) 3D view.
Figure 9.
Classification of the buildings in the urban area of Cosenza based on the volumes’ (upper panel) 2D map, and (lower panel) 3D view.
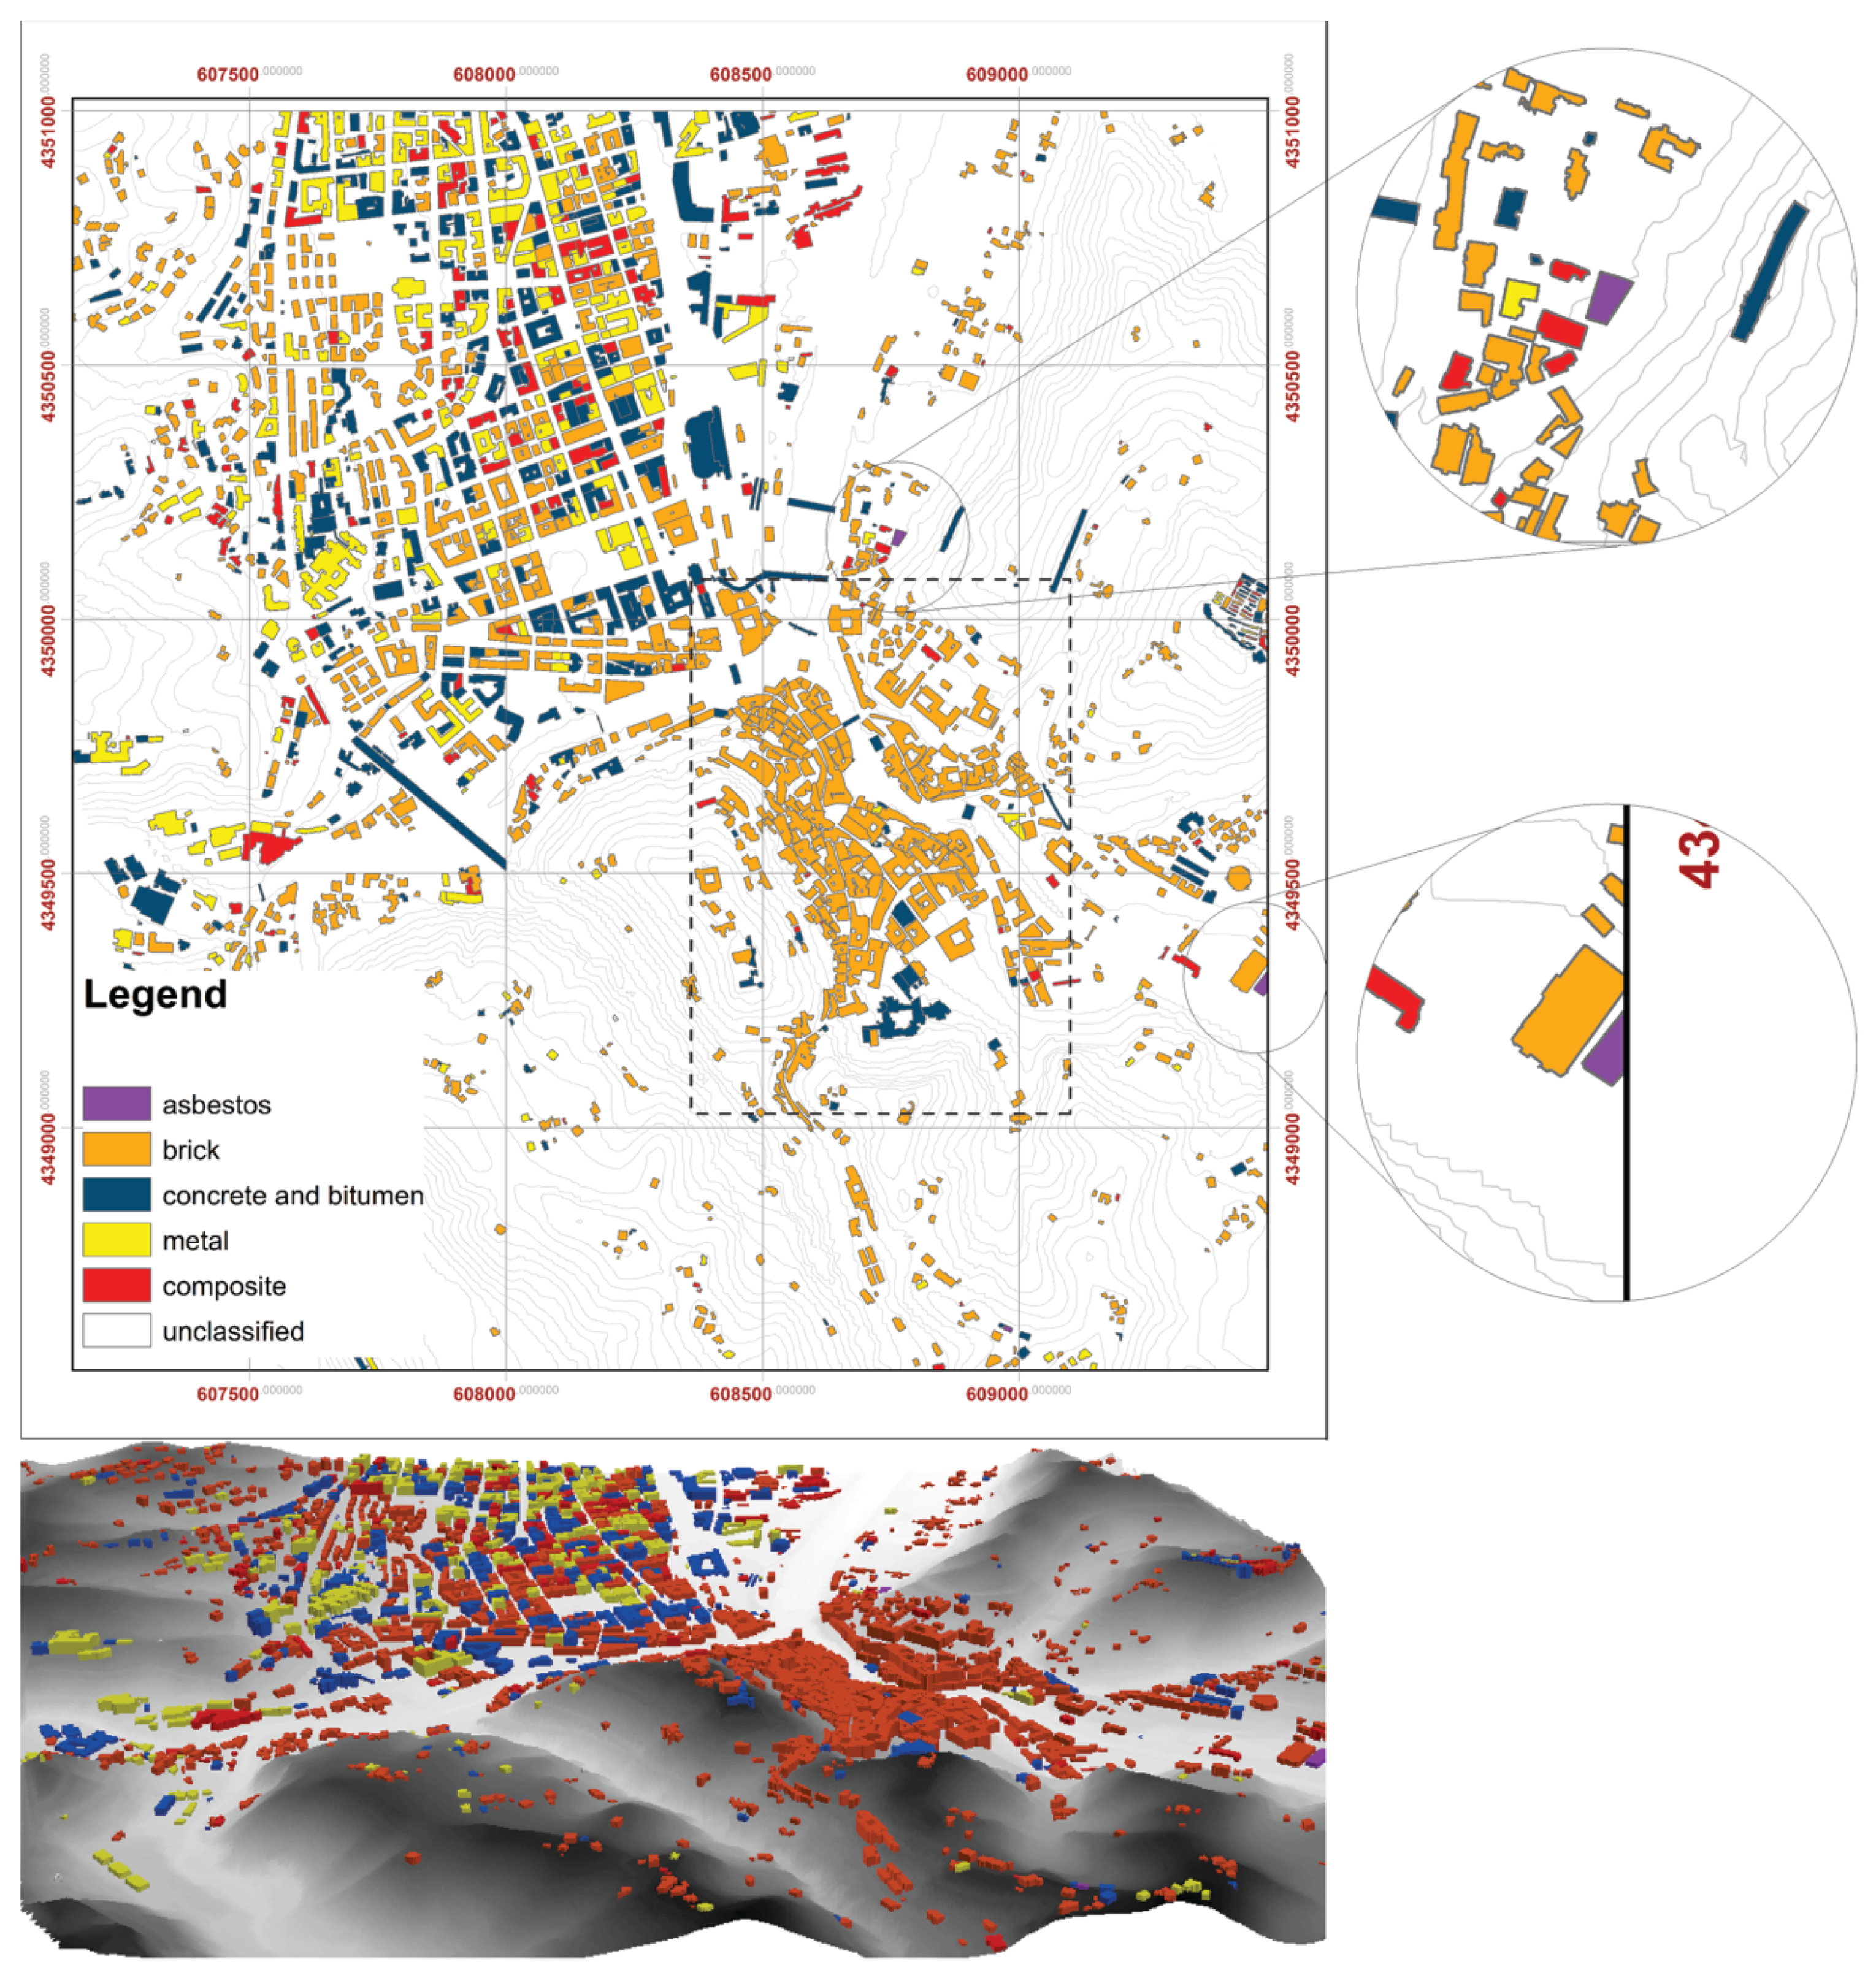
In
Figure 10, the building assessment map is shown in terms of building roof typologies. As mentioned in
Section 4.1, some roof typology classes have been considered for the SAM-based classification procedure of the hyperspectral data based on the main roof construction features of the South Italy landscape. The results of the SAM-based classification have been summarized in a geospatial table within a GIS environment, which contains the point-wise information of detected building coverage materials. To properly assign the roof typology class to each building footprint recognized by LiDAR survey, the ratio between the area of each identified material and the one associated to the whole building has been evaluated. If one of the materials is prevailing with respect to the others with a ratio greater than 50%, the building roof typology is classified accordingly, otherwise the “composite” class is assigned.
Experimental results clearly show that the more recent part of the city (see the central-upper part of the map in
Figure 10) is characterized by different heterogeneous roof typologies. Conversely, the historical city center (see dashed box in
Figure 10) is mainly characterized by buildings with brick and shingle roofs together with high slopes, although some modern structures are visible. These results are very useful, especially considering the construction features of South Italy; in fact, the identification of shingles and brick roofs, combined with the building information extrapolated by consecutive urban plans, allows a first screening phase to select the more ancient buildings of the area. Moreover, the type of building roof can provide information on both the weight and the slope of the coverage associated to typical methods of construction. The latter could be used, together with information on the local seismic response, as well as the building geometry and the construction materials, to assign an attention index for each building of the observed area. Referring to the presence of critical infrastructures, some asbestos roofs are recognized and detected (see circular zoom in
Figure 10), which are relevant to some industrial building. This result is important to evaluate the environmental risk and the economic exposure of structures, especially in case of seismic shaking.
Figure 10.
Classification of the buildings in the urban area of Cosenza based on the roof material: (upper panel) 2D map and (lower panel) 3D view.
Figure 10.
Classification of the buildings in the urban area of Cosenza based on the roof material: (upper panel) 2D map and (lower panel) 3D view.
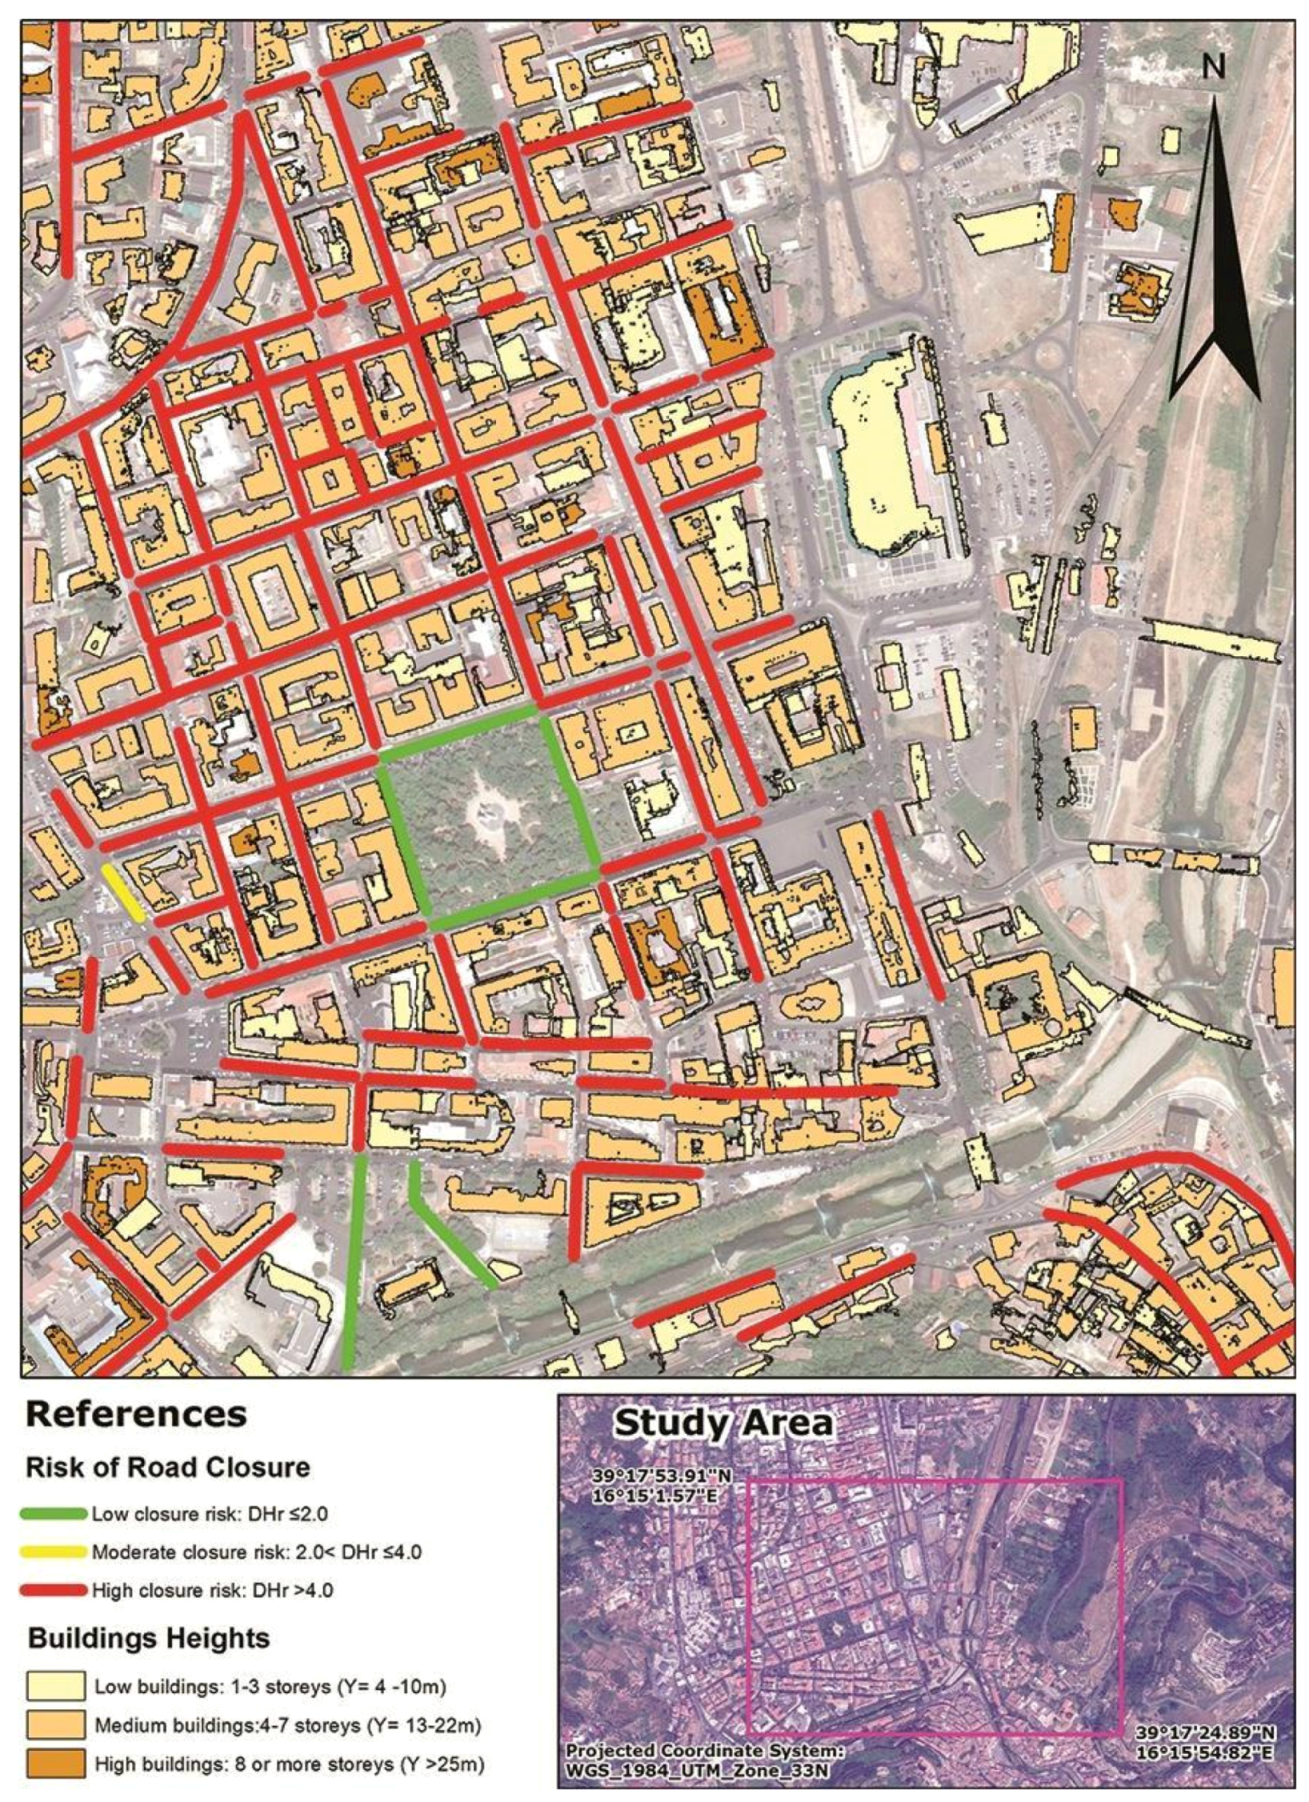
Finally, following the procedure proposed in
Section 4.4, a road assessment map is shown in
Figure 11 in terms of the roads closing risk due to strong earthquakes for a more recent part of the city; given the small width of roads in the historical center, the analysis would have been superfluous. The road risk block index has been quantified as function of the building volumes, with the hypothesis of a total building collapse independently of construction materials. The three different colors in
Figure 11 are correlated to the risk of blockage due to collapse of buildings,
i.e., green for low risk, yellow for moderate risk, and red for high risk. Experimental results show that most of Cosenza urban roads are characterized by high risk of blockages; only a small area in the southern part and the central sector, where a wide square is present, shows a low risk of road blockage.
Figure 11.
Risk map of the blockage of the roads for a selected area of Cosenza.
Figure 11.
Risk map of the blockage of the roads for a selected area of Cosenza.
These results allow understanding how the city of Cosenza may have serious drawbacks for evacuation in case of building collapses during a strong seismic event. Such a pattern of closeness between multi-historic buildings and road facilities is reflected in most European cities. In order to improve the assessment of the roadblock risk, additional information could be taken into account for the next improvement of the proposed approach, such as the materials composition and the time of the building construction, as well as the code technique adopted for such constructions.
In conclusion, all the experimental results allow demonstrating the operational benefits of the proposed approach for evaluating topographic, building, and road assessment features of a seismic urbanized area. Moreover, the combined use and exploitation of airborne LiDAR and hyperspectral measurements provides (a) the definition and the development of remote sensing data archives for the assessment of vulnerability, the evaluation of risk, as well as the planning and the management of emergencies; (b) the informatization of spatial data for both the assessment of seismic urban areas and civil protection purposes, especially in case of building collapses because of seismic events; and (c) the identification and the characterization of historic city center features with respect to new urban settlements. These high spectral and high spatial resolution value-added products can effectively address issues and needs of different stakeholders involved in environmental protection, planning, and management. In this context, experimental results further highlight, indirectly, the benefits and the powerful capabilities of GIS for providing advanced functions and tools needed to efficiently capture, store, manipulate, analyze, and display the multi-layer spatial georeferenced information about urban resources. In detail, referring to the Cosenza urban environment, they show that the more recent part of the city is characterized by heterogeneous buildings with different roof typology materials, located over flat surface morphologies with low topographic amplification values. Conversely, the historic city center is characterized by aggregate homogeneous ancient buildings with brick roofs, located within an area with different morphological features and then susceptible to non-negligible topographic amplification phenomena. In addition to the topographic and building assessment analyses, experimental results show the high risk of road closure due to building collapses in the case of destructive earthquakes for the whole urban area, thus showing high levels of both exposure and seismic vulnerability, as well as the needing of ad hoc strategies for risk mitigation plans.
6. Conclusions
In this study, an innovative methodology for supporting both vulnerability assessment and mitigation plans of urban areas and infrastructures within a seismic environment has been tested. The novelty, as well as the objectives and the operational usefulness of the proposed work, mainly rely on the combined use and exploitation of innovative airborne LiDAR and hyperspectral imagery for supporting both urban assessment analyses and seismic vulnerability mitigation purposes. On the one hand, LiDAR measurements, acquired by the airborne RIEGL LMS-Q680i sensor, have been processed through classical signal processing techniques to provide topographic (DTM and DSM maps) and geometric features of the urban environment. On the other hand, airborne hyperspectral IMSpectorV10E VNIR measurements, acquired by the IPERGEO sensor, have been processed through the SAM-based supervised classification algorithm to provide land-use and land-cover maps of an urban area. The latter allows identifying the roof typologies of buildings, the main road facilities, as well as surrounding natural environments (e.g., terrain and vegetated areas). All of these remotely-sensed maps are intermediate products and have been properly integrated within a GIS platform to obtain topographic, building, and road assessment maps. The latter represent value-added products supporting the assessment and the mitigation of seismic vulnerability in urban areas. These products have been obtained using consolidated, efficient, and widely used commercial software and algorithms, able to manage, process, combine, and exploit novel, innovative, and high-resolution airborne remote sensing products for operational applications.
Experimental results, gathered for the urban area of Cosenza, Italy, have demonstrated both the powerful capabilities of high-resolution, airborne, remotely-sensed measurements and the benefits of the proposed approach for seismic vulnerability assessment purposes. The joint use of LiDAR and hyperspectral intermediate products have provided synthetic value-added thematic maps of the observed urban environment. Such maps can be used for evaluating and assessing the exposure level and the seismic vulnerability of urban areas in case of earthquakes, based on the analysis of co-located topographic amplification values, structural building features, and road facilities. Moreover, they can be used to (i) integrate, support, and overcome classical techniques and existing space-borne remote-sensing approaches adopted for environmental/urban seismic vulnerability assessments at regional and urban scales; (ii) update existing and/or ancient land registers (e.g., cadastral plans or road inventories by the municipalities), which can be further directed to all end-users even as geospatial digital maps; and (iii) provide a centralized geospatial database for assessing topographic, building, and road networking features of urban environments in view of seismic vulnerability mitigation as well as pre- and post-earthquake intervention plans.
Future outlooks of the proposed work will concern the digitization of available land registers within a GIS platform environment in order to (i) integrate, assess, and validate airborne remote-sensing products and results with in-depth quantitative and qualitative analyses; and (ii) update old land registers of the observed test area with high-resolution geospatial remotely-sensed databases and information.


 ,
, 


