
A Generic Framework for Using Multi-Dimensional Earth Observation Data in GIS


Abstract
:
1. Introduction
2. Materials and Related Work
2.1. EO Data Format, Tools, and Related Work
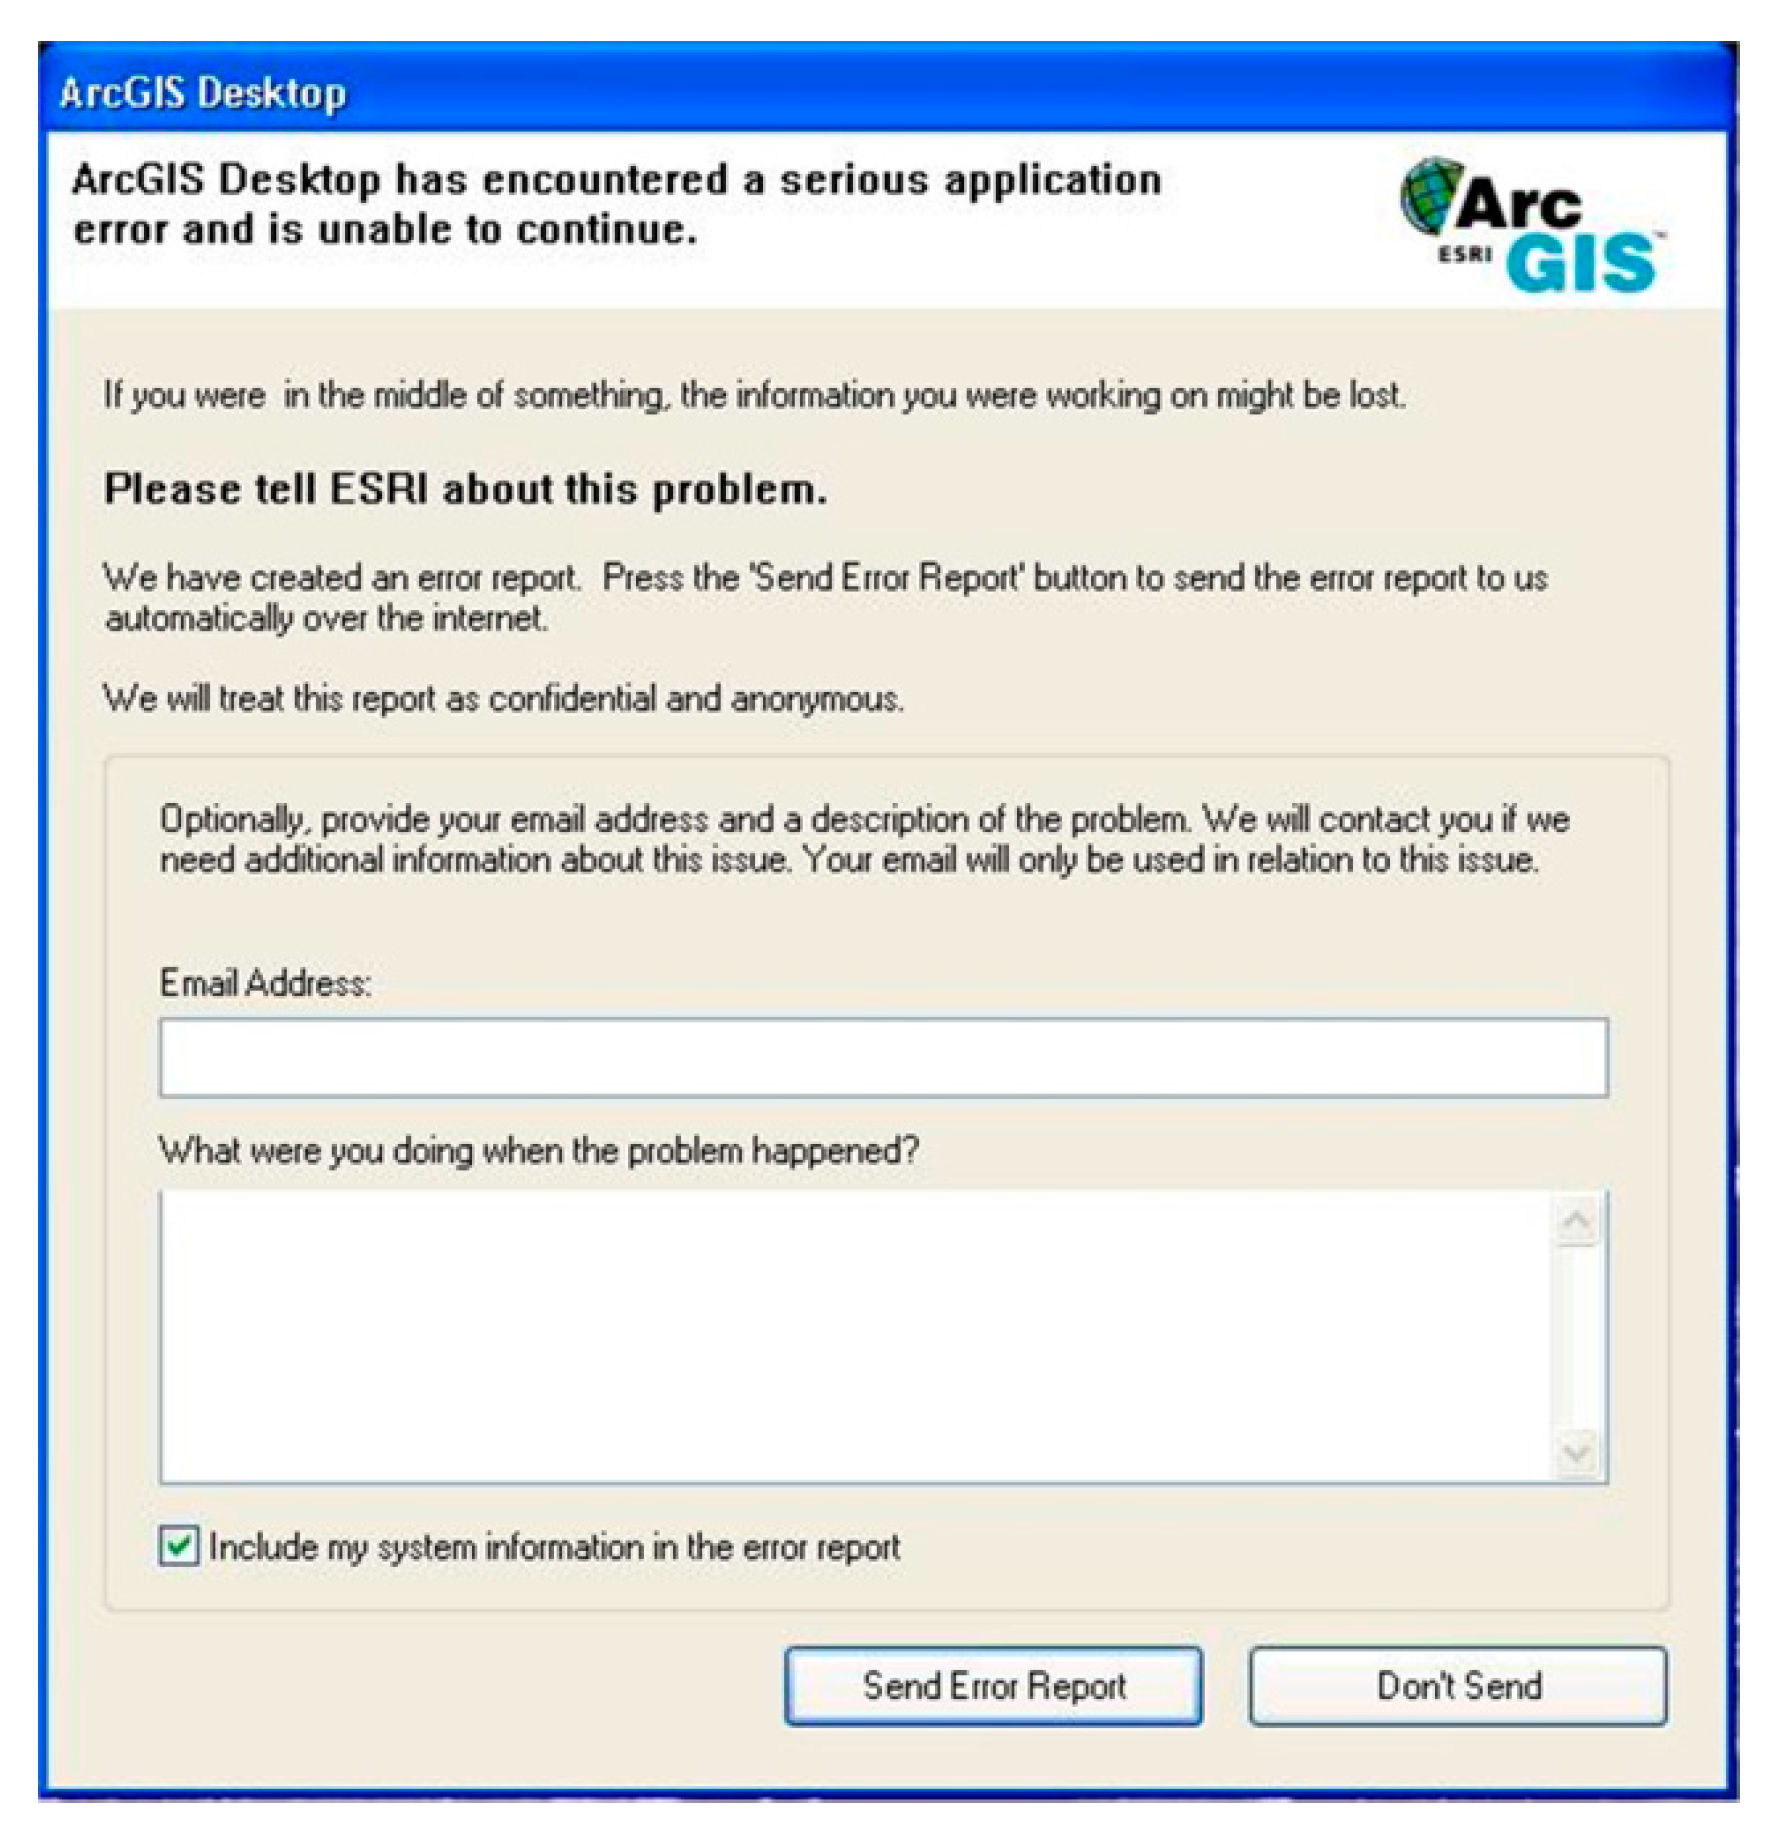
2.2. Common Challenges when Using EO Data in GIS
- Problem 1: 90 degrees rotated and inverted upside down image
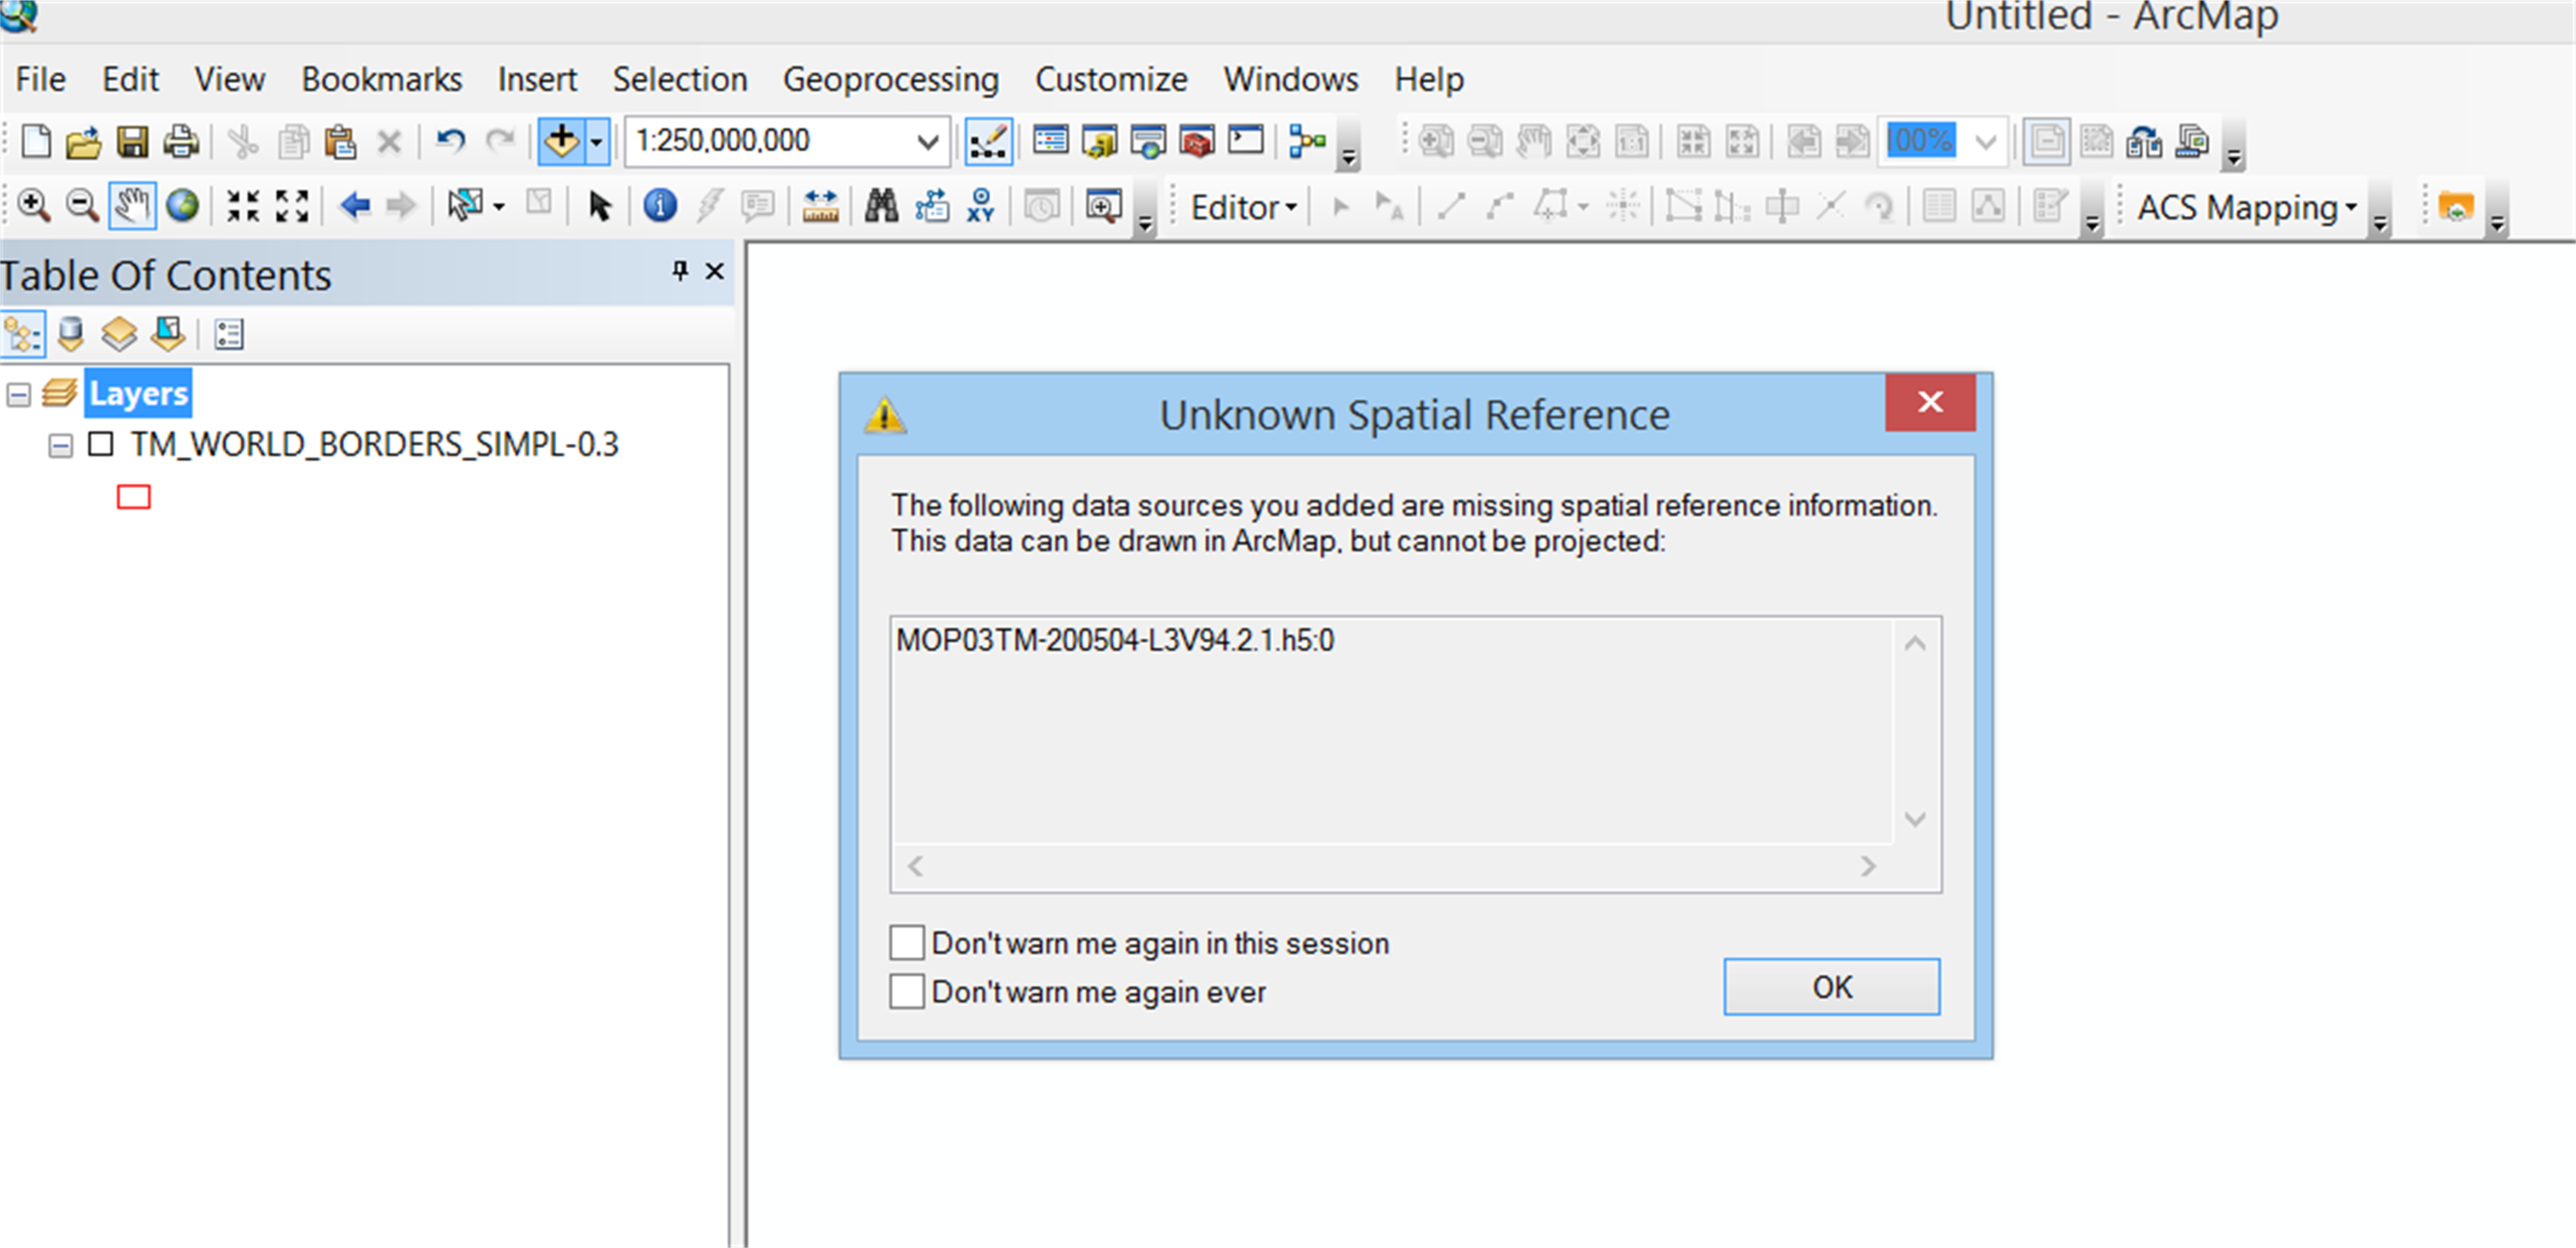
- Problem 2: Missing geo-reference information
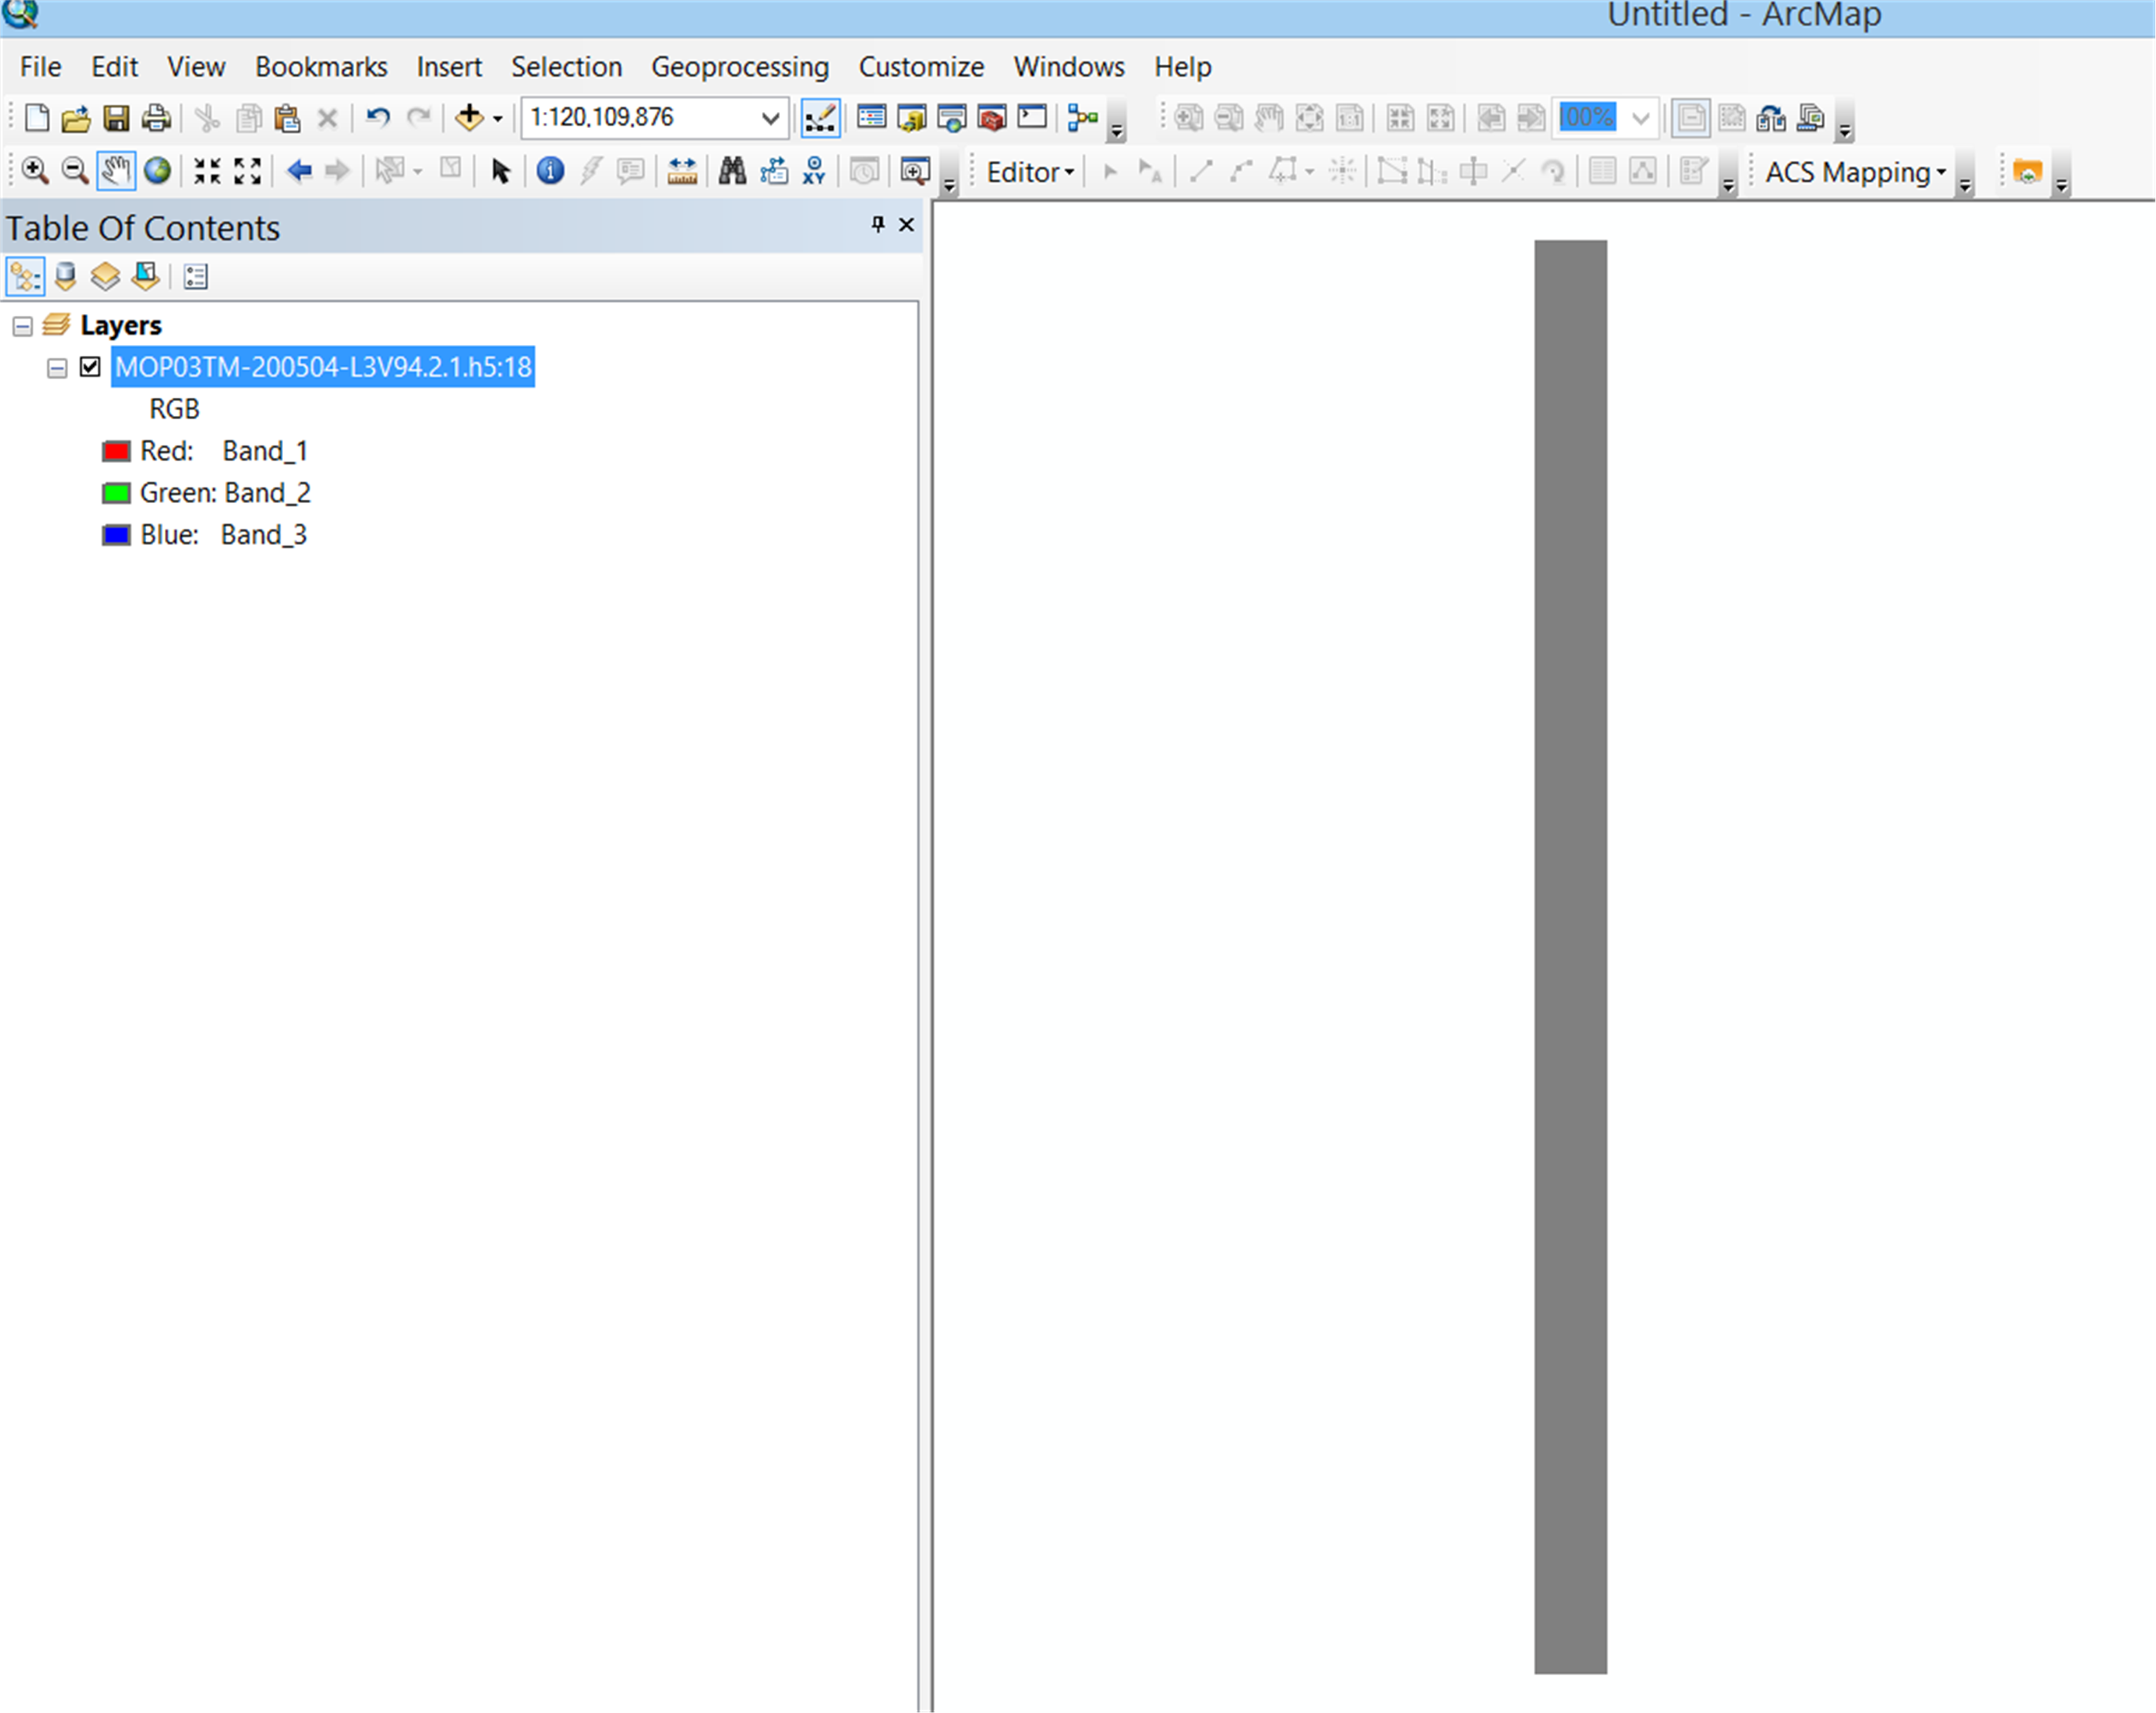
- Problem 3: 3D subsets cannot be interpreted correctly
- Problem 4: Missing metadata
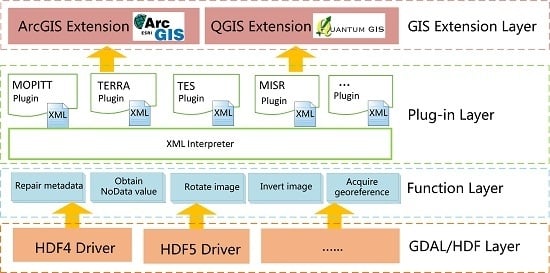
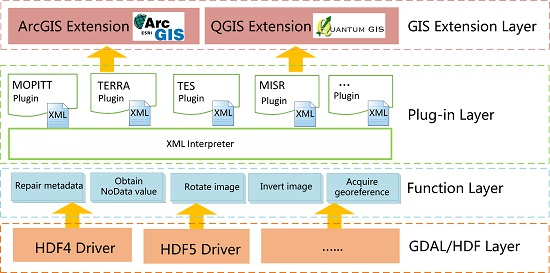
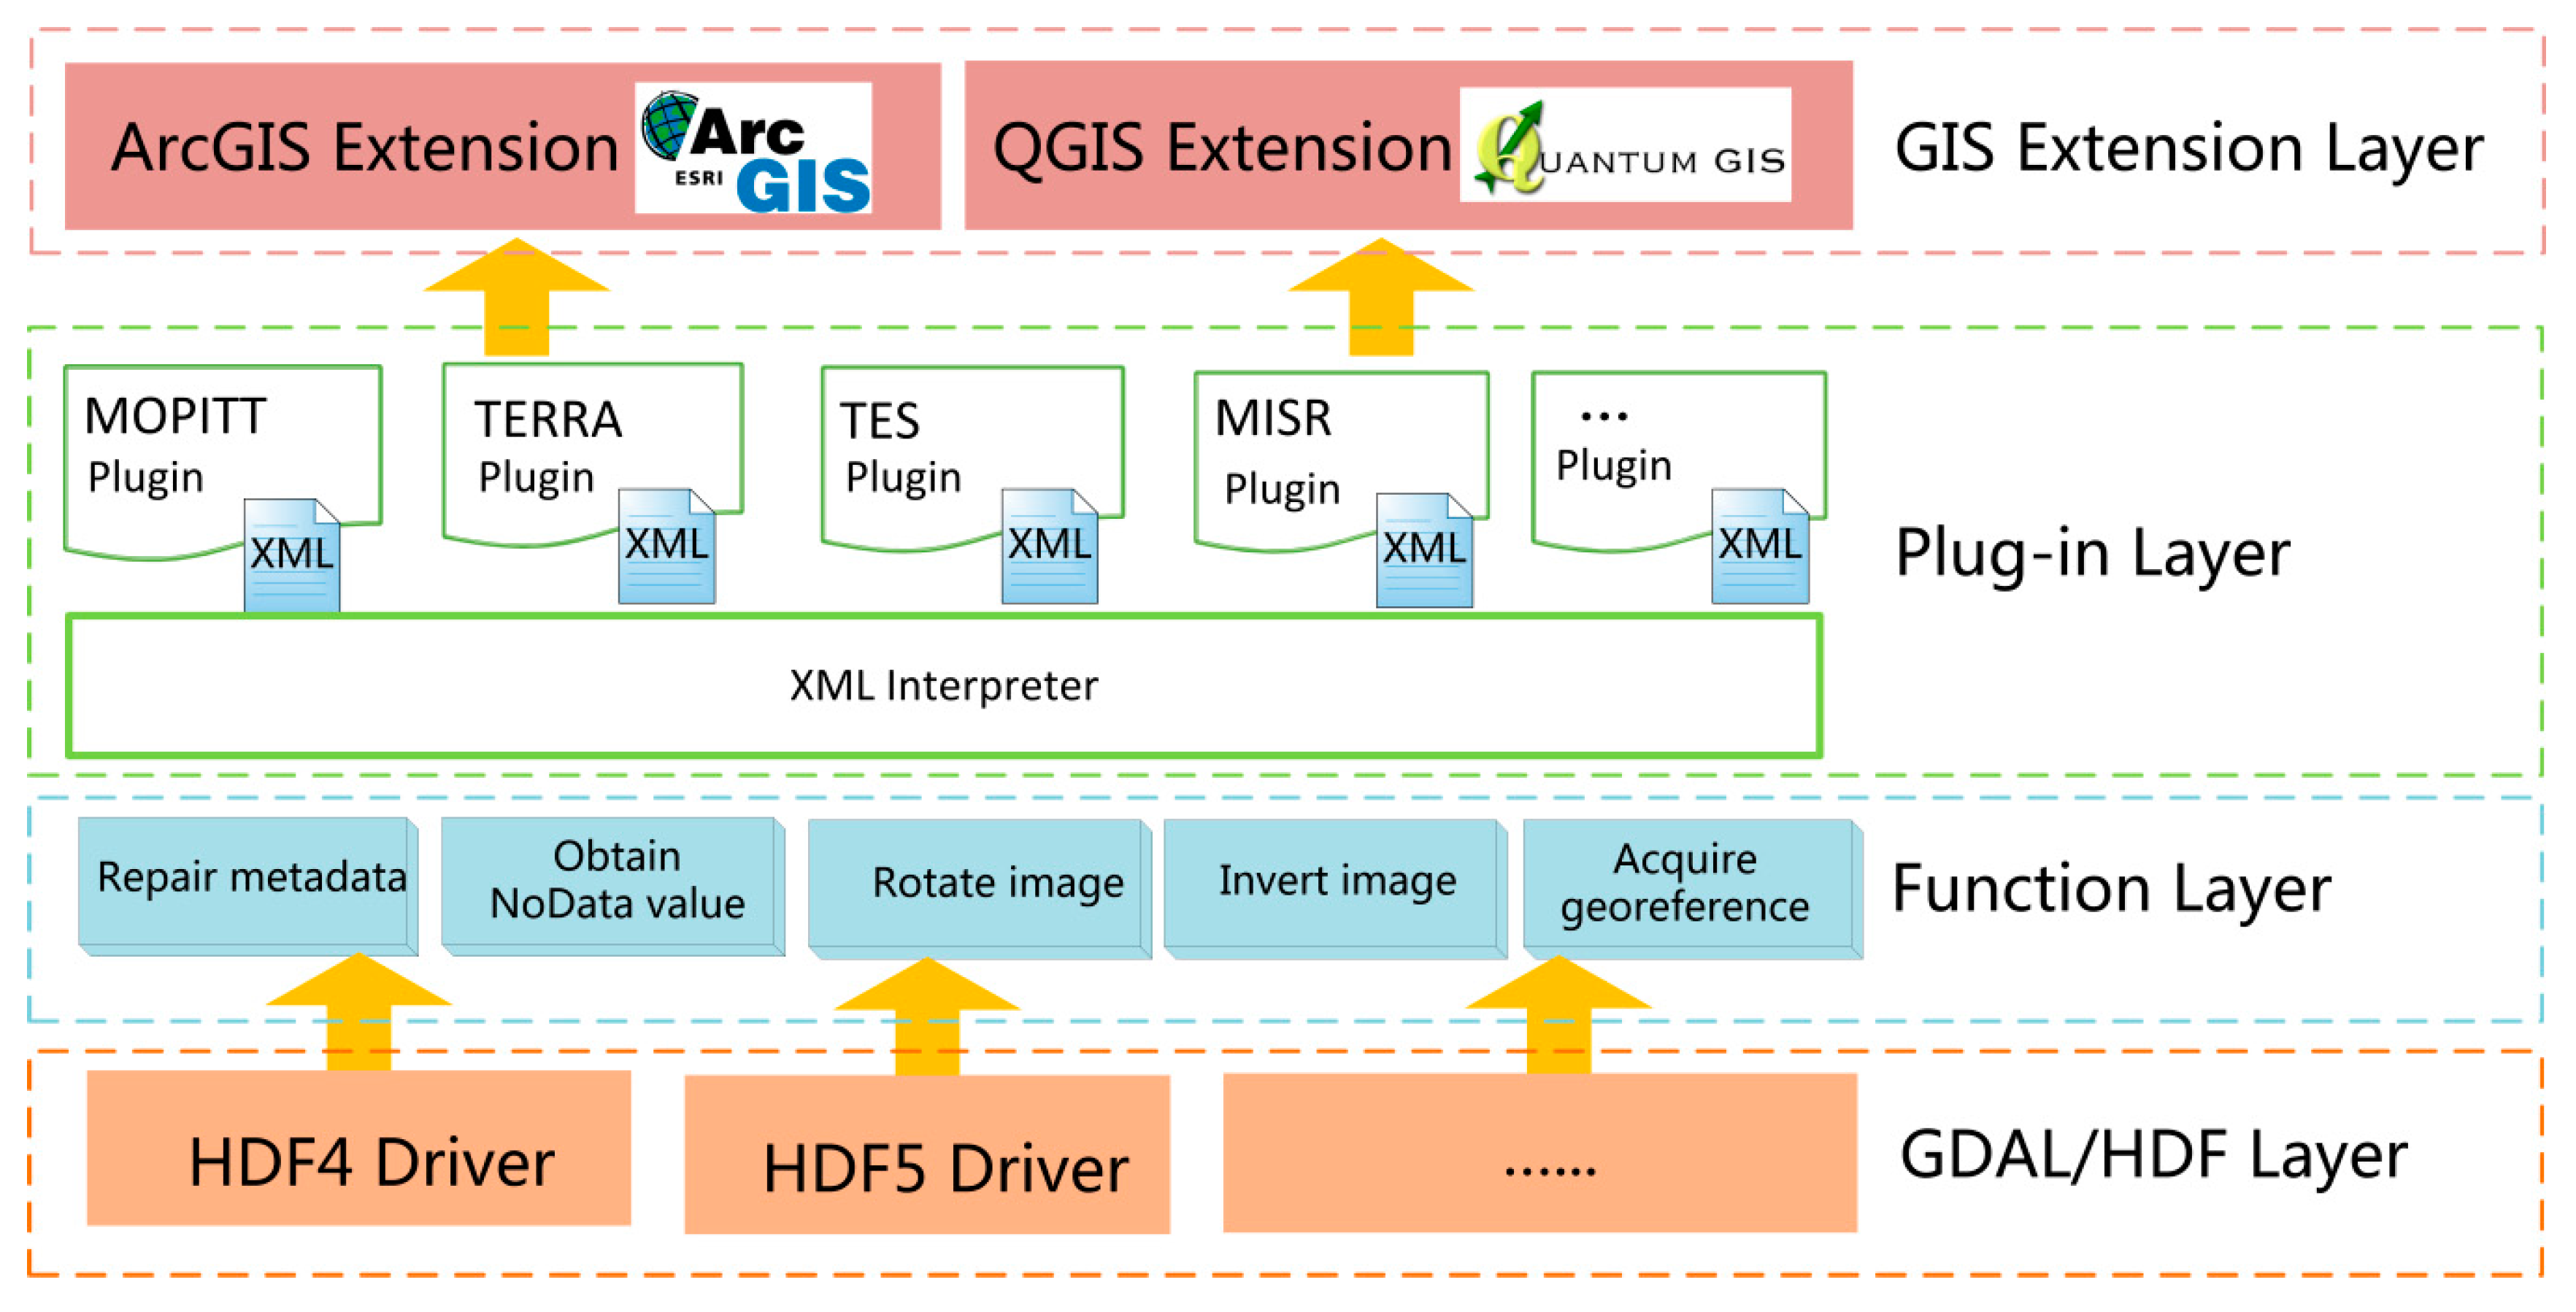
3. Methods
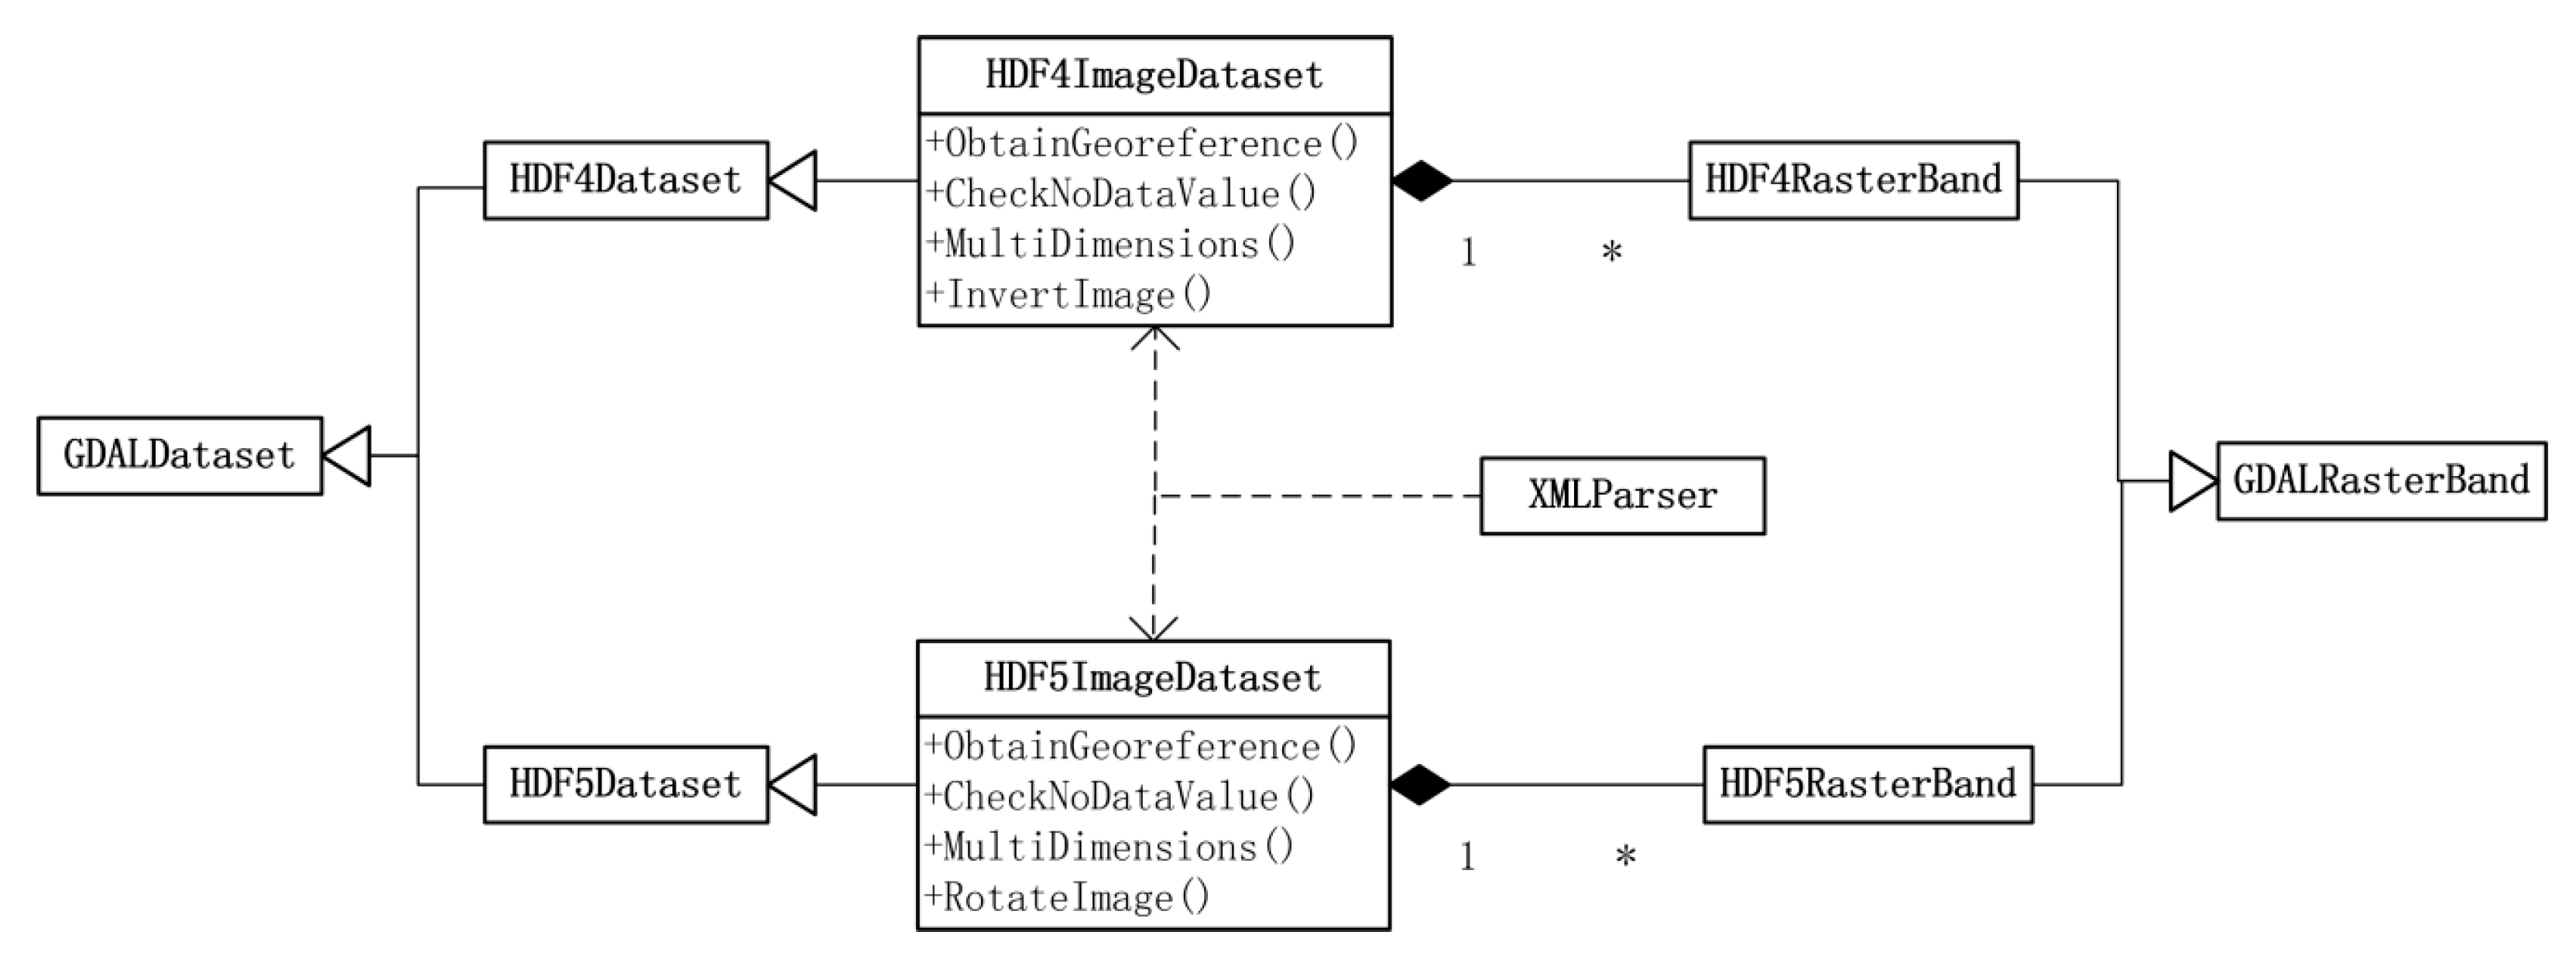
3.1. GDAL/HDF Layer
3.2. Function Layer
3.2.1. Metadata Functions
3.2.2. Image Displaying Functions
3.2.3. Interpreting Functions
3.2.4. Spatial Reference Functions
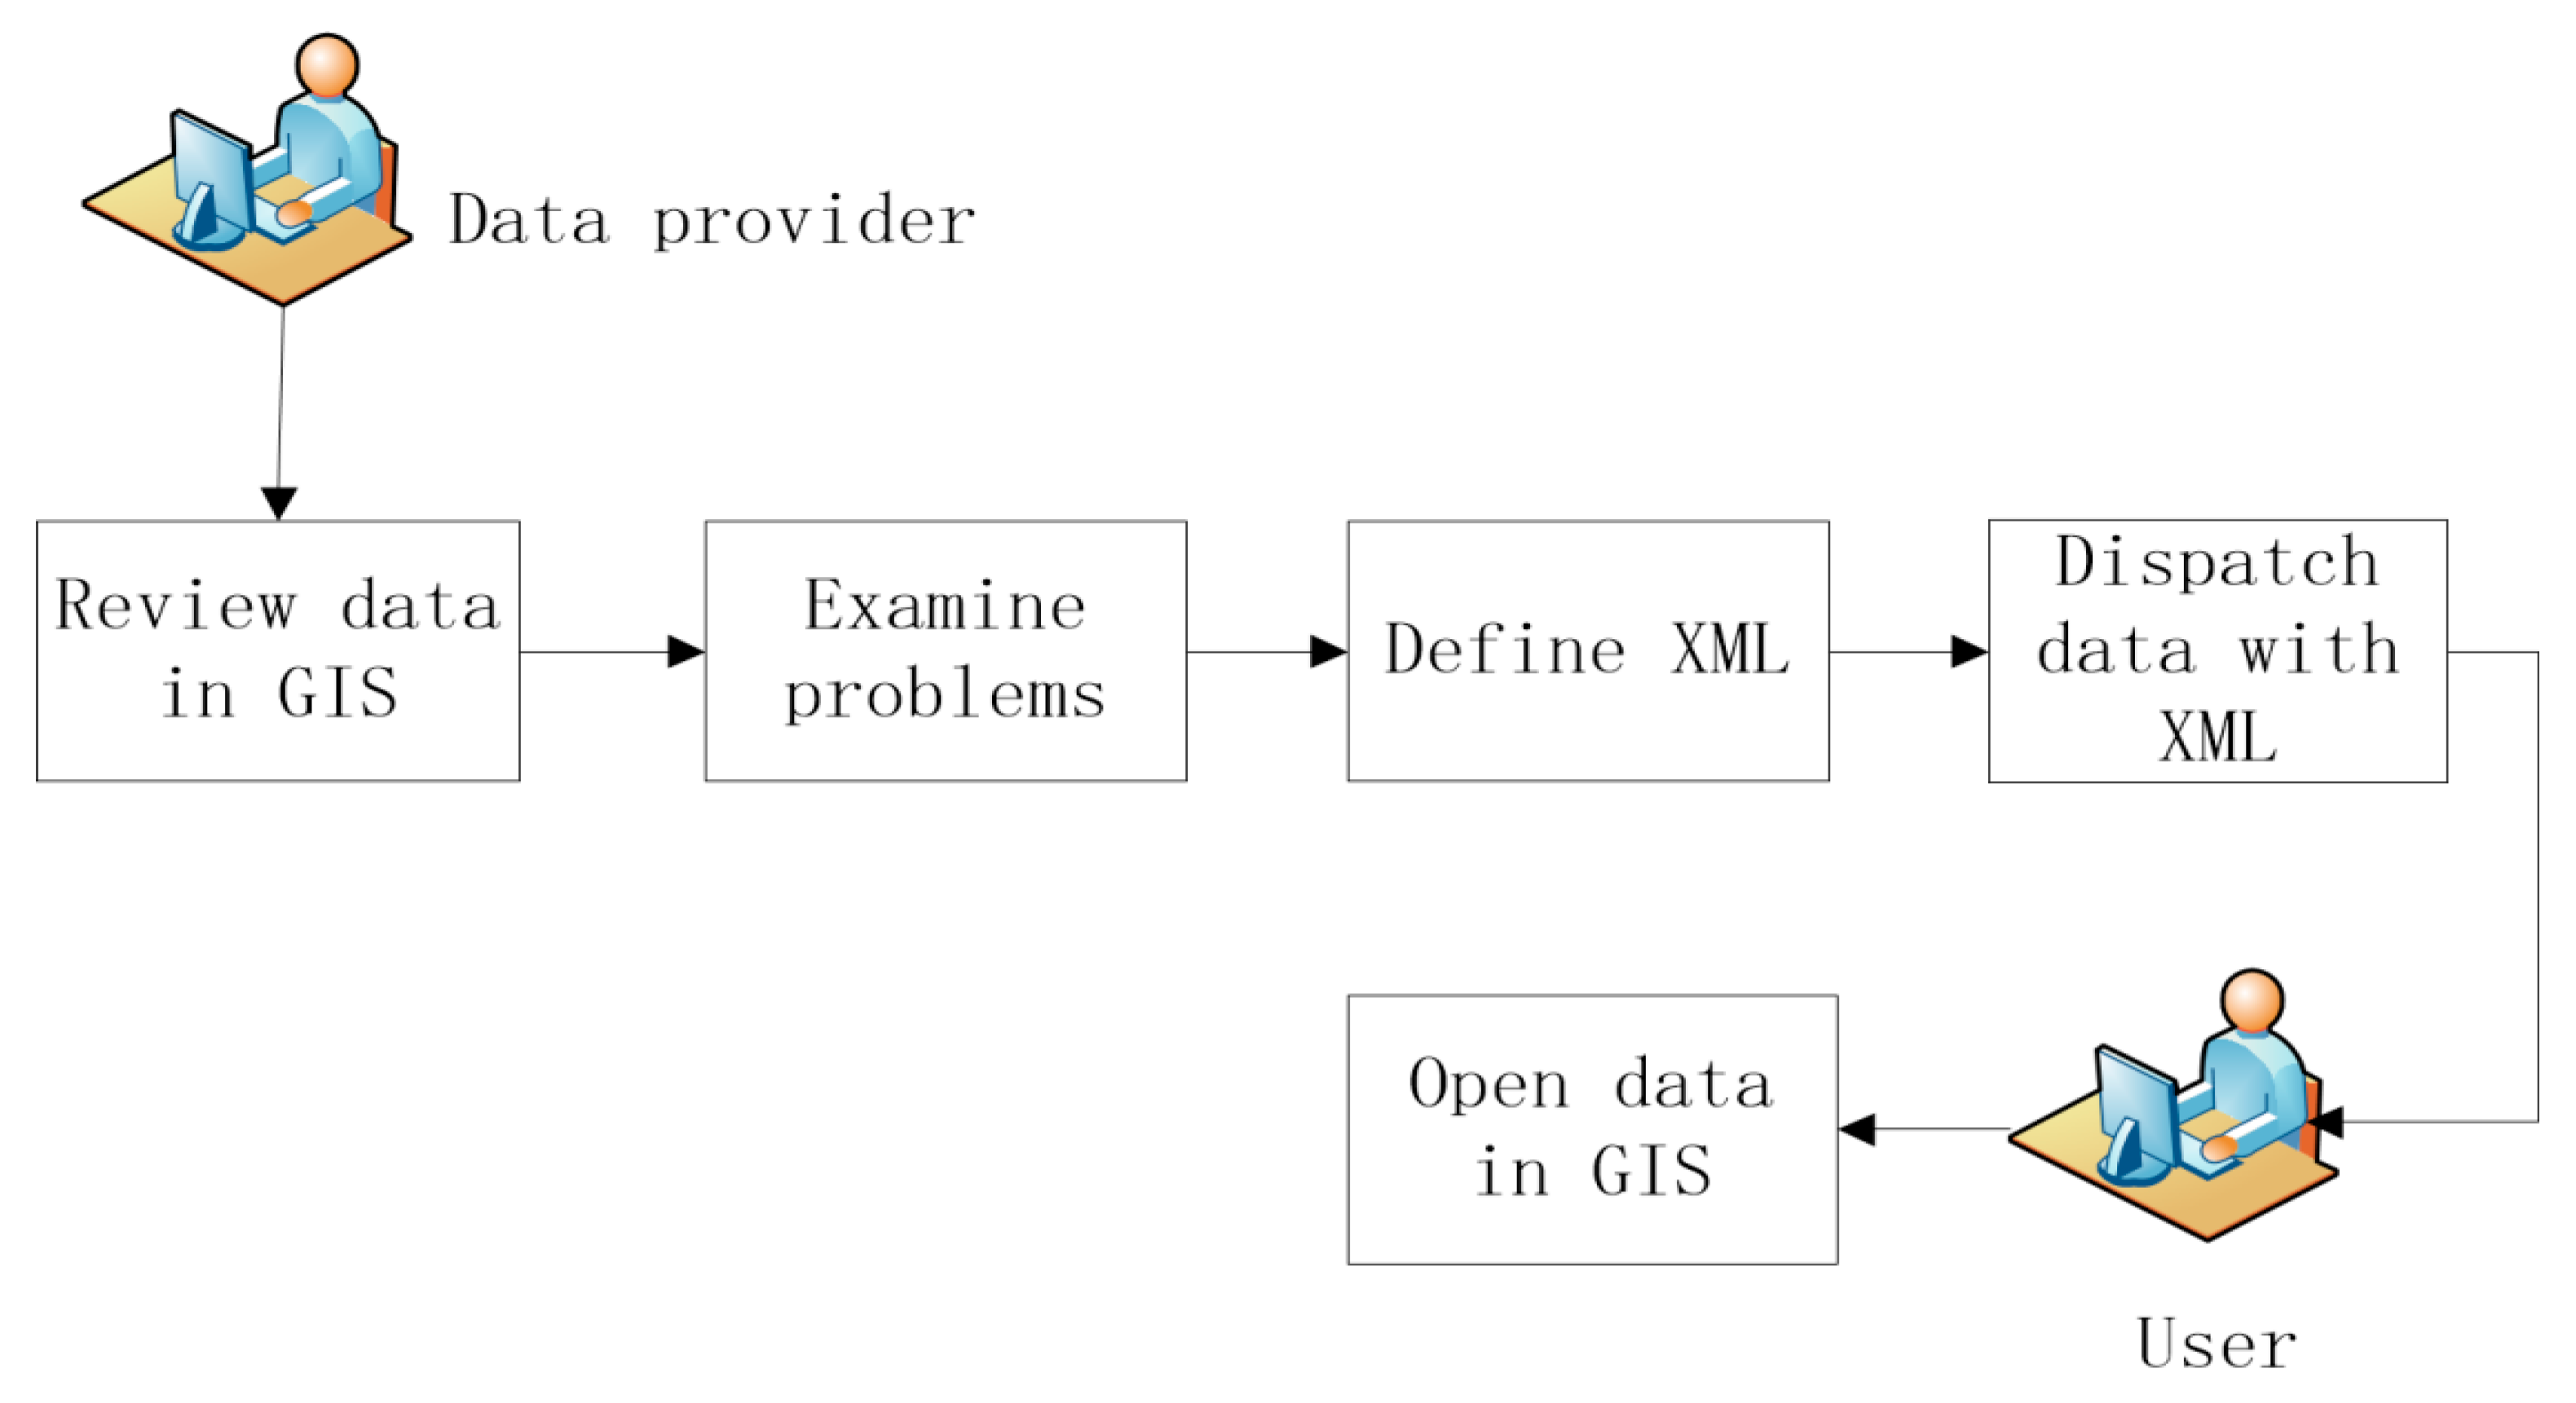
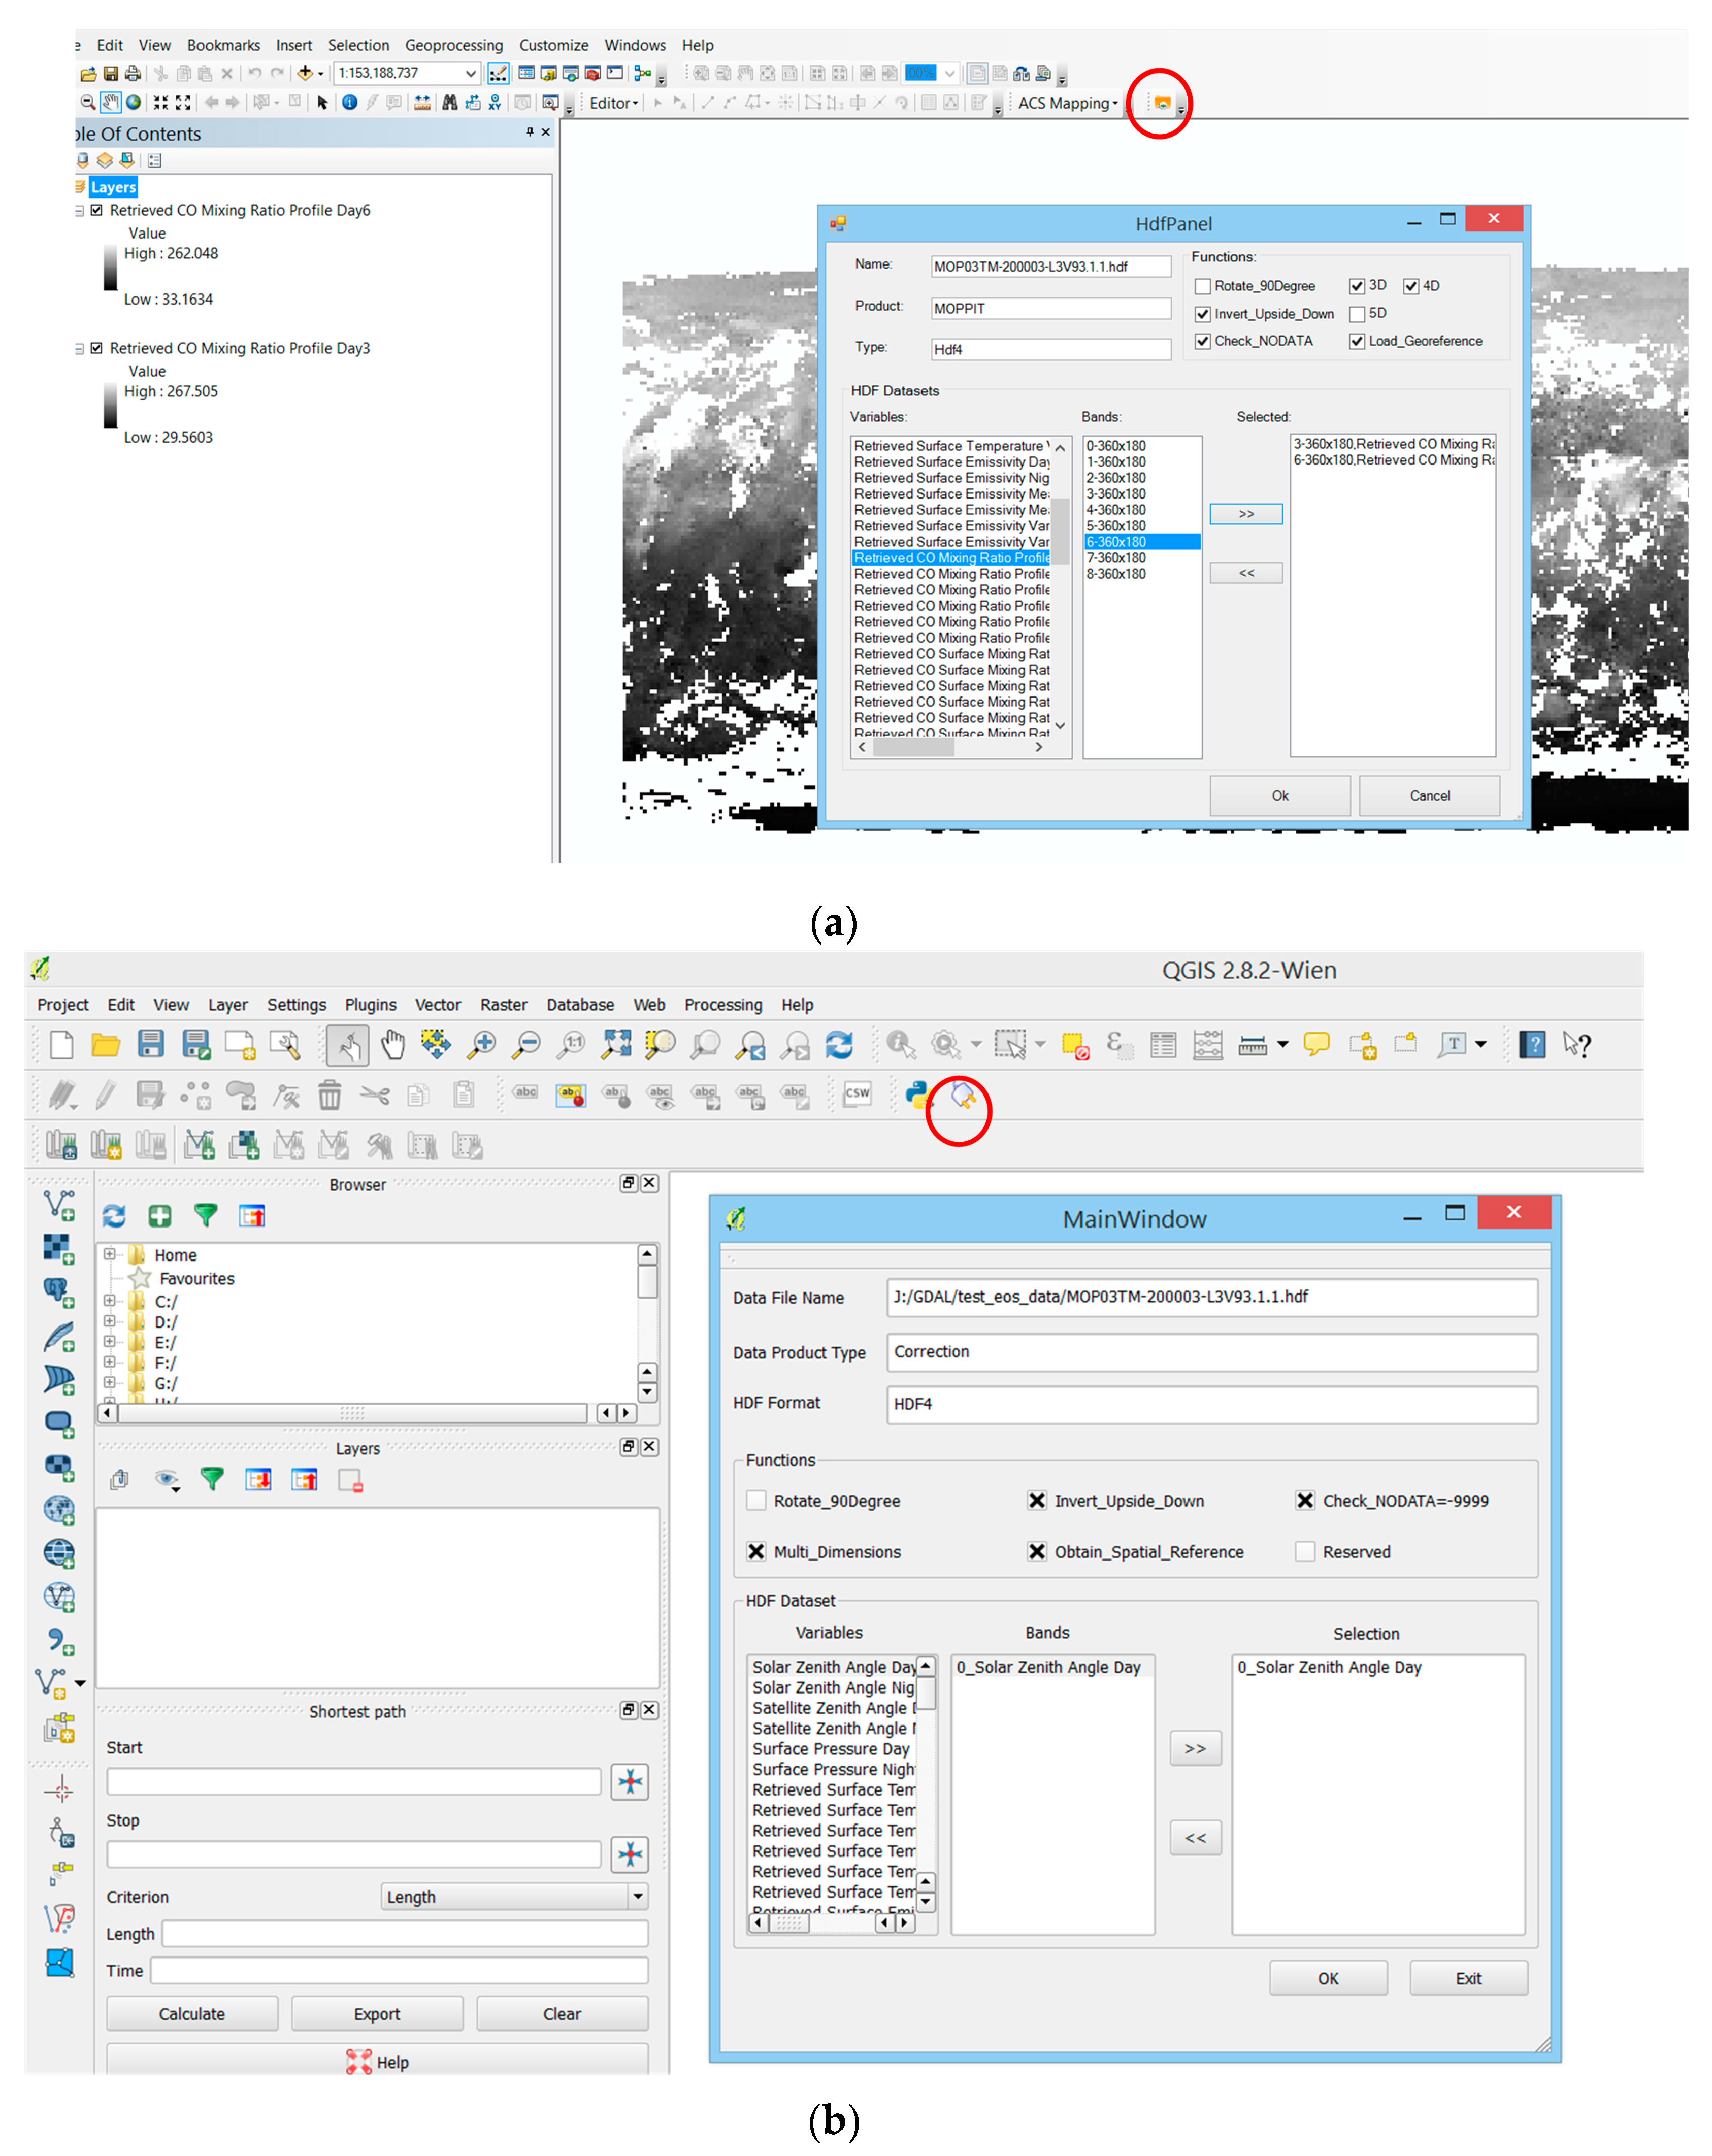
3.3. Plug-In Layer
3.4. GIS Layer
4. Results
4.1. Development Environment
4.2. GDAL Enhancement
4.3. XML-Based Plug-In
- <?xml version="1.0" encoding="UTF-8"?>
- <ProductPlugin productType="MOPPIT3" productFormat="HDF4">
- <DataAccessProblem>Description Problems</DataAccessProblem>
- <Correction>
- <Function>InvertImageUpsideDown</Function>
- </Correction>
- <Correction>
- <Function>AddFilledValue</Function>
- </Correction>
- <Correction>
- <Function>Display3Dimension</Function>
- <RasterXDim>2</RasterXDim>
- <RasterYDim>1</RasterYDim>
- <RasterBandDim>0</RasterBandDim>
- </Correction>
- <Correction>
- <Function>Display4Dimension</Function>
- <RasterXDim>3</RasterXDim>
- <RasterYDim>2</RasterYDim>
- <RasterBandDim>1</RasterBandDim>
- <Raster4Dim>0</Raster4Dim>
- </Correction>
- <Correction>
- <Function>Display5Dimension</Function>
- <RasterXDim>4</RasterXDim>
- <RasterYDim>3</RasterYDim>
- <RasterBandDim>2</RasterBandDim>
- <Raster4Dim>1</Raster4Dim>
- <Raster5Dim>0</Raster5Dim>
- </Correction>
- </ProductPlugin><?xml version="1.0" encoding="utf-8"?>
- <ProductPlugin productType="MOPPIT3" productFormat="HDF4">
- <DataAccessProblem>Description Problems</DataAccessProblem>
- <Correction>
- <Function>InvertImageUpsideDown</Function>
- </Correction>
- <Correction>
- <Function>AddFilledValue</Function>
- </Correction>
- <Correction>
- <Function>Display3Dimension</Function>
- <RasterXDim>2</RasterXDim>
- <RasterYDim>1</RasterYDim>
- <RasterBandDim>0</RasterBandDim>
- </Correction>
- <Correction>
- <Function>Display4Dimension</Function>
- <RasterXDim>3</RasterXDim>
- <RasterYDim>2</RasterYDim>
- <RasterBandDim>1</RasterBandDim>
- <Raster4Dim>0</Raster4Dim>
- </Correction>
- <Correction>
- <Function>Display5Dimension</Function>
- <RasterXDim>4</RasterXDim>
- <RasterYDim>3</RasterYDim>
- <RasterBandDim>2</RasterBandDim>
- <Raster4Dim>1</Raster4Dim>
- <Raster5Dim>0</Raster5Dim>
- </Correction>
- </ProductPlugin>
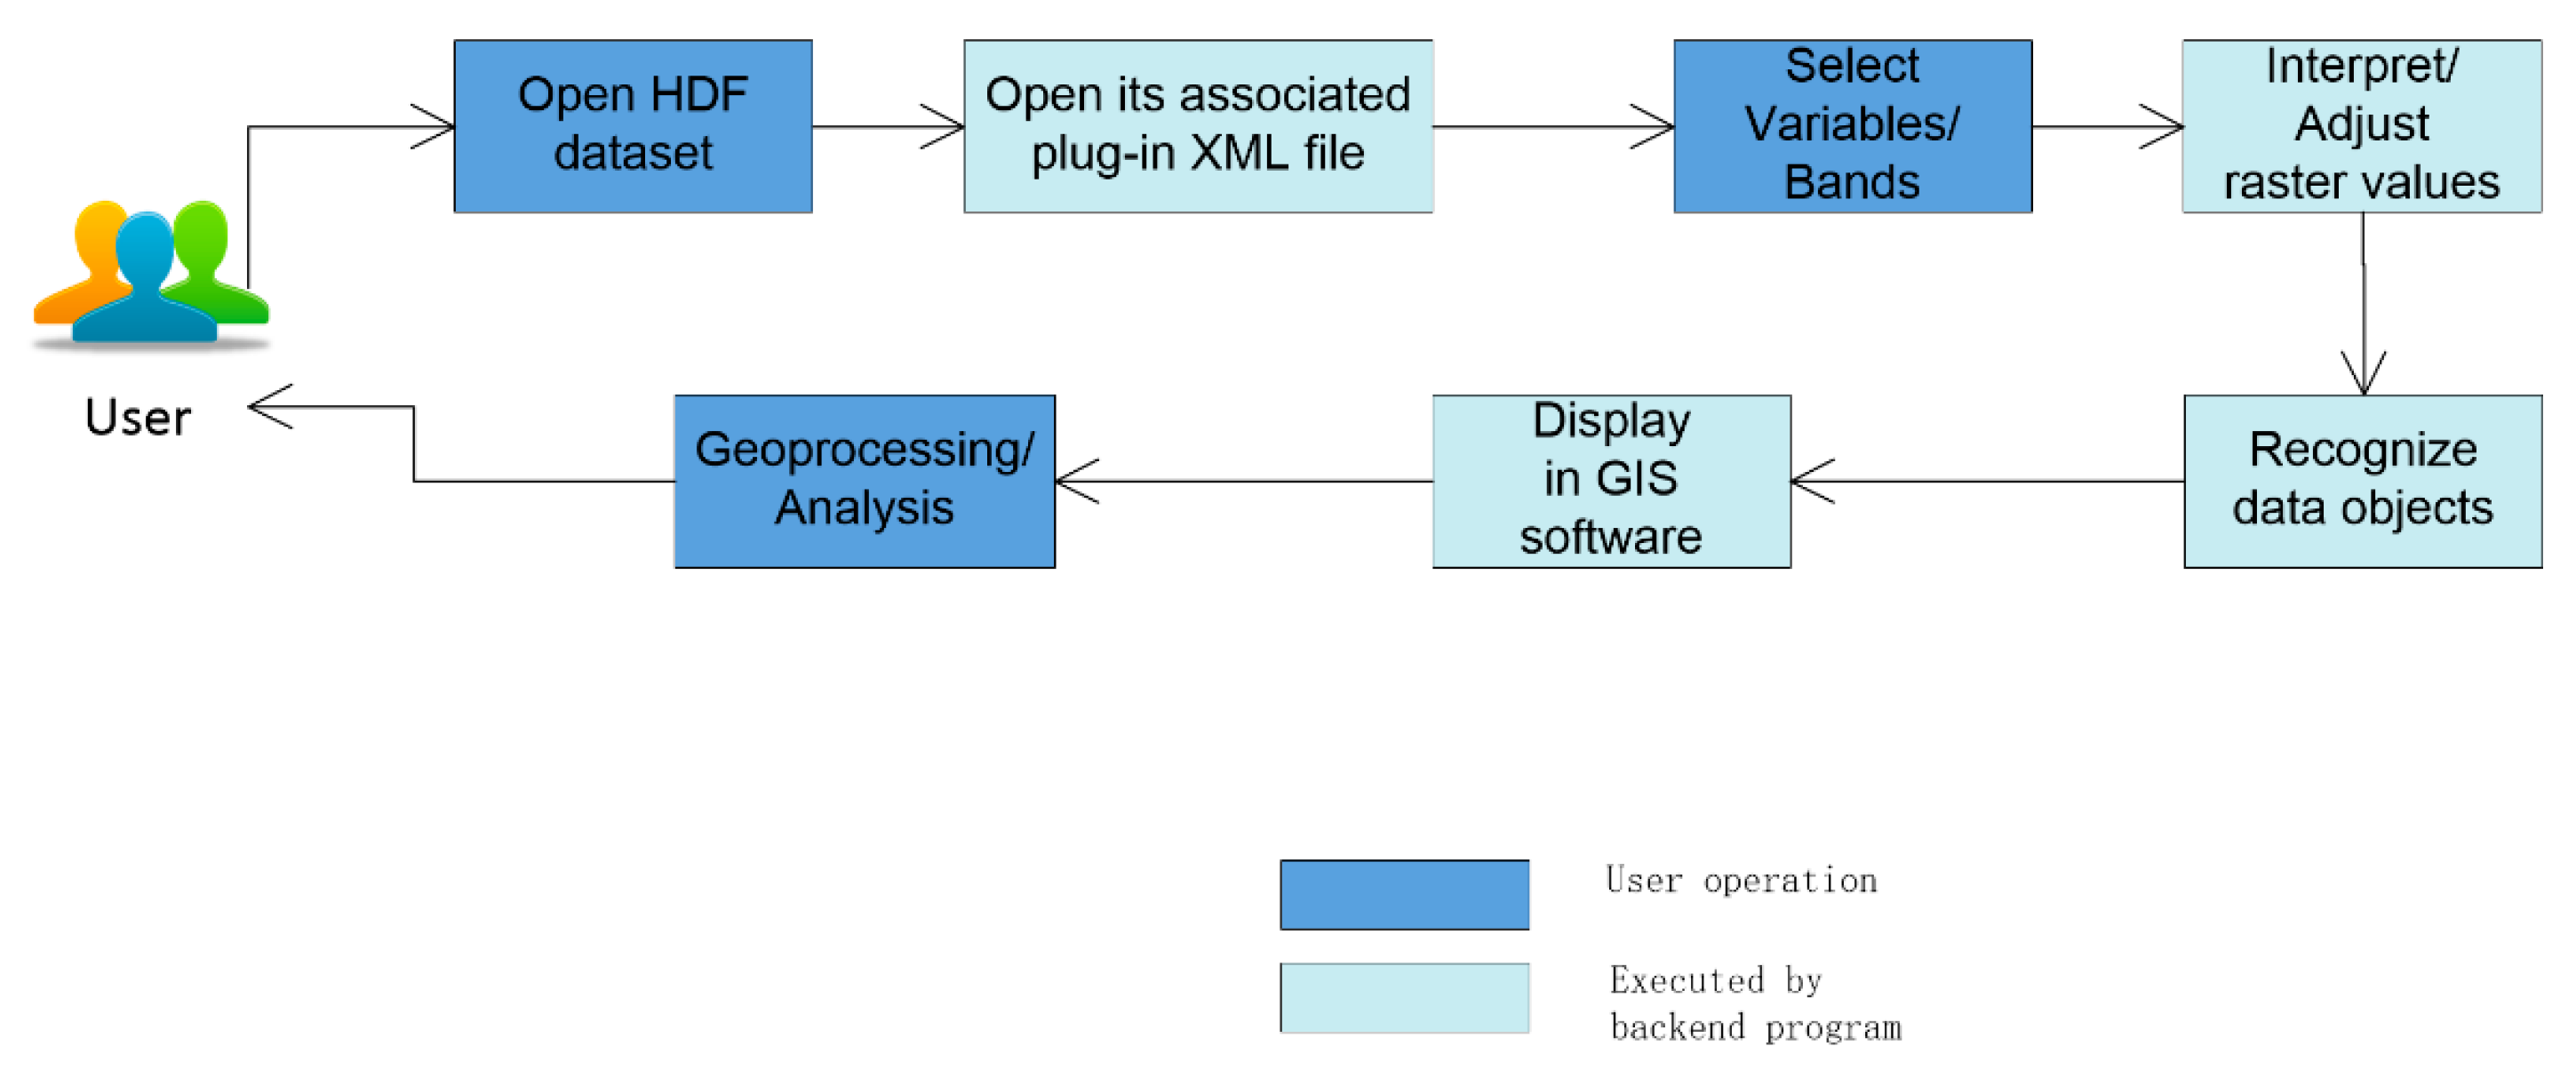
4.4. Workflow of Processing HDF Dataset
4.5. Integrate the Framework into GDAL
5. Experiments and Discussion
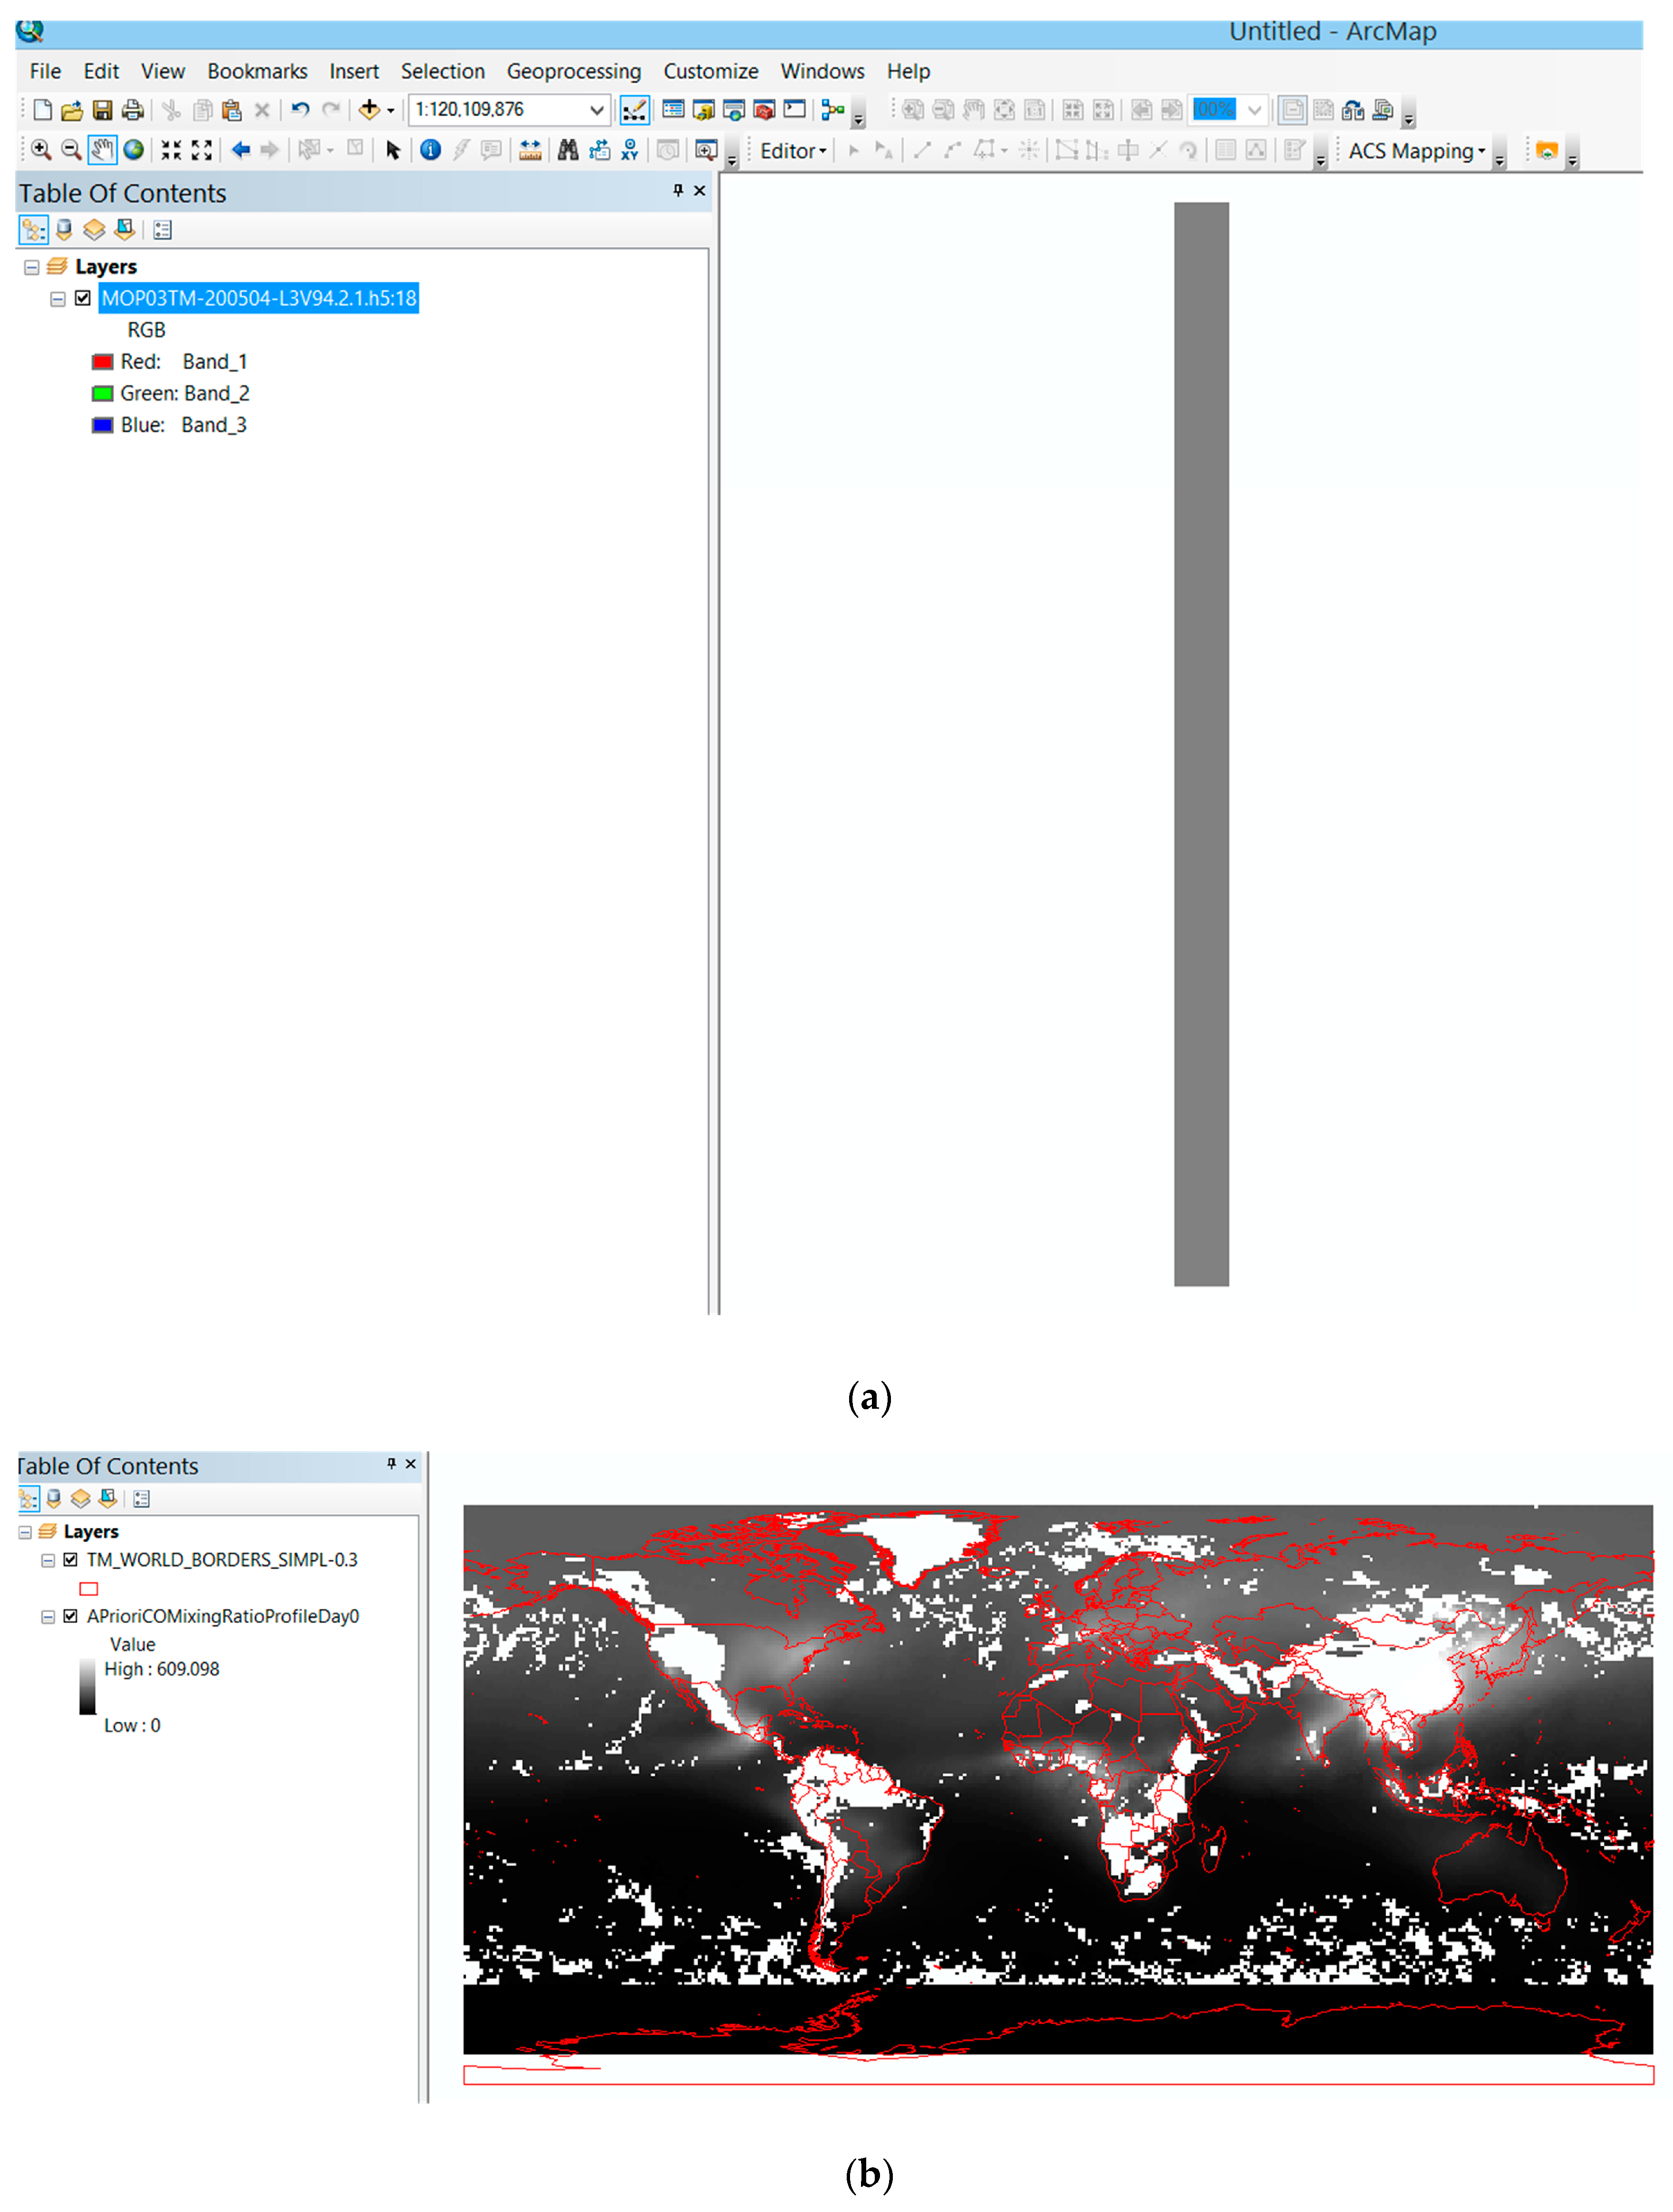
5.1. Case 1: Interpret Multiple Dimension HDF Data
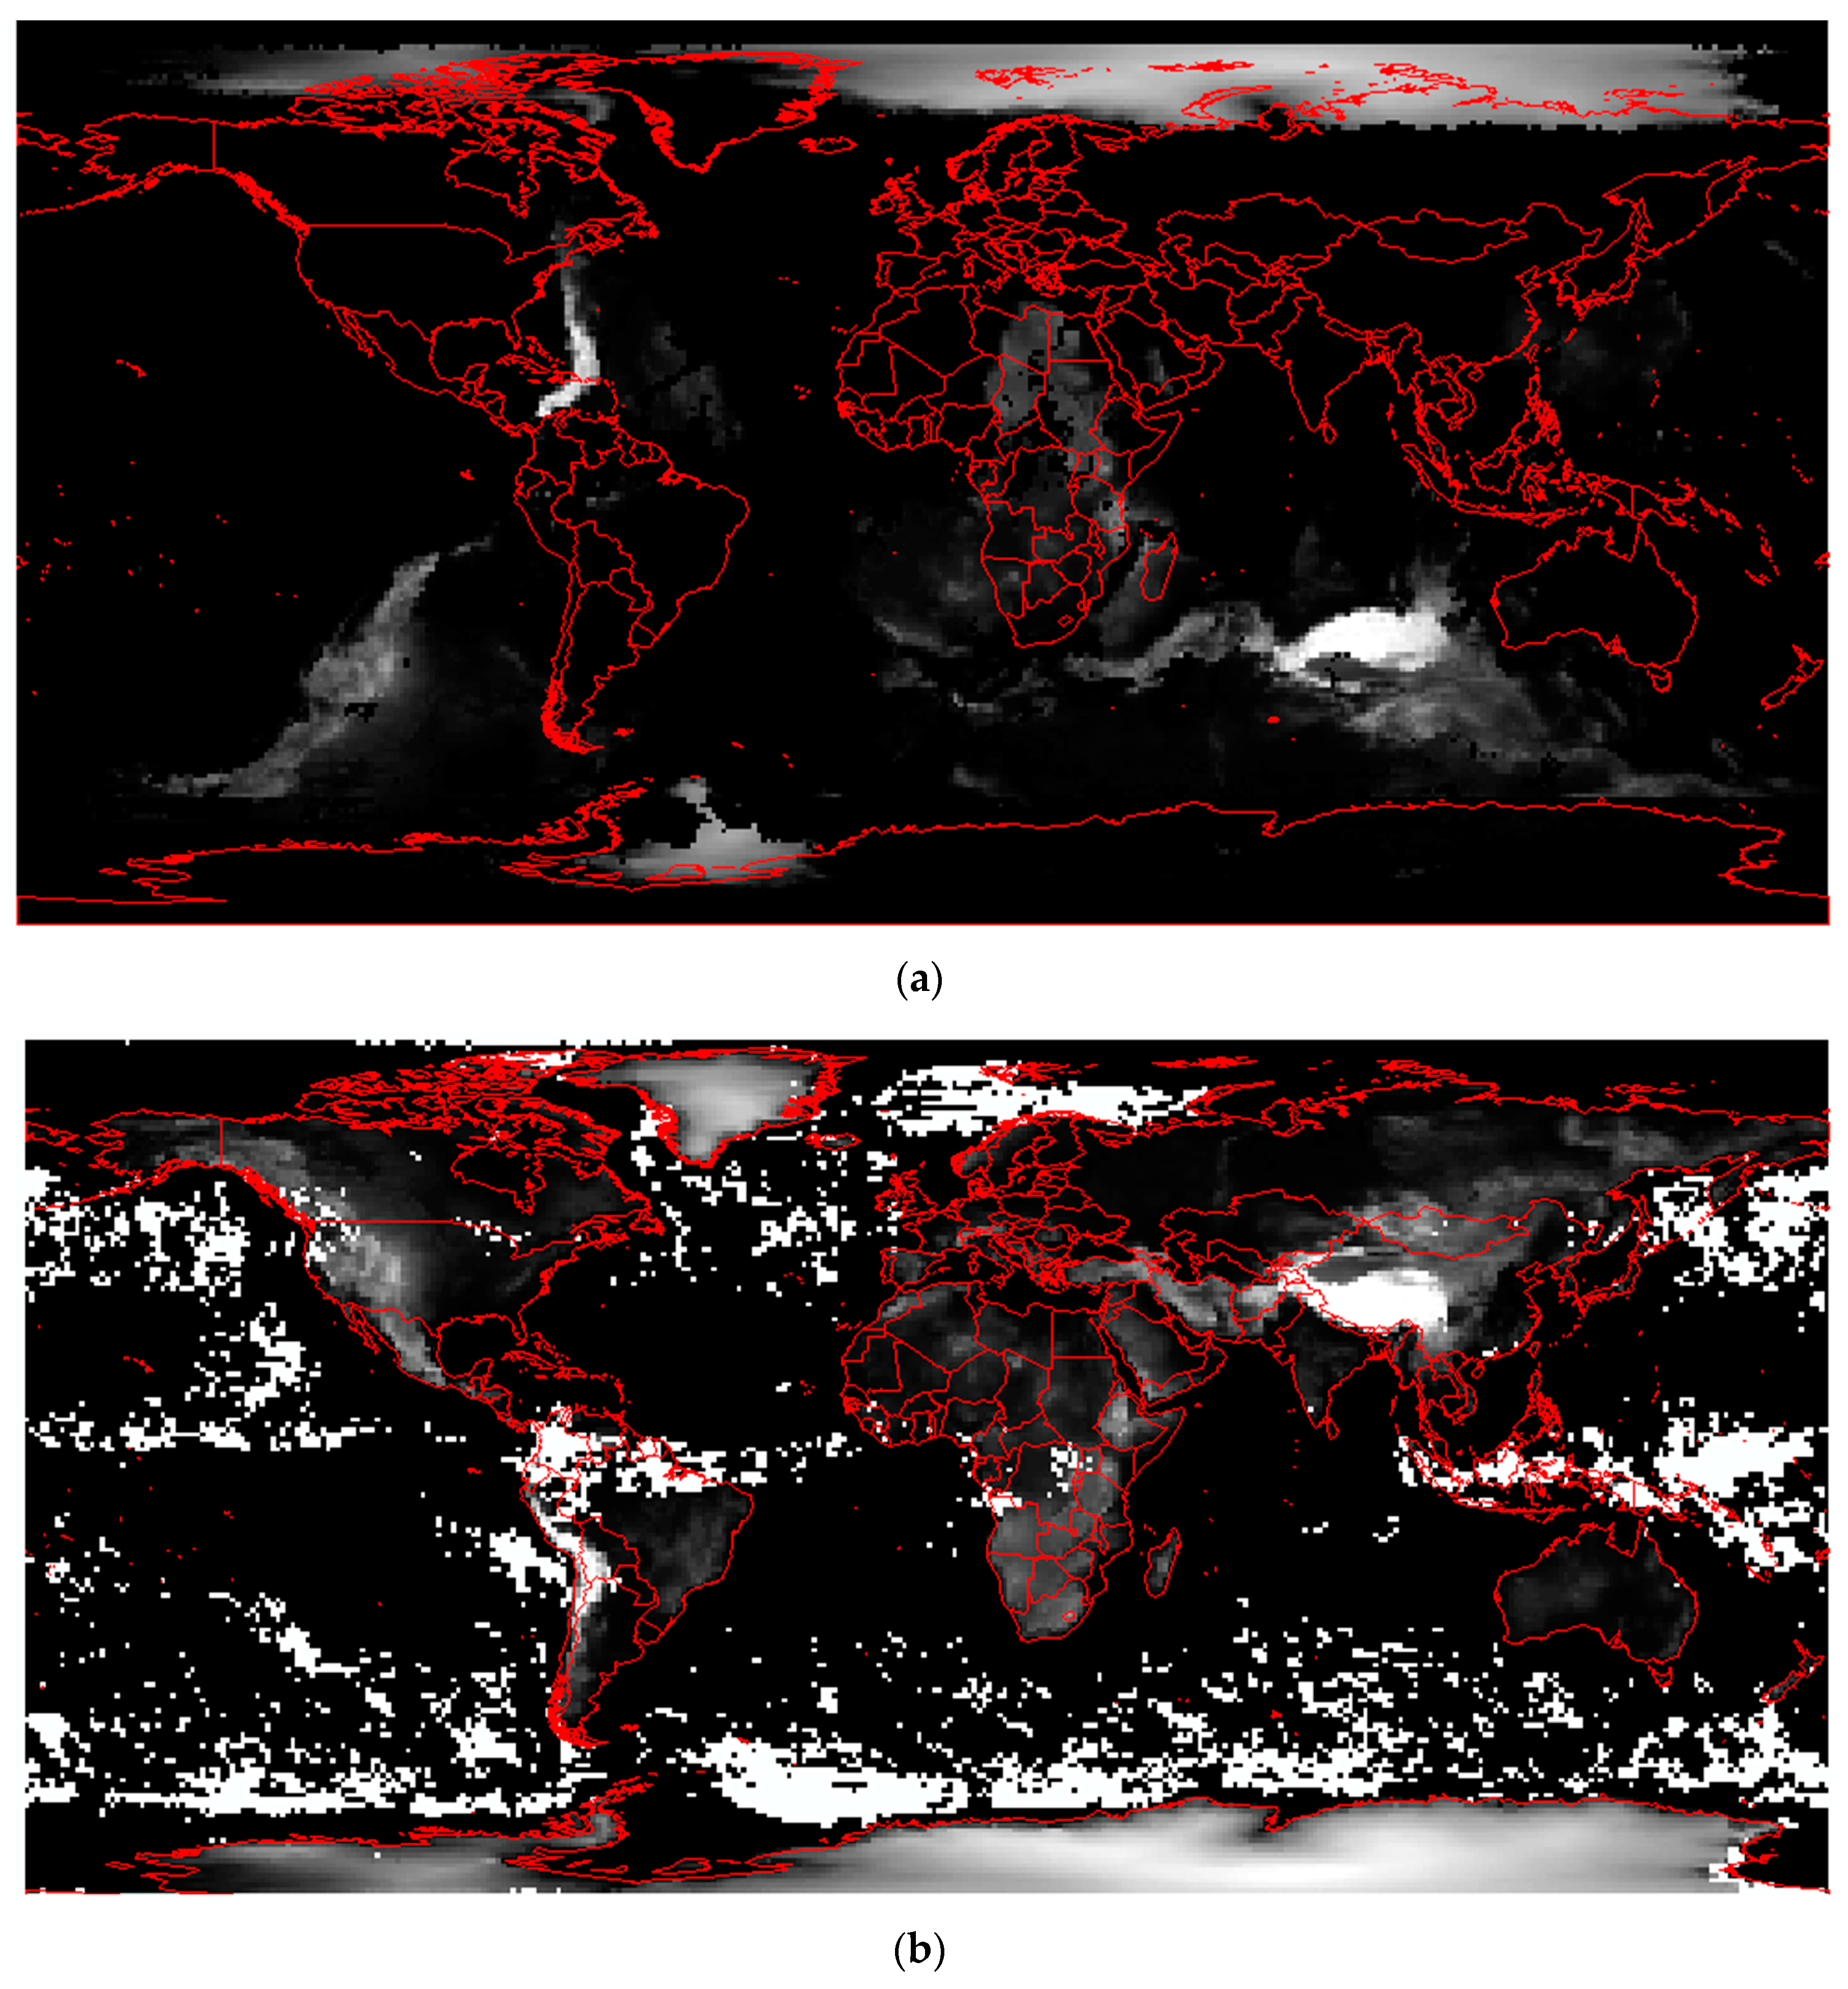
5.2. Case 2: Rectify Image Inverted Problem
5.3. Case 3: Repair Images Rotated by 90 Degrees
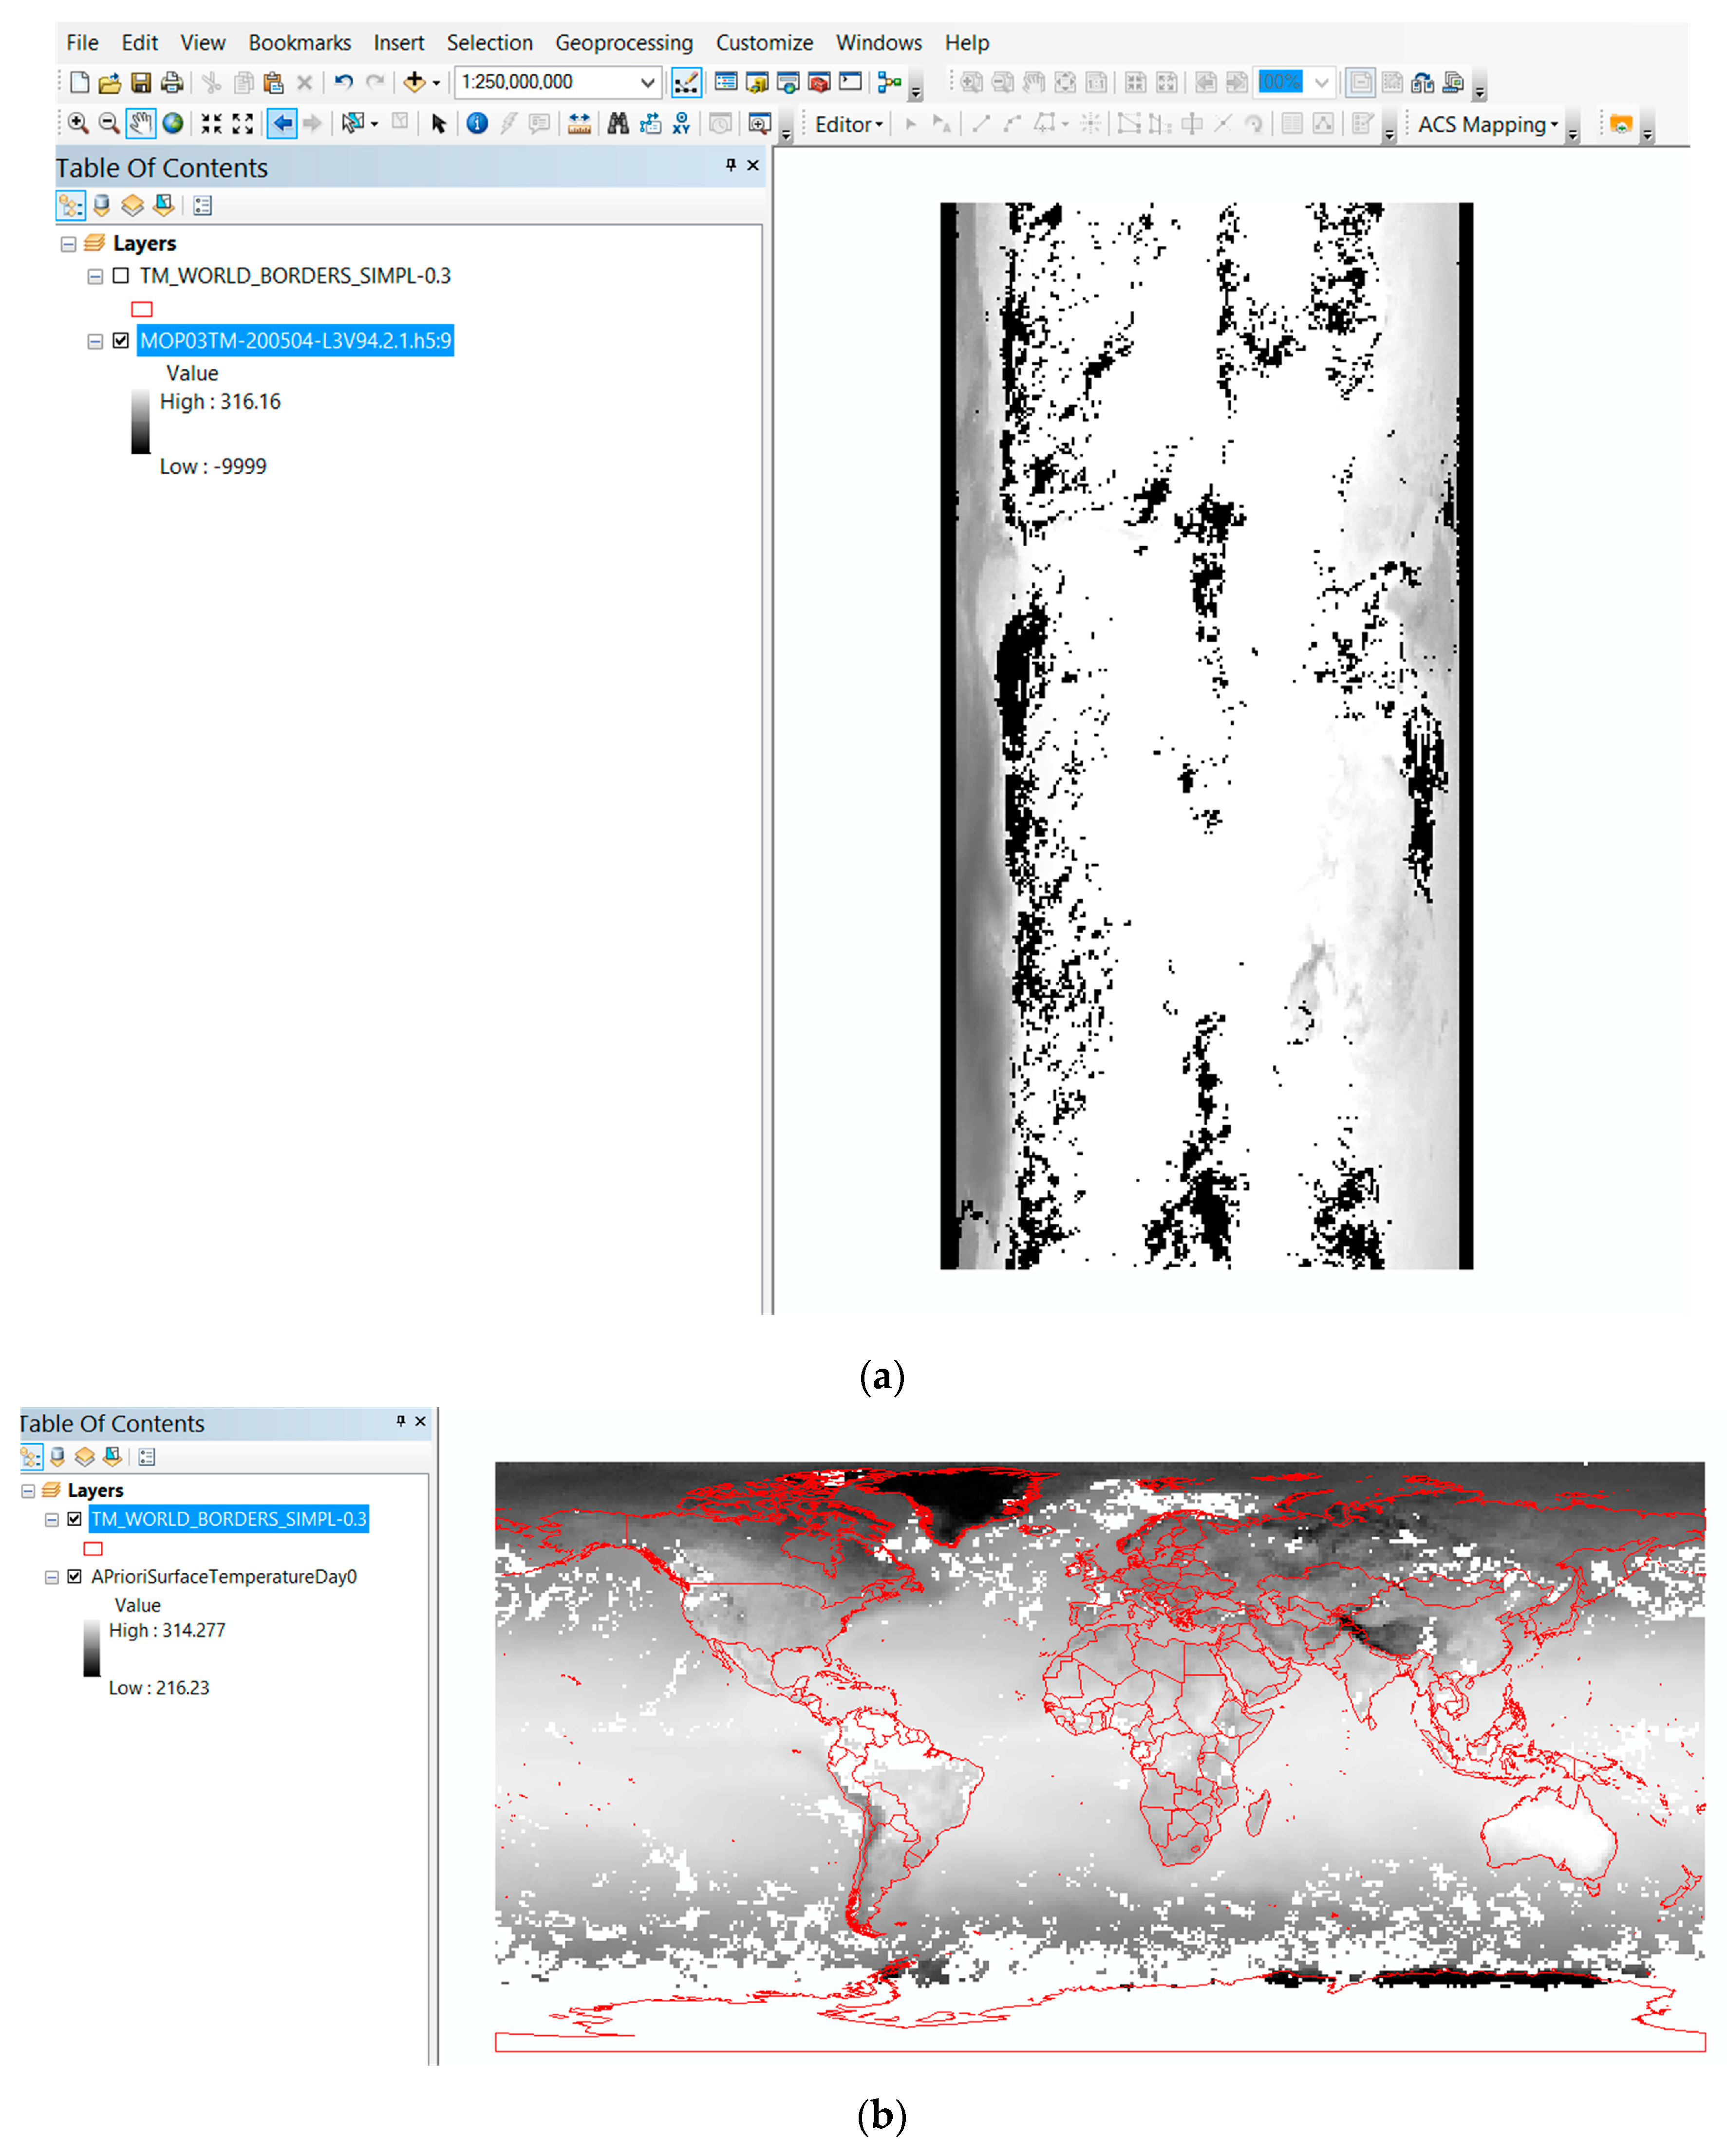
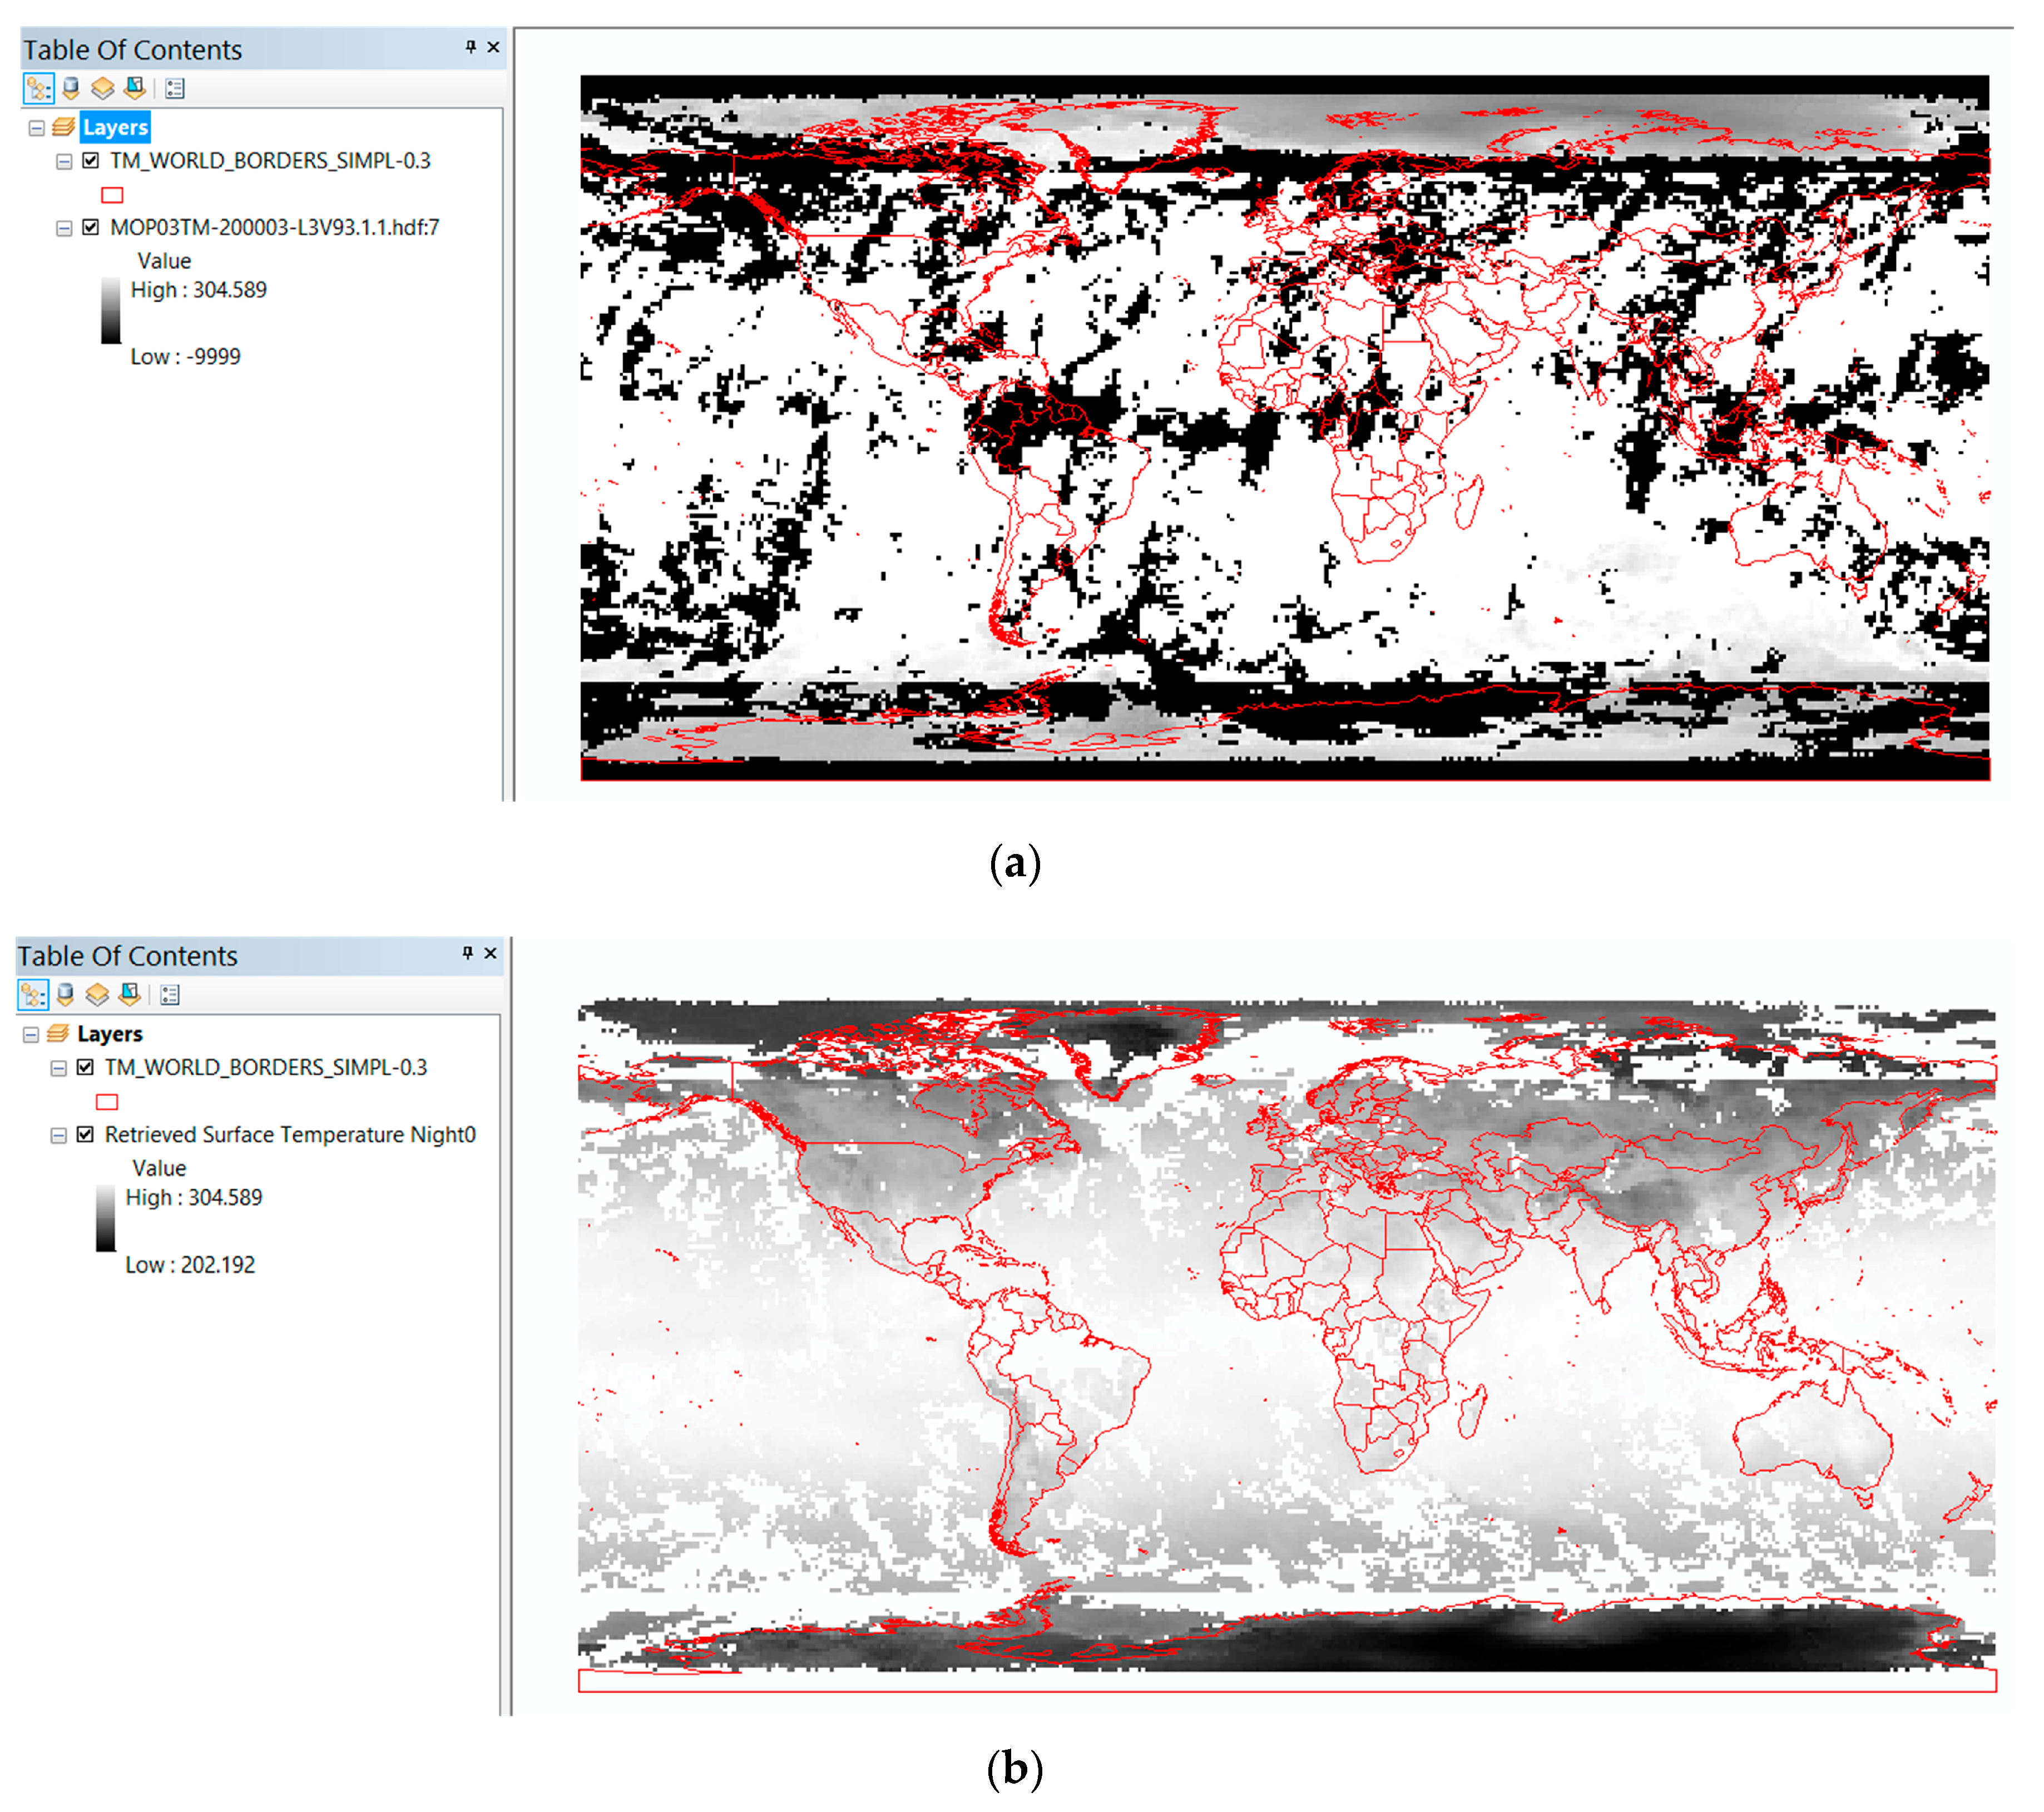
5.4. Case 4: Assign Missed NoData Value
6. Software Availability
7. Conclusions and Future Work
Acknowledgments
Author Contributions
Conflicts of Interest
Abbreviations
| GDAL | Geospatial Data Abstraction Library |
| GIS | Geographic Information System |
| EOS | Earth Observing System |
| ASDC | Atmospheric Scientific Data Center |
| HDF | Hierarchical Data Format |
| NASA | National Aeronautics and Space Administration |
| MOPPIT | Measurement of Pollution in the Troposphere |
| AIRS | Advanced Infrared Sounder |
| TES | Tropospheric Emission Spectrometer |
| CERES | Clouds and Earth’s Radiant Energy System |
| MISR | Multi-angle Imaging SpectroRadiometer |
| APIs | Application Program Interfaces |
References
- Farr, T.; Granger, S.; Kopp, S. Integrating remote sensing data into geographic information systems. Trans. Am. Geophys. Union 2011, 92, 154. [Google Scholar] [CrossRef]
- Bagwell, R.; Lindsay, F.; Lynnes, C.; Yang, M. Using NASA remote sensing data in a geographical information system. In Proceedings of the American Public Health Associate (APHA) 2011 Annual Meeting, Washington, DC, USA, 29 October–2 November 2011.
- Van de Vegte, J.; de Cerff, W.; van den Oord, G.; Sluiter, R.; van der Neut, I.; Plieger, M.; Wilhelmi, O.V. Atmospheric data access for the geospatial user community. Proc. SPIE 2007, 6749. [Google Scholar] [CrossRef]
- Wilkinson, G. A review of current issues in the integration of GIS and remote sensing data. Int. J. Geogr. Inf. Sci. 1996, 10, 85–101. [Google Scholar] [CrossRef]
- Wright, D.; Goodchild, M. Data from the deep: Implications for the GIS community. Int. J. Geogr. Inf. Sci. 1997, 11, 523–528. [Google Scholar] [CrossRef]
- GDAL. Available online: http://www.gdal.org/ (accessed on 5 December 2015).
- Yang, C.; Sun, M.; Liu, K.; Huang, Q.; Li, Z.; Gui, Z.; Jiang, Y.; Xia, J.; Yu, M.; Lostritto, P. Contemporary computing technologies for processing big spatiotemporal data. In Space-Time Integration in Geography and GIScience; Springer: Dordrecht, The Netherlands, 2015; pp. 327–351. [Google Scholar]
- ESRI ArcGIS. Available online: http://doc.arcgis.com/en/arcgis-online/create-maps/display-imagery.htm (accessed on 15 September 2015).
- QGIS. Available online: https://www.qgis.org/en/site/getinvolved/development/cppplugindevelopment.html (accessed on 6 April 2016).
- NASA Earth Science Mission. Available online: http://eospso.nasa.gov/files/mission_profile.pdf (accessed on 10 August 2015).
- Goodchild, M. Integrating GIS and remote sensing for vegetation analysis and modeling: methodological issues. J. Veget. Sci. 1994, 5, 615–626. [Google Scholar] [CrossRef]
- Hill, L. Georeferencing: The Geographic Associations of Information; MIT Press: Cambridge, MA, USA, 2009. [Google Scholar]
- Lo, C.; Quattrochi, D.; Luvall, J. Application of high-resolution thermal infrared remote sensing and GIS to assess the urban heat island effect. Int. J. Remote Sens. 1997, 18, 287–304. [Google Scholar] [CrossRef]
- Petropoulos, G.; Kalivas, D.; Griffiths, H.; Dimou, P. Remote sensing and GIS analysis for mapping spatio-temporal changes of erosion and deposition of two Mediterranean river deltas: The case of the Axios and Aliakmonas rivers, Greece. Int. J. Appl. Earth Observ. Geoinf. 2015, 35, 217–228. [Google Scholar] [CrossRef]
- NSIDC (National Snow & Ice Data Center). Available online: http://nsidc.org/data/hdfeos/intro.html (accessed on 10 August 2015).
- Tsou, M. Integrating Web-based GIS and image processing tools for environmental monitoring and natural resource management. J. Geogr. Syst. 2004, 6, 155–174. [Google Scholar] [CrossRef]
- Raskin, R.; Pan, M.; Mattmann, C. Enabling semantic interoperability for earth science data. In Proceedings of 4th NASA Earth Science Technology Conference, Palo Alto, CA, USA, 22–24 June 2004.
- Shalaby, A.; Tateishi, R. Remote sensing and GIS for mapping and monitoring land cover and land-use changes in the Northwestern coastal zone of Egypt. Appl. Geogr. 2007, 27, 28–41. [Google Scholar] [CrossRef]
- Di, L.; Chen, A.; Yang, W.; Zhao, P. The integration of grid technology with OGC web services (OWS) in NWGISS for NASA EOS data. In Proceedings of the Eighth Global Grid Forum, Seattle, WA, USA, 25 June 2003.
- Qin, C.Z.; Zhan, L.J.; Zhu, A. How to apply the Geospatial Data Abstraction Library (GDAL) properly to parallel geospatial raster I/O? Trans. GIS 2014, 18, 950–957. [Google Scholar] [CrossRef]
- GDAL Enhancement for ESDIS. Available online: https://git.earthdata.nasa.gov/projects/GEE/repos/gdal-enhancements-for-esdis/browse/gdal-2.0.0 (accessed on 26 April 2016).
- Enhanced GDAL’s User Guide and Sample Code. Available online: http://199.26.254.185:8080/pages/viewpage.action?pageId=1016592 (accessed on 26 April 2016).
- Yang, C.; Xu, Y.; Nebert, D. Redefining the possibility of digital Earth and geosciences with spatial cloud computing. Int. J. Dig. Earth 2013, 6, 297–312. [Google Scholar] [CrossRef]


© 2016 by the authors; licensee MDPI, Basel, Switzerland. This article is an open access article distributed under the terms and conditions of the Creative Commons Attribution (CC-BY) license (http://creativecommons.org/licenses/by/4.0/).
Share and Cite
Jiang, Y.; Sun, M.; Yang, C. A Generic Framework for Using Multi-Dimensional Earth Observation Data in GIS. Remote Sens. 2016, 8, 382. https://0-doi-org.brum.beds.ac.uk/10.3390/rs8050382
Jiang Y, Sun M, Yang C. A Generic Framework for Using Multi-Dimensional Earth Observation Data in GIS. Remote Sensing. 2016; 8(5):382. https://0-doi-org.brum.beds.ac.uk/10.3390/rs8050382
Chicago/Turabian StyleJiang, Yunfeng, Min Sun, and Chaowei Yang. 2016. "A Generic Framework for Using Multi-Dimensional Earth Observation Data in GIS" Remote Sensing 8, no. 5: 382. https://0-doi-org.brum.beds.ac.uk/10.3390/rs8050382