Article

Changes in Global Grassland Productivity during 1982 to 2011 Attributable to Climatic Factors

1
Institute of Environment and Sustainable Development in Agriculture, Chinese Academy of Agricultural Sciences, Beijing 100081, China
2
Key Laboratory for Agro-Environment & Climate Change, Ministry of Agriculture, Beijing 100081, China
3
John Muir Institute of the Environment, University of California, Davis, CA 95616, USA
4
College of Resources Science and Technology, Beijing Normal University, Beijing 100875, China
*
Author to whom correspondence should be addressed.
Submission received: 15 December 2015 / Revised: 29 March 2016 / Accepted: 6 April 2016 / Published: 6 May 2016

Abstract

:
Open, Grass- and Forb-Dominated (OGFD) ecosystems, including tundra, tropical grasslands and savanna, provide habitat for both wild and domesticated large ungulate herbivores. These ecosystems exist across a wide temperature gradient from the Arctic regions to the Equator, but are confined to a narrow set of moisture conditions that range from arid deserts to forest-dominated systems. Primary productivity in OGFD ecosystems appears extremely sensitive to environmental change. We compared global trends in the annual maximum and mean values of the Normalized Difference Vegetation Index (NDVI) and identified the key bioclimatic indices that controlled OGFD productivity changes in various regions for the period from 1982 to 2011. We found significantly increased or decreased annual maximum NDVI values of 36.3% and 4.6% for OGFD ecosystems, respectively. Trends in the annual mean NDVI are similar for most OGFD ecosystems and show greater area decreases and smaller area increases than trends in the annual maximum NDVI in global OGFD ecosystems during the study period. Ecosystems in which the productivity significantly increased were distributed mainly in the Arctic, mid-eastern South America, central Africa, central Eurasia and Oceania, while those with decreasing trends in productivity were mainly on the Mongolian Plateau. Temperature increases tended to improve productivity in colder OGFD ecosystems; and precipitation is positively correlated with productivity changes in grassland and savannas, but negatively correlated with changes in the Arctic tundra. Simple bioclimatic indices explain 42% to 55% of productivity changes in OGFD systems worldwide, and the main climatic predictors of productivity differed significantly between regions. In light of future climate change, the findings of this study will help support management of global OGFD ecosystems.

Graphical Abstract

1. Introduction

Open, Grass- and Forb-Dominated (OGFD) ecosystems are areas in which the vegetation is dominated by grasses and forbs. On a climatic gradient, these ecosystems are situated between forest (wetter) and desert or ice-land (drier) [1,2]. These systems are divided into three main types: tundra, grassland and savanna. Tundra is generally vegetated with a mixture of grasses, sedges and forbs along with small shrubs. Savanna is typically grass-dominated with a low density (<20% cover) of trees and tall shrubs. Grasslands are grass-dominated and can be distinguished as either temperate or tropical grasslands. OGFD ecosystems provide anthropogenically important ecosystem services, such as sand-fixation, soil and water conservation, and provide food for both wild and domesticated livestock. Threatened in many parts of the world [1,2], they provide habitat for an ecologically and culturally important suite of species (e.g., wild progenitors of horses and cows) and provide important economic, cultural and historical values to humans.
Globally, OGFD ecosystems are at risk from a variety of climatic and non-climatic factors [3,4,5]. Primary productivity of OGFD ecosystems may be changing globally as a consequence of changes in climatic conditions (temperature and precipitation) and land use patterns (e.g., grazing), as well as the direct effects of increasing atmospheric CO2 concentrations [6,7,8,9,10]. Previous studies have documented that increases in temperature enhanced vegetation activity and ecosystem productivity in the Northern Hemisphere [11]. Studies have also reported that changes in precipitation have a strong influence on temporal patterns in the biomass of grassland and shrubs [12]. The relationships between changes in temperature, precipitation and ecosystem productivity or vegetation have mainly been discussed at regional [11,13] and global scales [12]. In most of these studies, maximum values of the Normalized Difference Vegetation Index (NDVI) were used as a proxy for vegetation activity or ecosystem productivity; the maximum NDVI represents the highest vegetation activity or ecosystem productivity, meaning that this approach provides limited information on the normal status of an ecosystem [14]. These studies also report vague information on normal trends in productivity changes in OGFD ecosystems and the climatic drivers of change, even though this information is important to ensure adaptation to future changes in climate, support for pastoralist livelihoods and ecological management of global OGFD ecosystems.
The present study aims to use remotely-sensed data to examine global changes in OGFD ecosystems and to identify the main drivers of these changes. We use the annual maximum and mean values of the NDVI as proxies for the highest and normal levels of annual productivity within the Earth’s major OGFD-dominated biomes, respectively. The annual maximum NDVI may be more sensitive to climate change and human activities [14,15], while the annual mean NDVI indicates the amount of fodder, which is important for sustaining pastoralist livelihoods and for protecting biodiversity in global OGFD ecosystems [2]. We use trends in the annual maximum and mean values of the NDVI to highlight general patterns of change in different OGFD ecosystems. We then examine the relationship between changes in the NDVI and bioclimatic indices by region to identify the key climatic drivers in OGFD productivity. An improved understanding of these trends and the bioclimatic indices that control them will help us adapt to future climate change and move towards optimizing the management of global OGFD ecosystems.

2. Materials and Methods
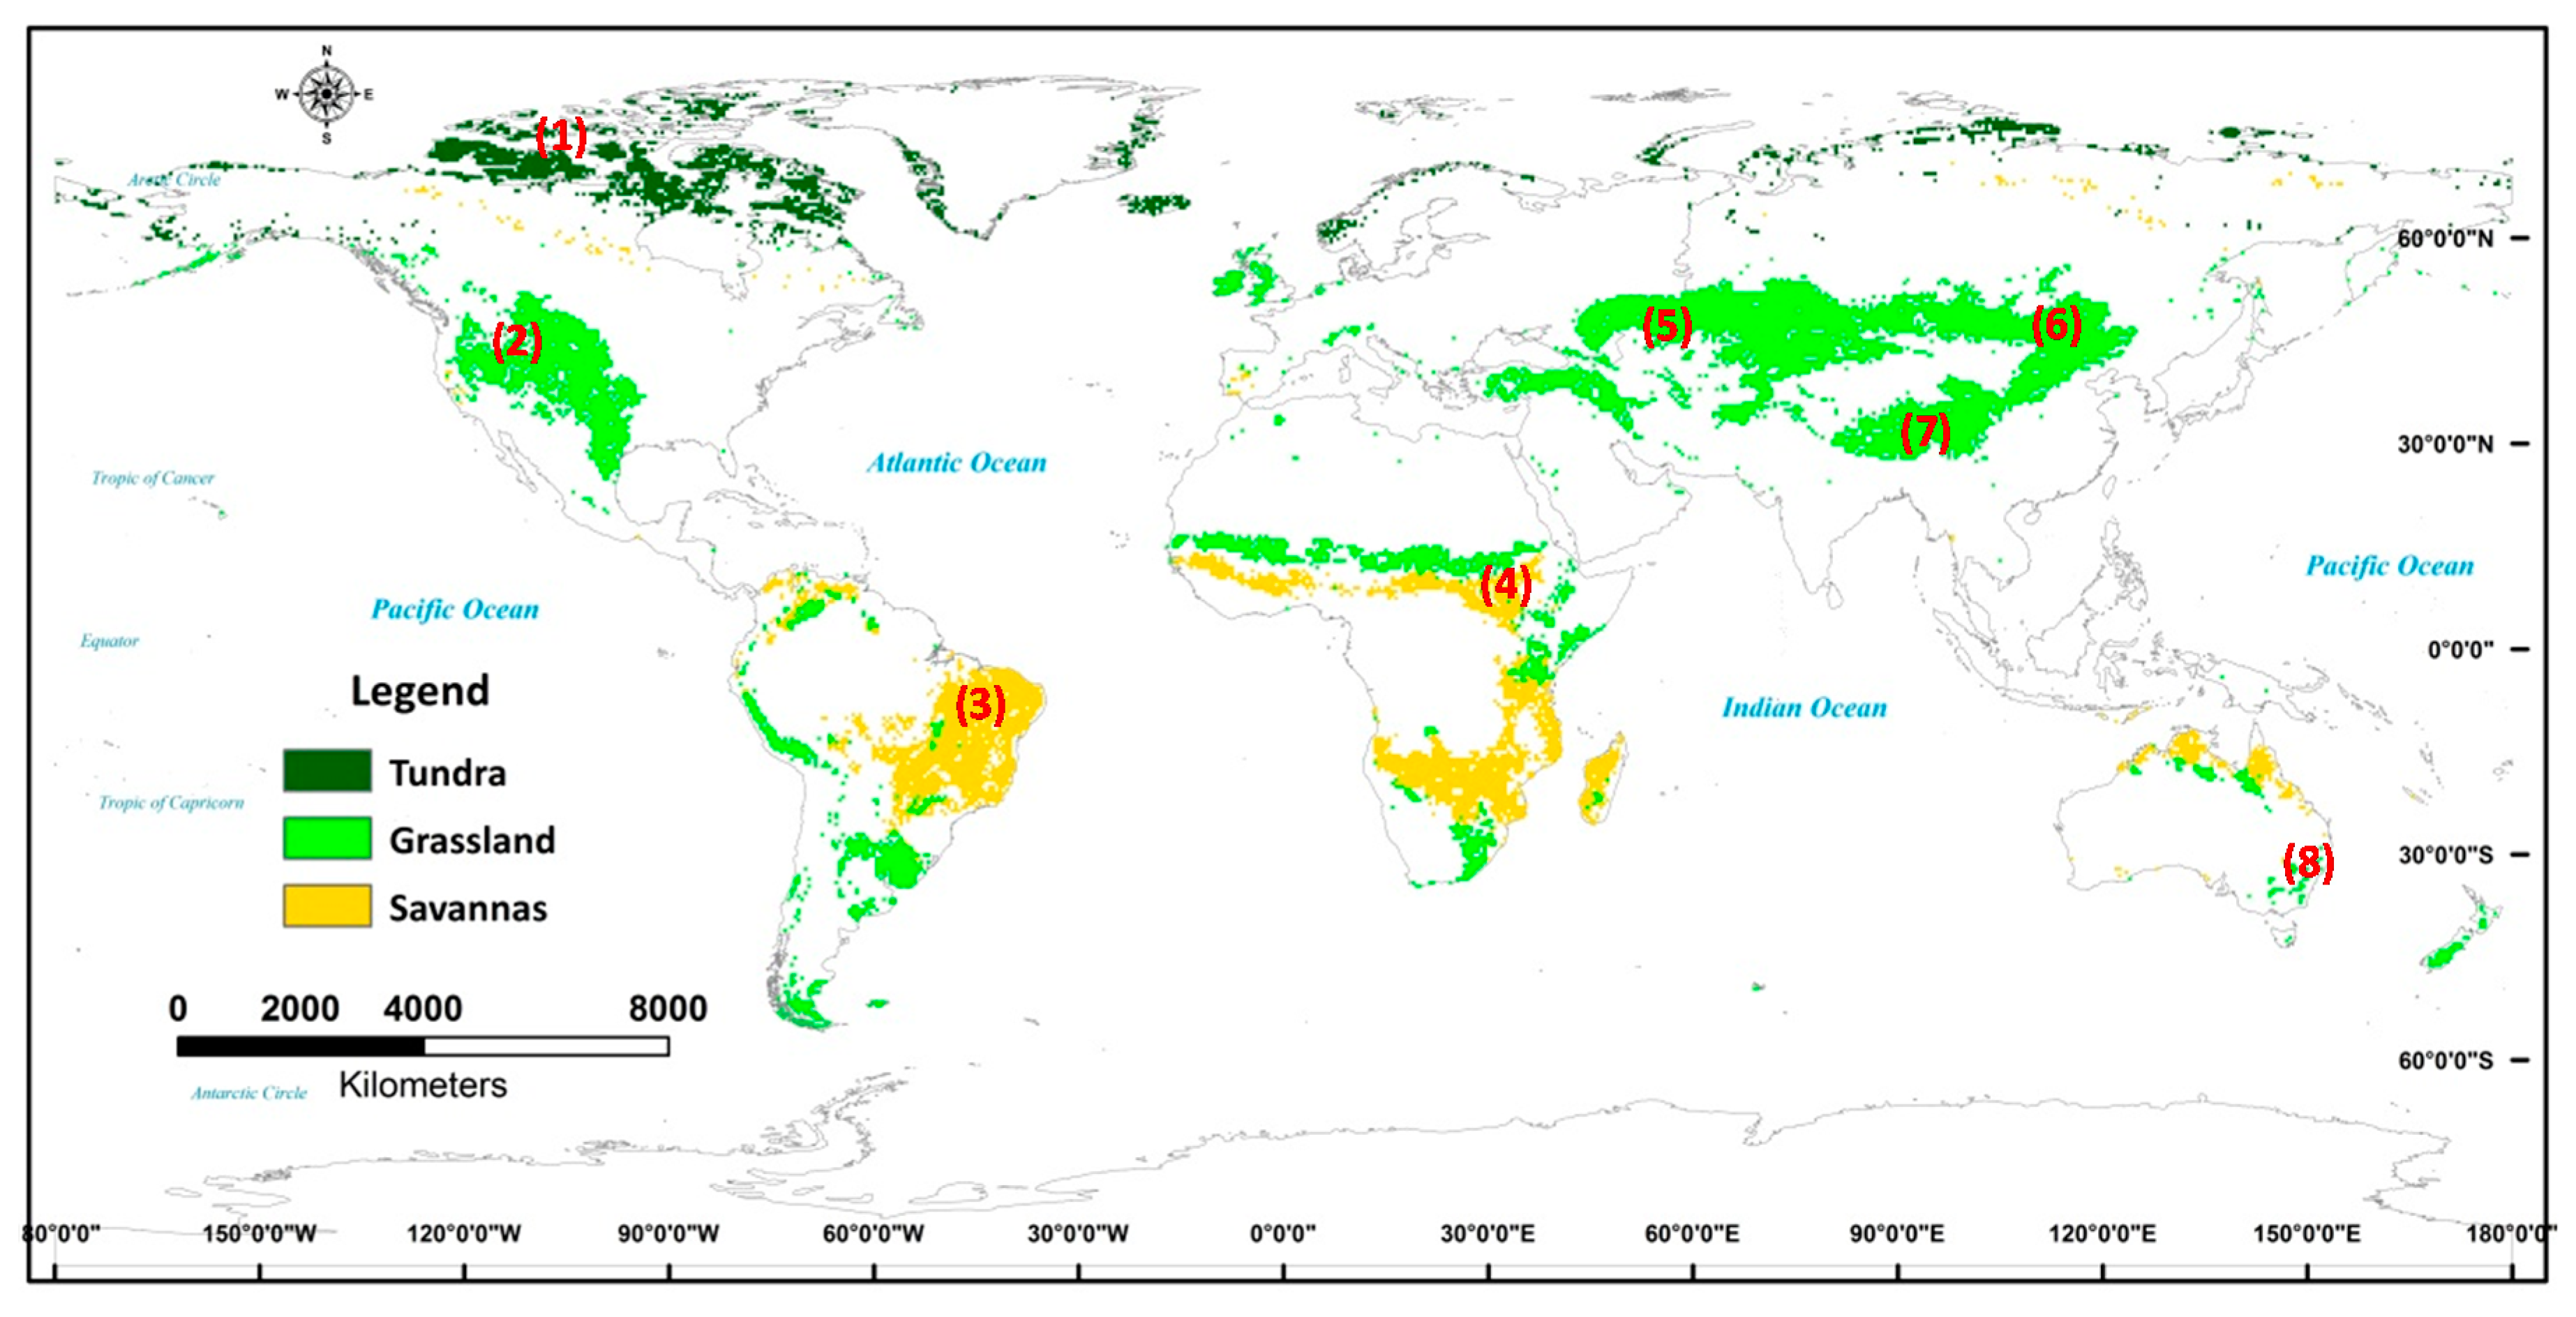
2.1. Study Area

Open, Grass- and Forb-Dominated (OGFD) ecosystems span the full range of global mean annual temperatures from Arctic and alpine tundra to tropical grassland and savanna, but span a relatively narrow range of mean annual precipitation (10 to 100 cm/year) [16,17]. These ecosystems are among the largest in the world and contribute to the livelihoods of more than 800 million people [1]. They are a source of goods and services, such as food and forage, energy and wildlife habitat; they also provide carbon and water storage and watershed protection for many major river systems [1,2,18]. The moisture regime is generally sufficient to support the dense herbaceous plant growth that is characteristic of OGFD systems, but insufficient to permit forests to dominate [17]. OGFD ecosystems are more dependent on temperature and annual precipitation in areas with very cold temperatures than in warmer areas [17]. Nevertheless, there is concern for these systems because they support the Earth’s vast range of large grazing mammals, both wild and domestic. The area of global OGFD ecosystems, including tundra, grasslands and savanna, has been estimated at 3.73 billion ha (37,300,000 km2) from the land cover classes defined by the International Geosphere-Biosphere Programme (IGBP, http://www.igbp.net), which means that such areas cover about 19% of the world’s land area. These OGFD ecosystems are mainly distributed through the Arctic, southwestern USA, mid-eastern South America, central Africa, central Eurasia, the Mongolian Plateau, the Qinghai-Tibetan Plateau and Oceania (Figure 1).

2.2. Dataset and Pre-Analysis

Climatic data: Monthly mean temperature and total precipitation data were obtained from the Climatic Research Unit’s (CRU) Time-Series Version 3.21 (TS3.21) high-resolution gridded dataset of month-by-month variation in climate (http://badc.nerc.ac.uk), at a resolution of 0.5°. We used these data to examine the annual and monthly impacts of climate on the dynamics of OGFD ecosystems’ productivity at global and regional scales from 1982 to 2011.
Remote sensing data: In recent years, changes in regional or global ecosystem productivity have been widely documented by remotely-sensed spectral vegetation indices, such as the NDVI. The NDVI is an index of vegetation greenness and photosynthetic capacity and is the normalized ratio of red to Near-Infrared (NIR) reflectance [19]. It is widely used to detect variability in the productivity and phenology of regional and global terrestrial ecosystems [11,12,13,19]. The most popular continuous and long-term source of NDVI data is the Global Inventory Modeling and Mapping Studies (GIMMS) NDVI dataset from the National Oceanic and Atmospheric Administration Advanced Very High Resolution Radiometer (NOAA AVHRR), which dates back to July 1981. We used the GIMMS NDVI third generation monthly dataset from 1982 to 2011, at a resolution of 0.083°, to analyze the actual status of global and regional OGFD ecosystem productivity. The GIMMS NDVI data have been calibrated and widely used to detect changes in vegetation at regional and global scales in recent years.
Land cover map: We used global land cover data at a resolution of 8 km from the International Geosphere-Biosphere Programme (IGBP) [20] (http://www.igbp.net) to derive the global distribution map of OGFD ecosystems.
Bioclimatic indices and data processing: Seven bioclimatic indices, namely the annual total precipitation (Pat, mm), precipitation of the wettest month (Pwm, mm), precipitation of the driest month (Pdm, mm), annual mean temperature (Tam, °C), mean temperature of the hottest month (Thm, °C), mean temperature of the coldest month (Tcm, °C) and the ombrothermic index (Io = Pt/Ts, where Pt is the total precipitation of those months whose average temperature is higher than 0 °C and Ts is the sum of the monthly average temperature of those months whose average temperature is higher than 0 °C) [21], were chosen for analysis. These indices were calculated using the monthly total precipitation and mean temperature data from the CRU TS3.21 for the period 1982 to 2011 for the different OGFD types and for regions in which the OGFD ecosystems were mainly distributed. The bioclimatic variables represent the annual climate (e.g., mean annual temperature, annual precipitation) and extreme or limiting environmental factors (e.g., temperature of the coldest and warmest months, precipitation during wet and dry months and ombrothermic index) and, so, provide biologically-relevant information about ecosystem productivity.
We aggregated the monthly GIMMS NDVI to obtain the annual maximum values of the NDVI (NDVImax) using a maximum value composite approach and then averaged the monthly GIMMS NDVI to create the annual mean NDVI (NDVImean) for the period from 1982 to 2011. We identified three OGFD ecosystem types at the global scale, namely grasslands, savanna and tundra. The distribution of grasslands and savanna was derived directly from the 17th IGBP classification map. Grassland in the Arctic Circle (66°33′N) was defined as tundra. We resampled the NDVI and OGFD distribution map using the nearest-neighbor method at a resolution of 0.5°, so that it was consistent with the resolution of the climate data used to determine the climatic predictors of changes in OGFD ecosystem productivity.

2.3. Data Analysis

General trend: We detected a gradual change in the annual maximum and mean NDVI in OGFD ecosystems form 1982 to 2011 at the pixel level using a least-squares linear regression model, namely y = a + bx [22], where a and b are the regression coefficients (a is the intercept and b the slope), y is the year-by-year annual maximum or annual mean NDVI and x is time. The trends were identified as being statistically significant (p < 0.05) or highly statistically significant (p < 0.01).
Stepwise multiple regressions: We determined the relationship between the single response variable (dependent variable) and two or more controlled variables (independent variables) using multiple linear regression [23]. Stepwise Multiple Regressions (SMR), which combine forward selection and backward elimination methods, were used to identify climatic factors that controlled productivity changes in the OGFD ecosystems [23,24]. Since the annual meteorological cycles in the Northern and Southern Hemisphere are different, we used stepwise multiple regressions to determine the relationship between the NDVI and bioclimatic indices in all pixels of the OGFD types and major OGFD ecosystems, aggregated over time for the various types and regions.

3. Results

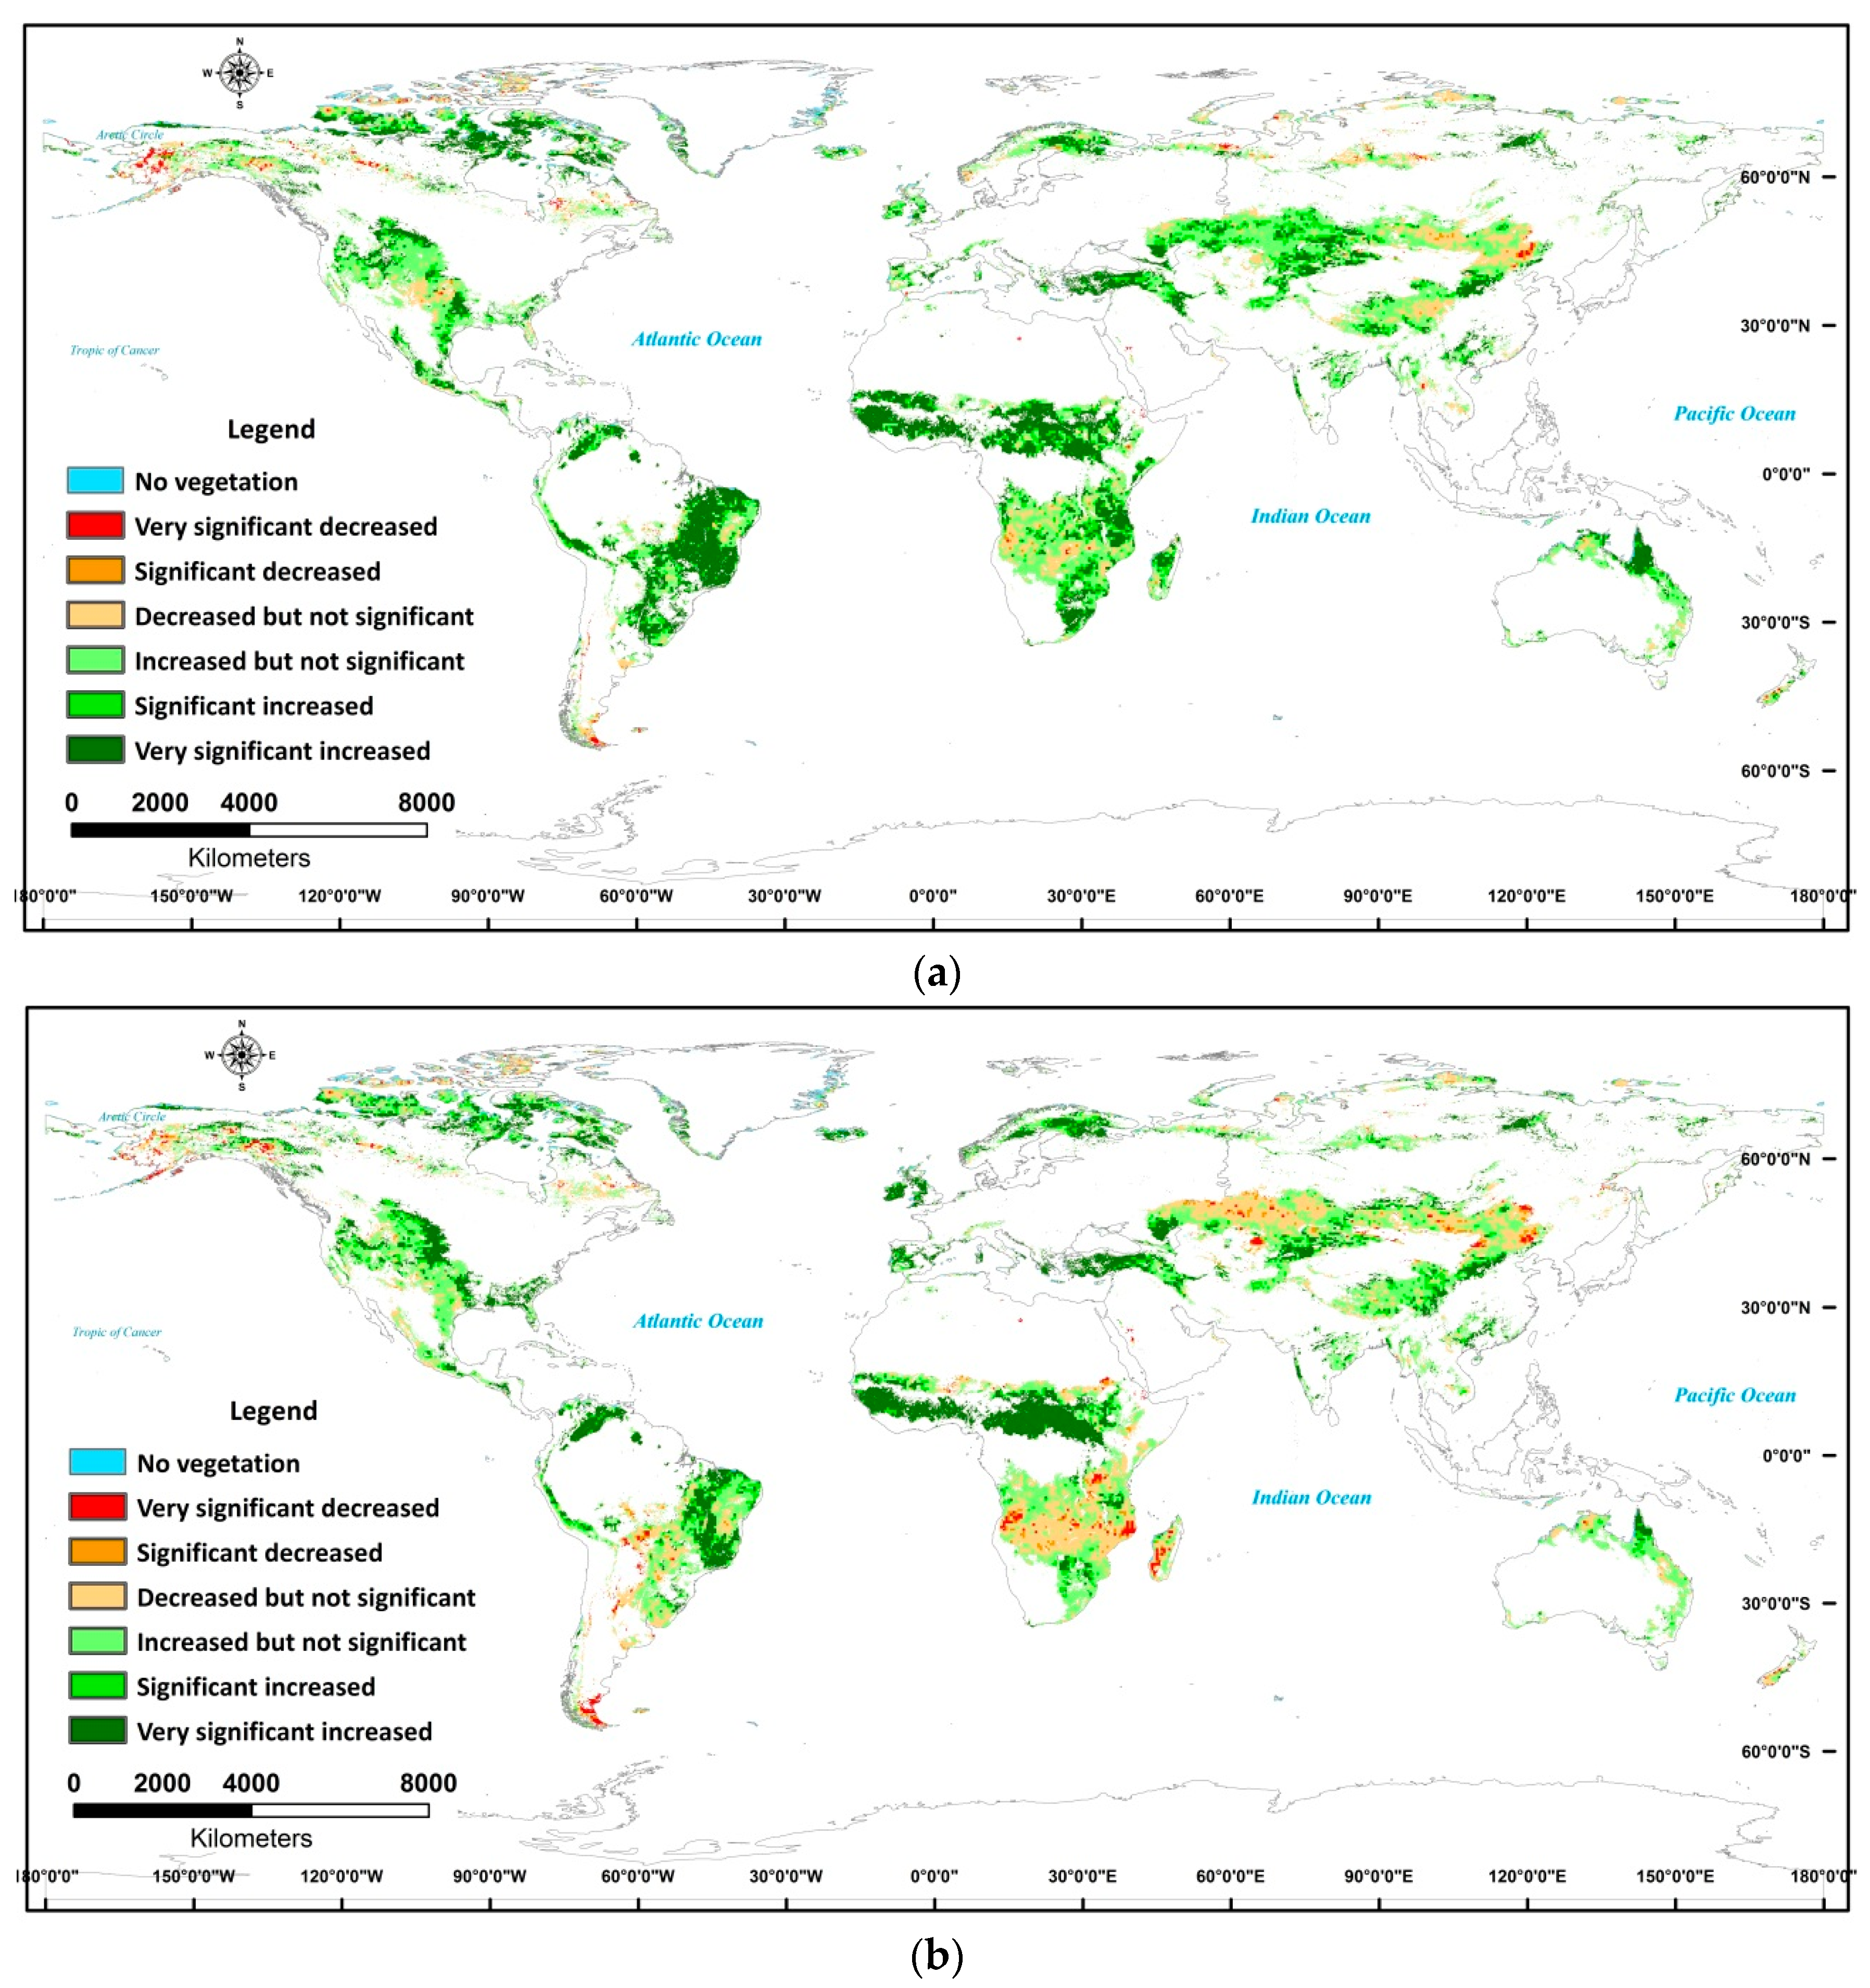
3.1. Productivity Changes in Global OGFD Ecosystems

We found significant (p < 0.05) and very significant (p < 0.01) increasing trends in the annual maximum NDVI across 45.8% of the global OGFD area. Significantly- (p < 0.05) and very significantly- (p < 0.01) decreasing trends in the annual maximum NDVI were observed for only 1.5% of the area (Table 1). The significant increases in the annual maximum NDVI were mainly distributed throughout OGFD ecosystems in the Arctic, mid-eastern South America, central Africa, central Eurasia and Oceania, whereas decreases were observed mainly on the Mongolian Plateau (Figure 2a; Table 2). Savanna (60.6%) accounted for the highest percentage of the significant increasing trend (p < 0.05 and p < 0.01) in the annual maximum NDVI, followed by tundra (48.2%) and grassland (38.4%) (Table 1).
Trends in the annual mean NDVI are similar to those of the maximum NDVI in most OGFD ecosystems, but the increasing and decreasing trends in the annual mean NDVI are stronger and weaker, respectively, than the corresponding trends in the maximum NDVI (Table 1). Trends were observed in grassland and savanna ecosystems in mid-eastern South America, central Africa, central Eurasia and Oceania (Figure 2b and Table 2). In the Arctic region, a smaller area was subjected to significant decreasing and increasing trends in the annual mean NDVI than in the case of annual maximum NDVI (Table 2). The decreasing and increasing trends in the annual mean NDVI are weaker and stronger, respectively, than the corresponding trends in the maximum NDVI for the southwestern USA (Table 2). The areas on the Mongolian and Qinghai–Tibetan Plateau that experienced significant decreasing and increasing trends in the annual mean NDVI were larger than the areas with corresponding trends in the maximum NDVI (Table 2). There was a significant increasing trend in the annual mean NDVI for 43.5% of the global tundra ecosystem area, which is greater than that for grasslands and savanna (Table 1).

3.2. Climatic Predictors of Changes in the Productivity of Different OGFD Ecosystems

Stepwise multiple regression models based on bioclimatic variables show that the contributions of climate change to the annual maximum and mean NDVI are different in different OGFD ecosystems (Table 3). For tundra, Tam is the most important predictors of the annual maximum NDVI, whereas Tam and Thm are important predictors of changes in the annual mean NDVI. The annual maximum NDVI in grassland ecosystems is controlled mainly by Pdm, Io and Pat, and the annual mean NDVI is controlled by Tam, Pdm and Pwm. For savanna, Thm, Pat, Io and Tam are the most important predictors of the annual maximum NDVI, whereas Pat, Tcm, Pwm and Pdm are strong predictors of the annual mean NDVI. The coefficients of determination (R2), which are a good measure of predicative performance, range from 0.415 to 0.547 in different OGFD ecosystems (Table 3). Bioclimatic factors explain 41.5% (R2 = 0.415) and 54.7% of the variation in the annual maximum NDVI and the variation in annual mean NDVI in tundra, as well as 50.0% and 51.8% in grasslands and 53.1% and 47.7% in savanna, respectively.

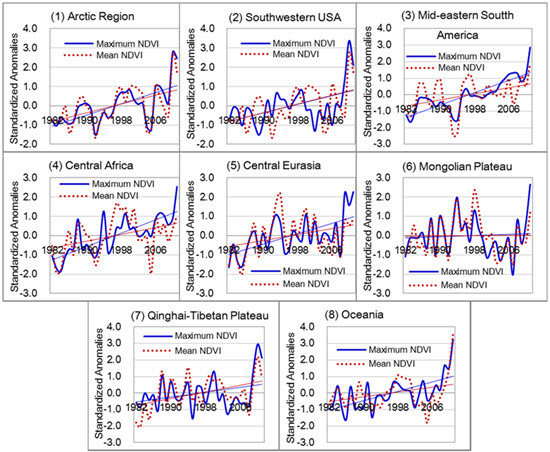
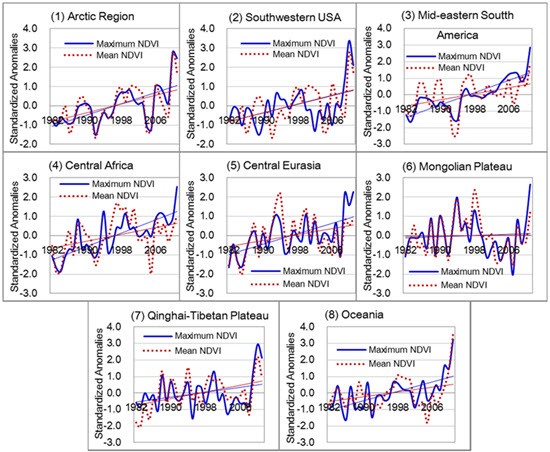
3.3. Climatic Predictors of Changes in OGFD Ecosystems’ Productivity in Different Regions

We found that different climate predictors drove the variability in OGFD ecosystem productivity in different regions (Table 4 and Table S1). In OGFD ecosystems, Pat was a predictor of positive changes in the annual maximum NDVI in southwestern USA, central Africa and central Eurasia and a predictor of negative changes in the annual maximum NDVI in the Arctic. Pwm was a predictor of positive changes in central Africa, central Eurasia, on the Mongolian Plateau and in Oceania and Pdm a predictor of negative change in the productivity of OGFD ecosystems in the Arctic, mid-eastern South America, central Africa and on the Mongolian Plateau. Tam was a predictor of positive changes in grassland productivity in the Arctic and mid-eastern South America, whereas Thm predicted positive changes in the Arctic, central Africa and on the Mongolian and Qinghai–Tibetan Plateau, but predicted negative changes in Oceania. Tcm predicted positive changes in OGFD ecosystem productivity in the Arctic and negative changes on the Mongolian Plateau. Io predicted positive changes in OGFD ecosystems productivity in mid-eastern South America and Oceania, but negative changes in the southwestern USA and central Eurasia.
Pat had a positive impact on the annual mean NDVI in OGFD ecosystems in southwestern USA, mid-eastern South America, central Africa and central Eurasia and a negative impact on the Qinghai–Tibetan Plateau. Pwm had a positive impact on the annual mean NDVI in southwestern USA, central Africa, central Eurasia and on the Mongolian Plateau and a negative impact in mid-eastern South America. Pdm was identified as a negative predictor for central Africa and on the Mongolian Plateau. Tam was identified as a positive predictor for the Arctic, the southwestern USA, mid-eastern South America and on the Qinghai-Tibetan Plateau and a negative predictor in Oceania. Thm had a positive impact in southwestern USA, mid-eastern South America and on the Mongolian and Qinghai-Tibetan Plateaus and a negative impact in central Africa. Tcm was a positive predictor in Oceania and a negative predictor in the southwestern USA and on the Mongolian Plateau. Io was confirmed as a positive predictor in Oceania.

4. Discussion

Results from least-squares linear regression analysis show that changes in the NDVI were not significant for most (>50%) global OGFD ecosystems and that there were increasing trends in both the annual maximum NDVI and annual mean NDVI from 1982 to 2011 for 34% and 46% of OGFD ecosystems, respectively (Table 1). The trends in the annual maximum NDVI show greater increases and smaller decreases than the trends in the annual mean NDVI in global OGFD ecosystems (Figure 2; Table 1). Most previous studies have reported changes in ecosystem productivity based on the maximum NDVI [14]. The annual maximum NDVI appears to be less stable than the annual mean NDVI in OGFD ecosystems (Table 1; Figure S1). The annual average NDVI indicates the normal productivity status of an ecosystem, so information about changes in this index should be useful because of its importance for grazing production and other ecosystem services [2]. Furthermore, the bioclimatic predictors of the maximum and mean NDVI in OGFD ecosystems are inconsistent (Table 3; Table S1).
The area showing an increasing trend in the mean NDVI (61% of OGFD ecosystems globally) is larger than the area with an increasing trend in the maximum NDVI (40%). Savanna, grasslands and tundra account for about 21%, 10% and 5% of the change in the maximum NDVI, respectively (Table 1). Normal productivity in savanna and grasslands ecosystems is subjected to greater influence from other factors, such as human activity, wild and domestic herbivores and fire, than are tundra ecosystem [1,2,25,26,27]. There were significant increasing trends in productivity in OGFD systems (both maximum and mean NDVI values) in the Arctic, mid-eastern South America, central Africa, central Eurasia and Oceania and significant decreasing trends in systems on the Mongolian Plateau (Figure 2; Table 2). Our results confirm the findings of previous studies; i.e., that, depending on the region, vegetation activity and ecosystem productivity have not changed or increased in recent years [11,19].
Most of the changes in productivity in OGFD ecosystems were correlated with bioclimatic indices (Table 3; Table S1). The coefficients of determination between the NDVI and bioclimatic factors range from 0.415 to 0.547, and bioclimatic factors explain 41.5% to 54.7% of the variation in the productivity in various OGFD ecosystems (Table 3). OGFD ecosystem productivity in the Arctic and in parts of mid-eastern South America benefited from increases in temperature, whereas productivity in Oceania and central Africa decreased as temperature increased from 1982 to 2011 (Table 4 and Table S1). Our results suggest that increasing temperatures have a positive impact on vegetation activity and biomass in cold regions [8,9,11,28,29,30] and a negative impact in warm regions [9]. Therefore, increasing temperatures tend to improve and diminish productivity in colder OGFD and warmer OGFD ecosystems, respectively.
In grassland and savanna, precipitation was the main driver of changes in the annual maximum and mean NDVI from 1982 to 2011 (Table 3; Table S1), which agrees with previous reports of a positive correlation between rainfall and productivity in water-limited ecosystems [7,12,31,32,33]. Productivity in the Arctic tundra responded negatively to variations in precipitation (Table 3; Table S1). While it is well known that the rate of temperature increase is rising over time and has greater consequences in the Arctic than in other regions [9], the impact of increases in precipitation cannot be ignored [34]. The recently-reported weakening in the influence of warming on vegetation activity in the Northern Hemisphere [11] may be related to the negative impacts of increased precipitation on tundra productivity in the Arctic.
The bioclimatic indices that controlled the NDVI varied between regions (Table 4 and Table S1). Bioclimatic predictors explain 13.3% of the variability in the annual maximum NDVI in the southwestern USA and 18.8% of the variability in the annual mean NDVI in central Eurasia, but these correlations are not significant (p > 0.05) (Table 4). Therefore, the variability in the annual maximum NDVI in the southwestern USA and in the annual mean NDVI in central Eurasia can be attributed mainly to non-climatic factors, such as improved management and fires [27]. The productivity of OGFD ecosystems on the Mongolian Plateau showed a decreasing trend (Figure 2; Table 1). The reasons for this decline are debated, but recent research suggests that it is attributable to overgrazing [26]. Climate predictors explain 55.2% and 55.5% of the variability in the annual maximum and mean NDVI, respectively, on the Mongolian Plateau from 1982 to 2011. Thus, our results suggest that the observed decline in the productivity of OGFD ecosystems on the Mongolian Plateau is attributable mainly to increases in drought and temperature in recent years.
In this contribution, we have documented changing patterns in the productivity of global OGFD ecosystems and the relationships with bioclimatic factors, from our analysis of long-term NDVI and climatic data. However, some uncertainties remain, such as those in the NDVI [14,19,22,35], gridded CRU data and land use data [20]. For example, the annual maximum NDVI values are sensitive to false highs and noise correction [14], while the annual mean values of NDVI were affected by the non-growing season NDVI (e.g., too low a value of NDVI) to cause the possible error. The NDVI for one savannas region is increasing as a result of woody encroachment [5,36]. At 0.5°, the spatial resolution of the gridded CRU data is coarse. There is some uncertainty regarding the mixed type classes of IGBP global land cover data [20,37], and spatial variability also has an influence on the results of stepwise multiple regression analysis for the OGFD regions or ecosystems. Over a period of 30 years, large areas of global OGFD ecosystems may have changed to other land cover types. Seasonal phenology also has an important effect on the primary productivity of terrestrial ecosystem [38]. Future studies should use data from long-term controlled experiments and multi-model ensembles to examine these uncertainties and the mechanisms that control the relative contributions of climate change to variations in the productivity of global OGFD ecosystems.

5. Conclusions

(1) From 1982 to 2011, there were significant changes in the annual maximum NDVI for 47.3% of OGFD ecosystems worldwide, with 45.8% experiencing an increase and 1.5% a decrease. There were significant changes in the annual mean NDVI for 38.3% of OGFD ecosystems over the same period, with increases in 33.7% and decreases in 4.6%.
(2) The annual maximum and mean NDVI values of OGFD ecosystems showed significant increasing trends throughout the Arctic, mid-eastern South America, central Africa, central Eurasia and Oceania and decreasing trends on the Mongolian Plateau.
(3) More than 50% of Arctic tundra and 33% of South American savanna have benefited from increasing temperature, while more than 50% of OGFD ecosystems in Oceania experienced negative impacts from warming during 1982 to 2011.
(4) Precipitation was positively correlated with the productivity change in grassland and savannas, but was negatively correlated with productivity in the Arctic tundra from 1982 to 2011.
(5) Variability in the maximum and mean productivities is related to different climatic predictors in different regions and different OGFD ecosystems types. Bioclimatic indices explain between 42% and 55% of the changes in productivity of global OGFD ecosystems.

Supplementary Materials

The following are available online at www.mdpi.com/2072-4292/8/5/384/s1, Figure S1: Trends of standardized anomalies of annual maximum and mean NDVI in the main distribution regions of global OGFD ecosystem; Table S1: Significant correlation between NDVI and bioclimatic factors in different OGFD ecosystem types and different regions from 1982 to 2011.

Acknowledgments

The authors gratefully acknowledge financial support from the National Key Project of Scientific and Technical Supporting Program of China (2013BAC09B03), the National Natural Science Foundation of China (31570484, 31170460) and a cooperative project with the Nagqu Grassland Station and the Institute of Agricultural Environment and Sustainable Development in agriculture. We also thanks GLCF (Global Land Cover Facility, University of Maryland) for providing the GIMMS NDVI data, CRU (Climatic Research Unit, University of East Anglia) for sponsoring the meteorological data and IGBP (International Geosphere-Biosphere Programme) for providing the global land cover data.

Author Contributions

Qingzhu Gao and Mark W. Schwartz designed the study. Wenquan Zhu analyzed the remote sensing data. Qingzhu Gao, Mark W. Schwartz and Yue Li wrote the main manuscript text. Yunfan Wan, Xiaobo Qin, Xin Ma and Shuo Liu analyzed the results. Matthew A. Williamson and Casey B. Peters proposed useful suggestions on the manuscript. All authors reviewed the manuscript.

Conflicts of Interest

The authors declare no conflict of interest.

Abbreviations

The following abbreviations are used in this manuscript:
OGFDOpen, Grass- and Forb-Dominated ecosystems
NDVINormalized Difference Vegetation Index
IGBPInternational Geosphere-Biosphere Programme
CRUClimatic Research Unit
TS3.21Time-Series Version 3.21
NIRNear-Infrared Reflectance
GIMMSGlobal Inventory Modeling and Mapping Studies
NOAANational Oceanic and Atmospheric Administration
AVHRRAdvanced Very High Resolution Radiometer
PatAnnual Total Precipitation (mm)
PwmPrecipitation of Wettest Month (mm)
PdmPrecipitation of Driest Month (mm)
TamAnnual Mean Temperature (°C)
ThmMean Temperature of Hottest Month (°C)
TcmMean Temperature of Coldest Month (°C)
IoOmbrothermic Index (Io = Pt/Ts, Pt is the total precipitation of those months whose average temperature is higher than 0 °C, and Ts is the sum of the monthly average temperature of those months whose average temperature is higher than 0 °C)

References

  1. White, R.P.; Murray, S.; Rohweder, M. Grasslands: Executive Summary. In Pilot Analysis of Global Ecosystems: Grassland Ecosystems; World Resources Institute: Washington, DC, USA, 2000; pp. 1–6. [Google Scholar]
  2. Suttie, J.M.; Reynolds, S.G.; Batello, C. (Eds.) Chapter 1 Introduction. In Grasslands of the World; Food & Agriculture Organization: Rame, Italy, 2005; pp. 1–18.
  3. Archer, S.; Schimel, D.S.; Holland, E.A. Mechanisms of shrubland expansion: Land use, climate or CO2? Clim. Chang. 1995, 29, 91–99. [Google Scholar] [CrossRef]
  4. Van Auken, O.W. Shrub invasions of North American semiarid grasslands. Annu. Rev. Ecol. Evol. Syst. 2000, 31, 197–215. [Google Scholar] [CrossRef]
  5. D’Odorico, P.; Okin, G.S.; Bestelmeyer, B.T. A synthetic review of feedbacks and drivers of shrub encroachment in arid grasslands. Ecohydrology 2012, 5, 520–530. [Google Scholar] [CrossRef]
  6. Morgan, J.A.; LeCain, D.R.; Pendall, E.; Blumenthal, D.M.; Kimball, B.A.; Carrillo, Y.; Williams, D.G.; Heisler-White, J.; Dijkstra, F.A.; West, M. C4 grasses prosper as carbon dioxide eliminates desiccation in warmed semi-arid grassland. Nature 2011, 476, 202–205. [Google Scholar] [CrossRef] [PubMed]
  7. Craine, J.M.; Nippert, J.B.; Elmore, A.J.; Skibbe, A.M.; Hutchinson, S.L.; Brunsell, N.A. Timing of climate variability and grassland productivity. Proc. Natl. Acad. Sci. USA 2012, 109, 3401–3405. [Google Scholar] [CrossRef] [PubMed]
  8. Xu, X.; Sherry, R.A.; Niu, S.; Li, D.; Luo, Y. Net primary productivity and rain-use efficiency as affected by warming, altered precipitation, and clipping in a mixed-grass prairie. Glob. Chang. Biol. 2013, 19, 2753–2764. [Google Scholar] [CrossRef] [PubMed]
  9. Field, C.B.; Barros, V.R.; Mach, K.; Mastrandrea, M.; van Aalst, M.; Adger, W.N.; Arent, D.J.; Barnett, J.; Betts, R.; Bilir, T.E.; et al. Technical summary. In Climate Change 2014: Impacts, Adaptation, and Vulnerability. Part A: Global and Sectoral Aspects. Contribution of Working Group II to the Fifth Assessment Report of the Intergovernmental Panel on Climate Change; Cambridge University Press: Cambridge, UK; New York, NY, USA, 2014; pp. 35–94. [Google Scholar]
  10. Li, F.Y.; Newton, P.C.; Lieffering, M. Testing simulations of intra- and inter-annual variation in the plant production response to elevated CO2 against measurements from an 11-year FACE experiment on grazed pasture. Glob. Chang. Biol. 2014, 20, 228–239. [Google Scholar] [CrossRef] [PubMed]
  11. Piao, S.; Nan, H.; Huntingford, C.; Ciais, P.; Friedlingstein, P.; Sitch, S.; Peng, S.; Ahlstrom, A.; Canadell, J.G.; Cong, N.; et al. Evidence for a weakening relationship between interannual temperature variability and northern vegetation activity. Nat. Commun. 2014, 5, 5018. [Google Scholar] [CrossRef] [PubMed] [Green Version]
  12. Liu, Y.Y.; Dijk, A.I.; McCabe, M.F.; Evans, J.P.; Jeu, R.A. Global vegetation biomass change (1988–2008) and attribution to environmental and human drivers. Glob. Ecol. Biogeogr. 2013, 22, 692–705. [Google Scholar] [CrossRef]
  13. Jong, R.; Schaepman, M.E.; Furrer, R.; Bruin, S.; Verburg, P.H. Spatial relationship between climatologies and changes in global vegetation activity. Glob. Chang. Biol. 2013, 19, 1953–1964. [Google Scholar] [CrossRef] [PubMed]
  14. Pettorelli, N.; Vik, J.O.; Mysterud, A.; Gaillard, J.M.; Tucker, C.J.; Stenseth, N.C. Using the satellite-derived NDVI to assess ecological responses to environmental change. Trends Ecol. Evol. 2005, 20, 503–510. [Google Scholar] [CrossRef] [PubMed]
  15. Ning, T.; Liu, W.; Lin, W.; Song, X. NDVI variation and its responses to climate change on the northern loess plateau of China from 1998 to 2012. Adv. Meteorol. 2015. [Google Scholar] [CrossRef]
  16. Breshears, D.D. The grassland-forest continuum: Trends in ecosystem properties for woody plant mosaics? Front. Ecol. Environ. 2006, 4, 96–104. [Google Scholar] [CrossRef]
  17. Whittaker, R.H. Communities and Ecosystems, 2nd ed.; Macmillan Publishing Co.: New York, NY, USA, 1975. [Google Scholar]
  18. O’Mara, F.P. The role of grasslands in food security and climate change. Ann. Bot Lond. 2012, 110, 1263–1270. [Google Scholar] [CrossRef] [PubMed]
  19. Guay, K.C.; Beck, P.S.; Berner, L.T.; Goetz, S.J.; Baccini, A.; Buermann, W. Vegetation productivity patterns at high northern latitudes: A multi-sensor satellite data assessment. Glob. Chang. Biol. 2014, 20, 3147–3158. [Google Scholar] [CrossRef] [PubMed]
  20. Loveland, T.R.; Reed, B.C.; Brown, J.F.; Ohlen, D.O.; Zhu, J.; Yang, L.; Merchant, J.W. Development of a global land cover characteristics database and IGBP DISCover from 1-km AVHRR data. Int. J. Remote Sens. 2000, 21, 1303–1330. [Google Scholar] [CrossRef]
  21. Valencia-Barrera, R.; Comtois, P.; Fernández-González, D. Bioclimatic indices as a tool in pollen forecasting. Int. J. Biometeorol. 2002, 46, 171–175. [Google Scholar] [CrossRef] [PubMed]
  22. Chen, B.; Xu, G.; Coops, N.C.; Ciais, P.; Innes, J.L.; Wang, G.; Myneni, R.B.; Wang, T.L.; Krzyzanowski, J.; Li, Q.L.; et al. Changes in vegetation photosynthetic activity trends across the Asia–Pacific region over the last three decades. Remote Sens. Environ. 2014, 144, 28–41. [Google Scholar] [CrossRef]
  23. Badreldin, N.; Sanchez-Azofeifa, A. Estimating forest biomass dynamics by integrating multi-temporal Landsat satellite images with ground and airborne LiDAR data in the Coal Valley Mine, Alberta, Canada. Remote Sens. 2015, 7, 2832–2849. [Google Scholar] [CrossRef]
  24. Schmidt, M.; Klein, D.; Conrad, C.; Dech, S.; Paeth, H. On the relationship between vegetation and climate in tropical and northern Africa. Theor. Appl. Climatol. 2014, 115, 341–353. [Google Scholar] [CrossRef]
  25. Liu, Y.Y.; Evans, J.P.; McCabe, M.F.; de Jeu, R.A.; van Dijk, A.I.; Dolman, A.J.; Saizen, I. Changing climate and overgrazing are decimating Mongolian steppes. PLoS ONE 2013, 8, e57599. [Google Scholar] [CrossRef] [PubMed]
  26. Hilker, T.; Natsagdorj, E.; Waring, R.H.; Lyapustin, A.; Wang, Y. Satellite observed widespread decline in Mongolian grasslands largely due to overgrazing. Glob. Chang. Biol. 2014, 20, 418–428. [Google Scholar] [CrossRef] [PubMed]
  27. Jolly, W.M.; Cochrane, M.A.; Freeborn, P.H.; Holden, Z.A.; Brown, T.J.; Williamson, G.J.; Bowman, D.M. Climate-induced variations in global wildfire danger from 1979 to 2013. Nat. Commun. 2015, 6, 7537. [Google Scholar] [CrossRef] [PubMed]
  28. Sistla, S.A.; Moore, J.C.; Simpson, R.T.; Gough, L.; Shaver, G.R.; Schimel, J.P. Long-term warming restructures Arctic tundra without changing net soil carbon storage. Nature 2013, 497, 615–618. [Google Scholar] [CrossRef] [PubMed]
  29. Fu, G.; Shen, Z.X.; Sun, W.; Zhong, Z.M.; Zhang, X.Z.; Zhou, Y.T. A meta-analysis of the effects of experimental warming on plant physiology and growth on the Tibetan Plateau. J. Plant. Growth Regul. 2014, 34, 57–65. [Google Scholar] [CrossRef]
  30. Zhang, Y.; Gao, Q.; Dong, S.; Liu, S.; Wang, X.; Su, X.; Li, Y.; Tang, L.; Wu, X.; Zhao, H. Effects of grazing and climate warming on plant diversity, productivity and living state in the alpine rangelands and cultivated grasslands of the Qinghai-Tibetan Plateau. Rangel. J. 2014, 37, 57–65. [Google Scholar] [CrossRef]
  31. Gao, Q.Z.; Li, Y.; Wan, Y.F.; Zhang, W.N.; Borjigdai, A. Challenges in disentangling the influence of climatic and socio-economic factors on alpine grassland ecosystems in the source area of Asian major rivers. Quatern. Int. 2013, 304, 126–132. [Google Scholar]
  32. Gao, Q.; Li, Y.; Wan, Y.; Qin, X.; Jiangcun, W.; Liu, Y. Dynamics of alpine grassland NPP and its response to climate change in Northern Tibet. Clim. Chang. 2009, 97, 515–528. [Google Scholar] [CrossRef]
  33. Gang, C.; Zhou, W.; Wang, Z.; Chen, Y.; Li, J.; Chen, J.; Qi, J.; Odeh, I.; Groisman, P.Y. Comparative assessment of grassland NPP dynamics in response to climate change in China, North America, Europe and Australia from 1981 to 2010. J. Agron. Crop. Sci. 2014, 201, 57–68. [Google Scholar] [CrossRef]
  34. Bintanja, R.; Selten, F.M. Future increases in Arctic precipitation linked to local evaporation and sea-ice retreat. Nature 2015, 509, 479–482. [Google Scholar]
  35. Fensholt, R.; Horion, S.; Tagesson, T.; Ehammer, A.; Ivits, E.; Rasmussen, K. Global-scale mapping of changes in ecosystem functioning from earth observation-based trends in total and recurrent vegetation. Glob. Ecol. Biogeogr. 2015, 24, 1003–1017. [Google Scholar] [CrossRef]
  36. Van Auken, O.W. Causes and consequences of woody plant encroachment into western North American grasslands. J. Environ. Manag. 2009, 90, 2931–2942. [Google Scholar] [CrossRef] [PubMed]
  37. Congalton, R.G.; Gu, J.; Yadav, K.; Thenkabail, P.; Ozdogan, M. Global land cover mapping: A review and uncertainty analysis. Remote Sens. 2014, 6, 12070–12093. [Google Scholar] [CrossRef]
  38. Xia, J.; Niu, S.; Ciais, P.; Janssens, I.; Chen, J.; Ammann, C.; Arain, A.; Blanken, P.D.; Cescatti, A.; Bonal, D.; et al. Joint control of terrestrial gross primary productivity by plant phenology and physiology. Proc. Natl. Acad. Sci. USA 2015, 112, 2788–2793. [Google Scholar] [CrossRef] [PubMed]
Figure 1. Global OGFD ecosystems distribution and regional division map. In this figure: (1) is the Arctic; (2) is the southwestern USA; (3) is mid-eastern South America; (4) is central Africa; (5) is central Eurasia; (6) is the Mongolian Plateau; (7) is the Qinghai-Tibetan Plateau; and (8) is Oceania.
Remotesensing 08 00384 g001
Figure 2. Spatial trends of annual maximum (a) and mean (b) NDVI in global OGFD ecosystems from 1982 to 2011.
Remotesensing 08 00384 g002
Table 1. The area proportion (%) of different change trends in the annual maximum and mean NDVI of global OGFD ecosystems from 1982 to 2011.
NDVITrendsTundraGrasslandSavannasGlobal OGFD Ecosystems
Annual maximumVery significantly decreased1.20.70.20.6
Significantly decreased1.80.90.50.9
Insignificantly decreased25.915.09.115.0
Insignificantly increased22.945.029.637.7
Significantly increased9.014.710.812.8
Very significantly increased39.223.749.833.0
Annual meanVery significantly decreased1.22.22.42.1
Significantly decreased1.42.82.52.5
Insignificantly decreased23.424.023.623.8
Insignificantly increased30.542.831.137.9
Significantly increased11.810.29.410.2
Very significantly increased31.718.031.023.5
Table 2. The area proportion (%) of different change trends in the annual maximum and mean NDVI of OGFD ecosystems in different regions from 1982 to 2011.
TrendsTrends in Annual Maximum NDVITrends in Annual Mean NDVI
Regions Significantly DecreasedInsignificantly ChangedSignificantly IncreasedSignificantly DecreasedInsignificantly ChangedSignificantly Increased
Arctic2.739.857.51.951.047.1
Southwestern USA0.567.332.20.463.536.1
Mid-eastern South America0.530.369.23.558.837.7
Central Africa0.843.455.86.662.530.9
Central Eurasia0.355.843.94.967.128.0
Mongolian Plateau5.187.37.611.479.09.6
Qinghai-Tibetan Plateau0.77920.31.070.328.7
Oceania1.556.142.42.380.717.0
Table 3. Stepwise multiple regression between NDVI and bioclimatic factors of different OGFD ecosystems from 1982 to 2011. The NDVImax is the annual maximum values of NDVI; NDVImean is the annual mean values of NDVI; Pat is annual total precipitation (mm); Pwm is the precipitation of the wettest month (mm); Pdm is the precipitation of the driest month (mm); Tam is annual mean temperature (°C); Thm is the mean temperature of the hottest month (°C); Tcm is the mean temperature of the coldest month (°C); and Io is the ombrothermic index.
Grassland TypesStepwise Regression EquationsR2Fp
TundraNDVImax = 0.484 + 0.644Tam0.415F(1,28) = 19.87<0.0001
NDVImean = 0.131 + 0.655Tam + 0.151Thm0.547F(2,27) = 16.30<0.0000
GrasslandNDVImax = 0.473 + 0.484Pdm − 0.545Io + 0.329Pat0.500F(3,26) = 8.670<0.0004
NDVImean = 0.235 + 0.462Tam + 0.325Pdm + 0.304Pwm0.518F(3,26) = 9.331<0.0002
SavannasNDVImax = 0.435 + 0.243Thm +18.08Pat − 18.034Io − 3.317Tam0.531F(4,25) = 7.077<0.0006
NDVImean = 0.325 + 0.763Pat + 0.246Tcm − 0.237Pwm − 0.165Pdm0.477F(4,25) = 5.711<0.0020
Table 4. Stepwise multiple regression between NDVI and bioclimatic factors of OGFD ecosystems in different regions from 1982 to 2011. The NDVImax is the annual maximum values of NDVI; NDVImean is the annual mean values of NDVI; Pat is annual total precipitation (mm); Pwm is the precipitation of the wettest month (mm); Pdm is the precipitation of the driest month (mm); Tam is annual mean temperature (°C); Thm is the mean temperature of the hottest month (°C); Tcm is the mean temperature of the coldest month (°C); and Io is the ombrothermic index.
RegionsStepwise Regression EquationsR2Fp
the ArcticNDVImax = 0.540 + 0.563Tam − 0.231Pat + 0.300Tcm − 0.200Pdm + 0.154Thm0.582F(5,24) = 6.686<0.0005
NDVImean = 0.123 + 0.714Tam0.509F(1,29) = 29.06<0.0001
the southwestern USANDVImax = 0.490 + 0.838Pat − 0.582Io0.133F(2,27) = 2.071<0.1457
NDVImean = 0.157 + 0.721Tam + 0.489Pwm − 0.254Tcm +0.336Pat + 0.283Thm0.530F(5,24) = 5.414<0.0018
mid-eastern South AmericaNDVImax = −0.202 + 0.603Tam + 0.297Io − 0.215Pdm0.346F(3,26) = 4.576<0.0011
NDVImean = 0.076 + 0.661 Pat + 0.196 Thm − 0.294Pwm + 0.244Tam0.333F(4,25) = 3.119<0.0328
central AfricaNDVImax = 0.119 +0.448Pat + 0.355Thm − 0.198Pdm + 0.209 Pwm0.532F(4,25) = 7.115<0.0006
NDVImean = 0.452 + 0.619 Pat + 0.253Pwm − 0.141Pdm – 0.135Thm0.662F(4,25) = 12.26<0.0000
central EurasiaNDVImax = 0.329 + 0.875Pat + 0.351Pwm − 0.596Io0.436F(3,26) = 6.701<0.0017
NDVImean = 0.229 + 0.275Pwm+ 0.247Pat0.188F(2,27) = 3.133<0.0598
the Mongolian PlateauNDVImax = 0.353 + 0.5748Pwm − 0.394Tcm − 0.302Pdm + 0.232Thm0.552F(4,25) = 7.695<0.0004
NDVImean = 0.184 + 0.700Pwm + 0.468Thm − 0.285Pdm − 0.229Tcm0.555F(4,25) = 7.797<0.0003
the Qinghai-Tibetan PlateauNDVImax = 0.368 + 0.427Thm0.182F(1,28) = 6.246<0.0186
NDVImean = 0.241 + 0.718Tam – 0.286Pat + 0.258Thm − 0.189Tcm0.536F(4,25) = 7.210<0.0005
OceaniaNDVImax = 0.795 + 0.409Io − 0.263Thm + 0.225Pwm0.584F(3,26) = 12.16<0.0000
NDVImean = 0.851 + 0.429Io − 0.532Tam + 0.345Tcm0.584F(3,26) = 12.17<0.0000

