Article

Long Term Validation of Land Surface Temperature Retrieved from MSG/SEVIRI with Continuous in-Situ Measurements in Africa

by
Frank-M. Göttsche
1,*,
Folke-S. Olesen
1,
Isabel F. Trigo
2,
Annika Bork-Unkelbach
1 and
Maria A. Martin
1
1
Karlsruhe Institute of Technology (KIT), Hermann-von-Helmholtz-Platz 1, 76344 Eggenstein-Leopoldshafen, Germany
2
Instituto Português do Mar e da Atmosfera (IPMA), Rua C ao Aeroporto, Lisboa 1749-077, Portugal
*
Author to whom correspondence should be addressed.
Submission received: 23 February 2016 / Revised: 2 May 2016 / Accepted: 4 May 2016 / Published: 13 May 2016

Abstract

:
Since 2005, the Land Surface Analysis Satellite Application Facility (LSA SAF) operationally retrieves Land Surface Temperature (LST) for the Spinning Enhanced Visible and Infrared Imager (SEVIRI) on board Meteosat Second Generation (MSG). The high temporal resolution of the Meteosat satellites and their long term availability since 1977 make their data highly valuable for climate studies. In order to ensure that the LSA SAF LST product continuously meets its target accuracy of 2 °C, it is validated with in-situ measurements from four dedicated LST validation stations. Three stations are located in highly homogenous areas in Africa (semiarid bush, desert, and Kalahari semi-desert) and typically provide thousands of monthly match-ups with LSA SAF LST, which are used to perform seasonally resolved validations. An uncertainty analysis performed for desert station Gobabeb yielded an estimate of total in-situ LST uncertainty of 0.8 ± 0.12 °C. Ignoring rainy seasons, the results for the period 2009–2014 show that LSA SAF LST consistently meets its target accuracy: the highest mean root-mean-square error (RMSE) for LSA SAF LST over the African stations was 1.6 °C while mean absolute bias was 0.1 °C. Nighttime and daytime biases were up to 0.7 °C but had opposite signs: when evaluated together, these partially compensated each other.

Graphical Abstract

1. Introduction

Land surface temperature (LST) is one of the main quantities governing the energy exchange between surface and atmosphere. LST is operationally retrieved and distributed from measurements of several space-borne sensors, such as the Spinning Enhanced Visible and Infrared Imager (SEVIRI) onboard Meteosat Second Generation (MSG)—provided by the Satellite Application Facility on Land Surface Analysis (LSA SAF; [1])—or the Moderate Resolution Imaging Spectroradiometer (MODIS) on EOS-Terra—provided by the MODIS Land Team. LSA SAF retrieves 15-min LST estimates from the SEVIRI channels at 10.8 µm and 12.0 µm using a generalized split-window (GSW) algorithm [2,3]. The GSW algorithm requires information on atmospheric moisture content, e.g., from numerical weather forecasts, and surface emissivity [3,4,5], which LSA SAF obtains with a fraction of vegetation cover (FVC) method [6]. The LSA SAF LST is also used to generate the Copernicus Global Land LST (http://land.copernicus.eu/global/) by merging the LSA SAF product retrieved from SEVIRI with LST estimates from other geostationary platforms [7]. Although LSA SAF’s target accuracy is 2 °C, the uncertainty of its LST retrievals depends on a wide range of factors such as land surface type (related to emissivity uncertainty), water vapor content in the atmosphere, or viewing geometry [3]. In order to ensure that LST retrievals are stable in time and consistently meet their expected accuracy, operationally derived LST have to be continuously monitored and assessed. Relative accuracy can be assessed by cross-validation between LST products obtained with different retrieval algorithms and/or for different sensors [8]. Such exercises allow analyses of the consistency between different products but provide limited information on their actual accuracy. The so-called ”radiance based validation” method [9,10] circumvents the need for in-situ measurements by assuming precise a priori knowledge about the surface (i.e., emissivity) as well as atmospheric conditions: this information is then used to obtain “true LST” via radiative transfer modeling. Consequently, the method is limited by errors in atmospheric profiles and by uncertainty in surface conditions. This is especially true over arid (sparsely vegetated) regions where surface emissivity can vary over a broad range (e.g., from 0.92 to 0.97 at 11 µm) and is often strongly variable in space [11,12,13], which causes large uncertainties in retrieved LST. Ultimately, in-situ measurements (“ground truth”) are needed for validating satellite LST and surface emissivity (LST&E) products [14,15]. In principle, LST products can readily be validated with ground-truth radiometric measurements. However, this so-called “temperature based validation” [8] is largely complicated by the spatial scale mismatch between satellite and ground based sensors [15]: areas observed by ground radiometers usually cover about 10 m2, whereas satellite measurements in the thermal infrared typically cover between 1 km2 and 100 km2. Furthermore, natural land covers and the corresponding LST are usually spatially heterogeneous: therefore, for in-situ LST to be representative for the area observed by the satellite, they have to be obtained over areas that are sufficiently homogenous at the scale of the in-situ measurements as well as on the satellite pixel scale. The size of the area that needs to be viewed by the validation instrument at the ground depends on the within-pixel variability of the surface and on how well measurements of several “end members” can be mixed in order to obtain a representative value for the satellite pixel [16]. The mixing of measurements obtained for different end members requires information on their respective fractions within the sensor’s field of view and on scene emissivity [5,17,18]. Moreover, the former may change with viewing geometry and observation time (e.g., shadow/sunlit fractions) [19,20]. Therefore, an accurate characterization of validation sites is critical for temperature-based validation.
In order to be able to validate satellite-derived LST products over a wide range of different climatic conditions, Karlsruhe Institute of Technology (KIT) operates four permanent LST validation stations in different climate zones. The stations, being part of LSA SAF’s validation effort and supported by EUMETSAT, were chosen and designed to validate LST derived from MSG/SEVIRI, but are equally well suited to validate other LST products [21,22]. Figure 1 shows the stations’ locations within the field of view of the Meteosat satellites: Evora (Portugal, since 2005; cork-oak trees and grass), Dahra (Senegal, since 2008; tiger bush), Gobabeb (Namibia, since 2007; gravel plain), and RMZ Farm/Farm Heimat (Namibia, since 2009; Kalahari bush). The four stations are in temperate Mediterranean climate (CSh), semi-arid climate (BSh), and warm desert climate (BWh) climate zones, respectively [23]. Currently, KIT stations are the only ones dedicated to LST validation located in large homogenous areas suitable for validating spatially coarse satellite LST. Although the four stations already cover a wide range of climatic and surface conditions, for global representativeness additional stations are needed, e.g., over snow and Tundra. The most accurate surface temperatures can be obtained over large water bodies, which are even suitable for vicarious sensor calibration [24,25].
Accurate estimations of land surface emissivity (LSE) are essential for the validation of satellite LST&E products, but also to limit the uncertainty of ground-based LST observations. Especially sites with larger fractions of bare ground are prone to be misrepresented in satellite-retrieved LSEs; in-situ measurements revealed that LSE estimations over arid regions can be wrong by more than 3% [14]. In order to minimize such errors, in-situ LSEs of the dominant surface cover types in Gobabeb and Dahra were obtained with the so-called “emissivity box method” [26]. However, given the typical high variability of LST in space and in time, the validation of LST estimated from remote sensing observations remains a challenging problem. Using one year of in-situ data [20] and [19] investigated the performance of LSA SAF LST at Evora: it was shown that the complex and structured land cover around the station (cork-oak tree forest) requires in-situ LST that account for the dependence of end-member fractions on viewing and illumination geometry. In contrast, end-member fractions at the three African validation stations can be treated as constant. Therefore, this paper focuses on in-situ measurements from stations Dahra, Gobabeb and Farm Heimat and uses them for validating spatially coarse satellite LST, namely LSA SAF’s operational LST estimates obtained from MSG/SEVIRI. In the following sections the sensors and methods used to obtain the satellite LST and in-situ LST are described, an uncertainty analysis for the in-situ LST is performed, overviews of the sites and their climatic conditions are given, and validation results for up to six years of LSA SAF LST are presented and discussed.

2. The SEVIRI Sensor

The first satellite of the MSG series, Meteosat-8, began operations in January 2004, while the last of this series, Meteosat-11, was launched in July 2015. The main sensor on-board MSG is SEVIRI, which provides observations in 12 spectral channels at 15-min temporal sampling and a pixel sampling distance of 3 km (1km for the high-resolution visible channel) at sub-satellite point [27]. MSG’s nominal position at 0° longitude and SEVIRI’s large field of view (up to 80° zenith angle; Figure 1) allow frequent observations of a wide area encompassing Africa, most of Europe and part of South America.
Radiances in SEVIRI’s split-window channels 9 and 10, which are centered at 10.8 and 12.0 μm, respectively, are the key measurements for estimating LST. The two channels contain radiometric noise of about 0.11 to 0.16 °C ([28]; www.eumetsat.int). In combination with other infra-red and visible bands, the two split-window channels have proven to be efficient in the elimination of cloudy pixels [29]; therefore, also the infra-red and visible bands have significant impact on the quality of MSG/SEVIRI LST products.

3. LSA SAF LST&E Products for MSG/SEVIRI

LSA SAF estimates LST from top-of-atmosphere (TOA) brightness temperatures T10.8 and T12.0 obtained for SEVIRI’s split-window channels 9 and 10 [1,3]. LST retrieval methods based on measurements in two pseudo-contiguous channels in the thermal infra-red, i.e., split-window algorithms, generally rely on the differential absorption of the two bands to improve the atmospheric correction [2,3].

3.1. Generalized Split Window Algorithm

Within the LSA SAF, LST is estimated through the application of a Generalized Split-Window (GSW) formulation similar to the one first proposed for AVHRR and MODIS, which was adapted to the response functions of the SEVIRI channels [2]:
L S T = ( A 1 + A 2 1 ε ε + A 3 Δ ε ε 2 ) T 10.8 + T 12.0 2 + ( B 1 + B 2 1 ε ε + B 3 Δ ε ε 2 ) T 10.8 T 12.0 2 + C + Δ L S T
where ε is the average of the two channel effective surface emissivities; Δε their difference (ε10.8–ε12.0); Aj, Bj, (j = 1,2,3) and C are the GSW parameters; and ΔLST is the uncertainty of the LST retrieval (please see [3] for further details). The GSW parameters were calibrated for different ranges of satellite zenith angle and total column water vapor. In the operational LST retrievals, the latter is obtained from three-hourly forecasts provided by the European Center for Medium-range Weather Forecasts (ECMWF). Since the GSW algorithm is applicable to clear sky conditions, cloudy pixels are removed through the use of multispectral thresholding tests performed for SEVIRI channels in the visible, near-infrared, and thermal atmospheric window [29].

3.2. Vegetation Cover Method for LSE Retrieval

Equation (1) requires the effective land surface emissivities εeff_ch for each split window channel to be known: within LSA SAF, these are estimated as the weighted average of the emissivities of vegetation εveg_ch and bareground εbg_ch, which are the dominant land cover types:
ε e f f _ c h = ε v e g _ c h  FVC  + ε b g _ c h   ( 1    FVC )
where FVC is the Fraction of Vegetation Cover within a pixel. In this methodology, also referred to as the Vegetation Cover Method [4,30], FVC is estimated on a daily basis from SEVIRI visible and near-infrared channels by the LSA SAF [1,31]. The particular values of εveg_ch and εbg_ch are available from look-up-tables for the land cover classes [6] defined by the International Geosphere-Biosphere Programme (IGBP; [32]). The operational retrieval of surface emissivity within the LSA SAF also accounts for snow on the ground: in the case snow is detected based on SEVIRI data [33], FVC is set to 0 and εbg_ch to the channel value for snow.
Despite its limitations over non-vegetated areas, the vegetation cover method allows estimating surface emissivity values that are consistent with the (seasonal) variability of vegetation as well as in the presence of snow and snow melt.

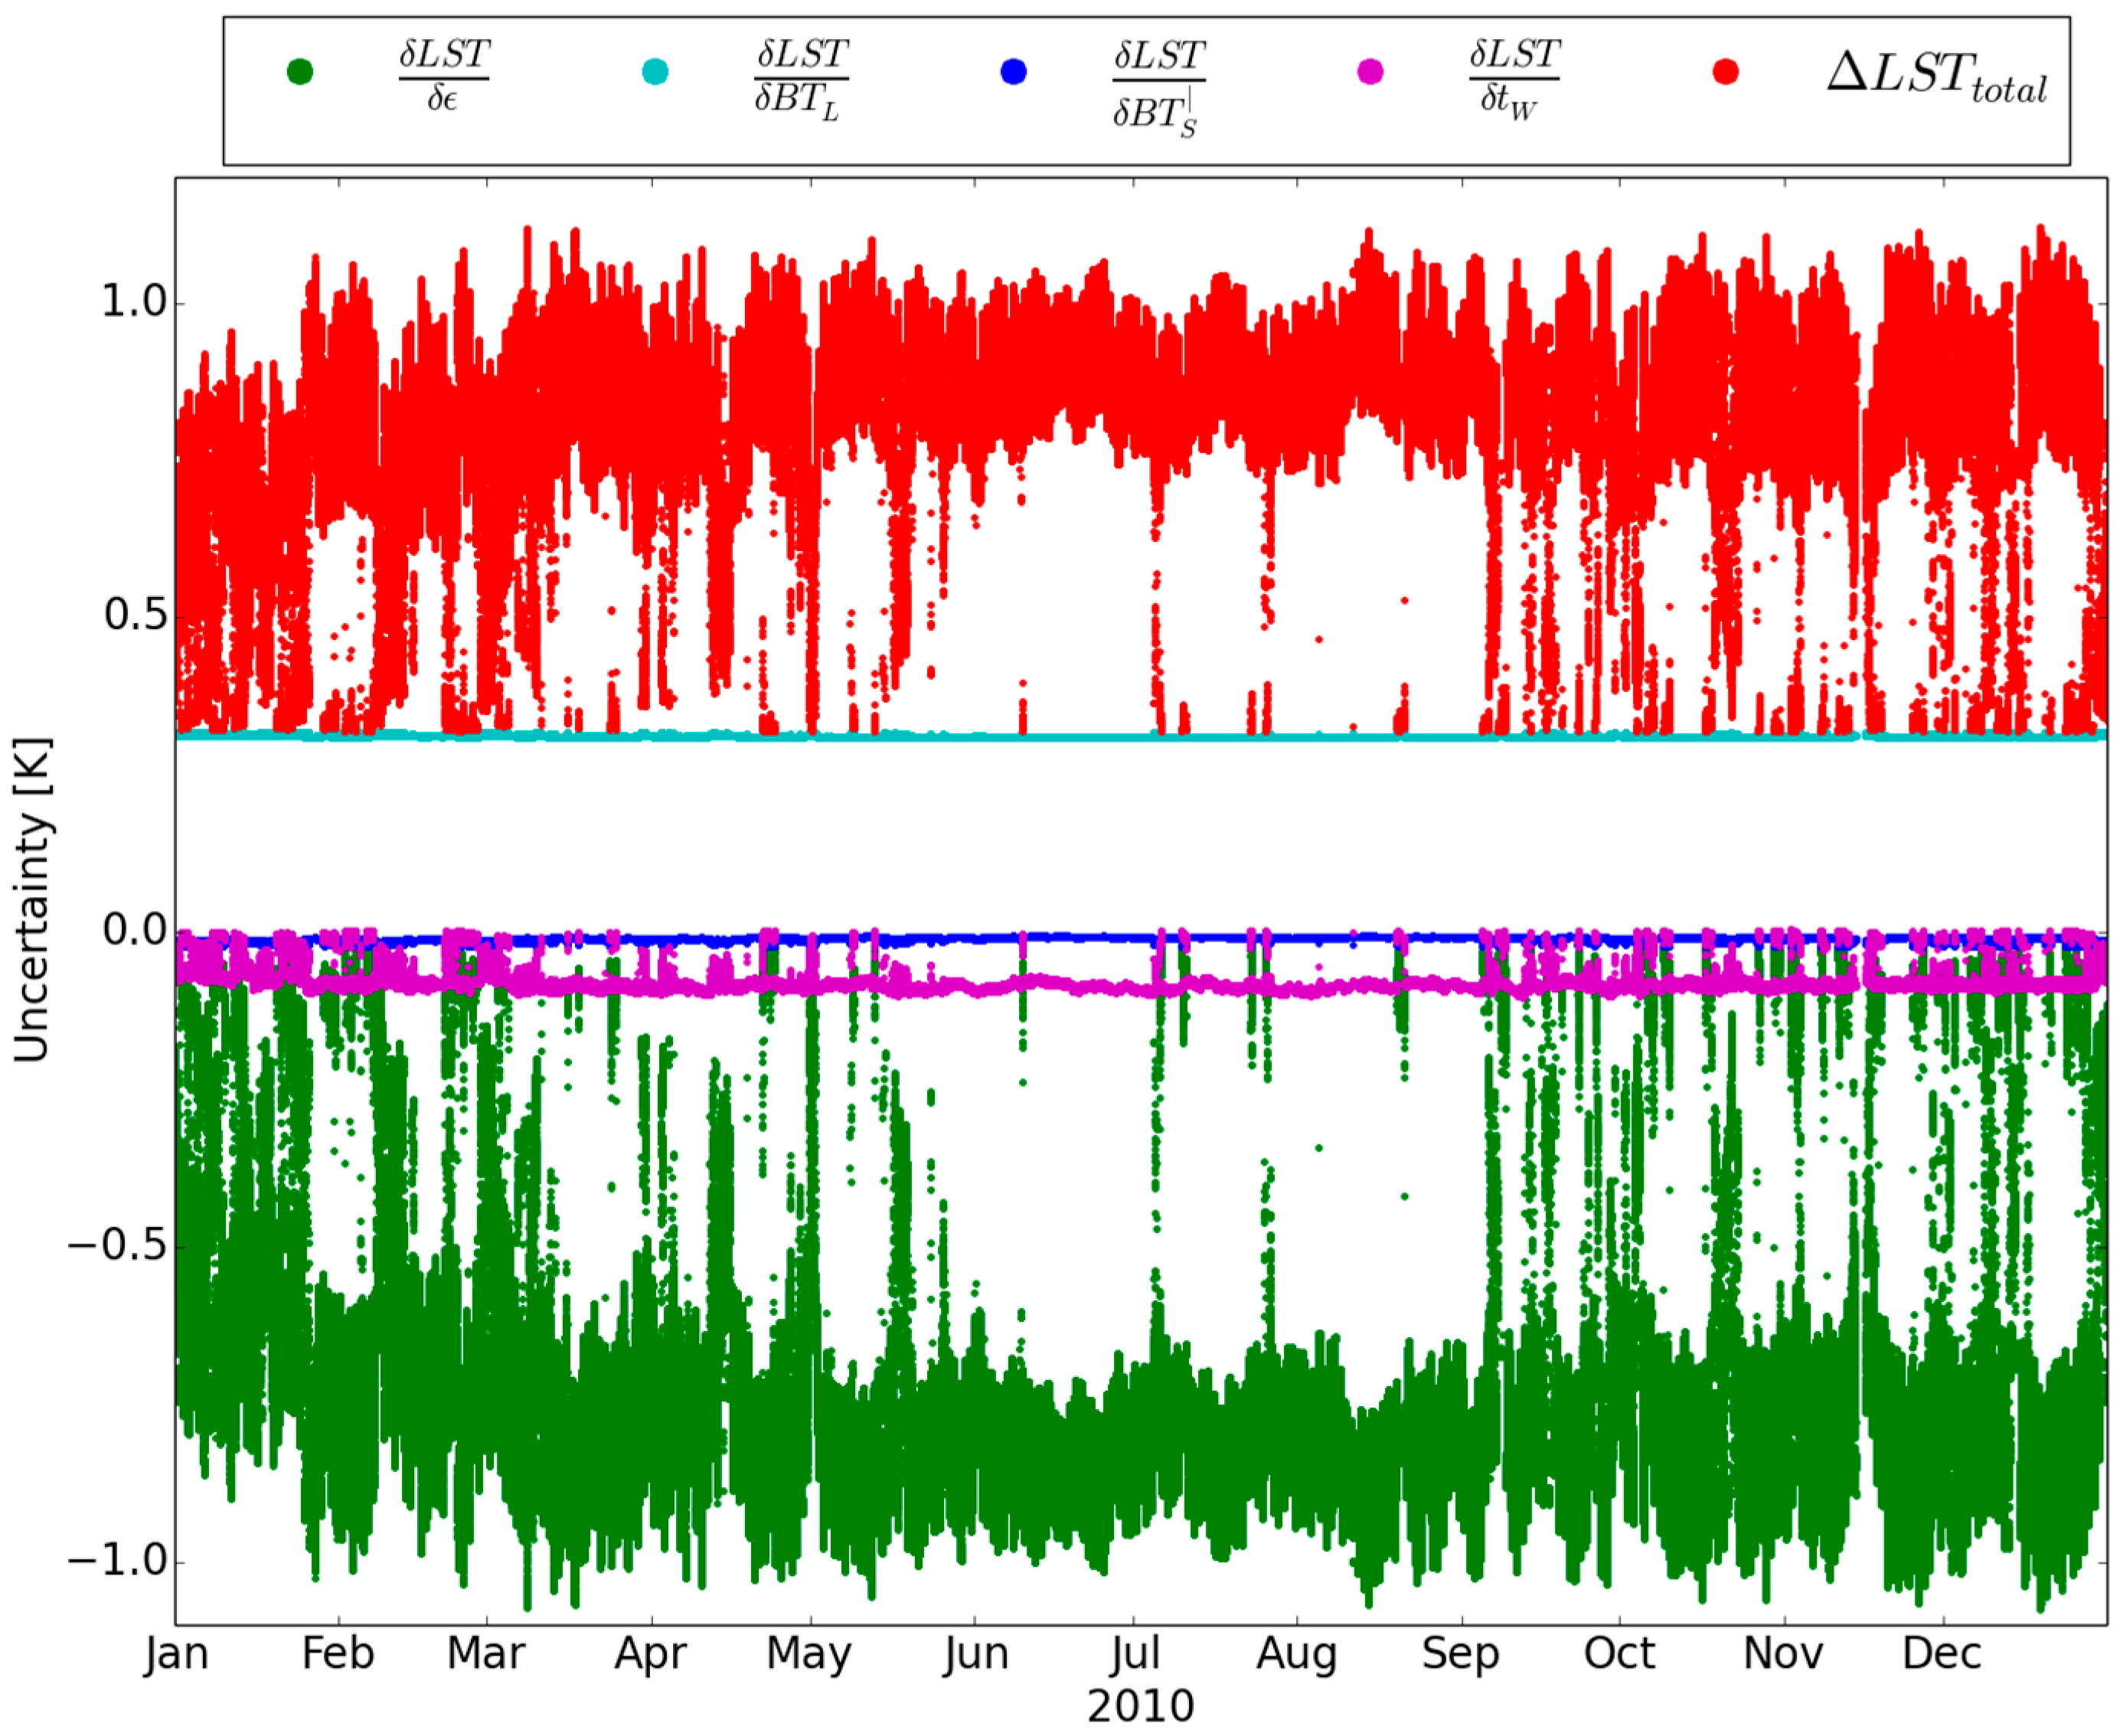
3.3. Uncertainty Associated with LST&E Estimation

Along with the retrieved LST fields LSA SAF distributes estimates of the associated errors on a pixel-by-pixel basis. The quantification of LST error is thoroughly discussed in [3] and is based on the characterization of: (i) the uncertainty of the LST algorithm, which is highly dependent on the retrieval conditions, i.e., it increases with view angle and atmospheric water vapor content; and (ii) the uncertainty of the input variables and their propagation to the LST product.
Over semi-arid regions, where bare soils dominate and the atmosphere is generally dry, LST error is controlled by the uncertainty in land surface emissivity (LSE). Over the Sahara, LST uncertainty may reach values up to 3 °C and the uncertainties in many satellite-retrieved LSE products exceed 3% [14,34]. However, algorithmic improvements allow retrieving LSE with higher accuracy, e.g., “Temperature-Emissivity Separation (TES)” developed by Gillespie et al. [35] for the ASTER sensor on-board NASA’s Terra spacecraft is able to retrieve LSE with an accuracy of 1.5%. More recently, the TES method has been adapted to MODIS [36] and SEVIRI [37] and Masiello et al. [38] developed a Kalman filter approach that exploits the high temporal resolution of the geostationary MSG satellite to achieve similar accuracy [39]. Under moist atmospheres, the uncertainty of LST retrievals increases steeply with view angle. The LST errors are also used to define the coverage of the LSA SAF LST obtained at each observation time: LST values with uncertainties higher than 4 °C are masked out. LST is usually retrieved for all clear sky land pixels within the SEVIRI disk up to a view zenith angle of 70°. However, near the edge of the disk values are frequently masked out for moderate-to-very moist atmospheric conditions [3].

4. In-Situ Measurements and LST Determination

The main instrument for the in-situ determination of land surface temperature at KIT’s validation stations is the precision radiometer “KT15.85 IIP” produced by Heitronics GmbH, Wiesbaden, Germany. The radiometers measure thermal infra-red radiance between 9.6 µm and 11.5 µm, have a temperature resolution of 0.03 °C and an accuracy of ±0.3 °C over the relevant temperature range [40]. The KT15.85 IIP has a drift of less than 0.01% per month: the high stability is achieved by linking the radiance measurements via beam-chopping (a differential method) to internal reference temperature measurements and was confirmed in a long-term parallel run with a self-calibrating radiometer, which was continuously stabilized by two blackbodies [17].
The radiometers are typically mounted at heights between 12 m and 28 m (Figure 2), which results in fields of view (FOV) ranging from 3 m2 to 14 m2. Since the KT-15.85 IIP’s spectral response function lies within the atmospheric window and the distance between the radiometers and the surface is small, the attenuation of surface-leaving TIR radiation is negligible. However, the KT-15.85 IIP measurements of the surface contain its emitted radiance (i.e., the target signal) as well as reflected downwelling IR radiance from the atmosphere, which needs to be corrected for: depending on target emissivity and downwelling longwave radiance (e.g., a cold clear sky vs. a warm humid atmosphere), the reflected component can cause differences of several degrees Celsius [34,41]. Therefore, at each station, an additional KT-15.85 IIP measures downwelling longwave IR radiance from the atmosphere at 53° zenith angle and points towards an azimuth that is never reached by the sun; measurements under that specific zenith angle are directly related to downwelling hemispherical radiance [42] so that no ancillary data for deriving ground truth LST are needed.
In order to obtain in-situ LSTs that are representative for the land surface within the satellite pixel, we use the extrapolation methodology described by [16] to scale the point-like station measurements to satellite pixel resolution. The so-called End-Member-Cover method is based on a linear spectral mixing approach and assumes that the total IR radiance emitted by the land surface within a satellite pixel can be reasonably well approximated by a linear mixture of the IR radiance emitted by the relevant surface cover types within that area. The relevant surface cover types, also called spectral end-members, can be trees, grassland or different kinds of rock or soil and are determined from an independent component analysis of high-resolution satellite data in the visible and near infrared. The cover fractions of the relevant end-members (Table 1) are determined by land cover classification and are then used as weights for mixing the measured radiances.

4.1. LST Derivation from in-Situ Measurements

Planck’s law relates the radiance emitted by a black body (emissivity ε = 1) to its temperature [43]. However, most objects relevant to remote sensing applications are non-black bodies with 0 < ε(λ) < 1. Spectral emissivity ε(λ) is defined as the ratio between the spectral radiance Rk emitted by surface component k at wavelength λ, and the spectral radiance emitted by a black body at the same wavelength and temperature. Spectral radiance emitted by a non-black body can be obtained by multiplying Planck’s function B(Tk, λ) with ε(λ):
R k ( T k , λ ) = ε ( λ ) · B ( T k , λ )
where Rk is in W·m−3·sr−1, Tk is the measured component temperature in Kelvin, and λ is the wavelength in meters. For a sensor located near the surface and measuring within an atmospheric TIR window, the influence of the atmosphere can be neglected. With known emissivity, the simplified radiative transfer equation [43,44] can be used to account for reflected downwelling TIR radiance from the atmosphere and for the non-black body behavior of the surface. Switching for simplicity to channel-effective values, a single surface component and dropping the variable dependencies, emitted blackbody-equivalent radiance B can be expressed as
B   =   R L ( 1 ε ) · R S ε
where R L is the upwelling land surface radiance and R S the downwelling sky radiance; in practice, the latter is measured by a dedicated KT15.85 IIP radiometer aligned at the zenith angle of 53°. Once B is known, inverting Planck’s law gives the surface temperature. The spectral response functions of the KT15.85 IIP radiometers are approximately symmetric and the Planck function as well as the spectral emissivity of natural surfaces varies slowly over the radiometers spectral range, as shown in [14]. Therefore, LST is retrieved by evaluating Planck’s function at the radiometer’s center wavelength of 10.55 µm [15].

4.2. Land Surface Emissivity Determination

When remotely sensed, a reasonable approximation for the LSE of complete covers of green and desiccated vegetation in the spectral range of the KT15.85 IIP is 0.965 [11,45]. However, arid and semi-arid regions usually have a considerable bare surface fraction for which LSE is generally significantly smaller (e.g., 0.93 for sand) and also low-lying, desiccated grass can have considerably reduced emissivities around 10.55 µm [46]: therefore, in-situ determination of LSE is critical for such sites. An advantage of arid regions is the usually high frequency of clear sky conditions and—at least for the chosen, level sites—the lack of obstructions: these are favorable conditions to apply the “one-lid emissivity box method” for LSE determination described by [47]. The authors of [26] studied the one-lid and the two-lid method in detail and derived correction terms for the two methods. KIT’s emissivity box has inner walls of highly polished aluminum and the same dimensions as in [26]. Using the same nomenclature as [48], uncorrected LSE ε 0 is obtained from a sequence of three radiance measurements [14]:
ε 0 = L BB L a L 2 L a
where L BB is the sample radiance measured under clear sky conditions (i.e., without the box), L a is the downwelling sky radiance, and L 2 is the radiance measured through the bottomless box when it is placed on the sample. Corrected LSE is then given by ε = ε 0 + δ ε with correction
δ ε = ( 1 ε 0 ) { 1 L 2 L a L 2 L a R ( L 2 B c ) }
where R is a box-specific factor, which depends on box geometry and the spectral response of the inner walls. For box dimensions of 30 cm × 30 cm × 80 cm and an emissivity of ε c = 0.03 for highly polished aluminum [26] obtained R = 0.265 . The term B c is the radiance measured through the box when its bottom is closed with a sheet of aluminum, i.e., it corresponds to the radiance emitted by the “cold” aluminum. In order to avoid the “Narcissus” effect, i.e., the radiometer observing its own reflection, the opening in the top of KIT’s emissivity box is slightly off-center and inclines the inserted Heitronics KT-15.85 IIP radiometer by five degrees with respect to (w.r.t.) nadir [14].
In practical field measurements the down-welling hemispherical sky radiance is approximated as L a = 1.3 × B [ T ( 0 ° ) ] , where B is the Planck function evaluated at the radiometer’s center wavelength of 10.55 µm and T ( 0 ° ) is brightness temperature measured at zenith [26]. Over flat, homogenous surfaces the accuracy of emissivities determined with the box method is about 0.5% [14,26,48].

4.3. Uncertainty of in-Situ LST

This section presents an analysis of the uncertainty associated with in-situ LST estimates. In order to obtain realistic assumptions about the dispersion of the input data, a full year (2010) of Gobabeb in-situ data are investigated. Erroneous measurements due to short term disturbances (shadow from small clouds and birds, etc.) are excluded by removing data for which land surface brightness temperature BT L or sky brightness temperature BT S deviate by more than 3σ (standard deviations) from their respective 1 min averages. This leaves about 430,000 data points for the analysis, which corresponds to 85% of the available data points.
The uncertainty of in-situ LST is calculated via error propagation using the relation between LST and surface emitted radiance B given by Planck’s law [49]:
L S T =   c 2 λ · log ( c 1 · λ 5 B + 1 )
where c 1 , c 2 and λ are constants, c 1 =   1.191044   ×   10 8 W m 2  ster cm 4 , c 2 =   1.438769  K cm  [49], and λ  =   10.55  µ m is the center wavelength of the KT-15.85 IIP radiometer. Blackbody-equivalent radiances B are obtained from measured upwelling land surface radiance R L and measured downwelling sky radiance R S via Equation (4); a representative emissivity value for the gravel plains near Gobabeb is ε =   0.94 [14]. Brightness temperatures BT L and BT S are connected to R L and R S , respectively, via Planck’s law (writing the equation only once with a joint index L/S):
R L / S   = d 1 exp ( d 2 B T L / S ) 1
where, for simplicity, the constants d 1 =  c 1 · λ 5 and d 2 =   c 2 λ have been introduced.
The KT-15.85 IIP radiometer measuring the sky brightness temperature has a protective window to shield its lens from rain and dirt. The nominal transmissivity t W   of the protective window over the relevant wavelength range is 0.895. When assuming that the temperature of the window and the surrounding air temperature T a are the same, BT S can be obtained as:
B T S = B T S ' ( 1 t W ) · T a t W
where BT S ' is the sky brightness temperature measured through the protective window. A detailed description of error propagation is presented in Appendix A. The relevant sources of error in estimating in-situ LST (surface emissivity, brightness temperatures BT L and BT S ' , and transmissivity of the protective window) and their respective magnitudes are summarized in Table 2.
Δ LST random is calculated as the squared sum of the individual random uncertainties:
Δ L S T r a n d o m = ( δ L S T δ ε ) 2 · Δ ε 2 +   ( δ L S T δ B T L ) 2 · Δ B T L 2 + ( δ L S T δ B T ' S ) 2 · Δ B T ' S 2
where the individual random uncertainties are estimated via the partial derivatives of in situ LST w.r.t. ε , B T L , and B T ' S . Inserting these derivatives into Equation (10) and using the uncertainties in Table 2, a median random LST uncertainty Δ LST random of 0.80 ± 0.12  K was found for the Gobabeb in-situ measurements of 2010. Readers can find the worked out derivatives in Appendix A.
Since there is only one known systematic uncertainty, i.e., the degradation of the protective window, total systematic uncertainty Δ LST sys is the same as δ LST δ t W . For the Gobabeb data of 2010, the median systematic LST uncertainty Δ LST sys is 0.08 ± 0.01  K , i.e., about 10% of random uncertainty.
Systematic and random uncertainties combined yield total uncertainty Δ LST total :
Δ L S T t o t a l =   Δ L S T r a n d o m 2   + Δ L S T s y s 2
Δ L S T t o t a l and the individual uncertainties obtained for the Gobabeb 2010 data are shown in Figure 3. It can be seen that the main contribution to total uncertainty stems from the uncertainty in emissivity, followed by the uncertainty in BT L . In comparison, BT S ' and t W have small impact, since for typical land surface emissivities reflected sky radiance is a minor contribution to surface-leaving radiance. Median Δ L S T t o t a l for 2010 is estimated as 0.80 ± 0.12 °C, which is the same as random uncertainty (i.e., systematic uncertainty is negligible). In comparison, uncertainty associated with satellite LST retrievals is typically about 1 °C to 4 °C. Furthermore, in-situ LST uncertainty is dominated by uncertainty in land surface emissivity, which for Gobabeb is estimated as ±0.015. However, Farm Heimat has a larger fraction of permanent vegetation and the Dahra site is covered for most of the year (the dry season) by a relatively steady mixture of low-lying desiccated grass and soil: therefore, the corresponding uncertainties in in-situ emissivity and LST are expected to be slightly smaller than at Gobabeb.

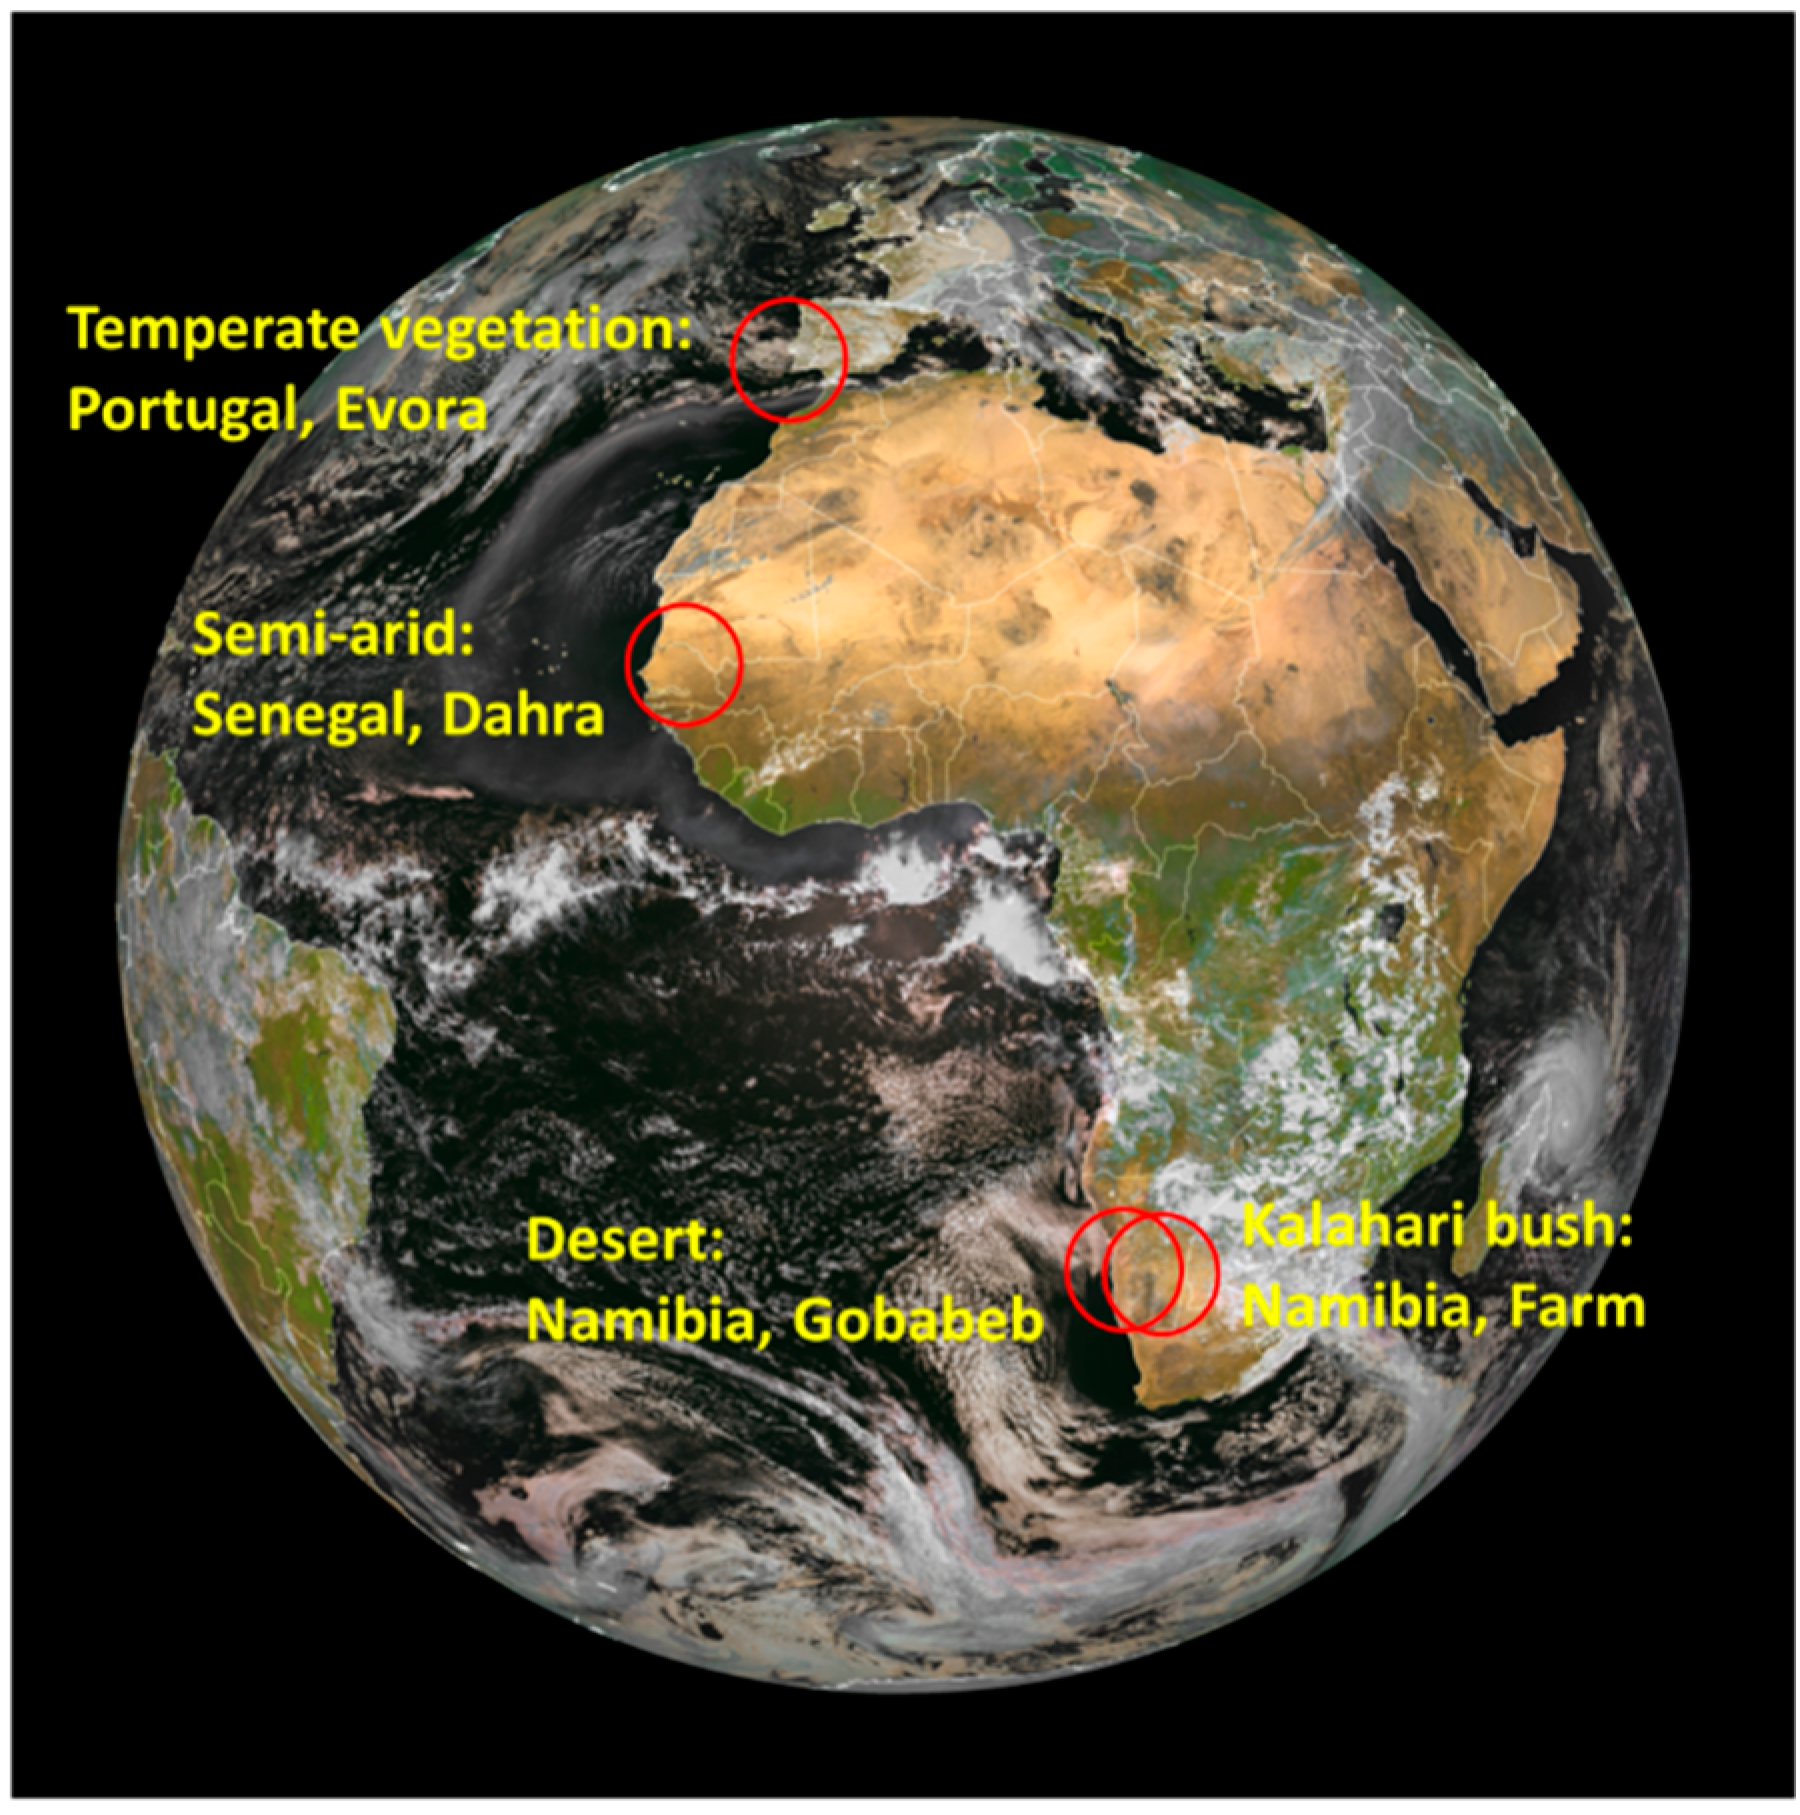
5. LST Validation Stations
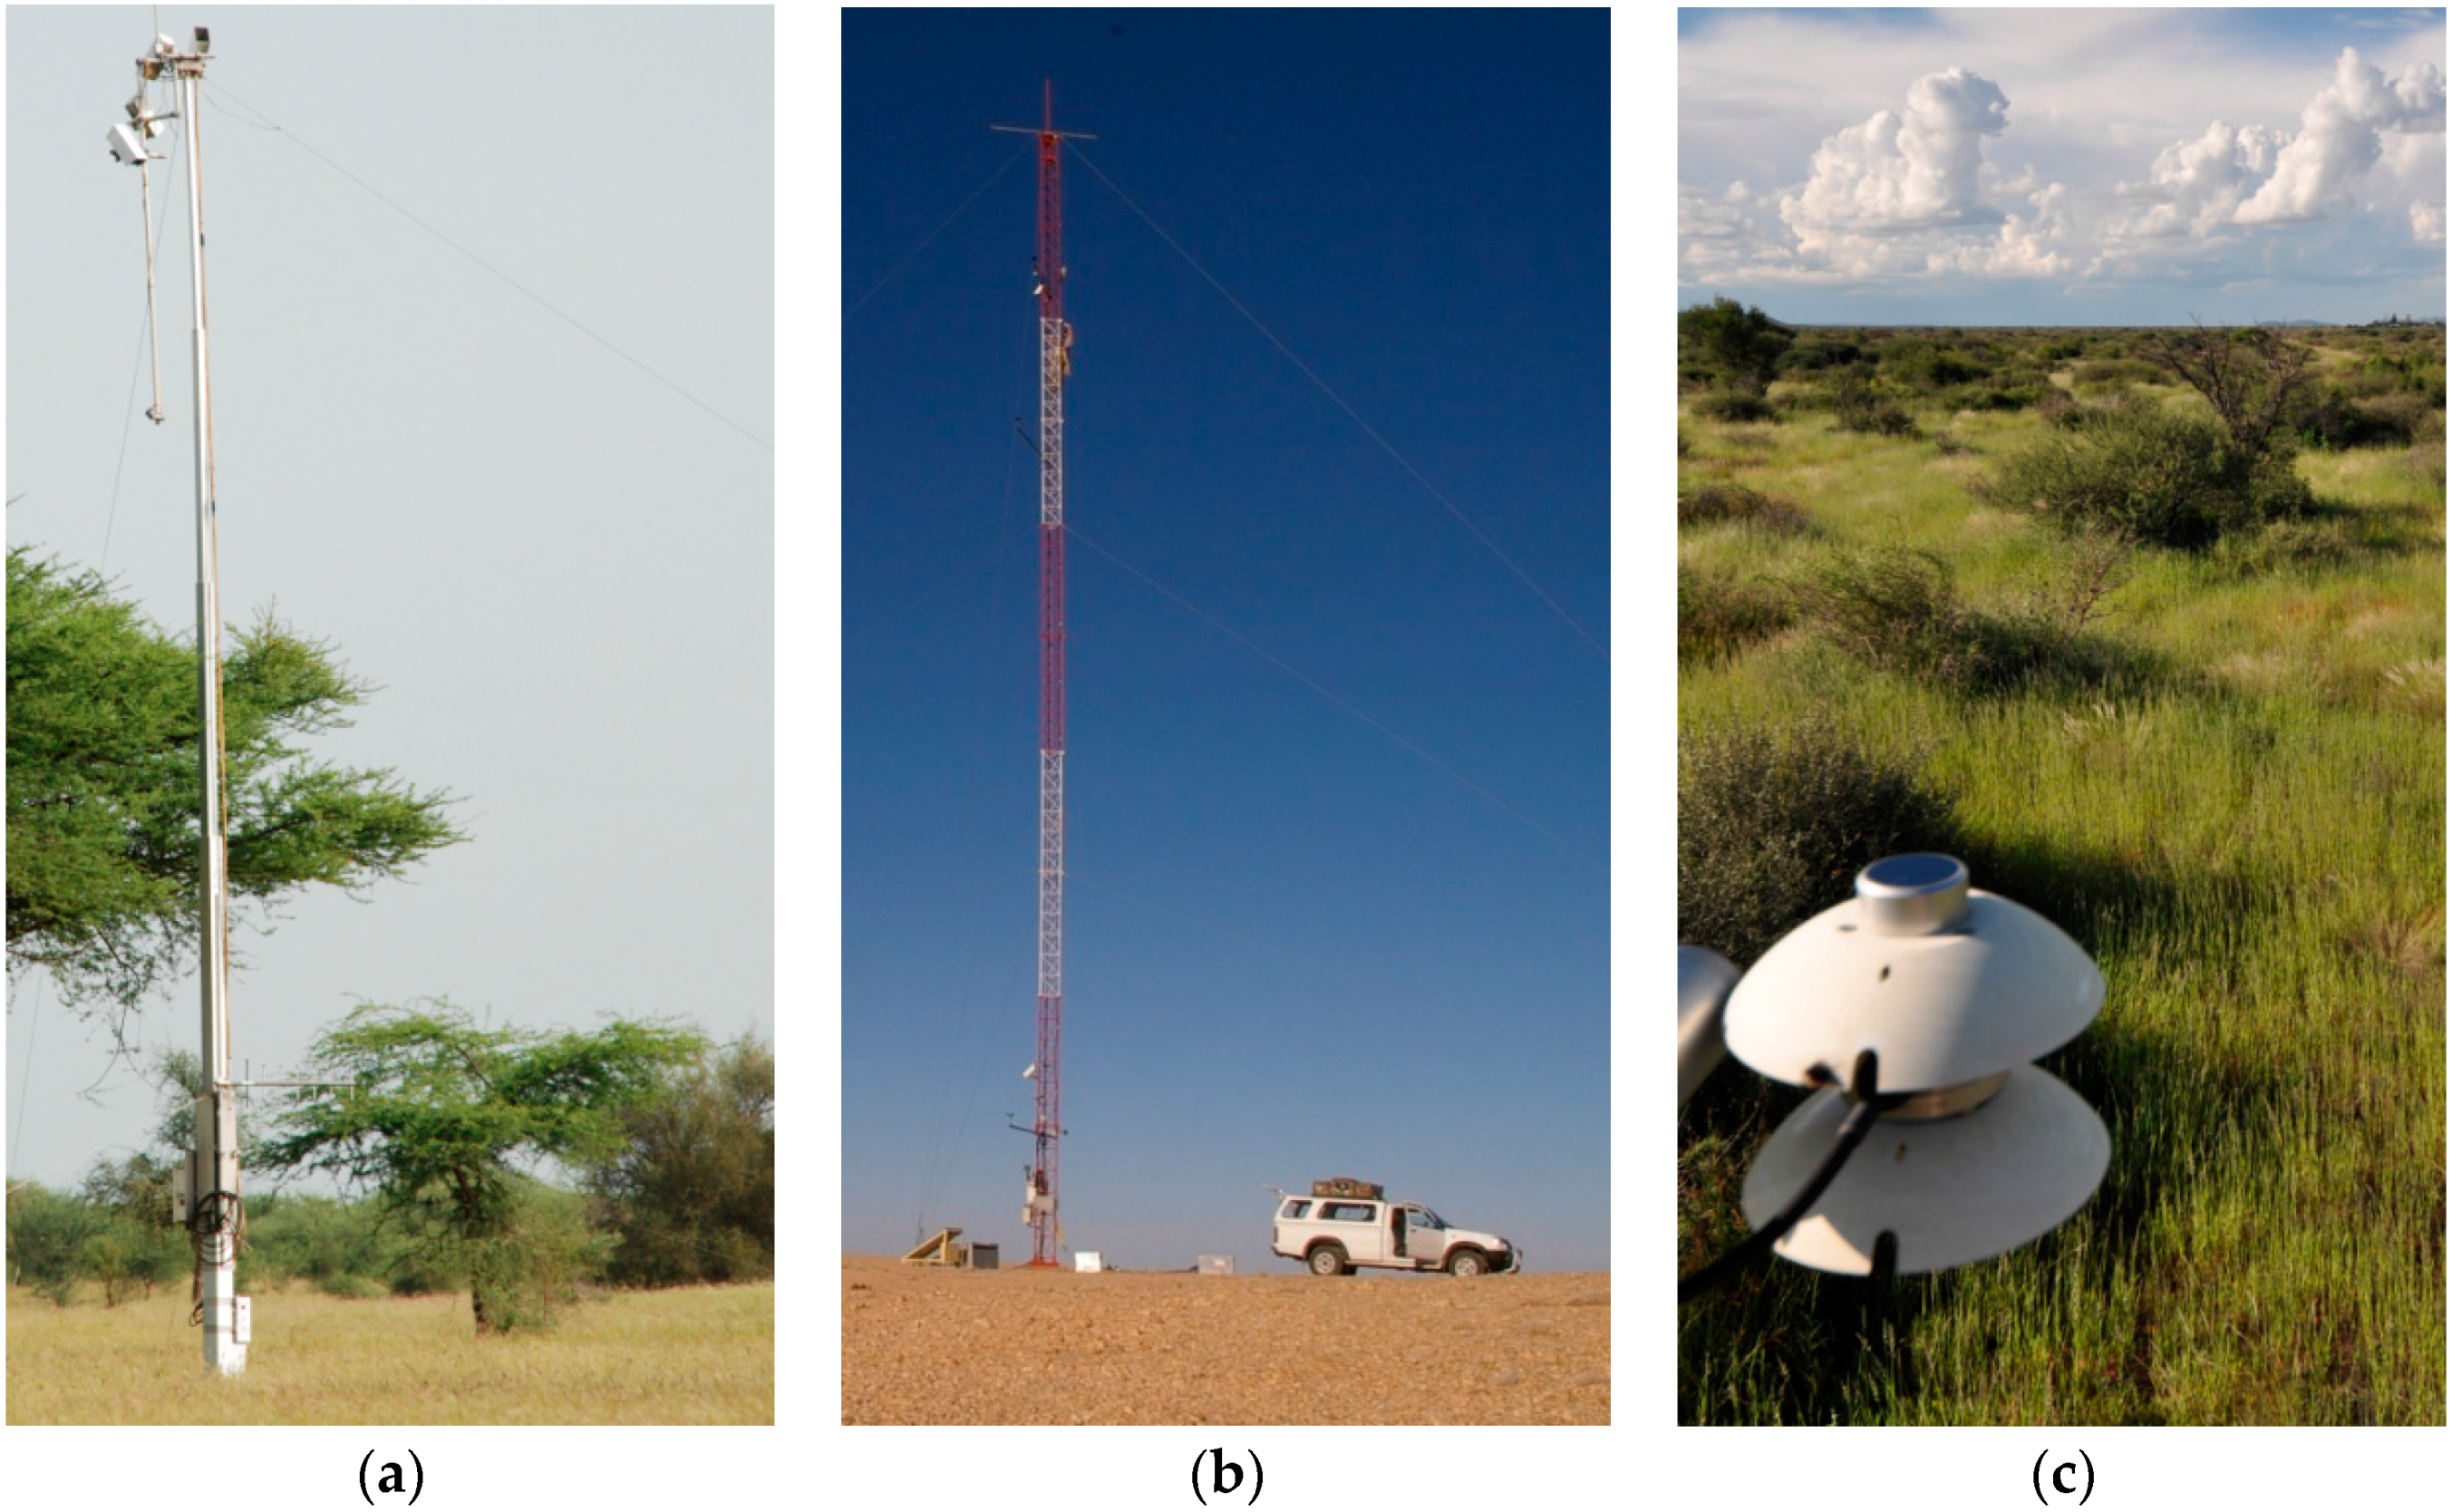
The core instruments of KIT’s LST validation stations (Figure 1) are self-calibrating, chopped radiometers Heitronics KT15.85 IIP (9.6–11.5 µm; SD ± 0.3 °C) that measure the radiation from the relevant components, e.g., grass, soil, tree, shadow, and sky. The stations record air temperature and humidity and stations Gobabeb and Farm Heimat are additionally equipped with shortwave and longwave radiation budget sensors (Figure 2). Since all stations are located in isolated and remote areas, they are solar powered and automatically record all measurements once per minute (Campbell Scientific CR1000 data logger). The data are stored locally and are also transmitted via radio and the Internet for monitoring and data safety.

5.1. Dahra, Senegal

Dahra LST validation station (15.402°N, 15.443°W, 45 m a.s.l.) is located about 7 km northeast of the town of Dahra, Senegal. The field site is hosted by the Centre de Recherches Zootechniques de Dahra, Institut Senegalais de Recherches Agricoles (ISRA), and also includes two towers operated by the University of Copenhagen for validating satellite products [50,51,52]. The towers are equipped with instruments for validating satellite products in the visible, near-infrared, and the thermal domain.
The area around the station (Figure 2a) is practically unpopulated and the dominant surface cover types are seasonal grass and sparse trees, which are mostly “Acacia raddiana”, “Acacia Senegal”, and “Balanites aegyptiaca” [18]. The soil is sandy and reddish in color and was classified as an Arenosol [53]. The entire site is grazed by cattle and sheep, while migrating camels from the northern Sahel feed on the leaves of the trees. The trees are scattered in the landscape, either as isolated trees or as small clumps. In some cases the distribution of the bushes and trees follows ancient dunes, which causes stripes of high vegetation—hence the name “tiger bush”. According to the classification by Köppen and Geiger [23,54], Dahra is characterized by the hot-arid, steppe-prairie climate typical of the Sahel region. During the dry season from October to March, the climate is especially hot and the grass desiccates rapidly, whereas the trees stay usually green throughout the year.
In contrast, the rainy season (July to October) is strongly influenced by the monsoon, which is characterized by very humid atmospheres and strong and persistent cloud-cover, and the grass grows about 1 m high [18]. The long-term average annual precipitation is about 370 mm and has a high inter-annual variability. Due to the distinct dry and rainy seasons, the validation site exhibits a strong annual vegetation cycle. Usually only the trees stay green all year while in the rainy season the grass grows dense and the entire site is covered by vegetation.
The current set-up of instruments at Dahra is in operation since July 2009, but due to technical problems and theft there are considerable data gaps. The sensor configuration for validating LST consists of KT-15.85 IIP radiometers observing grass/soil (direction south and direction west) and the canopy of an Acacia raddiana tree from southwest. A separate radiometer measures downwelling longwave radiance from the sky at 53° zenith angle. Dahra’s low elevation of about 45 m a.s.l. results in long atmospheric paths and the atmospheric water vapor load varies strongly between the rainy season and the dry season: especially during the warm (about 40 °C) and humid rainy season (up to 90% relative humidity), the atmospheric correction of satellite TIR data is extremely challenging. Occasional outbreaks of Sahara dust complicate the situation further.

5.1.1. Estimation of Land Surface Cover and Representative in-Situ LSTs

Based on Independent Component Analysis of high-resolution multispectral Quickbird data [16] showed that relevant endmembers within the MSG/SEVIRI pixel (15.43°N, 15.42°W) over Dahra station, for which LSA SAF LST are validated, are grassland and trees with fractional coverages of 97% and 3%, respectively. The results were verified in a quality assessment and agree well with the Tree Crown Cover (TCC) fraction determined in a previous survey in the validation area [55], where a TCC between 3% and 4.5% was found by manually classifying five sample regions. Due to the small TCC value, the effect of varying TCC between 3% and 6% on retrieved LST is negligible [18].

5.1.2. Land Surface Emissivity at Dahra

While the emissivity of the tree crowns can be set to a literature value of 0.98, the emissivity of the grass and soil background varies significantly over the year [21]. This is mainly due to seasonal changes in soil moisture and the strongly varying grass cover, which both greatly affects land surface emissivity. The operational LSA SAF emissivity product for MSG/SEVIRI uses the vegetation cover fraction method to capture this variation. For an estimated tree crown cover (TCC) at Dahra of 4%, an emissivity of 0.98 for the tree crown and an assumed emissivity of 0.95 for the soil/grass background the error associated with integrating over entire pixel is about 0.001 [18], which is negligible. LSA SAF emissivities for MSG/SEVIRI channel 9 (centered at 10.8 μm) vary annually from 0.969 (July; end of dry season) to 0.984 (September; end of rainy season), which is largely related to seasonal changes of the grass: SEVIRI channel 9 emissivities are around 0.980 for the rainy season, which is in good agreement with literature values for green grass [56]. In contrast, in-situ emissivities determined by KIT in January 2013 indicate that LSA SAF emissivities for the dry season at Dahra are too high [21]: for unaltered, dominantly low lying, dry grass and sand mixtures an emissivity of 0.941 ± 0.005 was determined for a KT15.85II P radiometer [37], which has a similar, but slightly broader response function as SEVIRI channel 9 [14].

5.2. Gobabeb, Namibia

Gobabeb LST validation station (23.551°S, 15.051°E, 450 m a.s.l.) lies about 2 km northeast of Gobabeb Training and Research Center (http://www.gobabebtrc.org/) in the Namib Desert, Namibia. The validation station is located on large gravel plains (several thousand km2), which are covered by a highly homogeneous mixture of gravel, sand and sparse desiccated grass (Figure 2b). The pointing of the radiometers to the assumed surface end-members has not been changed since the setup of the station in December 2007. A view direction of the ground measurements close to North was chosen to observe an undisturbed surface: this implies that the radiometers are not aligned with MSG’s line of sight to the validation site.
There is a sharp transition between the vast Namib sand sea with its up to 300 m high dunes and the gravel plains: this natural boundary is maintained by irregular flows of the ephemeral Kuiseb River (a few days every other year), which wash the advancing sand into the South Atlantic Ocean. In order to avoid MSG/SEVIRI pixel containing a mix of gravel plains and sand dunes, LST validation at Gobabeb is performed for pixel (23.55°S, 15.18°E) on the highly homogenous gravel plains about 13 km East of the station. Due to the hyper-arid desert climate [23,54], the site is spatially and temporally highly stable and, therefore, ideal for long-term validation studies of satellite products [13,57]. The long-term average annual temperature at Gobabeb is 21.1 °C [58], whereas the average annual precipitation is less than 100 mm [59] and highly variable [60,61]. Consequently, the relatively frequent fog events are of special importance for the water balance of the Namib [59].
Continuous in-situ measurements from Gobabeb are available since the beginning of 2008 and the gravel plains are highly homogeneous in space and time, which makes them ideal for validating a broad range of satellite-derived products [14]. Nevertheless, for reliable product validation the effect of the small scale variation of surface materials (e.g., dry grass, rock outcrops) and topography needs to be fully characterized. Using a mobile radiometer system, three field experiments were performed during which the radiometer was driven along tracks of up to 40 km length. The results show a high level of homogeneity and a stable relationship between station LST and LST obtained along the tracks with biases between −0.1 °C and 0.8 °C [14].

Land Surface Emissivity at Gobabeb

During November 2011, in-situ measurements with the “one-lid emissivity box” method were performed to determine the emissivities of relevant surface types at Gobabeb. Assuming a dry grass fraction of 25% [16], the LSE over the gravel plains is estimated as 0.944 ± 0.015 for SEVIRI channel 9 [14]. This value was also shown to be in good agreement with LSE derived with the temperature emissivity separation (TES) algorithm [35] from ASTER and MODIS data [36]. Combining in-situ measurements performed in 2011 and 2012 at Gobabeb and assuming a dry grass fraction of 25%, the emissivity for the KT15.85IIP is estimated as 0.940 ± 0.015, which is the value used to derive in-situ LST in Section 6.3.

5.3. Farm Heimat, Namibia

Farm Heimat (22.933°S, 17.992°E, 1380 m a.s.l.) lies about 100 km southeast from Windhuk on a plateau in the Kalahari semi-desert. The Kalahari is characterized by hot and arid climate, which exhibits a natural seasonality: there is a small rainy season with very little rain (September to November) and a big rainy season (January and March) with possible flooding. Outside the big rainy season the Kalahari bush is dry and the grass desiccates quickly. Farm Heimat produces livestock (cattle and sheep) and is also used for hunting game (mainly springbok and Oryx). The farm itself has a size of about 50 km2, but the land cover (“Kalahari bush”) and land use in a wide area (thousands of km2) around Farm Heimat are identical. Cattle are carefully managed and moved systematically between fenced off “camps” to avoid overgrazing. In-situ measurements at Farm Heimat started in February 2011. The station is located in a typical Kalahari land scape and a wide area around the mast is mainly covered by patchy, desiccated grass dotted with bushes and isolated camel thorn trees. Due to the station’s high elevation winter temperatures (June–August) frequently drop well below freezing point. Furthermore, the remaining water vapor column between the surface and a satellite is relatively small, since about half of the atmosphere’s water vapor is contained in the lowest 2 km.
Figure 2c shows a view over the Kalahari bush from the mast at Farm Heimat during a rainy season. The station is equipped with radiometers measuring the brightness temperatures of a crown of small tree, grass (2 spots), and the sky. Standard meteorology, a rain gauge (tipping bucket), and a radiation balance (“Hukseflux NR01”) are also available.

5.3.1. Estimation of Land Surface Cover and Representative in-Situ LSTs

For the area of the MSG/SEVIRI pixel (22.93°S, 18.01°E) located over Farm Heimat and for which LSA SAF LST are validated, the relevant surface cover types and their fractional coverage were determined from publicly available Google Earth (http://www.google.com/earth/) imagery. Using object based image analysis [16], it was found that the validation area is covered by 15% trees, 22% bush and 63% grass and sand; the latter form a joint class in which the cover fraction of grass depends on season and annual rainfall. Therefore, the brightness temperature of a representative grass and sand area is measured with a single in-situ radiometer. Trees at Farm Heimat are generally small, dry and thermodynamically similar to bushes, i.e. both are usually close to air temperature. Therefore, the tree and bush cover fractions are treated as a single cover fraction of 37%.

5.3.2. Land Surface Emissivity at Farm Heimat

End-members observed by the Heitronics KT15.85 IIP radiometers are grass/bare ground and bush/tree crown. More bare ground may be observed during the dry season, whereas during the rainy season the surface can be completely covered by up to 1 m high grass, which increases effective emissivity via the volume effect. Currently, the KT15.85 IIP’s emissivities of the two observed end-members are set to the value retrieved operationally by LSA SAF for MSG/SEVIRI channel 9: over the course of the year this value varies little between about 0.973–0.984, which is in good agreement with literature values for vegetation.

6. Results and Discussion

Having described the LST validation stations and their specific characteristics in terms of site and instrumentation, the in-situ LST obtained with the methods described in Section 4 are now used to validate LSA SAF’s operational LST product for MSG/SEVIRI. In-situ LST at Dahra and Farm Heimat are derived using LSA SAF’s dynamic emissivity product for SEVIRI channel 9, which has a spectral response function similar to the Heitronics KT15.85 IIP radiometer. At the desert site Gobabeb, which has a hyper-arid climate and a quasi-static land cover, in-situ LST are retrieved using a constant emissivity of 0.940 [14]. MSG/SEVIRI’s high temporal sampling rate of 15 min results in 96 potential LST values per pixel per day, i.e., up to 2976 LST per pixel per month. After cloud-masking, there typically remain at least several hundred match-ups between MSG/SEVIRI LST and in-situ LST per month. In contrast, for polar orbiters one usually obtains about valid 100 match-ups per year. The delay between actual satellite acquisition time at each site and nominal product time has been accounted for and in-situ LST and LSA SAF LST were matched to better than 1 minute. In order to limit the number of outliers (mainly undetected clouds), all matched-up LSTs were additionally filtered with a “Hampel filter” (three-sigma filter using robust statistics [15,62]; which typically reduced the number of match-ups by less than 10%.

6.1. Results for Dahra

Figure 4 demonstrates data availability and diurnal temperature ranges for Dahra: shown are LSA SAF LST, in-situ LST and their difference (LSA SAF LST—in-situ LST) for May 2011. There are several gaps (detected clouds, missing data) and some remaining outliers (undetected clouds) in the data. Furthermore, it can be seen that until the 5th of May 2011 LSA SAF LST agree well with the in-situ LST: the differences show near zero bias and negligible diurnal variability. From the 6th of May onwards the match deteriorates: in-situ LST are generally higher than LSA SAF LST and their difference shows diurnal cycles with amplitude of about 3 °C. This change in LSA SAF LST performance could be related to the African monsoon reaching Senegal from the South, but a similar effect was not observed in 2013 or 2014. Generally, there are considerably more clear sky situations during the dry season then during the rainy season.
Figure 5 shows plots of LSA SAF LST derived from MSG/SEVIRI against Dahra station LST for November 2010 (begin of dry season; top), March 2011 (near middle of dry season; center), and May 2011 (near end of dry season; bottom), respectively. In-situ LST were derived using LSA SAF’s emissivity product, which at Dahra varies from about 0.984 at the end of the rainy season to 0.969 near the end of the dry season (Figure 5c).
For November 2010 (Figure 5a) there are 1591 match-ups between satellite and in-situ LST and bias (mean “satellite minus in situ” difference) and RMSE are determined as −0.11 °C and 1.37 °C, respectively. This suggests that in November—just after the rainy season—the LSA SAF LSE of 0.975 approximates the actual emissivities for SEVIRI channel 9 and the KT15.85 IIP well, which is plausible since in November the site usually still has a cover of desiccated grass, for which [14] determined a KT15.85 IIP emissivity of 0.962 ± 0.013. Some outliers are still observed, indicating small, undetected clouds (shadow) over the station (satellite LST higher) or sub-pixel clouds (in-situ LST higher). For March 2011 (Figure 5b) there are 458 match-ups and bias and RMSE are 0.05 °C and 1.00 °C, respectively. However, LSA SAF emissivity for March is 0.970, which is considered too high for the dry season. In May 2011 (Figure 5c), emissivity has nearly the same value (0.969); there are 1876 match-ups and bias and RMSE are −1.24 °C and 2.12 °C, respectively.
Figure 6 displays monthly biases and RMSE for Dahra between July 2009 and July 2014: each data point in the plots represents the results for an entire month (e.g., a plot as in Figure 5) and the number of valid match-ups between LSA SAF LST and in-situ LST is shown as a grey bar; the dotted black line marks a reference target accuracy of 2 °C for LST satellite products. The large data gaps are due to stolen solar panels and technical problems with the station. In January 2014, the mast was damaged by cattle, which changed viewing geometry and observed areas; however, this appears to have had no obvious effect on the measurements from February 2014 onwards. Figure 6a shows the results for all data (nighttime and daytime): monthly bias and RMSE clearly vary seasonally, with strong negative biases during the rainy seasons, e.g., −6 °C in August 2009, and RMSE reaching up to 7 °C; mean bias and RMSE are −2.0 °C and 3.2 °C, respectively. However, limiting the data to the dry season, which is defined here as November to April, yields considerably smaller mean bias and RMSE of −0.04 °C and 1.43 °C, respectively. Analyzing only the nighttime data (Figure 6b), we obtain a mean bias and RMSE of −1.5 °C (dry season: 0.4 °C) and 2.5 °C (dry season: 1.2 °C), respectively. For the daytime data (Figure 6c), we obtain a mean bias and RMSE of −2.6 °C (dry season: −0.6 °C) and 4.1 °C (dry season: 1.7 °C), respectively. The largest daytime bias (−9.7 °C) and RMSE (10.7 °C) are reached in August 2009 (rainy season).

6.2. Discussion for Dahra

The negative bias observed in May 2011 (Figure 5c) means that LSA SAF LST are systematically too low, which may be caused by warm and moist air already approaching with the monsoon from the South. This is supported by observed sky brightness temperature, which changed from an average of −12.8 °C (1–5 May) to an average of −2.0 °C (6–31 May). Furthermore, the limited emissivity range of the LSA SAF product over Dahra (see Figure 5) does not sufficiently reflect the strong seasonal vegetation cycle (i.e., from near full vegetation cover to near bare soil). In-situ measurements of emissivity during the dry season [37] and comparisons with other emissivity products [21] have shown that a realistic annual LSE range for SEVIRI channel 9 is from about 0.95 (end of dry season) to 0.985 (middle/end of rainy season). The observed deviations in emissivity annual ranges between LSA SAF and in situ estimates are likely a result of the simplistic representation of satellite pixels in the Vegetation Cover Method (VCM; Section 3.2), which assumes that the emissivity of vegetated and non-vegetated pixel endmembers may be determined from a land-cover based look-up-table [3,30]. The VCM only responds to green vegetation and may result in wrong emissivity for desiccated grass. Emissivity deviations at Dahra are estimated to be within 0.1% during the rainy season but around 2% at the end of dry season, mainly because the non-vegetated “background” emissivity in the LSA SAF retrieval is too high [21]. Despite this considerable deviation in emissivity, the results show that during the dry season the LSA SAF LST product meets its target accuracy of 2 °C.

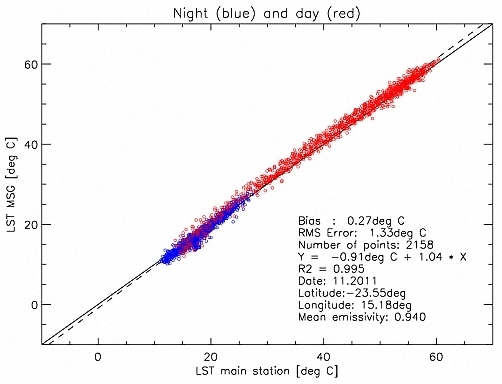
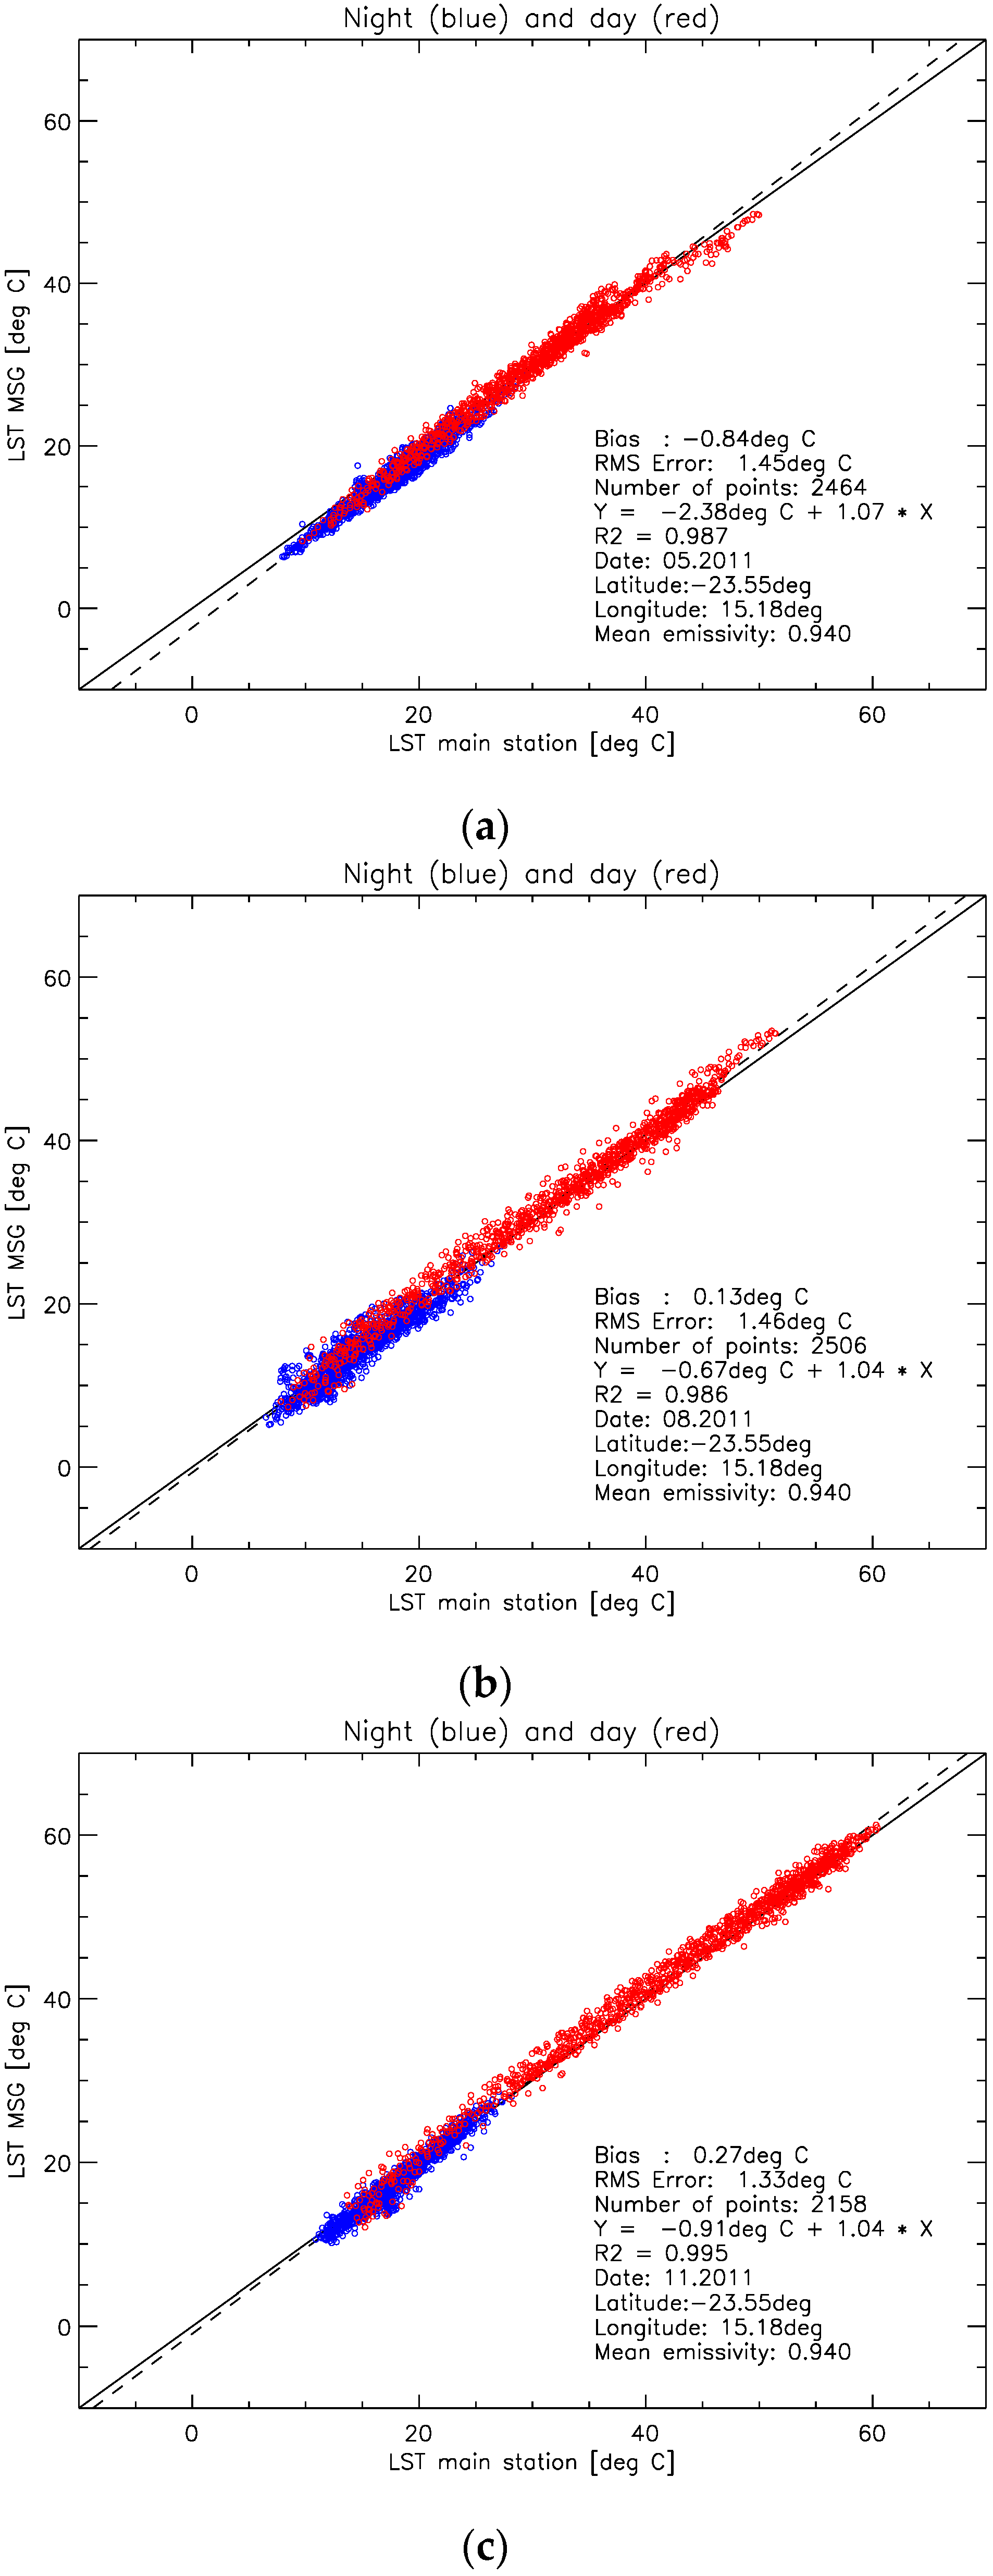
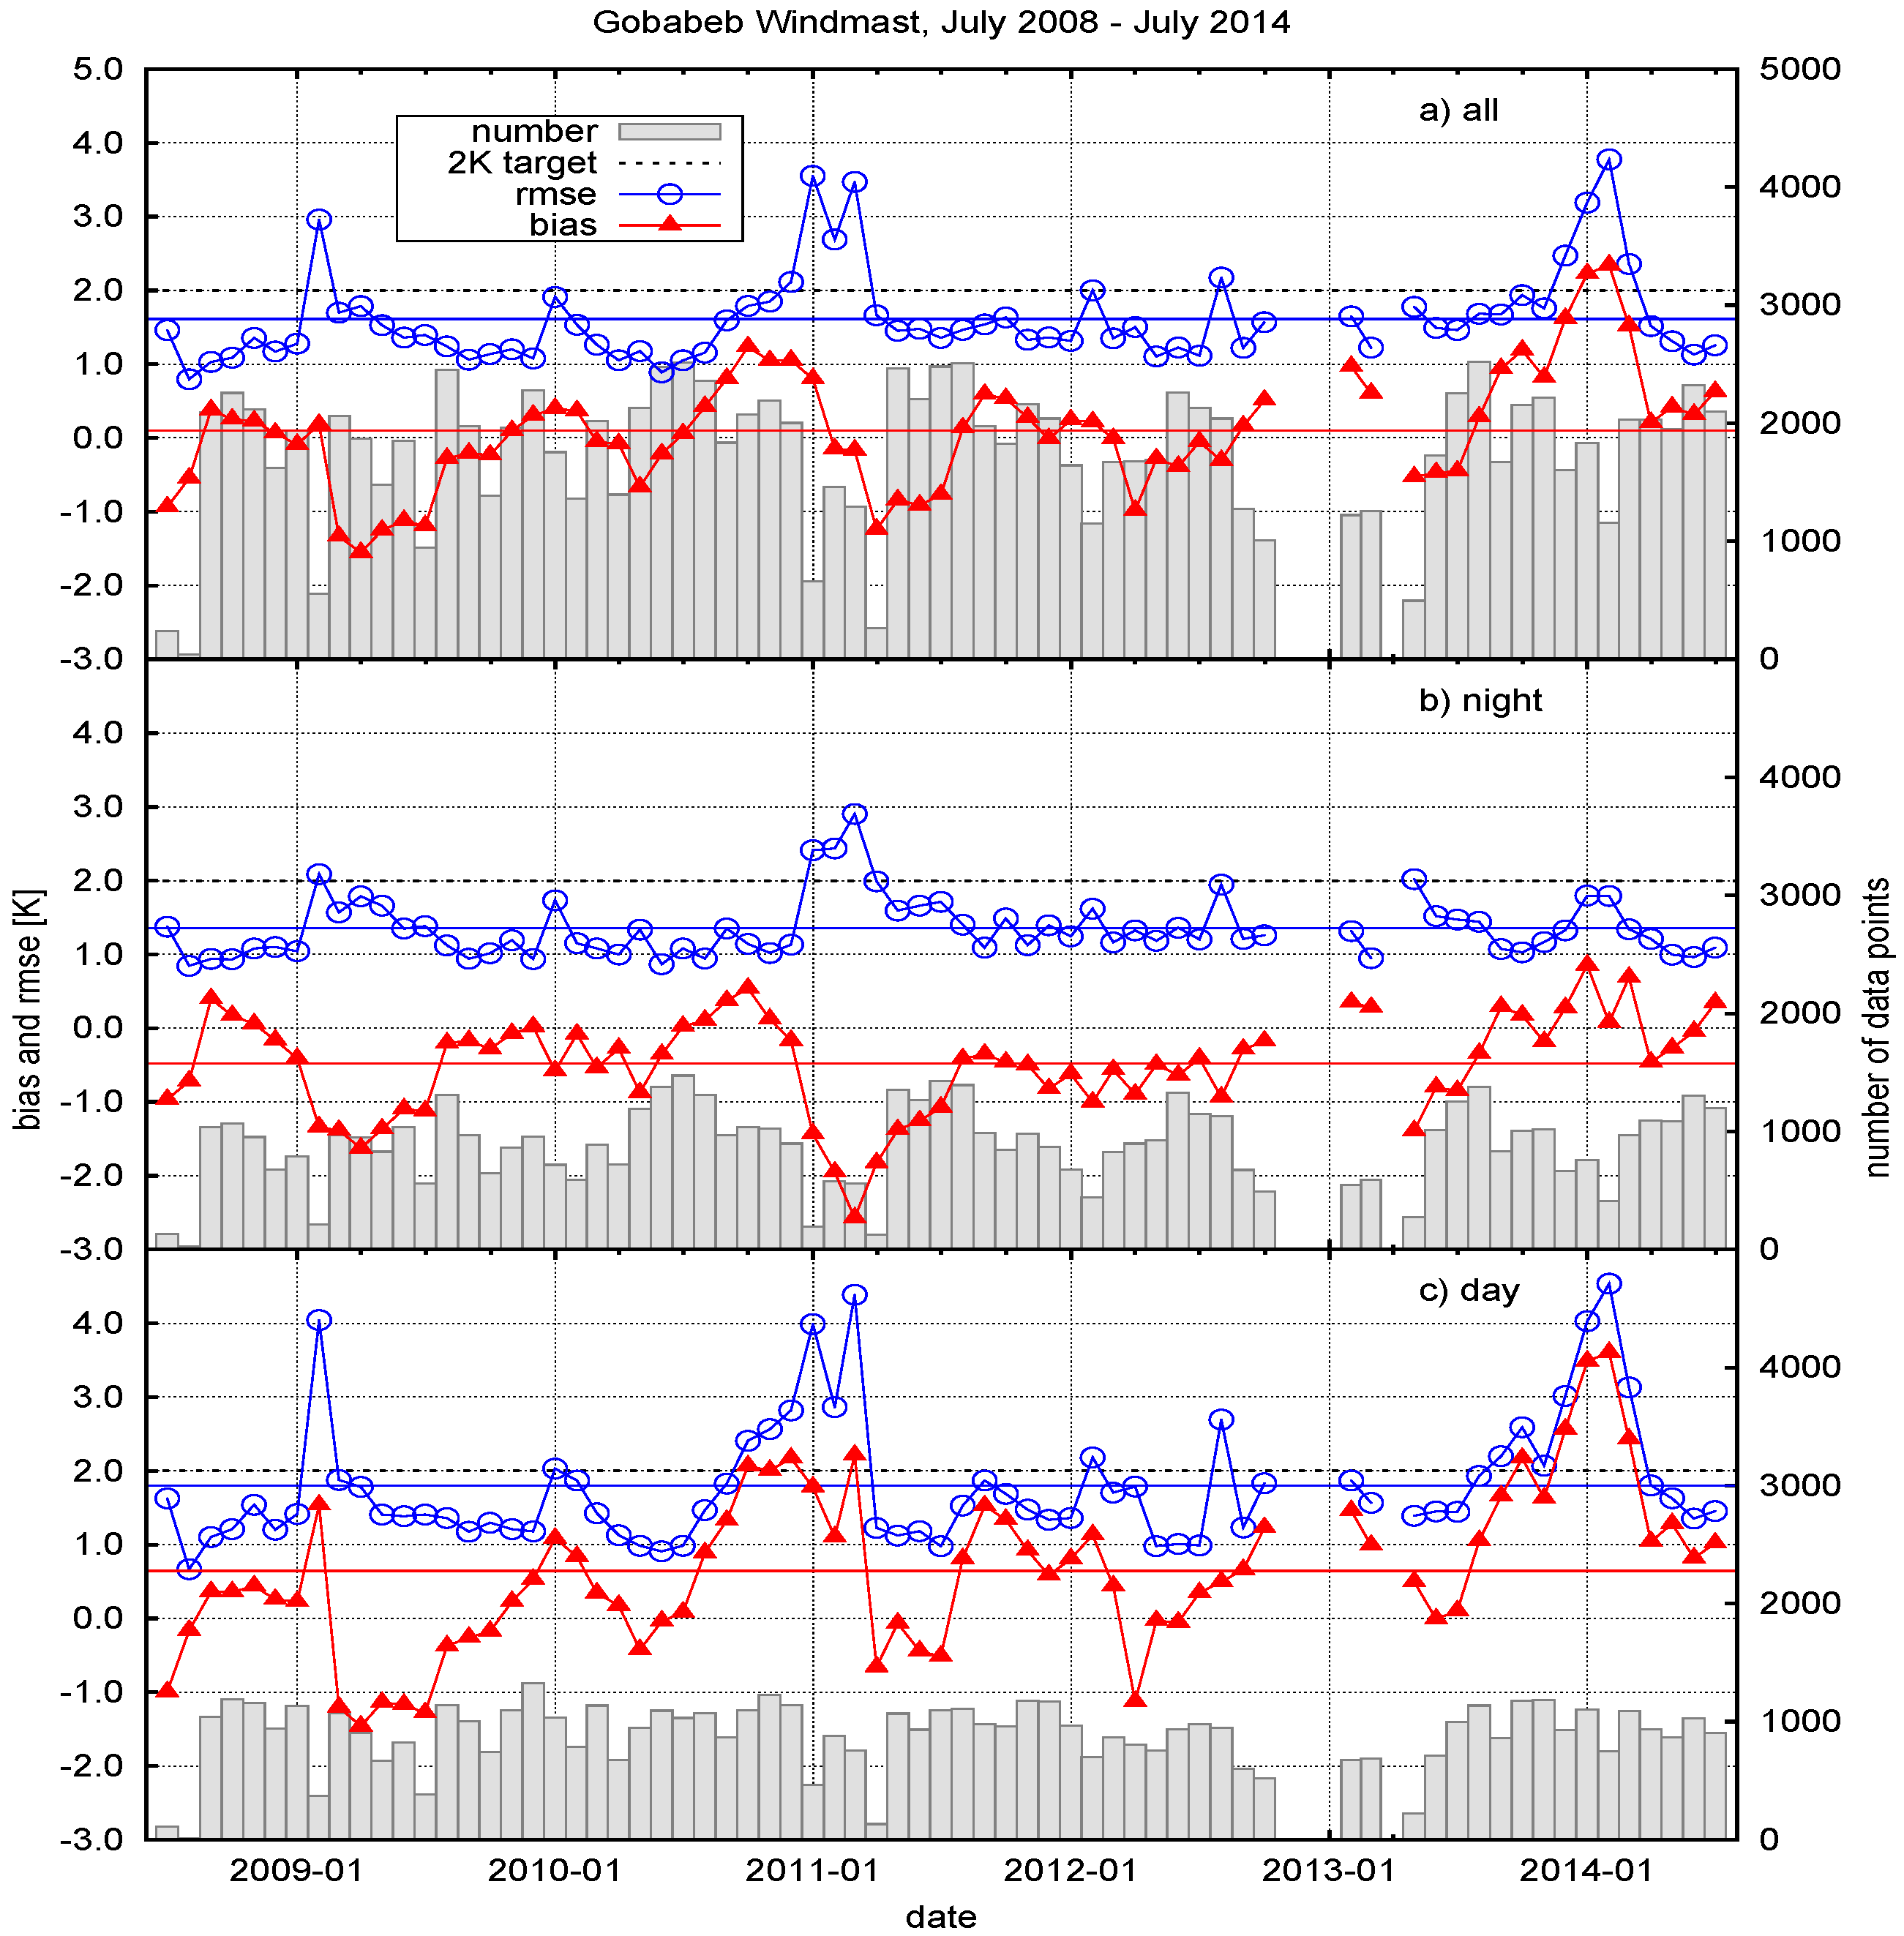
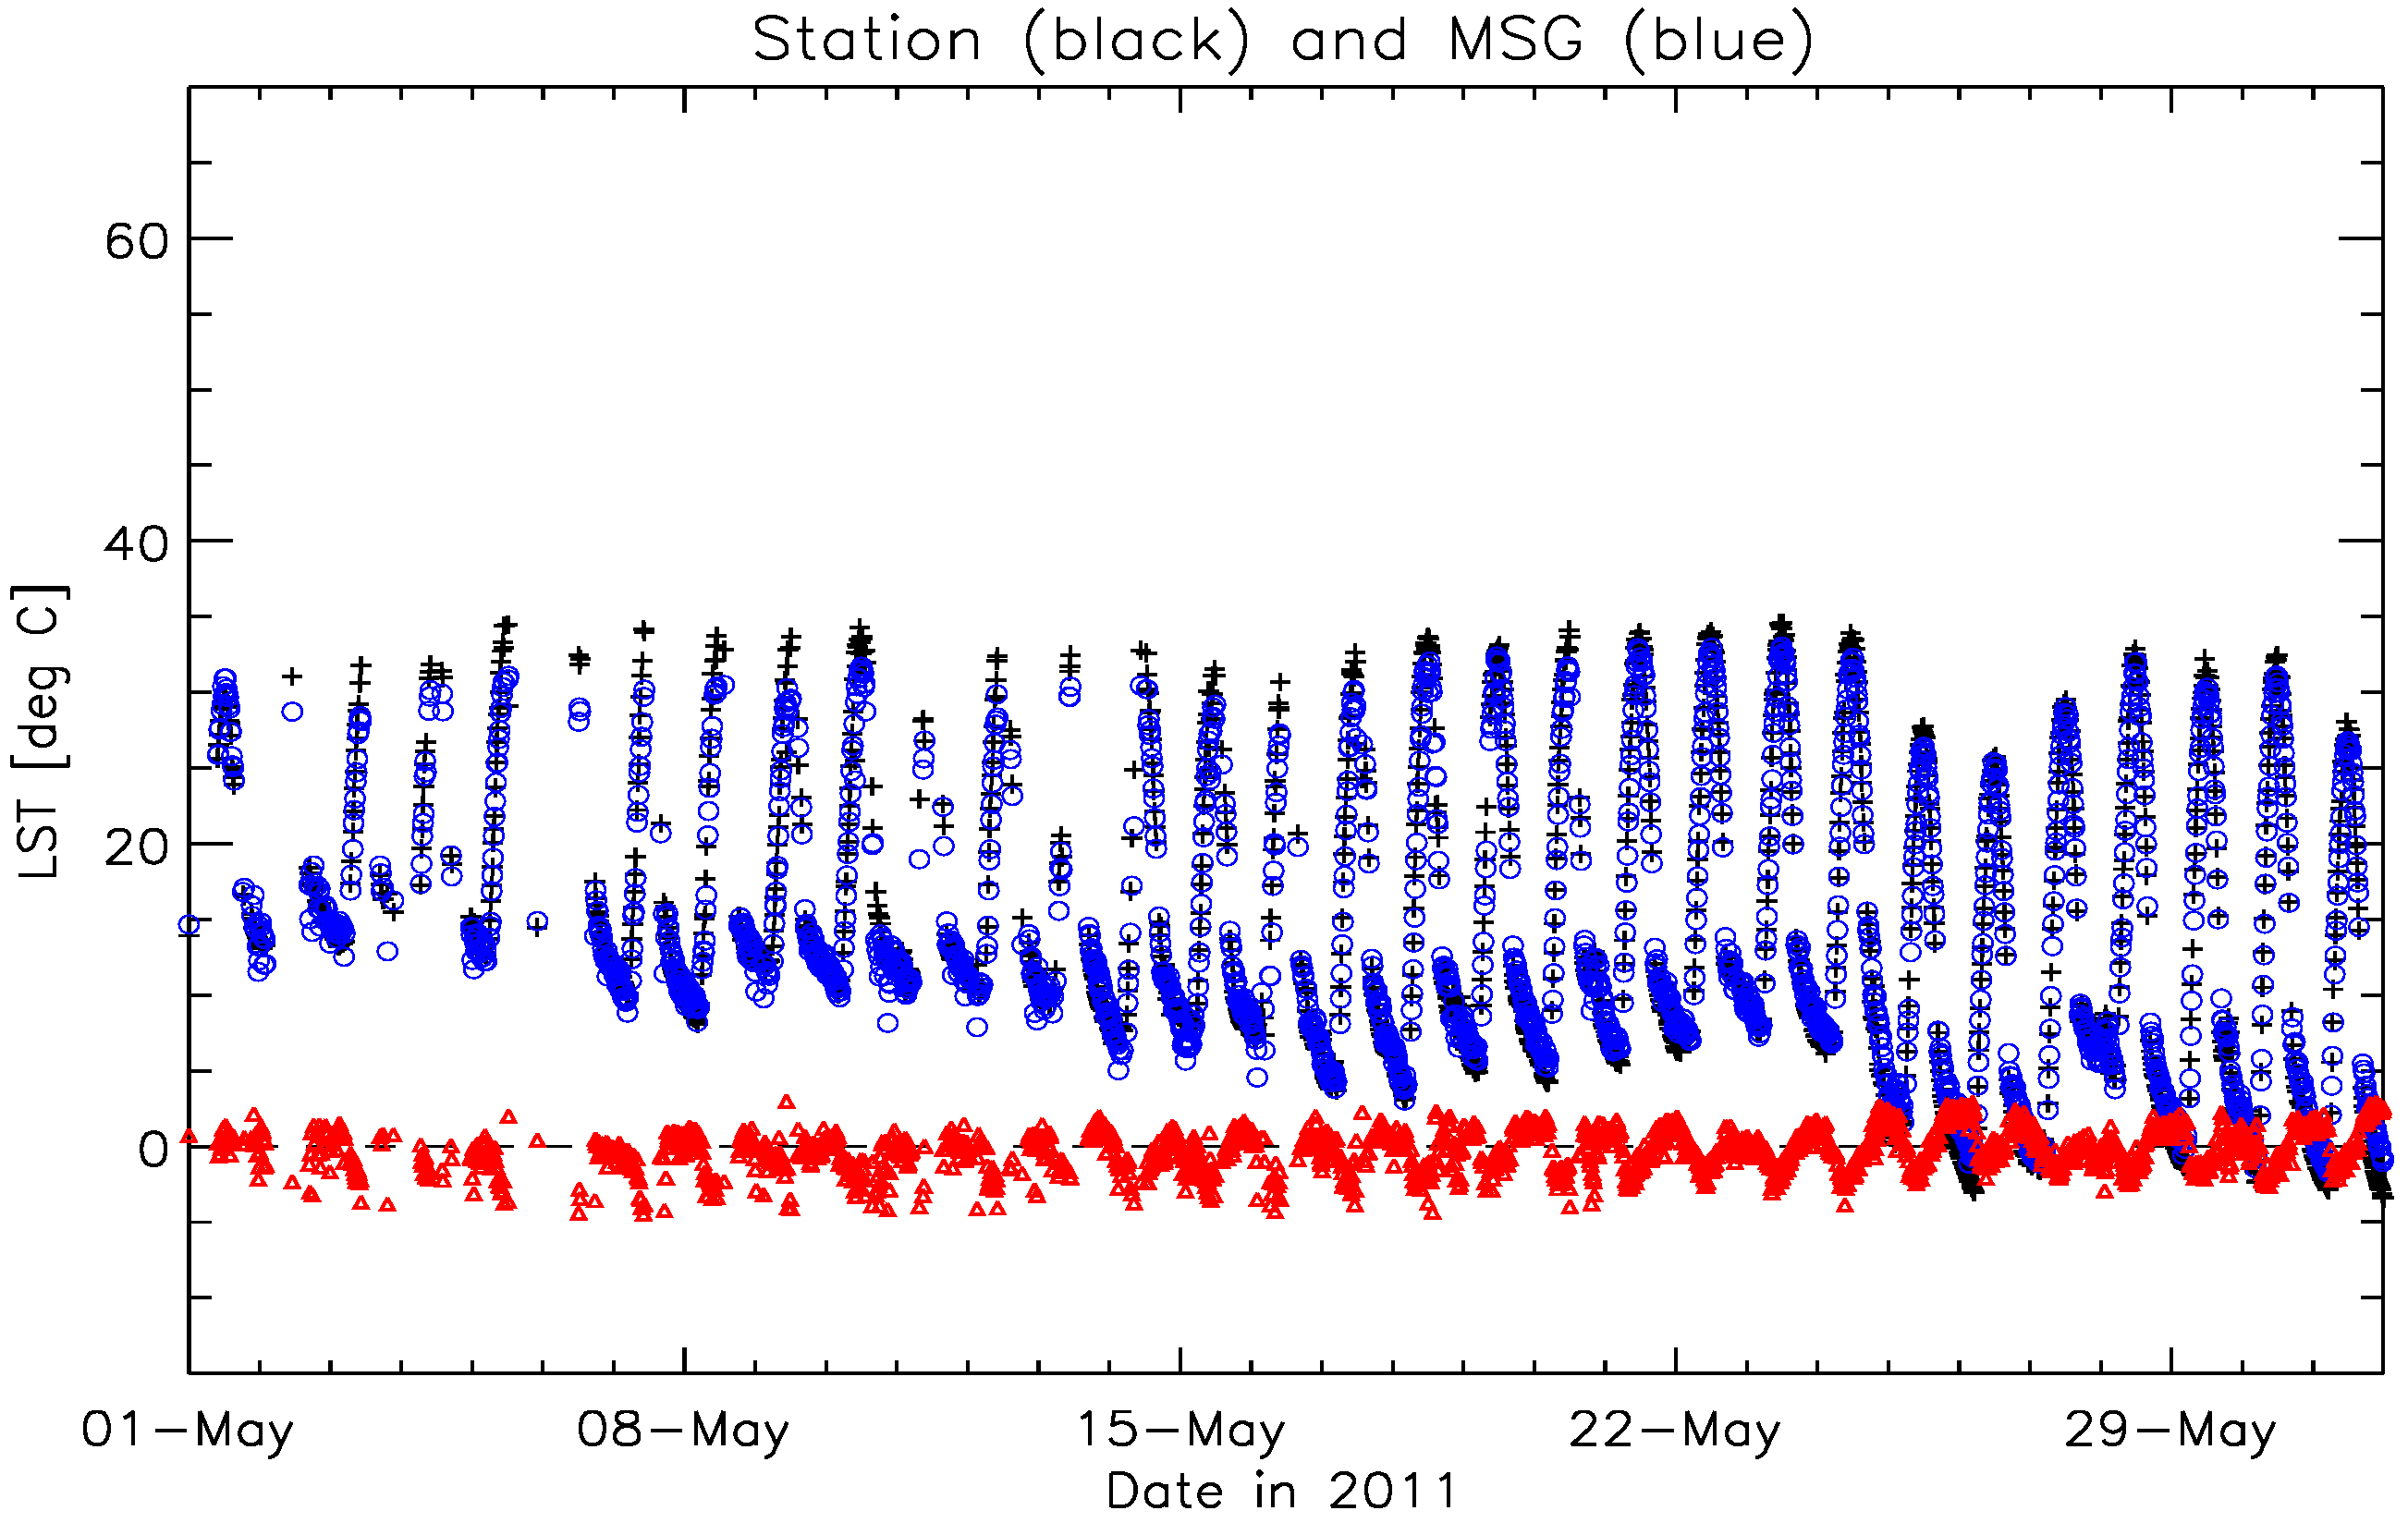
6.3. Results for Gobabeb

Figure 7 demonstrates data availability and diurnal temperature ranges for Gobabeb: shown are LSA SAF LST, in-situ LST and their difference (LSA SAF LST—in-situ LST) for May 2011. From the plot, it can be seen that there are only few gaps (detected clouds) and outliers (undetected clouds) in the data. The LST differences exhibit a diurnal cycle with amplitude of about 2 °C.
Figure 8 shows plots of LSA SAF LST derived from MSG/SEVIRI against Gobabeb station LST for May, August, and November 2011, respectively. The three months represent autumn, winter and spring at Gobabeb (southern hemisphere) and usually have a high number of clear sky situations. The in-situ LST at Gobabeb were derived from KT15.85 IIP measurements using a static emissivity of 0.940, as determined by [14]. For May 2011 (Figure 8, top) there are 2464 match-ups between satellite and in-situ LST for which bias and RMSE are determined as −0.84 °C (satellite colder) and 1.45 °C, respectively. From Figure 8), it can be seen that the negative bias is mainly due to lower satellite LST estimates at nighttime.
For August 2011 (Figure 8b) there are 2506 match-ups (i.e., 84% of all potential satellite observations are cloud-free) between LSA SAF LST and in-situ LST; the determined bias and RMSE are 0.13 °C (satellite warmer) and 1.46 °C, respectively. However, Figure 8b also shows that LSA SAF LST estimates tend to be slightly too low at nighttime and slightly too high at daytime. For November 2011 (Figure 8c) there are 2158 match-ups between satellite and in-situ LST and bias and RMSE are 0.27 °C (satellite warmer) and 1.33 °C, respectively. As for August 2011, LSA SAF LST estimates are slightly lower than in-situ LST at nighttime and slightly higher at daytime.
Figure 9 displays monthly biases and RMSE together with the corresponding numbers of valid data points for Gobabeb between July 2008 and July 2014. Figure 9a shows the results for all data (nighttime and daytime). The bias appears to be seasonal with minimum values of about −1.0 °C around May and smaller positive values around November; the overall mean bias and RMSE are 0.1 °C and 1.6 °C, respectively. The data gap around December 2012 is due to technical problems. The higher bias observed around October 2010 (about +1.0 °C) and the RMSE increase between December 2010 and March 2011 (to about 3.5 °C) occur around the exceptionally wet 2010/2011 rainy season (Namibia’s “small” rainy season is in October/November and its “big” rainy season between January and April). Figure 9b shows that after the “big” rainy seasons in 2009 and 2011 the nighttime bias, for which illumination effects can be ruled out, is about −1.5 °C and −2.5 °C, respectively. Figure 9c shows monthly biases and RMSE for the daytime data. The bias shows seasonal behavior superimposed by the signal from the exceptional rainy seasons 2009 and 2011; and as for the nighttime data, periods of negative bias are more pronounced around these rainy seasons. During and just after the rainy seasons the bias is generally around zero, whereas it tends to be slightly positive otherwise (ignoring rainy seasons).

6.4. Discussion for Gobabeb

Figure 8 demonstrates that the LSA SAF LST are in excellent agreement with Gobabeb station LST. This means that the LSA SAF GSW algorithm performs well in desert regions with LST up to 60 °C and considerable surface overheating w.r.t. air temperature (>20 °C). Furthermore, the results show that the chosen station location and instrumentation provide in-situ LST that are representative for spatially coarse satellite LST products, which was also demonstrated with additional measurements across the gravel plains [15]. The high level of agreement gives confidence in the station concept and in measurements performed at the other, more complex validation sites.
The Namib gravel plains usually receive little or no rain, i.e., the long term annual average at Gobabeb is 25 mm [59]. In contrast, during the rainy seasons 2008/2009 and 2010/2011 the gravel plains received 80 mm and 175 mm cumulated rainfall, respectively. The 12th of March 2011 was the wettest day in recorded history (49 mm) and “transformed the gravel plains into a grassland” [59]. The increased grass cover fraction appears to be reflected in the monthly biases during the first half of 2009 and 2011, for which it is more negative over a longer period of time than in the other years in Figure 9. This can be explained by the different effect changes in grass cover fraction have on channel-effective emissivities of SEVIRI channel 9 and the KT15.85 IIP: whereas convolving the sensors’ response functions with an emissivity spectrum of a dry grass sample [14] yields similar emissivities for the KT15.85 IIP (0.958) and SEVIRI channel 9 (0.955), emissivities obtained for a gravel sample are 0.931 and 0.941 for the KT15.85 IIP and SEVIRI channel 9, respectively. When weighing the grass and gravel in-situ emissivities by their respective cover fractions, an increase in dry grass fraction from 25% to 100% (i.e., complete grass cover) would increase KT15.85 IIP emissivity from 0.938 to 0.958, whereas SEVIRI channel 9 in-situ emissivity would change from 0.945 to 0.955. However, on the gravel plains grass desiccates rapidly and LSA SAF emissivity for SEVIRI channel 9 is near constant at 0.949, since its algorithm for emissivity determination only responds to green vegetation (see Section 3.2). Gobabeb in-situ LST are obtained with KT15.85 IIP emissivity set to 0.940 as estimated in [14] for a static dry grass fraction of 25% [16]: for a complete grass cover this value underestimates emissivity by 0.018. In contrast, for a dry grass fraction of 25% LSA SAF overestimates SEVIRI channel 9 in-situ emissivity (0.945) by 0.004 and underestimates it by 0.006 for complete grass covers.
The bias curve shown in Figure 9b suggests that strong rain events increased the dry grass fraction for about six months: during this time the static KT15.85 IIP emissivity would then underestimate actual emissivity and cause an overestimation of in situ LST by about an additional 1 °C. The most negative nighttime biases occur around March 2011; however, the corresponding RMSE are also highest and there are fewer match-ups, suggesting the presence of undetected clouds.
The periodic behavior of the daytime bias in Figure 9c could be caused by seasonal variation in atmospheric correction of LSA SAF’s LST retrieval algorithm, i.e., a systematic overestimation of water vapor content during the rainy season. This would also help to explain the strong increase in bias from August to November 2010, since an overestimation of water atmospheric vapor content would result in too high satellite LST.

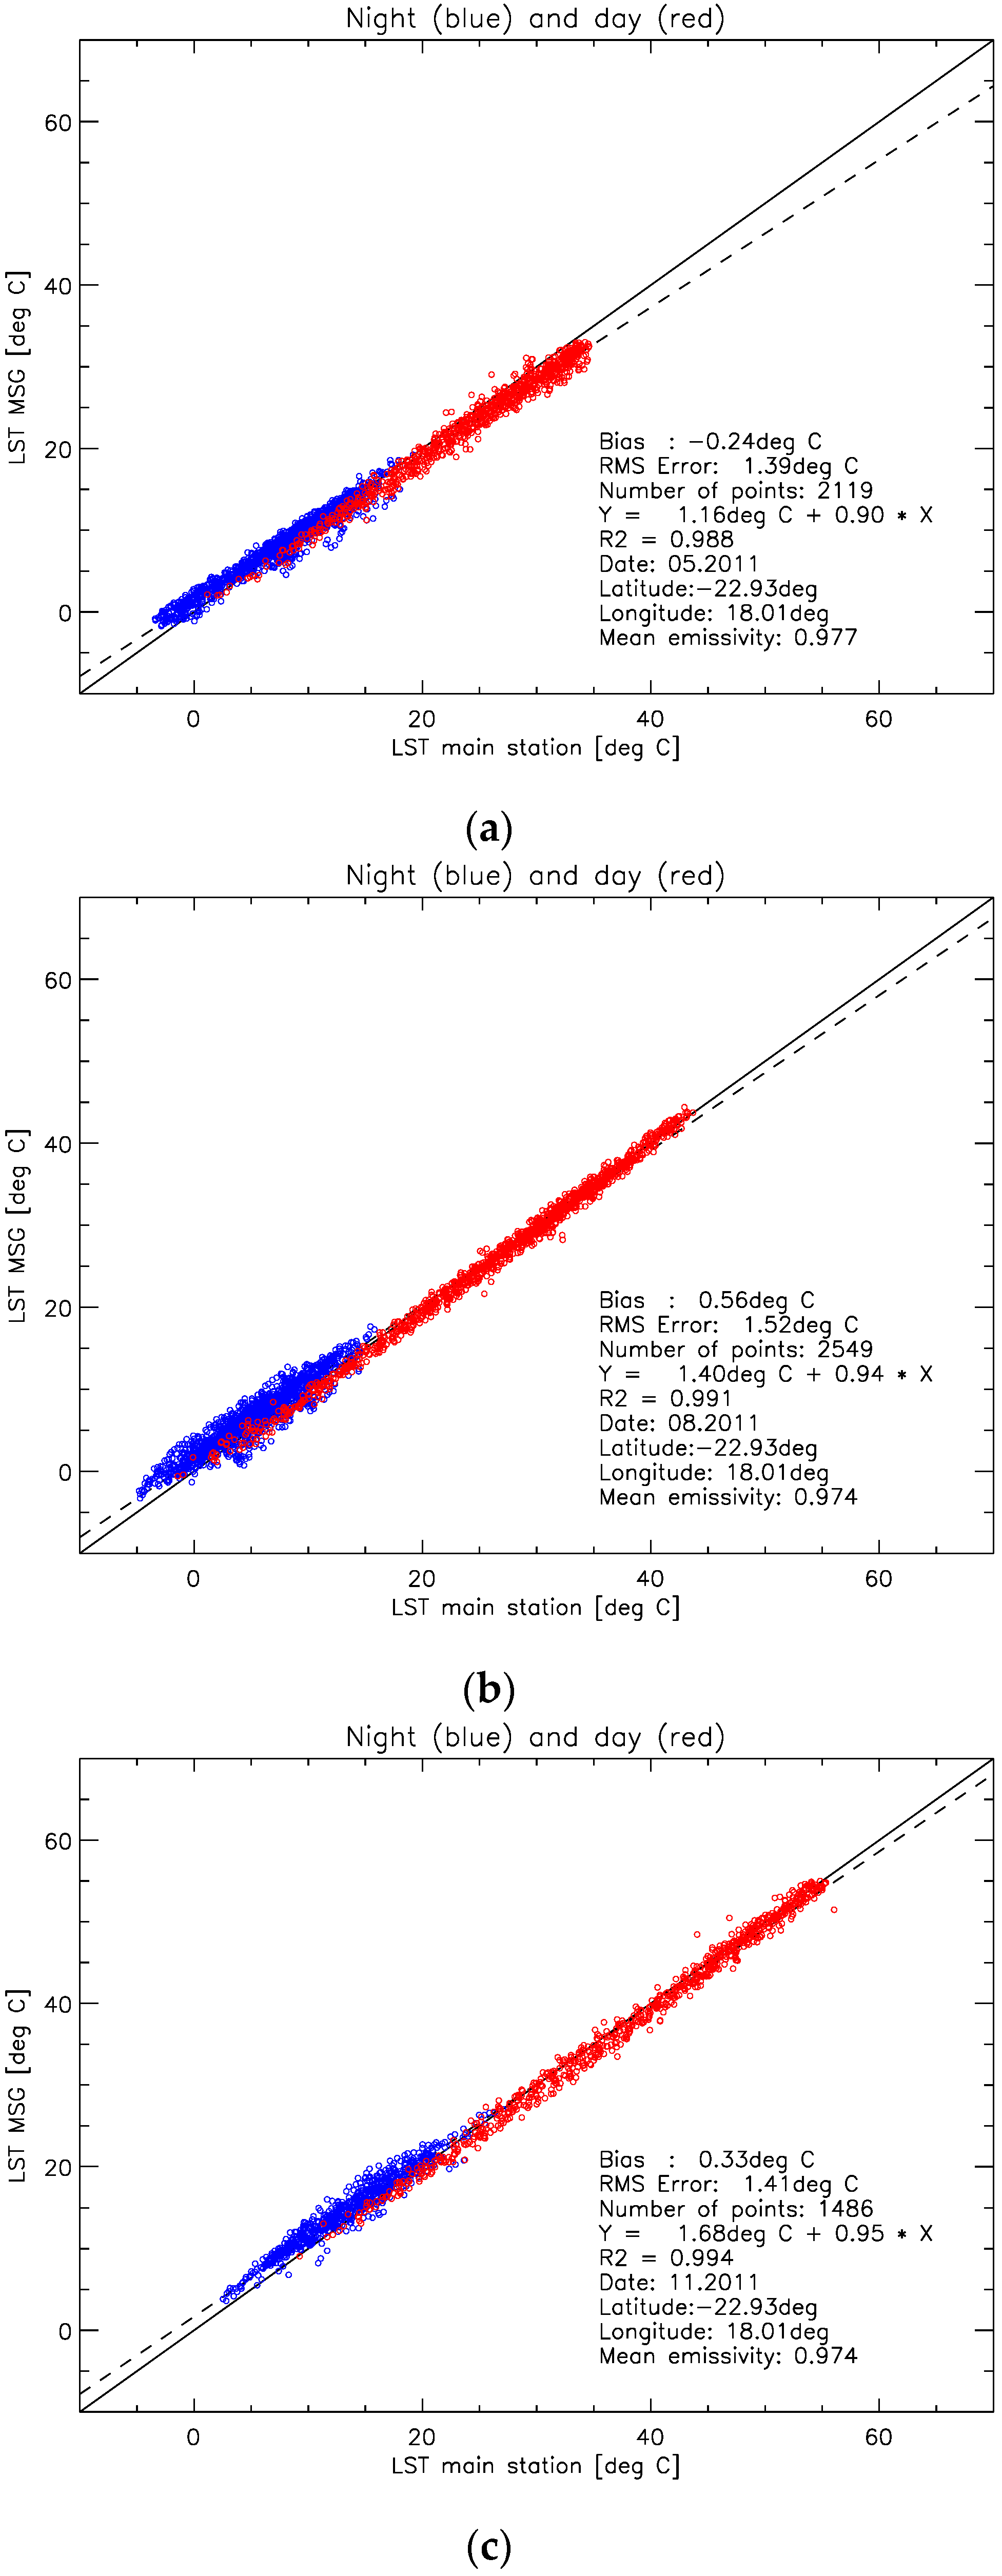
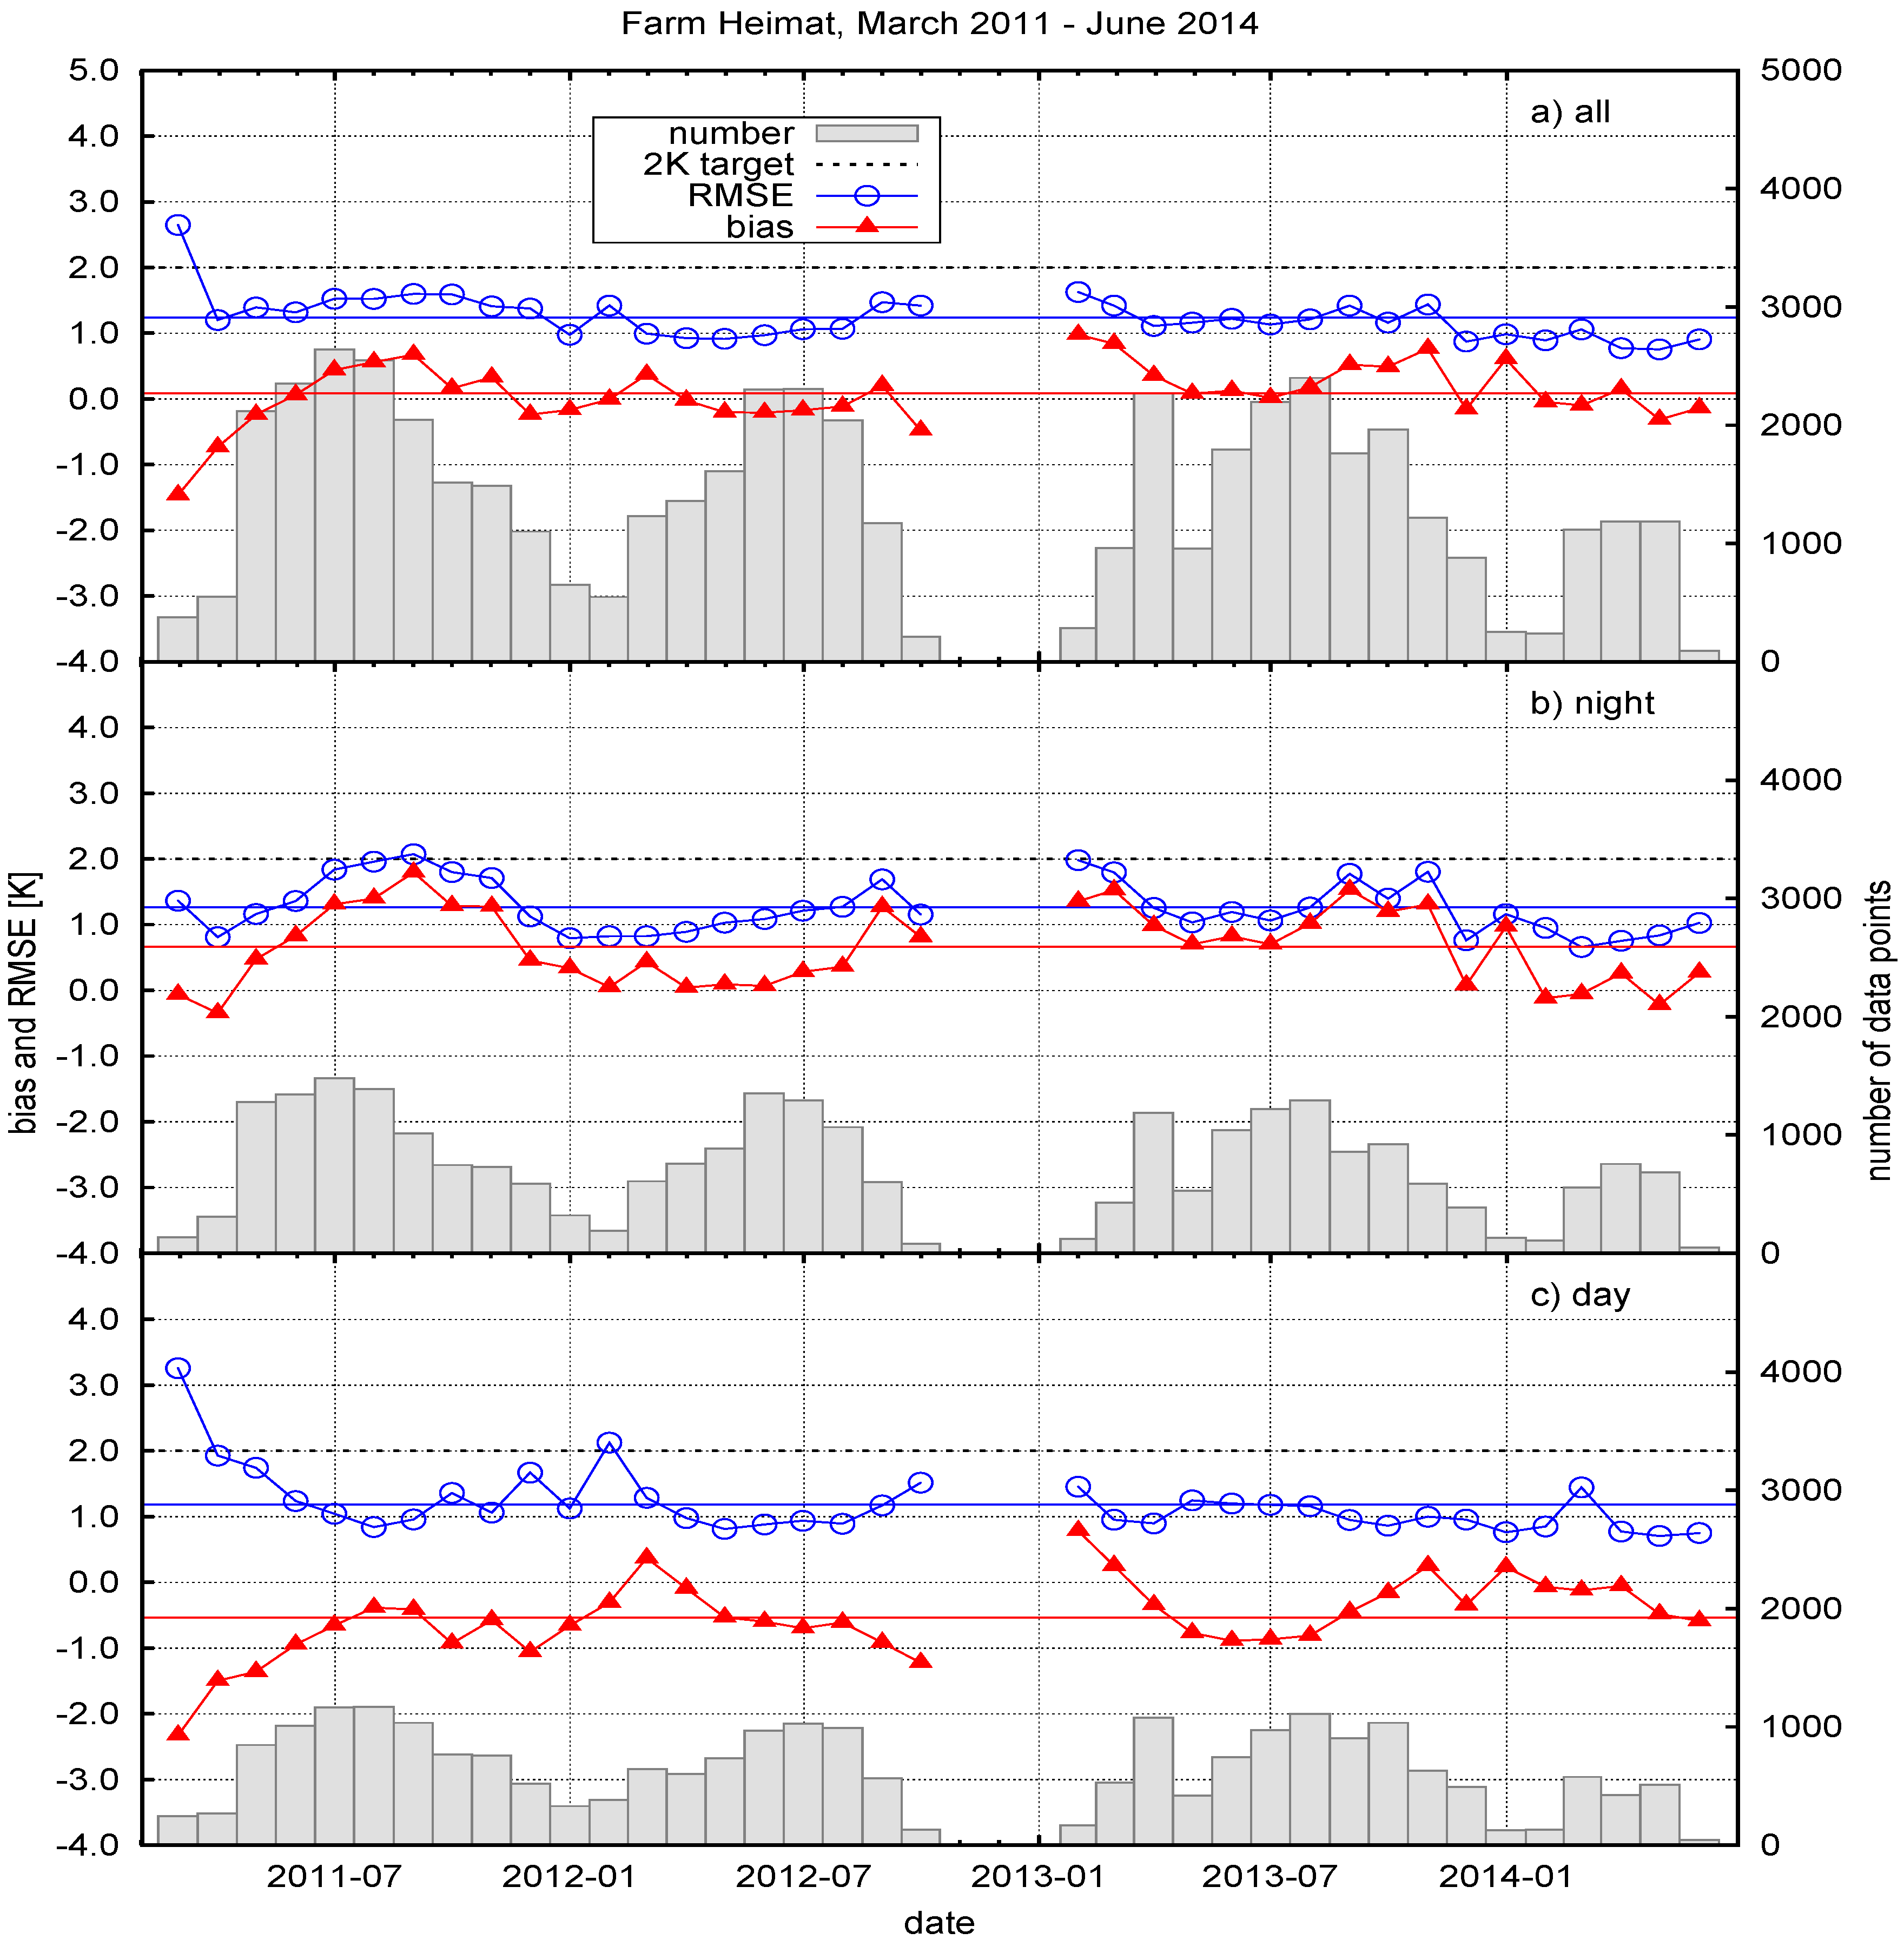
6.5. Results for Farm Heimat

Figure 10 demonstrates data availability and diurnal temperature ranges for Farm Heimat; shown are LSA SAF LST, in-situ LST and their difference (LSA SAF LST—in-situ LST) for May 2011 (southern hemisphere autumn). The LST differences exhibit a diurnal cycle with amplitude of about 3 °C. At the beginning of May 2011 LSA SAF LST around noon are colder than in-situ LST and there are data gaps (clouds) and outliers (undetected clouds). In the second half of May there are fewer data gaps, minimum nighttime LST becomes increasingly colder (below 0 °C at the end of May) and LSA SAF overestimates nighttime LST. This behavior is better seen in Figure 11a, which shows a scatter plot of the data shown in Figure 10.
Figure 11 shows scatter plots of LSA SAF LST derived from MSG/SEVIRI against Farm Heimat in-situ LST for May, August, and November 2011. The three months represent autumn, winter and spring at Farm Heimat and usually have a high number of clear sky situations. In-situ LST were derived using LSA SAF’s emissivity product, which at Farm Heimat is about 0.975. For May 2011 (Figure 11a) there are 2119 match-ups between satellite and in-situ LST, for which the determined bias and RMSE are −0.24 °C and 1.39 °C, respectively. From Figure 11a it can be seen that bias is positive at nighttime (LSA SAF LST warmer) and negative at daytime (LSA SAF LST colder). The bias and RMSE for August 2011 (Figure 11b) are 0.56 °C and 1.52 °C, respectively, and there is very good agreement between LSA SAF daytime LST and in-situ LST. For November 2011 (Figure 11c) bias and RMSE are 0.33 °C and 1.41 °C, respectively. For all three months, there is a pronounced positive nighttime bias, indicating that LSA SAF LST are systematically warmer than in-situ LST; at daytime LSA SAF LST are (slightly) colder than in-situ LST.
Figure 12 displays monthly biases and RMSE together with the corresponding numbers of valid data points for Farm Heimat between March 2011 and June 2014. Figure 12a shows the results for nighttime and daytime data: with the exception of March and April 2011, the monthly bias varies relatively little (amplitude about 0.5 °C) and has a mean of about 0.1 °C. The monthly RMSE in Figure 12a also shows little variation and has a mean of 1.2 °C. However, the small bias for the combined daytime and nighttime data partially results from compensation between different nighttime (Figure 12b) and daytime (Figure 12c) biases: whereas mean nighttime bias is 0.7 °C, mean daytime bias is −0.5 °C. The corresponding means of RMSE are 1.3 °C and 1.2 °C for nighttime and daytime, respectively.

6.6. Discussion for Farm Heimat

The nighttime and daytime data in Figure 12a show that with the exception of March and April 2011 the monthly bias varies relatively little: during these two months the data are thought to be affected by the exceptional rainy season 2010/2011 in Namibia. Furthermore, there appears to be a seasonal increase of nighttime bias and RMSE (Figure 12b) around southern hemisphere winter (June–August). This is consistent with possible unaccounted effects of local near surface atmospheric inversions, commonly observed in winter clear sky cases; however, this still needs to be further investigated.

7. Conclusions

Up to six years of in-situ LST from KITs long term validation stations in Africa have been used to validate the operational LST product retrieved by the Land Surface Satellite Application Facility (LSA SAF) from MSG/SEVIRI data. The validation stations represent different surface cover types and climates and are located in flat, homogeneous terrains. The stations design, in particular instrumentation and location, target specifically the validation of LST satellite products derived for pixel scales over 1 km, e.g., the used precision radiometers have particularly small drift and the landscape surrounding the sites is homogeneous at the scale of several MSG/SEVIRI pixels. Uncertainty analysis performed for one year of Gobabeb station data yielded an in-situ LST uncertainty of 0.80 ± 0.12 °C. This value is dominated by uncertainty in land surface emissivity within the radiometer’s band, which for Gobabeb is estimated as ±0.015; since Farm Heimat has a larger fraction of permanent vegetation and the Dahra site is covered for most of the year (the dry season) by a relatively steady mixture of low-lying desiccated grass and soil, the corresponding uncertainties in in-situ emissivity and LST are expected to be slightly smaller than at Gobabeb.
Typically, thousands of monthly match-ups between satellite LST and in-situ LST were available at each validation site and yielded highly linear relationships between the two quantities. Furthermore, the large number of match-ups allowed seasonally resolved validations of LSA SAF LST; among others, this highlighted seasonal differences in the retrieval algorithm’s performance, e.g., lower performance during rainy seasons as a consequence of increased cloud contamination. After the exceptional rainy seasons 2008/2009 and 2010/2011 monthly nighttime bias at Gobabeb showed a clear response for about 6 months during which it became about 1 °C more negative. This effect can be explained with an unusual growth of grass triggered by strong rain: when assuming a full grass cover, the static emissivity for the in-situ radiometer over the gravel plains underestimates actual emissivity by up to 1.8%, whereas SEVIRI channel 9 in-situ emissivity varies by about ±0.5% around its assumed value.
Table 3 summarizes the validation results for LSA SAF LST for validation stations Dahra, Gobabeb and Farm Heimat. It should be stressed that these validation results are also largely valid for the Copernicus Global Land LST product, since over Europe and Africa (i.e., regions where MSG/SEVIRI disk does not overlap that of other geostationary satellites) the Copernicus LST corresponds to the LSA SAF product [7] re-projected to the Copernicus Global Land grid (http://land.copernicus.eu/global/). The results show that the LSA SAF LST product achieves its target accuracy of 2 °C RMSE for Gobabeb and Farm Heimat, regardless whether LST are validated as night- and daytime data separately or together. For Dahra the results show that LSA SAF achieves its target accuracy during the dry season, but not during the rainy season. However, when limiting the analysis for Dahra to dry seasons (Table 3, values in brackets), the results are comparable to those found at Gobabeb and Farm Heimat, e.g., mean RMSE for nighttime and daytime data combined was 1.4 °C while mean absolute bias was 0.0 °C.
Currently more accurate and reliable satellite-retrieved emissivities are (close to) becoming operational [36,38]. These improved LSE products will also help to reduce in-situ emissivity uncertainty, the dominant source of uncertainty, and allow increasing the accuracy of in-situ LST obtained at KIT’s validation stations further.

Acknowledgments

The research was carried out within the framework of the Satellite Application Facility (SAF) on Land Surface Analysis (LSA), a project funded by the European Organisation for the Exploitation of Meteorological Satellites (EUMETSAT).

Author Contributions

Frank-M. Göttsche derived the in-situ LST, matched them to the satellite LST and analyzed the data. He wrote the paper and is responsible for the description of the procedures used to obtain the in-situ LST&E. Folke-S. Olesen is in charge of stations Gobabeb and Farm Heimat, performed in-situ measurements and contributed to the sections describing the stations. Isabel F. Trigo provided the satellite LST and wrote the sections describing LST&E retrieval from MSG/SEVIRI data. Annika Bork-Unkelbach derived the land cover fractions from high resolution VIS/NIR satellite data and implemented the data base solution for the in-situ measurements. Maria A. Martin performed the uncertainty analysis for the in-situ LST and wrote the respective manuscript section.

Conflicts of Interest

The authors declare no conflict of interest.

Abbreviations

The following abbreviations are used in this manuscript:
FVCFraction of Vegetation Cover
GSWGeneralized split-window
LSA SAFLand Surface Analysis Satellite Application Facility
LSELand Surface Emissivity
LSTLand Surface Temperature
MODISModerate Resolution Imaging Spectroradiometer
MSGMeteosat Second Generation
SEVIRISpinning Enhanced Visible and Infrared Imager
TESTemperature-Emissivity Separation

Appendix A

This appendix presents the derivation of the equations describing the uncertainties associated with the in-situ LST estimates. Combining Equations (4), (8) and (9) and inserting into Equation (7) gives LST as a function of the measured brightness temperatures BT L and BT S ' :
L S T =   d 2 log ( d 1 d 1 exp ( d 2 B T L ) 1 ( 1 ε ) · d 1 exp ( d 2 B T S ' ( 1 t W ) · T a t W ) 1 ε + 1 )
All parameters that have to be considered for uncertainty estimation are included in Equation (A1). First, there is the random uncertainty of the brightness temperatures BT L and BT S ' measured by the KT-15.85 IIP radiometers, which have an absolute accuracy of ±0.3 °C [40]. Second, the random uncertainty of ε is estimated as ±0.015 for the Gobabeb site [14], which is also a typical value for satellite-retrieved emissivities. A systematic error is introduced by the transmissivity of the protective window, which was found to degrade during its deployment by up to 5% (−0.045). Equation (A1) was differentiated with respect to the parameters having random uncertainties to obtain an estimate of total random uncertainty Δ LST random :
δ L S T δ ε   =   d 2 · ( d 1 R L ( 1 ε ) · R S ε + 1 ) 1 · d 1 ( R L ( 1 ε ) · R S ε ) 2 · R S R L ε 2 log ( d 1 R L ( 1 ε ) · R S ε + 1 ) 2
δ L S T δ B T L   =   d 2 · ( d 1 R L ( 1 ε ) · R S ε + 1 ) 1 · d 1 ε ( R L ( 1 ε ) · R S ε ) 2 · d 1 · exp ( d 2 B T L ) · d 2 B T L 2 ( exp ( d 2 B T L ) 1 ) 2 log ( d 1 R L ( 1 ε ) · R S ε + 1 ) 2
δLST δB T S = d 2 ( d 1 R L (1ε)· R S ε +1 ) 1 · d 1 ·(ε1) ε ( R L (1ε)· R S ε ) 2 · d 1 ·exp( d 2 B T S )· d 2 t w B T S 2 (exp( d 2 B T S )1) 2 log ( d 1 R L (1ε)· R S ε +1) 2
The systematic error introduced by the protective window is estimated in a similar way to random uncertainty, i.e., Equation (A1) was derived with respect to  t W :
δLST δ t w = d 2 ( d 1 R L (1ε)· R S ε +1 ) 1 · d 1 ·(ε1) ε ( R L (1ε)· R S ε ) 2 · d 1 ·exp( d 2 B T S )· d 2 B T S 2 · T a B T S t W 2 (exp( d 2 B T S )1) 2 log ( d 1 R L (1ε)· R S ε +1) 2

References

  1. Trigo, I.F.; Dacamara, C.C.; Viterbo, P.; Roujean, J.L.; Olesen, F.; Barroso, C.; Camacho-de Coca, F.; Carrer, D.; Freitas, S.C.; Garcia-Haro, J.; et al. The satellite application facility for land surface analysis. Int. J. Remote Sens. 2011, 32, 2725–2744. [Google Scholar] [CrossRef]
  2. Wan, Z.; Dozier, J. A generalized split-window algorithm for retrieving land-surface temperature from space. IEEE Trans. Geosci. Remote Sens. 1996, 34, 892–905. [Google Scholar]
  3. Freitas, S.; Trigo, I.; Bioucas-Dias, J.; Gottsche, F.M. Quantifying the Uncertainty of Land Surface Temperature Retrievals from SEVIRI/Meteosat. IEEE Trans. Geosci. Remote Sens. 2010, 48, 523–534. [Google Scholar] [CrossRef]
  4. Peres, L.; DaCamara, C. Emissivity maps to retrieve land-surface temperature from MSG/SEVIRI. IEEE Trans. Geosci. Remote Sens. 2005, 43, 1834–1844. [Google Scholar] [CrossRef]
  5. Trigo, I.F.; Monteiro, I.T.; Olesen, F.; Kabsch, E. An assessment of remotely sensed land surface temperature. J. Geophys. Res. 2008, 113, 1–12. [Google Scholar] [CrossRef]
  6. Trigo, I.F.; Peres, L.F.; DaCamara, C.C.; Freitas, S.C. Thermal land surface emissivity retrieved from SEVIRI/Meteosat. IEEE Trans. Geosci. Remote Sens. 2008, 46, 307–315. [Google Scholar] [CrossRef]
  7. Freitas, S.C.; Trigo, I.F.; Macedo, J.; Barroso, C.; Silva, R.; Perdigão, R. Land surface temperature from multiple geostationary satellites. Int. J. Remote Sens. 2013, 34, 3051–3068. [Google Scholar] [CrossRef]
  8. Schneider, P.; Ghent, D.; Corlett, G.; Prata, F.; Remedios, J. AATSR Validation: LST Validation Protocol; ESA Report Contract No. 9054/05/NL/FF; European Space Agency (ESA): Paris, France, 2012. [Google Scholar]
  9. Wan, Z.; Li, Z.L. Radiance-based validation of the V5 MODIS land-surface temperature product. Int. J. Remote Sens. 2008, 29, 5373–5395. [Google Scholar] [CrossRef]
  10. Niclos, R.; Galve, J.M.; Valiente, J.A.; Estrela, M.J.; Coll, C. Accuracy assessment of land surface temperature retrievals from MSG2-SEVIRI data. Remote Sens. Environ. 2011, 115, 2126–2140. [Google Scholar] [CrossRef]
  11. Salisbury, J.; D’Aria, D.M. Emissitivity of Terrestrial Materials in the 8–14 micrometer Atmospheric Window. Remote Sens. Environ. 1992, 42, 83–106. [Google Scholar] [CrossRef]
  12. Hulley, G.C.; Hook, S.J. The North American ASTER Land Surface Emissivity Database (NAALSED) Version 2.0. Remote Sens. Environ. 2009, 113, 1967–1975. [Google Scholar] [CrossRef]
  13. Hulley, G.C.; Hook, S.J.; Manning, E.; Lee, S.Y.; Fetzer, E. Validation of the Atmospheric Infrared Sounder (AIRS) version 5 land surface emissivity product over the Namib and Kalahari deserts. J. Geophys. Res. 2009, 114, 1–11. [Google Scholar] [CrossRef]
  14. Göttsche, F.M.; Hulley, G.C. Validation of six satellite-retrieved land surface emissivity products over two land cover types in a hyper-arid region. Remote Sens. Environ. 2012, 124, 149–158. [Google Scholar] [CrossRef]
  15. Göttsche, F.M.; Olesen, F.S.; Bork-Unkelbach, A. Validation of land surface temperature derived from MSG/SEVIRI with in situ measurements at Gobabeb, Namibia. Int. J. Remote Sens. 2013, 34, 3069–3083. [Google Scholar] [CrossRef]
  16. Bork-Unkelbach, A. Extrapolation von in-situ Landoberflächentemperaturen auf Satellitenpixel. Ph.D. Thesis, Karlsruher Institut für Technologie, Karlsruhe, Germany, 2012. [Google Scholar]
  17. Kabsch, E.; Olesen, F.S.; Prata, F. Initial results of the land surface temperature (LST) validation with the Evora, Portugal ground-truth station measurements. Int. J. Remote Sens. 2008, 29, 5329–5345. [Google Scholar] [CrossRef]
  18. Rasmussen, M.O.; Gottsche, F.M.; Olesen, F.S.; Sandholt, I. Directional effects on land surface temperature estimation from Meteosat second generation for savanna landscapes. IEEE Trans. Geosci. Remote Sens. 2011, 49, 4458–4468. [Google Scholar] [CrossRef]
  19. Ermida, S.L.; Trigo, I.F.; DaCamara, C.C.; Göttsche, F.M.; Olesen, F.S.; Hulley, G. Validation of remotely sensed surface temperature over an oak woodland landscape—The problem of viewing and illumination geometries. Remote Sens. Environ. 2014, 148, 16–27. [Google Scholar] [CrossRef]
  20. Guillevic, P.C.; Bork-Unkelbach, A.; Gottsche, F.M.; Hulley, G.; Gastellu-Etchegorry, J.P.; Olesen, F.S.; Privette, J.L. Directional viewing effects on satellite land surface temperature products over sparse vegetation canopies—A multisensor analysis. IEEE Geosci. Remote Sens. Lett. 2013, 10, 1464–1468. [Google Scholar] [CrossRef]
  21. Xu, H.; Yu, Y.; Tarpley, D.; Gottsche, F.; Olesen, F.S. Evaluation of GOES-R land surface temperature algorithm using SEVIRI satellite retrievals with in situ measurements. IEEE Trans. Geosci. Remote Sens. 2014, 52, 3812–3822. [Google Scholar] [CrossRef]
  22. Duguay-Tetzlaff, A.; Bento, V.A.; Göttsche, F.M.; Stöckli, R.; Martins, J.P.; Trigo, I.; Olesen, F.; Bojanowski, J.S.; da Camara, C.; Kunz, H. Meteosat land surface temperature climate data record: Achievable accuracy and potential uncertainties. Remote Sens. 2015, 7, 13139–13156. [Google Scholar] [CrossRef]
  23. Köppen, W. Handbuch der Klimatologie. Das Geographische System der Klimate; Gebrüder Borntraeger: Berlin, Germany, 1936. [Google Scholar]
  24. Hook, S.J.; Prata, F.J.; Alley, R.E.; Abtahi, A.; Richards, R.C.; Schladow, S.G.; Pálmarsson, S.Ó. Retrieval of lake bulk skin and temperatures using Along-Track Scanning Radiometer (ATSR-2) data: A case study using lake Tahoe and California. J. Atmos. Ocean. Technol. 2003, 20, 534–548. [Google Scholar] [CrossRef]
  25. Coll, C.; Hook, S.J.; Galve, J.M. Land surface temperature from the advanced along-track scanning radiometer: Validation over inland waters and vegetated surfaces. IEEE Trans. Geosci. Remote Sens. 2009, 47, 350–360. [Google Scholar] [CrossRef]
  26. Rubio, E.; Caselles, V.; Badenas, C. Emissivity measurements of several soils and vegetation types in the 8–14 micrometer wave band: Analysis of two field methods. Remote Sens. Environ. 1997, 59, 490–521. [Google Scholar] [CrossRef]
  27. Schmetz, J.; Pili, P.; Tjemkes, S.; Just, D.; Kerkmann, J.; Rota, S.; Ratier, A. An introduction to Meteosat Second Generation (MSG). Bull. Am. Meteorol. Soc. 2002, 83, 992–992. [Google Scholar] [CrossRef]
  28. Schmetz, J.; Pili, P.; Tjemkes, S.; Just, D.; Kerkmann, J.; Rota, S.; Ratier, A. Radiometric performance of SEVIRI. Bull. Am. Meteorol. Soc. 2002, 83, ES50–ES51. [Google Scholar] [CrossRef]
  29. Derrien, M.; Gléau, H.L. MSG/SEVIRI cloud mask and type from SAFNWC. Int. J. Remote Sens. 2005, 26, 4707–4732. [Google Scholar] [CrossRef]
  30. Caselles, V.; Valor, E.; Coll, C.; Rubio, E. Thermal band selection for the PRISM instrument: 1. Analysis of emissivity-temperature separation algorithms. J. Geophys. Res. 1997, 102, 11145–11164. [Google Scholar] [CrossRef]
  31. Garcia-Haro, F.J.; Sommer, S.; Kemper, T. A new tool for variable multiple endmember spectral mixture analysis (VMESMA). Int. J. Remote Sens. 2005, 26, 2135–2162. [Google Scholar] [CrossRef]
  32. Belward, A. The IGBP-DIS Global 1 km Land Cover Data Set (DISCover)—Proposal and Implementation Plans; Technical Report 13; IGBP-DIS: Toulouse, France, 1996. [Google Scholar]
  33. Siljamo, N.; Hyvärinen, O. New geostationary satellite-based snow-cover algorithm. J. Appl. Meteorol. Climatol. 2011, 50, 1275–1290. [Google Scholar] [CrossRef]
  34. Schädlich, S.; Göttsche, F.; Olesen, F.S. Influence of Land Surface Parameters and Atmosphere on METEOSAT Brightness Temperatures and Generation of Land Surface Temperature Maps by Temporally and Spatially Interpolating Atmospheric Correction. Remote Sens. Environ. 2001, 75, 39–46. [Google Scholar] [CrossRef]
  35. Gillespie, A.; Rokugawa, S.; Matsunaga, T.; Cothern, J.S.; Hook, S.; Kahle, A.B. A temperature and emissivity separation algorithm for Advanced Spaceborne Thermal Emission and Reflection Radiometer (ASTER) images. IEEE Trans. Geosci. Remote Sens. 1998, 36, 1113–1126. [Google Scholar] [CrossRef]
  36. Hulley, G.C.; Hook, S.J. Generating consistent land surface temperature and emissivity products between ASTER and MODIS data for earth science research. IEEE Trans. Geosci. Remote Sens. 2011, 49, 1304–1315. [Google Scholar] [CrossRef]
  37. Jimenez-Munoz, J.C.; Sobrino, J.A.; Mattar, C.; Hulley, G.; Gottsche, F.M. Temperature and emissivity separation from MSG/SEVIRI data. IEEE Trans. Geosci. Remote Sens. 2014, 52, 5937–5951. [Google Scholar] [CrossRef]
  38. Masiello, G.; Serio, C.; De Feis, I.; Amoroso, M.; Venafra, S.; Trigo, I.F.; Watts, P. Kalman filter physical retrieval of surface emissivity and temperature from geostationary infrared radiances. Atmos. Meas. Tech. 2013, 6, 3613–3634. [Google Scholar] [CrossRef]
  39. Masiello, G.; Serio, C.; Venafra, S.; Liuzzi, G.; Göttsche, F.; Trigo, I.; Watts, P. Kalman filter physical retrieval of surface emissivity and temperature from SEVIRI infrared channels: A validation and intercomparison study. Atmos. Meas. Tech. 2015, 8, 2981–2997. [Google Scholar] [CrossRef]
  40. Theocharous, E.; Usadi, E.; Fox, N. CEOS Comparison of IR Brightness Temperature Measurements in Support of Satellite Validation. Part I: Laboratory and Ocean Surface Temperature Comparison of Radiation Thermometers; NPL Report OP 3; National Physical Laboratory: Teddington, UK, 2010. [Google Scholar]
  41. Becker, F. The impact of spectral emissivity on the measurement of land surface temperature from a satellite. Int. J. Remote Sens. 1987, 8, 1509–1522. [Google Scholar] [CrossRef]
  42. Kondratyev, K.Y. Radiation in the Atmosphere; Academic Press: New York, NY, USA, 1969. [Google Scholar]
  43. Dash, P.; Goettsche, F.M.; Olesen, F.S.; Fischer, H. Land surface temperature and emissivity estimation from passive sensor data: Theory and practice-current trends. Int. J. Remote Sens. 2002, 23, 2563–2594. [Google Scholar] [CrossRef]
  44. Becker, F.; Li, Z.L. Towards a local split window method over land surfaces. Int. J. Remote Sens. 1990, 11, 369–393. [Google Scholar] [CrossRef]
  45. Olioso, A.; Soria, G.; Sobrino, J.; Duchemin, B. Evidence of low land surface thermal infrared emissivity in the presence of dry vegetation. IEEE Geosci. Remote Sens. Lett. 2007, 4, 112–116. [Google Scholar] [CrossRef]
  46. French, A.; Schmugge, T.; Kustas, W. Discrimination of Senescent Vegetation Using Thermal Emissivity Contrast. Remote Sens. Environ. 2000, 74, 249–254. [Google Scholar] [CrossRef]
  47. Combs, A.; Weickmann, H.; Mader, C.; Tebo, A. Application of infrared radiometers to meteorology. J. Appl. Meteorol. 1965, 4, 253–262. [Google Scholar] [CrossRef]
  48. Rubio, E.; Caselles, V.; Coll, C.; Valour, E.; Sospedra, F. Thermal-infrared emissivities of natural surfaces: improvement on the experimental set-up and new measurements. Int. J. Remote Sens. 2003, 24, 5379–5390. [Google Scholar] [CrossRef]
  49. Dash, P.; Goettsche, F.M.; Olesen, F.S. Potential of MSG for surface temperature and emissivity estimation: considerations for real-time applications. Int. J. Remote Sens. 2002, 23, 4511–4518. [Google Scholar] [CrossRef]
  50. Stisen, S.; Jensen, K.H.; Sandholt, I.; Grimes, D.I. A remote sensing driven distributed hydrological model of the Senegal River basin. J. Hydrol. 2008, 354, 131–148. [Google Scholar] [CrossRef]
  51. Fensholt, R.; Sandholt, I. Evaluation of MODIS and NOAA AVHRR vegetation indices with in situ measurements in a semi-arid environment. Int. J. Remote Sens. 2005, 26, 2561–2594. [Google Scholar] [CrossRef]
  52. Tagesson, T.; Fensholt, R.; Guiro, I.; Rasmussen, M.O.; Huber, S.; Mbow, C.; Garcia, M.; Horion, S.; Sandholt, I.; Holm-Rasmussen, B.; et al. Ecosystem properties of semiarid savanna grassland in West Africa and its relationship with environmental variability. Glob. Chang. Biol. 2014, 21, 250–264. [Google Scholar] [CrossRef] [PubMed]
  53. Batjes, N. Options for increasing carbon sequestration in West African soils: An exploratory study with special focus on Senegal. Land Degrad. Dev. 2001, 12, 131–142. [Google Scholar] [CrossRef]
  54. Peel, M.C.; Finlayson, B.L.; McMahon, T.A. Updated world map of the Köppen-Geiger climate classification. Hydrol. Earth Syst. Sci. 2007, 11, 1633–1644. [Google Scholar] [CrossRef]
  55. Rasmussen, M.O.; Göttsche, F.M.; Diop, D.; Mbow, C.; Olesen, F.S.; Fensholt, R.; Sandholt, I. Tree survey and allometric models for tiger bush in northern Senegal and comparison with tree parameters derived from high resolution satellite data. Int. J. Appl. Earth Obs. Geoinformation 2011, 13, 517–527. [Google Scholar] [CrossRef]
  56. Jimenez-Munoz, J.C.; Sobrino, J.A.; Gillespie, A.; Sabol, D.; Gustafson, W.T. Improved land surface emissivities over agricultural areas using ASTER NDVI. Remote Sens. Environ. 2006, 103, 474–487. [Google Scholar] [CrossRef]
  57. Hulley, G.C.; Hook, S.J.; Baldridge, A.M. Validation of the North American ASTER Land Surface Emissivity Database (NAALSED) version 2.0 using pseudo-invariant sand dune sites. Remote Sens. Environ. 2009, 113, 2224–2233. [Google Scholar] [CrossRef]
  58. Lancaster, J.; Lancaster, N.; Seely, M. Climate of the central Namib Desert. Madoqua 1984, 14, 5–61. [Google Scholar]
  59. Eckardt, F.; Soderberg, K.; Coop, L.; Muller, A.; Vickery, K.; Grandin, R.; Jack, C.; Kapalanga, T.; Henschel, J. The nature of moisture at Gobabeb, in the central Namib Desert. J. Arid Environ. 2013, 93, 7–19. [Google Scholar] [CrossRef]
  60. Mason, S.J.; Jury, M.R. Climate variability and change over southern Africa: A reflection on underlying processes. Prog. Phys. Geogr. 1997, 21, 25–50. [Google Scholar] [CrossRef]
  61. Seely, M.K. Standing crop as an index of precipitation in the central Namib grassland. Madoqua 1978, 9, 5–13. [Google Scholar]
  62. Pearson, R.K. Outliers in Process Modeling and Identification. IEEE Trans. Control Syst. Technol. 2002, 10, 55–63. [Google Scholar] [CrossRef]
Figure 1. Locations of Karlsruhe Institute of Technology’s (KIT) validation stations on Meteosat Second Generation (MSG) / Spinning Enhanced Visible and Infrared Imager (SEVIRI) earth disk. The stations are located in large, homogeneous areas and were selected to cover a wide range of climatic and surface conditions.
Remotesensing 08 00410 g001
Figure 2. African Land Surface Temperature (LST) validation stations: (a) Dahra, Senegal; (b) Gobabeb, Namibia; and (c) Farm Heimat, Namibia (Kalahari, rainy season). Whereas the land cover at Gobabeb is quasi-static, the grass cover fractions at Dahra and Farm Heimat exhibit a strong seasonality. The station locations and some of their significant aspects are provided in Table 1.
Remotesensing 08 00410 g002
Figure 3. Variation of individual and total uncertainties in 2010 for Gobabeb, Namibia. The legend above gives the color of each uncertainty while their meaning is explained in Table 2.
Remotesensing 08 00410 g003
Figure 4. Land Surface Analysis (LSA) Satellite Application Facility (SAF) LST and in-situ for May 2011 for KIT station “Dahra”. Blue circles: LSA SAF LST. Black crosses: in-situ LST. Red triangles: LSA SAF LST—in-situ LST.
Remotesensing 08 00410 g004
Figure 5. LSA SAF LST against Dahra in-situ LST (blue circles: nighttime, red circles: daytime): November 2010 (a); March 2011 (b); and May 2011 (c).
Remotesensing 08 00410 g005
Figure 6. Monthly statistics at Dahra station, Senegal, for LSA SAF LST: subplots show results for: (a) all data; (b) night; and (c) day. Monthly bias (red triangles) and RMSE (blue circles) refer to the left y-axis, the number of match-ups (grey bars) to the right y-axis. The red (blue) line corresponds to the bias (RMSE) estimated over the whole period. Dotted black line: reference target accuracy of 2 °C for LSA SAF LST.
Remotesensing 08 00410 g006
Figure 7. LST for May 2011 over KIT station “Gobabeb”. Blue circles: LSA SAF LST, black crosses: in-situ LST, red triangles: LSA SAF LST—in-situ LST.
Remotesensing 08 00410 g007
Figure 8. LSA SAF LST against Gobabeb in-situ LST (blue circles: nighttime, red circles: daytime): May 2011 (a); August 2011 (b); and November 2011 (c).
Remotesensing 08 00410 g008
Figure 9. Monthly statistics at Gobabeb station, Namibia, for SAF LST: subplots show results for: (a) all data; (b) night; and (c) day. Monthly bias (red triangles) and RMSE (blue circles) refer to the left y-axis, the number of match-ups (grey bars) to the right y-axis. The red (blue) line corresponds to the bias (RMSE) estimated over the whole period. Dotted black line: reference target accuracy of 2 °C for LSA SAF LST.
Remotesensing 08 00410 g009
Figure 10. LST for May 2011 over KIT station Farm Heimat. Blue circles: LSA SAF LST, black crosses: in-situ LST, red triangles: LSA SAF LST—in-situ LST.
Remotesensing 08 00410 g010
Figure 11. LSA SAF LST against Farm Heimat in-situ LST (blue circles: nighttime, red circles: daytime): May 2011 (a); August 2011 (b); and November 2011 (c).
Remotesensing 08 00410 g011
Figure 12. Monthly statistics at Farm Heimat, Namibia: subplots show results for: (a) all data; (b) night; and (c) day. Monthly bias (red triangles) and RMSE (blue circles) refer to the left y-axis, the number of match-ups (grey bars) to the right y-axis. The red (blue) line corresponds to the bias (RMSE) estimated over the whole period. Dotted black line: reference target accuracy of 2 °C for LSA SAF LST.
Remotesensing 08 00410 g012
Table 1. Locations and significant aspects of the three validation stations shown in Figure 2.
DahraGobabebFarm Heimat
LocationSenegal; Lat: 15.402, Lon: −15.443Namibia; Lat: −23.551, Lon: 15.051Namibia; Lat: −22.933, Lon: 17.992
Elevation45 m450 m1380 m
Climate ZoneSub-tropical, hot semi-aridDesertSemi-Desert
Land CoverGrassland; 96% sand/grass, 4% treeBaren; 75% sand/gravel, 25% dry grassSavanna; 63% soil/grass, 37% tree/bush
Table 2. Error sources considered in estimating total in-situ LST uncertainty.
VariableUncertainty TypeMagnitude
εrandom±0.015
BTLrandom±0.3 °C
BT’Srandom±0.3 °C
tWsystematic−0.045
Table 3. Mean multi-annual biases and root mean square errors for Dahra, Gobabeb, and Farm Heimat. The values in brackets for Dahra give the results for dry seasons only (November–April).
StationBias (°C)RMSE (°C)
All DataNightDayAll DataNightDay
Dahra−2.0 (0.0)−1.5 (0.4)−2.6 (−0.6)3.2 (1.4)2.5 (1.1)4.1 (1.7)
Gobabeb0.1−0.50.61.61.41.8
Heimat0.10.7−0.51.21.31.2

