1. Introduction
Multi-temporal data acquisition is required in many research and application fields. Examples include building construction monitoring [
1], change detection analyses [
2,
3], disaster management to identify damaged areas [
4] and digging works to study archeological sites [
5].
Different approaches have been adopted by the scientific community for scene monitoring. Some of them exploit airborne laser scanning [
6] or combine images and GIS (Geographic Information System) tools [
7] to detect changes.
However, images can provide colored georeferenced ortho-images, surface models and point clouds which allow a more comprehensive understanding of the scene. For this reason, a lot of research in the last decade has been concentrated on using both terrestrial and aerial data to achieve reliable results with photogrammetric approaches, especially in the field of construction industry [
8], disaster monitoring [
9,
10], urban development, documentation of archaeological sites [
11,
12] and agriculture and natural resources management [
13]. All these works use images from single epochs as the acquisition of data in multiple epochs is expensive and rather impractical using conventional manned flights. Terrestrial acquisitions are time consuming and dangerous to carry out on a construction site and it might be impossible to capture data in inaccessible areas.
During the last years we have witnessed a rapid improvement in the UAVs (Unmanned Aerial Vehicles) hardware and software that have led to a massive use of these acquisition systems for geospatial applications. In literature a lot of work can be found related to the benefits given by such systems for photogrammetry and remote sensing applications [
14,
15,
16,
17,
18]. The main motivation in their use is often related to their straight-forward and affordable data acquisition and processing for 3D modelling and map generation. This is especially due to the development of sophisticated image processing pipelines based on SfM (Structure from Motion, [
19]) which facilitate the photogrammetric processing of big image datasets and the use of cheap and mass-market cameras.
Since monitoring applications require repetitive acquisitions, they can be performed in a convenient way using UAVs able to operate at lower altitude and to provide high resolution and multi-view data [
20]. These systems allow the development of high quality and low-cost projects and they have been investigated also for multi-temporal analyses [
21,
22,
23]. The user can easily chose different flight parameters and the same area can be flown as often as possible and as long as the weather is favorable, i.e., a very high temporal resolution can be realized easily.
The open problem is still the use of these multi-temporal data, in particular regarding the need to have several epochs geometrically co-registered. UAVs are equipped with a GNSS receiver for the navigation and most of them are also able to use this sensor to geo-tag the images. However, most of the commercial solutions are not able to provide accurate georeferencing data as they just use code-signal receivers. In these cases, the collection of external Ground Control Points (GCPs) is required for the registration phase if a precise high accurate final co-registration is required between the epochs. The use of GCPs is often unpractical since it requires fieldwork operations that are time consuming, costly and, in some cases, very difficult or even impossible due to the presence of inaccessible or dangerous areas. Then, if the points were previously acquired and they are still available in the multi-temporal scenarios, the process of incorporating them in the registration requires manual and time consuming intervention of the user.
UAVs with RTK (Real Time Kinematic) based positioning have been recently introduced into the market, showing georeferencing accuracies of few centimeters. Although these accuracies are sufficient for most of the applications [
24], the registration of multi-temporal epochs might need a refinement as well, especially due to the fact that RTK UAVs usually do not have metric cameras on board [
19] and the images require a self-calibration process where IO (interior orientation) and EO (exterior orientation) parameters correlation can lead to additional effects. Then, GNSS provides only the projection center, and a photogrammetric process is anyway needed to co-register the images. Some ground truth is advised even for those advanced devices [
25,
26,
27] because of possible systematic errors, e.g., caused by camera triggering uncertainties. An image-based approach as proposed here has the advantage to be independent from any hardware and system requirement.
During the years a lot of research was made in the field of image registration, also in multi-temporal scenarios. Zitova and Flusser [
28] presented a review on image registration methods dividing them according to the image registration procedure. Sheng et al. [
29] provided an automatic way to register hydrological images based on the extraction of lakes centroids from satellite images. Behling et al. [
30] detected landslides using the alignment of orthorectified data from optical satellite remote sensing images. Zhao and Goshtasby [
31] used aerial optical images to perform a registration based on line features. The registration procedure was also applied to merge satellite and aerial remotely sensed images in Wong and Clausi [
32], paying attention to the use of multi-temporal and multi-sensors data. The registration was also investigated providing some solutions to simultaneously register and detect changes in remote sensing data with graphical models [
33]. A two steps procedure based on edge feature matching to first define approximate registration parameters and then refine this with a Maximum Likelihood Estimation Sample Consensus approach is reported in [
34].
In most of the cited papers, low resolution satellite data are used to orient pairs of images. In contrast, the aim of the proposed work is related to the use of high resolution large image blocks from UAVs to perform an image-based registration on multi-temporal datasets. The main goal is to constrain the Bundle Block Adjustment (BBA) of a dataset to be consistent to a reference one. The registration is performed on large image blocks instead of simpler image pairs and the presented method is only based on the use of images from a reference dataset in order to perform a relative registration between epochs. The purpose is to investigate the technique to automate the co-registration of image blocks fixing the interior and exterior orientation parameters of anchor images selected from the reference epoch along unchanged areas. This will avoid the GCPs collection and will allow its incorporation in the SfM processing.
It is worth to mention that the presented co-registration method just solves the relative transformation between epochs but leaves the absolute localization within the mapping datum unknown. If an accurate positioning in the mapping frame is desired, some GCPs in the reference epoch will be still needed to adjust the block accordingly.
The paper is organized as follow: in the second section the proposed procedure is explained in detail; an automatic procedure for the anchor image selection and the way to evaluate the final accuracy is also defined. In
Section 3 a case study is described, including all the tests that were performed to define the best strategy to be used in this kind of scenario. A second dataset is presented in
Section 4 to validate the procedure. Finally, some discussions and conclusions are reported.
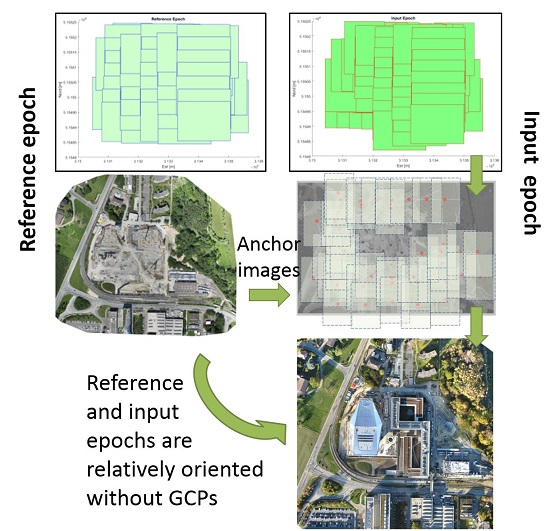
2. The Proposed Approach
The co-registration strategy presented in this paper is based on the use of some oriented images from a reference epoch with fixed orientation parameters to constrain the alignment of the images in the following (slave) epochs. This allows for monitoring and detecting changes in multi-temporal scenarios. Some first tests were performed in [
35] where the registration using only the Exif (Exchangeable Image File Format) file GNSS data was also presented. In this paper, the additional innovative aspects are covered:
- -
The reference image blocks co-registration (RIBC) algorithm: the proposed procedure is based on the use of reference images. Their selection was performed firstly manually in [
35] to validate the procedure using half of the image resolution. In this paper, the full resolution is used and also an automatic image selection is developed to speed up the process and to further reduce the human intervention;
- -
The accuracy evaluation: the accuracy of the BBA is estimated in relation to a synthetic solution (a specifically created solution without ground truth data) since no ground truth is available for the presented cases study. It was built georeferencing all the epochs with GCPs manually extracted from the reference epoch after the BBA. In addition, in this case, more and better distributed GCPs and CPs (Check Points) (with respect to [
35]) are used;
- -
Two different datasets are considered: a building construction site and a post-earthquake damaged area.
2.1. Reference Image Blocks Co-Registration (RIBC)
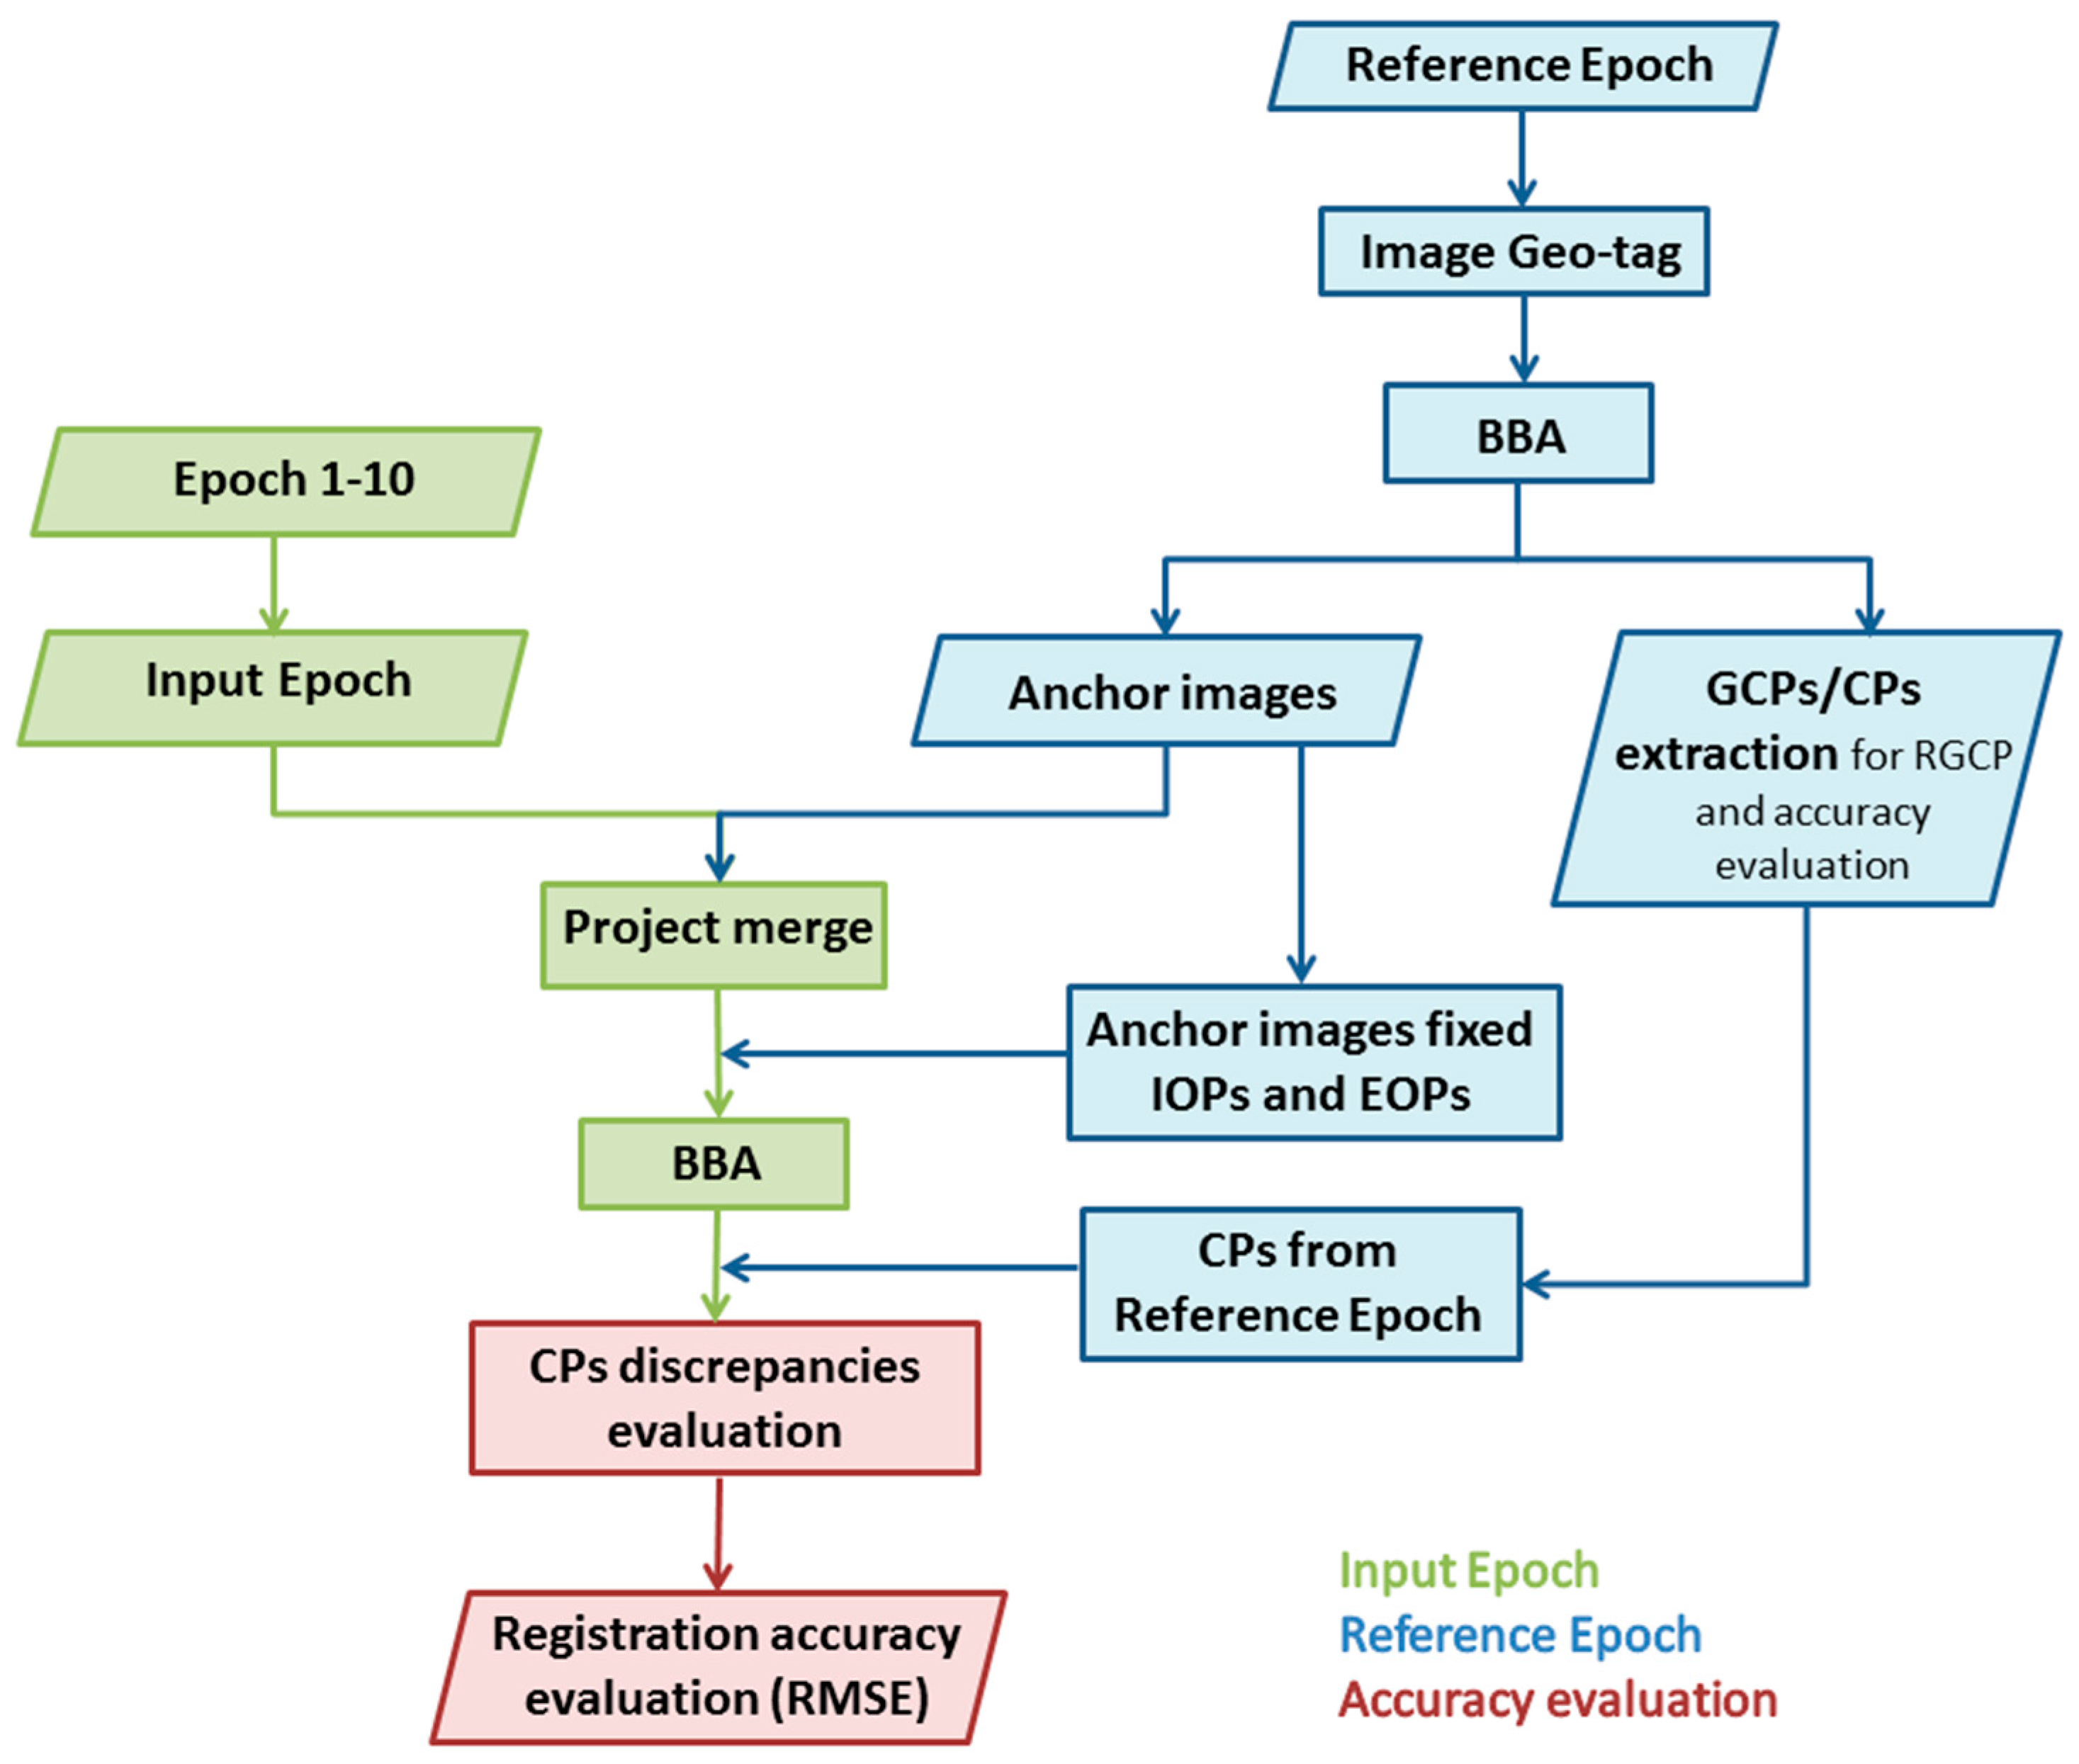
The proposed method exploits photogrammetric algorithms to create multi-temporal orthophotos and DSMs (Digital Surface Models) from images. The current implementation takes advantage of already available software packages. In particular, the Pix4D software is chosen for this task as it is one of the most widespread solutions, well representing the current state of the art in photogrammetry [
36,
37]. Then, the RIBC approach follows these steps (
Figure 1):
One epoch is chosen as reference and the BBA is performed using the GNSS positions registered in the Exif file as input to roughly georeference the block. Alternatively, GCPs can be introduced to guarantee the accurate localization in the mapping frame and to perform the validation. As usual in UAV projects without metric cameras, a self-calibration of interior orientation (IO) parameters of the camera is performed. The full image resolution is used in this phase of the process;
A subset of images from the reference block (anchor images) is selected in correspondence of the stable area, i.e., unchanged regions. These images should be selected in order to be outside the area to monitor and to be useful in the whole multi-temporal process;
Image blocks from a subsequent epoch and from selected anchor images are merged together into a unique block;
The exterior orientation parameters (EOPs) of the images from the reference epoch (anchor images) are then loaded assigning them a higher weight. In terms of bundle adjustment this means that the known EO parameters of the reference epoch are not changed during the BBA, but basically act as constraints;
The camera interior orientation is also treated separately. While the images used for the reference epoch are introduced with fixed IO parameters, the camera parameters of the input epochs are adjusted in the orientation process. The IO and EO parameters of the anchor images are both fixed as they are highly correlated and freeing the IO would modify the solution;
Image matching, initial structure from motion solution and final BBA can be finally performed between the reference and each input epoch images starting from the EOPs of anchor images.
This procedure relies on the successful image matching between anchor images and images of the current epoch. To mathematically solve the problem, two anchor images can provide enough observations to remove the rank defect, but at least 3 non-linearly arranged images should be available in order to have a more stable block geometry. Those anchor images should be in the outer perimeter of the block in order to avoid extrapolation. In the experiment section below a thorough analysis of this problem is performed.
2.1.1. The Automatic Selection of Anchor Images
The manual selection of anchor images can be cumbersome, especially when large datasets are considered, so an automatic selection of these images from the reference epoch is needed.
In principle the non-static (changing) areas in the scene could just be masked out for the tie point matching and then the entire image block from the reference epoch could be chosen as anchor. Experimental tests have shown that a minimum non-changed-area would stabilize the entire process and also maximize the processing speed.
The proposed approach (
Figure 2) can automatically select the reference images from the image block through the matching of local interest features.
The algorithm follows these steps:
A preselection of the images to be compared is initially performed using the Exif files of both the reference and input epochs. In this way, every image from the reference epoch won’t be matched with all the frames in the input data, but only with the approximately overlying images to detect the stable regions. The overlap between images is determined considering their footprint on the ground and it is computed using:
- -
the approximate position given by the GNSS recorded data;
- -
the flight altitude;
- -
the camera specifications: focal length and sensor size.
This allows reducing the amount of time for the processing as the feature extraction and matching will be only executed between images capturing approximately the same area. As shown in
Section 3, different tests were performed to evaluate the correct overlap to use, taking into account the low performance of the GNSS receiver on board the UAV;
- 2.
The Wallis filter is applied to the images in order to increase the number of extracted and matched features. This image enhancement through an adaptive contrast filter [
38] is very helpful with multi-temporal datasets as it allows to reduce the illumination changes among different datasets balancing the contrast and the brightness;
- 3.
Image feature extraction and matching techniques are applied to the selected pairs of images:
- -
The SIFT (Scale-invariant feature transform) [
39] operator is used to detect the features on the full resolution images;
- -
The features are then matched to define the corresponding pairs of keypoints;
- -
The Lowe ratio test is applied to firstly remove the outliers [
39]. The ratio of distance from the closest neighbor to the distance of the second closest is considered and all the matches whose distance ratio is greater than 0.8 are rejected according to the original implementation of this algorithm. From the experimental tests (presented by Lowe in [
39]) this method demonstrated to eliminate about 90% of false matches while discarding less than 5% of the correct matches;
- -
The fundamental matrix is estimated using the pairs of corresponding points. The RANSAC—(RANdom-SAmple Consensus) is adopted to exclude outliers;
- -
The presence of outliers is further verified computing the epipolar lines. The distance of each point from the epipolar line (de) is estimated and the points whose distance is larger than the used threshold (2 pixels) are excluded.
At the end of these steps, a set of points is recorded;
- 4.
The extracted points give information about the unchanged area on the considered stereo-pair. If the area is dynamic, no (or very few) points will be preserved after the filtering steps described above. On the other hand, a higher number of points will still be matched on both images in correspondence of unchanged regions. The Alpha Shape algorithm [
40] is employed to earmark those areas and to build polygons from a set of points: a distance constraint (
dα) is adopted to discard isolated points and limit possible overestimations of the overlap area;
- 5.
The anchor images selection is finally performed imposing a threshold tA: an image is selected if its Alpha Shape defines an area bigger than tA. This allows to select only the images in the unchanged area and to remove the data in the construction site.
2.2. Accuracy Evaluation
The proposed RIBC procedure is designed to be fully automatic, without the introduction of tie points for the image orientation. The best way to evaluate the accuracy of this approach would be the use of Check Points topographically measured on the ground (i.e., using a total station or a GNSS receiver) with high accuracy. This is not possible in the proposed case studies since the images were provided to us without a ground reference.
For this reason, we built a synthetic reference solution. Well distributed points are manually collimated (to avoid the introduction of errors in the procedure evaluation) in the reference epoch after the BBA. Features visible in all the datasets are used as GCPs to register the other input epochs to the reference one (reference GCP-based co-registration—RGCP). This process is adopted to perform a block registration simulating the conventional photogrammetric procedure using real ground points.
The achieved results constitute a reference frame to evaluate the RIBC procedure by using the CPs derived from the reference epoch: the differences of the CPs coordinate in the image-based and the point-based approaches are used to determine statistical parameters, such as the root mean square error (RMSE), and to evaluate the accuracy of the different Bundle Block Adjustments. This evaluation strategy is not able to identify and quantify possible block deformations, but it is useful to evaluate the relative registration between epochs which is important in the evaluation of local changes.
3. Experimental Study: A Building Construction Site
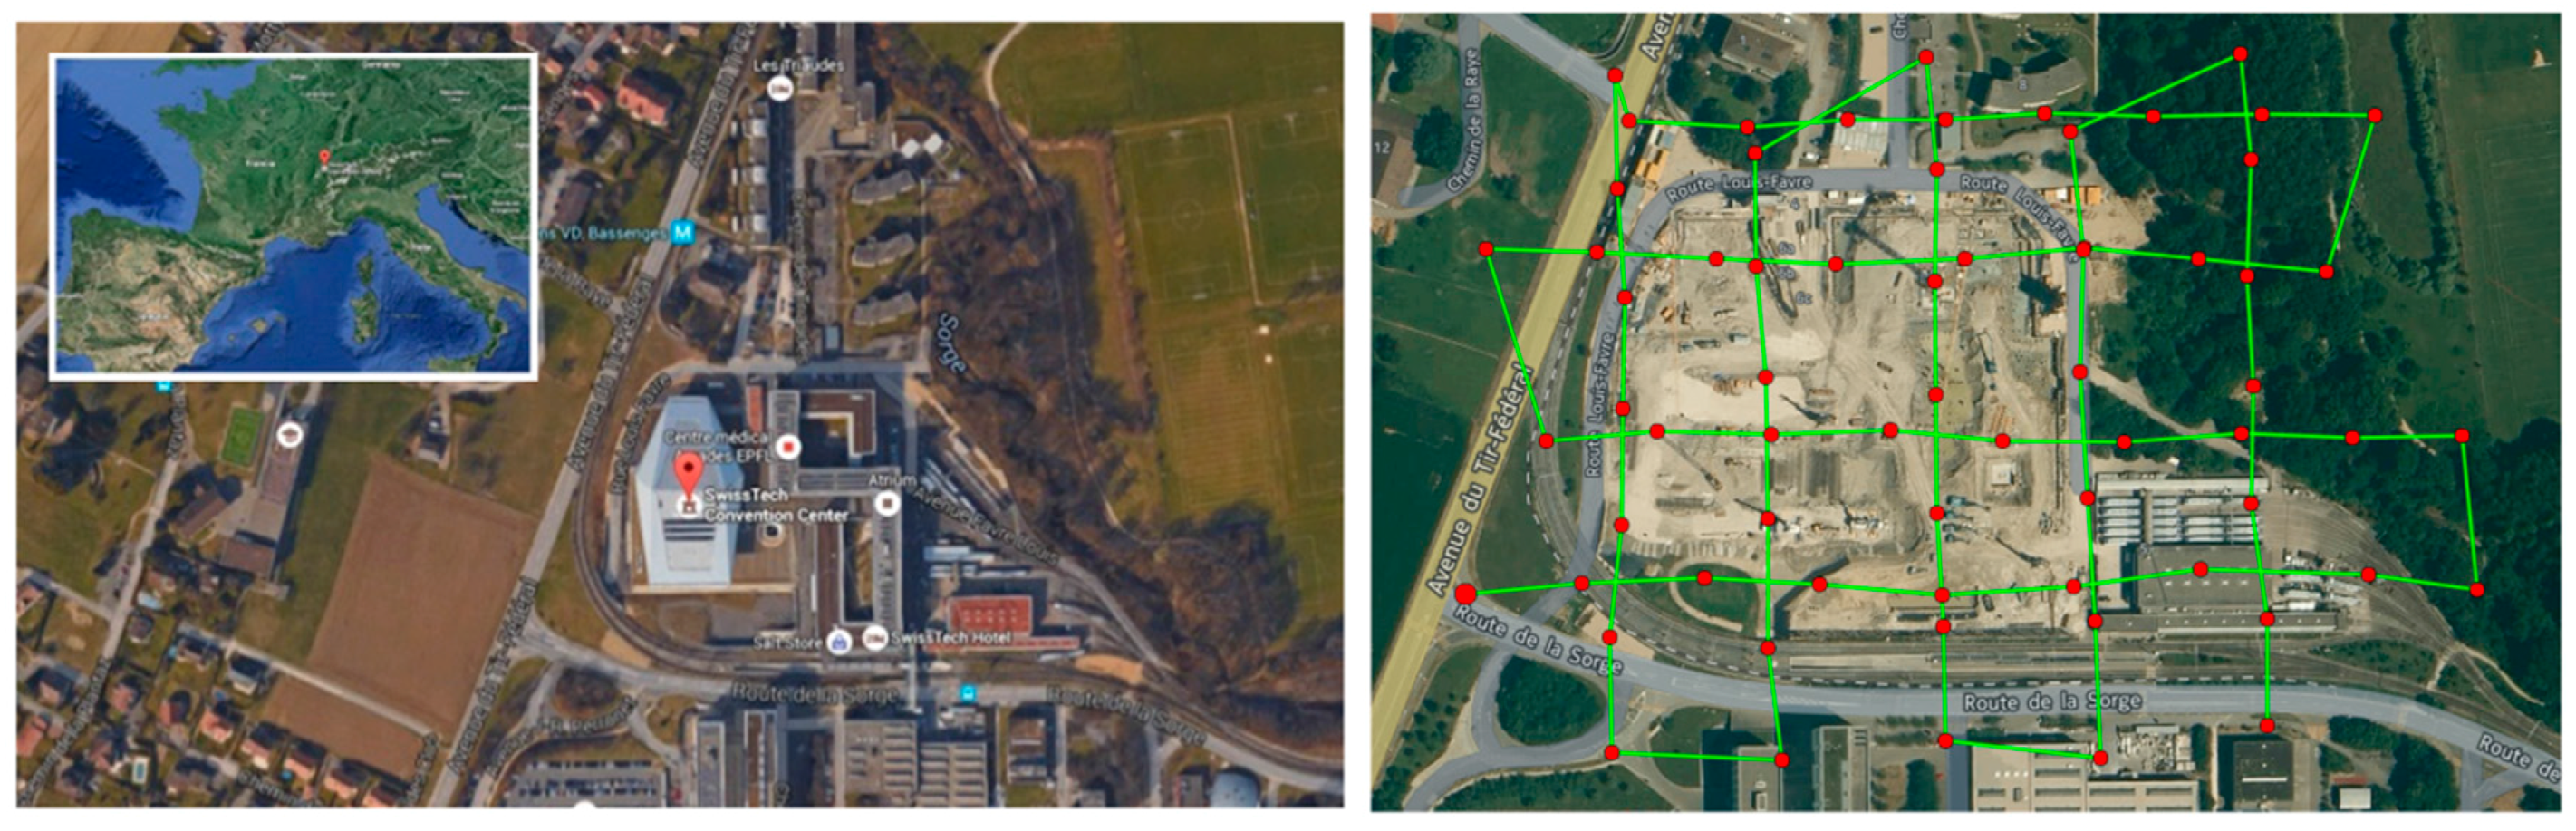
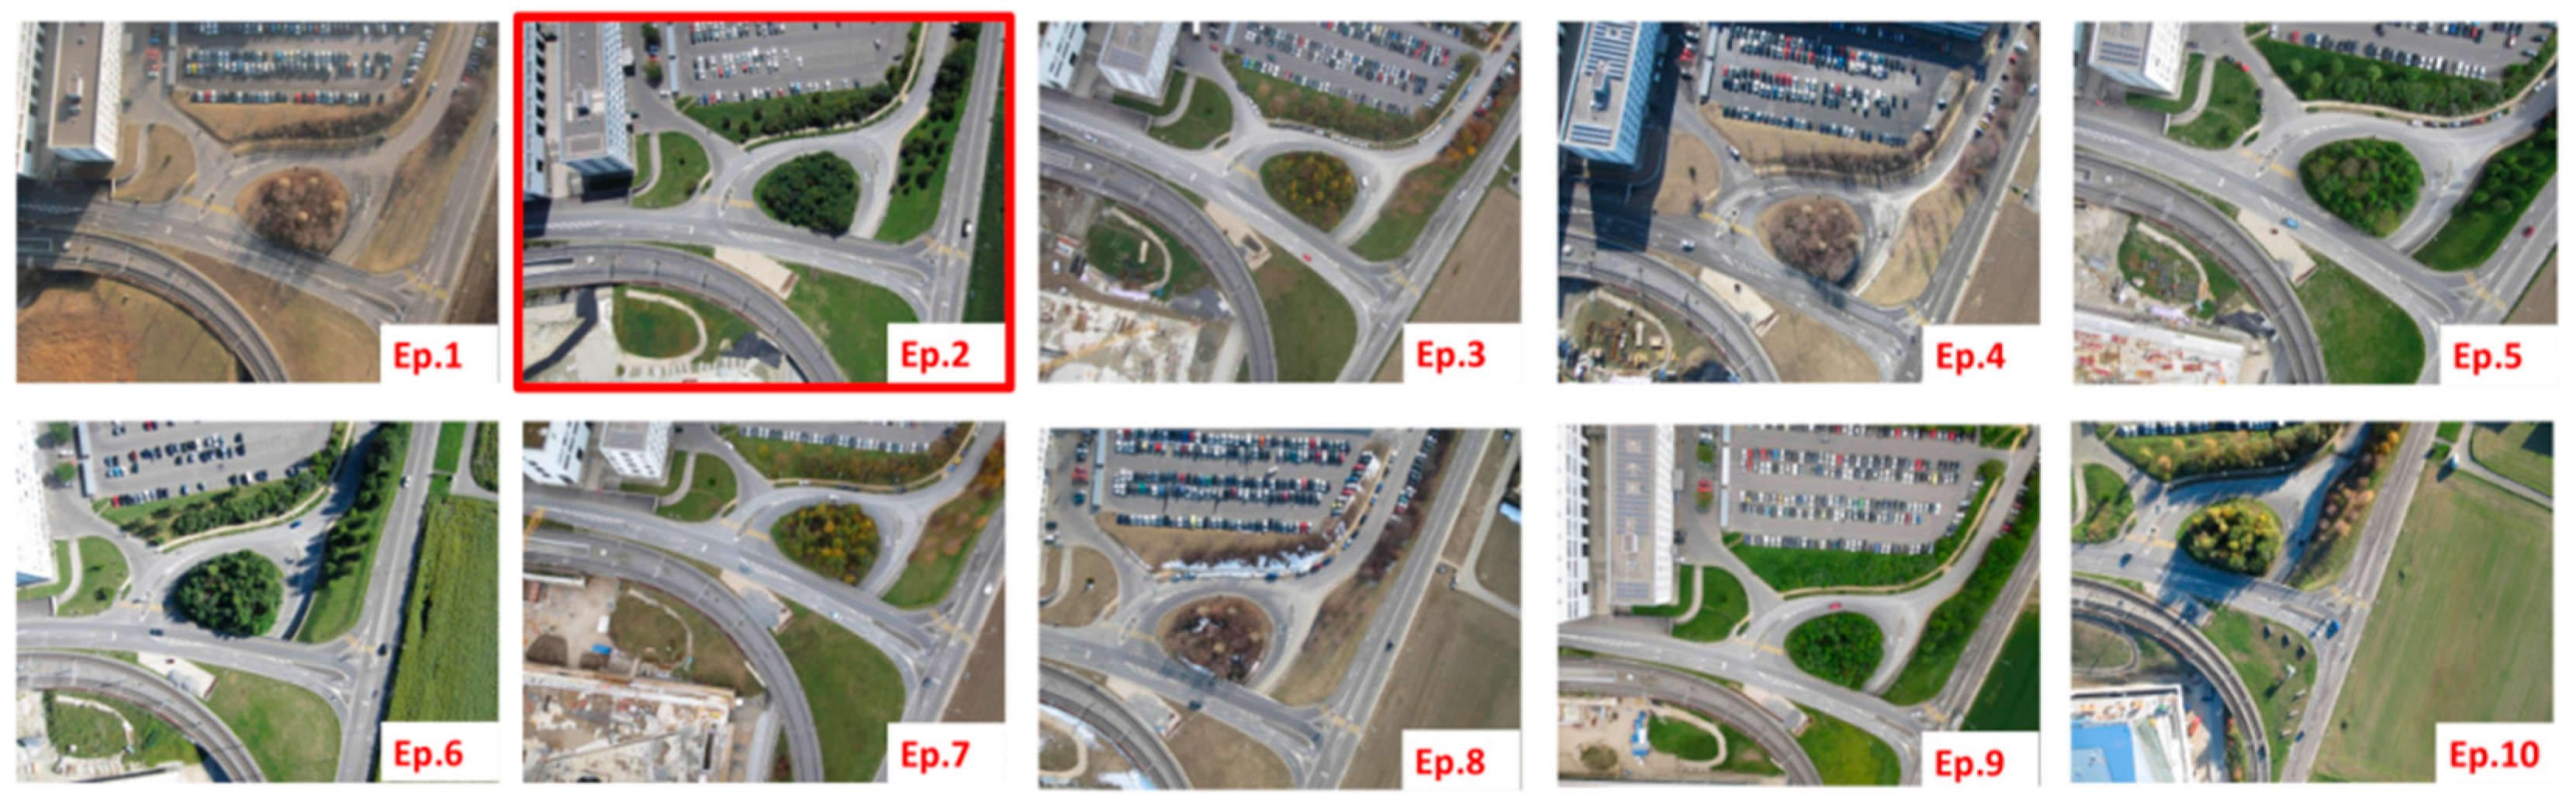
The proposed method was evaluated considering 10 multi-temporal block images acquired by the Pix4D company over a 3 year period on the construction of the EFPL’s SwissTech Convention Center in Lausanne, Switzerland (
Figure 3). The flights were executed to have a complete temporal coverage of the building and to monitor its development for change detection purposes. The aerial surveys were performed with a very lightweight (less than 500 g) UAV, the eBee by SenseFly. This fixed-wing platform carries a consumer grade GNSS receiver and it can fly for about 30–40 min under low wind conditions. Its payload is about 125 g and it can house on board a consumer camera with an automatic input for the camera trigger. Two different cameras were adopted (
Table 1) in this case study. The data acquisition was performed with a photogrammetric approach considering forward (80%) and side (60%) overlaps between images and performing the flights along two orthogonal directions (see
Figure 3). All the images of each epoch were taken during the same flight, acquiring between 60 and 160 images in each mission. The approximate georeferencing parameters were provided by the on-board GNSS, geo-tagging the image exposures during the flight and storing these data in the Exif file.
The Pix4D software was adopted for the image orientation task [
41]. It allows to perform all the steps of the RIBC approach: image orientation and calibration, project merge with fixed IO/EO parameters of the anchor images, accuracy evaluation with check points and DSMs (Digital Surface Models) generation for visual and model evaluation. The accuracy of the proposed procedure in the relative image orientation was evaluated through different tests:
All input epochs were registered using the RGCP approach: 15 GCPs were used to constitute the reference results for the RIBC method. All the mentioned points were initially extracted from the reference epoch;
All input epochs were registered using the RIBC manual approach, i.e., performing a manual selection of anchor images. Eleven CPs were used in each test for the accuracy assessment and the results were compared to those obtained with the RGCP method;
All input epochs were registered using the RIBC automatic approach where the selection of the anchor images is performed automatically. Eleven CPs were used for the accuracy assessment and to compare the results obtained by different strategies.
3.1. Reference Ground Control Point-Based Co-Registration (RGCP)
Since no ground truth was available in this specific case study, a synthetic solution was created as described in
Section 2 to evaluate the final RIBC accuracy.
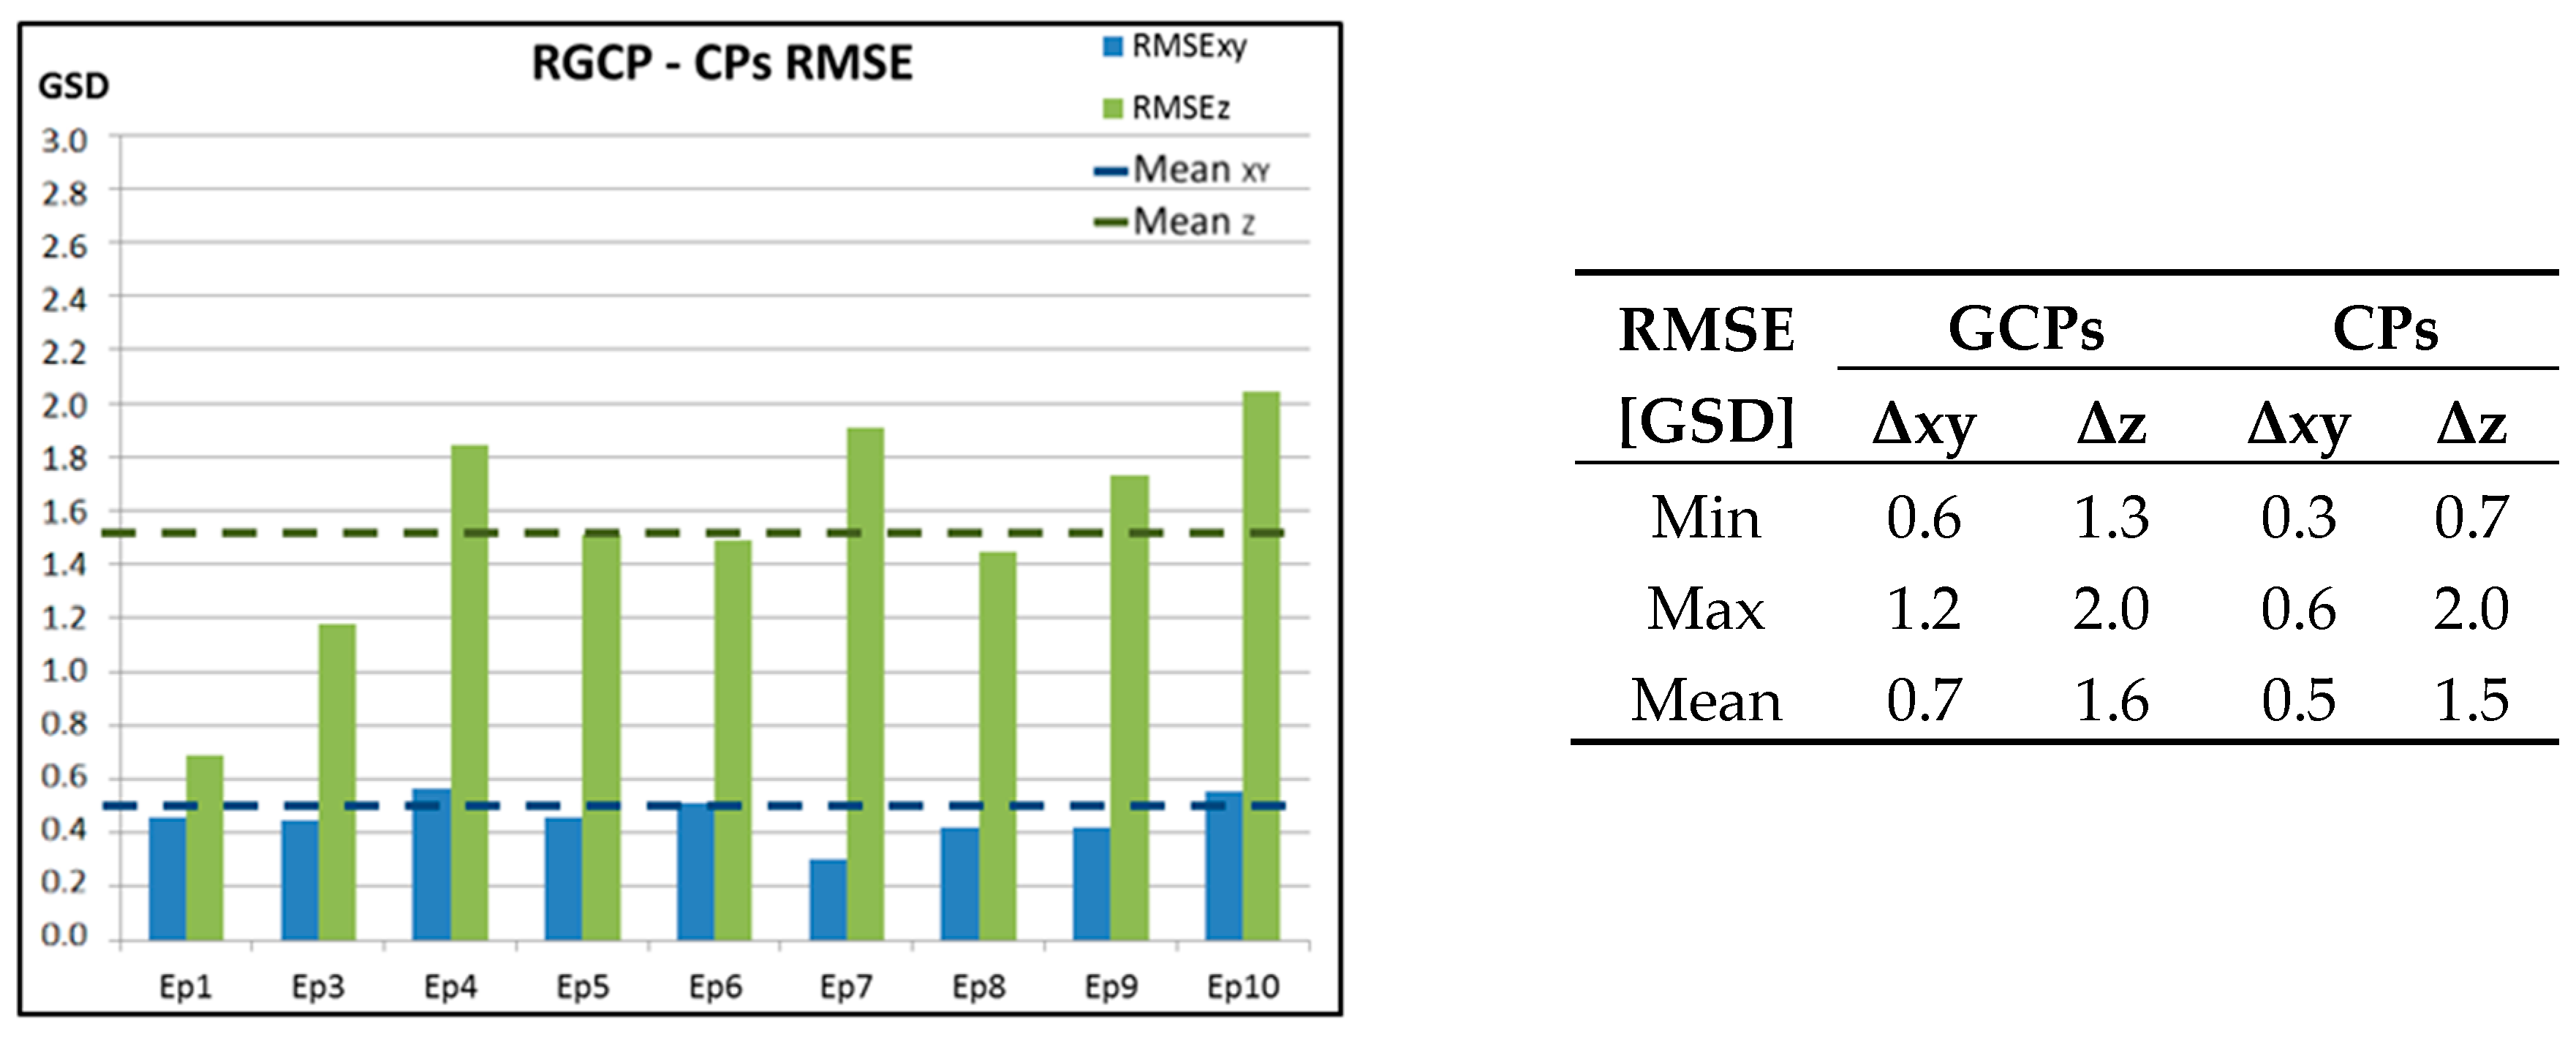
Figure 4 shows the results of the estimated RMSE between the reference epoch and all the input datasets (processed with the full resolution) registered using GCPs from the reference epoch. All the RMSE are provided as multiples of the GSD (Ground Sample Distance) size, which is 4.5 cm.
These data constitute the reference solution for the validation of the RIBC procedure. Since the points are not retrieved by independent ground measures, the accurate scale cannot be estimated and possible block deformation cannot be detected, as well. Within this possibly deformed block the results show that the mean RMSE is less than 1 GSD for the horizontal component and 1.5 GSD for the vertical one. These outcomes are in accordance to the expected accuracy of a conventional photogrammetric approach. Even if a global deformation of the reference epoch might exist, the subsequent epochs show a reasonable accuracy with respect to the latter one.
3.2. Reference Image-Based Co-Registration (RIBC) with Manual Approach
The anchor images were selected manually from the reference epoch around the construction site where no big changes of the acquired scene took place. In these regions, the extracted features are expected to be distinct, well spread all over the image and efficiently detectable in the reference and in the input images [
28]. An example of a reference image and the same area in the input datasets is shown in
Figure 5.
The area around the building construction contains houses and other building in most of the cases, but there are also a lot of vegetation or temporary objects which do not give stable and reliable features among different epochs. Therefore, it is important to select as reference the images with a lot of stable features (on man-made objects) to better constrain the BBA. Starting from the anchor images some tests were performed to evaluate the quality of the achieved results (i) varying the distribution and the number of anchor images in the final registration as well as (ii) the choice of different reference epochs. In order to assess these two issues, the following anchor image configurations have been adopted in the performed tests.
- -
Even distribution of 18 reference images manually selected from the first epoch (forward approach) as reference (
Section 3.2.1);
- -
Even distribution of 18 images manually selected from the last epoch (epoch 10) as reference (backward approach,
Section 3.2.2);
- -
Uneven distribution of 10 images manually selected (described in [
35]);
- -
Sequential approach changing the reference epoch each time (
Section 3.2.3);
- -
Even distribution of 37 reference images manually selected (
Section 3.2.4);
- -
Use of all the reference images as anchor in the other epochs (
Section 3.2.4).
The epoch 2, instead of epoch 1, was chosen as reference in the forward approach as its characteristics are more similar to the other epochs that were captured in almost the same season. In addition, in epoch 1 the vegetation is very brown and different from the data of the other epochs (see
Figure 8). The effect of this kind of changes in the time series will be analyzed in detail below.
3.2.1. Eighteen Evenly Distributed Images, Forward Approach: from Epoch 2 to Epoch 10
As a first test, 18 images from the reference dataset were manually selected and used as anchor for the orientation of the other epochs. The quality of the achieved solution was compared on the CPs as already mentioned in
Section 2.1.
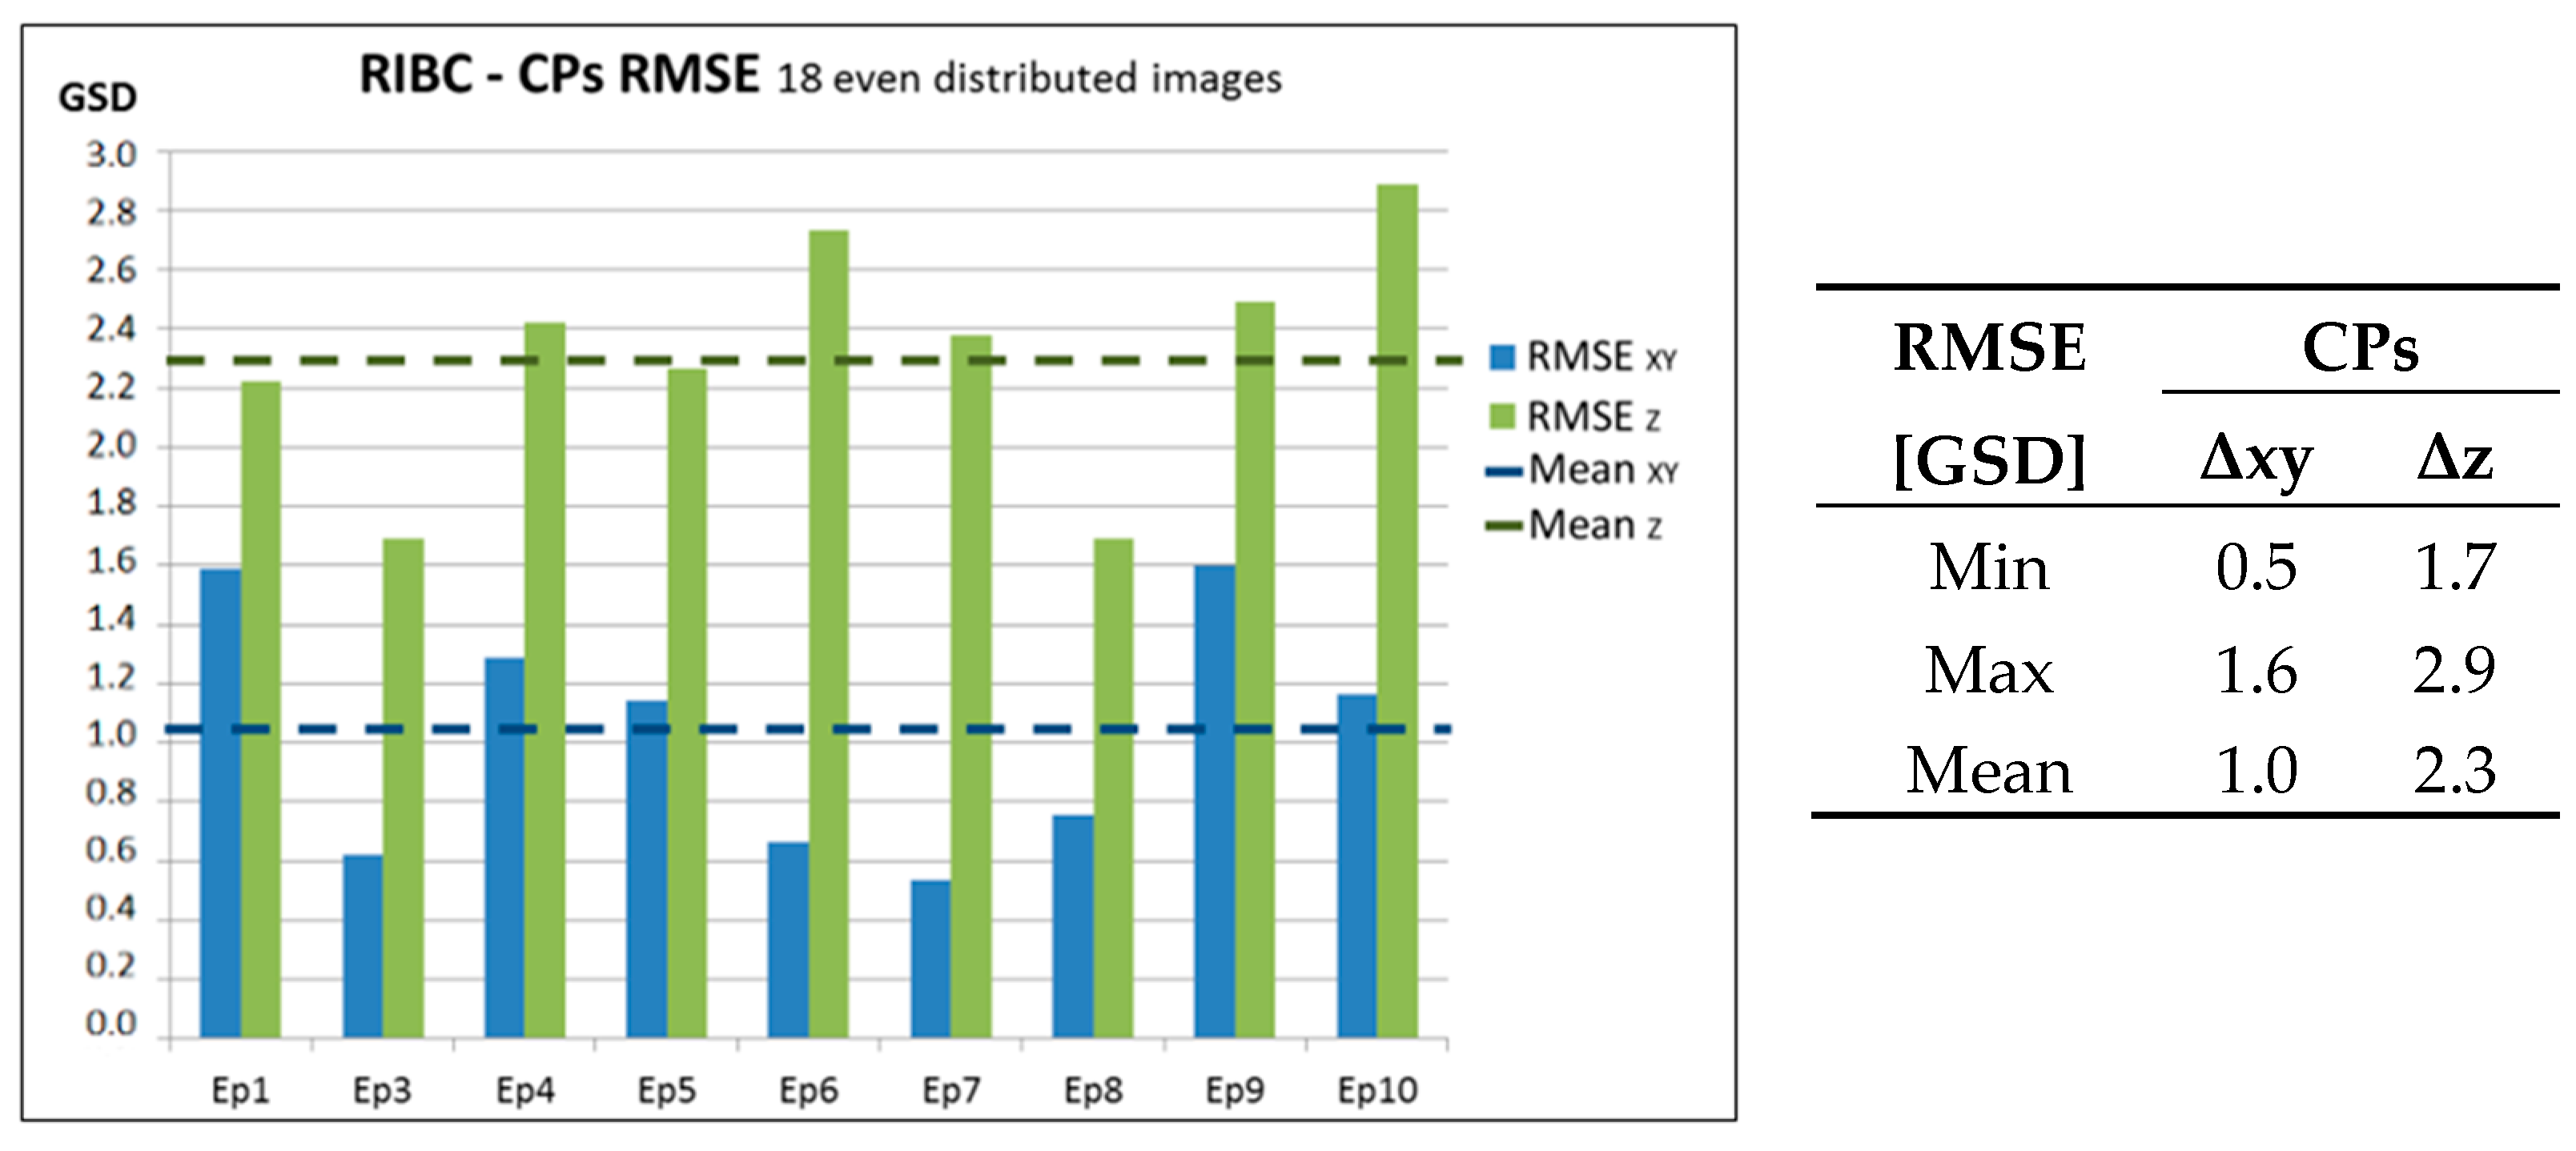
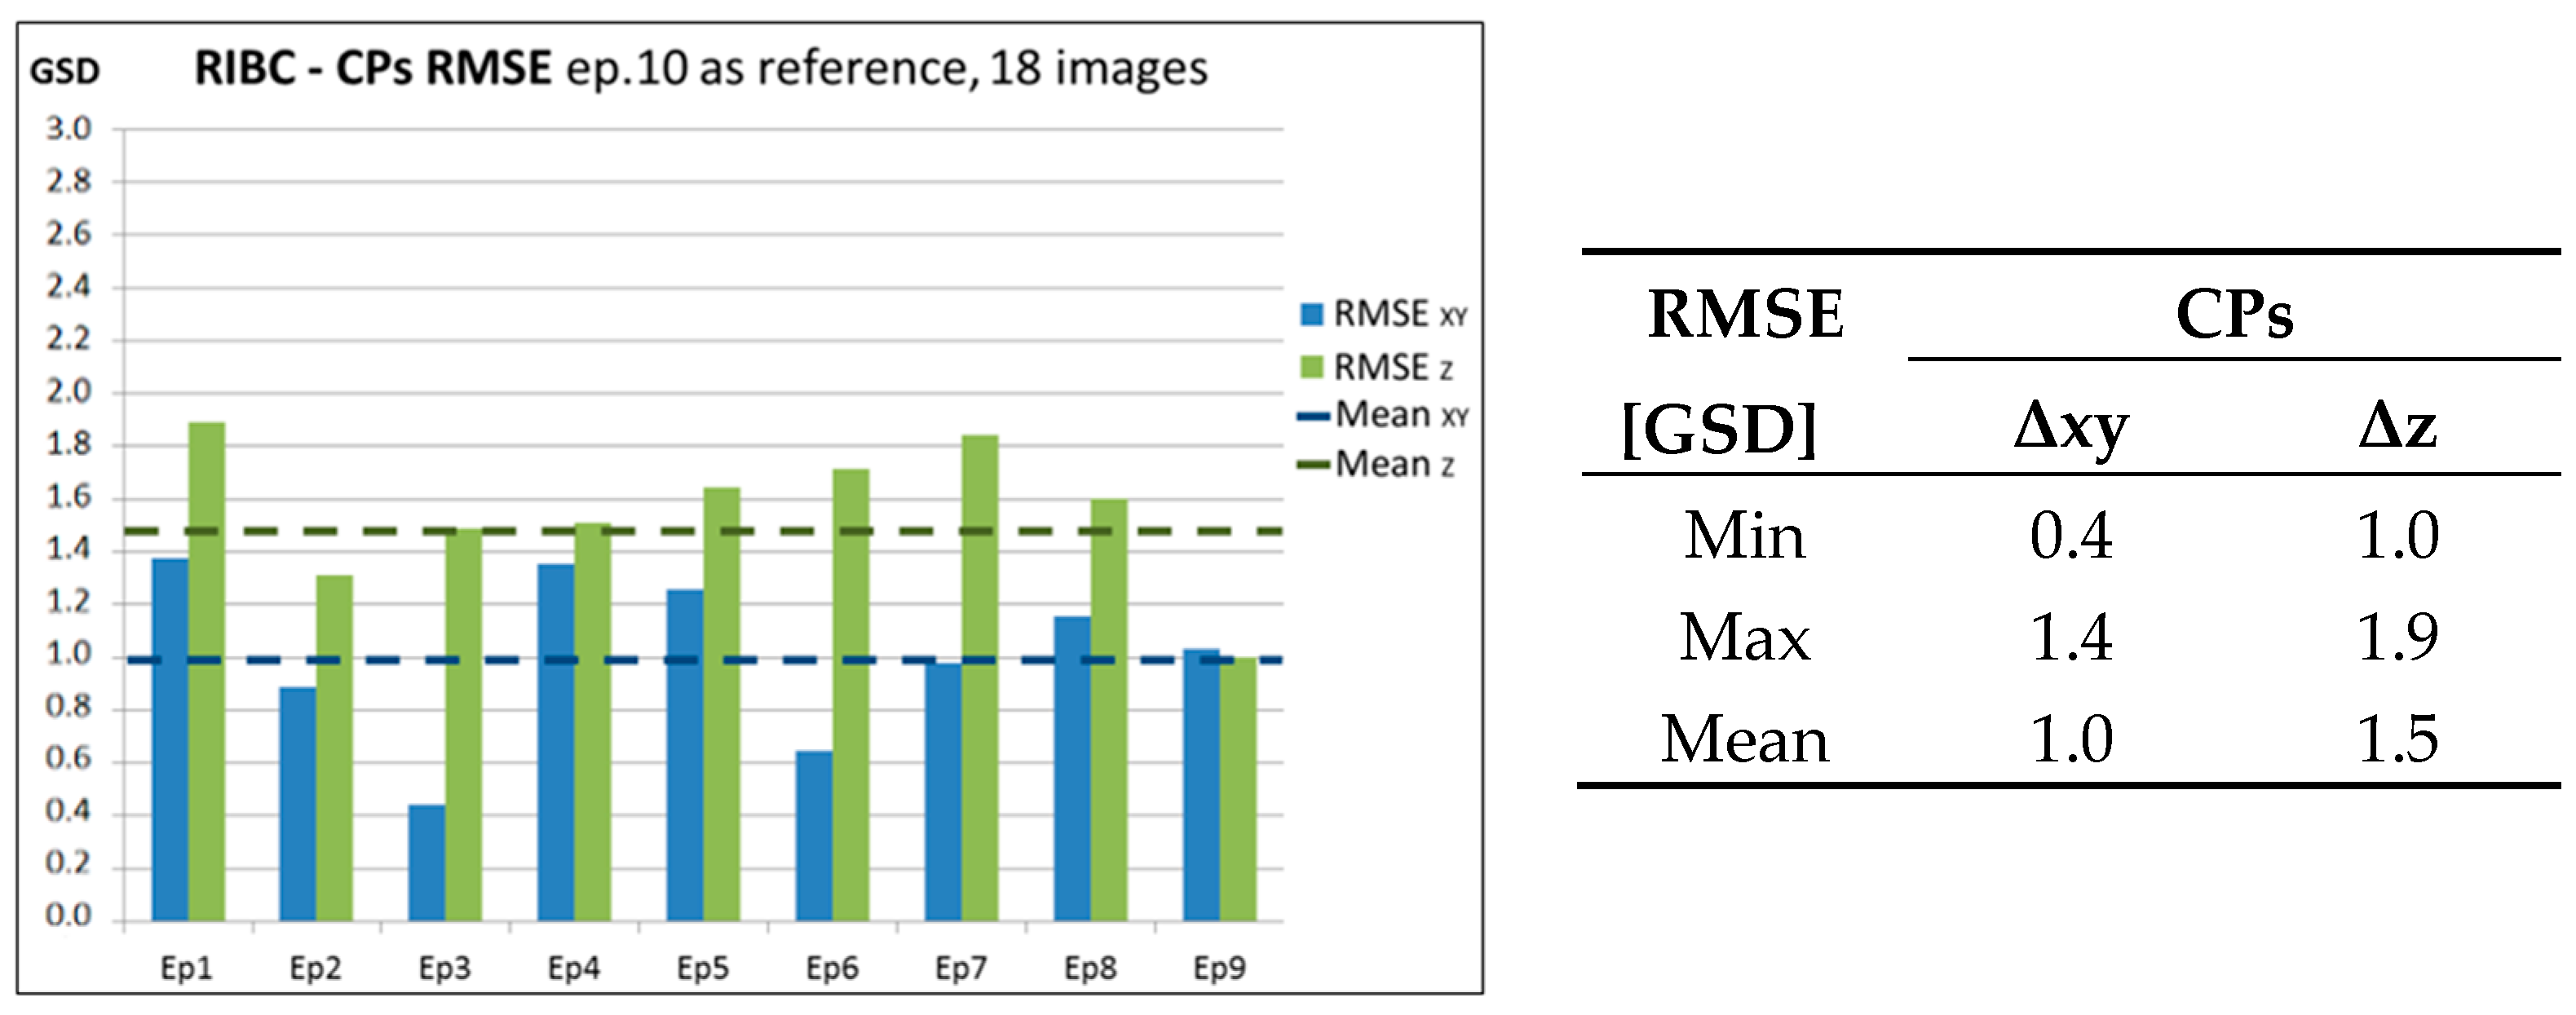
Table 2 shows the results obtained from each epoch with the RIBC approach in comparison to the values estimated from the reference epoch. The results show that the vertical error is bigger than the horizontal one.
Figure 6 shows the results of the estimated RMSE of all the input datasets registered using the anchor images from the reference dataset.
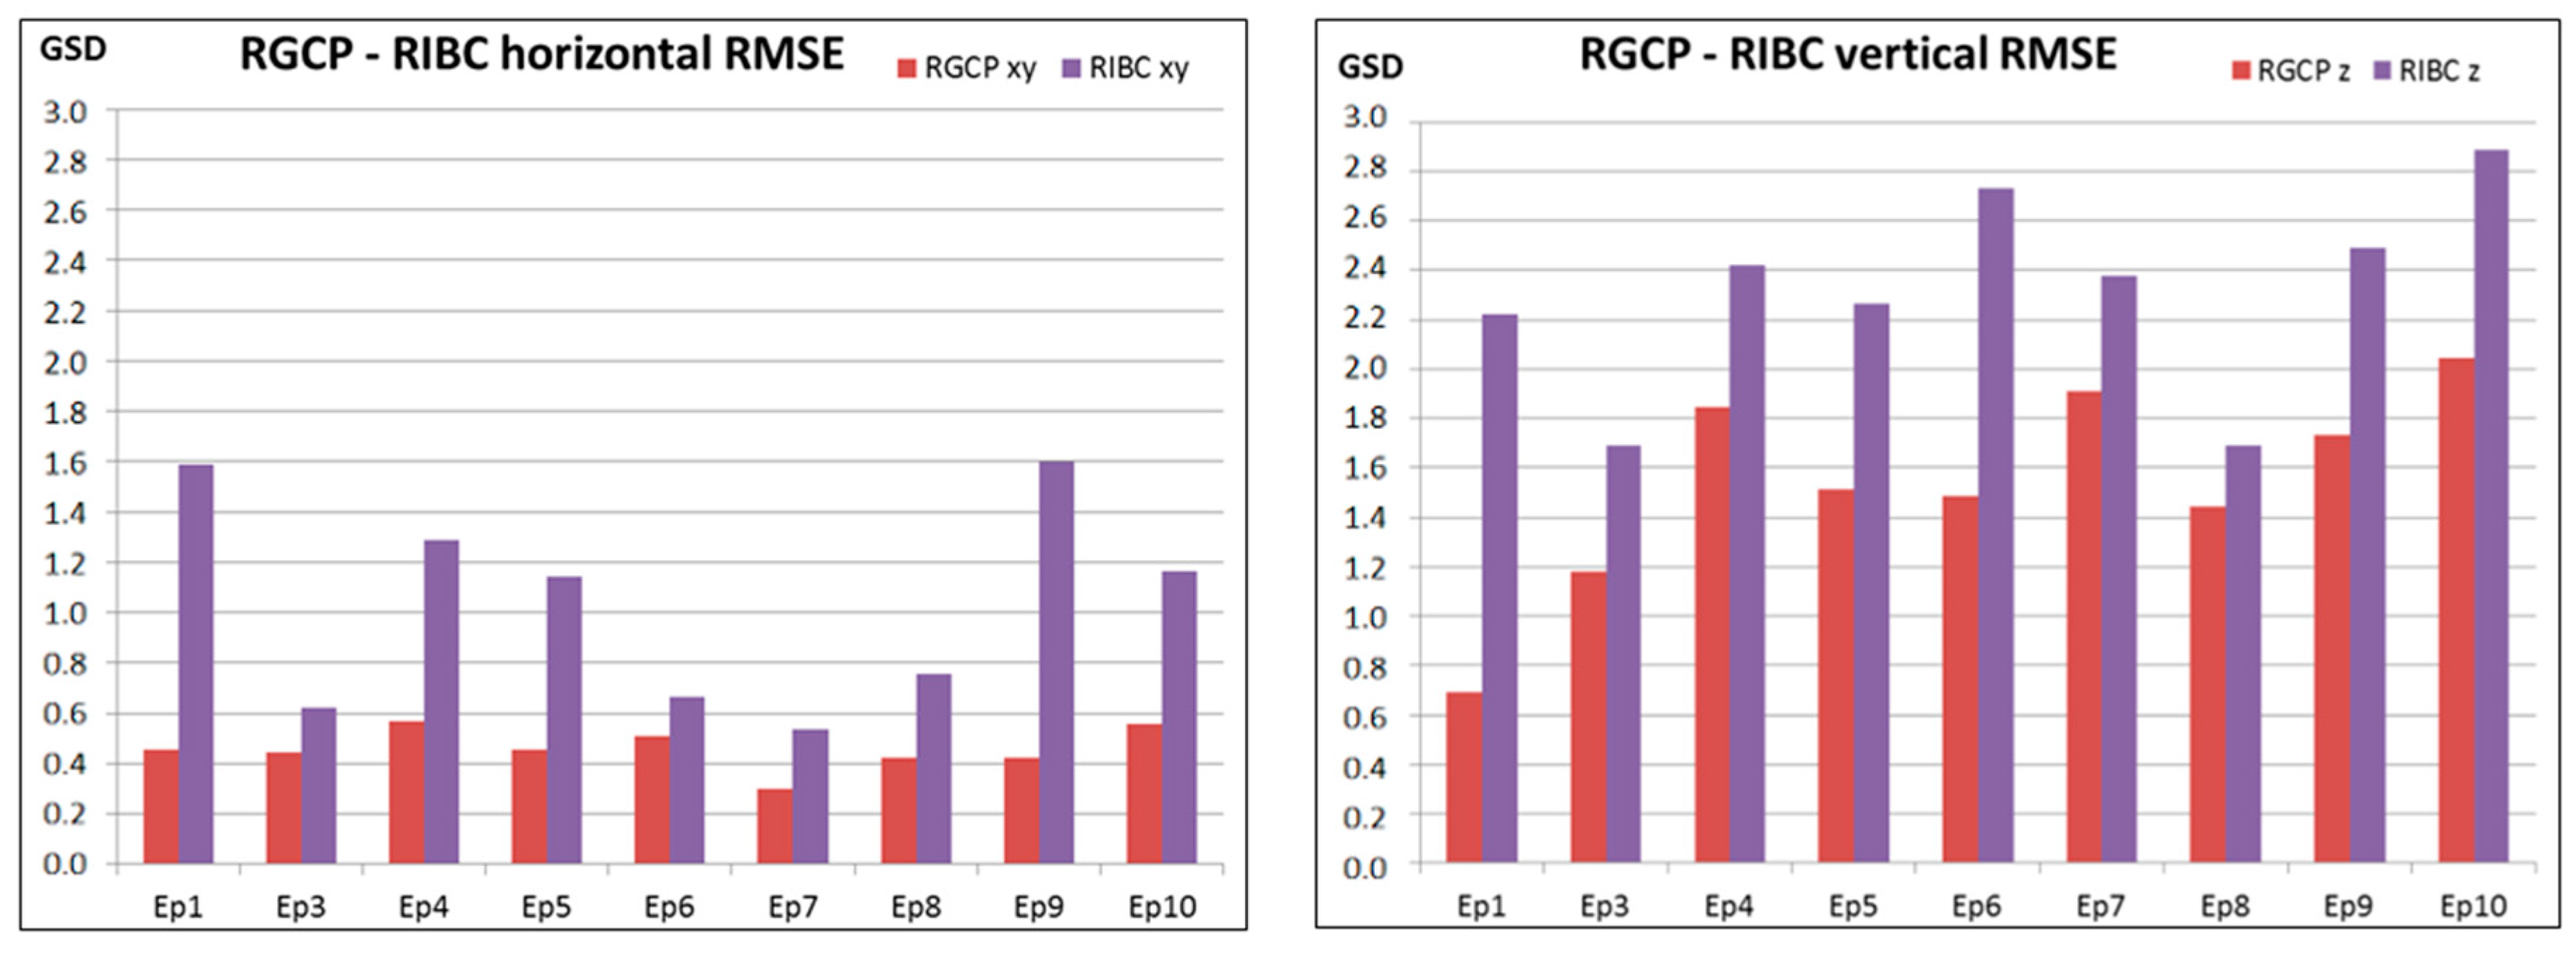
The results show that the proposed procedure is still within the expected photogrammetric tolerances (about 1 GSD in XY and less than 2.5 GSD in Z). The vertical RMSE component tends to be larger than the planimetric one. However, this is still acceptable and not extremely larger than the registration using GCPs. Comparing the results of the RGCP and the RIBC approaches (
Figure 7), it can be observed that the final error of the image-based approach is twice the error of the conventional method with GCPs. The differences (1 GSD) are mainly concentrated in the vertical component.
The results plotted in
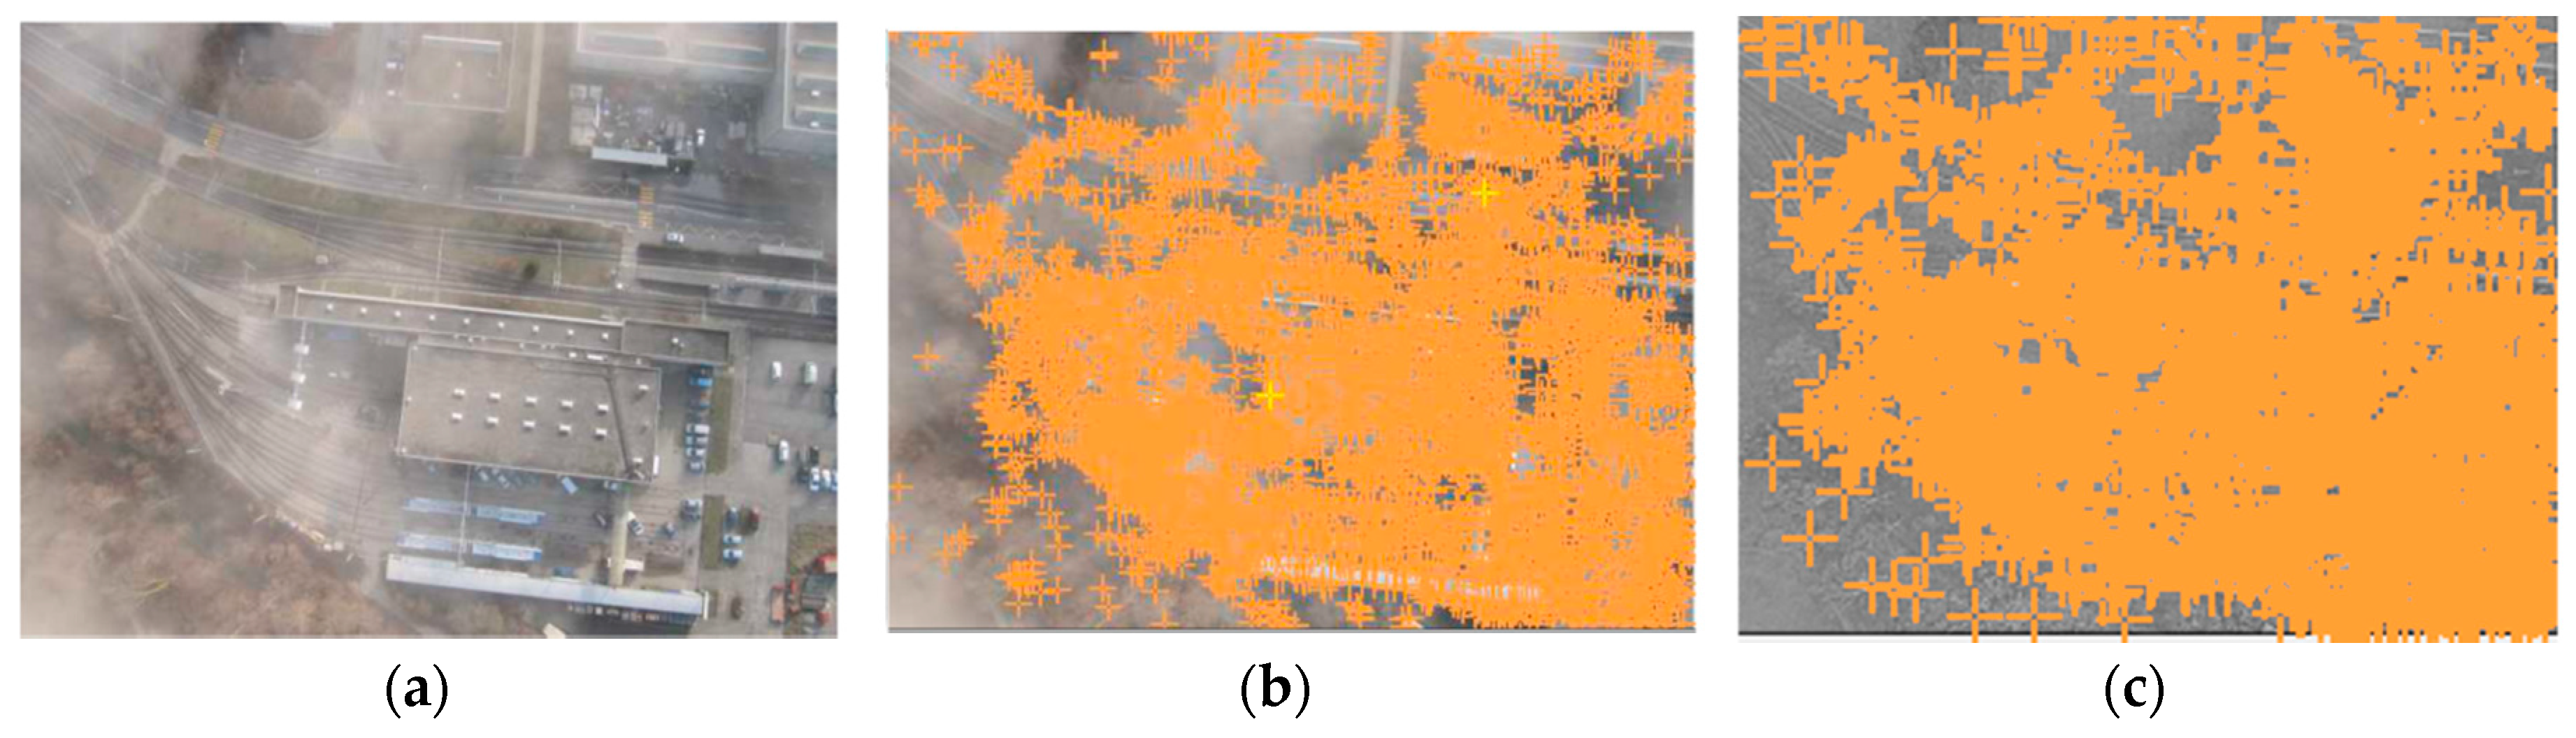
Figure 7 give rise to the assumption that the image quality could influence the final result as the differences from the GCPs approach are mainly due to image matching problems. The use of pre-processing filters (like the Wallis filter) can often mitigate this kind of problems compensating for the differences in image illumination and contrast. As an example, epoch 1 returns bigger errors in both components with respect to the reference solution. This problem is mainly due to the presence of fog during the acquisition phase that led to an uneven distribution of matched keypoints as shown in
Figure 8: the most foggy regions are the one without correct matches.
The final registration quality was improved applying the Wallis filter as pre-processing step. We used an implementation of the filter written by the authors considering the following parameters as suggested in [
38]: window size = 20, target mean value = 127, target standard deviation value = 85, alpha = 0.85, limit = 0.7. This filter enhances the image contrast leading to a larger number of correct matches compared to the original images [
42]. Following this strategy, a clear gain is appreciated (
Table 3) especially in the horizontal accuracy.
Since the proposed approach is based only on the use of images across different epochs, the image quality is the aspect that must be taken care of. This experiment has shown that the employment of the Wallis filter leads to a refinement of the registration results, especially for the horizontal component.
3.2.2. Eighteen Evenly Distributed Images, Backward Approach: from Epoch 10 to Epoch 1
The same co-registration processing was applied using epoch 10 as reference, in order to validate the accuracy and repeatability of the procedure. As in the former case, this epoch was oriented using the geo-tag information and 18 images were manually selected and used as anchor data in the processing of the input datasets.
Figure 9 shows the results obtained by this co-registration process.
The final discrepancy is less than 2 GSD for both components also in this case. Comparing the final RMSE with the results of
Section 3.2.1 (
Figure 10) the horizontal component provides very similar results while the vertical accuracy largely improves. Two main reasons can explain this result: the better distribution of the reference images and the higher quality of the image block of the reference epoch.
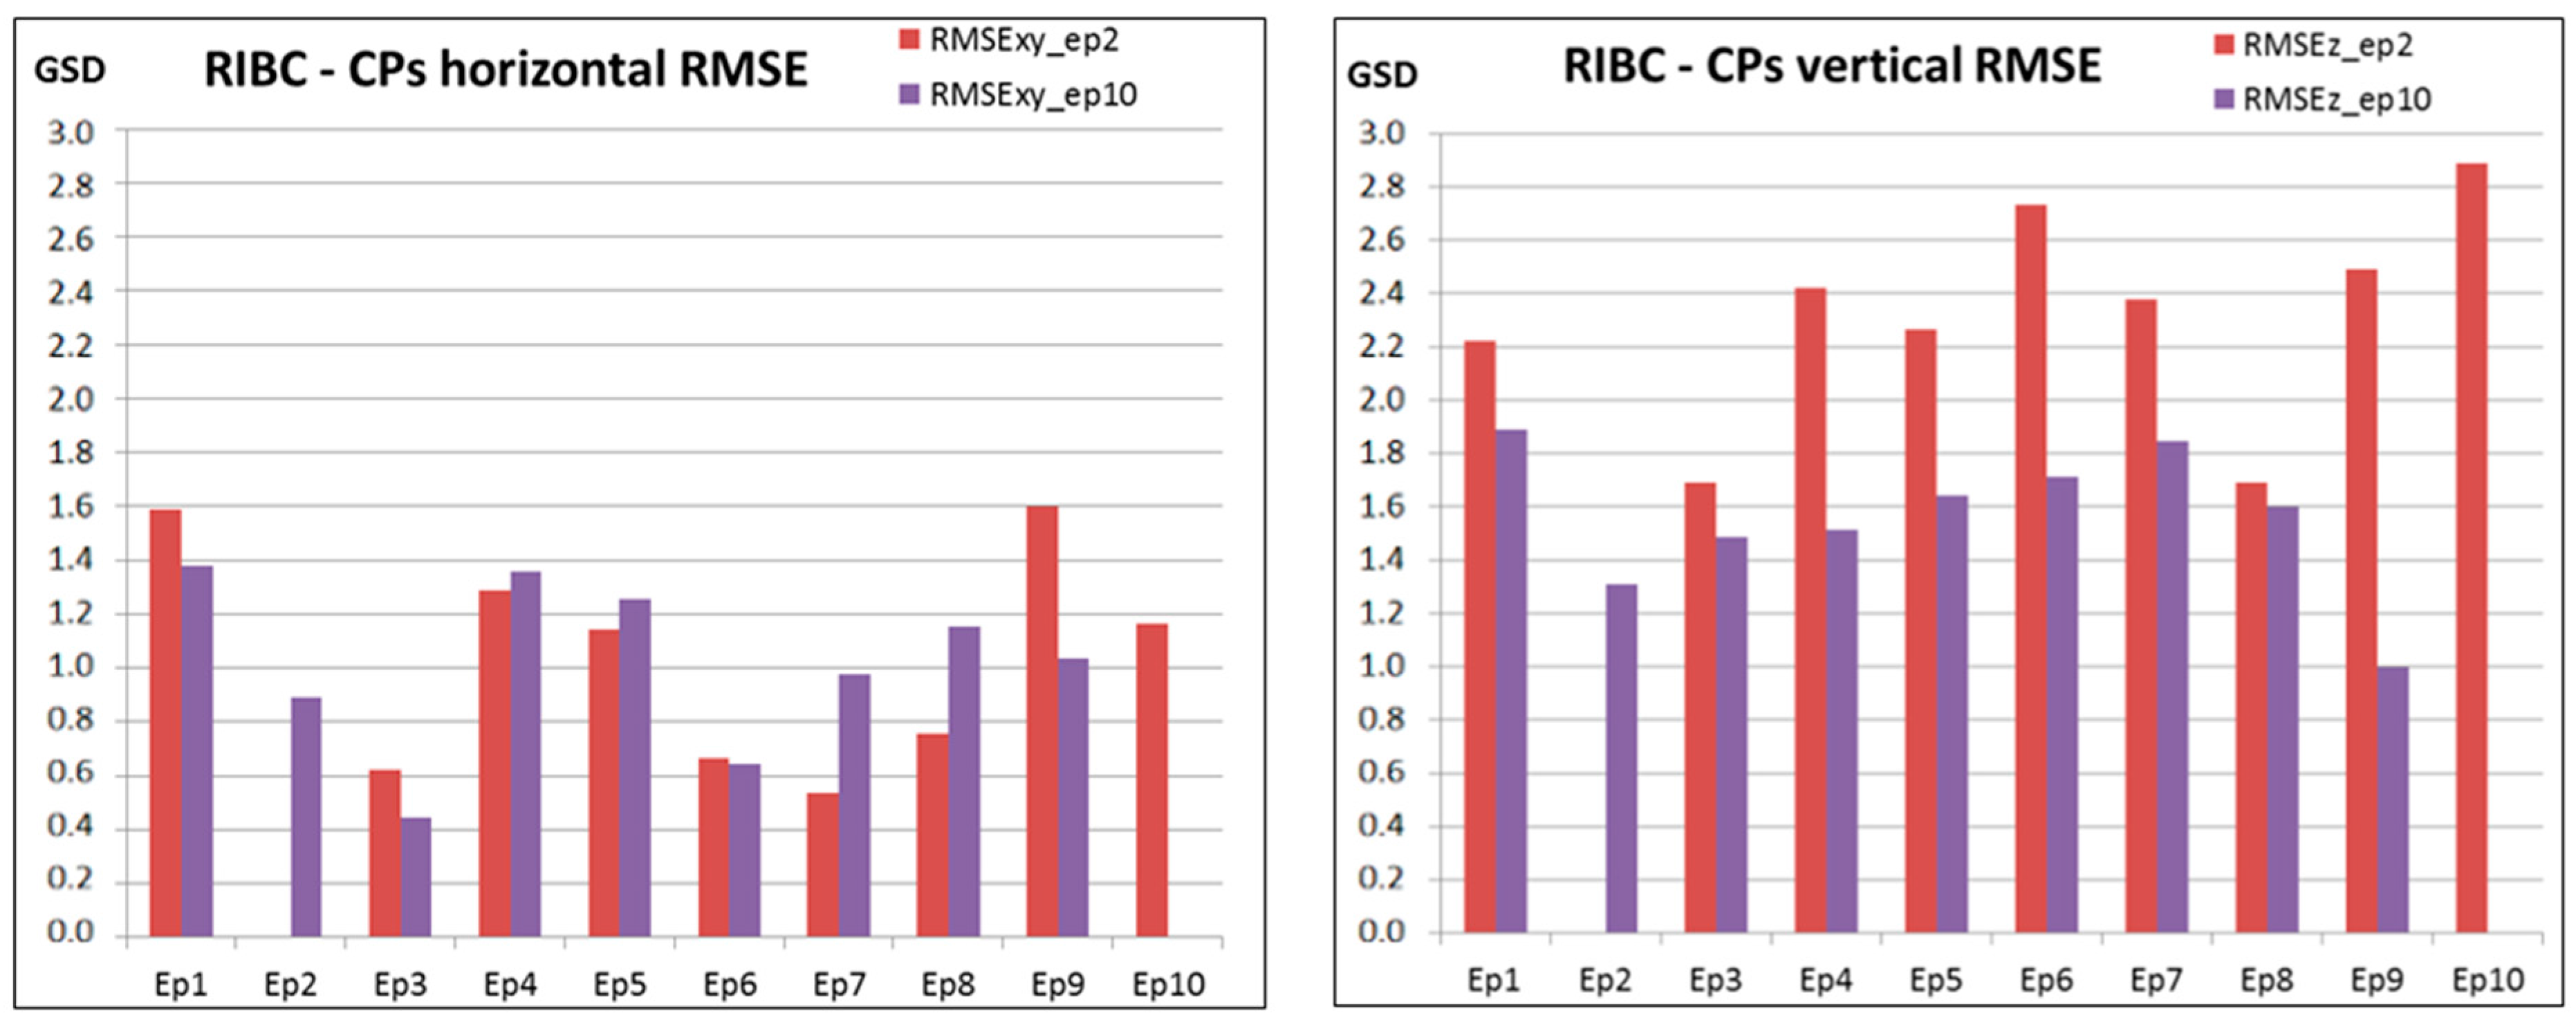
3.2.3. Eighteen Even Distributed Images, Sequential Approach
The same reference epoch was used with all the input datasets in the former investigations. In this test, a sequential approach is investigated: the reference images change every time and the epoch
t-
1 is used to register the images of epoch
t. Theoretically, this strategy would allow to maximize the unchanged areas between the two epochs. The registration procedure was applied (
Figure 11) manually selecting new anchor images from the reference dataset.
The results report an increase in the error although more homologous features on the unchanged area are detected. Since this is a relative registration procedure, the sequential approach leads to an accumulation of the error in all three coordinate directions.
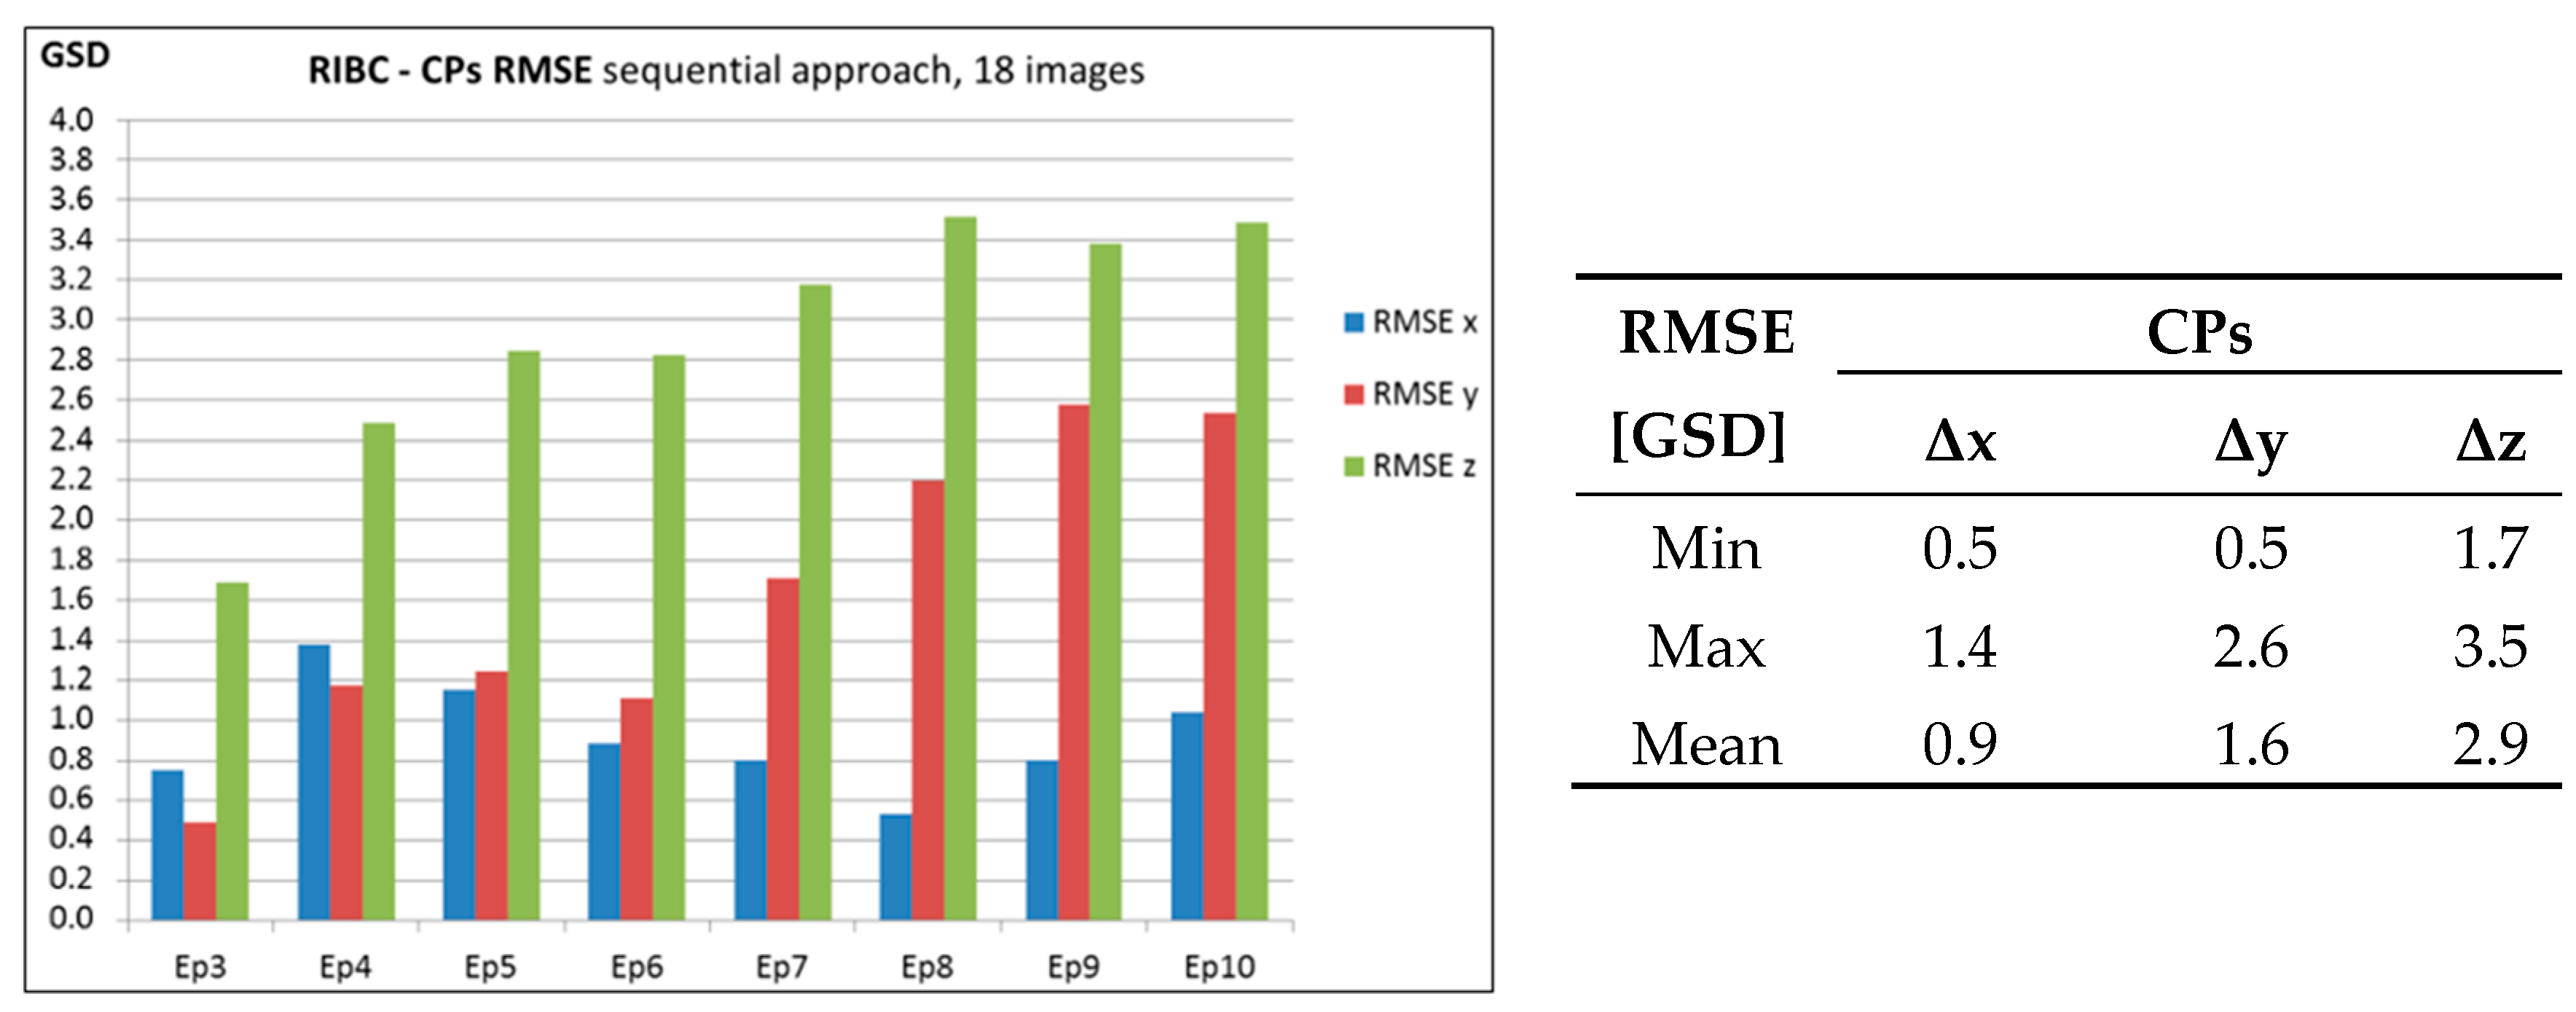
3.2.4. Effects of the Increase in the Number of Evenly Distributed Images
The quality of the co-registration was assessed increasing the number of anchor images used in the registration process. Two different tests (
Figure 12) were performed on three input epochs (3, 5, 10) using as anchor both 37 images and all the data (67) of the reference epoch 2.
The vertical component greatly improves using 37 evenly distributed images (1 GSD as final error), as shown in
Figure 12. The same trend is confirmed using the entire reference epoch at least in the vertical component. On the other hand, the use of the full dataset does not give any benefit to the horizontal component, and the overall accuracy obtained is almost equivalent to the one reached using 18 reference images. This effect can be explained considering that the images within the construction area probably introduce noise in the image orientation. The final co-registration accuracy could be improved defining a good set of images and excluding the changing area.
3.3. Reference Image-Based Co-Registration (RIBC) with Automatic Approach
The manual selection of the anchor images is time consuming and better results were achieved using a higher number of evenly distributed images in the unchanged area of the image block. The best solution should select each time the best set of anchor images according to the input epoch. An automatic procedure for the anchor images selection is therefore implemented to avoid human intervention and to automate the whole process. As shown in the methodological section (
Section 2.1.1), it can automatically recognize and extract reference images from the block through the matching of local interest features.
The best percentage of overlap to select images in the same area was first evaluated. Considering the quality of the GNSS receiver on-board the eBee and after some tests, a 30% overlap has been adopted. This allows to initially select the set of images to be matched between the reference and the input datasets. Different values of d
α for the definition of the Alpha Shape have been tested providing quite similar results. A default value of 300 pixels has been chosen. Finally, the threshold
tA is fixed to 10% of the area of the image. A set of anchor images from the reference epoch 2 was automatically selected for each input epoch, as it is shown in
Table 4. Epoch 1 was omitted, because it has been previously demonstrated that the quality of the images is not good enough due to the fog.
A decrease in the number of anchor images in epoch 10 compared to epoch 3 can be noticed. This is mainly due to the changes that occur in the area during the time. This highlights the risk of using GCPs located on the ground for multi-temporal acquisitions: it is very hard to define stable points in advance as most of the areas are subject to changes. On the other hand, the image-based registration allows to automatically detect the most reliable images for the registration. The same workflow (
Figure 1) used in
Section 3.2 was then applied with the automatically selected images: the results are shown in
Figure 13.
The mean final error is about 1 GSD in all the three axes showing a good result of the automatic procedure in the selection of the correct set of images. If we compare the automatic results (
Figure 14) with the ones obtained with the manual selection (both 18 and 37 anchor images) we can assess that for the horizontal component the mean error slightly decreases (about 0.3·GSD), but an improvement of more than 1 GSD compared to the 18 anchor image-setup can be observed in the vertical direction. A difference of about 1.2 GSD between the manual and the automatic approach can be noticed showing that the final results of the automatic procedure are in the same range as the reference solution obtained using the GCPs.
Figure 15 shows the anchor image distribution of the epoch 2 selected using both the manual and the automatic approach. In the manual case, the reference images are the same for each input dataset, while the results shown in the automatic procedure are related to epoch 3. The introduction of more images allows to have a coverage of the area from multiple images and a better distributed set of reference data. Moreover, the figure highlights the lower concentration of automatically selected images in the vegetation area where it is obviously difficult to define common points with the feature detection algorithms.
In order to have an acceptable final relative registration, it is important to have more than one image covering the stable parts of the scene. This allows to further constrain the relative orientation defining more common points between the anchor and the input images. Moreover, the possibility to have multiple images of the same area allows to exclude false positive common points. The automatic recognition of common points in the vegetated areas is difficult, so a good practice is to verify the anchor images distribution before introducing them in the BBA. As reported in [
35] an uneven distribution of anchor images leads to an inaccurate relative registration.
The performed tests showed that the proposed automatic procedure can guarantee good results also under different image configurations. Good selection results were obtained using as the reference the datasets acquired both in the same and in a different seasons. Reliable results were also achieved considering different cameras (as specified in the description of the case study) and flight plans as the acquisitions differ in terms of number of images and stripes.
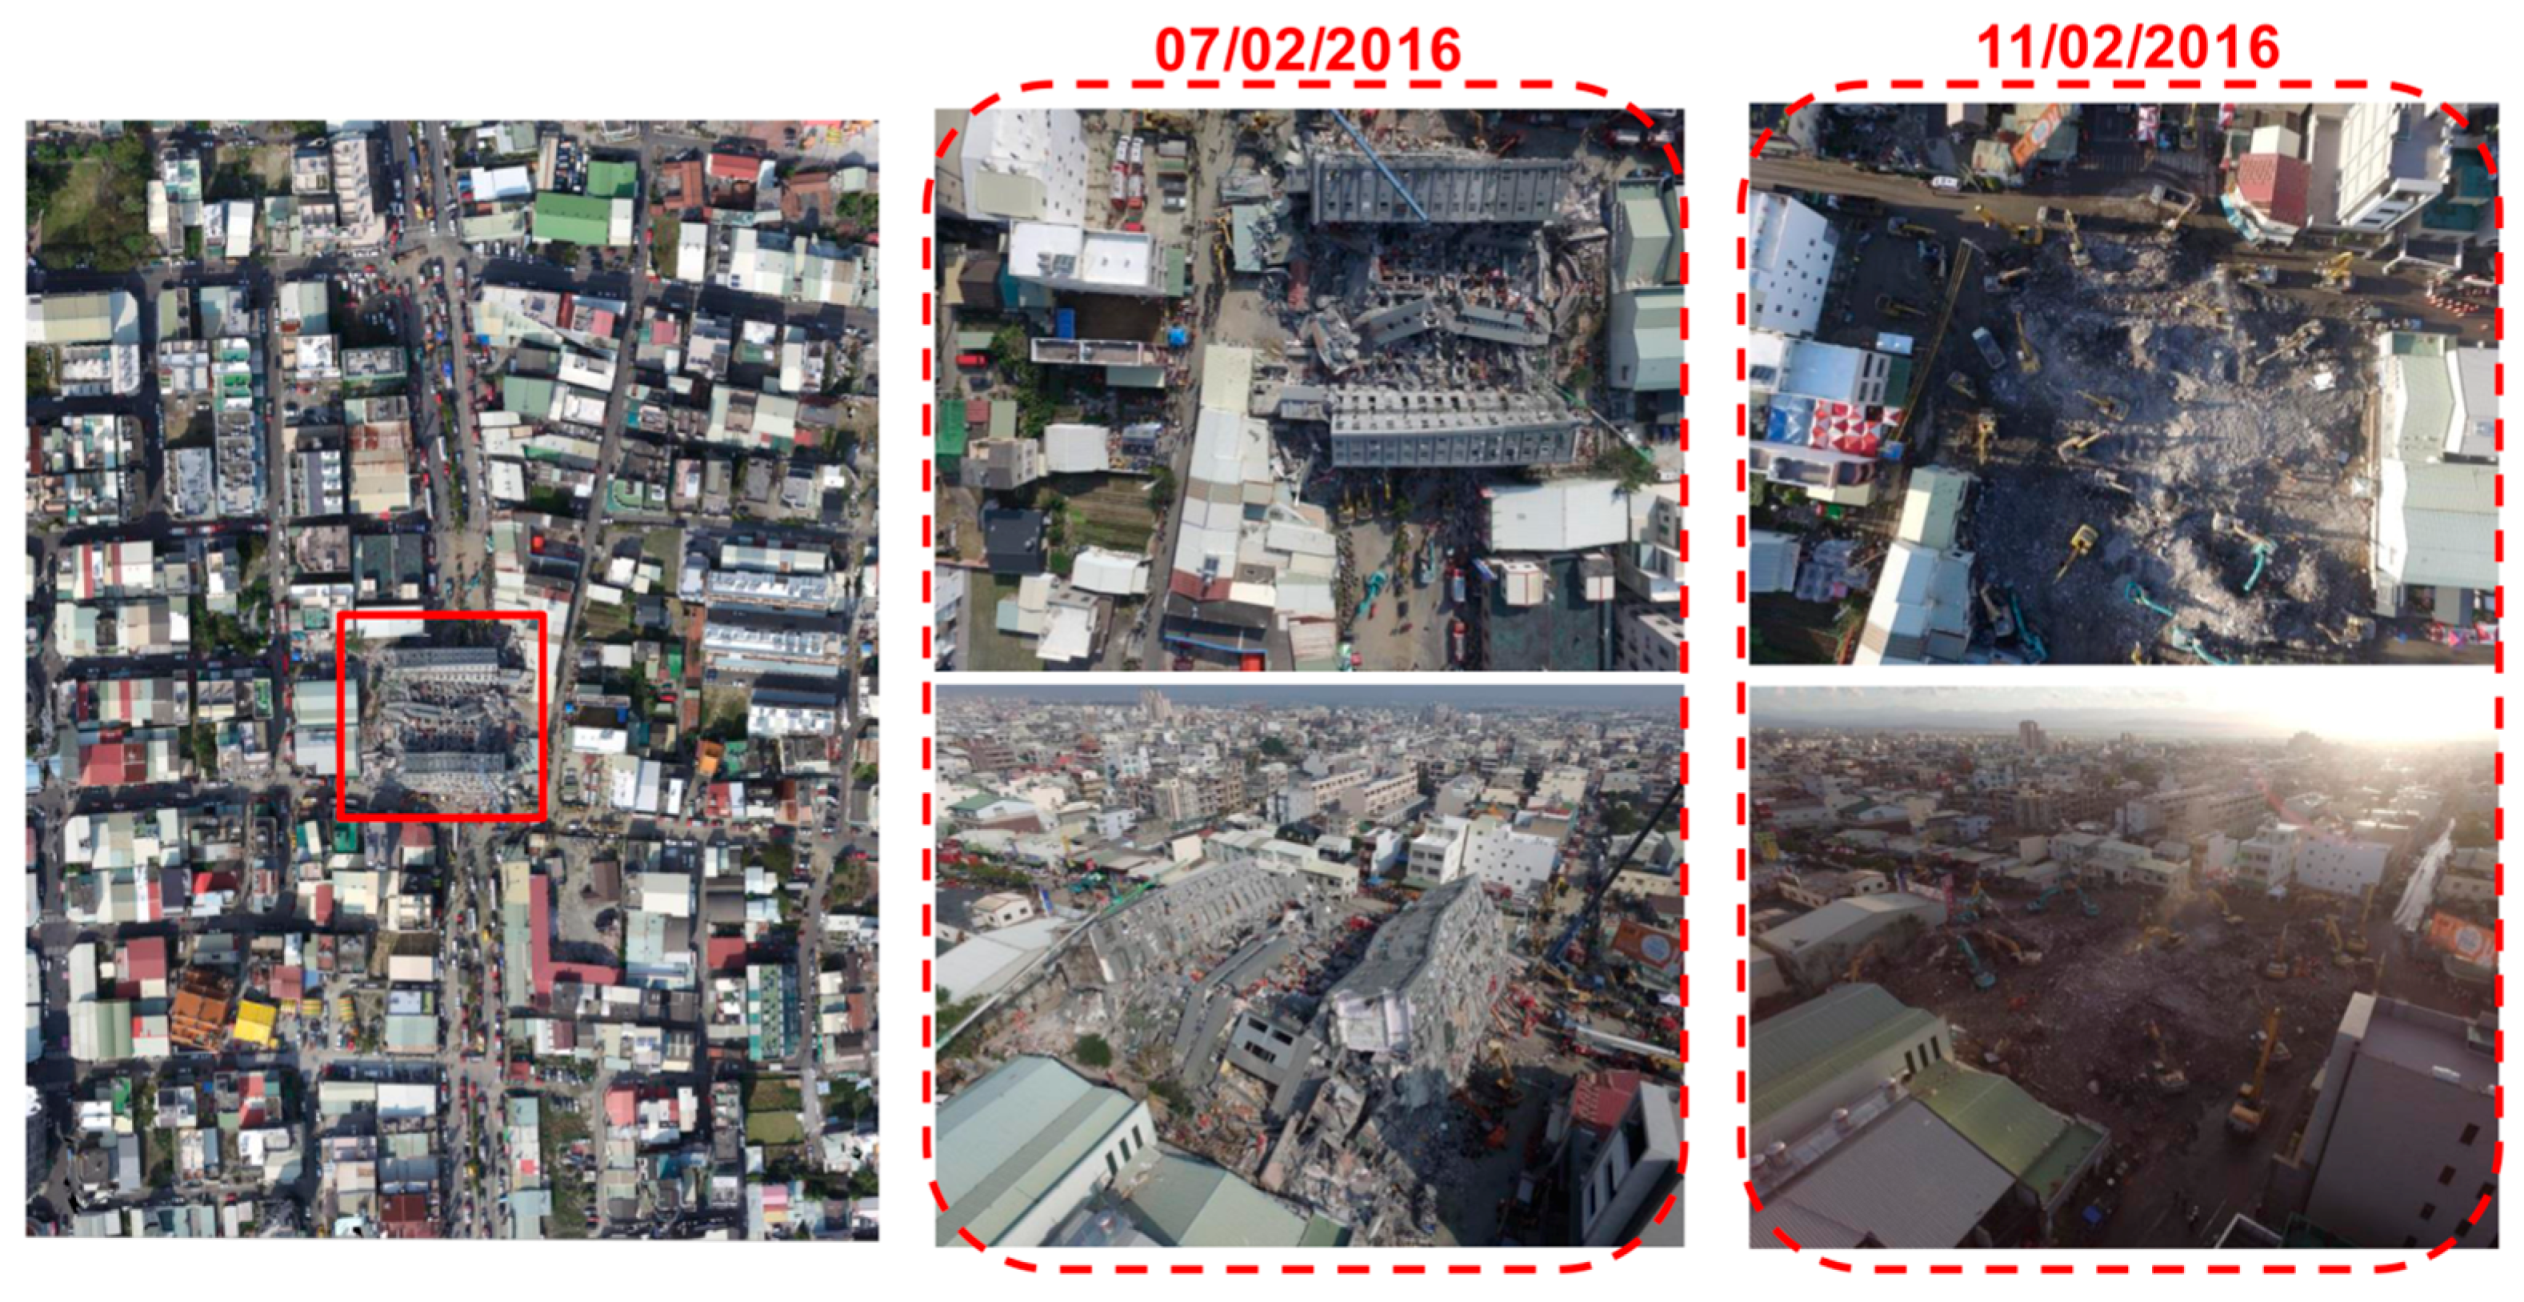
4. Experimental Study: Post-Earthquake Monitoring
A second datasets was used to further validate the RIBC procedure with the automatic anchor image selection. We have two image blocks acquired with a DJI Phantom3 after an earthquake in Taiwan (
Figure 16): in the first flight (177 images) a collapsed building is visible while it is completely removed in the second one (232 images). An automatic co-registration of both epochs would facilitate the monitoring of the clean-up work in the disaster recovery.
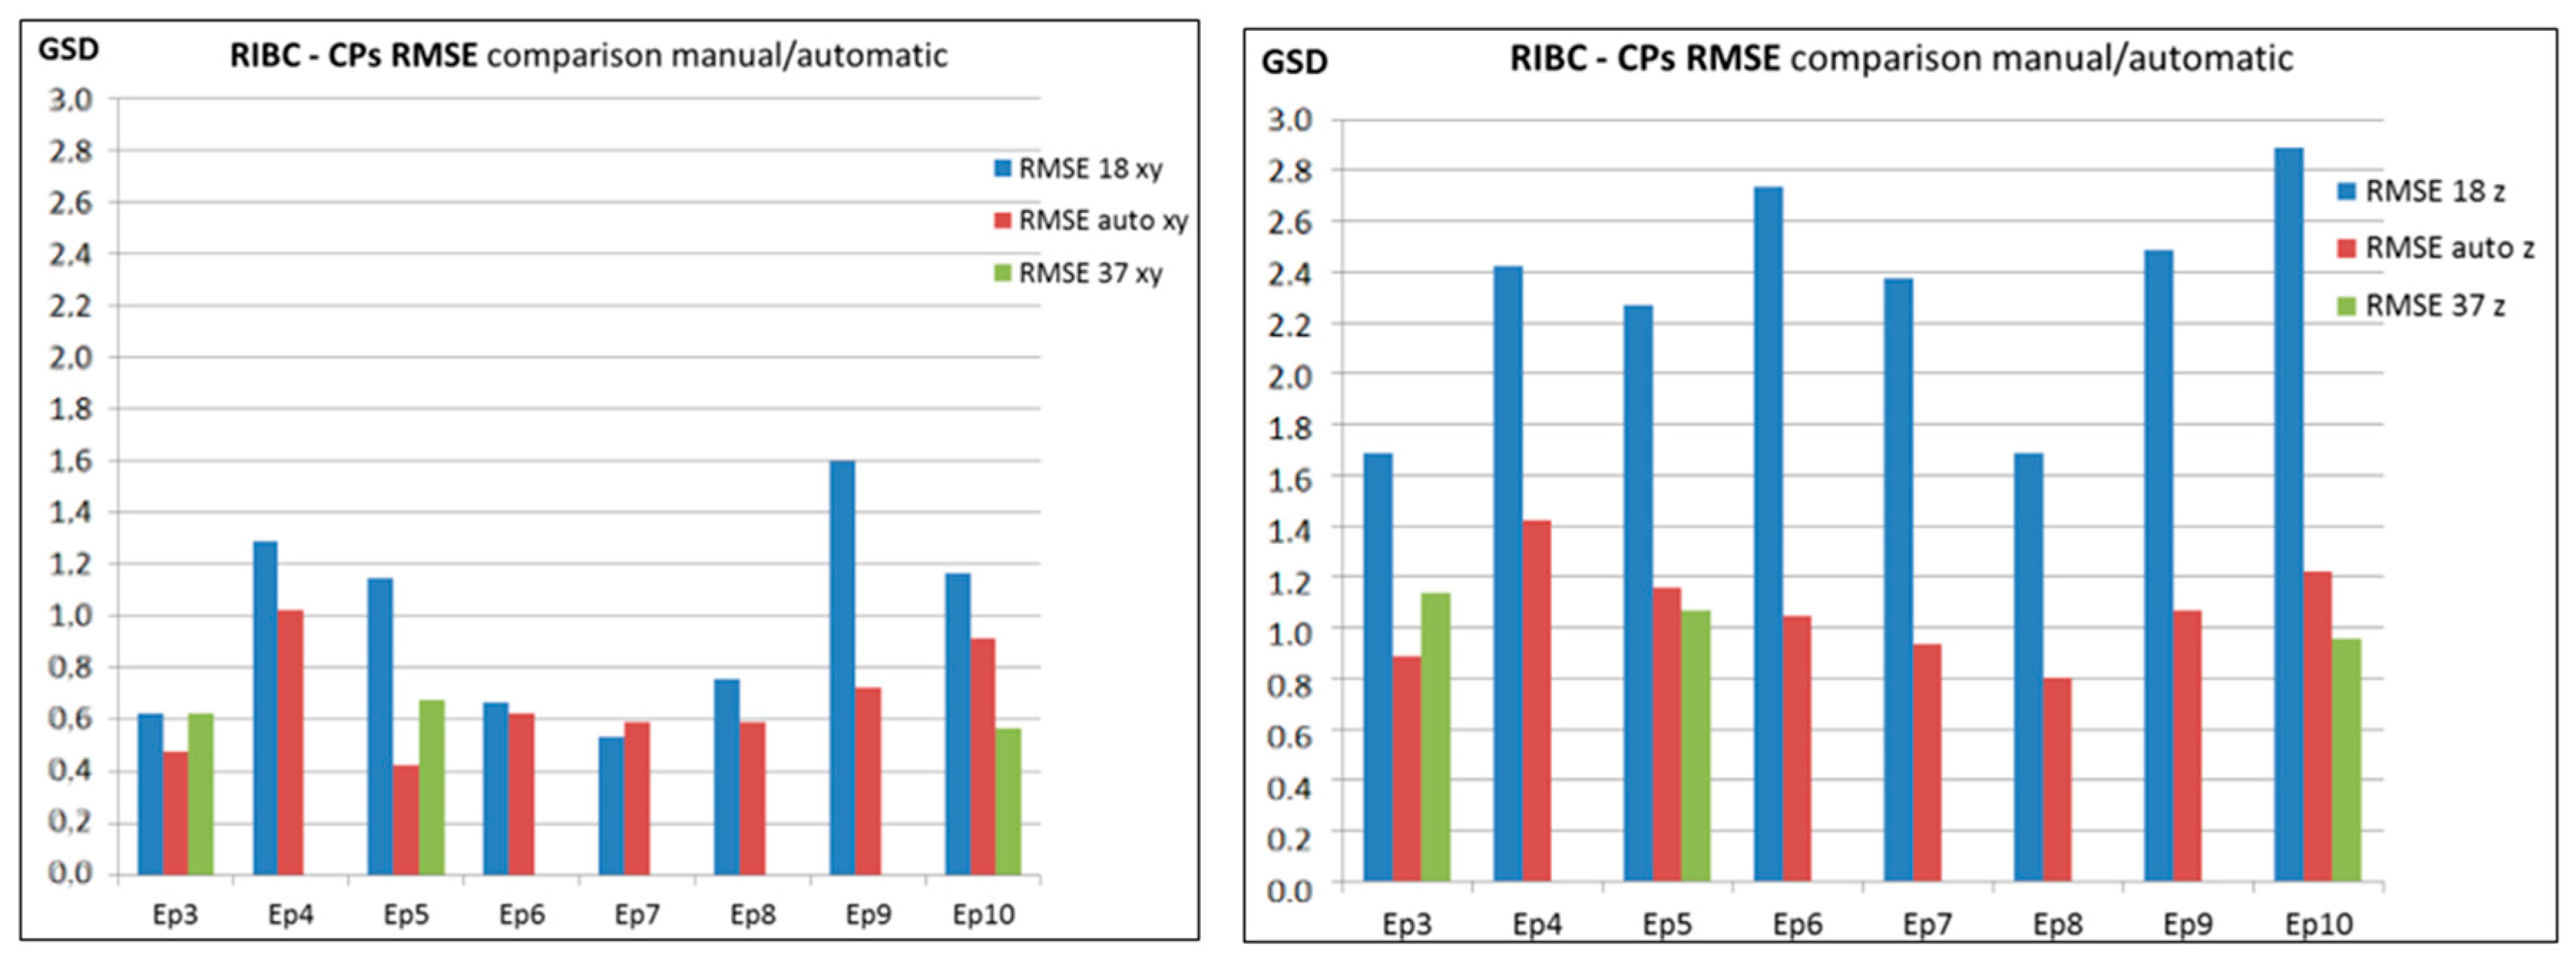
The first dataset was used as reference and the image-based registration was performed with the second set of images, excluding the collapsed building from the reference images. This was realized applying the automatic procedure for the image selection. The images representing the collapsed building were successfully excluded.
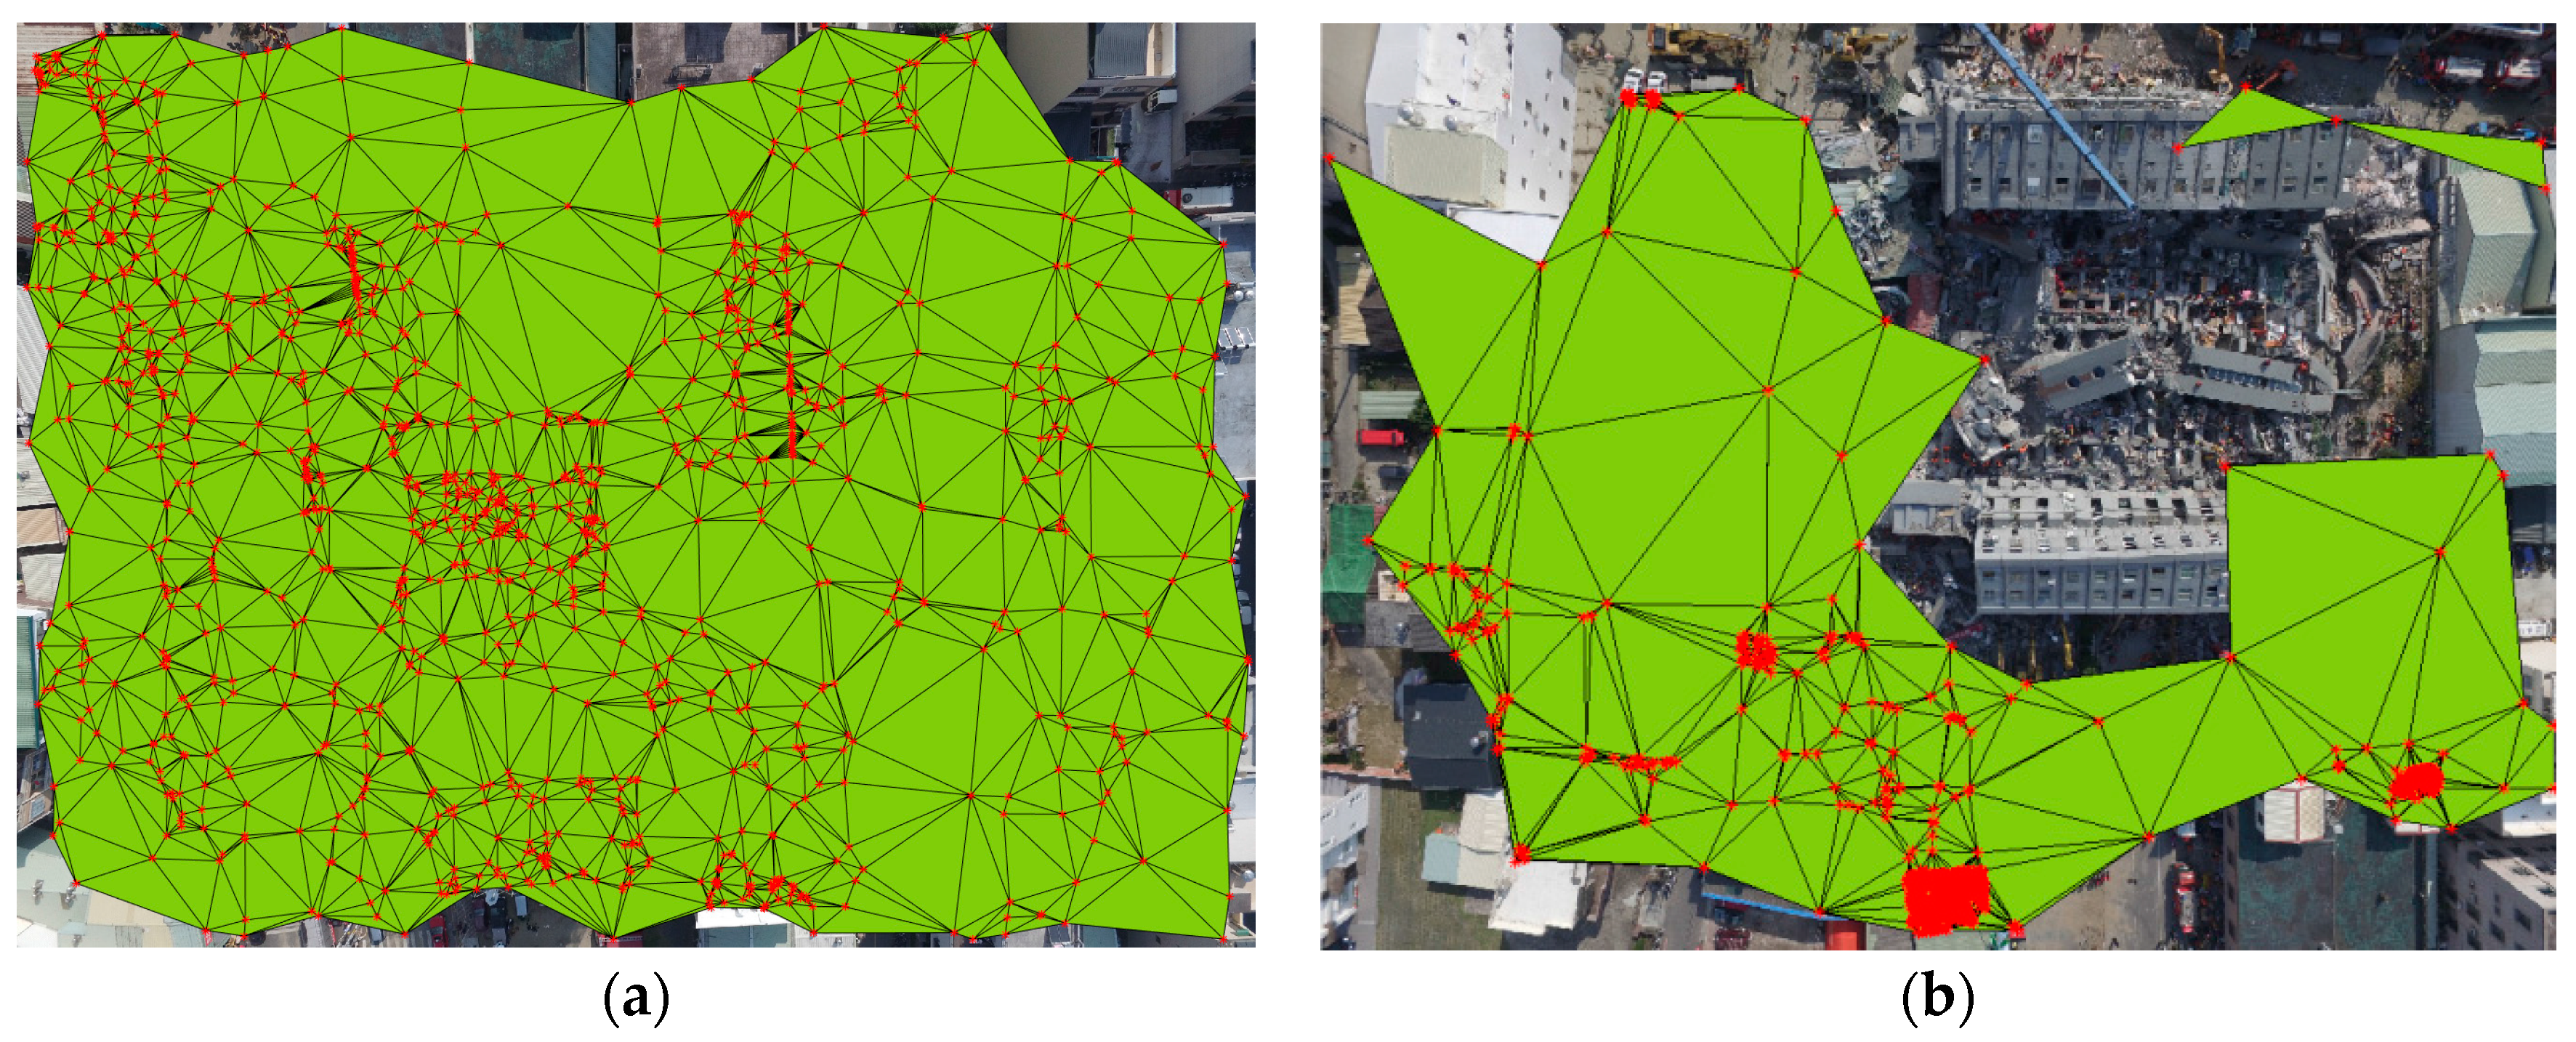
Figure 17 shows an example of how the procedure works with this dataset in the automatic selection of anchor images: all the images representing stable buildings are selected while the data in the collapsed area are automatically rejected.
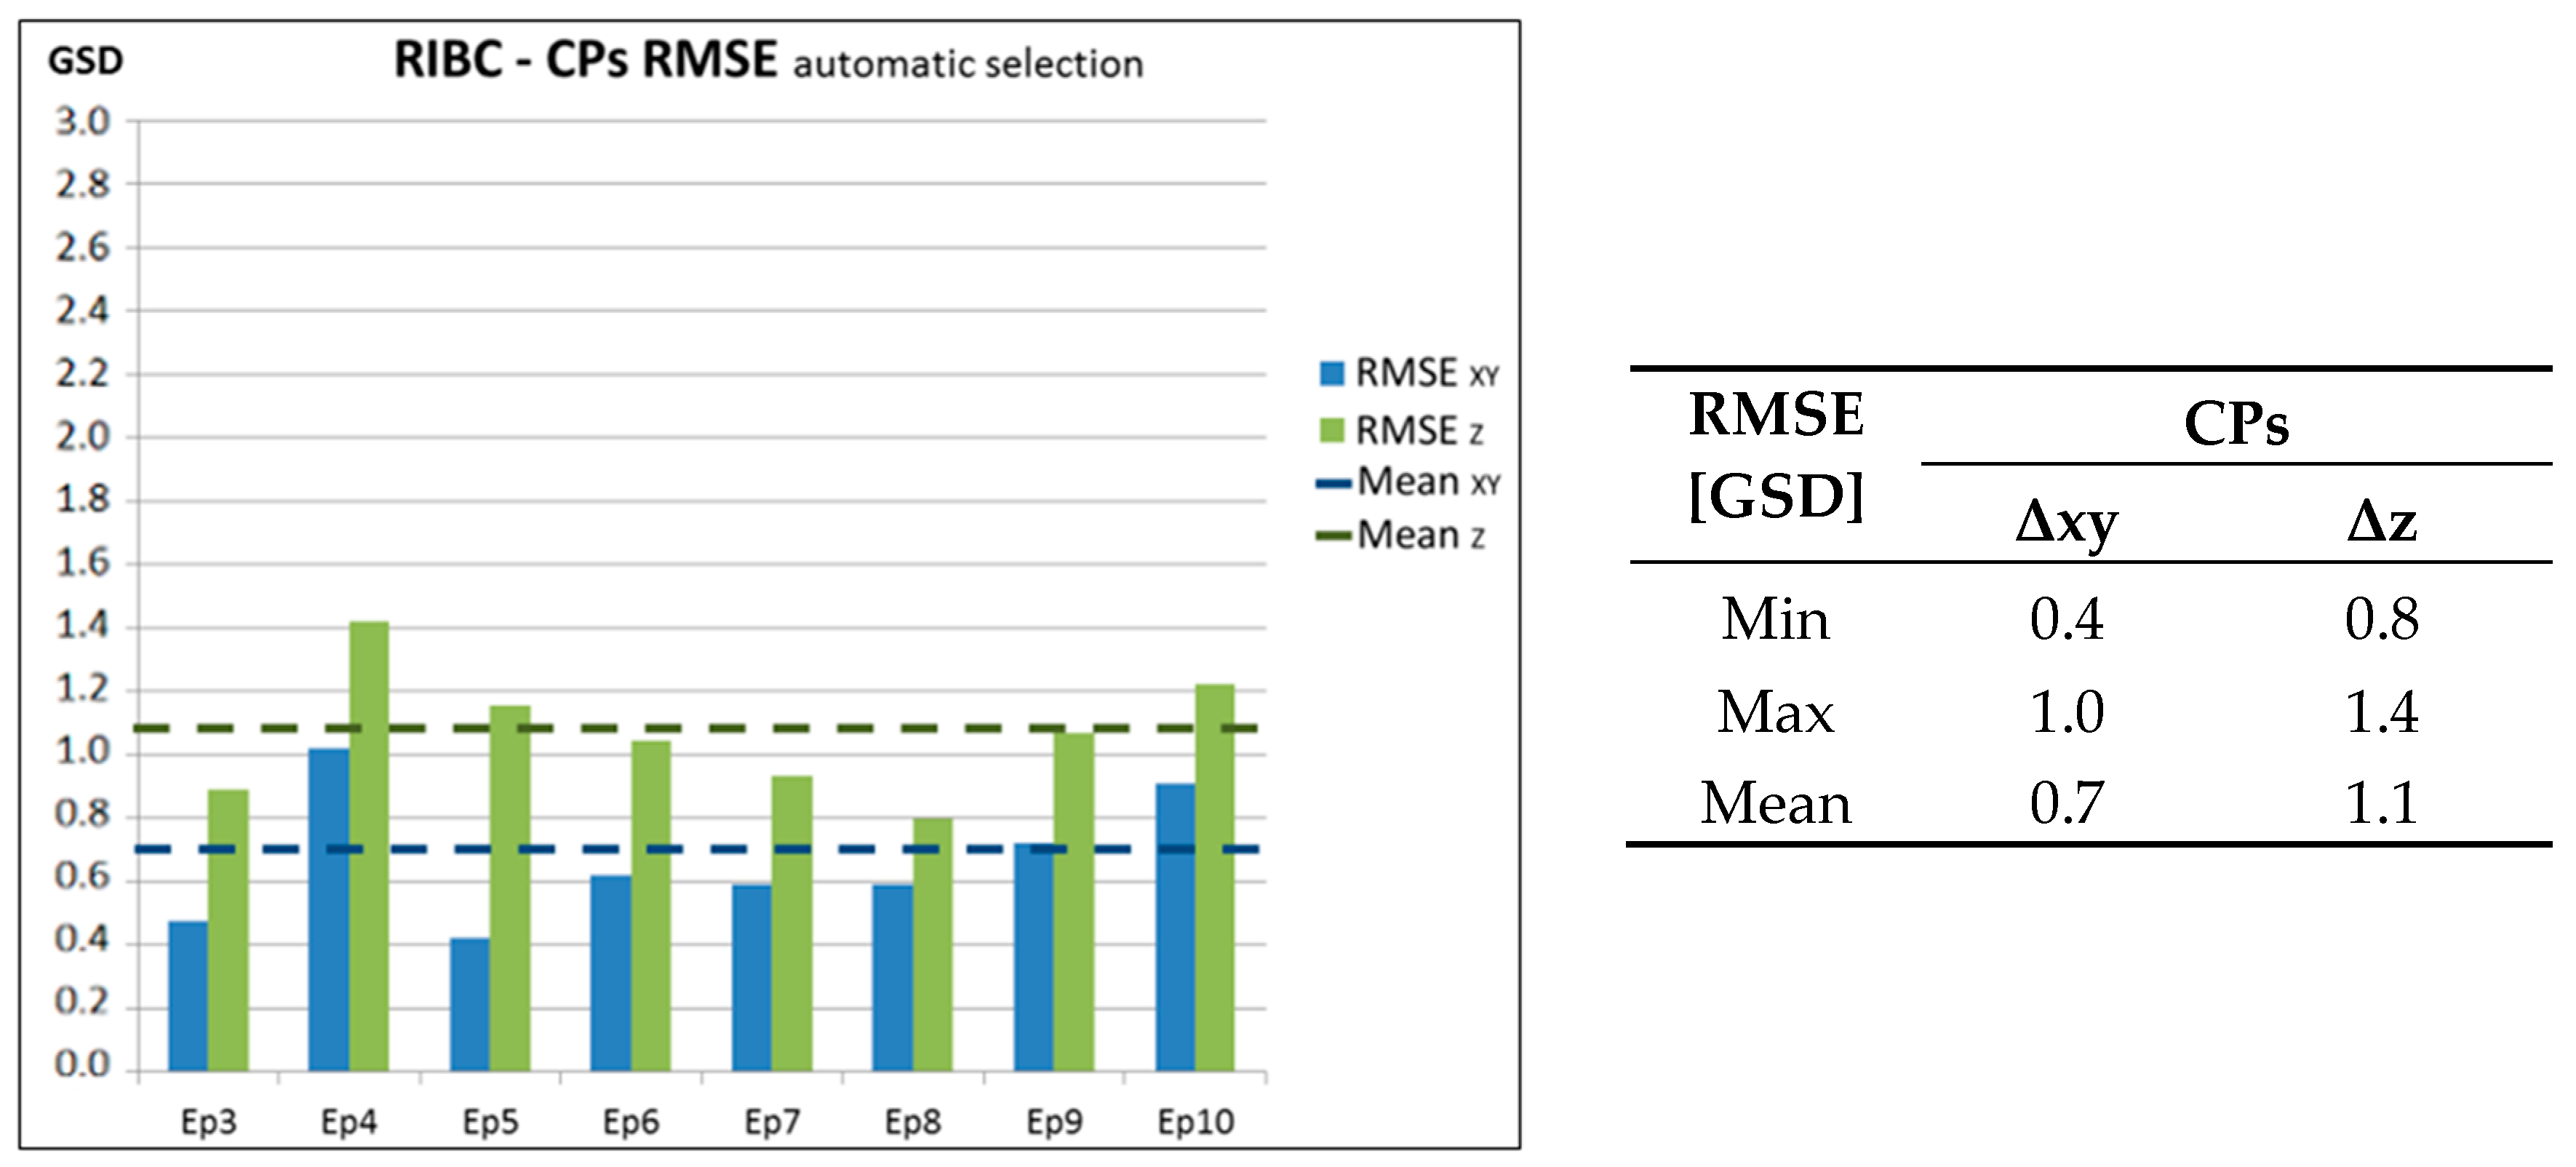
Thirteen points were manually selected after the orientation of the first image block. As in the former tests they were used as control points for the accuracy estimation. The achieved results (
Table 5) demonstrate that the mean horizontal discrepancy is very small and the vertical component is about 1 GSD (GSD = 3.60 cm).
The good result is also due to the high quality of the images, as the flight altitude was lower than in the first dataset and most of the images are not in the damaged area. This allows the procedure to define many common areas and to perform a reliable registration.
5. Discussion
The performed tests have permitted to evaluate the final relative orientation between epochs and to assess if the proposed procedure is usable in multi-temporal scenarios. Without a ground truth it is not possible to estimate the deformation of the block, but this is not a critical issue in many change detection applications.
The results showed a final registration error comparable to the precision normally achieved with conventional photogrammetric approaches in all the performed tests (about 1 GSD for the horizontal component and 2–3 GSD for the vertical one). A summary of these tests (RGCP, RIBC manual and automatic) is reported in
Figure 18. The horizontal component accuracy is about the same for the RGCP and RIBC with automatic image selection. In contrast, the latter outperforms the RGCP and manual selection of the RIBC method when it comes to the vertical component.
The observations show that the use of a consistent number of anchor images can improve the vertical component while the image quality of the reference epoch strongly influences the final results. The automatic procedure of the anchor image selection shows a relevant improvement in the vertical component due to the increase of the number of images in the stable area. The distribution of anchor images on the whole surveyed area is another fundamental aspect that needs to be considered. The presence of vegetation can negatively influence the co-registration process due to the seasonal changes that reflect in different colors and different geometries over the time.
The automatic procedure shows better results compared to the RGCP solution for the vertical component, probably because of a larger number of anchor images which provides more observations than the GCP approach.
In addition, the performed tests showed that the selection of the same reference epoch leads to improved results compared to a sequential approach: in the last case errors are accumulating. For this reason, it is important to take the season and the light conditions into account when the reference epoch gets selected. Image enhancement algorithms such as the Wallis filter can be used to partially improve the image matching. The experiments on the Taiwan datasets confirmed the reliability of the registration procedure providing final results close to 1·GSD.
6. Conclusions
This paper presents an automatic technique to register high resolution multi-temporal datasets from UAVs. The co-registration is performed without the use of GCPs and it is based on the employment of anchor images selected from a chosen reference dataset to constrain the orientation of the other epochs. The validity of the procedure has been assessed considering the relative orientation of the epochs as no ground truth was available in these case studies. The proposed RIBC approach can produce co-registration results comparable to the conventional RGCP solution if the anchor images from the reference epoch are well distributed and do not include the changing area. The developed method for the automatic anchor image selection turned out to deliver a consistent and high number of valuable images being able to outperform the results achieved with manually selected images, in particular in the height component.
A central requisite to reach acceptable results is the image quality and the availability of static features across the investigated area. For this reason, the RIBC approach can be mostly used in scenarios like building construction and monitoring, archeological investigations and damage assessment (e.g., after catastrophic events, fire damages, flooding and war destructions) where distinct static features can be detected around the study area. This means that during flight planning it is important to cover not only the interest area but to enlarge the acquisition in order to include more stable and unchanged features. This can produce a greater quantity of data, but it will lead to a better result.
It was demonstrated that the final results are strictly dependent on the image quality and distribution over the whole block. The same flight plan between epochs is not required, but very strong differences in terms of final image quality have to be avoided.
The image quality also impacts the automatic procedure for the anchor images selection. Even if the Wallis filter is included in the procedure the image quality can affect the feature extraction and subsequent matching might lead to unreliable results affecting the co-registration results. However, the use of the same reference epoch has proved to be the best option in order to avoid accumulation of the errors.
The presented procedure allows to finely co-register different blocks. It can be, therefore, considered as the first step of an automatic procedure for change detection and monitoring on the generated Digital Surface Models (DSM) and orthophotos. In this sense, future works will be performed to implement a completely automatic procedure able to automatically highlight the changes on DSMs and Orthophotos.


