1. Introduction
Soil moisture content and surface roughness play important roles in meteorology, hydrology, agronomy, agriculture, and risk assessment. These soil surface characteristics can be estimated using synthetic aperture radar (SAR). Today, several high-resolution SAR images can be acquired on a given study site with the availability of SAR data in the L-band (ALOS-2), the C-band (Sentinel-1), and the X-band (TerraSAR-X, COSMO-SkyMed). In addition, it is possible to obtain SAR and optical data for global areas at high spatial and temporal resolutions with free and open access Sentinel-1/2 satellites (six days with the two Sentinel-1 satellites and five days with the two Sentinel-2 satellites at 10 m spatial resolution). This availability of both Sentinel-1 satellites and Sentinel-2 sensors, in addition to Landsat-8 (also free and open access), allows the combination of SAR and optical data to estimate soil moisture and vegetation parameters in operational mode.
The retrieval of soil moisture content and surface roughness requires the use of radar backscatter models capable of correctly modelling the radar signal for a wide range of soil parameter values. This estimation from imaging radar data implies the use of backscattering electromagnetic models, which can be physical, semi-empirical, or empirical. The physical models (e.g., integral equation model “IEM”, small perturbation model “SPM”, geometrical optic model “GOM”, physical optic model “POM”, etc.), based on physical approximations corresponding to a range of surface conditions (moisture and roughness), provide site-independent relationships, but have limited validity depending upon the soil roughness. As for semi-empirical or empirical models, they are often difficult to apply to sites other than those on which they were developed and are generally valid only for specific soil conditions. The empirical models are often favored by users because the models are easier to implement and invert [
1,
2,
3,
4,
5,
6,
7].
Among the numerous semi-empirical models reported in the literature, the most popular are those developed over bare soils by Oh et al. [
8,
9,
10,
11] and Dubois et al. [
12]. The Oh model uses the ratios of the measured backscatter coefficients HH/VV and HV/VV to estimate volumetric soil moisture (
mv) and surface roughness (
Hrms), while the Dubois model links the backscatter coefficients in HH and VV polarizations to the soil’s dielectric constant and surface roughness. Extensive studies evaluated various semi-empirical models, but mixed results have been obtained. Some studies show good agreement between measured backscatter coefficients and those predicted by the models, while others have found great discrepancies between them (e.g., [
13,
14,
15,
16]). The discrepancy between simulations and measurements often reach several decibels, making soil parameter estimates unusable.
The objective of this paper is to propose a robust, empirical, radar backscattering model based on the Dubois model. First, the performance of the Dubois model is analyzed using a large dataset acquired at several worldwide study sites by numerous SAR sensors. The dataset consists of SAR data (multi-angular and multi-frequency) and measurements of soil moisture and surface roughness over bare soils. Then, the different terms of Dubois equations that describe the dependence between the SAR signal and both sensor and soil parameters have been validated or modified to improve the modelling of the radar signal. Ultimately, a new semi-empirical backscattering model has been developed for radar scattering in the HH, VV, and HV polarization from bare soil surfaces.
After a description of the dataset in
Section 2,
Section 3 describes and analyzes the potential and the limitations of the Dubois model in radar signal simulations over bare soils. In
Section 4, the new model is described and its performance is evaluated for different available SAR data (L-, C- and X-bands, incidence angles between 20° and 45°). Conclusions are presented in
Section 5.
2. Dataset Description
A wide experimental dataset was used, consisting of SAR images and ground measurements of soil moisture content and roughness collected over bare soils at several agricultural study sites (
Table 1). SAR images were acquired by various airborne and spaceborne sensors (AIRSAR, SIR-C, JERS-1, PALSAR-1, ESAR, ERS, RADARSAT, ASAR, and TerraSAR-X). The radar data were available in L-, C-, and X-bands (approximately 1.25 GHz, 5.3 GHz, and 9.6 GHz, respectively); with incidence angles between 18° and 57°; and in HH, VV, and HV polarizations. For several reference plots, the mean backscatter coefficients have been obtained from radiometrically and geometrically calibrated SAR images by averaging backscatter coefficient values for each plot for all pixels within the plot.
In addition, in situ measurements of soil moisture (mv) were available for each reference plot. The soil water content was collected from the top 5–10 cm of each reference plot at several locations using the gravimetric method and a calibrated time domain reflectometry (TDR) probe. In practice, the soil moisture for each reference plot was assumed to be equal to the mean of all measurements carried out on the reference plot within a few hours of the SAR overpasses. In our experimental dataset, the soil moisture ranged from 2–47 vol%.
The roughness was defined by the standard deviation of surface height (Hrms) available for each reference plot. From roughness profiles sampled for each reference plot using mainly laser or needle profilometers (mainly 1 m and 2 m long and with 1 cm and 2 cm sampling intervals), the mean of all experimental autocorrelation functions was calculated to estimate the Hrms measurement. However, for some in situ measurement campaigns, the meshboard technique was used for estimating the roughness parameters. In our dataset, Hrms surface height ranged from 0.2–9.6 cm (k Hrms ranged from 0.2–13.4, k was the radar wave number).
A total of 1569 experimental data acquisitions with radar signal, soil moisture content, and roughness were available for HH polarization, 930 for VV polarization, and 605 for HV polarization.
3. Validation and Analysis of the Dubois Model
3.1. Description of the Dubois Model
Dubois et al. [
12] proposed an empirical model to model radar backscatter coefficients in HH and VV polarizations (
and
) for bare soil surfaces. The expressions of
and
depend on the radar wave incidence angle (θ, in radians), the real part of the soil dielectric constant (ε), the rms surface height of the soil (
Hrms), and the radar wavelength (λ = 2 π/
k, where
k is the radar wavenumber):
and
are given in a linear scale. λ is in cm. The validity of the Dubois model is defined as follows:
k Hrms ≤ 2.5,
mv ≤ 35 vol%, and θ ≥ 30°.
3.2. Comparison between Simulated and Real Data
The Dubois model shows an overestimation of the radar signal by 0.7 dB in HH polarization and an underestimation of the radar signal by 0.9 dB in VV polarization for all data combined (
Table 2). The results show that the overestimation in HH is of the same order for L-, C-, and X-bands (between 0.6–0.8 dB). For the L-band, a slight overestimation of approximately 0.2 dB of SAR data is observed in VV polarization. Additionally, in VV polarization, the Dubois model-based simulations underestimate the SAR data in the C- and X-bands by approximately 0.7 dB and 2.0 dB, respectively.
The rms error (RMSE) is approximately 3.8 dB and 2.8 dB in HH and VV, respectively (
Table 2). Analysis of the RMSE according the radar frequency band (L-, C-, and X-, separately) shows in HH an increase of the RMSE with the radar frequency (2.9 dB in the L-band, 3.7 dB in the C-band, and 4.1 dB in the X-band). In VV polarization, the quality of Dubois simulations (RMSE) is similar for the L- and C-bands, but is less accurate in the X-band (2.3 dB in the L-band, 2.6 dB in the C-band, and 3.2 dB in the X-band).
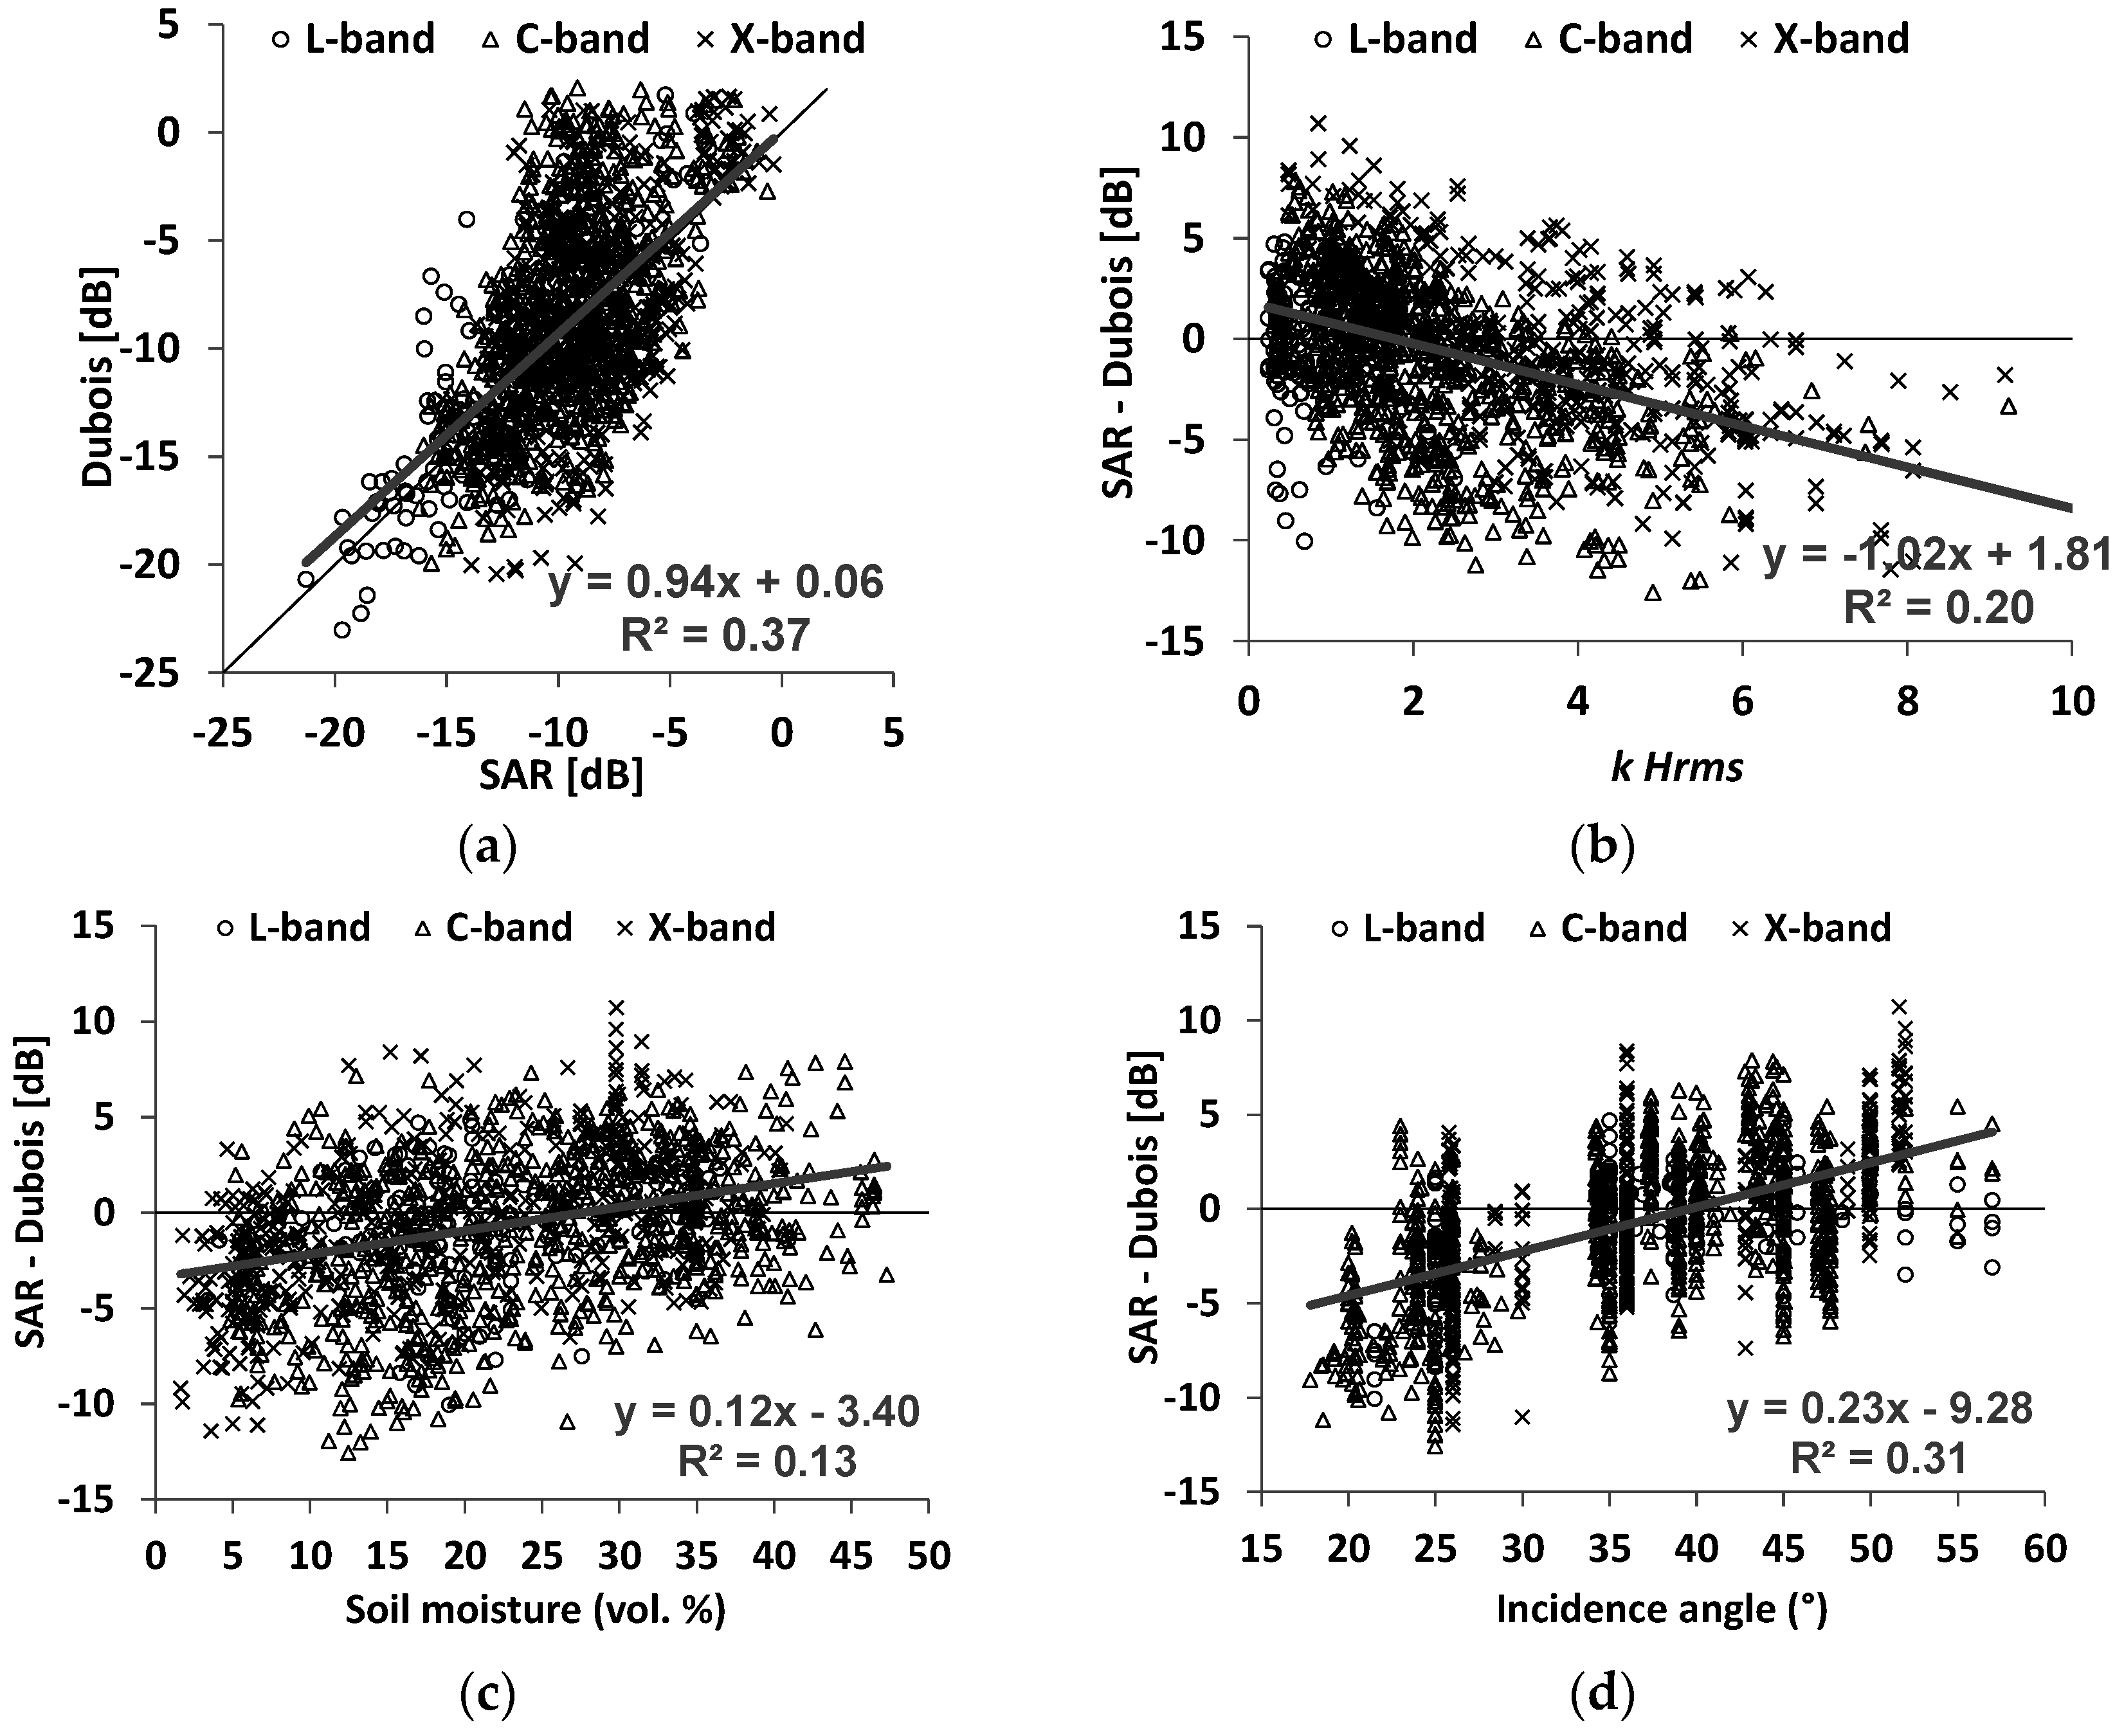
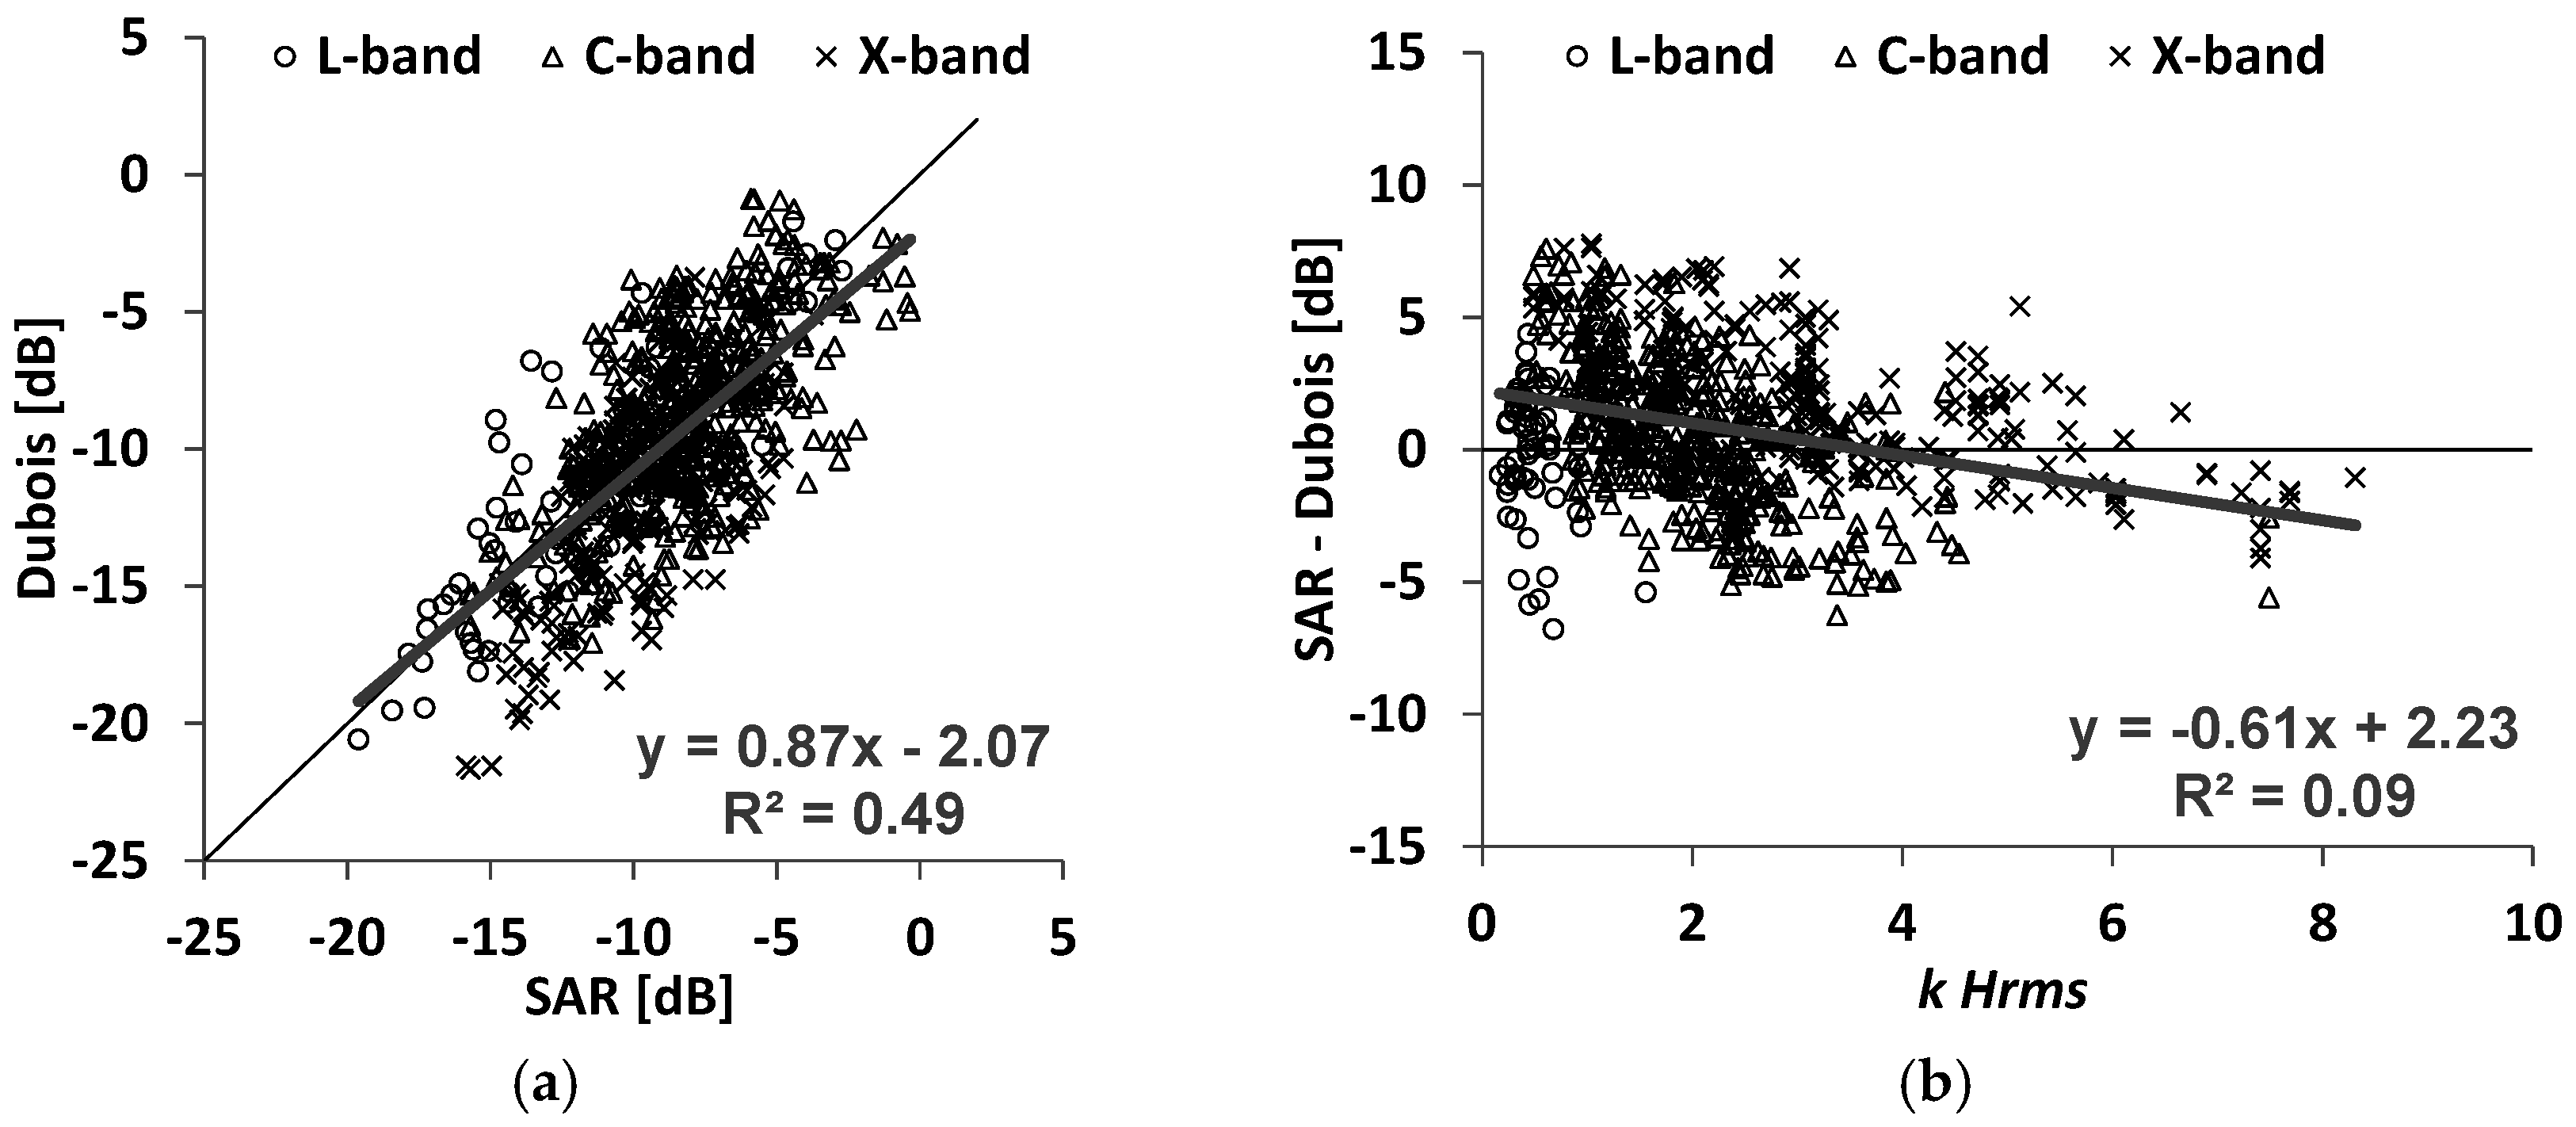
In addition, the agreement between the Dubois model simulations and SAR data is analyzed according to soil roughness, moisture content, and incidence angle (
Figure 1 and
Figure 2). The results indicate a slight underestimation of the radar signal by the Dubois model in the case of
kHrms lower than 2.5 (Dubois validation domain) for both HH and VV polarizations (
Figure 1b and
Figure 2b;
Table 2). For surfaces with a roughness
kHrms greater than 2.5, an overestimation of the radar signal is obtained with the Dubois model in HH, while the model works correctly in VV (
Figure 1b and
Figure 2b;
Table 2). Higher under- and overestimations are observed in HH than they are in VV (reaching approximately 10 dB in HH).
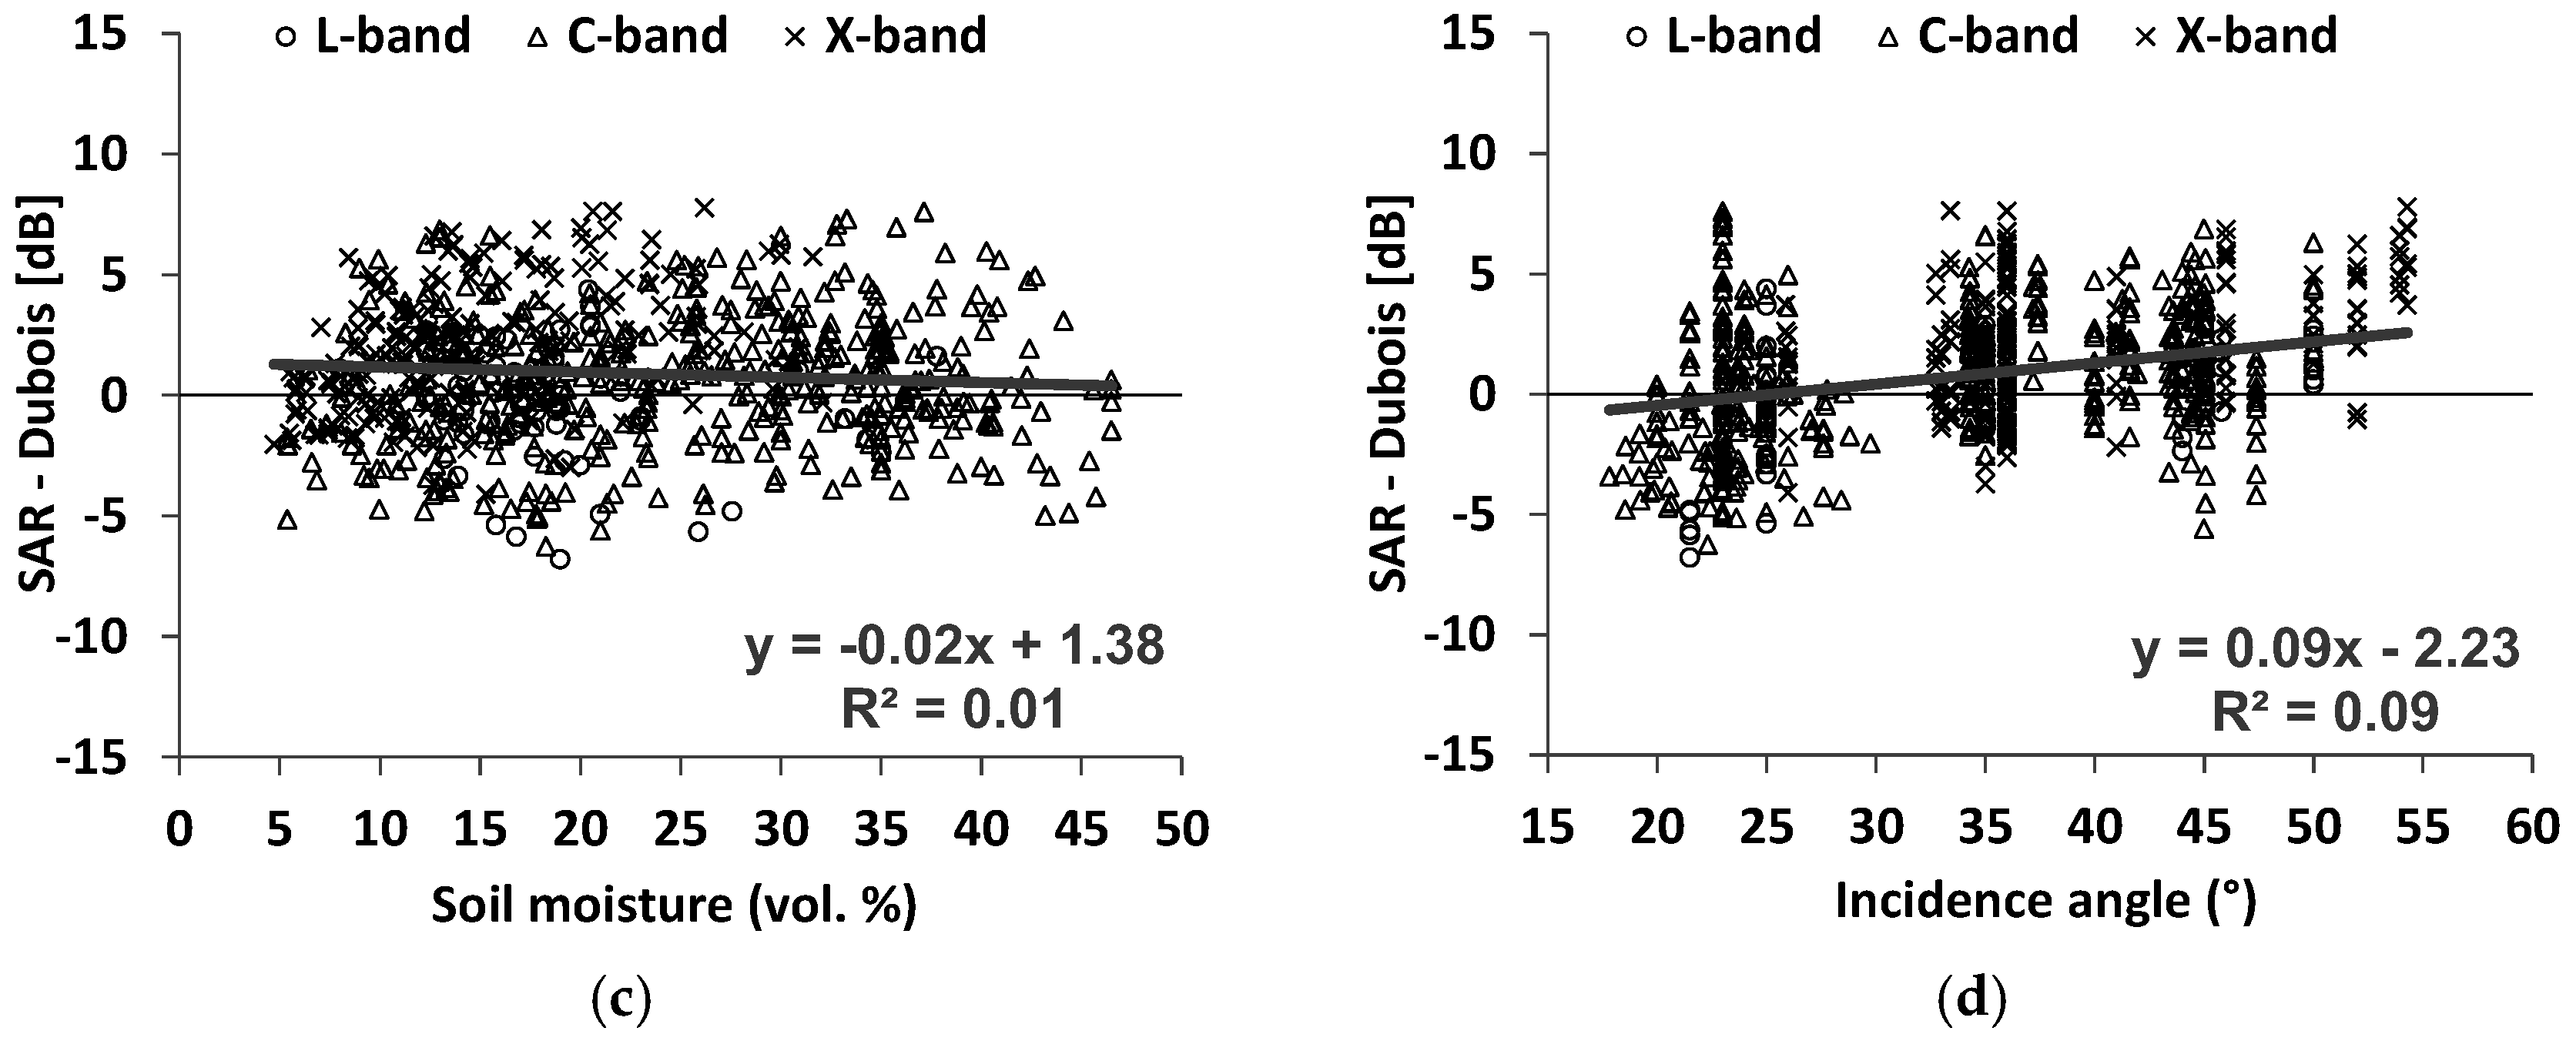
Analysis of the error as a function of soil moisture (
mv) shows that for both VV-polarized data, whatever the
mv values, and HH-polarized data with
mv values higher than 20 vol%, the observed bias between real and simulated data is small (
Figure 1c and
Figure 2c;
Table 2). However, a strong overestimation of the radar signal is observed by the Dubois model in HH for
mv values lower than 20 vol% (−2.0 dB,
Table 2).
Finally, the discrepancy between SAR and the model is larger in HH for incidence angles lower than 30° (outside of the Dubois validity domain) than for incidence angles higher than 30° (
Table 2). The Dubois model strongly overestimates the radar signal in HH for incidence angles lower than 30° but agrees closely with the measured data for incidence angles higher than 30° (
Figure 1d and
Figure 2d;
Table 2). In VV polarization, the Dubois model slightly overestimates the radar signal for incidence angles lower than 30° and underestimates the signal for incidence angles higher than 30° by +1.5 dB (
Figure 1d and
Figure 2d;
Table 2).
In conclusion, the Dubois model simulates VV better than it does HH (RMSE = 2.8 and 3.8 dB, respectively). The disagreements observed between the Dubois model and measured data are not limited to data that are outside the optimal application domain of the Dubois model.
4. New Empirical Model
4.1. Methodology
The disagreement observed between the measured and modelled radar signal encouraged us to develop a new empirical backscattering model using SAR observations and soil in situ measurements. The new model is based on the Dubois model and uses the dependency observed between the SAR signal and soil parameters according to results obtained in various studies. For bare soils, the backscattering coefficient depends on soil parameters (roughness and moisture) and SAR instrumental parameters (incidence angle, polarization, and wavelength). For bare soils, the radar signal in
pq polarization (
p and
q = H or V, with HV = VH) can be expressed as the product of three components:
The radar backscatter coefficient is related to the incidence angle (θ) by the relation
[
38,
39,
40]. This relationship describes the decrease of
° with the incidence angle (the decrease is higher for low angles than for high angles).
The second term represents the relationship between the radar backscatter coefficient and soil moisture (
mv). The results obtained in several investigations show that, for bare soils, the radar signal (σ°) in decibels increases linearly with soil moisture (
mv) when
mv is in the range between approximately 5–35 vol% (e.g., [
5,
6,
19,
41]). In the linear scale
can be written as
The sensitivity of the radar signal to the soil moisture γ depends on θ. Higher sensitivity is observed for lower than for higher incidence angles (e.g., [
42,
43]). To include this dependence on the incidence angle, the soil moisture value is multiplied with the term
. Thus,
can be written as
The last term
represents the behavior of
with soil roughness. An exponential or logarithmic function is often used to express the radar signal (in dB) in terms of surface roughness ([
7,
41,
44,
45]). For a logarithmic behavior of
with
k Hrms,
in the linear scale can be written as
. Baghdadi et al. [
22] showed that at high incidence angles, the radar return is highly sensitive to surface roughness and shows much larger dynamics than at a low incidence angle. In addition, the term
is intended to include this dependence with the incidence angle:
.
Finally, the relationship between the radar backscattering coefficient (
σ°) and the soil parameters (soil moisture and surface roughness) for bare soil surfaces can be written as Equation (4):
The coefficients δ, β, γ, and ξ are then estimated for each radar polarization using the method of least squares by minimizing the sum of squares of the differences between the measured and modelled radar signal. The error in the modelling of radar backscatter coefficients by the new backscattering model was assessed for each polarization using a five-fold cross-validation to validate the predictive performance of the new model. To conduct the five-fold cross-validation, the dataset was first randomly divided into five equal size subsets. Next, four of the subsets are used to train the new model and one was retained to validate its predictive performance. The cross-validation process was then repeated five times, with each of the five sub-datasets used exactly once as the validation data. The final validation result combines the five validation results. The advantage of this method over repeated random sub-sampling is that all observations are used for both training and validation, and each observation is used for validation exactly once.
The fitting of various coefficients parameter in the Equation (4) was done using the entire dataset (fitting errors are about 2 dB for all polarizations). This fitting allows writing
as a function of the rms surface height (
Hrms) and incidence angle (
θ), by Equations (5)–(7):
where
θ is expressed in radians and
mv is in vol%. Equations (5)–(7) show that the sensitivity (
γ) of the radar signal to the soil moisture in the decibel scale is 0.25 dB/vol% in HH polarization, 0.22 dB/vol% in VV polarization, and 0.30 dB/vol% in HV polarization for an incidence angle of 20°. This sensitivity decreases to 0.09 dB/vol% in HH, 0.08 dB/vol% in VV, and 0.11 dB/vol% for an incidence angle of 45°. As for the signal’s sensitivity to soil roughness, it is of the same order of magnitude in HH and VV, and twice as large as the HV signal. The availability of a backscatter model for the cross-polarization component is required because most spaceborne SAR acquisitions are made with one co-polarization and one cross-polarization, in the case of a dual-polarization mode.
4.2. Results and Discussion
4.2.1. Performance of the New Model
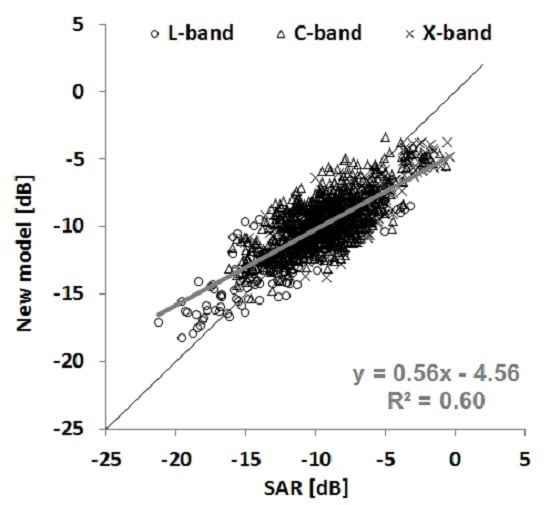
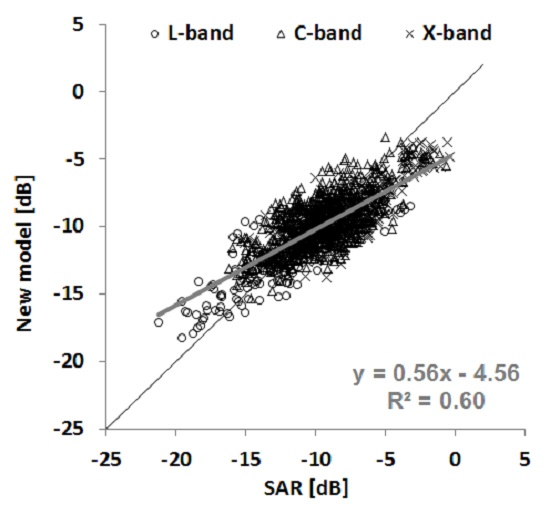
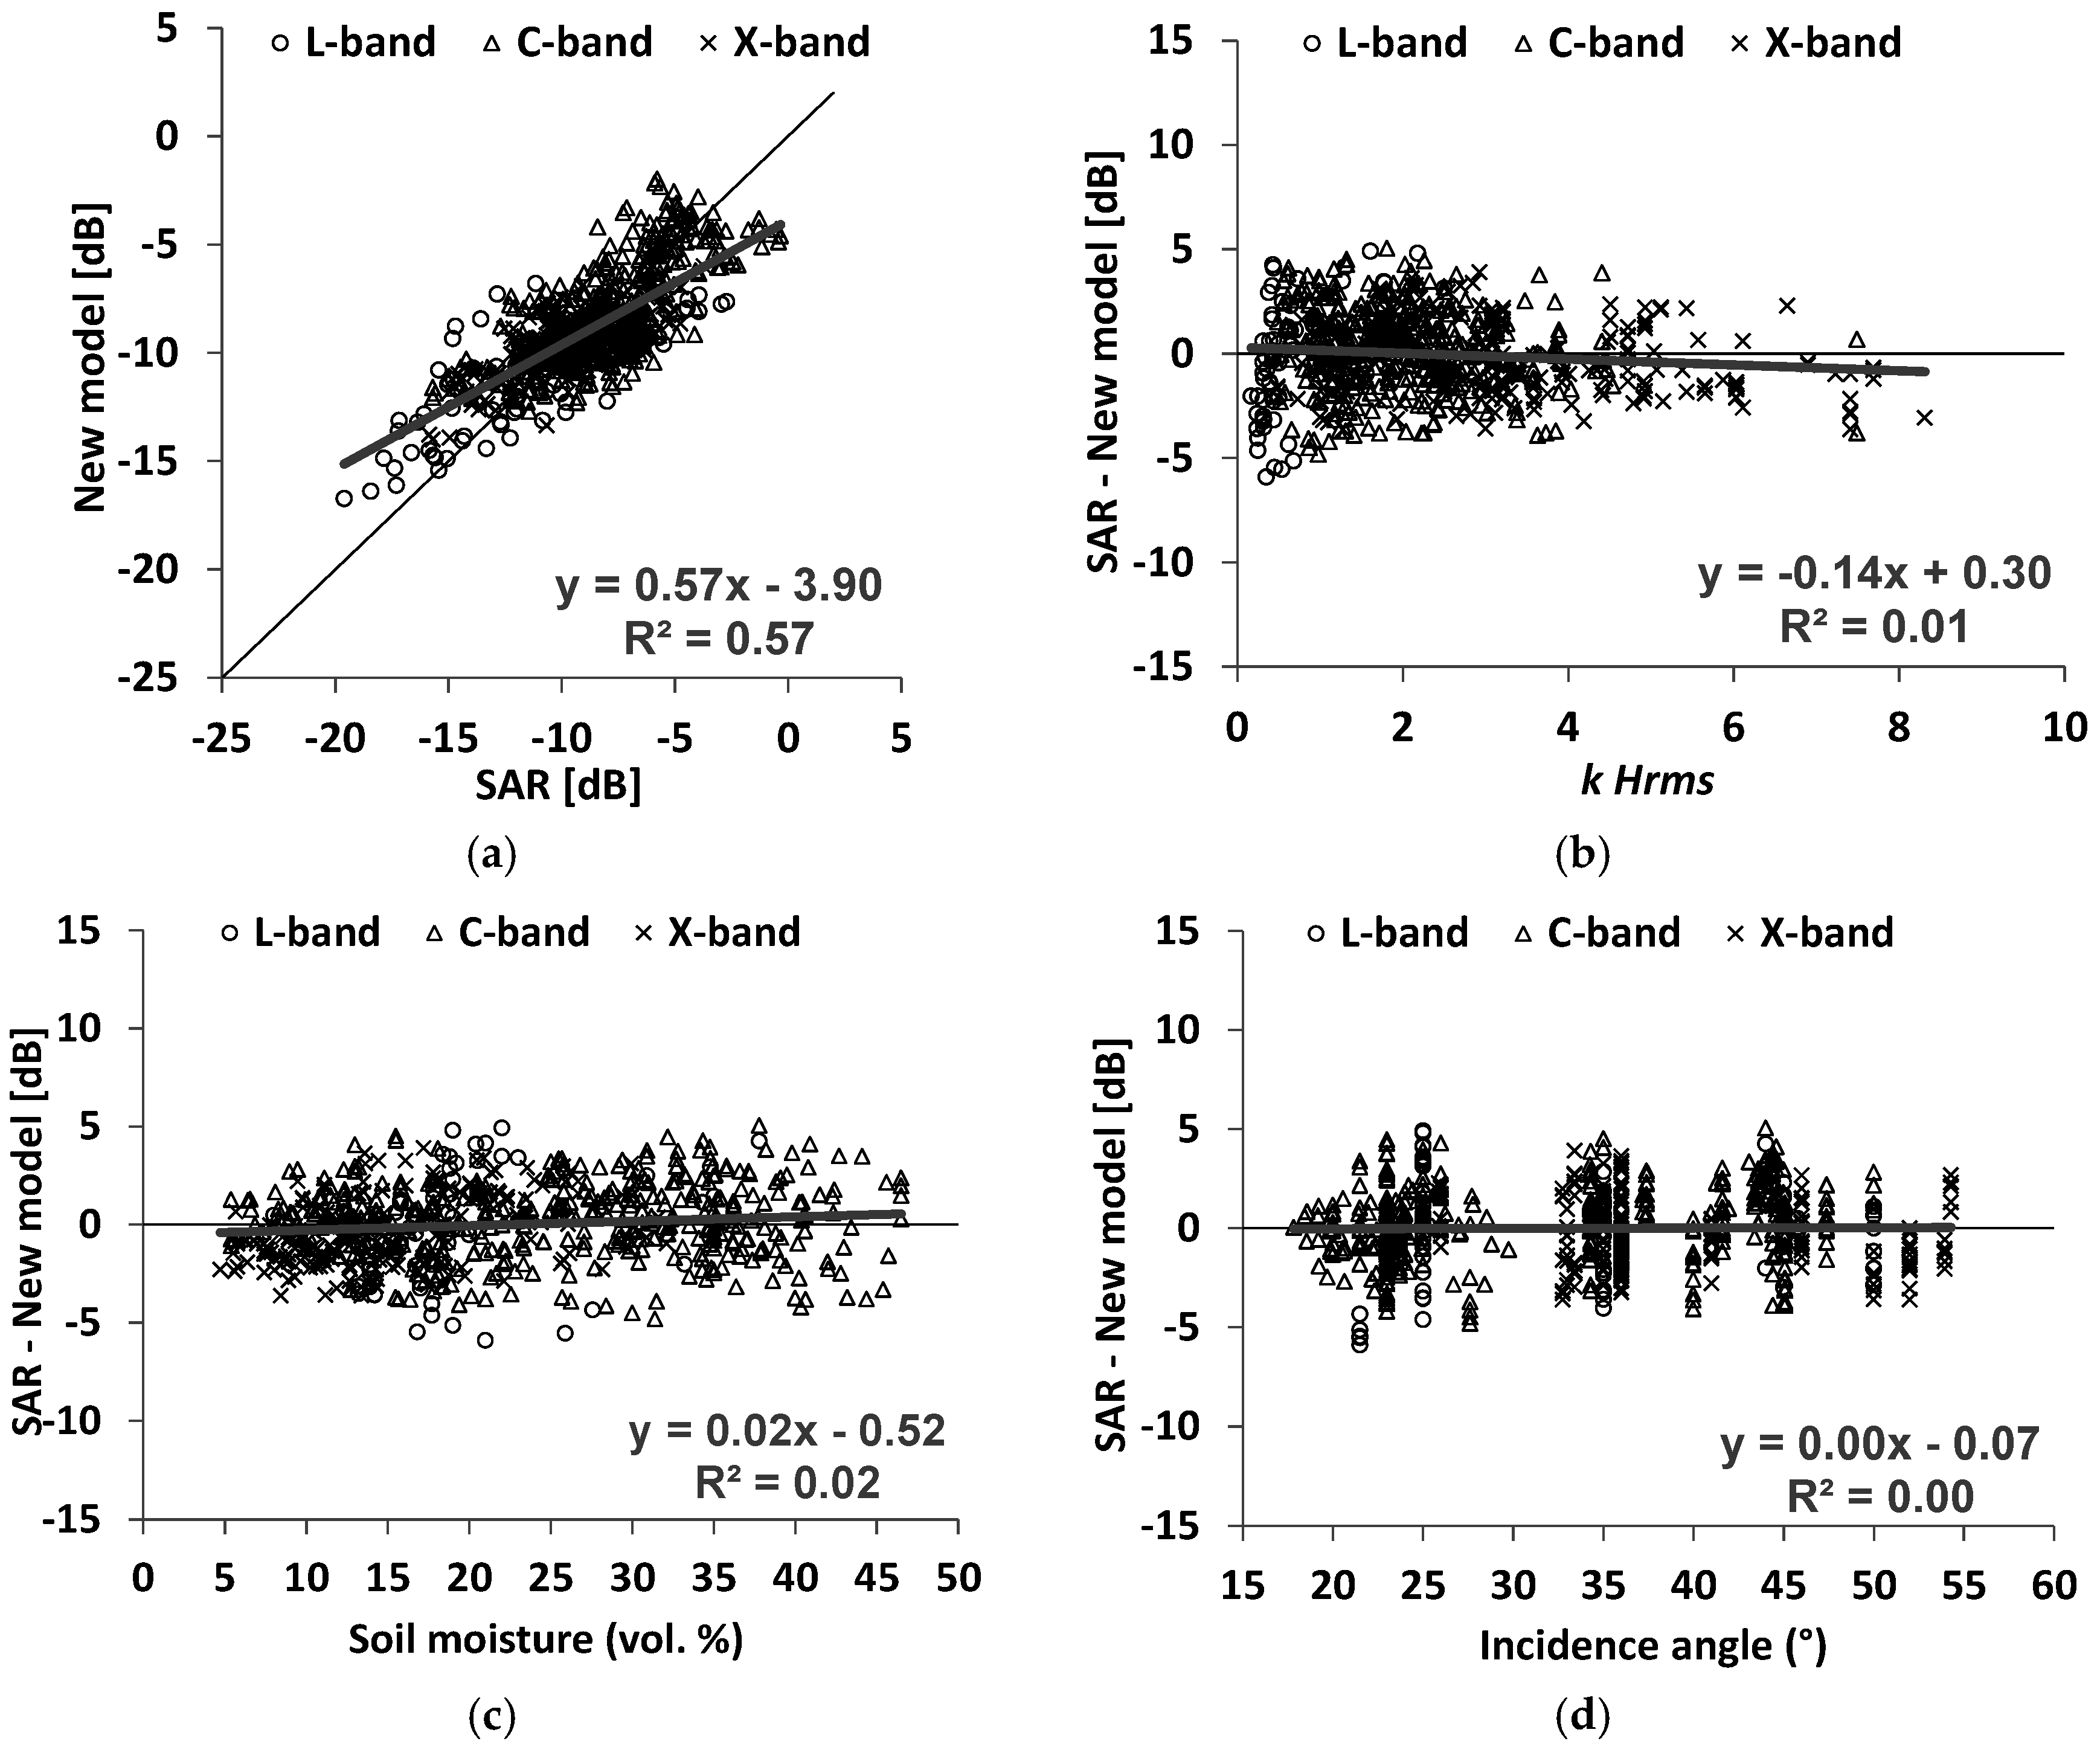
Results show that the new model provides more accurate results. The biases and the RMSE decrease for both HH and VV polarizations. The RMSE decreases from 3.8 dB to 2.0 dB for HH and from 2.8 dB to 1.9 dB for VV (
Table 3). In addition, the high over- or underestimations of radar backscattering coefficients observed with the Dubois model according to soil moisture, surface roughness, and radar incidence angle are clearly eliminated with the new model (
Figure 3 and
Figure 4).
Analysis of the new model’s performance for each radar wavelength, separately (L-, C- and X-bands), shows that the most significant improvement is observed in the X-band with an RMSE that decreases from 4.1 dB to 1.9 dB in HH and from 3.2 dB to 1.8 dB in VV. In the L-band, the performance of the new model is no better than that of the Dubois model because the RMSE decreases slightly with the new model, from 3.0 dB to 2.3 dB in HH, and remains similar in VV (RMSE = 2.3 dB with the Dubois model and 2.7 dB with the new model). The improvement is also important for the C-band with an RMSE that decreases from 3.7 dB to 1.9 dB in HH and from 2.6 dB to 1.9 dB in VV. With respect to bias, the results show that it decreases with the new model for all radar wavelengths. In addition, the new model does not show bias according to the range of soil moisture, surface roughness, and radar incidence angle.
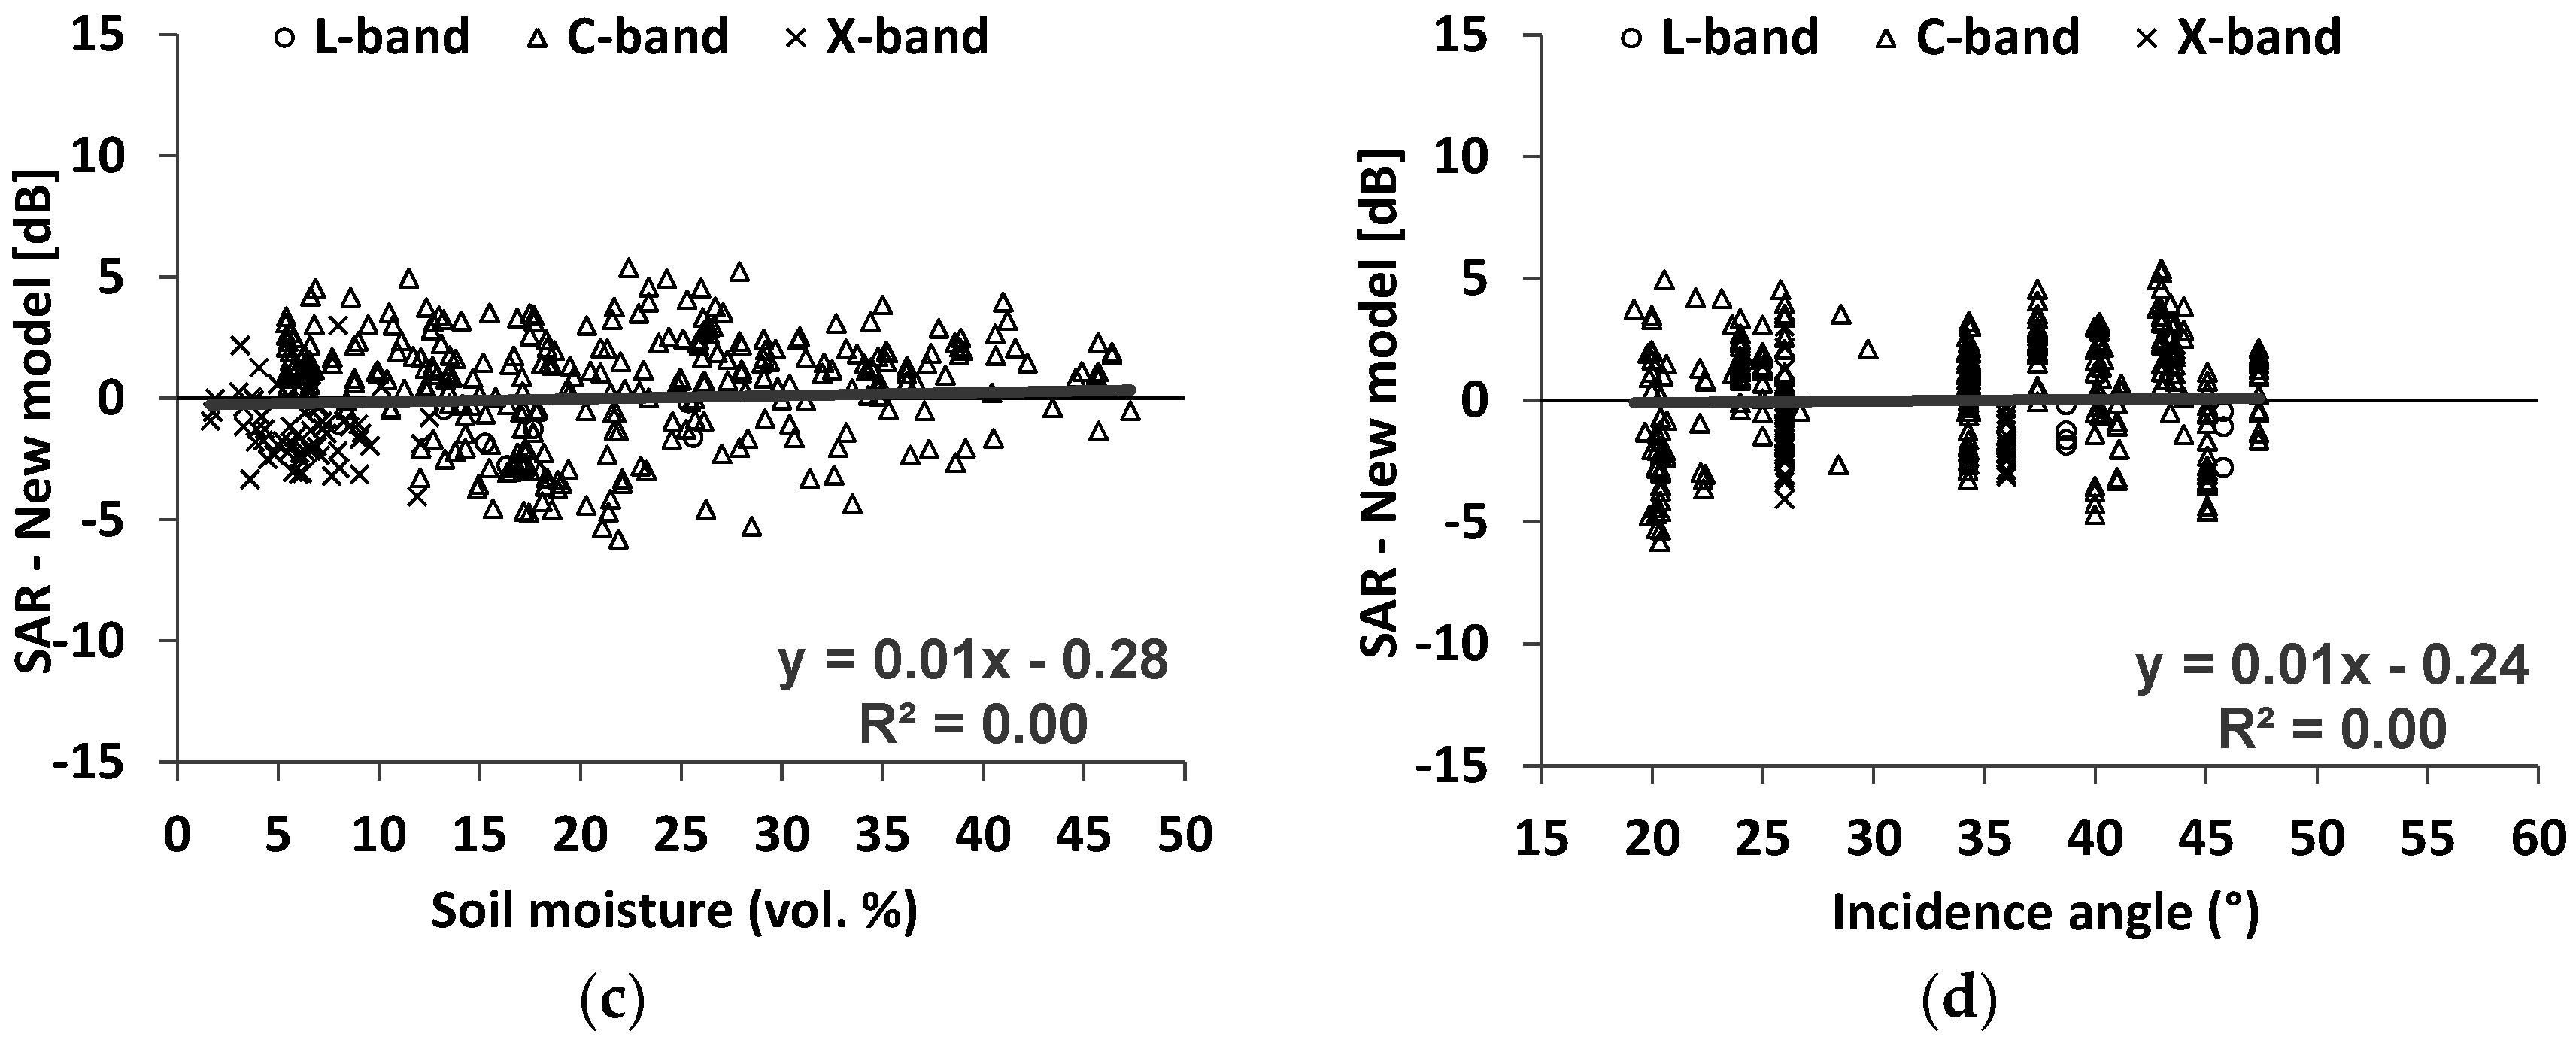
The comparison between the new model simulations in HV polarization Equation (7) and the real data (SAR data) shows an RMSE of 2.1 dB (
Table 3) (1.6 dB in the L-band, 2.2 dB in the C-band, and 1.9 dB in the X-band). The bias (σ°SAR—model) is −1.3 dB in the L-band, 0.2 dB in the C-band, and −1.3 dB in the X-band.
Figure 5 shows also that the new model correctly simulates the radar backscatter coefficient in HV for all ranges of soil moisture, surface roughness, and radar incidence angle.
4.2.2. Behavior of the New Model
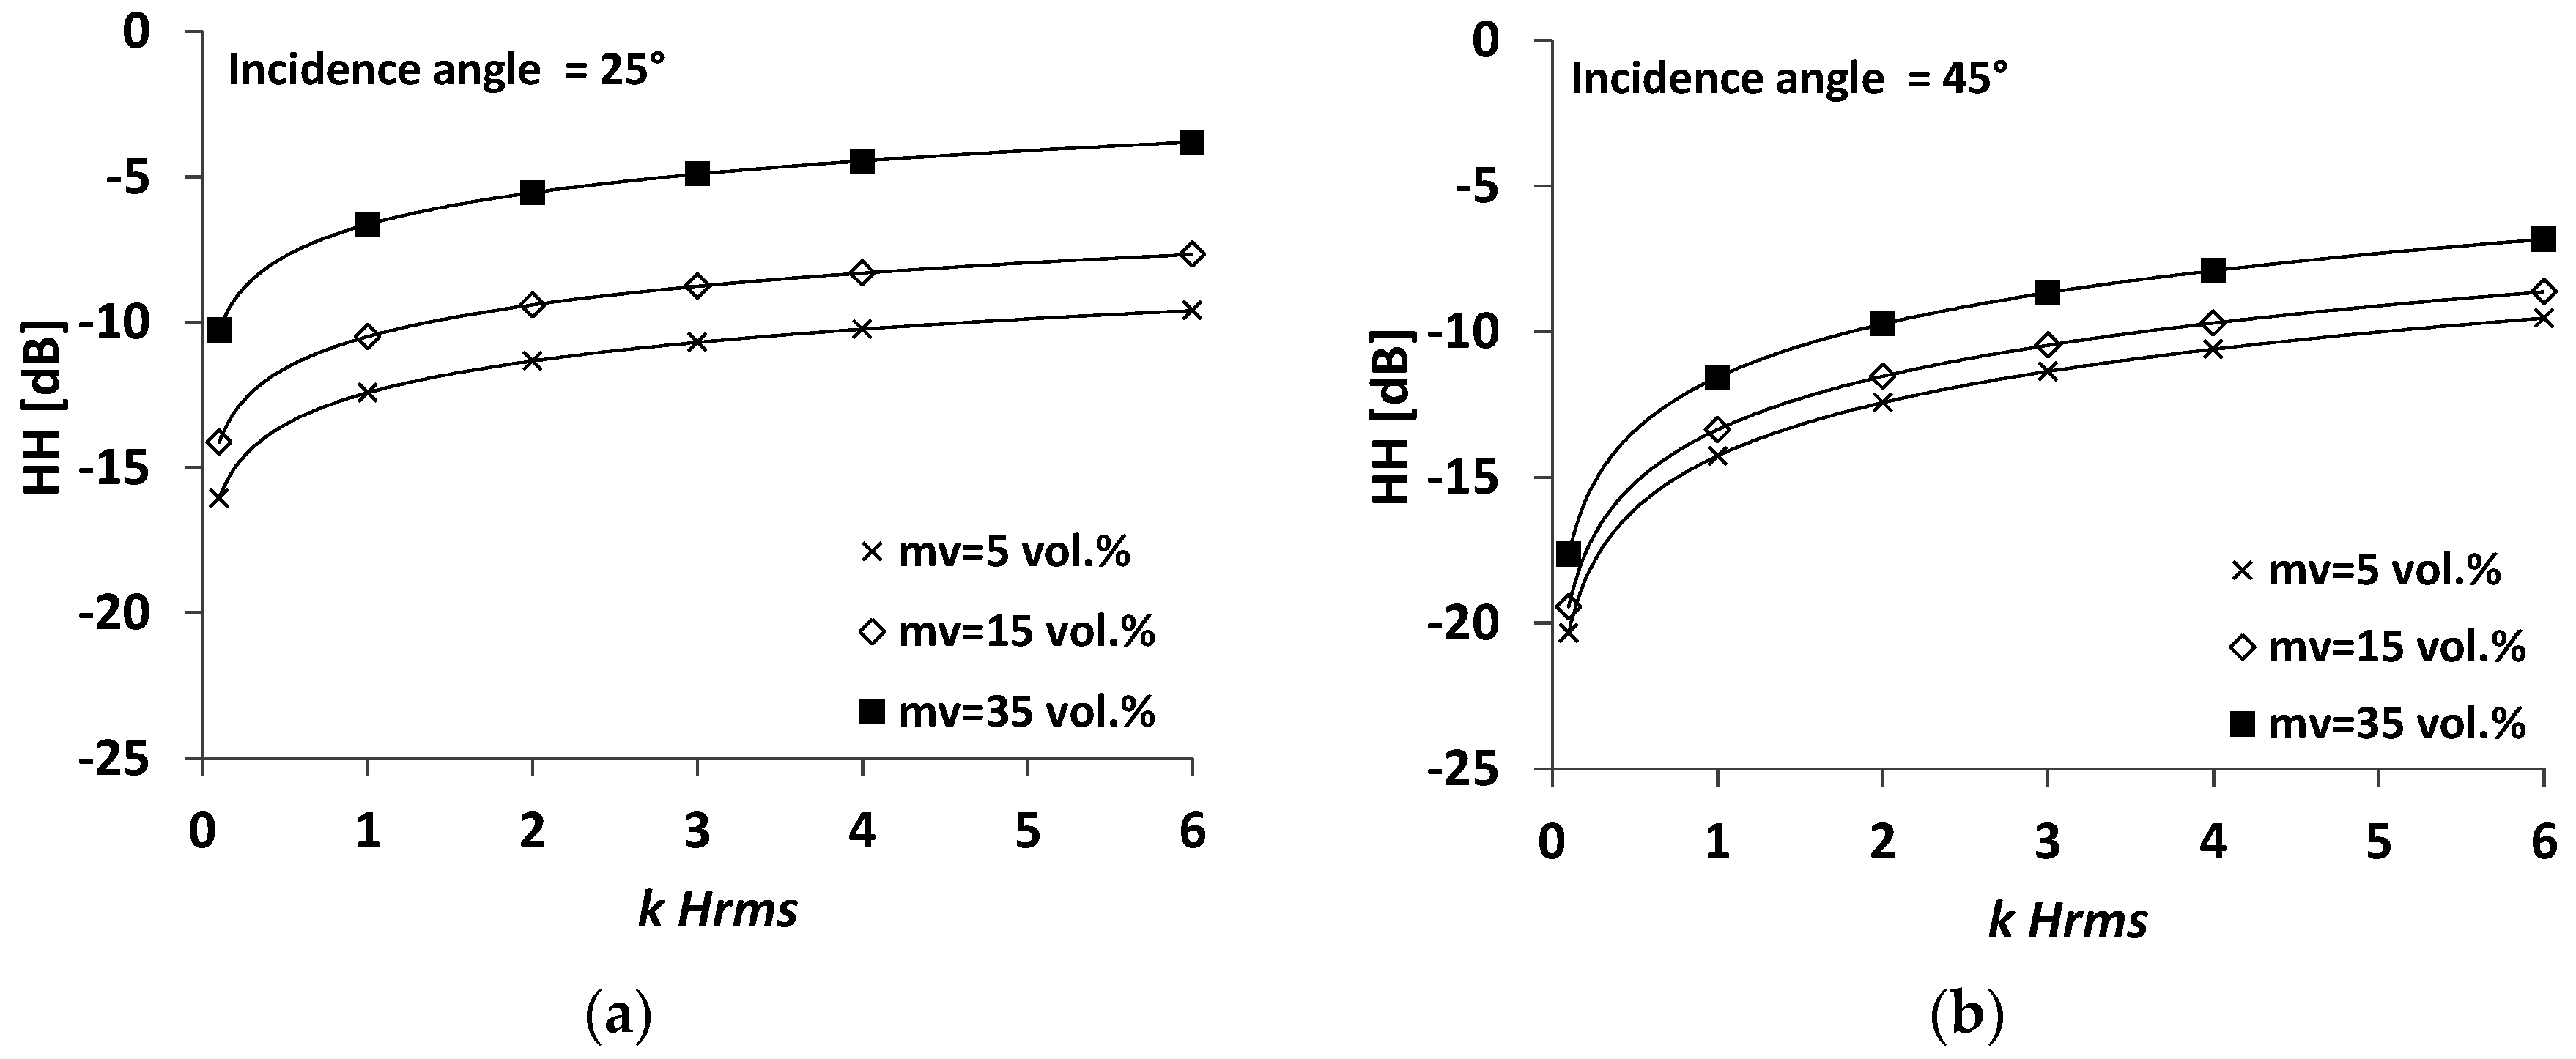
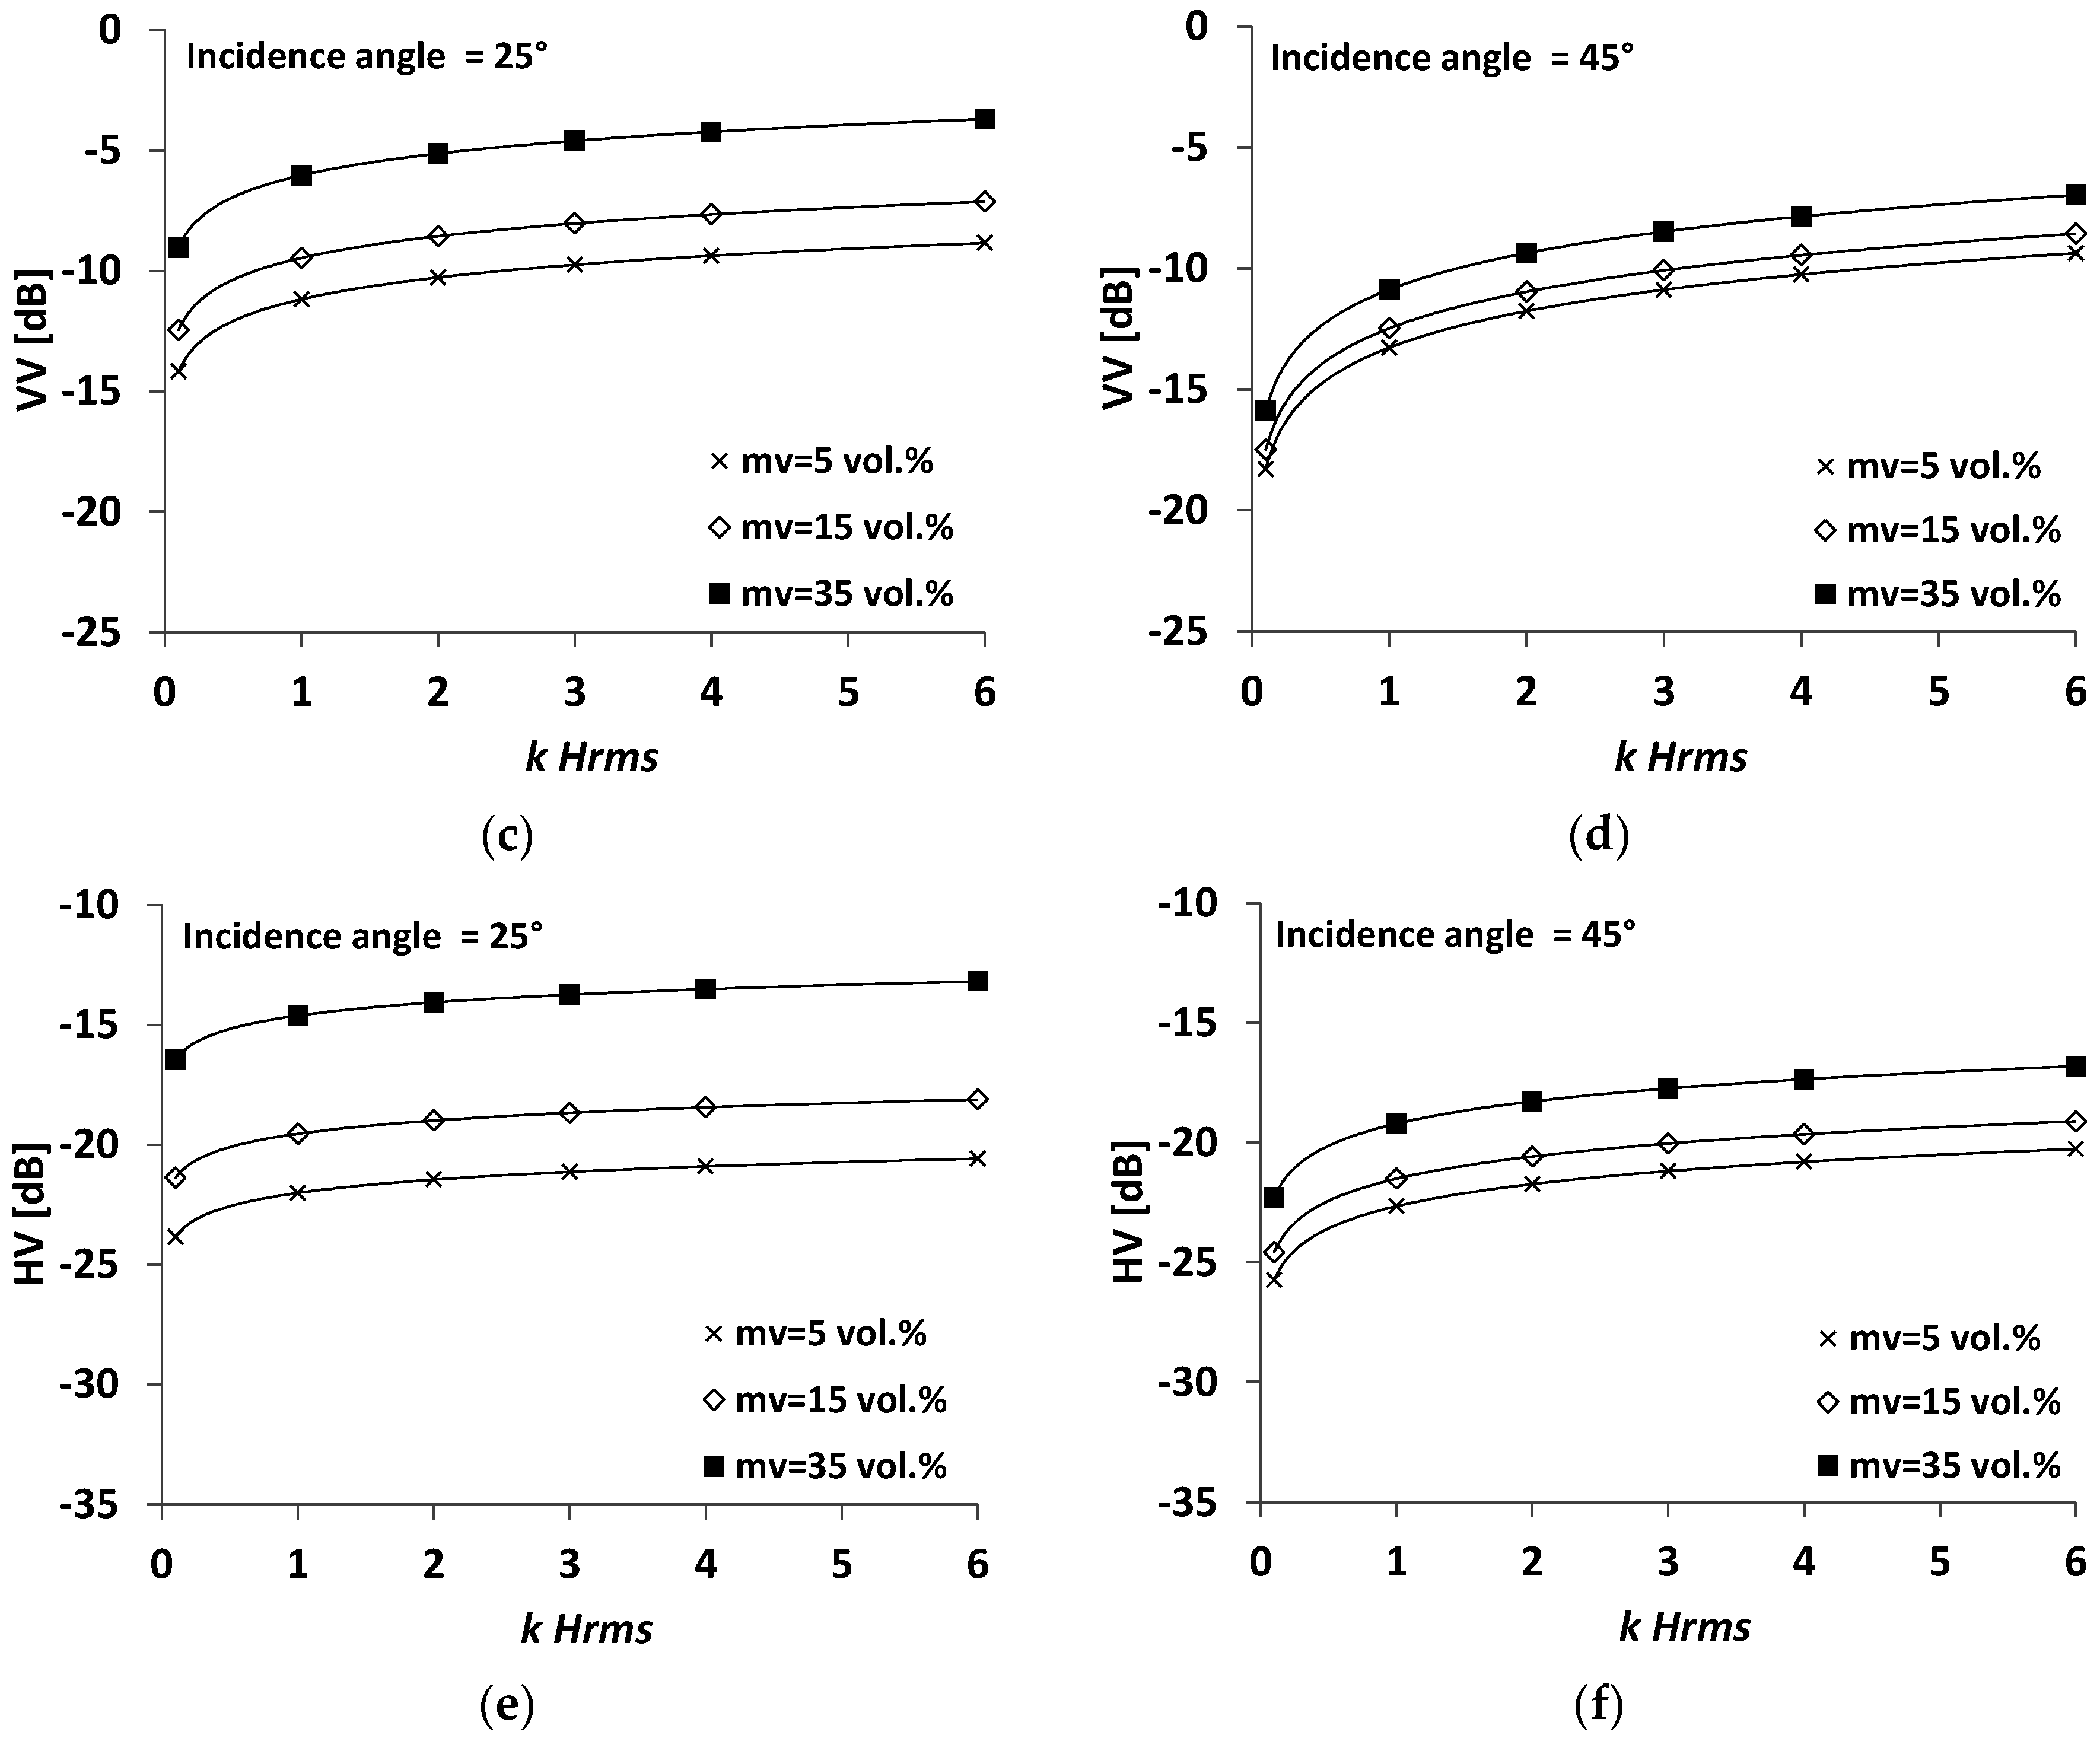
The physical behavior of the new radar backscatter model was studied as a function of the incidence angle (θ), soil moisture (mv), and surface roughness (kHrms).
Figure 6 shows that the radar signal is strongly sensitive to surface roughness, especially for small values of
kHrms. In addition, this sensitivity increases with the incidence angle. Concerning the influence of polarization, the new model shows, as do many theories and experimental studies, that a given soil roughness leads to slightly higher signal dynamics with the soil moisture in HH than in VV polarization [
17,
46]. The radar signal σ° increases with
kHrms. This increase is higher for either low
kHrms values or high θ values than it is for either high
kHrms values or low θ values. For
θ = 45°,
σ° increases approximately 8 dB in HH and 6.5 dB in VV when
kHrms increases from 0.1 to 2 compared with only 3 dB when
kHrms increases from two to six (for both HH and VV). This dynamic of
σ° is only half for
θ = 25° in comparison to that for
θ = 45°. In HV, the dynamic of
σ° to
kHrms is half that observed for HH and VV.
The behavior of
σ° according to soil moisture shows a larger increase of σ° with
mv for low incidence angles than for high incidence angles.
Figure 6 shows that
σ°HH and
σ°VV increase approximately 6 dB for
θ = 25° compared with only 3 dB for
θ = 45° when
mv increases from five to 35 vol%. In HV, the signal increases approximately 7.5 dB for
θ = 25° and 3.5 dB for
θ = 45° when
mv increases from 5 to 35 vol%.
As mentioned in Dubois et al. [
12], the ratio
should increase with
kHrms and remain less than 1. The new model shows that this condition is satisfied when 20°< θ < 45°,
kHrms < 6 and
mv < 35 vol%.
5. Conclusions
This investigation’s objective is to propose a new empirical model for radar backscatter from bare soil surfaces. The new model is based on the formulation made in the Dubois model where the radar signal in HH and VV polarizations is described according to radar wavelength, incidence angle, soil moisture, and roughness. This new model is based on the formulation made in the Dubois model. A large dataset was used, composed of ground measurements and SAR images over bare agricultural soils.
Results show that the new model provides improved results in comparison to the Dubois model (in the case of HH and VV). Biases and RMSE have decreased for both HH and VV polarizations. In addition, the high over- or under-estimations observed with the Dubois model for some ranges of soil moisture, surface roughness, and radar incidence angles were clearly eliminated with the new model. Analysis of the new model’s performance for each radar wavelength separately (L, C, and X) shows that, in the L-band, the performance of the new model was similar to that of the Dubois model. The model shows significant improvement in C- and X-bands (RMSE approximately 1.9 dB with the new model and between 2.6–4.1 dB with the Dubois model).
Based on the same equation as that used for HH and VV, a radar signal in HV polarization was also proposed. Finally, the new empirical model proposed in the present study would allow more accurate soil moisture estimates using the new Sentinel-1A and -1B SAR data.
Acknowledgments
This research was supported by IRSTEA (National Research Institute of Science and Technology for Environment and Agriculture), the French Space Study Center (CNES, TOSCA 2016) and the Belgian Science Policy Office (Contract SR/00/302). Hans Lievens is a postdoctoral research fellow of the Research Foundation Flanders (FWO). Authors thank the space agencies that provided AIRSAR, SIR-C, JERS-1, ERS-1/2, RADARSAT-1/2, ASAR, PALSAR-1, TerraSAR-X, COSMO-SkyMed, and ESAR data.
Author Contributions
Nicolas Baghdadi conceived the study; Nicolas Baghdadi performed the modeling Nicolas Baghdadi, Mohammad Choker and Mohammad El Hajj analyzed the results; Nicolas Baghdadi wrote the paper; Nicolas Baghdadi, Mohammad Choker, Mehrez Zribi, Mohammad El Hajj, Simonetta Paloscia, Niko E. C. Verhoest, Hans Lievens, Frederic Baup and Francesco Mattia revised the paper.
Conflicts of Interest
The authors declare no conflict of interest.
References
- Rao, S.S.; Kumar, S.D.; Das, S.N. Modified Dubois model for estimating soil moisture with dual polarized SAR data. J. Indian Soc. Remote Sens. 2013, 41, 865–872. [Google Scholar]
- Chai, X.; Zhang, T.T.; Shao, Y.; Gong, H.Z.; Liu, L.; Xie, K.X. Modeling and mapping soil moisture of plateau pasture using RADARSAT-2 imagery. Remote Sens. 2015, 7, 1279–1299. [Google Scholar]
- Kirimi, F.; Kuria, D.N.; Frank Thonfeld, F.; Amler, E.; Mubea, K.; Misana, S.; Gunter Menz, G. Influence of vegetation cover on the Oh soil moisture retrieval model: A case study of the Malinda Wetland, Tanzania. Adv. Remote Sens. 2016, 5, 28–42. [Google Scholar]
- Gherboudj, I.; Magagi, R.; Berg, A.A.; Toth, B. Soil moisture retrieval over agricultural Felds from multi-polarized and multi-angular RADARSAT-2 SAR data. Remote Sens. Environ. 2011, 115, 33–43. [Google Scholar] [CrossRef]
- Zribi, M.; Chahbi, A.; Shabou, M.; Lili-Chabaane, Z.; Duchemin, B.; Baghdadi, N.; Amri, R.; Chehbouni, A. Soil surface moisture estimation over a semi-arid region using ENVISAT ASAR radar data for soil evaporation evaluation. Hydrol. Earth Syst. Sci. 2011, 15, 345–358. [Google Scholar] [CrossRef] [Green Version]
- Le Hegarat-Mascle, S.; Zribi, M.; Alem, F.; Weisse, A.; Loumagne, C. Soil moisture estimation from ERS/SAR data: Toward an operational methodology. IEEE Trans. Geosci. Remote Sens. 2002, 40, 2647–2658. [Google Scholar] [CrossRef]
- Zribi, M.; Dechambre, M. A new empirical model to retrieve soil moisture and roughness from Radar Data. Remote Sens. Environ. 2003, 84, 42–52. [Google Scholar] [CrossRef]
- Oh, Y.; Sarabandi, K.; Ulaby, F.T. An empirical model and an inversion technique for radar scattering from bare soil surfaces. IEEE Trans. Geosci. Remote Sens. 1992, 30, 370–381. [Google Scholar] [CrossRef]
- Oh, Y.; Kay, Y. Condition for precise measurement of soil surface roughness. IEEE Trans. Geosci. Remote Sens. 1998, 36, 691–695. [Google Scholar]
- Oh, Y.; Sarabandi, K.; Ulaby, F.T. Semi-empirical model of the ensemble-averaged differential Mueller matrix for microwave backscattering from bare soil surfaces. IEEE Trans. Geosci. Remote Sens. 2002, 40, 1348–1355. [Google Scholar] [CrossRef]
- Oh, Y. Quantitative retrieval of soil moisture content and surface roughness from multipolarized radar observations of bare soil surfaces. IEEE Trans. Geosci. Remote Sens. 2004, 42, 596–601. [Google Scholar] [CrossRef]
- Dubois, P.C.; Van Zyl, J.; Engman, T. Measuring soil moisture with imaging radars. IEEE Trans. Geosci. Remote Sens. 1995, 33, 915–926. [Google Scholar] [CrossRef]
- Baghdadi, N.; Saba, E.; Aubert, M.; Zribi, M.; Baup, F. Comparison between backscattered TerraSAR signals and simulations from the radar backscattering models IEM, Oh, and Dubois. IEEE Geosci. Remote Sens. Lett. 2011, 8, 1160–1164. [Google Scholar] [CrossRef]
- Baghdadi, N.; Zribi, M. Evaluation of radar backscatter models IEM, Oh and Dubois using experimental observations. Int. J. Remote Sens. 2006, 27, 3831–3852. [Google Scholar] [CrossRef]
- Wang, H.; Méric, S.; Allain, S.; Pottier, E. Adaptation of Oh Model for soil parameters retrieval using multi-angular RADARSAT-2 datasets. J. Surv. Mapp. Eng. 2014, 2, 65–74. [Google Scholar]
- Wang, J.R.; Hsu, A.; Shi, J.C.; O’Neill, P.E.; Engman, E.T. A comparison of soil moisture retrieval models using SIR-C measurements over the Little Washita River watershed. Remote Sens. Environ. 1997, 59, 308–320. [Google Scholar] [CrossRef]
- Zribi, M.; Taconet, O.; Le Hégarat-Mascle, S.; Vidal-Madjar, D.; Emblanch, C.; Loumagne, C.; Normand, M. Backscattering behavior and simulation comparison over bare soils using SIRC/XSAR and ERASME 1994 data over Orgeval. Remote Sens. Environ. 1997, 59, 256–266. [Google Scholar] [CrossRef]
- Baghdadi, N.; Dubois-Fernandez, P.; Dupuis, X.; Zribi, M. Sensitivity of mail polarimetric parameters of multifrequency polarimetric SAR data to soil moisture and surface roughness over bare agricultural soils. IEEE Geosci. Remote Sens. Lett. 2013, 10, 731–735. [Google Scholar] [CrossRef] [Green Version]
- Baghdadi, N.; Zribi, M.; Loumagne, C.; Ansart, P.; Paris Anguela, T. Analysis of TerraSAR-X data and their sensitivity to soil surface parameters over bare agricultural fields. Remote Sens. Environ. 2008, 112, 4370–4379. [Google Scholar] [CrossRef]
- Baghdadi, N.; Aubert, M.; Zribi, M. Use of TerraSAR-X data to retrieve soil moisture over bare soil agricultural fields. IEEE Geosci. Remote Sens. Lett. 2012, 9, 512–516. [Google Scholar] [CrossRef] [Green Version]
- Baghdadi, N.; Gherboudj, I.; Zribi, M.; Sahebi, M.; Bonn, F.; King, C. Semi-empirical calibration of the IEM backscattering model using radar images and moisture and roughness field measurements. Int. J. Remote Sens. 2004, 25, 3593–3623. [Google Scholar] [CrossRef]
- Baghdadi, N.; King, C.; Bourguignon, A.; Remond, A. Potential of ERS and RADARSAT data for surface roughness monitoring over bare agricultural fields: Application to catchments in Northern France. Int. J. Remote Sens. 2002, 23, 3427–3442. [Google Scholar] [CrossRef]
- Holah, H.; Baghdadi, N.; Zribi, M.; Bruand, A.; King, C. Potential of ASAR/ENVISAT for the characterisation of soil surface parameters over bare agricultural fields. Remote Sens. Environ. 2005, 96, 78–86. [Google Scholar] [CrossRef] [Green Version]
- Baghdadi, N.; Holah, N.; Zribi, M. Calibration of the Integral Equation Model for SAR data in C-band and HH and VV polarizations. Int. J. Remote Sens. 2006, 27, 805–816. [Google Scholar] [CrossRef]
- Le Morvan, A.; Zribi, M.; Baghdadi, N.; Chanzy, A. Soil moisture profile effect on radar signal measurement. Remote Sens. 2008, 8, 256–270. [Google Scholar] [CrossRef]
- Baghdadi, N.; Cresson, R.; El Hajj, M.; Ludwig, R.; La Jeunesse, I. Estimation of soil parameters over bare agriculture areas from C-band polarimetric SAR data using neural networks. Hydrol. Earth Syst. Sci. (HESS) 2012, 16, 1607–1621. [Google Scholar] [CrossRef] [Green Version]
- Baghdadi, N.; Aubert, M.; Cerdan, O.; Franchistéguy, L.; Viel, C.; Martin, E.; Zribi, M.; Desprats, J.F. Operational mapping of soil moisture using synthetic aperture radar data: Application to Touch basin (France). Sens. J. 2007, 7, 2458–2483. [Google Scholar] [CrossRef]
- Zribi, M.; Gorrab, A.; Baghdadi, N.; Lili-Chabaane, Z. Influence of radar frequency on the relationship between bare surface soil moisture vertical profile and radar backscatter. IEEE Geosci. Remote Sens. Lett. 2014, 11, 848–852. [Google Scholar] [CrossRef] [Green Version]
- Gorrab, A.; Zribi, M.; Baghdadi, N.; Mougenot, B.; Lili-Chabaane, Z. Retrieval of both soil moisture and texture using TerraSAR-X images. Remote Sens. 2015, 7, 10098–10116. [Google Scholar] [CrossRef] [Green Version]
- Aubert, M.; Baghdadi, N.; Zribi, M.; Ose, K.; El Hajj, M.; Vaudour, E.; Gonzalez-Sosa, E. Toward an operational bare soil moisture mapping using TerraSAR-X data acquired over agricultural areas. IEEE J. Sel. Top. Appl. Earth Obs. Remote Sens. (JSTARS) 2013, 6, 900–916. [Google Scholar] [CrossRef] [Green Version]
- Dong, L.; Baghdadi, N.; Ludwig, R. Retrieving surface soil moisture using radar imagery in a semi-arid environment. IEEE Geosci. Remote Sens. Lett. 2013, 10, 461–465. [Google Scholar] [CrossRef] [Green Version]
- Baup, F.; Fieuzal, R.; Marais-Sicre, C.; Dejoux, J.-F.; le Dantec, V.; Mordelet, P.; Claverie, M.; Hagolle, O.; Lopes, A.; Keravec, P.; et al. MCM’10: An experiment for satellite multi-sensors crop monitoring. In From High to Low Resolution Observations, IEEE International Geoscience and Remote Sensing Symposium, Munich, Germany, 22–27 July 2012.
- Mattia, M.; Toan, T.L.; Souyris, J.C.; Carolis, G.D.; Floury, N.; Posa, F.; Pasquariello, G. The effect of surface roughness on multifrequency polarimetric SAR data. IEEE Trans. Geosci. Remote Sens. 1997, 35, 954–966. [Google Scholar] [CrossRef]
- Lievens, H.; Verhoest, N.E.C.; De Keyser, E.; Vernieuwe, H.; Matgen, P.; Álvarez-Mozos, J.; De Baets, B. Effective roughness modelling as a tool for soil moisture retrieval from C-and L-band SAR. Hydrol. Earth Syst. Sci. 2011, 15, 151–162. [Google Scholar] [CrossRef] [Green Version]
- Baronti, S.; Del Frate, F.; Ferrazzoli, P.; Paloscia, S.; Pampaloni, P.; Schiavon, G. SAR polarimetric features of agricultural areas. Int. J. Remote Sens. 1995, 16, 2639–2656. [Google Scholar] [CrossRef]
- Macelloni, G.; Paloscia, S.; Pampaloni, P.; Sigismondi, S.; de Matthæis, P.; Ferrazzoli, P.; Schiavon, G.; Solimini, D. The SIR-C/X-SAR experiment on Montespertoli: Sensitivity to hydrological parameters. Int. J. Remote Sens. 1999, 20, 2597–2612. [Google Scholar] [CrossRef]
- Paloscia, S.; Macelloni, G.; Pampaloni, P.; Sigismondi, S. The potential of C- and L-band SAR in estimating vegetation biomass: The ERS-1 and JERS-1 Experiments. IEEE Trans. Geosci. Remote Sens. 1999, 37, 2107–2110. [Google Scholar] [CrossRef]
- Ulaby, F.T.; Moore, R.K.; Fung, A.K. Microwave Remote Sensing; Addison-Wesley: New York, NY, USA, 1982. [Google Scholar]
- Beauchemin, M.; Thomson, K.; Edwards, G. Modelling forest stands with MIMICS: Implications for calibration. Can. J. Remote Sens. 1995, 21, 518–526. [Google Scholar] [CrossRef]
- Baghdadi, N.; Bernier, M.; Gauthier, R.; Neeson, I. Evaluation of C-band SAR data for wetlands mapping. Int. J. Remote Sens. 2001, 22, 71–88. [Google Scholar] [CrossRef]
- Baghdadi, N.; Holah, N.; Zribi, M. Soil moisture estimation using multi-incidence and multi-polarization ASAR SAR data. Int. J. Remote Sens. 2006, 27, 1907–1920. [Google Scholar] [CrossRef]
- Aubert, M.; Baghdadi, N.; Zribi, M.; Douaoui, A.; Loumagne, C.; Baup, F.; El Hajj, M.; Garrigues, S. Characterization of soil surface by TerraSAR-X imagery. Remote Sens. Environ. 2011, 115, 1801–1810. [Google Scholar] [CrossRef] [Green Version]
- Baghdadi, N.; Cerdan, O.; Zribi, M.; Auzet, V.; Darboux, F.; El Hajj, M.; Bou Kheir, R. Operational performance of current synthetic aperture radar sensors in mapping soil surface characteristics in agricultural environments: Application to hydrological and erosion modelling. Hydrol. Process. 2008, 22, 9–20. [Google Scholar] [CrossRef]
- Srivastava, H.S.; Patel, P.; Manchanda, M.L.; Adiga, S. Use of multi-incidence angle RADARSAT-1 SAR data to incorporate the effects of surface roughness in soil moisture estimation. IEEE Trans. Geosci. Remote Sens. 2003, 41, 1638–1640. [Google Scholar] [CrossRef]
- Sahebi, M.R.; Angles, J.; Bonn, F. A comparison of multi-polarization and multi-angular approaches for estimating bare soil surface roughness from spaceborne radar data. Can. J. Remote Sens. 2002, 28, 641–652. [Google Scholar] [CrossRef]
- Fung, A.K. Microwave Scattering and Emission Models and Their Applications; Artech House, Inc.: Boston, MA, USA, 1994. [Google Scholar]
© 2016 by the authors; licensee MDPI, Basel, Switzerland. This article is an open access article distributed under the terms and conditions of the Creative Commons Attribution (CC-BY) license (http://creativecommons.org/licenses/by/4.0/).


 ,
, 


