Simultaneous Automatic Electrochemical Detection of Zinc, Cadmium, Copper and Lead Ions in Environmental Samples Using a Thin-Film Mercury Electrode and an Artificial Neural Network

Abstract
: In this study a device for automatic electrochemical analysis was designed. A three electrodes detection system was attached to a positioning device, which enabled us to move the electrode system from one well to another of a microtitre plate. Disposable carbon tip electrodes were used for Cd(II), Cu(II) and Pb(II) ion quantification, while Zn(II) did not give signal in this electrode configuration. In order to detect all mentioned heavy metals simultaneously, thin-film mercury electrodes (TFME) were fabricated by electrodeposition of mercury on the surface of carbon tips. In comparison with bare electrodes the TMFEs had lower detection limits and better sensitivity. In addition to pure aqueous heavy metal solutions, the assay was also performed on mineralized rock samples, artificial blood plasma samples and samples of chicken embryo organs treated with cadmium. An artificial neural network was created to evaluate the concentrations of the mentioned heavy metals correctly in mixture samples and an excellent fit was observed (R2 = 0.9933).1. Introduction
Metals mainly occur in the Earth's crust, however, urbanization and industrialization lead to their releasing into the biosphere, where they have become part of the air, soil, water and biota [1–3]. As a consequence of the metabolic similarity of toxic metals with non-toxic elements, they bind to the sulfhydryl groups of proteins causing negative effects, including mutagenesis [4,5]. Some metals, such as copper (Cu) and zinc (Zn), are essential micronutrients, although they are also toxic in higher concentrations. On the other hand, other metals as cadmium, lead and mercury can damage numerous biochemical pathways, even at low concentration. Due to this fact and the fact that the one-half of the World's population lives now in urbanized areas, metals continue to present a serious issue for public health [6].
Several methods have been developed to detect trace amounts of heavy metals. Conventional heavy metal detection methods include atomic absorption spectrometry (AAS), inductively coupled plasma mass spectrometry (ICP-MS) or inductively coupled plasma optical emission spectroscopy (ICP-OES) [7–9]. However, they do not meet the demands for portable, easy-to-use, quick and cheap analysis. In this field, electrochemical analysis of heavy metals is an alternative to conventional methods and provides a few attractive properties, in addition to a high degree of sensitivity [10–12]. Electrochemistry offers unique application possibilities in the field of heavy metal analysis due to the compact, simple and portable instrumentation, electrode miniaturisation and easy electrode modification [13–15]. Electrochemistry was also proved to be suitable method to analyse heavy metal contents in biological and environmental samples like body fluids, tissues or rocks [16–18]. Gallus domesticus hen and its embryos are broadly used as a model organism [19], where the liver represents the organ of initial Cd accumulation and recent study shows that high levels of Cd can be presented also in brain [20].
Among other electrode materials suitable for these purposes, mercury and carbon have been used the most frequently. In spite of the fact that mercury has unique physico-chemical properties and are widely used in trace heavy metal analysis, neither the dropping mercury electrode nor the hanging mercury drop electrode are suitable for automated analysis methods because of their mechanical instability (the mercury drop is easily dislodged). High consumption of metallic mercury in these cases also does not correspond with current trends in heavy metal analysis, since much attention has been focused on the use of more eco-friendly solid materials like carbon and chemical modification of its surface to improve sensitivity [21,22]. Thin-film mercury electrodes (TFMEs) are able to resolve these limitations [23]. They decrease mercury consumption, enable electrode manipulation and preserve the key mercury electrode properties like a wide cathodic potential window. In this case, mercury is electrodeposited from a solution with low mercury concentration on the surface of a solid electrode, which serves as a mechanical support and enables easier manipulation. In the case of heavy metals analysis, anodic stripping voltammetry (ASV) exhibits remarkable sensitivity [24,25]. A more negative potential than the standard redox potential of the heavy metal ions is used to preconcentrate them on the mercury surface. A subsequent linear increase of the potential stripps them back into the solution represented by increased current at a specific potential. Pulse techniques like differential pulse or square wave voltammetry suppressing the background current were successfully combined with ASV to lower the limits of detection [26]. The only alternatives to mercury for stripping techniques are Bi-modified electrodes, however, their limitations are low anodic potential [27].
Moreover, there are also demands on high throughput analysis in the field of environmental monitoring. The long-term monitoring of heavy metal pollution is the only way to meet national and international legislative measures implemented to decrease the anthropogenic pressure on the environment. The automatic handling of samples shortens time-consuming analysis, enables one to perform multiple analyses without continuous operator attention and is also consistent with current trends in analytical chemistry. Automatic flow-based voltammetric detections of heavy metals were proven to have good accuracy and reproducibility and succeeded in reducing analysis times [28,29]. Use of titre plates for automatic analysis enables one to avoid the need for complex microfluidics and electrochemical flow-cells [30]. The potential of the electrochemical robotic system for automated quantification of Ni2+ ion released from corroding nickel-titanium alloys was recently demonstrated [31]. The electrochemical robotic system was designed for automatically performing adsorptive stripping voltammetry in individual compartments of 24-well microtiter plates. Displacing the preloaded plates in the x and y directions, locating an electrode assembly into the solution in a selected well, conditioning the working electrode surface, and finally executing adsorptive stripping voltammetry are key actions that had to be automated for the sequential determination of Ni2+ concentrations in sample solutions in the different wells of the microtiter plate [31]. In another work, automatic ascorbic acid voltammetry was performed in 24-well microtiter plates. The automated assay used a movable assembly of a pencil rod working electrode, an Ag/AgCl reference electrode and a Pt counter electrode using differential pulse anodic stripping voltammetry (DPASV) for concentration-dependent current generation [30].
Data obtained by voltammetric sensors from multicomponent environments produces complex signals. To solve this problem, several electrode surface functionalizations were developed to improve the electrode selectivity [12,32]. Alternatively, a multivariate signal processing tool can be used. Among others, artificial neural network (ANN) software-based techniques were developed to analyse complex data sets, and they excel in modelling and calibrating complex analytical signals [33]. There are many types of ANNs that vary mostly in the architecture or in the way they learn. It was proved that using ANN data analysis interference between target heavy metals ions and the effect of sample matrix can be counterbalanced and this also enables evaluate overlapped voltammograms [34–36]. This paper describes a novel application of the electrochemical robotic device that provides a convenient electrochemical 24-well microtiter plate assay for the automated quantification of multiple heavy metal samples containing Cd(II), Cu(II), Pb(II) and Zn(II) in pure aqueous model solutions, mineralized rocks, chicken embryo liver and brain and human plasma samples spiked with metals. The choice of the carbon tip electrode modified with mercury film as a working electrode, signal stability and reproducibility of known metal solution levels are reported. Moreover, artificial neural networks software-based techniques developed to analyse the complex data sets were also used in this study [37–40], because it was found that the presence of copper and zinc in samples may lead to the formation of intermetallic compounds on the mercury film and this affects analysis of both elements [41]. The correct zinc concentration in the presence of copper and vice versa can be, however, determined by ANN processing [42,43].
2. Experimental Section
2.1. Chemicals
ACS purity (i.e., chemicals meet the specifications of the American Chemical Society) sodium acetate trihydrate, acetic acid, Hg(NO3)2, water and other chemicals were purchased from Sigma-Aldrich (St. Louis, MO, USA) unless noted otherwise.
2.2. Instrumentation
An electrochemical robotic device (Sensolytics, Bochum, Germany) performed the automatic positioning of electrodes. Carbon tips (1 mL) were purchased from Tosoh Corporation (Tokyo, Japan) and were used as working electrodes after modification. Ag/AgCl/3M KCl as reference electrode (Metrohm, Herisau, Switzerland) and platinum wire (Metrohm, Herisau, Switzerland) as counter electrode were used. Electrochemical signals were recorded using a PGSTAT 101 potentiostat (Metrohm) and the NOVA 1.8 software (Metrohm) was employed for data evaluation. The electrode holder was printed by a PROFI 3D MARKER printing system (3Dfactories, Straznice, Czech Republic). Samples were measured in flat bottomed TPP tissue culture 24-well plates (Sigma-Aldrich).
2.2.1. Electrochemical Robotic Device
Electrodes were placed into the holder fabricated using the 3D printer. The electrochemical robotic device (Sensolytics) positioning the electrodes included three motorized units ST4118M1804 (Nanotec, Munich, Germany) and positioning system (OWIS, Staufen, Germany). The first unit was rigidly connected to the vertical frame of the electrochemical robot. The electrode holder was attached to it and this enabled us to perform precise vertical (z) positioning of the electrode holder (up and down). The microtiter plate was placed on a horizontally (x/y) positioned board. Coordinates and the precise time of the holder and plate motion were controlled by the ELChemRo software (Sensolytics). We used the advanced settings of NOVA to prepare a script enabling us to set up the sequence of differential pulse voltammetric measurements with adjustable time intervals between individual measurements.
2.2.2. Working Electrode
Automatic electrochemical detection was performed using a three electrodes system. A pipette tip made from polymeric material and coated by graphite enabled us to use it as a working electrode due to its conductive resin. Based on the mentioned facts, these electrodes can be used for detection of substances undergoing reduction and/or oxidation on the surface of such electrodes. In this study, detection of Cd(II), Pb(II), and Cu(II) was carried out by a bare working electrode. Carbon tip electrode modified with mercury film was employed for detection of Zn(II) ions (no reduction was observed using the bare electrode) and for detection of metal mixtures.
2.2.3. Modification of Carbon Tips
The carbon tips were inserted into 0.01 M Hg(NO3)2 solution, prepared by the dissolution of 0.086 g mecury(II) nitrate in 25 mL of acidified (5% HNO3, v/v) Milli-Q water. A −0.9 V potential was applied to the electrodes for 60 s, which resulted in the formation of a thin-film of mercury on the surface of the working electrode [44].
2.2.4. Method
We used differential pulse voltammetry for all measurements and measurement parameters were as follows: deposition potential −1.6 V, initial potential −1.6 V, end potential 0.1 V, step potential 0.005 (scan rate 50 mV·s−1), modulation amplitude 0.1 V, modulation time 0.004 s, interval time 0.1 s. All experiments were carried out at room temperature. Acetate buffer (0.2 M CH3COOH and 0.2 M CH3COONa) was used as the supporting electrolyte. The limit of detection was calculated as LOD = (3.3 × SD)/S, where SD = standard deviation of the response and S = slope of the calibration curve.
2.3. Statistical Analysis
First, simple regression was performed for each metal peak value–metal concentration pair. The following functions were tested: linear, logarithmic and exponential. The correlation of each regression was tested and then the optimal function for each metal was used. Based on these results, a nonlinear estimation using a user-determined regression function was created and the goodness of fit of the model was tested again. In the third step, an automated neuronal network was created. The following methods were tested: radial basis function and multilayer perceptron. The following activation functions were used for hidden and output neurons: identity, logistic, tan, and exponential. The number of hidden neurons was limited to 20 and was optimized during after the primary learning cycle. Weight decay was used to prevent overfitting using the following setting: 0.0001–0.001 (min–max) for both hidden and output layer. Data (645 samples in total) was randomly divided into a training group (70%), testing group (15%) and verification group (15%). A Broyden-Fletcher-Goldfarb-Shanno (BFGS) training algorithm was used. Unless noted otherwise, p-level 0.05 was considered significant. The software Statistica 12 (StatSoft, Tulsa, OK, USA) was used for analysis.
2.4. Sample Preparations
Fertilized egg of ISA brown hen (Integra, a.s., Zabcice, Czech Republic) was incubated in a RCom 50 MAX incubator (Gyeongnam, Changwon, Korea) at 37.5 °C and humidity control (45% rH). After 16 days of the incubation the embryo vitality was checked and then a solution of Cd(NO3)2•4H2O (4.5 mg·mL−1 in ACS water) was applied (500 μL) by injection using a Chirana T. injecta device (maximal volume: 1 mL, size: 0.33 × 12 mm) through a small hole in the egg shell into the air cell on the chorioallantoic membrane. After that the hole was covered by a plaster. The chicken embryo was incubated till the next day and then the brain and liver was extracted. From the chicken embryo, 10 mg of tissue (brain, liver) was equally removed, weighed and added to 500 μL of a mixture consisting of 350 μL 65% nitric acid (v/v) and 150 μL 30% hydrogen peroxide (v/v). The solutions were subjected to digestion in a microwave reaction system Anton Paar (Anton Paar GmbH, Graz, Austria) using the following conditions: time 40 min (10 min power 50, 30 min power 100 and 10 min power 0), 60 °C, Rotor-64MG5-16. Mineralized solutions (200 μL) were transferred to a 96-well Deepwell plate 96 evaporation plate (Eppendorf, Hamburg, Germany) and evaporated. For evaporation of samples an Ultravap 96 nitrogen blow-down evaporator with spiral needles (Porvair Sciences, Leatherhead, UK) was used. Finally, the solutions were dissolved in 0.2 M acetate buffer (200 μL, pH 5.0) and were diluted 10-fold with the same acetate buffer prior to analysis. Rock samples (10 mg) were prepared in the same manner as chicken samples. For mineralization the following conditions were used: time 110 min (100 min power-100 and 10 min power-0), 100 °C, Rotor-64MG5-16 and samples were diluted 1000-fold. The plasma samples with random heavy metal concentrations (0–6 μg·mL−1) were prepared as follows: to 10 μL of human plasma specific amount of metals ion stock solutions were added. Mineralized and evaporated samples were diluted to the original volume, then they were diluted 10-fold with acetate buffer (0.2 M, pH 5.0) and used for ANN evaluation.
2.5. Determination of Cadmium by Atomic Absorption Spectrometry
Cadmium was also determined on an Agilent Technologies 80 Z atomic absorption spectrometer (Agilent, Santa Clara, CA, USA) with electrothermal atomization. The spectrometer was operated at the 228.8 nm resonance line with a spectral bandwidth of 0.5 nm. The sample volume (20 μL) was injected into the graphite tube. The flow of argon inert gas was 300 mL·min−1. Zeeman background correction was used with a field strength of 0.8 Tesla. The absorption signal was evaluated in peak height mode with seven point smoothing.
2.6. X-Ray Fluorescence Analysis (XRF)
The rock samples were measured on a Spectro Xepos apparatus (Spectro Analytical Instruments, Kleve, Germany) using an anode X-ray tube with Pd anode working at a voltage of 44.69 kV and a current of 0.55 mA. Signals were detected with Barkla scatter aluminium oxide for 300 s. For excitation three secondary targets (Mo, Al2O3 and high-ordered pyrolithic graphite crystal) were used. The excitation geometry was 90°. The crushed samples were measured through the PE bottle side wall 20 mm above the bottom. The Spectro Xepos software and TurboQuant method were applied for data analysis.
3. Results and Discussion
3.1. Automatic System for Heavy Metal Detection
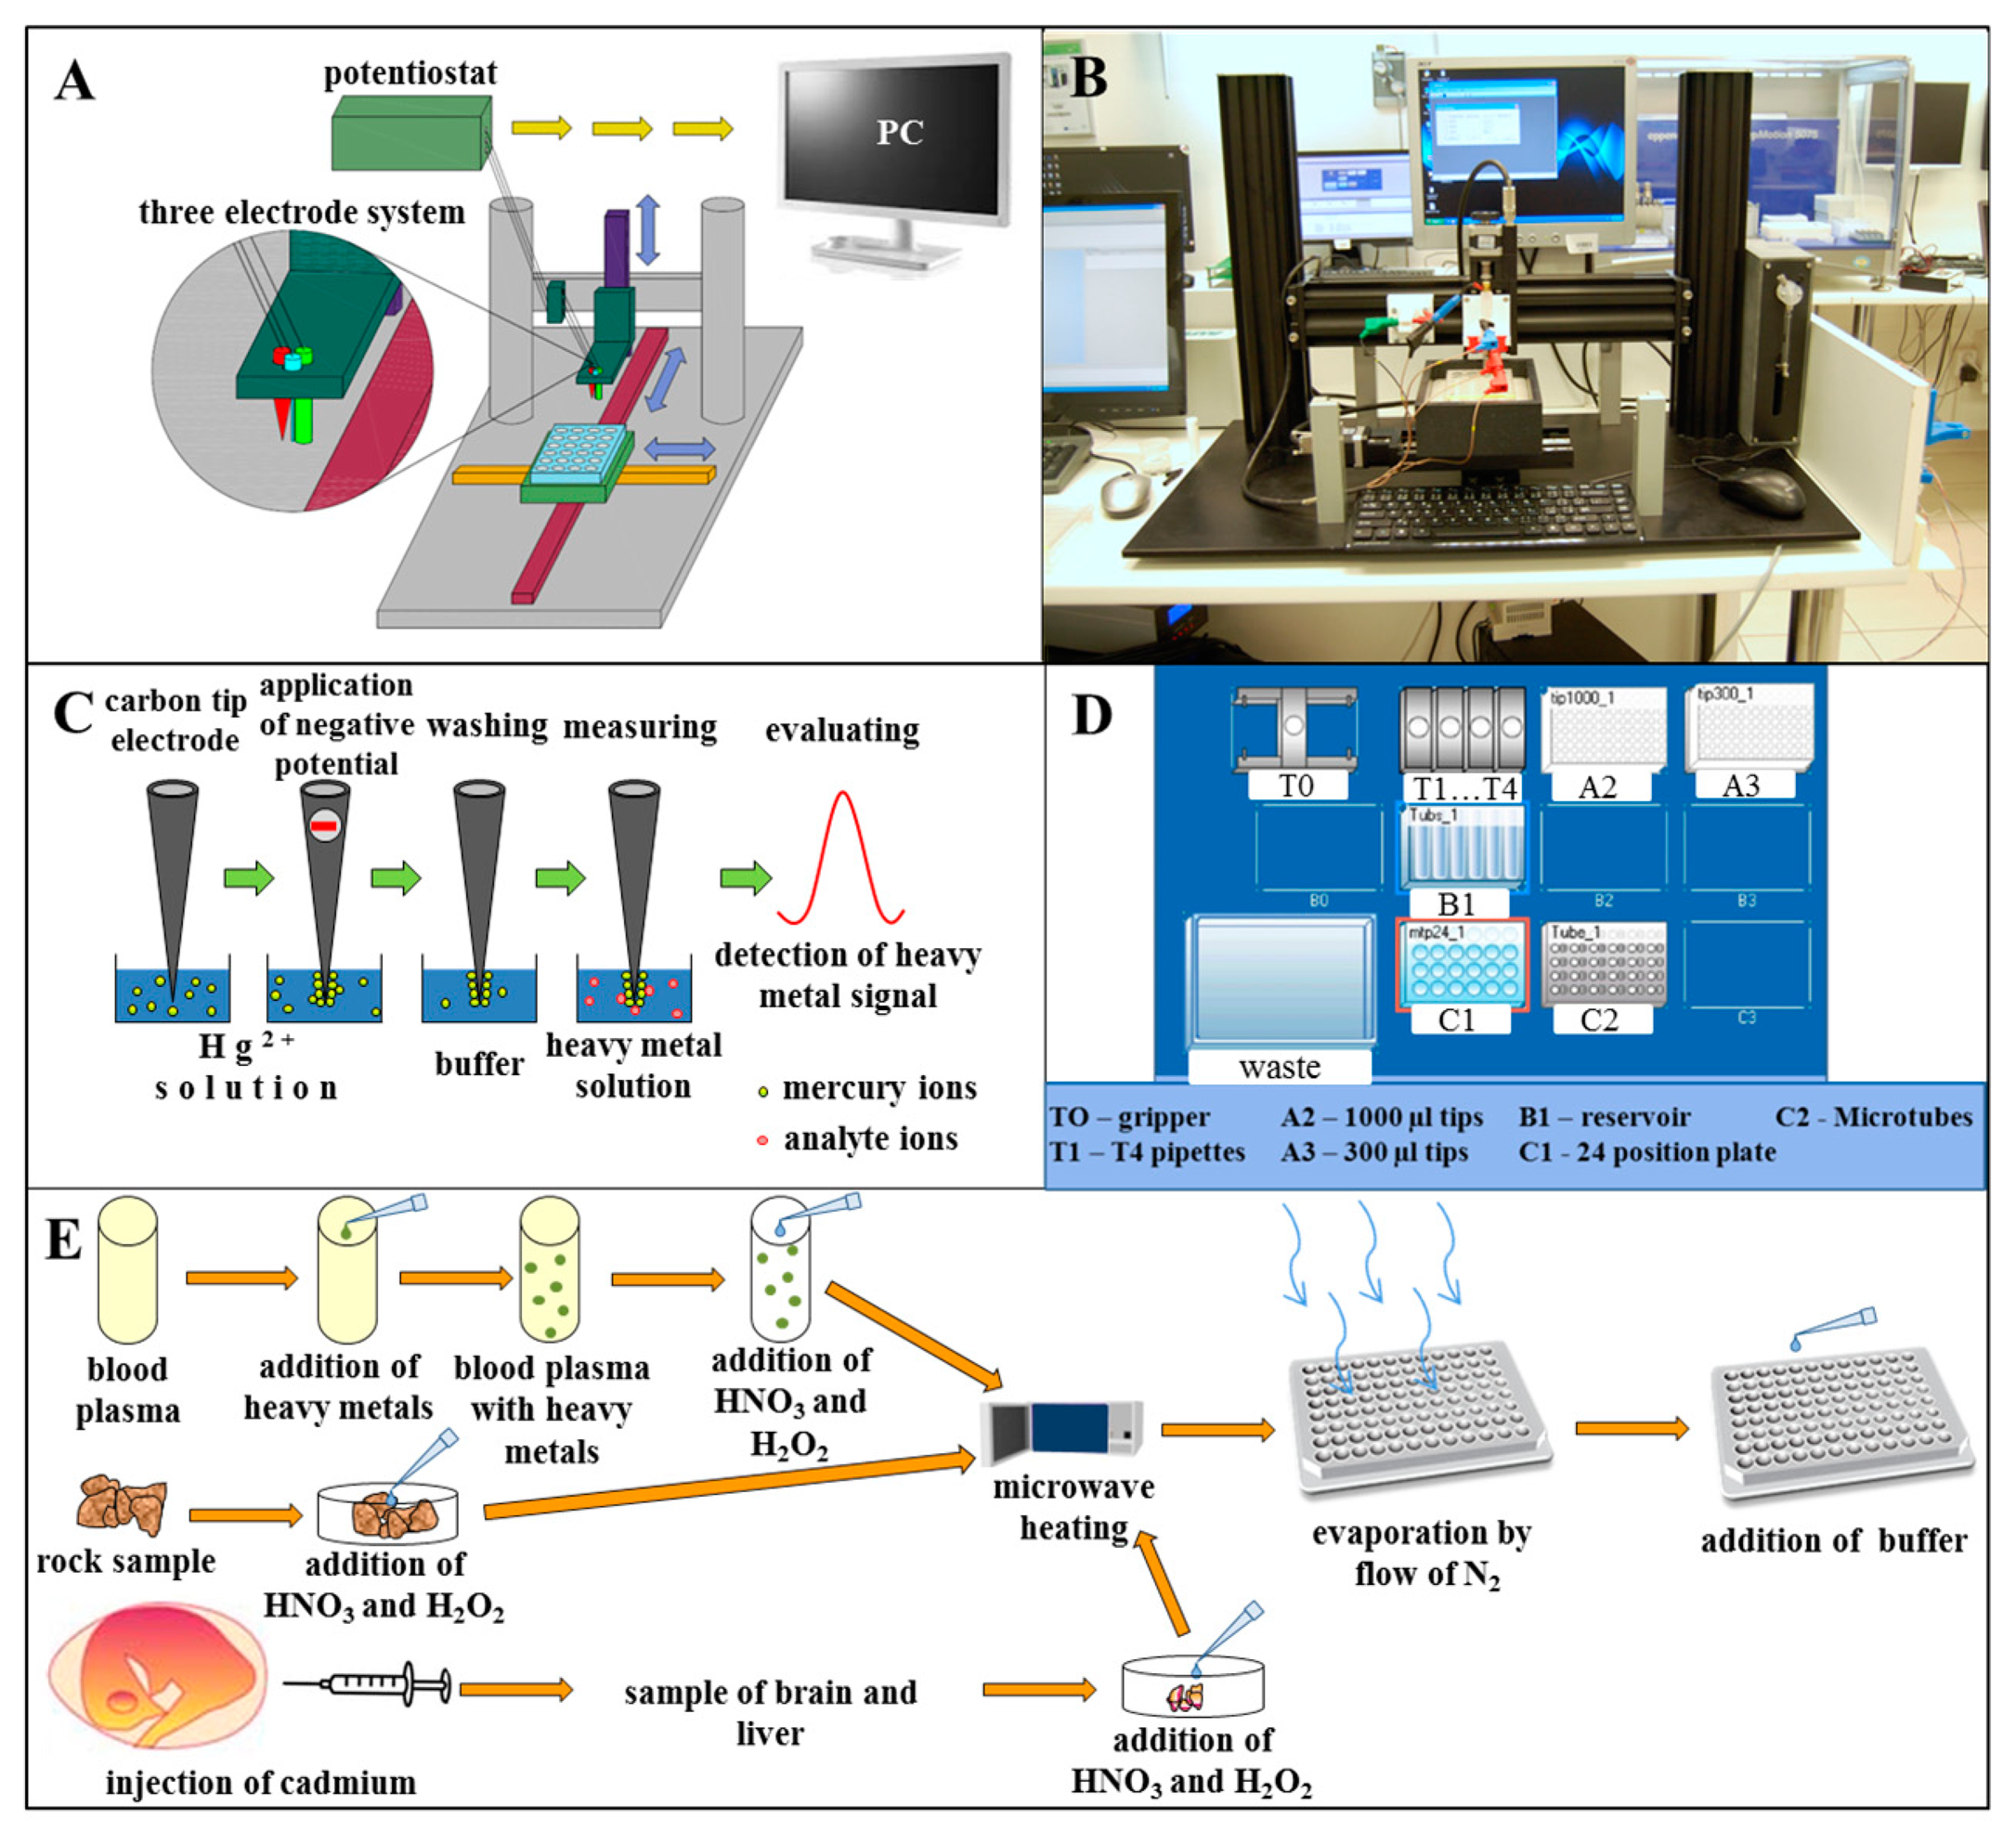
Automation or semi-automation of analysis reduces time-consuming manual operations and costs. We used an electrochemical detection method (differential pulse voltammetry) with all its known advantages (easy-to-use, good sensitivity, cheap instrumentation) for automatic simultaneous detection of cadmium, zinc, copper and lead ions in various types of real samples. The whole system consisted of detection and positioning parts. Detection was performed using a classical three-electrode system (working, reference and auxiliary electrode). Electrodes were fitted to a movable holder and positioned using an electrochemical robotic device schematically depicted in Figure 1A and photographed in Figure 1B. Scripts were created to precisely control the timing of electrochemical measurements and movements of the electrode holder with the electrodes. At first, we used a disposable carbon tip as a working electrode, nevertheless this electrode was not able to detect zinc ions. Hence, we fabricated thin-film mercury electrodes (TFMEs) by electrodeposition of mercury (II) ions from solution onto the carbon surface of electrodes (Figure 1C) and its sensitivity was compared with a disposable carbon tip electrode. Due to the fact that we focused on automation, the electrochemical robotic system was used to perform plating automatically and the automated pipetting device was used to prepare different heavy metal concentrations for calibration curve measurement and mixing samples with buffer. It is well known that oxidation/reduction of some metals on the surface of TFME can be affected by the presence of other metals by forming of intermetallic compounds [45]. Therefore, we used statistical methods (linear regression, multiregression model and finally a neural network) to reduce measurement errors and evaluate the detected concentrations of target heavy metals [42,43]. Complex analytical signals of mixture samples obtained by arrays of potentiometric electrodes or by voltammetric systems (not those based on specific receptors) mostly require application of chemometric tools [46,47]. We decided to use an artificial neural network for these purposes since it is an effective instrument to analyse these types of multivariate signals and is able to recognise specific patterns in data sets. It can be considered as one of the most important tools in this kind of analysis and is not only broadly used in evaluation of redox, but also optical signals [48,49]. Gutés et al. emphasized the need for voltammetric signal pre-processing before ANN modelling in order to reduce ANN training time and create a more accurate network [50]. A wavelet transform was previously used to extract the most relevant information from voltammograms [51]. We used individual ions peak heights as the ANN input data, because Cd(II) and Zn(II) ions in samples tended to affect the peak heights of each other instead of overlapping (peaks of Cd(II), Cu(II) and Pb(II) and Zn(II) are well separated) [41]. The neural network reliability was tested using 22 mineralized blood plasma samples with random heavy metal concentrations (0.0–6 μg·mL−1) and 20 randomly selected heavy metal mixtures (0.01–8 μg·mL−1). The automatic electrochemical robotic device and neural network were also used for evaluation of heavy metal content in rocks and chicken embryo tissues exposed to cadmium(II) ions. Addition of buffer to mineralized rock samples, chicken brain and liver and artificial plasma samples was performed by an automated pipetting device (Figure 1D). The way samples were treated is shown in Figure 1E.
3.2. Optimization of the Automatic System for Heavy Metal Detection
The automatic system for heavy metal detection was optimized for determination of the four metal ions (Cd(II), Cu(II), Pb(II) and Zn(II)). The optimization was focused on monitoring of the electrochemical response of the individual elements depending on the increasing accumulation time within the range from 0 to 300 s. Longer accumulation times were not investigated because of our desire to shorten the analysis to a maximum of 5 min. Thereafter, calibration curves were determined and limits of detection (LODs) were calculated. For values resulting from the calibration curve double-sided reliability bands were created, what is the part of the plane limited by straight lines, where the observed calibration points fall within with 95% probability [52]. Further, the sensitivity of the WE before and after modification with mercury film was compared by plotting the slopes of the calibration curves in the column graph. Due to the fact that lower limits of detection were attained by the mercury-modified carbon tip, calibration curves were determined within a linear range of concentrations (0.6, 1.25, 2.5 and 10 μg·mL−1). This linear range is common for both unmodified and modified WE, and therefore all the slopes could be compared. Finally, the automatic system was verified by comparing the electrochemical results with atomic absorption spectrometry (AAS) data.
At first, the electrochemical responses of the studied metals on the unmodified carbon tip WE were studied. Cd(II), Cu(II), and Pb(II) ion electrochemical signals were measured, but Zn(II) ions did not give any signal at the bare electrode. For this reason, the electrochemical optimization was performed only for the detected ions. The best electrochemical response of metal ions was achieved when using an accumulation time of 300 s. This accumulation was applied for all measurements. For the analysis of Cd(II) ions the electrochemical signal gave its maximum at a potential of −0.69 V and LOD was estimated as 0.1 μg·mL−1 (Figure 2A). For the analysis of Pb(II) ions the peak maximum was detected at a potential of −0.51 V and LOD = 0.2 μg·mL−1 was estimated (Figure 2B). For the analysis of Cu(II) ions the peak maximum was detected at a potential of −0.29 V and LOD = 0.1 μg·mL−1 was found (Figure 2C).
The next step was to estimate the LOD of electrochemical determination of metal ions when using mercury film modified carbon tip as WE. It was found that due to the modification of WE with mercury film the electrochemical signal of Zn(II) was recorded. The signal of Zn(II) ions showed a maximum at a potential of −1.07 V and LOD was estimated as 0.6 μg·mL−1 (Figure 2D). For the analysis of Cd(II) ions the peak maximum was detected at a potential of −0.7 V and LOD as 0.06 μg·mL−1, which is 21 times less than when measured with the unmodified WE, was found (Figure 2E). For the analysis of Pb(II) ions the peak maximum was detected at a potential of −0.54 V and LOD as 0.03 μg·mL−1, which is five times less than when measured with the unmodified WE (Figure 2F). For the analysis of Cu(II) ions the peak maximum was detected at a potential of −0.29 V and LOD as 0.02 μg·mL−1, which is five times less than when measured with the unmodified WE (Figure 2G).
Further, for the use of the slopes of the calibration curves (Figures 2A–2G), sensitivities of the unmodified and modified WE for analysis of individual metal ions were compared (Figure 2H). It was found that modification of WE with mercury film had the greatest effect on detection of Zn(II) and Cd(II) ions. Detection of Zn(II) ions was possible only due to the WE modification. For detection of Cd(II) ions the sensitivity was increased 7-fold. On the other hand an increase in sensitivity was not demonstrated for the detection of Cu(II) and Pb(II) ions within a 5% error bar. Finally, brain and liver samples of the real-chicken embryo treated with Cd(II) ions were analysed. For these samples Cd(II) ions were determined. Comparison of the results measured by both DPASV (without stirring since the samples were placed in a titre plate) and AAS coincided within 10% error, as shown in Figure 2I.
3.3. Rock Analysis
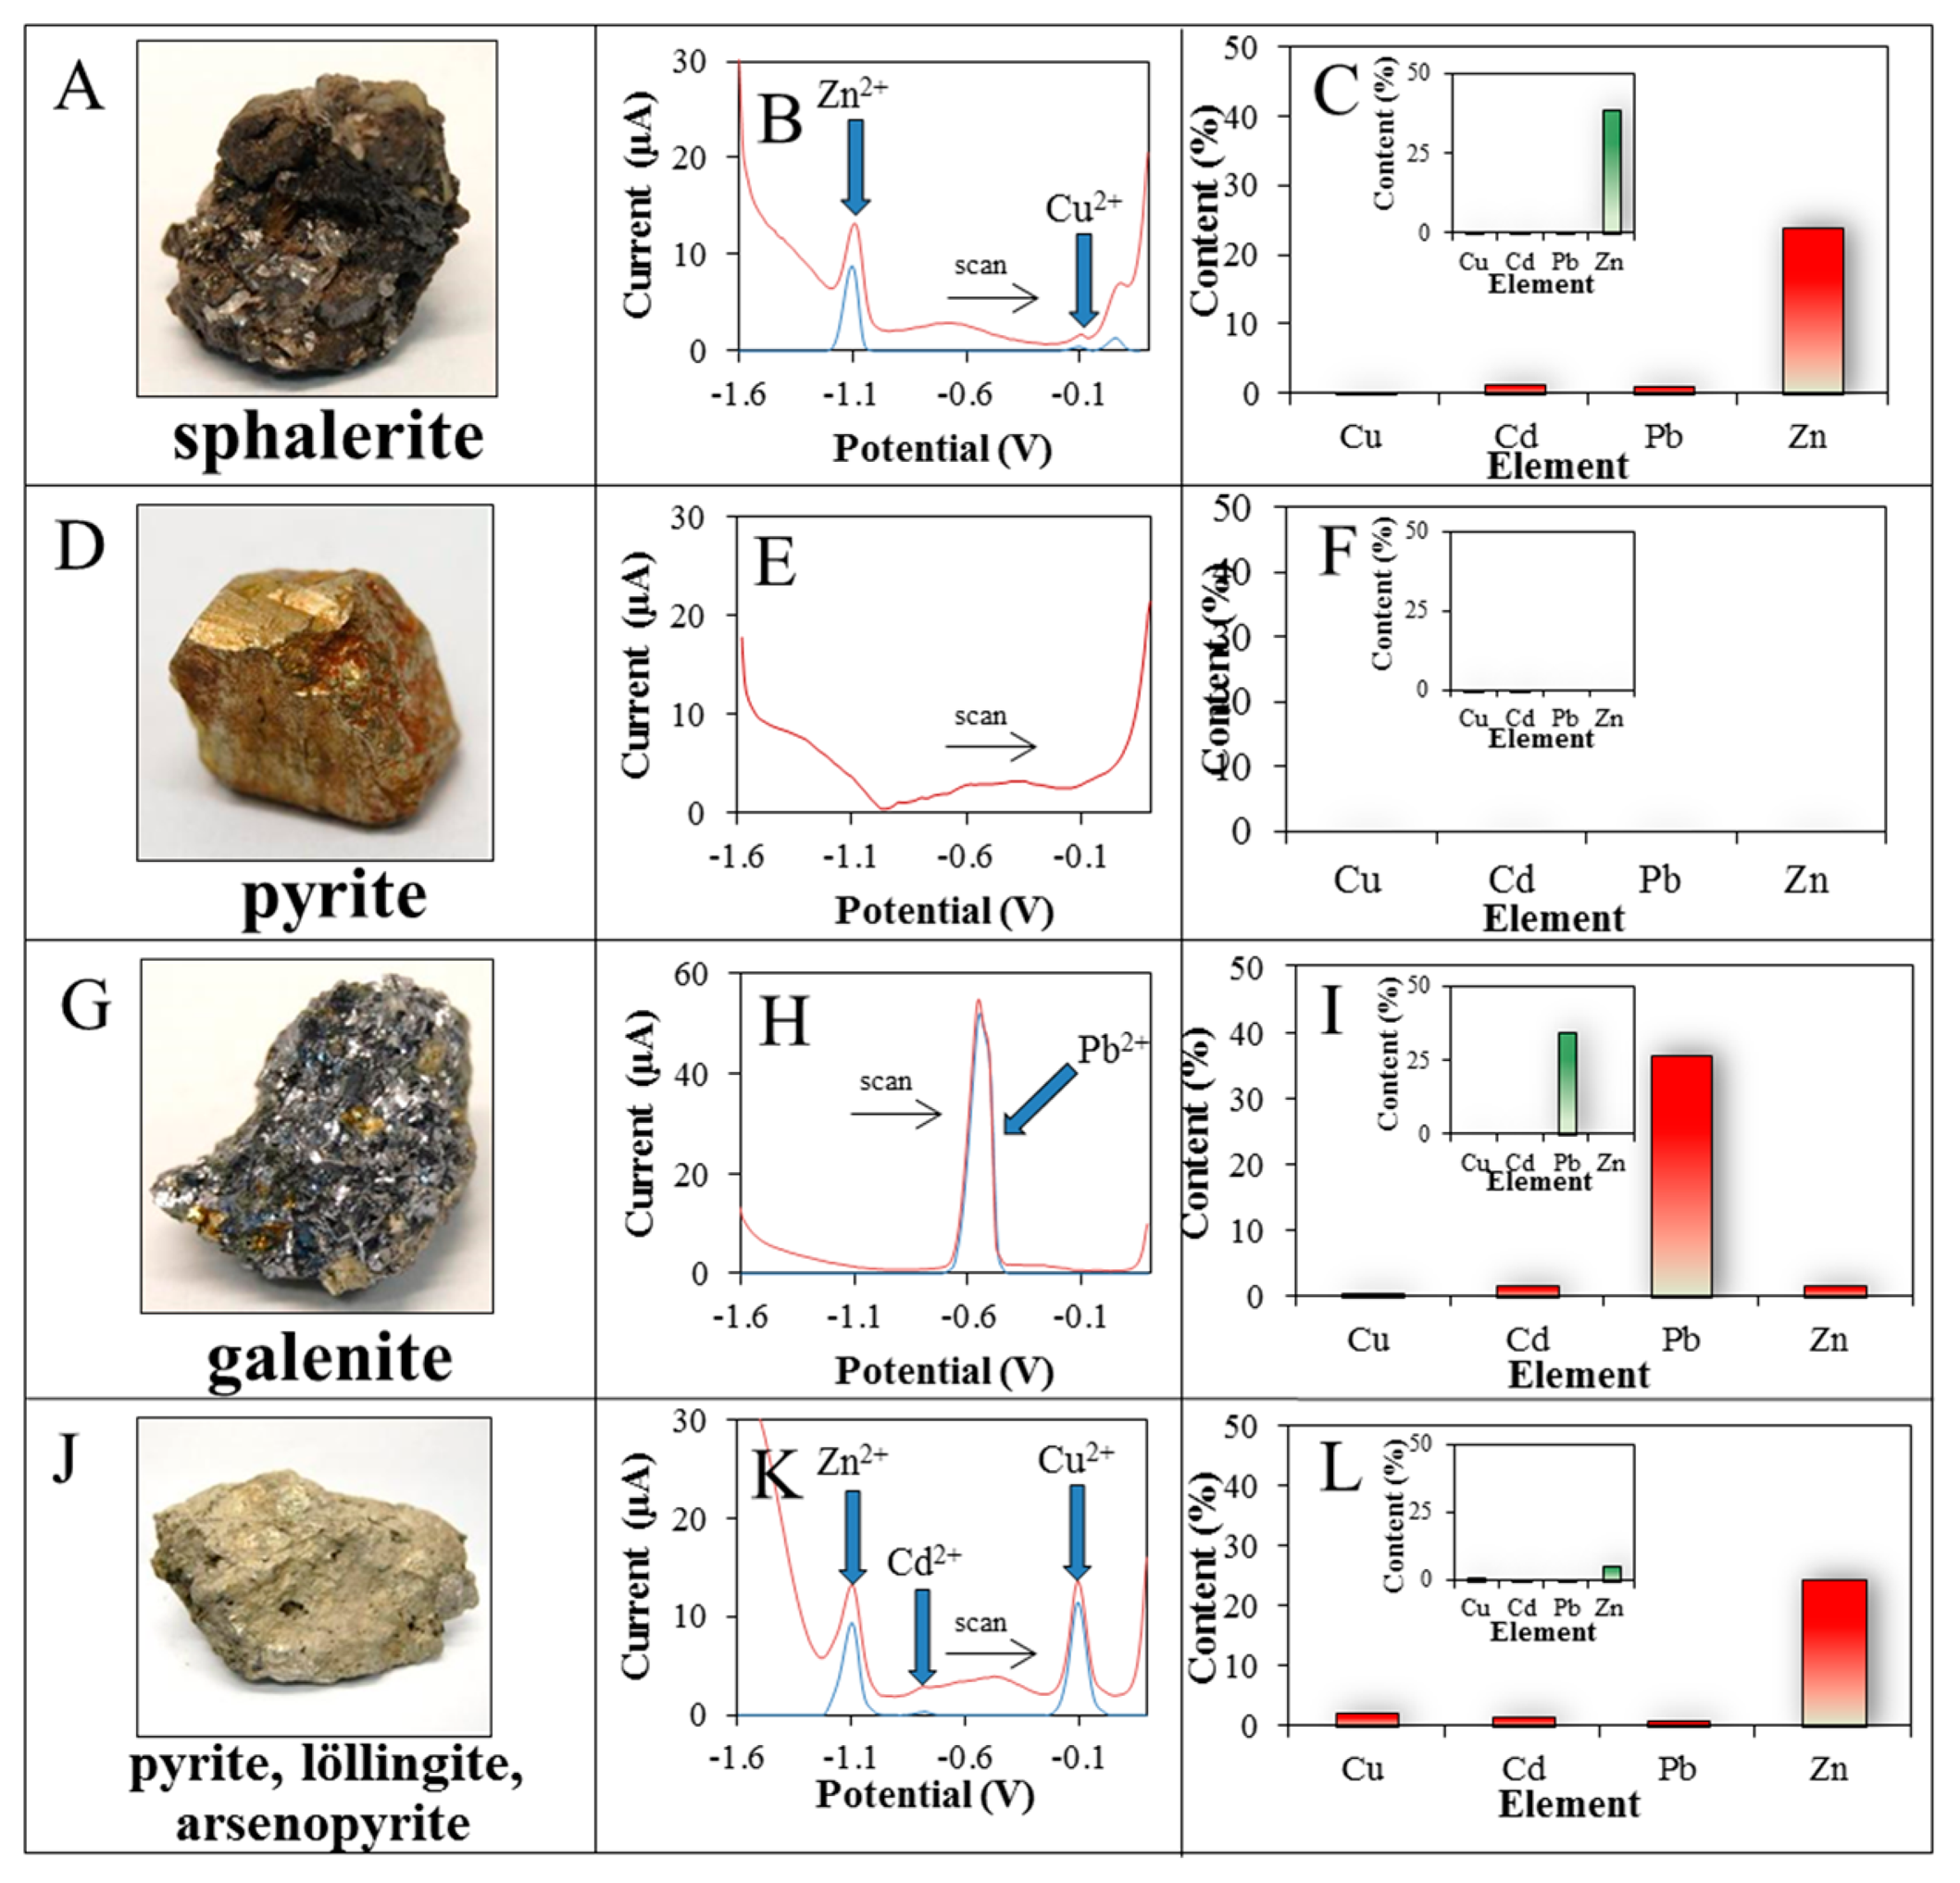
Four different rocks were analysed electrochemically using TFME and the obtained results were compared with the X-ray fluorescence analysis (XRF) ones. Two rock samples consisting predominantly of the minerals sphalerite (ZnS) and pyrite (FeS2) were obtained in Madan in Croatia, and further galenite (PbS), and a mineral association of arsenopyrite (FeAsS) with pyrite and löllingite (FeAs2) were obtained in Panasqueira in Portugal (Figure 3).
For the first sample of analysed rock, which was composed predominantly of the mineral sphalerite (Figure 3A), the highest content of Zn(II) (24%) and traces of Cd(II) (1.5%), Pb(II) (1.0%) and Cu(II) (0.3%) were determined electrochemically and evaluated by ANN (Figure 3B). Similar results were obtained by XRF analysis (Figure 3C). In addition the elements Fe (10%) and S (12% of detected elements) were further detected (not shown).
For the second sample of analysed rock composed mainly of pyrite (Figure 3D), none of the analysed metals was determined electrochemically (Figure 3E and F). Using XRF analysis the elements Fe (47%), S (30%), Mg (1.22%) and Cu (1.35%) were detected (not shown), which corresponds essentially to the elemental composition of pyrite.
For the third sample of analysed rock, which was composed mainly of the mineral galenite (Figure 3G), the highest content of Pb(II) (37%) was determined electrochemically and this corresponded to the composition of this mineral (Figure 3H). Further, Si (8.5%) and minor amounts of Zn (1.8%), Cd (1.6%), and Cu (0.6%) ions were also determined (Figure 3I). Similar results were obtained by XRF analysis (Figure 3H and I).
For the fourth sample of analysed rocks, consisting primarily of the minerals arsenopyrite, pyrite and löllingite (Figure 3J) the largest amount of Zn(II) (25%) and in smaller amounts Cu(II) (2.0%), Cd(II) (1.4%) and Pb(II) (1.0%) were determined electrochemically (Figure 3K and L). Similar results were obtained using XRF analysis, but the elements Fe (32%), As (>18.29%), S (8%) and Sn (>2.875%) were also found (not shown).
3.4. Identification of Regression Function
A total of 645 mixture combinations of Zn(II), Cd(II), Cu(II), and Pb(II) standard concentrations within the range 0–10 μg/mL were prepared (appropriate amounts of the corresponding nitrates were dissolved in water). First, simple linear regression was performed to reveal the associations between peak values and concentrations using the following equation
3.5. Building a Neural Network Model
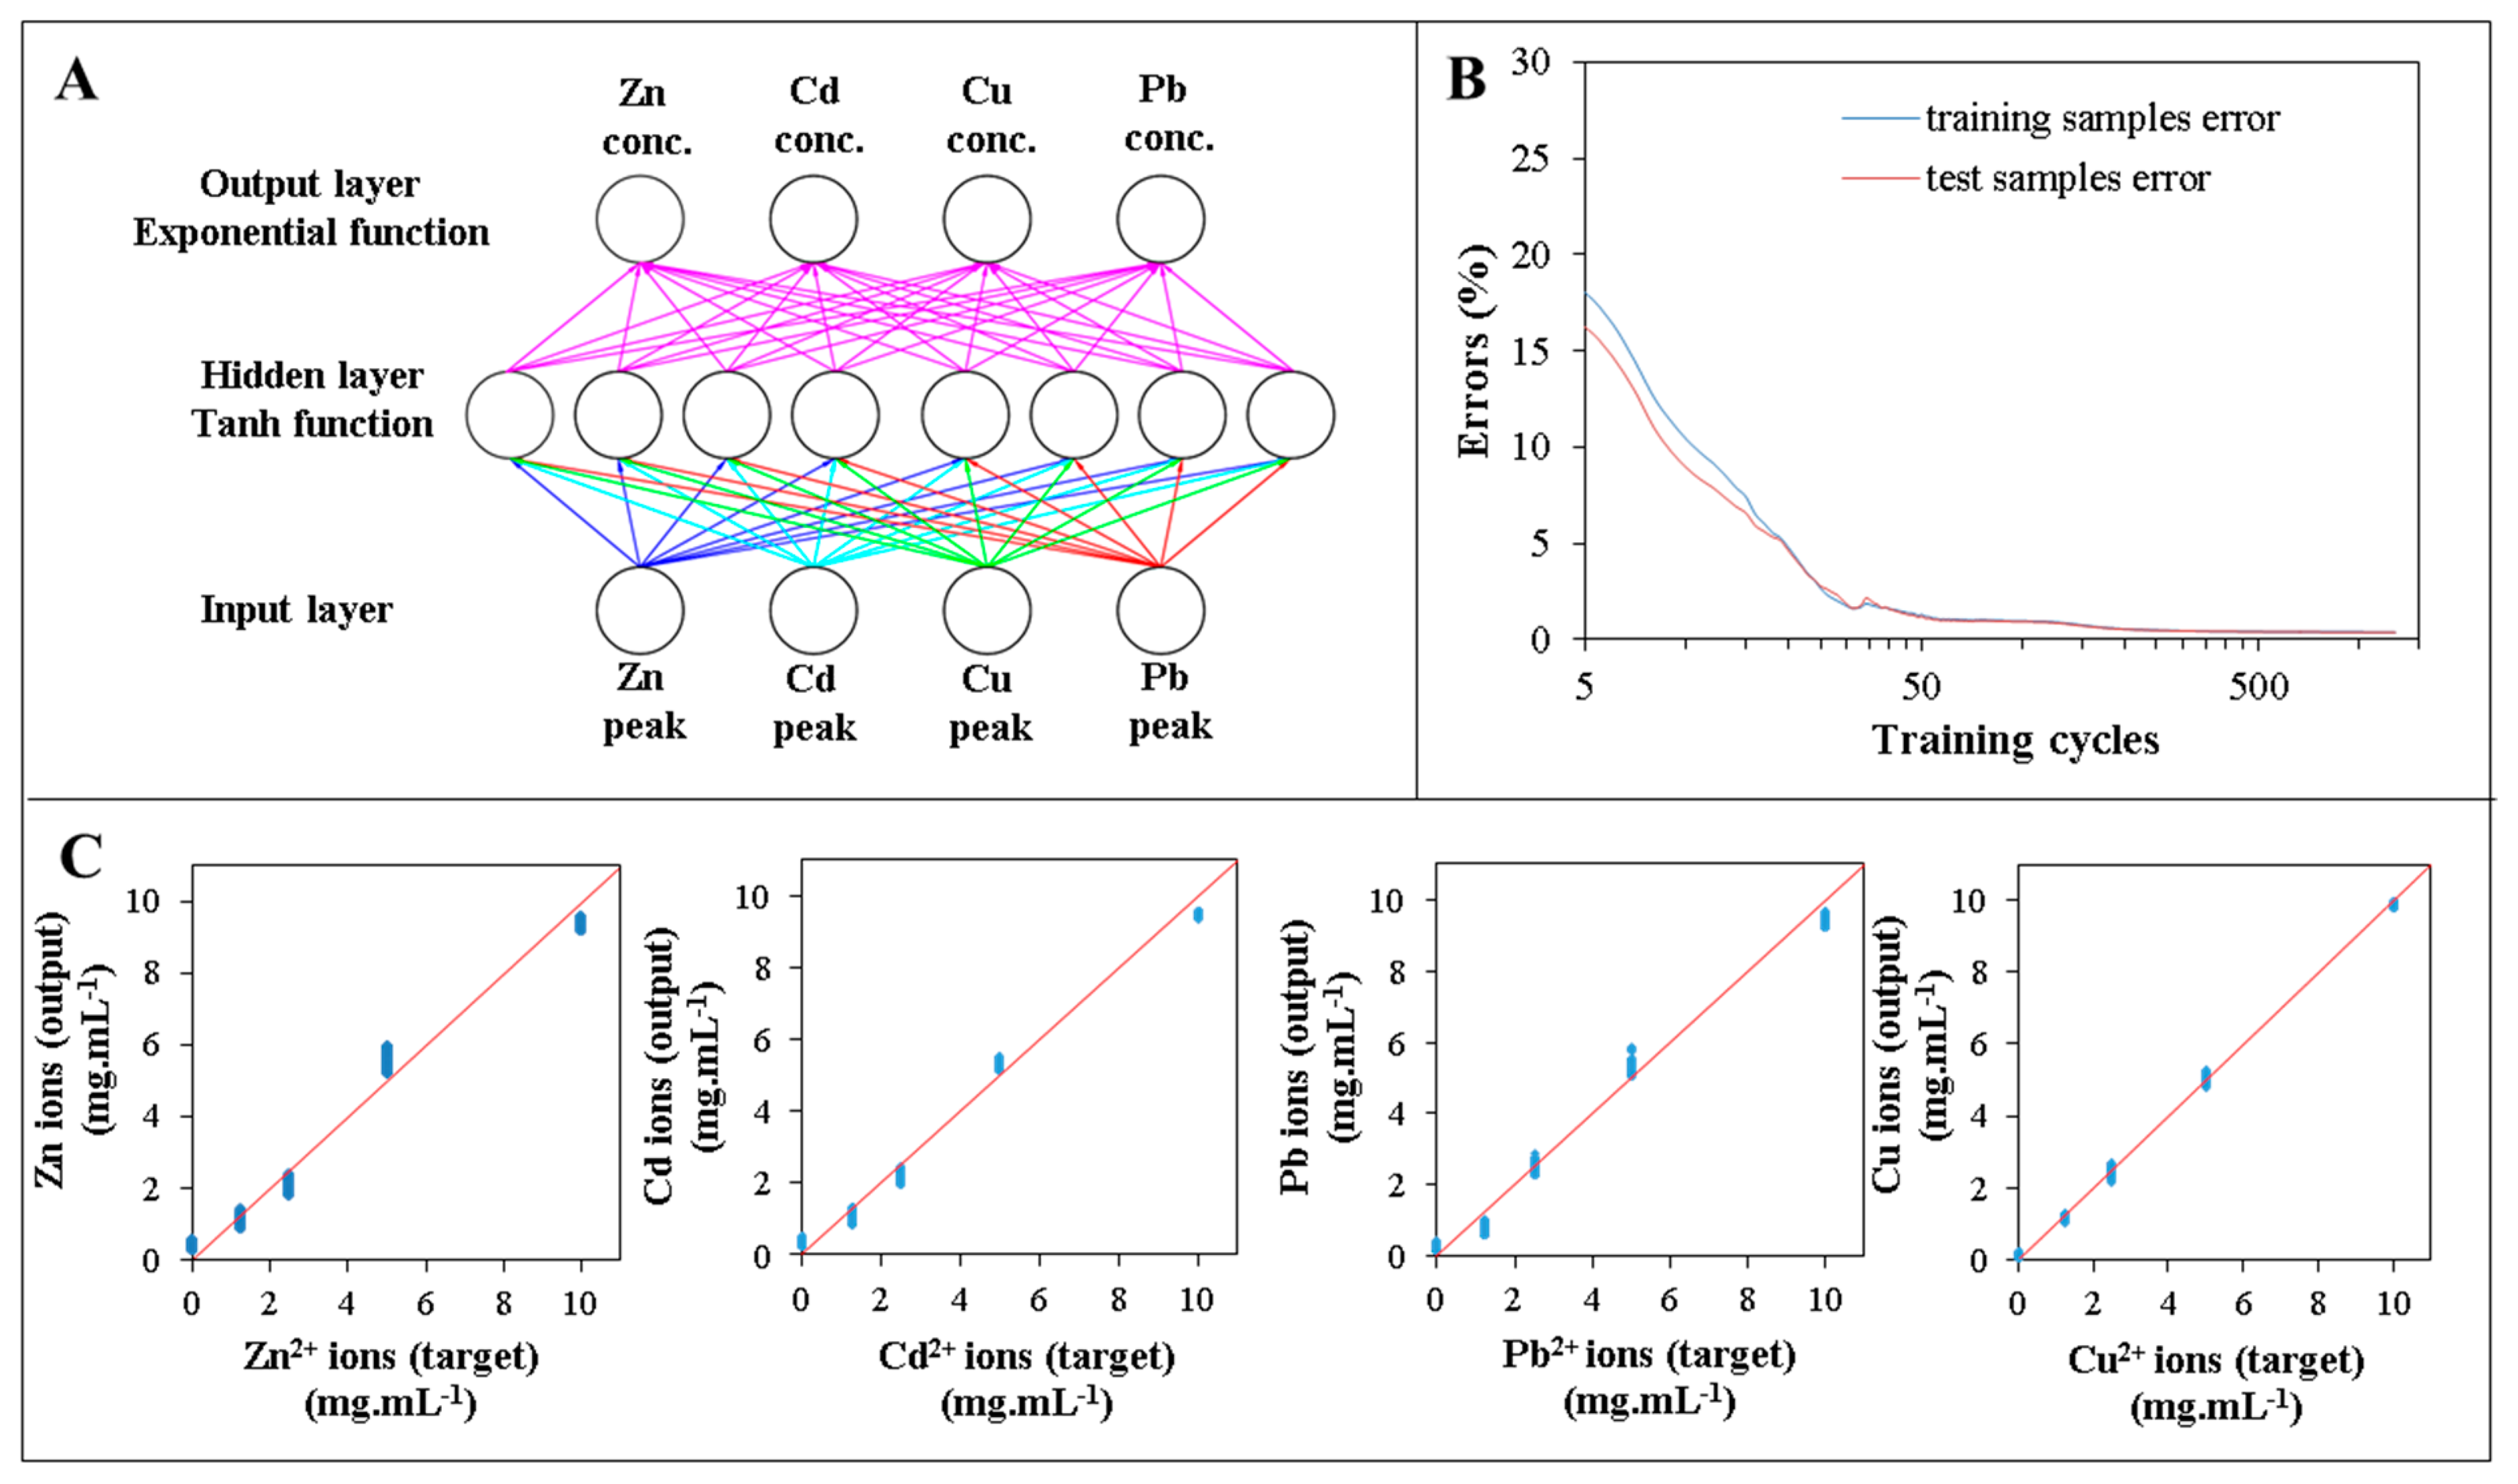
Both the radial basic function and multilayer perceptron approaches were used for training with the following activation functions, which were used for hidden and output neurons: identity, logistic, tan, and exponential. In the initial training set total 10,000 training cycles were performed with weight decay and the five best were retained. The number of hidden neurons was limited to 20. After the initial training, the highest observed network performance was observed in a network with 19 hidden neurons, and exponential and logistic hidden and output activation functions, respectively. The goodness of fit of the model was 0.9996 for both test and validation (Table 2).
Based on this network, the number of hidden neurons was optimized using a custom network design with enabled training stopping conditions. The number of hidden neurons was optimized in a range 0–30. The activation function for hidden and output layer was exponential and logistic with weight decay activated. When the number of hidden neurons increased from 1 to 8, the validation performance of the network increased significantly from 0.36 to 0.995. Subsequent increase in number of hidden neurons did not enhance the performance of the network significantly, therefore, eight hidden neurons was used as a model for final analyses (Table 2 and Figure 4A). Decreasing evaluation errors of training and testing samples were plotted against number of training cycles (Figure 4B).
Network name includes training method, and number of input-hidden-output neurons. MLP, multilayer perceptron. Training cycle indicates cycle number when the network was created (in the case of initial training) or the training was stopped by stopping conditions (in the case of final network design).
3.6. Measurements of a Blood Plasma and Unknown Samples
Consequently, a model was employed for the measurement of the 22 blood plasma samples, to which defined heavy metal concentrations were added (Table 3). The goodness of fit for the neuronal network was 0.995, 0.998, 0.993 and 9.999 for Zn, Cd, Pb, and Cu ions, respectively. Consequently, the model was tested on validation sample and goodness of fit was tested again. The R2 was as follows: 0.996, 0.998, 0.997, and 0.999 for Zn(II), Cd(II), Pb(II) and Cu(II), respectively. The results of these validations indicate significant improvement over using a general regression model with user defined function (compare the goodness of fit in Tables 1 and 2).
Concentration targets are concentrations added to blood plasma samples and prepared as custom concentrations for validation samples. Goodness of fit was tested separately for both sample sets. Correlations analysis of input heavy metals concentrations and output results were performed (Figure 4C).
4. Conclusions
In this work electrochemical system for automatic detection of heavy metals was developed. Using this system rock samples, blood plasma samples and organs of chicken embryos were successfully analysed. The accuracy of the system was verified by atomic absorption spectrometer (AAS) and X-Ray fluorescence (XRF). Furthermore, the different mathematical models were used to calculate the mutual interactions between the individual electrochemical signals in the multi element analysis. The performance of simple linear regression and multiple regression models (combination of linear and exponential regression) for determining copper concentrations correctly was weak. Based on this fact, an artificial neural network model was built and used for the correction of results in mixtures of metal samples. Perfect fit of this model was found (R2 = 0.9933).
Acknowledgments
Financial support from the project NANOLABSYS CZ.1.07/2.3.00/20.0148 is highly acknowledged. These results were presented at the 14th Workshop of Physical Chemists and Electrochemists.
Author Contributions
J. K. was responsible for electrochemical measurements automation and performed XRF analysis. H. V. N. optimized conditions and carried out electrochemical measurements. J. G. built statistical models and statistically evaluated the heavy metal concentrations. I. B. prepared the samples for analysis and helped with the interpretation of results. L. N. and B. R. N. participated in preparation of the manuscript and in design of the study. D. H. coordinated experiments. J. K. provided rock samples and participated on the analysis of these samples. V.A. and R.K. designed the study and drafted manuscript.
Conflicts of Interest
The authors declare no conflict of interest.
References
- Kleckerova, A.; Docekalova, H. Dandelion Plants as a Biomonitor of Urban Area Contamination by Heavy Metals. Int. J. Environ. Res. 2014, 8, 157–164. [Google Scholar]
- Vega, F.A.; Weng, L.P. Speciation of heavy metals in River Rhine. Water Res. 2013, 47, 363–372. [Google Scholar]
- Basha, S.; Jhala, J.; Thorat, R.; Goel, S.; Trivedi, R.; Shah, K.; Menon, G.; Gaur, P.; Mody, K.H.; Jha, B. Assessment of heavy metal content in suspended particulate matter of coastal industrial town, Mithapur, Gujarat, India. Atmos. Res. 2010, 97, 257–265. [Google Scholar]
- Chen, C.; Xie, Q.J.; Wang, L.H.; Qin, C.; Xie, F.Y.; Yao, S.Z.; Chen, J.H. Experimental Platform to Study Heavy Metal Ion-Enzyme Interactions and Amperometric Inhibitive Assay of Ag+ Based on Solution State and Immobilized Glucose Oxidase. Anal. Chem. 2011, 83, 2660–2666. [Google Scholar]
- Witkiewicz-Kucharczyk, A.; Bal, W. Damage of zinc fingers in DNA repair proteins, a novel molecular mechanism in carcinogenesis. Toxicol. Lett. 2006, 162, 29–42. [Google Scholar]
- Nations, U. Data on Urban and Rural Populations. In World Urbanization Prospects; United Nations Department of Economic and Social Affairs: New York, NY, USA, 2011; Volume 2014. [Google Scholar]
- Kenawy, I.M.M.; Hafez, M.A.H.; Akl, M.A.; Lashein, R.R. Determination by AAS of some trace heavy metal ions in some natural and biological samples after their preconcentration using newly chemically modified chloromethylated polystyrene-PAN ion-exchanger. Anal. Sci. 2000, 16, 493–500. [Google Scholar]
- Karami, H.; Mousavi, M.F.; Yamini, Y.; Shamsipur, M. On-line preconcentration and simultaneous determination of heavy metal ions by inductively coupled plasma-atomic emission spectrometry. Anal. Chim. Acta 2004, 509, 89–94. [Google Scholar]
- Faraji, M.; Yamini, Y.; Saleh, A.; Rezaee, M.; Ghambarian, M.; Hassani, R. A nanoparticle-based solid-phase extraction procedure followed by flow injection inductively coupled plasma-optical emission spectrometry to determine some heavy metal ions in water samples. Anal. Chim. Acta 2010, 659, 172–177. [Google Scholar]
- Hynek, D.; Prasek, J.; Businova, P.; Zak, J.; Drbohlavova, J.; Chomoucka, J.; Kynicky, J.; Konecna, M.; Brtnicky, M.; Hubalek, J.; et al. Automated voltammetric determination of lead(II) ions using sensor array. Int. J. Electrochem. Sci. 2013, 8, 4441–4456. [Google Scholar]
- Petrlova, J.; Potesil, D.; Zehnalek, J.; Sures, B.; Adam, V.; Trnkova, L.; Kizek, R. Cisplatin electrochemical biosensor. Electrochim. Acta 2006, 51, 5169–5173. [Google Scholar]
- Adam, V.; Petrlova, J.; Potesil, D.; Zehnalek, J.; Sures, B.; Trnkova, L.; Jelen, F.; Kizek, R. Study of metallothionein modified electrode surface behaviour in the presence of heavy metal ions-biosensor. Electroanalysis 2005, 17, 1649–1657. [Google Scholar]
- Nejdl, L.; Kudr, J.; Cihalova, K.; Chudobova, D.; Zurek, M.; Zalud, L.; Kopecny, L.; Burian, F.; Ruttkay-Nedecky, B.; Krizkova, S.; et al. Remote-controlled robotic platform Orpheus as a new tool for detection of bacteria in the environment. Electrophoresis 2014. in press. [Google Scholar]
- Nejdl, L.; Ruttkay-Nedecky, B.; Kudr, J.; Kremplova, M.; Cernei, N.; Prasek, J.; Konecna, M.; Hubalek, J.; Zitka, O.; Kynicky, J.; et al. Behaviour of Zinc Complexes and Zinc Sulphide Nanoparticles Revealed by Using Screen Printed Electrodes and Spectrometry. Sensors 2013, 13, 14417–14437. [Google Scholar]
- Locatelli, C.; Melucci, D. Voltammetric method for ultra-trace determination of total mercury and toxic metals in vegetables. Comparison with spectroscopy. Cent. Eur. J. Chem. 2013, 11, 790–800. [Google Scholar]
- Anastasiadou, Z.D.; Jannakoudakis, P.D.; Girousi, S.T. Square wave anodic stripping voltammetry determination of eco-toxic metals in samples of biological and environmental importance. Cent. Eur. J. Chem. 2010, 8, 999–1008. [Google Scholar]
- Kensova, R.; Hynek, D.; Kynicky, J.; Konecna, M.; Eckschlager, T.; Adam, V.; Hubalek, J.; Kizek, R. Determination of Metal Ions in the Plasma of Children with Tumour Diseases by Differential Pulse Voltammetry. Int. J. Electrochem. Sci. 2014, 9, 4675–4691. [Google Scholar]
- Fialova, D.; Kremplova, M.; Hynek, D.; Konecna, M.; Kaiser, J.; Malina, R.; Kynicky, J.; Krystofova, O.; Kizek, R.; Adam, V. Sosedka Pegmatite Metal Ions Composition Determined by Voltammetry. Int. J. Electrochem. Sci. 2013, 8, 7853–7867. [Google Scholar]
- Bahr, J. The Chicken as a Model Organism. In Sourcebook of Models for Biomedical Research; Conn, P.M., Ed.; Humana Press: New York, NY, USA, 2008; pp. 161–167. [Google Scholar]
- Shagirtha, K.; Muthumani, M.; Prabu, S.M. Melatonin abrogates cadmium induced oxidative stress related neurotoxicity in rats. Eur. Rev. Med. Pharmacol. Sci. 2011, 15, 1039–1050. [Google Scholar]
- Xu, H.; Zeng, L.P.; Xing, S.J.; Xian, Y.Z.; Shi, G.Y. Ultrasensitive Voltammetric Detection of Trace Lead(II) and Cadmium(II) Using MWCNTs-Nafion/Bismuth Composite Electrodes. Electroanalysis 2008, 20, 2655–2662. [Google Scholar]
- Rico, M.A. G.; Olivares-Marin, M.; Gil, E.P. Modification of carbon screen-printed electrodes by adsorption of chemically synthesized Bi nanoparticles for the voltammetric stripping detection of Zn(II), Cd(II) and Pb(II). Talanta 2009, 80, 631–635. [Google Scholar]
- Rocha, L.S.; Pinheiro, J.P.; Carapuca, H.M. Evaluation of nanometer thick mercury film electrodes for stripping chronopotentiometry. J. Electroanal. Chem. 2007, 610, 37–45. [Google Scholar]
- Huang, H.; Chen, T.; Liu, X.Y.; Ma, H.Y. Ultrasensitive and simultaneous detection of heavy metal ions based on three-dimensional graphene-carbon nanotubes hybrid electrode materials. Anal. Chim. Acta. 2014, 852, 45–54. [Google Scholar]
- Zhao, D.L.; Guo, X.F.; Wang, T.T.; Alvarez, N.; Shanov, V.N.; Heineman, W.R. Simultaneous Detection of Heavy Metals by Anodic Stripping Voltammetry Using Carbon Nanotube Thread. Electroanalysis 2014, 26, 488–496. [Google Scholar]
- Pujol, L.; Evrard, D.; Groenen-Serrano, K.; Freyssinier, M.; Ruffien-Cizsak, A.; Gros, P. Electrochemical sensors and devices for heavy metals assay in water: The French groups' contribution. Front. Chem. 2014, 2, 19. [Google Scholar]
- Pauliukaite, R.; Hocevar, S.B.; Ogorevc, B.; Wang, J. Characterization and applications of a bismuth bulk electrode. Electroanalysis 2004, 16, 719–723. [Google Scholar]
- Suteerapataranon, S.; Jakmunee, J.; Vaneesorn, Y.; Grudpan, K. Exploiting flow injection and sequential injection anodic stripping voltammetric systems for simultaneous determination of some metals. Talanta 2002, 58, 1235–1242. [Google Scholar]
- Ninwong, B.; Chuanuwatanakul, S.; Chailapakul, O.; Dungchai, W.; Motomizu, S. On-line preconcentration and determination of lead and cadmium by sequential injection/anodic stripping voltammetry. Talanta 2012, 96, 75–81. [Google Scholar]
- Intarakamhang, S.; Schuhmann, W.; Schulte, A. Robotic heavy metal anodic stripping voltammetry: Ease and efficacy for trace lead and cadmium electroanalysis. J. Solid State Electrochem. 2013, 17, 1535–1542. [Google Scholar]
- Ruhlig, D.; Schulte, A.; Schuhmann, W. An electrochemical robotic system for routine cathodic adsorptive stripping analysis of Ni2+ ion release from corroding NiTi shape memory alloys. Electroanalysis 2006, 18, 53–58. [Google Scholar]
- Adam, V.; Zehnalek, J.; Petrlova, J.; Potesil, D.; Sures, B.; Trnkova, L.; Jelen, F.; Vitecek, J.; Kizek, R. Phytochelatin modified electrode surface as a sensitive heavy-metal ion biosensor. Sensors 2005, 5, 70–84. [Google Scholar]
- Despagne, F.; Massart, D.L. Neural networks in multivariate calibration. Analyst 1998, 123, 157R–178R. [Google Scholar]
- Wilson, D.; Gutierrez, J.M.; Alegret, S.; del Valle, M. Simultaneous Determination of Zn(II), Cu(II), Cd(II) and Pb(II) in Soil Samples Employing an Array of Potentiometric Sensors and an Artificial Neural Network Model. Electroanalysis 2012, 24, 2249–2256. [Google Scholar]
- Wang, L.; Yang, D.; Chen, Z.L.; Lesniewski, P.J.; Naidu, R. Application of neural networks with novel independent component analysis methodologies for the simultaneous determination of cadmium, copper, and lead using an ISE array. J. Chemom. 2014, 28, 491–498. [Google Scholar]
- Gutierrez, J.M.; Moreno-Baron, L.; Cespedes, F.; Munoz, R.; del Valle, M. Resolution of Heavy Metal Mixtures from Highly Overlapped ASV Voltammograms Employing a Wavelet Neural Network. Electroanalysis 2009, 21, 445–451. [Google Scholar]
- Motalleb, G. Artificial Neural Network Analysis in Preclinical Breast Cancer. Cell J. 2014, 15, 324–331. [Google Scholar]
- Khajeh, M.; Golzary, A.R. Synthesis of zinc oxide nanoparticles-chitosan for extraction of methyl orange from water samples: Cuckoo optimization algorithm-artificial neural network. Spectrochim. Acta Part A Mol. Biomol. Spectrosc. 2014, 131, 189–194. [Google Scholar]
- Garkani-Nejad, Z.; Rashidi-Nodeh, H. Comparison of conventional artificial neural network and wavelet neural network in modeling the half-wave potential of aldehydes and ketones. Electrochim. Acta 2010, 55, 2597–2605. [Google Scholar]
- Efendioglu, H.S.; Yildirim, T.; Fidanboylu, K. Prediction of Force Measurements of a Microbend Sensor Based on an Artificial Neural Network. Sensors 2009, 9, 7167–7176. [Google Scholar]
- Panteli, V.S.; Kanellopoulou, D.G.; Gartaganis, S.P.; Koutsoukos, P.G. Application of Anodic Stripping Voltammetry for Zinc, Copper, and Cadmium Quantification in the Aqueous Humor: Implications of Pseudoexfoliation Syndrome. Biol. Trace Elem. Res. 2009, 132, 9–18. [Google Scholar]
- Chan, H.; Butler, A.; Falck, D.M.; Freund, M.S. Artificial neural network processing of stripping analysis responses for identifying and quantifying heavy metals in the presence of intermetallic compound formation. Anal. Chem. 1997, 69, 2373–2378. [Google Scholar]
- Chow, C.W. K.; Davey, D.E.; Mulcahy, D.E. A neural network approach to zinc and copper interferences in potentiometric stripping analysis. J. Intell. Mater. Syst. Struct. 1997, 8, 177–183. [Google Scholar]
- Farias, P.A. M.; Castro, A.A.; Wagener, A.D. R.; Miguel, E.M. Adenine determination in the presence of copper in diluted alkaline electrolyte by adsorptive stripping voltammetry at the mercury film electrode. Electroanalysis 2008, 20, 1445–1453. [Google Scholar]
- Alves, G.M.S.; Magalhaes, J.M.C.S.; Soares, H.M.V.M. Voltammetric Quantification of Zn and Cu, Together with Hg and Pb, Based on a Gold Microwire Electrode, in a Wider Spectrum of Surface Waters. Electroanalysis 2013, 25, 493–502. [Google Scholar]
- Gallardo, J.; Alegret, S.; Munoz, R.; De-Roman, M.; Leija, L.; Hernandez, P.R.; del Valle, M. An electronic tongue using potentiometric all-solid-state PVC-membrane sensors for the simultaneous quantification of ammonium and potassium ions in water. Anal. Bioanal. Chem. 2003, 377, 248–256. [Google Scholar]
- Laguarda-Miro, N.; Ferreira, F.W.; Garcia-Breijo, E.; Ibanez-Civera, J.; Gil-Sanchez, L.; Garrigues-Baixauli, J. Glyphosacte detection by voltammetric techniques. A comparison between statistical methods and an artificial neural network. Sens. Actuator B Chem. 2012, 171, 528–536. [Google Scholar]
- Ariza-Avidad, M.; Cuellar, M.P.; Salinas-Castillo, A.; Pegalajar, M.C.; Vukovic, J.; Capitan-Vallvey, L.F. Feasibility of the use of disposable optical tongue based on neural networks for heavy metal identification and determination. Anal. Chim. Acta 2013, 783, 56–64. [Google Scholar]
- Ariza-Avidad, M.; Salinas-Castillo, A.; Cuellar, M.P.; Agudo-Acemel, M.; Pegalajar, M.C.; Capitan-Vallvey, L.F. Printed Disposable Colorimetric Array for Metal Ion Discrimination. Anal. Chem. 2014, 86, 8634–8641. [Google Scholar]
- Gutes, A.; Cespedes, F.; Cartas, R.; Alegret, S.; del Valle, M.; Gutierrez, J.M.; Munoz, R. Multivariate calibration model from overlapping voltammetric signals employing wavelet neural networks. Chemom. Intell. Lab. Syst. 2006, 83, 169–179. [Google Scholar]
- Gutierrez, J.M.; Gutes, A.; Cespedes, F.; del Valle, M.; Munoz, R. Wavelet neural networks to resolve the overlapping signal in the voltammetric determination of phenolic compounds. Talanta 2008, 76, 373–381. [Google Scholar]
- Dordevic, S.; Stancin, S.; Meglic, A.; Milutinovic, V.; Tomazic, S. MC Sensor—A Novel Method for Measurement of Muscle Tension. Sensors 2011, 11, 9411–9425. [Google Scholar]


| Model | Parameter | Parameter Estimates (95% Confidence Interval) | |||||
|---|---|---|---|---|---|---|---|
| Zn(II) | Cd(II) | Pb(II) | Cu(II) | ||||
| Simple linear regression | |||||||
| a | * −0.56 | * −0.62 | * −0.52 | * −1.47 | |||
| b | * 0.72 | * 0.67 | * 0.18 | * 0.20 | |||
| model R2 | 0.98 | 0.98 | 0.98 | 0.87 | |||
| Nonlinear estimation | |||||||
| bZn | * 0.72 (0.70–0.73) | * 0.12 (0.11–0.13) | * −0.02 (−0.03–−0.01) | * 0.03 (0.00–0.05) | |||
| bCd | * 0.15 (0.13–0.16) | * 0.74 (0.73–0.76) | * −0.02 (−0.04–−0.01) | 0.00 (−0.02–0.03) | |||
| bPb | 0.00 (0.00–0.01) | 0.00 (0.00–0.00) | * 0.19 (0.18–0.19) | 0.00 (−0.01–0.00) | |||
| bCu | * −2.61 (−2.94–−2.28) | * −2.94 (−3.19–−2.7) | 0.02 (−0.27–0.31) | * 0.46 (0.33–0.59) | |||
| aCu | 0.00 (0.00–0.00) | 0.00 (0.00–0.00) | 0.00 (−0.31–0.31) | * 0.06 (0.05–0.06) | |||
| model R2 | 0.98 | 0.98 | 0.98 | 0.87 | |||
| Training Network Name | Network Performance (R2) | Network Error | Training Cycle | Activation Function | |||||
|---|---|---|---|---|---|---|---|---|---|
| Training | Test | Validation | Training | Test | Validation | Hidden | Output | ||
| Initial training | |||||||||
| MLP 4-17-4 | 0.9993 | 0.9993 | 0.9993 | 0.0362 | 0.0347 | 0.0367 | 210 | Logistic | Exponential |
| MLP 4-19-4 | 0.9996 | 0.9996 | 0.9996 | 0.0261 | 0.0222 | 0.0291 | 699 | Exponential | Logistic |
| MLP 4-19-4 | 0.9995 | 0.9995 | 0.9994 | 0.0292 | 0.0261 | 0.0320 | 232 | Exponential | Logistic |
| MLP 4-14-4 | 0.9992 | 0.9990 | 0.9993 | 0.0 394 | 0.0461 | 0.0367 | 589 | Tan | Identity |
| MLP 4-15-4 | 0.9993 | 0.9993 | 0.9993 | 0.0348 | 0.0333 | 0.0362 | 722 | Tan | Exponential |
| Final network for further deployment | |||||||||
| MLP 4-8-4 | 0.9941 | 0.9924 | 0.9933 | 0.3744 | 0.3641 | 0.4275 | 1237 | Exponential | Logistic |
| Group No. of Sample | Concentration Targets | Neuronal Network Outputs | |||||||||
|---|---|---|---|---|---|---|---|---|---|---|---|
| Zn(II) (μg·mL−1) | Cd(II) (μg·mL−1) | Pb(II) (μg·mL−1) | Cu(II) (μg·mL−1) | Zn(II) (μg·mL−1) | Cd(II) (μg·mL−1) | Pb(II) (μg·mL−1) | Cu(II) (μg·mL−1) | ||||
| blood plasma samples measurement | |||||||||||
| 1 | 6.00 | 6.00 | 6.00 | 6.00 | 6.61 | 6.48 | 6.00 | 6.25 | |||
| 2 | 6.00 | 6.00 | 6.00 | 4.00 | 6.58 | 6.49 | 6.01 | 3.94 | |||
| 3 | 6.00 | 6.00 | 6.00 | 2.00 | 6.54 | 6.49 | 6.03 | 2.25 | |||
| 4 | 6.00 | 6.00 | 6.00 | 1.00 | 6.49 | 6.49 | 6.05 | 1.11 | |||
| 5 | 6.00 | 6.00 | 6.00 | 0.00 | 6.49 | 6.50 | 6.04 | 0.17 | |||
| 6 | 6.00 | 6.00 | 4.00 | 6.00 | 6.59 | 6.47 | 4.51 | 6.24 | |||
| 7 | 6.00 | 6.00 | 2.00 | 6.00 | 6.54 | 6.44 | 2.20 | 6.24 | |||
| 8 | 6.00 | 6.00 | 1.00 | 6.00 | 6.48 | 6.37 | 0.63 | 6.22 | |||
| 9 | 6.00 | 6.00 | 0.00 | 6.00 | 6.42 | 6.29 | 0.20 | 6.21 | |||
| 10 | 6.00 | 4.00 | 6.00 | 6.00 | 6.75 | 4.18 | 5.97 | 6.23 | |||
| 11 | 6.00 | 2.00 | 6.00 | 6.00 | 6.81 | 1.99 | 5.93 | 6.21 | |||
| 12 | 6.00 | 1.00 | 6.00 | 6.00 | 6.87 | 0.95 | 5.92 | 6.18 | |||
| 13 | 6.00 | 0.00 | 6.00 | 6.00 | 6.88 | 0.32 | 5.93 | 6.14 | |||
| 14 | 4.00 | 6.00 | 6.00 | 6.00 | 5.27 | 6.50 | 5.95 | 6.24 | |||
| 15 | 2.00 | 6.00 | 6.00 | 6.00 | 1.88 | 6.45 | 5.80 | 6.22 | |||
| 16 | 1.00 | 6.00 | 6.00 | 6.00 | 1.00 | 6.49 | 5.74 | 6.20 | |||
| 17 | 0.00 | 6.00 | 6.00 | 6.00 | 0.37 | 6.47 | 5.66 | 6.18 | |||
| 18 | 0.00 | 0.00 | 0.00 | 4.00 | 0.49 | 0.50 | 0.38 | 3.81 | |||
| 19 | 0.00 | 0.00 | 4.00 | 0.00 | 0.49 | 0.47 | 4.77 | 0.10 | |||
| 20 | 0.00 | 4.00 | 0.00 | 0.00 | 0.45 | 4.18 | 0.31 | 0.09 | |||
| 21 | 4.00 | 0.00 | 0.00 | 0.00 | 5.08 | 0.38 | 0.27 | 0.08 | |||
| 22 | 0.00 | 0.00 | 4.00 | 4.00 | 0.46 | 0.46 | 4.64 | 3.91 | |||
| R2 of the network | 0.995 | 0.998 | 0.993 | 0.999 | |||||||
| Validation samples | |||||||||||
| 1 | 8.00 | 8.00 | 8.00 | 8.00 | 8.42 | 8.59 | 8.53 | 9.02 | |||
| 2 | 8.00 | 8.00 | 8.00 | 4.00 | 8.38 | 8.60 | 8.52 | 3.82 | |||
| 3 | 8.00 | 8.00 | 8.00 | 2.00 | 8.35 | 8.61 | 8.53 | 2.11 | |||
| 4 | 8.00 | 8.00 | 8.00 | 1.00 | 8.31 | 8.61 | 8.54 | 1.04 | |||
| 5 | 8.00 | 8.00 | 8.00 | 0.00 | 8.27 | 8.61 | 8.54 | 0.19 | |||
| 6 | 8.00 | 8.00 | 4.00 | 8.00 | 8.35 | 8.56 | 4.65 | 8.94 | |||
| 7 | 8.00 | 8.00 | 2.00 | 8.00 | 8.30 | 8.52 | 2.22 | 8.89 | |||
| 8 | 8.00 | 8.00 | 1.00 | 8.00 | 8.25 | 8.46 | 0.60 | 8.83 | |||
| 9 | 8.00 | 8.00 | 0.00 | 8.00 | 8.19 | 8.39 | 0.18 | 8.78 | |||
| 10 | 8.00 | 4.00 | 8.00 | 8.00 | 8.19 | 3.85 | 8.40 | 8.94 | |||
| 11 | 8.00 | 2.00 | 8.00 | 8.00 | 8.11 | 1.87 | 8.35 | 8.90 | |||
| 12 | 8.00 | 1.00 | 8.00 | 8.00 | 8.04 | 0.89 | 8.32 | 8.86 | |||
| 13 | 8.00 | 0.00 | 8.00 | 8.00 | 8.44 | 0.28 | 8.31 | 8.80 | |||
| 14 | 4.00 | 8.00 | 8.00 | 8.00 | 5.37 | 8.48 | 8.36 | 9.00 | |||
| 15 | 2.00 | 8.00 | 8.00 | 8.00 | 1.83 | 8.32 | 8.17 | 8.96 | |||
| 16 | 1.00 | 8.00 | 8.00 | 8.00 | 0.96 | 8.27 | 8.09 | 8.95 | |||
| 17 | 0.00 | 8.00 | 8.00 | 8.00 | 0.34 | 8.18 | 7.96 | 8.92 | |||
| 18 | 0.00 | 0.00 | 8.00 | 8.00 | 0.45 | 0.42 | 7.99 | 8.66 | |||
| 19 | 0.00 | 4.00 | 4.00 | 0.00 | 0.39 | 3.94 | 4.39 | 0.14 | |||
| 20 | 2.00 | 2.00 | 0.00 | 0.00 | 2.04 | 2.10 | 0.27 | 0.09 | |||
| R2 of the network | 0.996 | 0.998 | 0.997 | 0.999 | |||||||
© 2015 by the authors; licensee MDPI, Basel, Switzerland. This article is an open access article distributed under the terms and conditions of the Creative Commons Attribution license ( http://creativecommons.org/licenses/by/4.0/).
Share and Cite
Kudr, J.; Nguyen, H.V.; Gumulec, J.; Nejdl, L.; Blazkova, I.; Ruttkay-Nedecky, B.; Hynek, D.; Kynicky, J.; Adam, V.; Kizek, R. Simultaneous Automatic Electrochemical Detection of Zinc, Cadmium, Copper and Lead Ions in Environmental Samples Using a Thin-Film Mercury Electrode and an Artificial Neural Network. Sensors 2015, 15, 592-610. https://0-doi-org.brum.beds.ac.uk/10.3390/s150100592
Kudr J, Nguyen HV, Gumulec J, Nejdl L, Blazkova I, Ruttkay-Nedecky B, Hynek D, Kynicky J, Adam V, Kizek R. Simultaneous Automatic Electrochemical Detection of Zinc, Cadmium, Copper and Lead Ions in Environmental Samples Using a Thin-Film Mercury Electrode and an Artificial Neural Network. Sensors. 2015; 15(1):592-610. https://0-doi-org.brum.beds.ac.uk/10.3390/s150100592
Chicago/Turabian StyleKudr, Jiri, Hoai Viet Nguyen, Jaromir Gumulec, Lukas Nejdl, Iva Blazkova, Branislav Ruttkay-Nedecky, David Hynek, Jindrich Kynicky, Vojtech Adam, and Rene Kizek. 2015. "Simultaneous Automatic Electrochemical Detection of Zinc, Cadmium, Copper and Lead Ions in Environmental Samples Using a Thin-Film Mercury Electrode and an Artificial Neural Network" Sensors 15, no. 1: 592-610. https://0-doi-org.brum.beds.ac.uk/10.3390/s150100592