
Development of a 3D Underground Cadastral System with Indoor Mapping for As-Built BIM: The Case Study of Gangnam Subway Station in Korea

Abstract
:1. Introduction
2. Related Work
3. Proposed Method
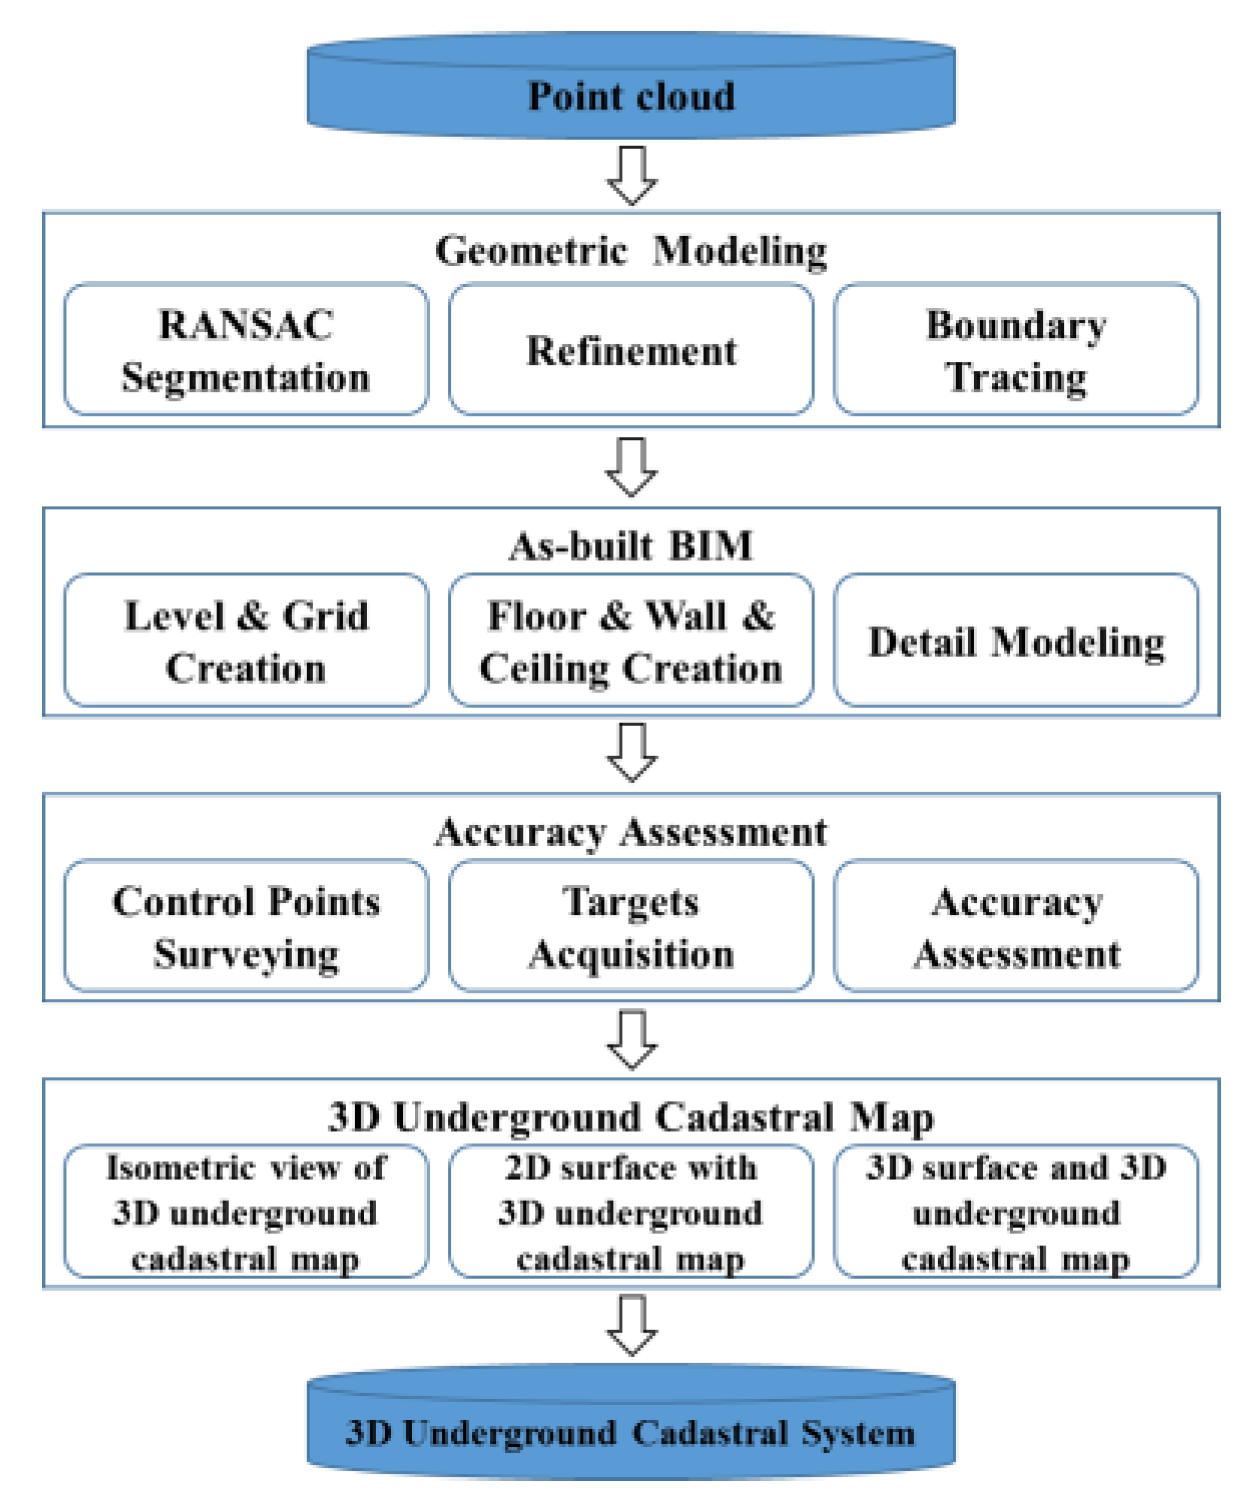
3.1. Overviews

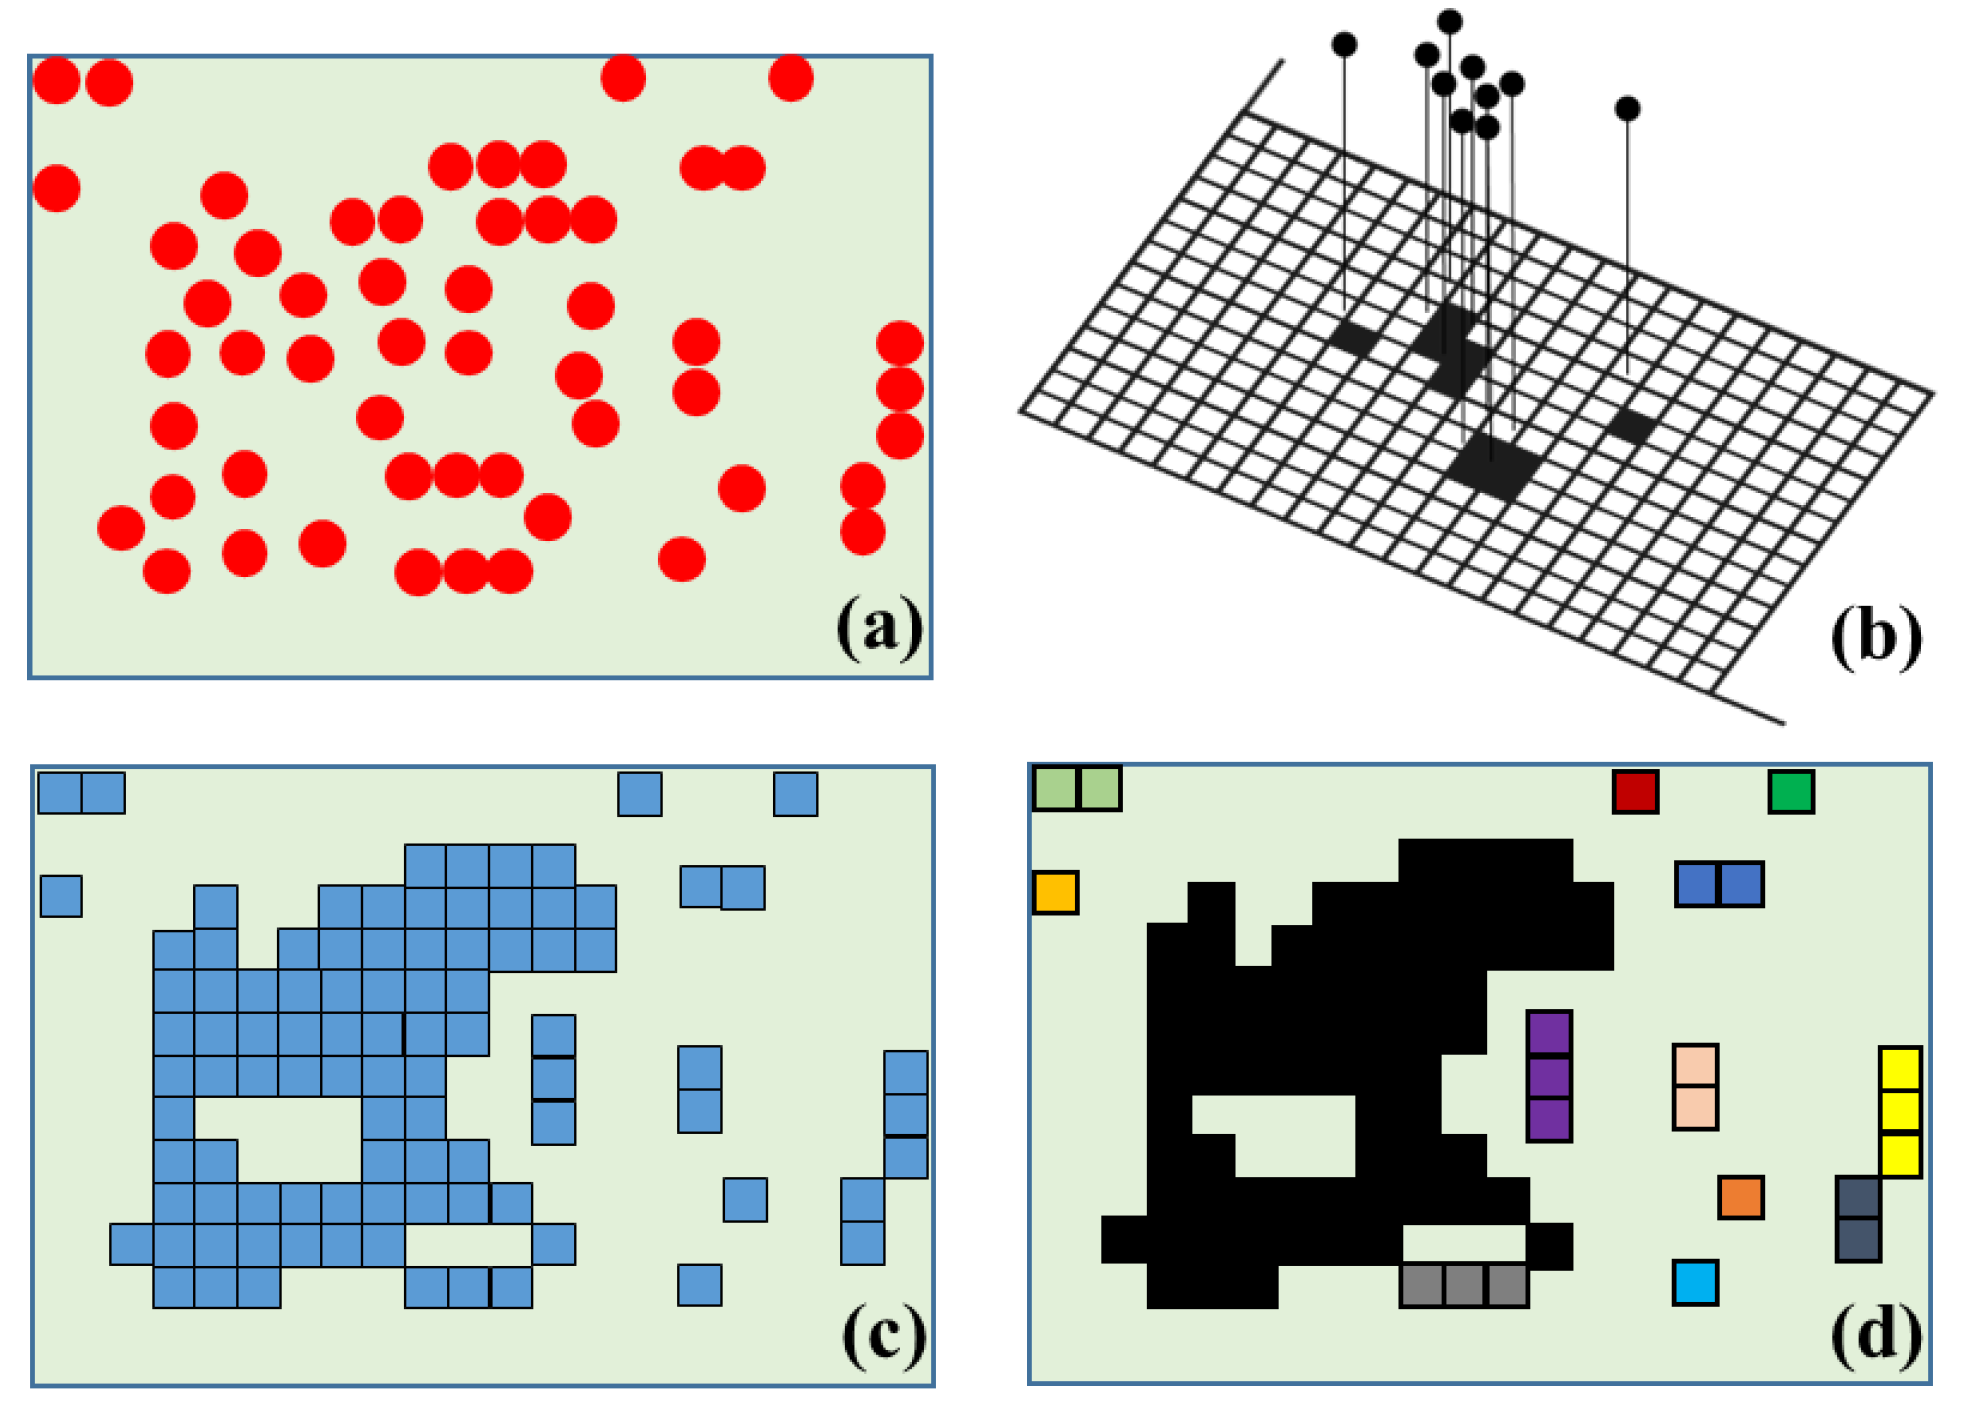
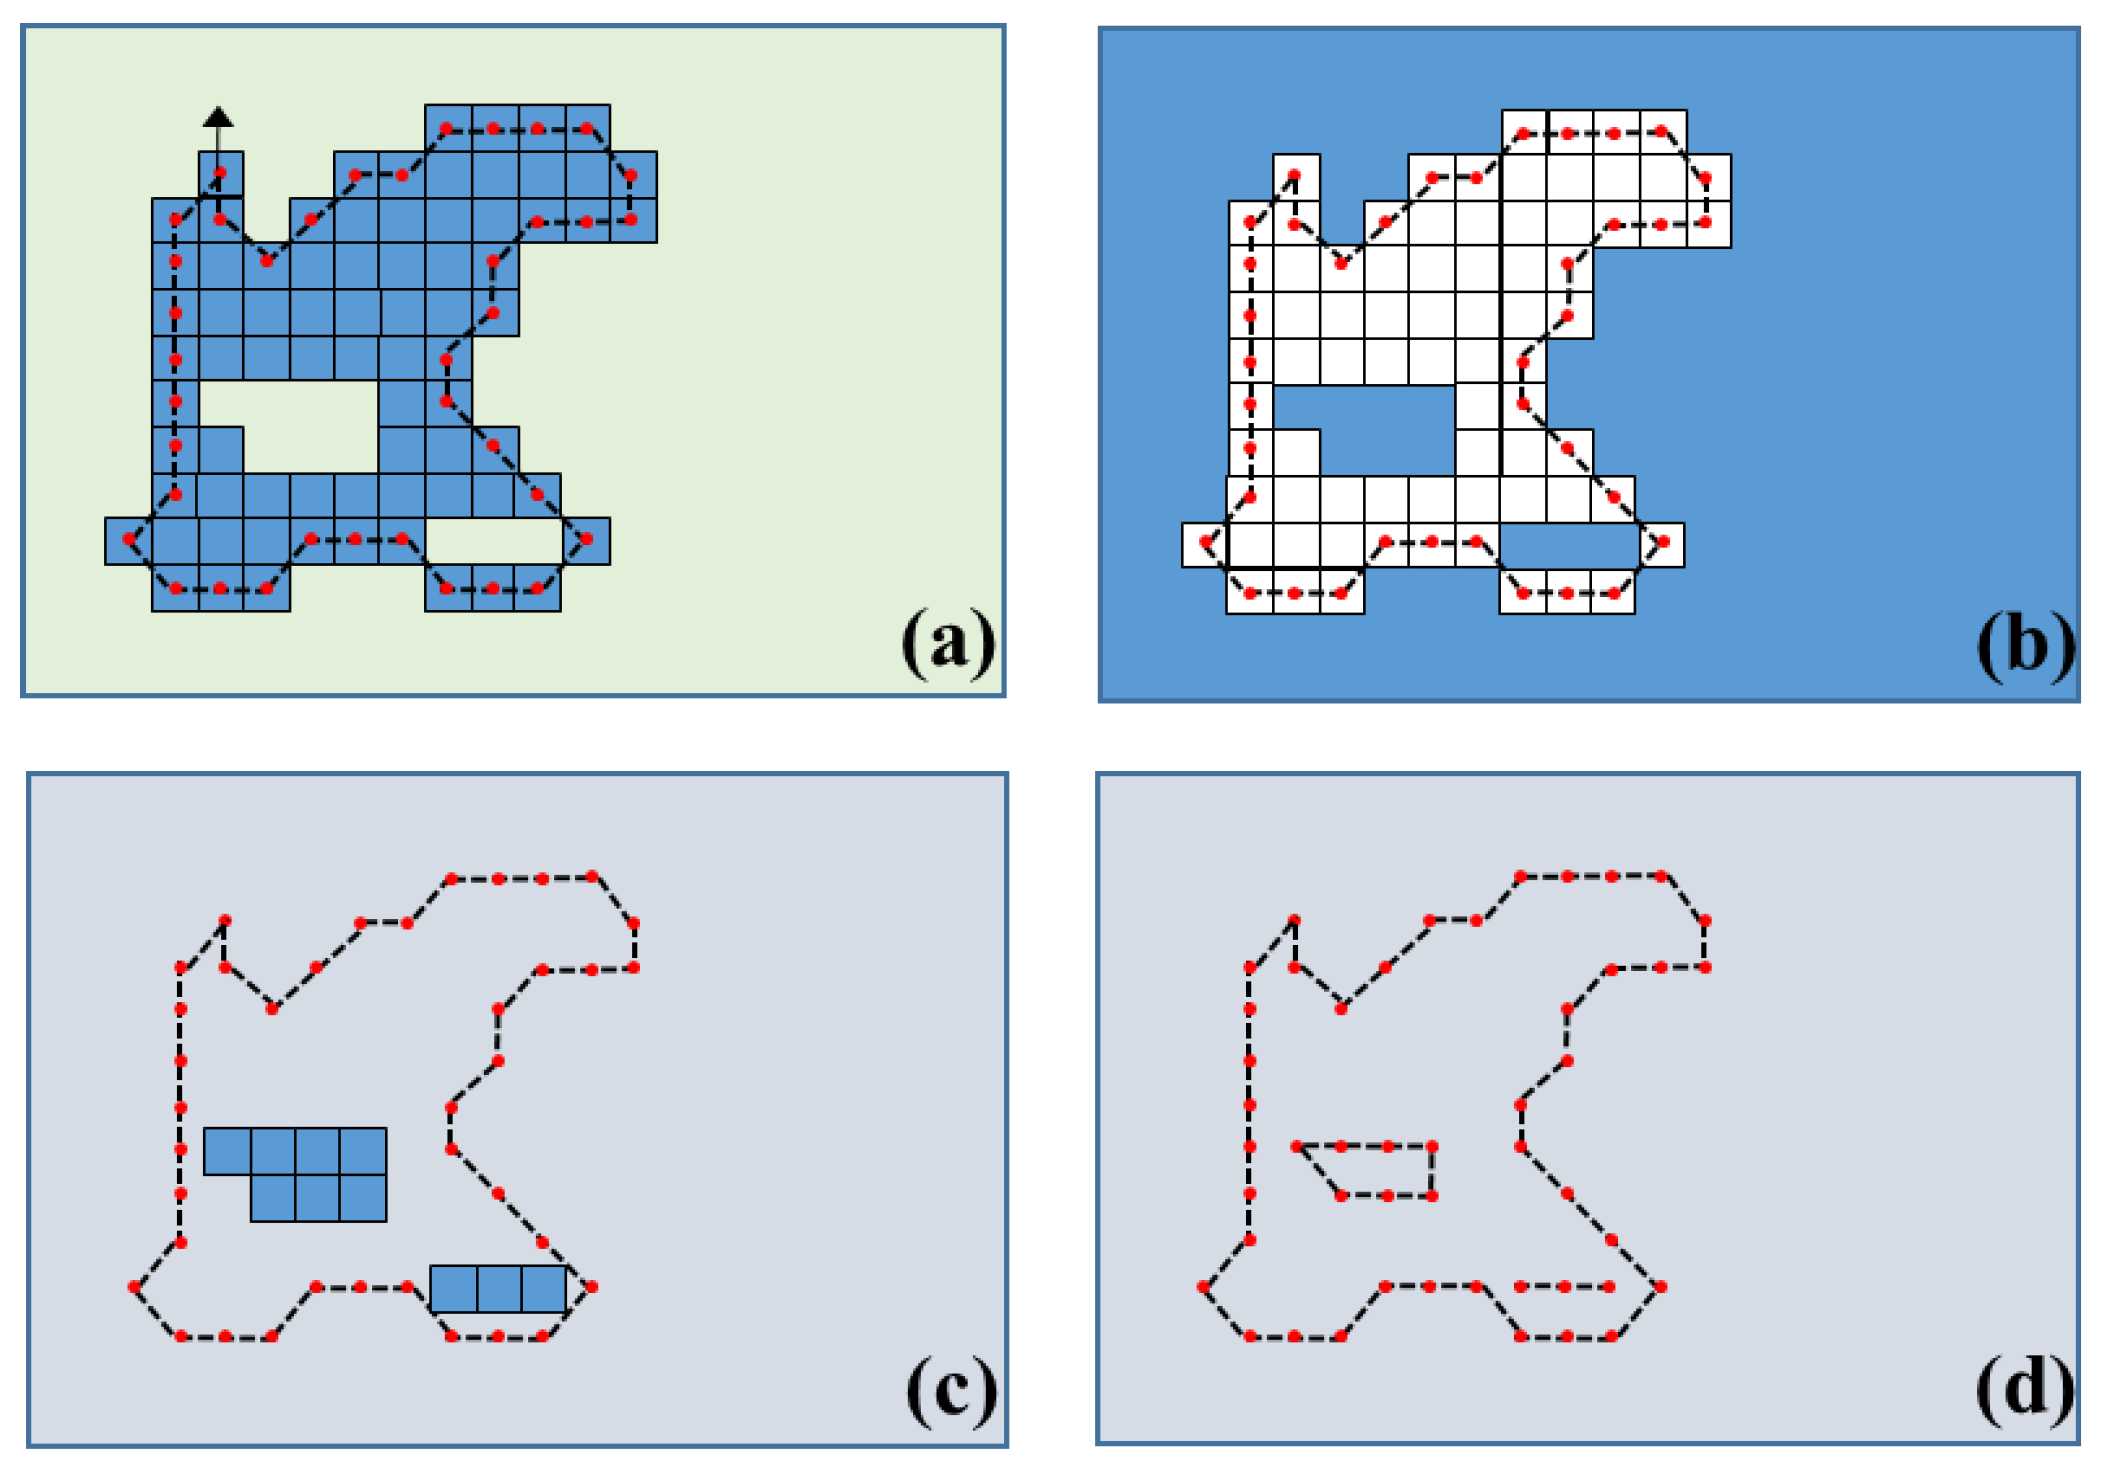
3.2. Geometric Modeling


3.3. As-Built BIM
3.4. Accuracy Assessment
3.5. Concepts of 3D Underground Cadastral Map
4. Application
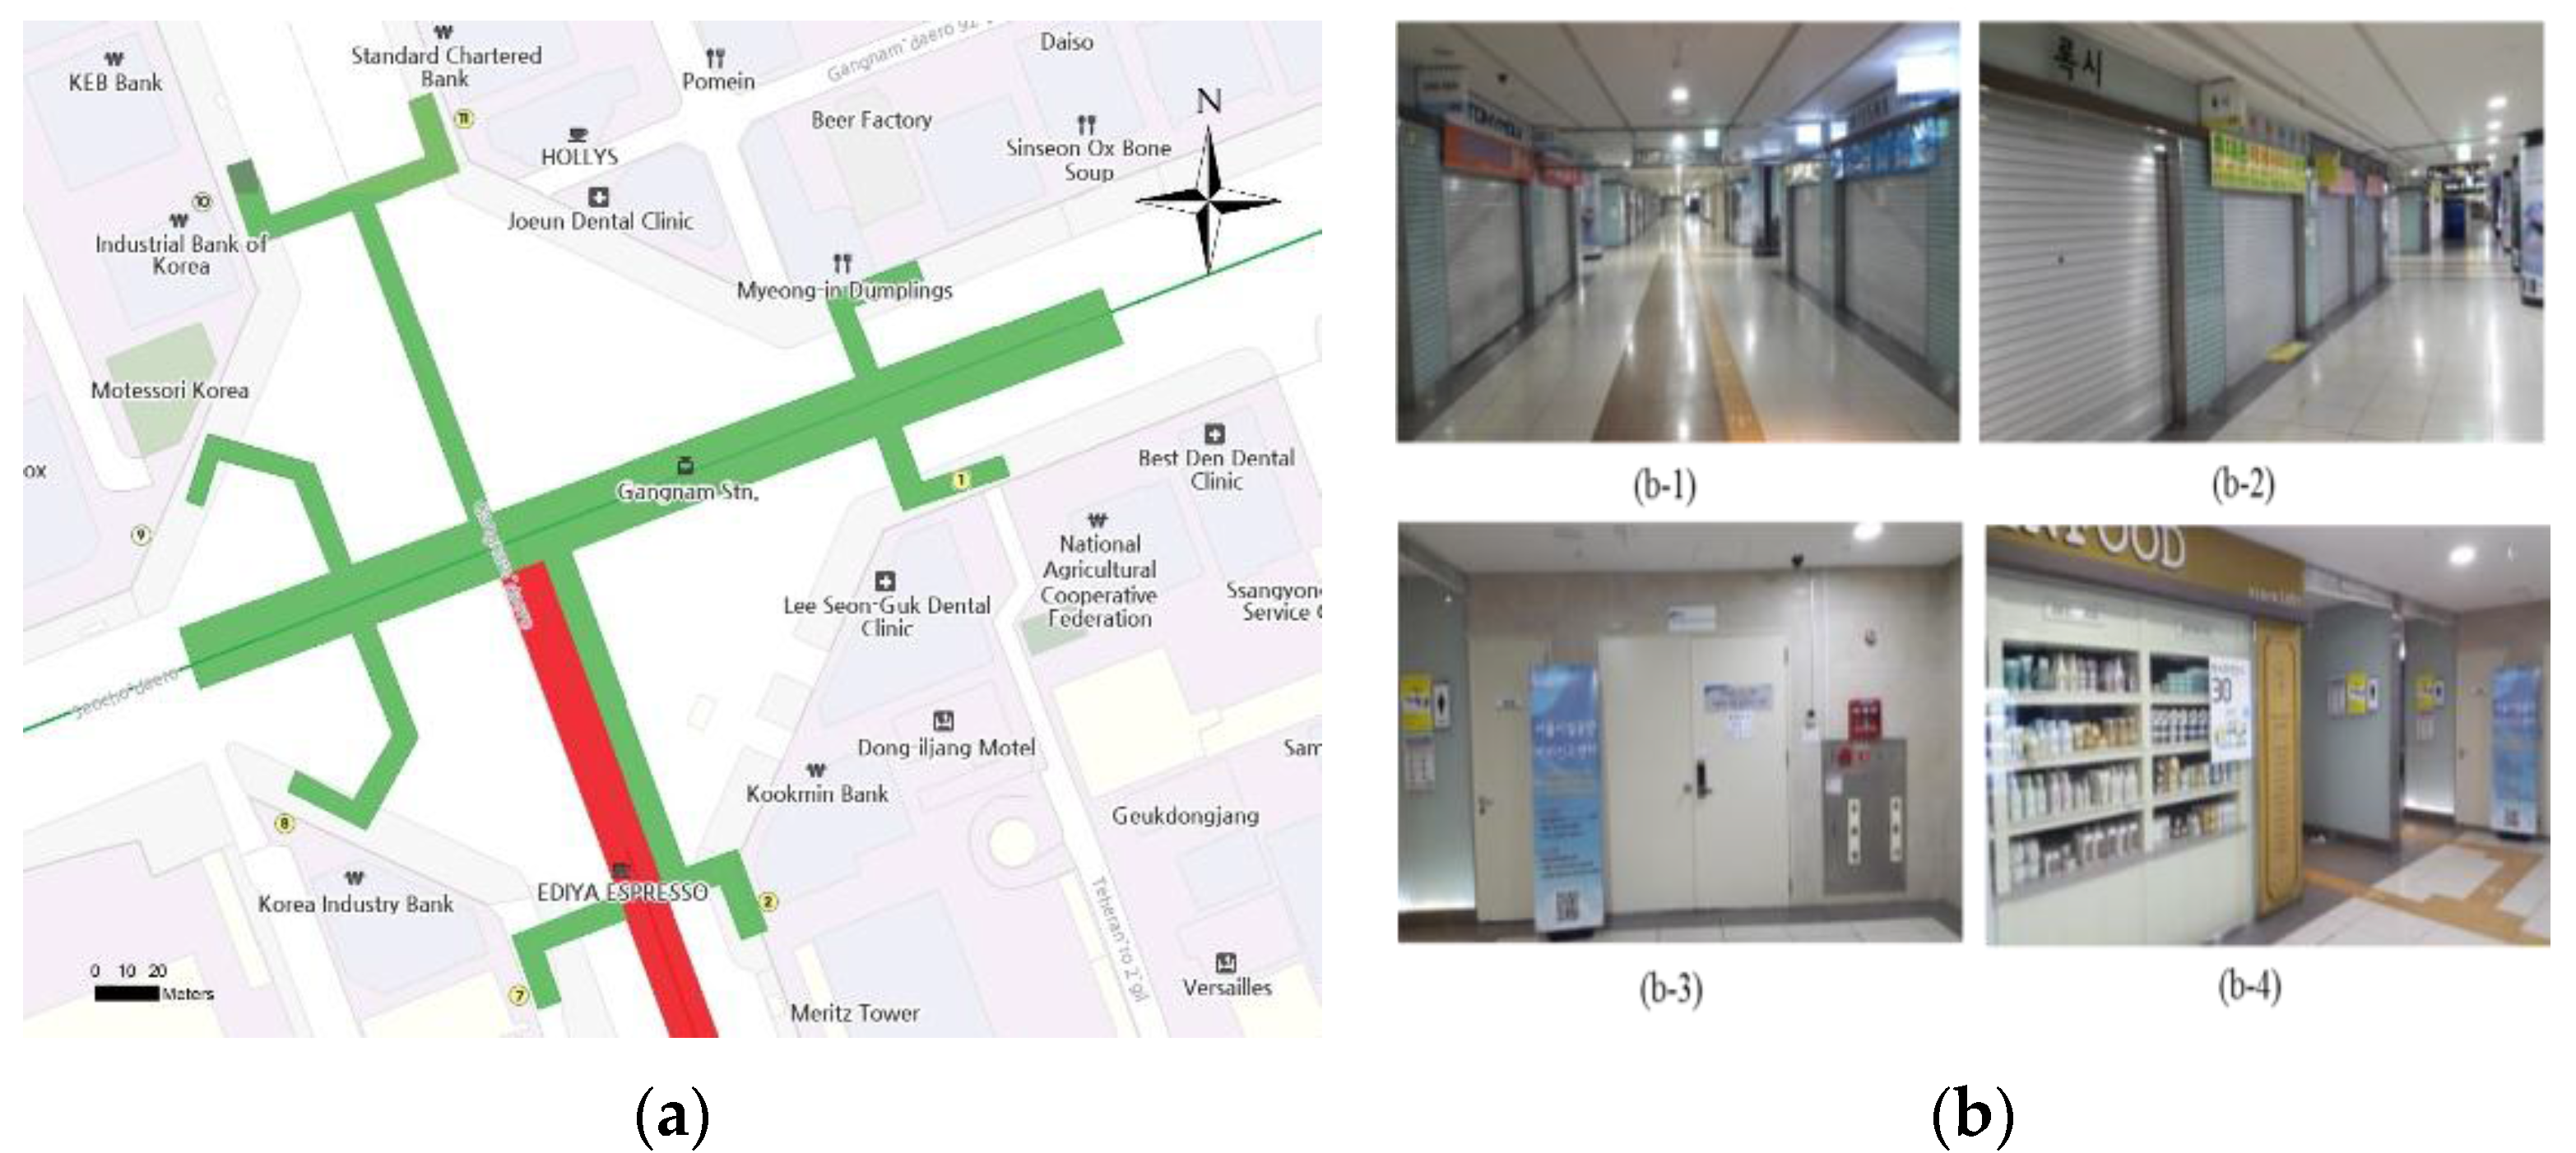
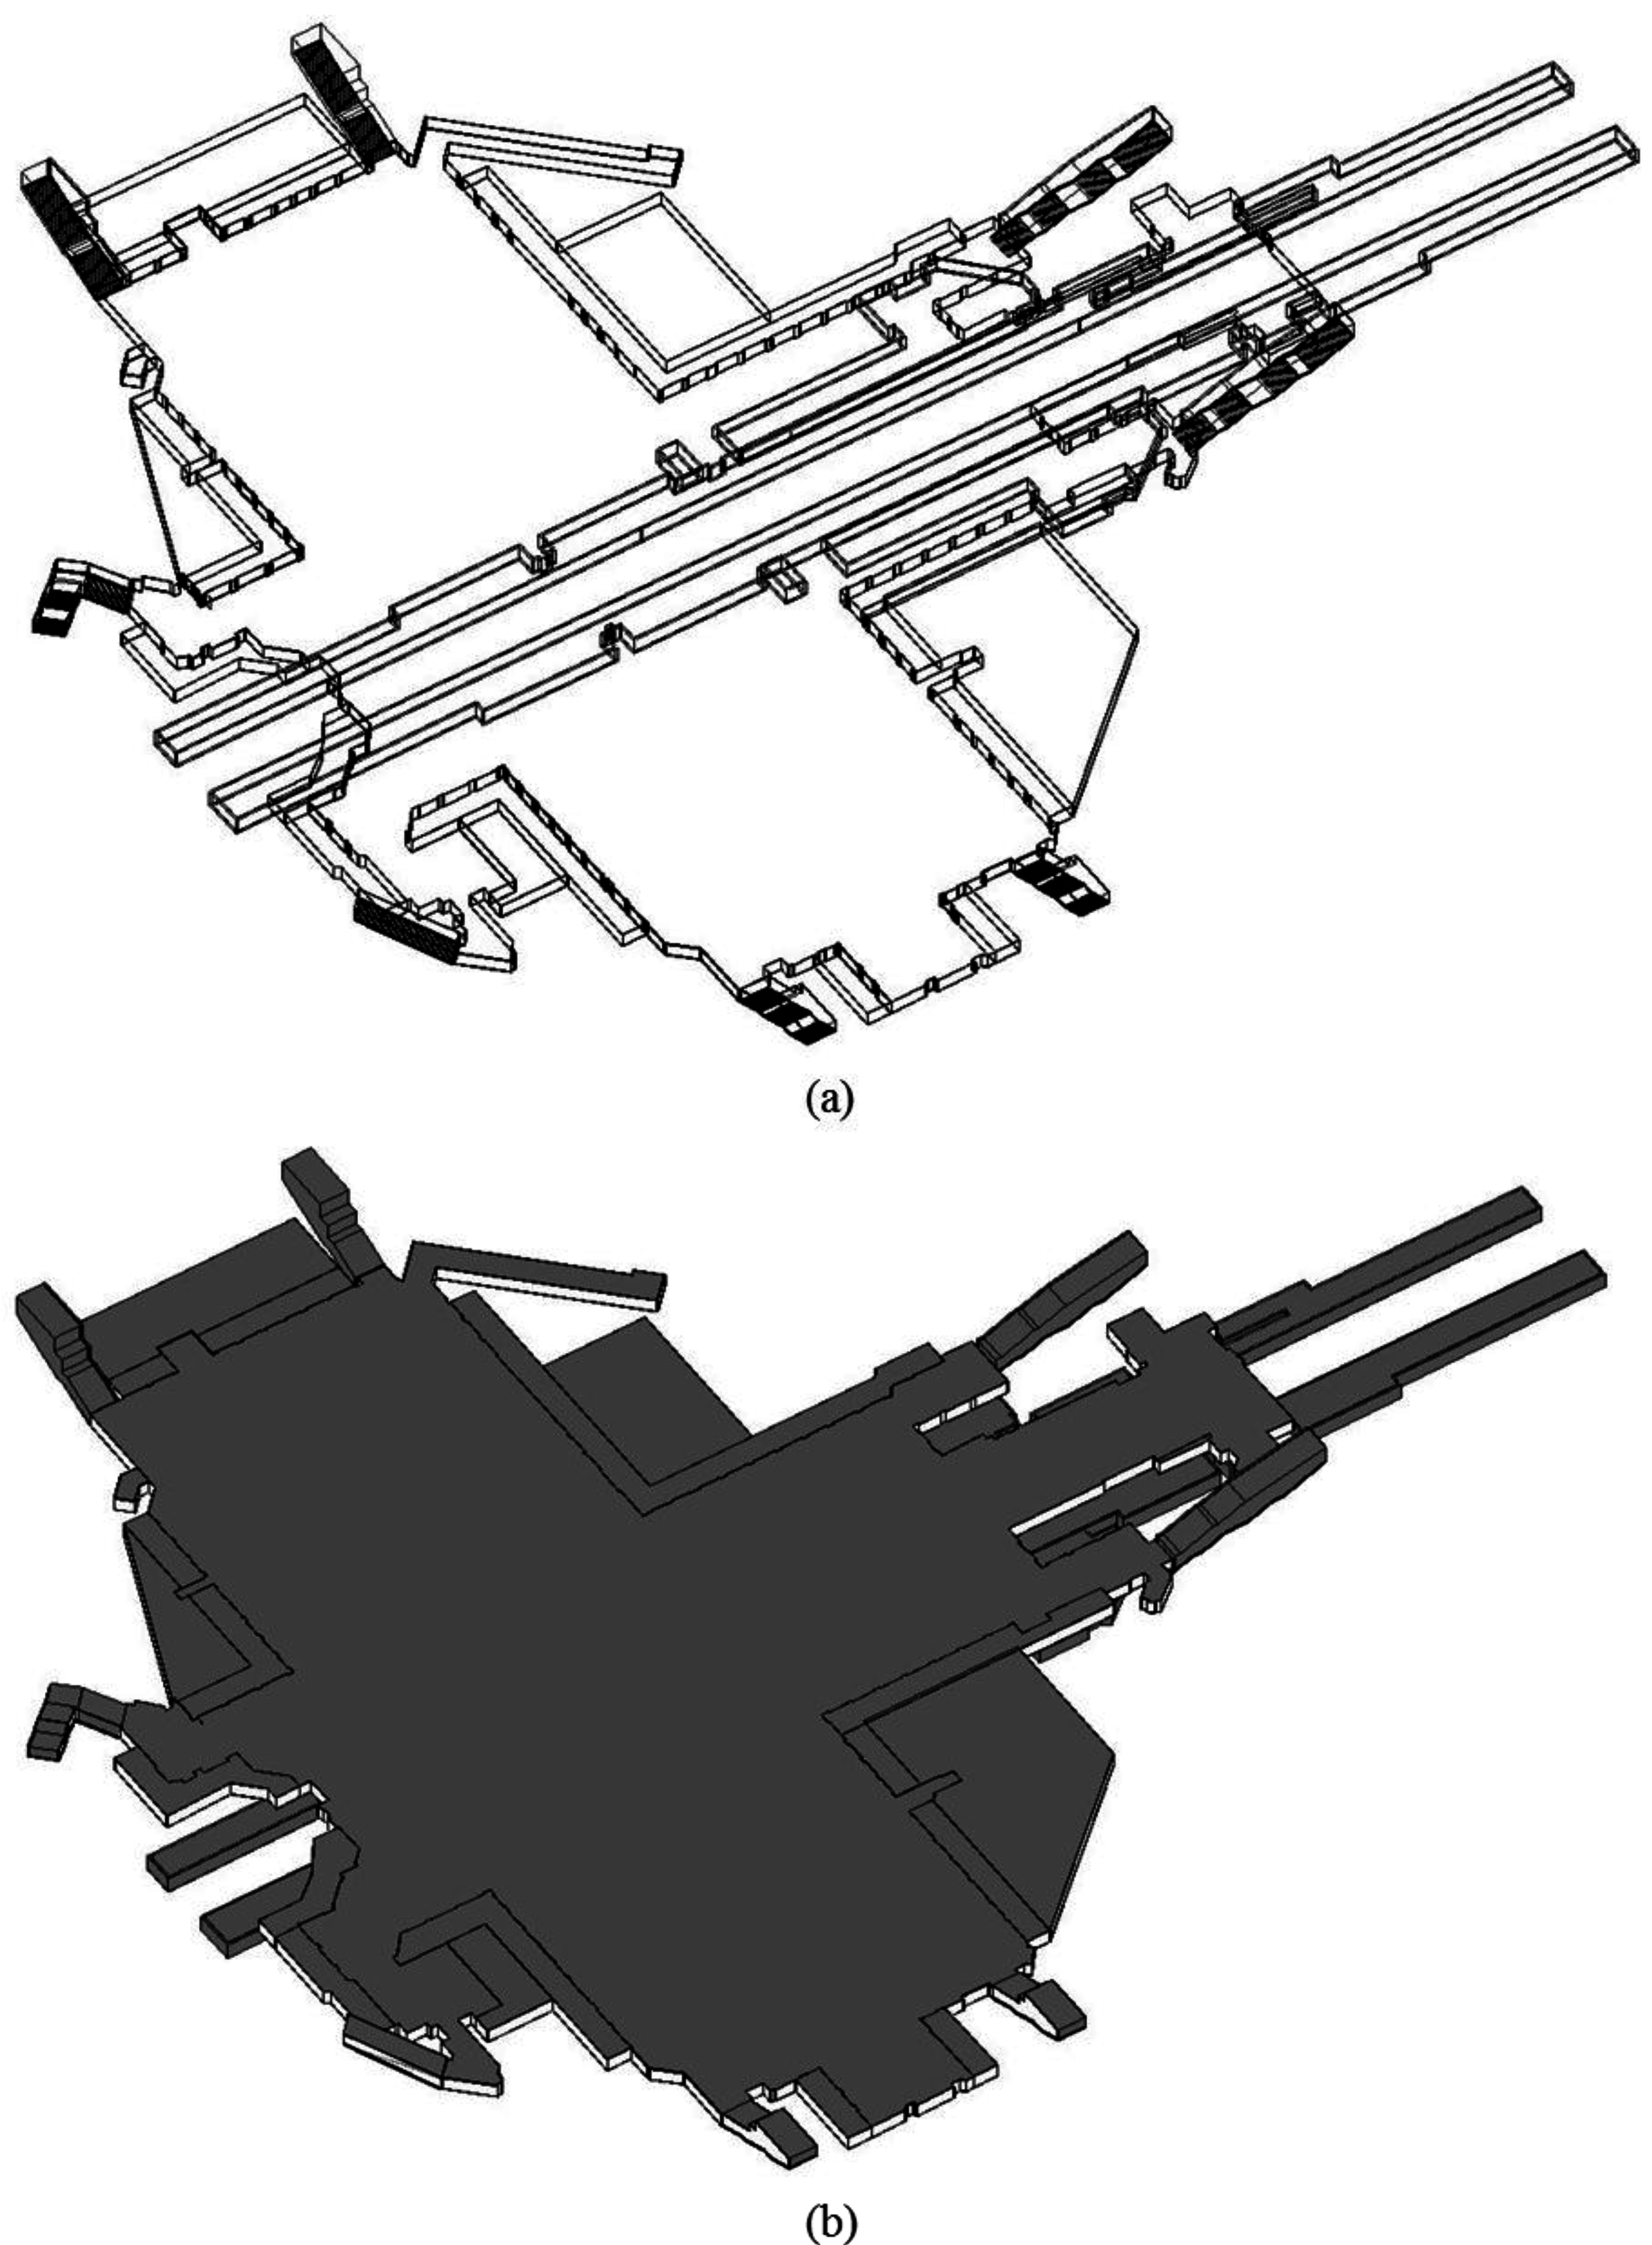
4.1. Project Site and Data Acquisition

| Categories | Specifications |
|---|---|
| Target Study Area | Gangnam subway station: underground shopping center and subway station platform (Gangnam-gu, Seoul, Korea) |
| Extent of Subway Station (Along Centerline) | Length = 254.116 m |
| Width = 177.5 m | |
| Height = 7.05 m | |
| Type of Terrestrial Laser Scanner | Scanner model: Leica Scan Station P20 |
| 3D position accuracy: 3 mm at 50 m, 6 mm at 100 m | |
| Linearity error: ≤1 mm | |
| Angular accuracy: 8″ (horizontal/vertical) | |
| Laser Scanning Data | Number of stations: 171 stations (1st floor: 126, 2nd floor: 45) |
| Data size: 4.85 GB | |
| Number of points: 106.7 million | |
| Coordinate System | Project coordinate system: Korea 2000 central belt 2010 |
| Datum: Korea 2000 (KGD2002) | |
| Ellipsoid: GRS1980 | |
| Projection: Transverse Mercator | |
| Processing Environment | CPU: Intel® Core™ i7-4790 [email protected] GHz |
| RAM: 32.0 GB | |
| OS: Windows 7 64-bit | |
| Software | Point cloud processing: Matlab 8.1.0 |
| As-built Modeling: Autodesk Revit 2014 |
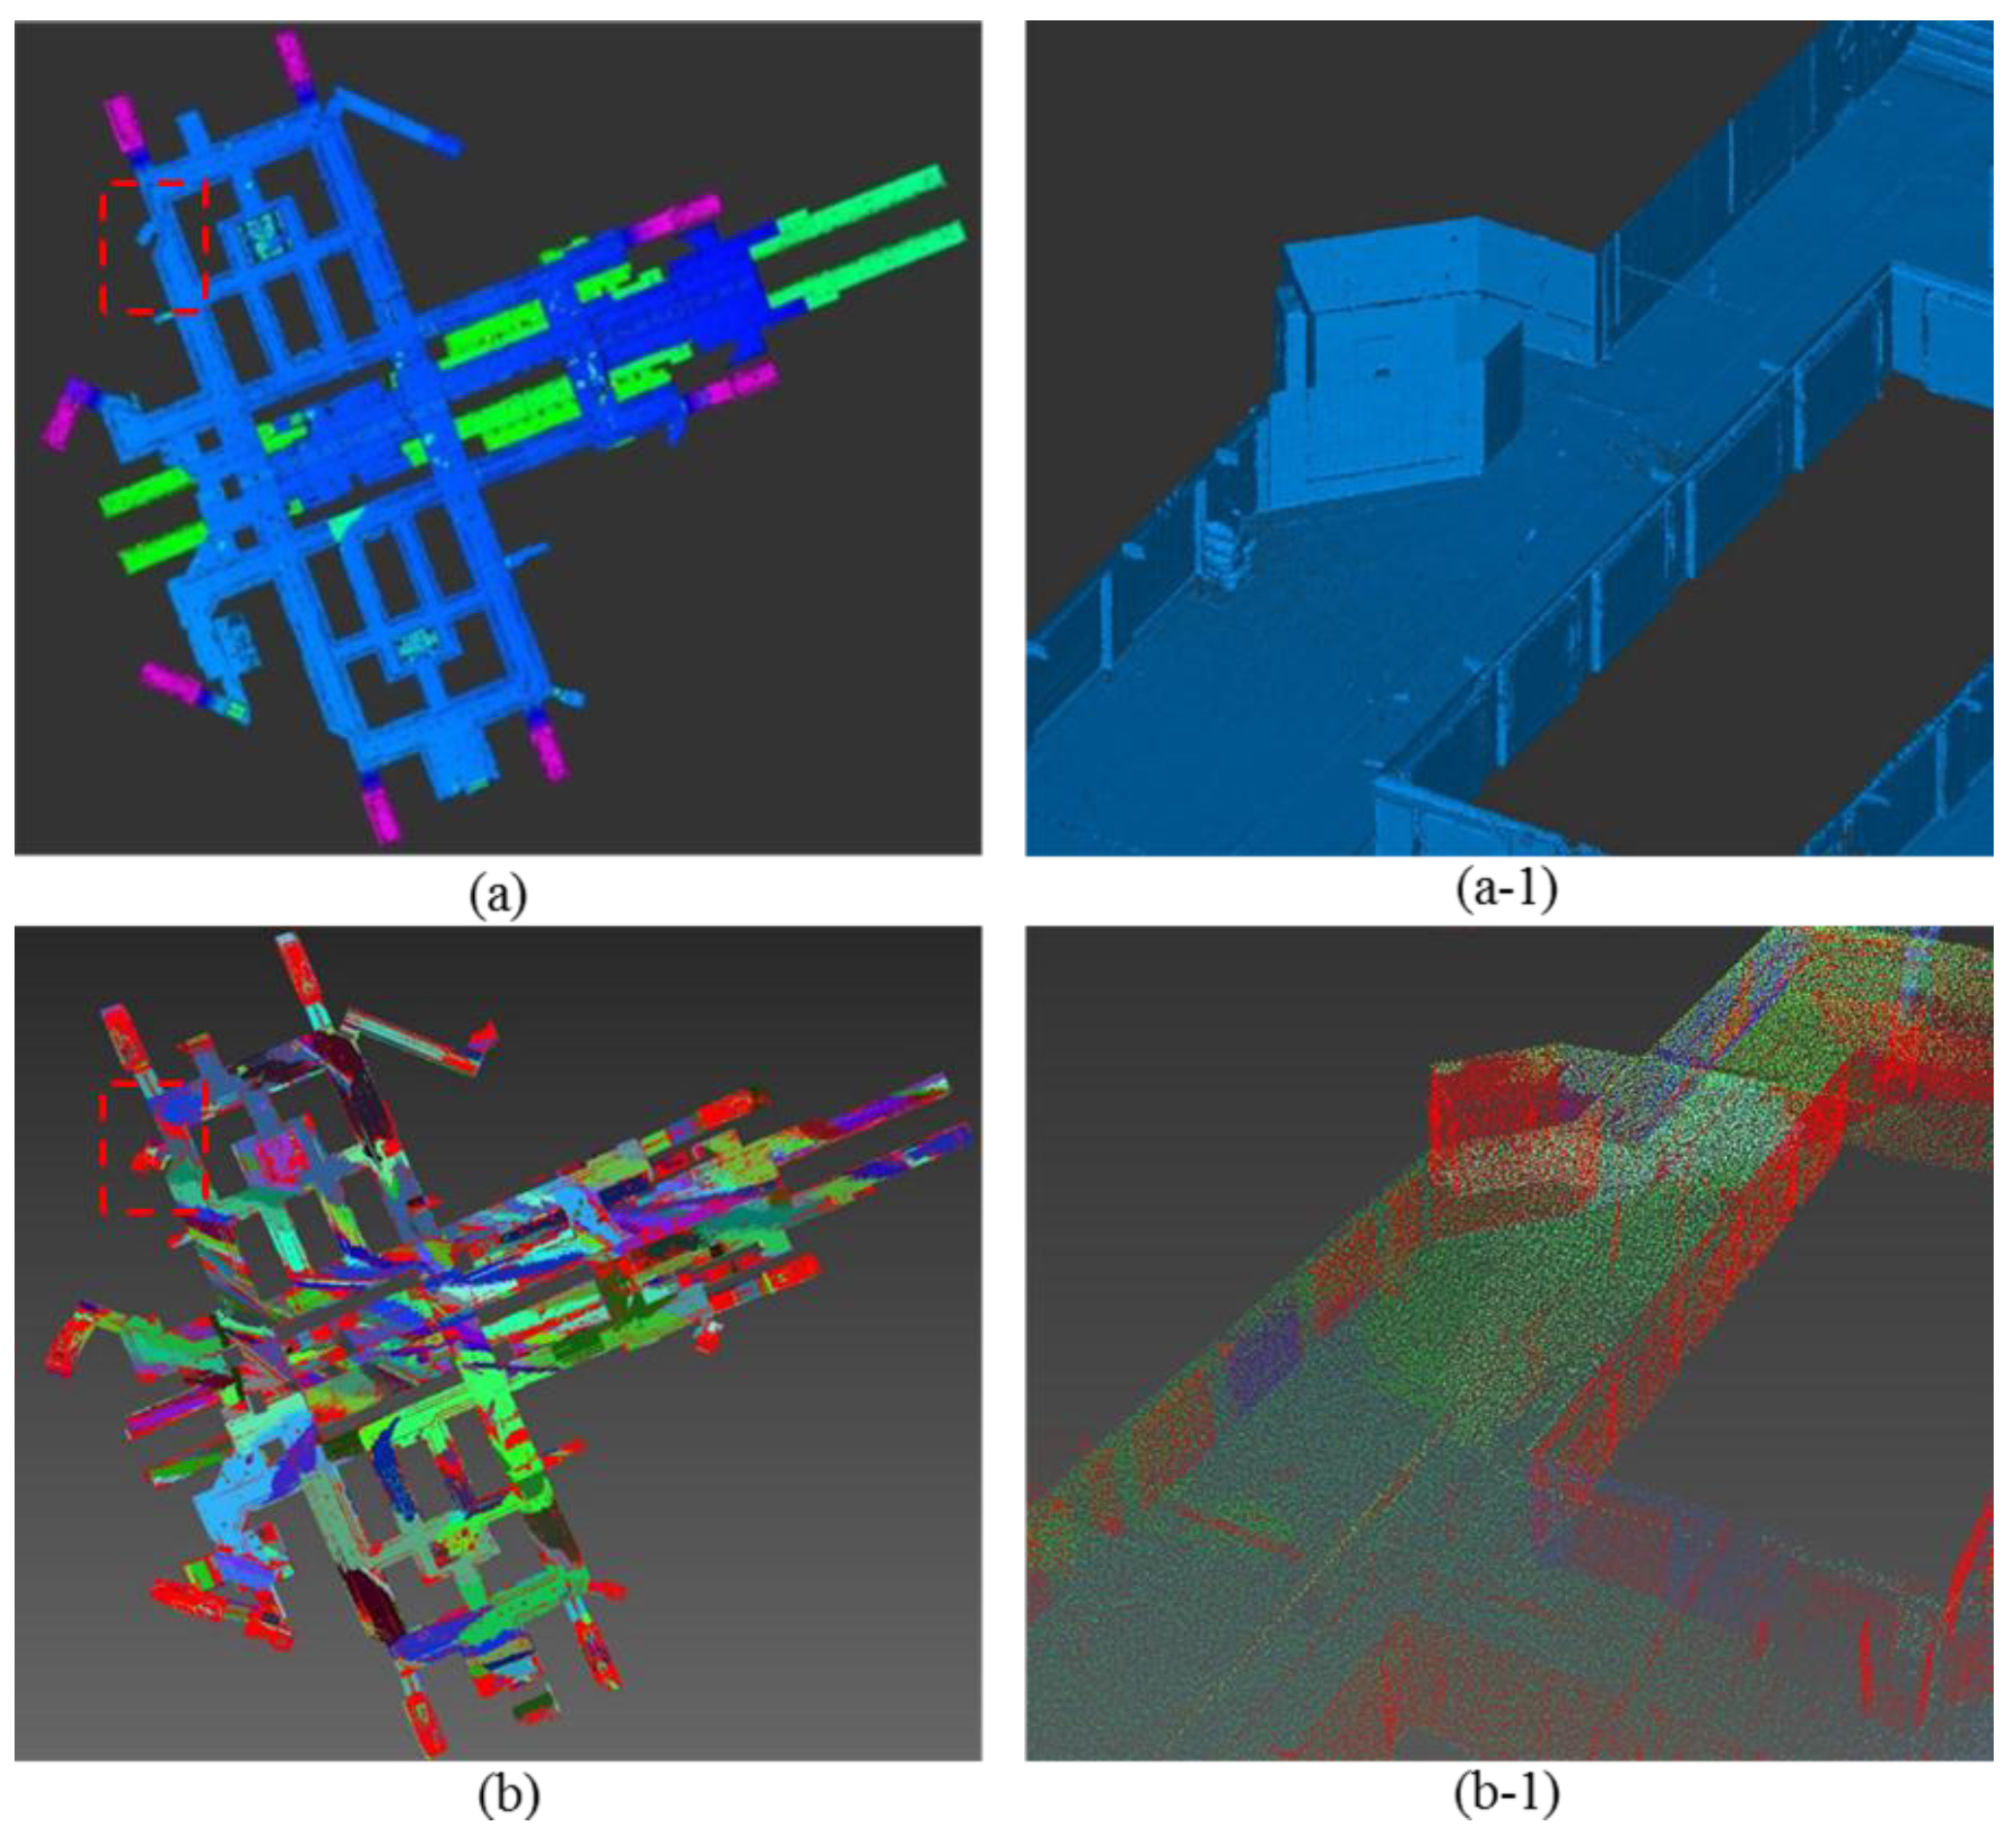
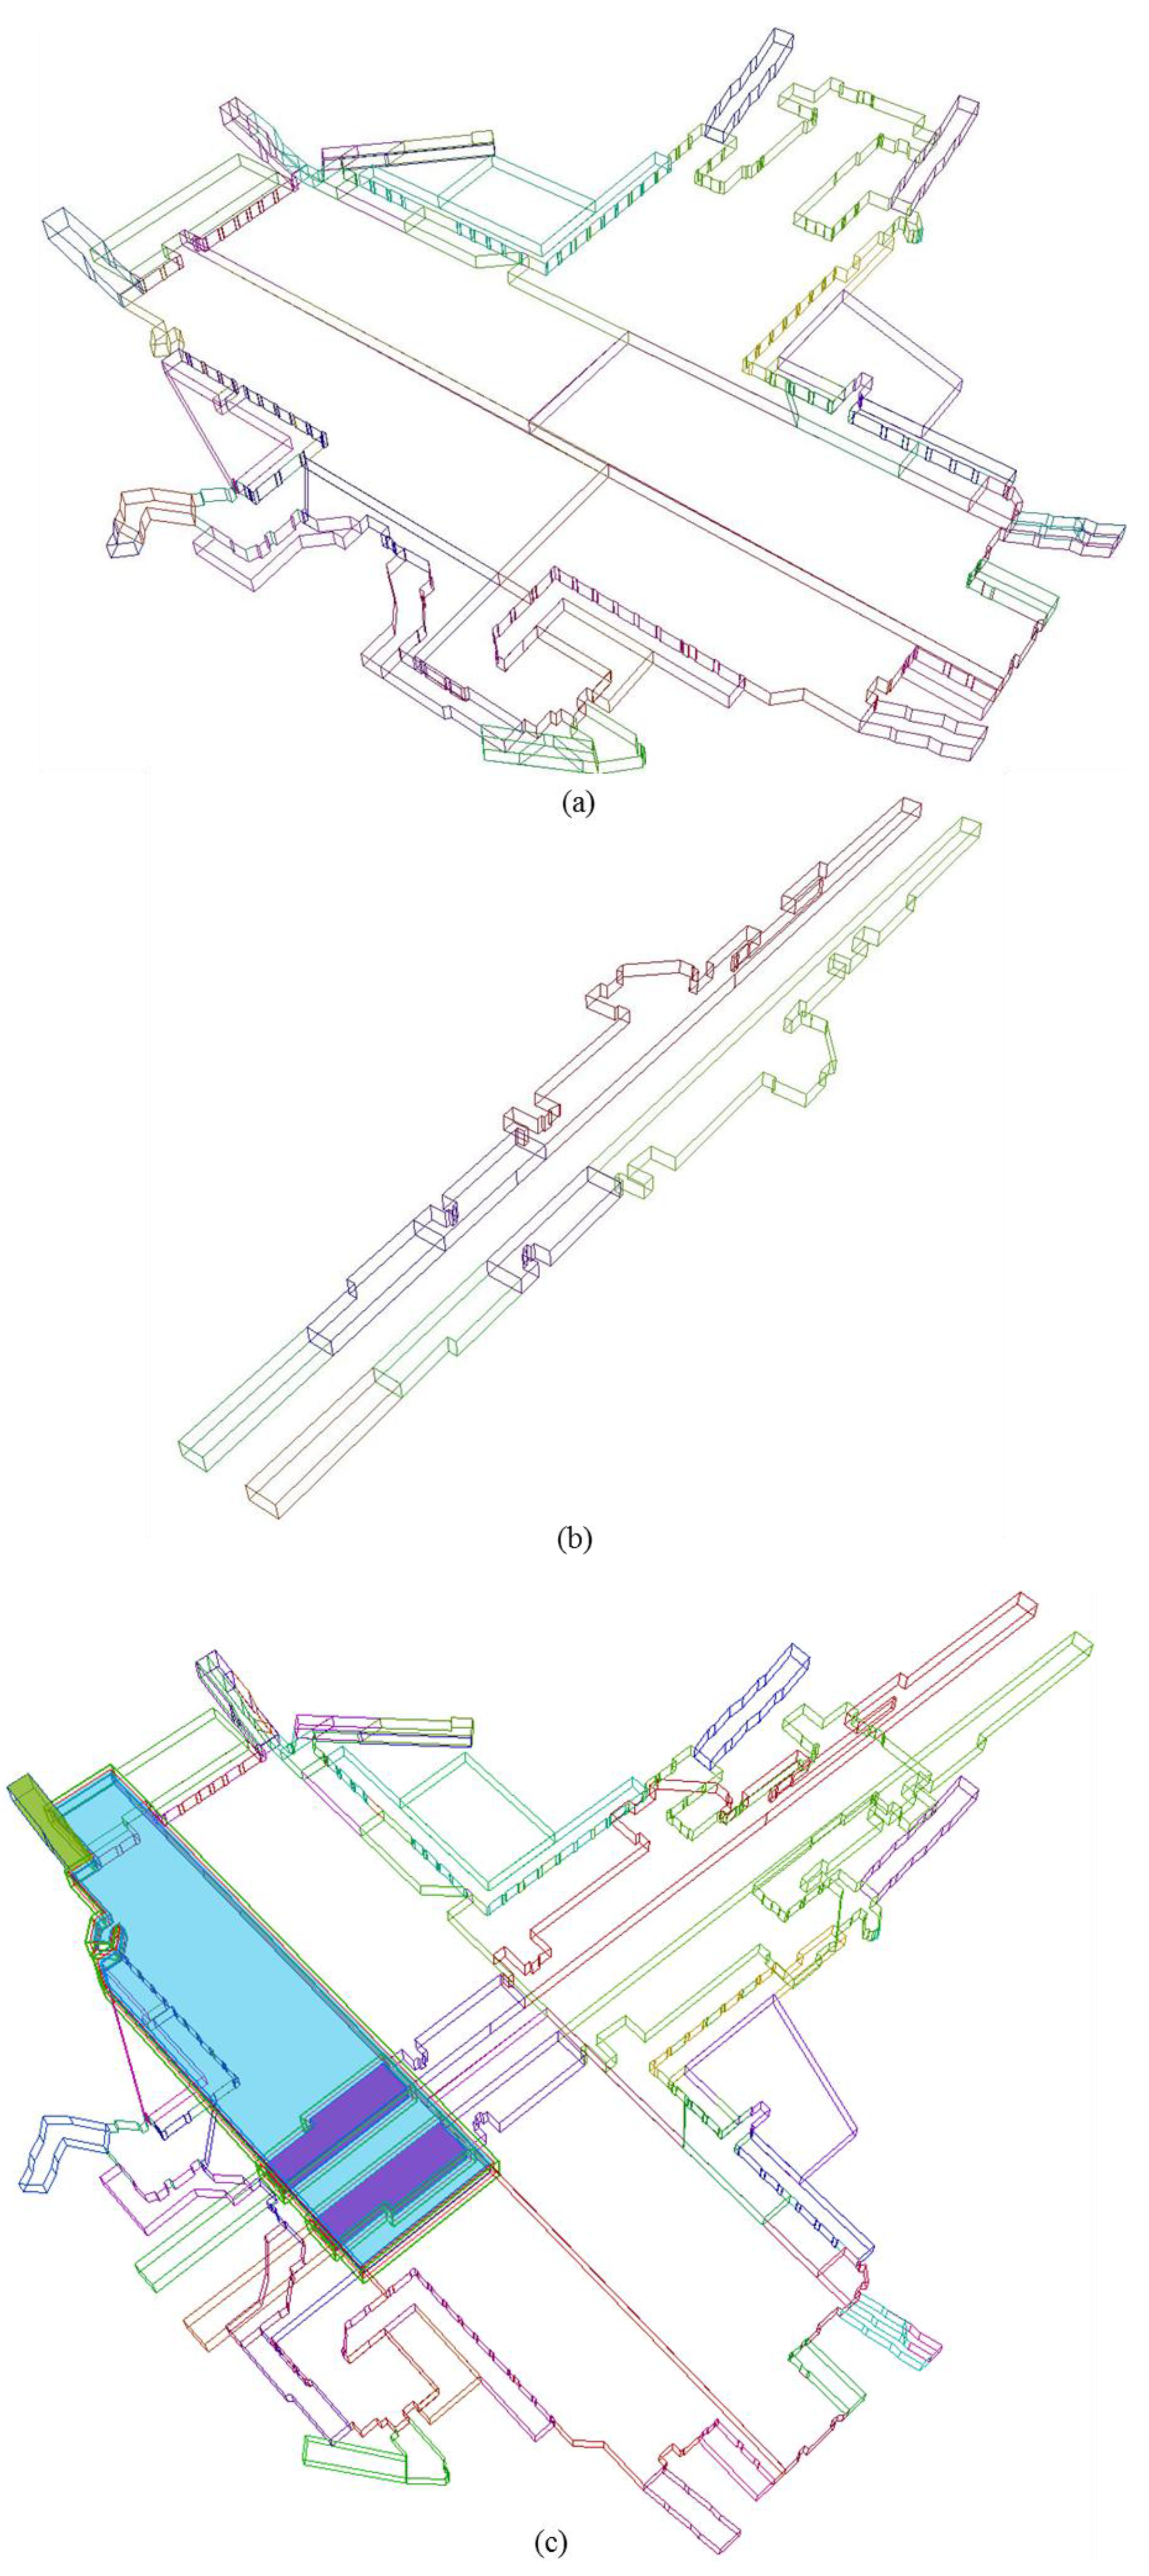
4.2. Segmentation and Geometric Modeling


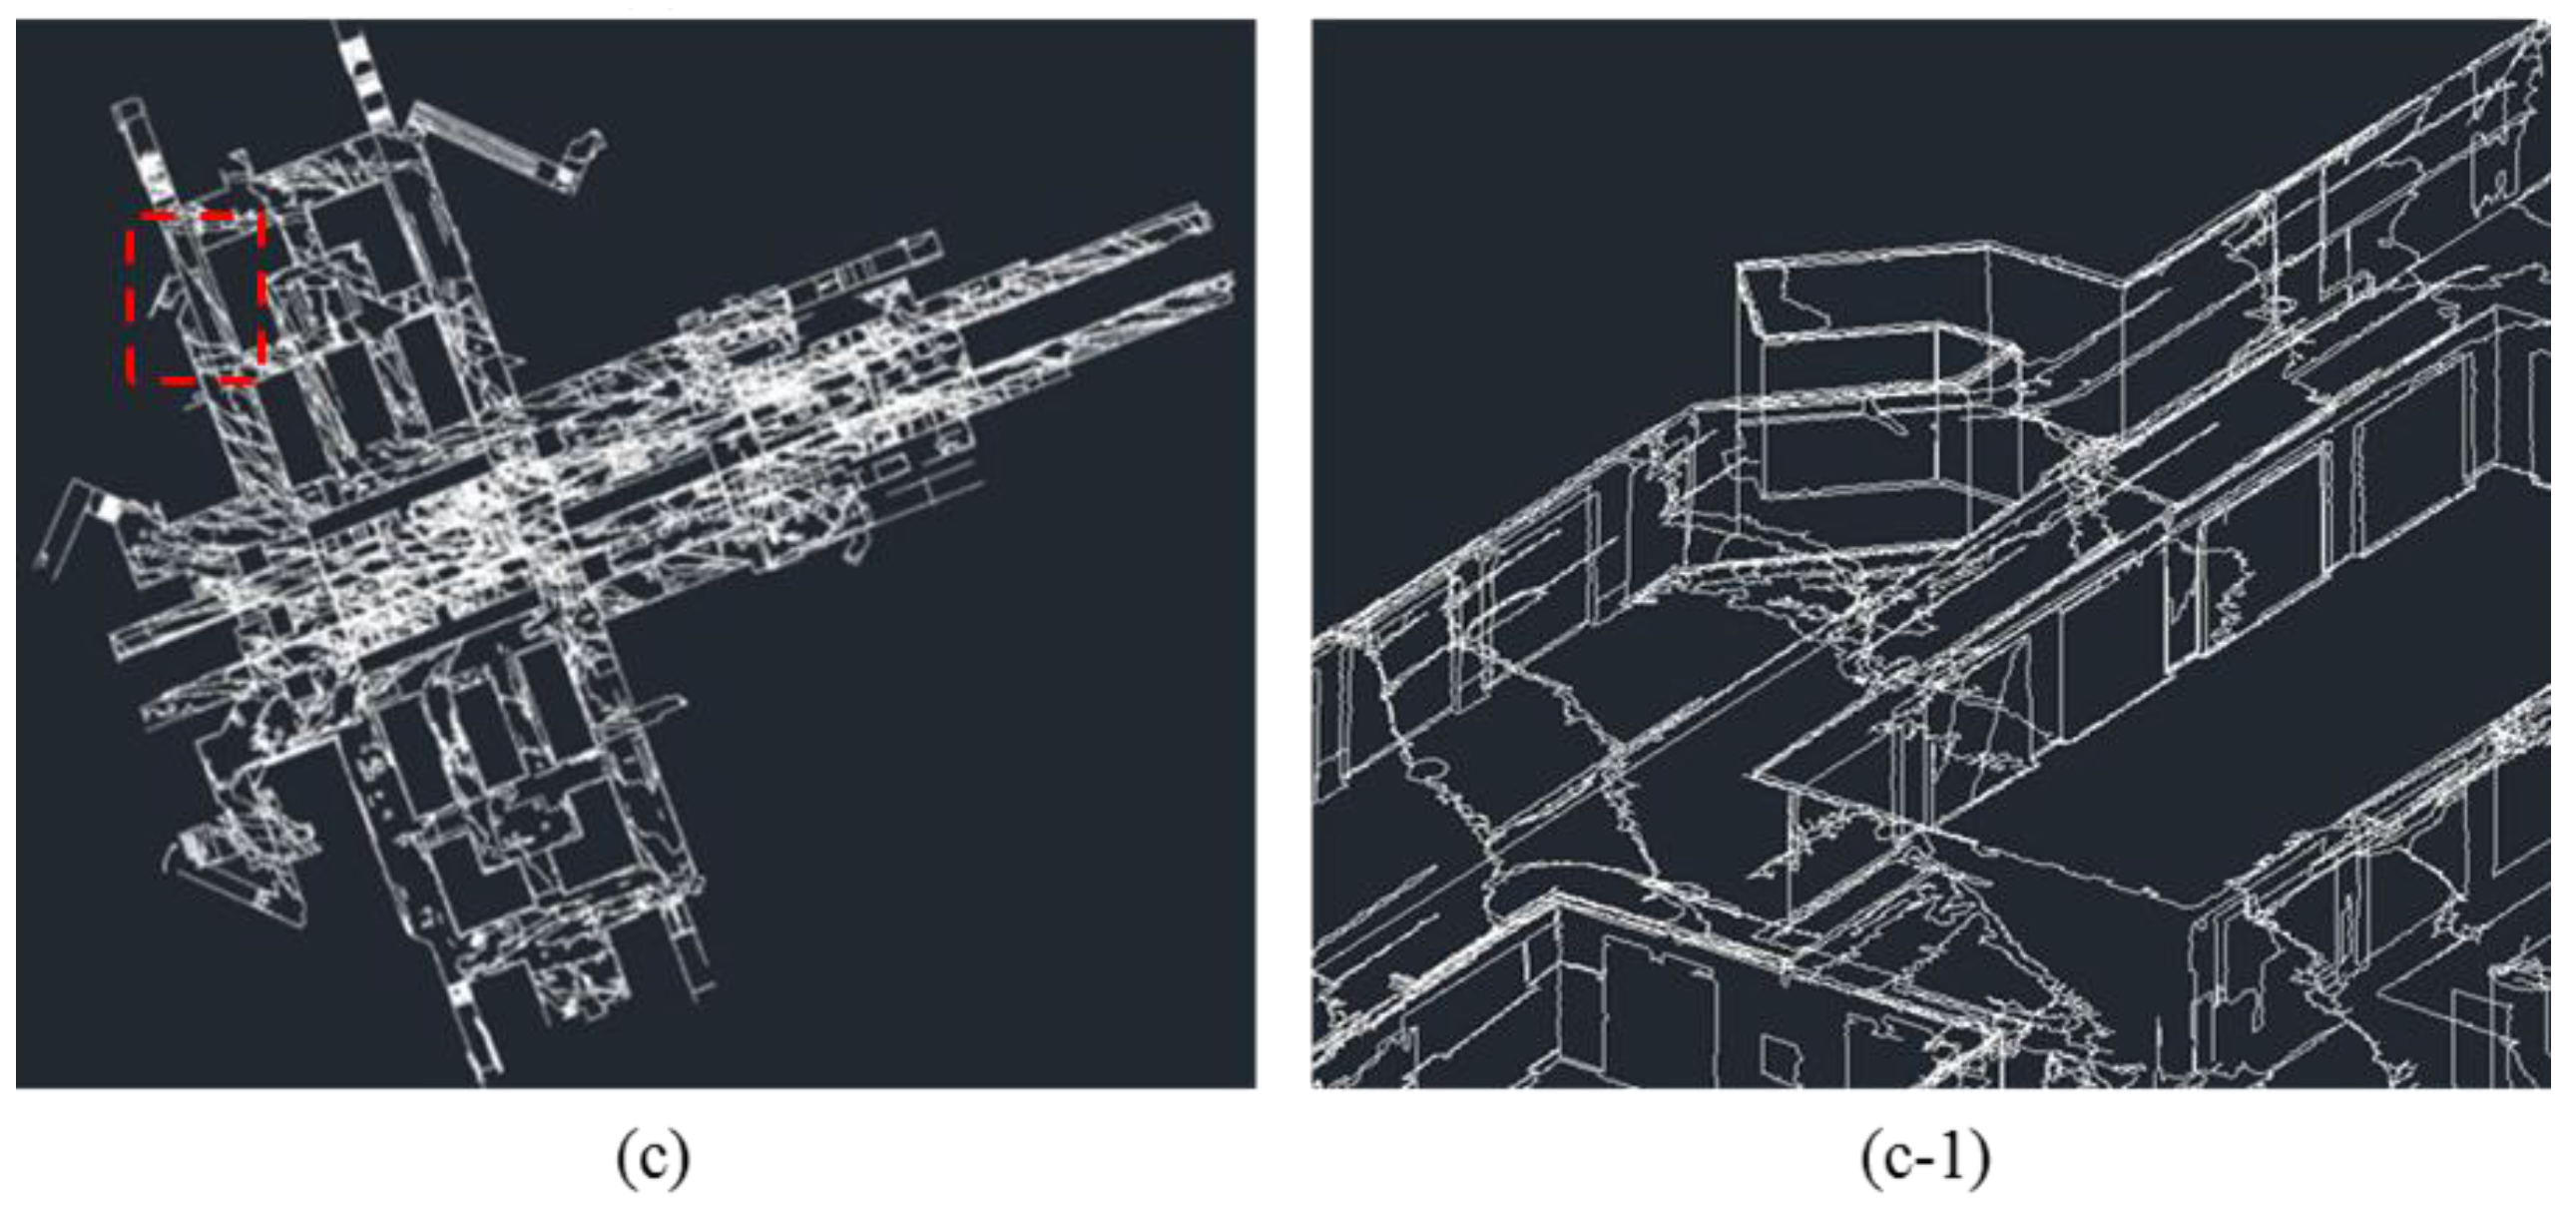
4.3. Implementation of As-Built BIM
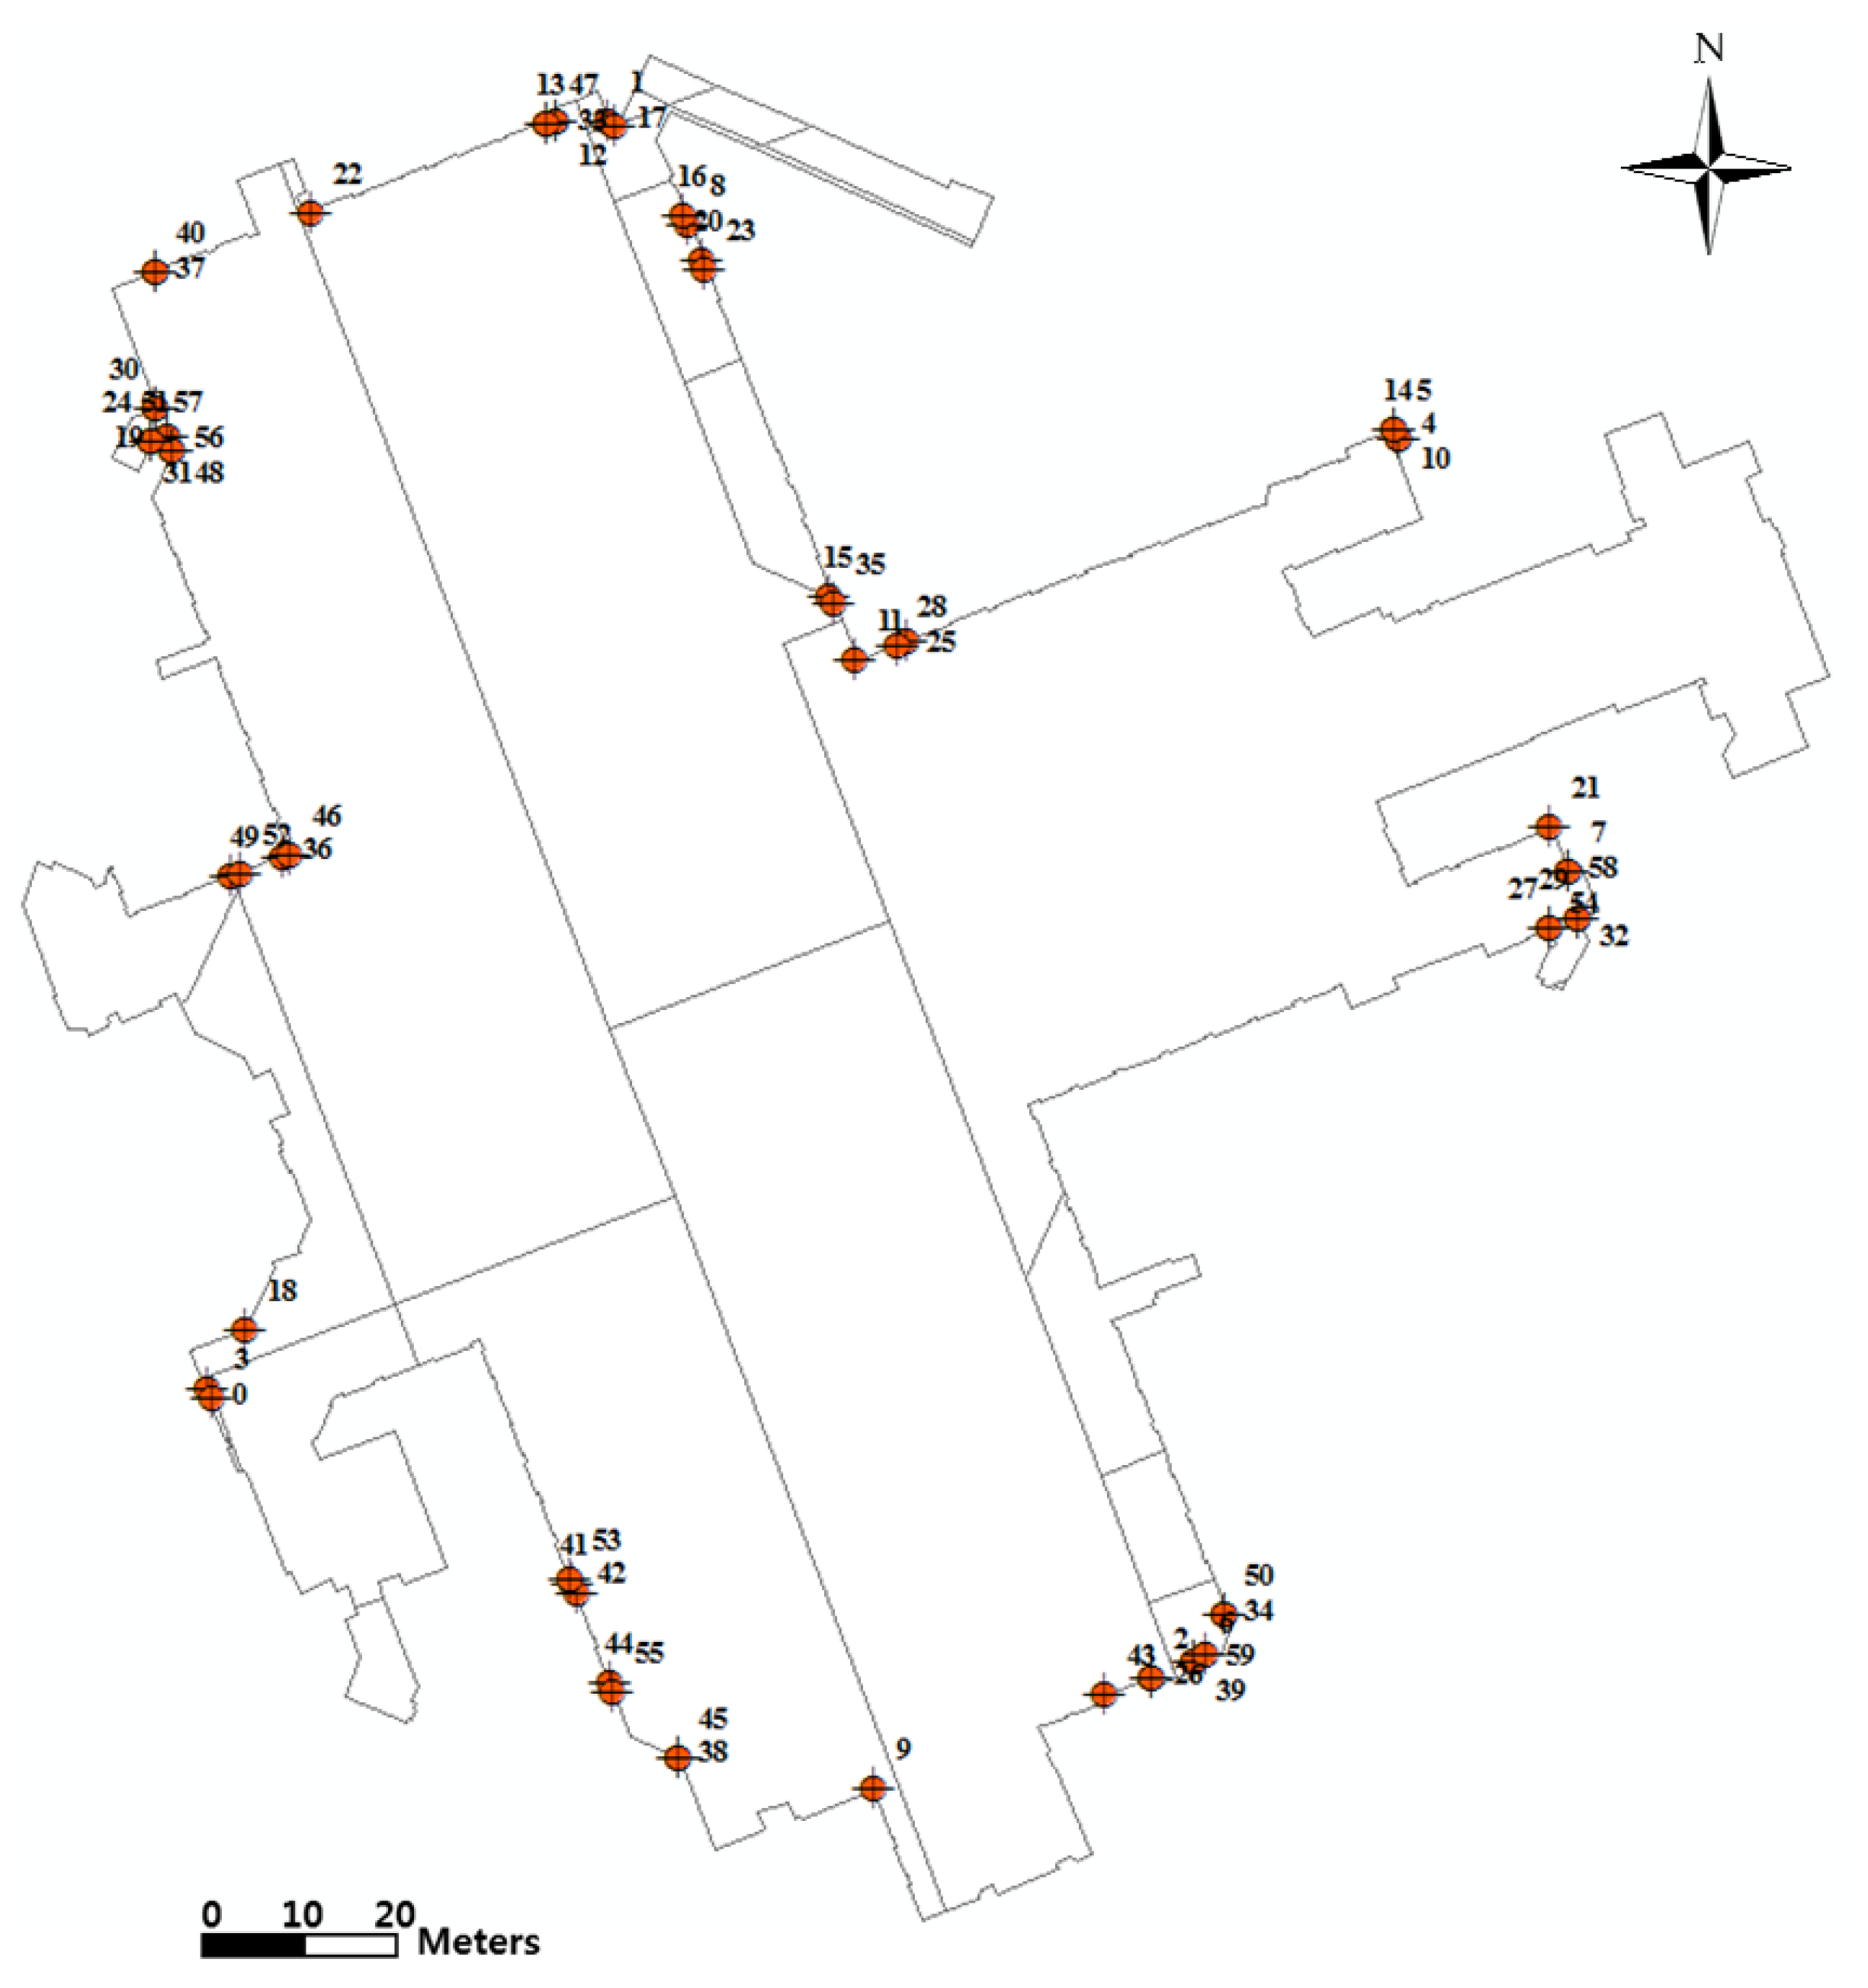
4.4. Accuracy Assessment of As-Built BIM Implementation


| Equipment | Specifications |
|---|---|
| Total Station | Model: GTS 9001 A, Topcon |
| 3D position accuracy: 3 mm at 50 m, 6 mm at 100 m | |
| Prism mode/linearity error: ±(2 mm + 2 ppm × D) | |
| Non-prism mode/linearity error: ±(5 mm) | |
| Electronic Digital/Barcode Level | Model: Leica DNA 03 |
| Accuracy of electronic measurement: 0.3 mm (invar staffs) | |
| Resolution height measurement: 0.01 mm | |
| Compensator-setting accuracy: 0.3″ | |
| Single measurement time: typically 3 seconds |


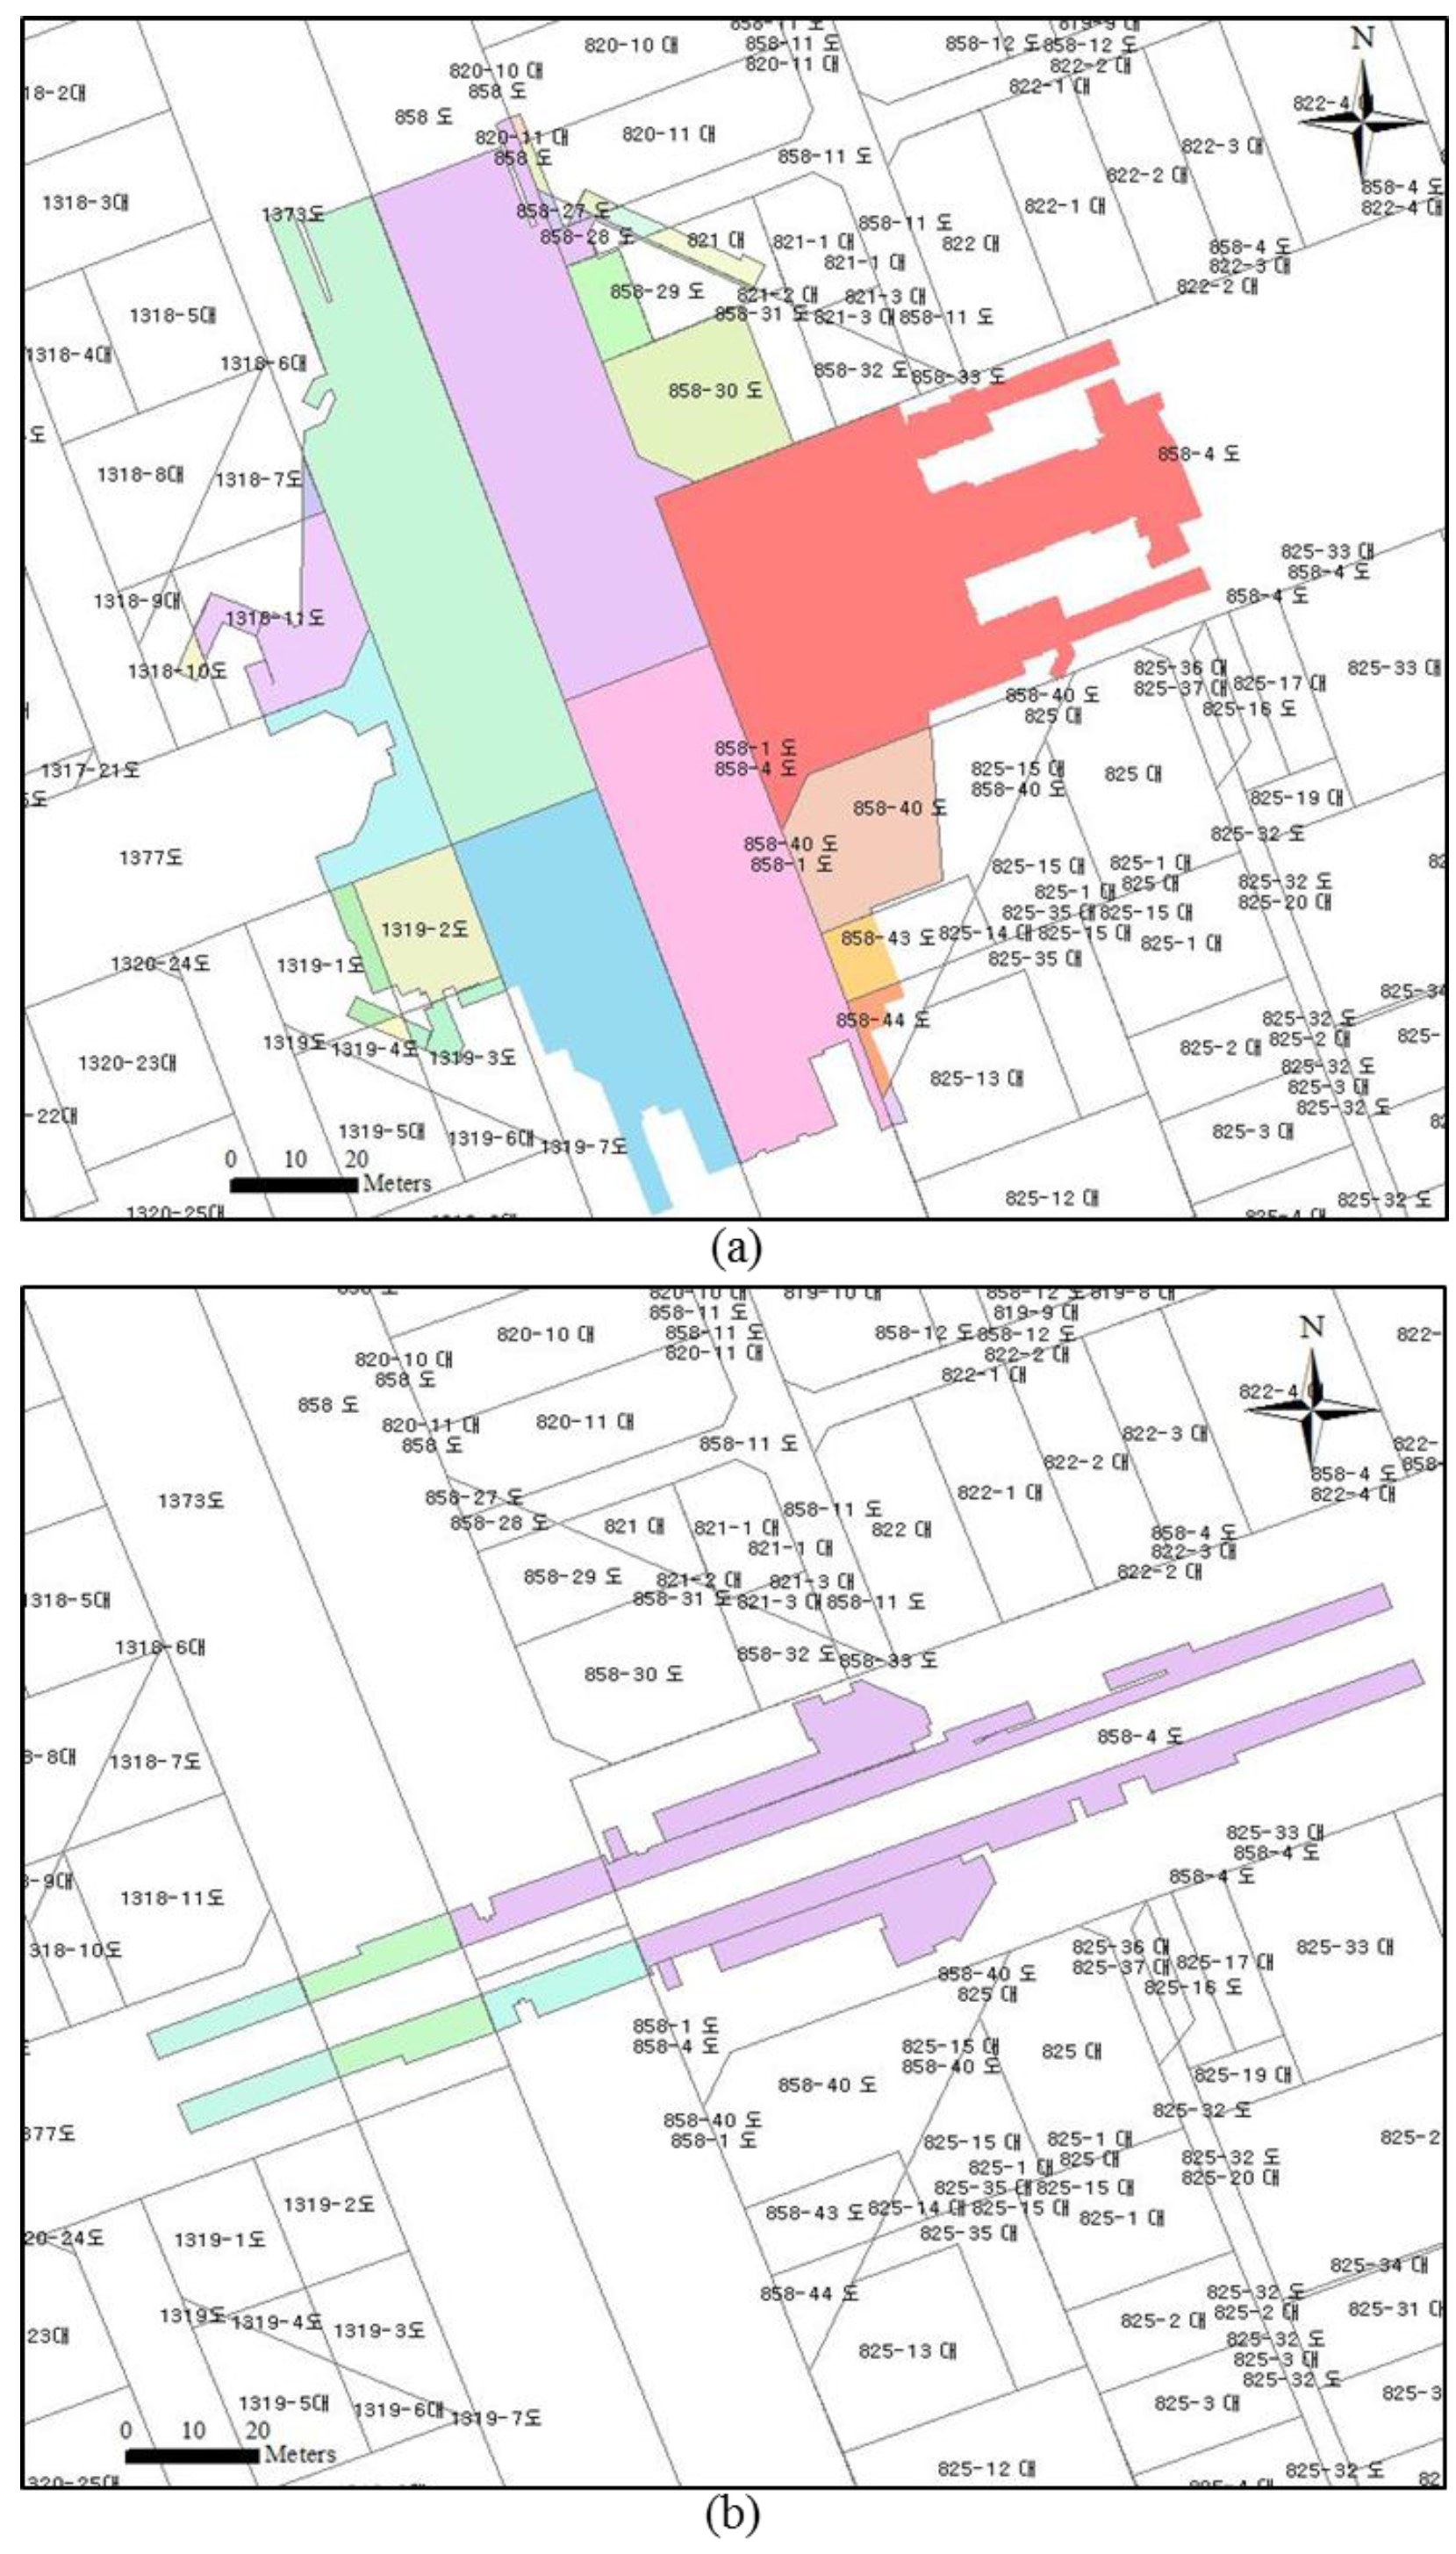
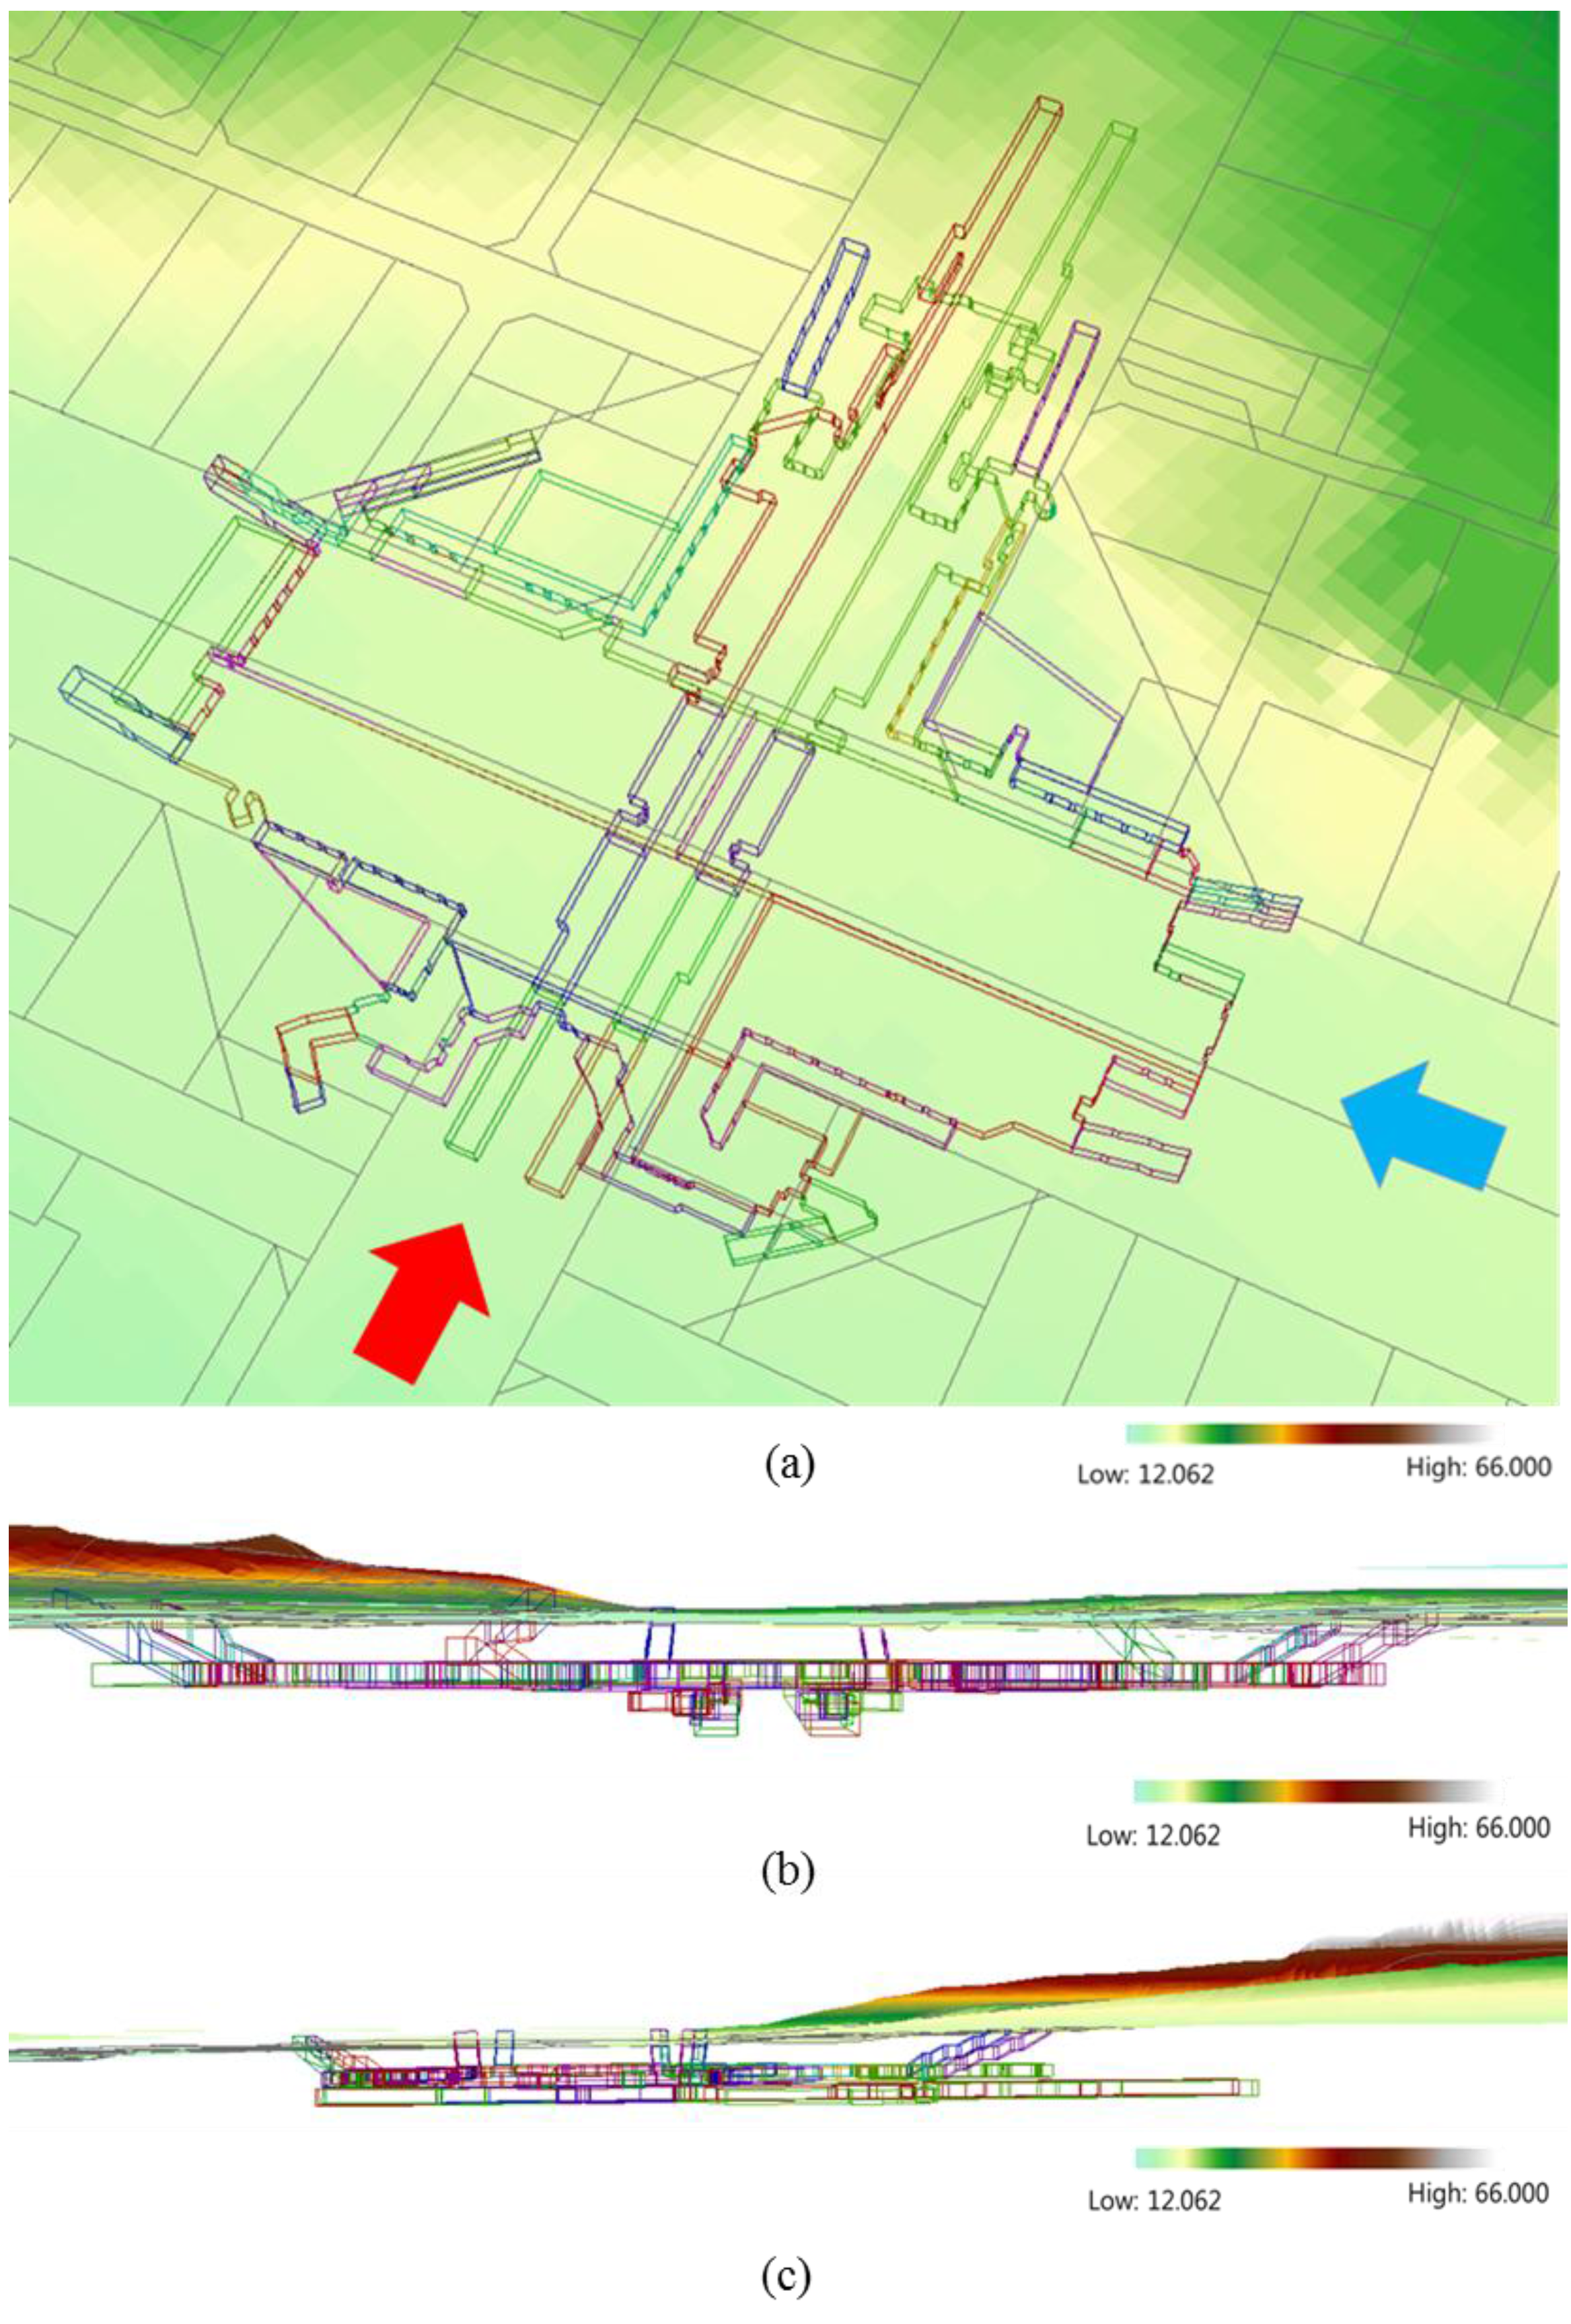
4.5. 3D Underground Cadastral Map
| Point ID | Error Vector | Error | Point ID | Error Vector | Error | ||||
|---|---|---|---|---|---|---|---|---|---|
| X | Y | Z | X | Y | Z | ||||
| 1 | 0.119 | −0.054 | 0.091 | 0.160 | 31 | −0.049 | −0.012 | −0.088 | 0.101 |
| 2 | 0.021 | 0.007 | 0.141 | 0.143 | 32 | −0.076 | −0.021 | −0.026 | 0.083 |
| 3 | −0.067 | −0.131 | −0.085 | 0.170 | 33 | −0.022 | 0.027 | 0.051 | 0.062 |
| 4 | 0.002 | 0.013 | −0.181 | 0.181 | 34 | −0.012 | 0.010 | 0.045 | 0.048 |
| 5 | 0.005 | 0.018 | −0.174 | 0.175 | 35 | 0.012 | −0.017 | 0.050 | 0.054 |
| 6 | −0.036 | 0.046 | 0.112 | 0.126 | 36 | −0.048 | 0.011 | −0.071 | 0.086 |
| 7 | 0.078 | 0.106 | −0.087 | 0.158 | 37 | 0.063 | −0.001 | 0.016 | 0.065 |
| 8 | −0.049 | 0.031 | 0.096 | 0.112 | 38 | −0.010 | −0.044 | 0.006 | 0.046 |
| 9 | −0.031 | 0.102 | 0.053 | 0.119 | 39 | −0.003 | 0.032 | 0.042 | 0.052 |
| 10 | 0.010 | 0.033 | −0.138 | 0.142 | 40 | 0.066 | 0.002 | −0.045 | 0.080 |
| 11 | 0.095 | −0.042 | 0.047 | 0.115 | 41 | −0.044 | 0.017 | −0.004 | 0.047 |
| 12 | −0.014 | 0.008 | 0.103 | 0.104 | 42 | −0.030 | −0.023 | 0.003 | 0.038 |
| 13 | −0.010 | −0.004 | 0.102 | 0.102 | 43 | 0.033 | 0.009 | 0.033 | 0.047 |
| 14 | 0.008 | 0.028 | −0.134 | 0.137 | 44 | −0.033 | 0.031 | −0.002 | 0.046 |
| 15 | 0.021 | −0.007 | 0.097 | 0.099 | 45 | −0.008 | −0.037 | −0.053 | 0.066 |
| 16 | 0.012 | −0.003 | 0.096 | 0.097 | 46 | −0.010 | 0.025 | −0.070 | 0.075 |
| 17 | −0.024 | 0.004 | 0.095 | 0.098 | 47 | −0.013 | 0.008 | 0.032 | 0.036 |
| 18 | 0.009 | −0.010 | −0.142 | 0.142 | 48 | 0.013 | −0.026 | −0.073 | 0.078 |
| 19 | −0.091 | 0.044 | −0.030 | 0.106 | 49 | −0.005 | 0.015 | −0.070 | 0.072 |
| 20 | −0.001 | −0.003 | 0.085 | 0.086 | 50 | −0.017 | −0.002 | −0.058 | 0.060 |
| 21 | 0.008 | −0.090 | −0.020 | 0.093 | 51 | 0.001 | −0.035 | −0.061 | 0.070 |
| 22 | 0.008 | −0.038 | 0.078 | 0.087 | 52 | 0.015 | 0.011 | −0.066 | 0.068 |
| 23 | −0.016 | 0.000 | 0.084 | 0.086 | 53 | 0.029 | −0.021 | −0.007 | 0.037 |
| 24 | 0.033 | 0.058 | −0.095 | 0.116 | 54 | −0.020 | −0.011 | 0.007 | 0.024 |
| 25 | 0.012 | −0.051 | 0.062 | 0.081 | 55 | −0.006 | 0.017 | −0.006 | 0.019 |
| 26 | 0.068 | −0.013 | 0.047 | 0.084 | 56 | 0.008 | −0.019 | 0.000 | 0.021 |
| 27 | −0.001 | 0.014 | −0.115 | 0.116 | 57 | 0.005 | −0.030 | −0.022 | 0.038 |
| 28 | 0.001 | −0.044 | 0.059 | 0.074 | 58 | 0.003 | 0.022 | −0.010 | 0.025 |
| 29 | −0.082 | −0.023 | −0.015 | 0.086 | 59 | 0.043 | 0.006 | 0.035 | 0.056 |
| 30 | 0.028 | 0.056 | 0.030 | 0.069 | 60 | −0.002 | 0.006 | 0.121 | 0.121 |
| Average Error | - | - | - | 0.086 | |||||
| RMSE | 0.039 | 0.038 | 0.078 | 0.095 | |||||
| SAS | - | - | - | 0.129 | |||||


| 2D Surface Parcel | 3D Underground Parcel | ||||||
|---|---|---|---|---|---|---|---|
| Parcel Number | Land Category | Underground Parcel Number | Utiliza-tion | Ownership | Right | Area (m2) | Volume (m3) |
| 858-4 | Road | 858-4-1 | US | SMG | FO | 3475.3 | 9035.8 |
| 858-40 | Road | 858-40-1 | US | SMG | FO | 610.2 | 1586.4 |
| 858-43 | Road | 858-43-1 | US | SMG | FO | 116.4 | 302.7 |
| 858-44 | Road | 858-44-1 | US | SMG | FO | 82.7 | 215.1 |
| 825-13 | Building site | 825-13-1 | US (Exit) | Private land | SS | 21.9 | 56.9 |
| 858-1 | Road | 858-1-1 | US | SMG | FO | 1956.2 | 5086.1 |
| 1374 | Road | 1374-0-1 | US | SMG | FO | 1380.5 | 3589.2 |
| 1319-3 | Road | 1319-3-1 | US | SMG | FO | 107.1 | 278.5 |
| 1319-4 | Road | 1319-4-1 | US | SMG | FO | 23.2 | 60.3 |
| 1319-1 | Road | 1319-1-1 | US | SMG | FO | 119.3 | 310.3 |
| 1319-2 | Road | 1319-2-1 | US | SMG | FO | 377.4 | 981.1 |
| 1377 | Road | 1377-0-1 | US | SMG | FO | 430.7 | 1119.8 |
| 1318-10 | Road | 1318-10-1 | US | SMG | FO | 33.9 | 88.0 |
| 1318-11 | Road | 1318-11-1 | US | SMG | FO | 442.9 | 1151.5 |
| 1318-7 | Road | 1318-7-1 | US | SMG | FO | 29.1 | 75.6 |
| 1373 | Road | 1373-0-1 | US | SMG | FO | 2377.6 | 6181.8 |
| 858 | Road | 858-0-1 | US | SMG | FO | 2220.2 | 5772.5 |
| 820-10 | Building site | 820-10-1 | US (Exit) | Private land | SS | 15.0 | 39.0 |
| 820-11 | Building site | 820-11-1 | US (Exit) | Private land | SS | 51.7 | 134.4 |
| 858-11 | Road | 858-11-1 | US | SMG | FO | 34.8 | 90.4 |
| 821 | Building site | 821-0-1 | US (Exit) | Private land | SS | 80.4 | 208.9 |
| 858-29 | Road | 858-29-1 | US | SMG | FO | 200.5 | 521.4 |
| 858-30 | Road | 858-30-1 | US | SMG | FO | 565.5 | 1470.3 |
| 858-28 | Road | 858-28-1 | US | SMG | FO | 51.8 | 134.6 |
| 858-32 | Road | 858-32-1 | US | SMG | FO | 10.6 | 27.5 |
| 858-27 | Road | 858-27-1 | US | SMG | FO | 24.1 | 62.6 |
| 1373 | Road | 1373-0-2 | SP | SMG | FO | 382.4 | 1567.9 |
| 1377 | Road | 1377-0-2 | SP | SMG | FO | 348.8 | 1429.9 |
| 858 | Road | 858-0-2 | SP | SMG | FO | 198.0 | 811.6 |
| 858-1 | Road | 858-1-2 | SP | SMG | FO | 205.7 | 843.3 |
| 858-4 | Road | 858-4-2 | SP | SMG | FO | 2544.9 | 10434.2 |

5. Conclusions
Acknowledgments
Author Contributions
Conflicts of Interest
References
- FIG, F. Statement on the cadastre. Int. Fed. Surv. 1995, 2, 22–27. [Google Scholar]
- Stoter, J.; Ploeger, H.; van Oosterom, P. 3D cadastre in the netherlands: Developments and international applicability. Comput. Environ. Urb. Syst. 2013, 40, 56–67. [Google Scholar] [CrossRef]
- Pouliot, J.; Vasseur, M.; Boubehrezh, A. How the ISO 19152 land administration domain model performs in the comparison of cadastral systems: A case study of condominium/co-ownership in quebec (Canada) and alsace moselle (France). Comput. Environ. Urb. Syst. 2013, 40, 68–78. [Google Scholar] [CrossRef]
- Paasch, J.; Paulsson, J. Terminological aspects on three-dimensional real property. Nord. J. Surv. Real Estate Res. 2012, 8, 81–97. [Google Scholar]
- Van Oosterom, P.; Stoter, J.; Ploeger, H.; Thompson, R.; Karki, S. World-Wide Inventory of the Status of 3D Cadastres in 2010 and Expectations for 2014. In Proceedings of the FIG Working Week 2011 Bridging the Gap between Cultures & 6th National Congress of ONIGT, Marrakech, Morocco, 18–22 May 2011; pp. 1–21.
- SIRI. A Study on 3D Cadastre for International Standardization; Spatial Information Research Institute: Seoul, Korea, 2014; pp. 1–123. [Google Scholar]
- MLTMA. A Study on the Compensation of Above and Below Land; Ministry of Land Transport and Maritime Affairs: Gyeonggi-do, Korea, 2012; pp. 1–237. [Google Scholar]
- Ji-Sun, S.; Keun-Chul, A.; Myeong-Hun, L. A study on the issue of legal right in utilizing underground space—focusing on the problem of the use of land and compensation. J. Korea Plan. Assoc. 2012, 47, 101–111. [Google Scholar]
- Jeon, B.J.; Lee, C.Y.; Park, Y.G.; Kim, K.H. A plan for registration underground space for 3D cadastre. J. Korea Plan. Assoc. 2012, 14, 79–94. [Google Scholar]
- Kim, Y.; Lee, S. A study on improving cadastre system and cadastre-related laws for introducing 3D cadastre. Korea Spat. Plan. Rev. 2006, 9, 147–162. [Google Scholar]
- Patraucean, V.; Armeni, I.; Nahangi, M.; Yeung, J.; Brilakis, I.; Haas, C. State of research in automatic as-built modelling. Adv. Eng. Inform. 2015, 29, 162–171. [Google Scholar] [CrossRef]
- Volk, R.; Stengel, J.; Schultmann, F. Building information modeling (BIM) for existing buildings—Literature review and future needs. Autom. Constr. 2014, 38, 109–127. [Google Scholar] [CrossRef]
- Bhatla, A.; Choe, S.Y.; Fierro, O.; Leite, F. Evaluation of accuracy of as-built 3D modeling from photos taken by handheld digital cameras. Autom. Constr. 2012, 28, 116–127. [Google Scholar] [CrossRef]
- Jung, J.; Hong, S.; Jeong, S.; Kim, S.; Cho, H.; Hong, S.; Heo, J. Productive modeling for development of as-built bim of existing indoor structures. Autom. Constr. 2014, 42, 68–77. [Google Scholar] [CrossRef]
- Heo, J.; Jeong, S.; Park, H.-K.; Jung, J.; Han, S.; Hong, S.; Sohn, H.-G. Productive high-complexity 3D city modeling with point clouds collected from terrestrial lidar. Comput. Environ. Urb. Syst. 2013, 41, 26–38. [Google Scholar] [CrossRef]
- Stoter, J.E.; van Oosterom, P. 3D Cadastre in an International Context: Legal, Organizational, and Technological Aspects; Crc Press: Boca Raton, FL, USA, 2006. [Google Scholar]
- Aien, A.; Kalantari, M.; Rajabifard, A.; Williamson, I.; Wallace, J. Towards integration of 3D legal and physical objects in cadastral data models. Land Use Policy 2013, 35, 140–154. [Google Scholar] [CrossRef]
- Jazayeri, I.; Rajabifard, A.; Kalantari, M. A geometric and semantic evaluation of 3D data sourcing methods for land and property information. Land Use Policy 2014, 36, 219–230. [Google Scholar] [CrossRef]
- Overby, J.; Bodum, L.; Kjems, E.; Iisoe, P. Automatic 3D building reconstruction from airborne laser scanning and cadastral data using hough transform. Int. Arch. Photogramm. Remote Sens. Spat. Inform. Sci. 2004, 34, 296–301. [Google Scholar]
- Majdik, A.L.; Verda, D.; Albers-Schoenberg, Y.; Scaramuzza, D. Micro Air Vehicle Localization and Position Tracking from Textured 3D Cadastral Models. In Proceedings of the Robotics and Automation (ICRA), 2014 IEEE International Conference, Hong Kong, China, 31 May–7 June 2014; pp. 920–927.
- Suveg, I.; Vosselman, G. 3D reconstruction of building models. Int. Arch. Photogramm. Remote Sens. Spat. Inform. Sci. 2000, 33, 538–545. [Google Scholar]
- Xiong, X.; Adan, A.; Akinci, B.; Huber, D. Automatic creation of semantically rich 3D building models from laser scanner data. Autom. Constr. 2013, 31, 325–337. [Google Scholar] [CrossRef]
- Liang, X.; Litkey, P.; Hyyppä, J.; Kaartinen, H.; Vastaranta, M.; Holopainen, M. Automatic stem mapping using single-scan terrestrial laser scanning. IEEE Trans. Geosci. Remote Sens. 2012, 50, 661–670. [Google Scholar] [CrossRef]
- Pfeifer, N.; Briese, C. Geometrical aspects of airborne laser scanning and terrestrial laser scanning. Int. Arch. Photogramm. Remote Sens. Spat. Inform. Sci. 2007, 36, 311–319. [Google Scholar]
- Arayici, Y. An approach for real world data modelling with the 3D terrestrial laser scanner for built environment. Autom. Constr. 2007, 16, 816–829. [Google Scholar] [CrossRef]
- Alba, M.I.; Barazzetti, L.; Scaioni, M.; Rosina, E.; Previtali, M. Mapping infrared data on terrestrial laser scanning 3D models of buildings. Remote Sens. 2011, 3, 1847–1870. [Google Scholar] [CrossRef]
- Hong, S.; Jung, J.; Kim, S.; Cho, H.; Lee, J.; Heo, J. Semi-automated approach to indoor mapping for 3D as-built building information modeling. Comput. Environ. Urb. Syst. 2015, 51, 34–46. [Google Scholar] [CrossRef]
- Haala, N.; Anders, K.-H. In acquisition of 3D urban models by analysis of aerial images, digital surface models, and existing 2D building information. Int. Soc. Opt. Photonics 1997, 3072, 212–222. [Google Scholar]
- Taneja, A.; Ballan, L.; Pollefeys, M. Registration of spherical panoramic images with cadastral 3D models. In Proceedings of the IEEE 2012 Second International Conference on 3D Imaging, Modeling, Processing, Visualization and Transmission (3DIMPVT), Yichang, China, 21–23 April 2012; pp. 479–486.
- Taneja, A.; Ballan, L.; Pollefeys, M. City-scale change detection in cadastral 3D models using images. In Proceedings of the 2013 IEEE Conference on Computer Vision and Pattern Recognition (CVPR), Portland, OR, USA, 23–28 June 2013; pp. 113–120.
- Hammoudi, K.; Dornaika, F. A featureless approach to 3D polyhedral building modeling from aerial images. Sensors 2010, 11, 228–259. [Google Scholar] [CrossRef] [PubMed]
- Baillard, C.; Zisserman, A. A plane-sweep strategy for the 3D reconstruction of buildings from multiple images. Int. Arch. Photogramm. Remote Sens. 2000, 33, 56–62. [Google Scholar]
- Baillard, C.; Schmid, C.; Zisserman, A.; Fitzgibbon, A. Automatic line matching and 3D reconstruction of buildings from multiple views. In Proceedings of the ISPRS Conference on Automatic Extraction of GIS Objects from Digital Imagery, Munich, Germany, 8–10 September 1999; pp. 69–80.
- Sahin, C.; Alkis, A.; Ergun, B.; Kulur, S.; Batuk, F.; Kilic, A. Producing 3D city model with the combined photogrammetric and laser scanner data in the example of taksim cumhuriyet square. Opt. Lasers Eng. 2012, 50, 1844–1853. [Google Scholar] [CrossRef]
- Chen, L.-C.; Teo, T.-A.; Hsieh, C.-H.; Rau, J.-Y. Reconstruction of building models with curvilinear boundaries from laser scanner and aerial imagery. In Advances in Image and Video Technology; Springer: Berlin, Germany, 2006; pp. 24–33. [Google Scholar]
- Hongjian, Y.; Shiqiang, Z. 3D building reconstruction from aerial CCD image and sparse laser sample data. Opt. Lasers Eng. 2006, 44, 555–566. [Google Scholar] [CrossRef]
- Matikainen, L.; Kaartinen, H.; Hyyppä, J. Classification tree based building detection from laser scanner and aerial image data. Int. Arch. Photogramm. Remote Sens. Spat. Inform. Sci. 2007, 36, 280–287. [Google Scholar]
- Cheng, L.; Gong, J.; Li, M.; Liu, Y. 3D building model reconstruction from multi-view aerial imagery and lidar data. Photogramm. Eng. Remote Sens. 2011, 77, 125–139. [Google Scholar] [CrossRef]
- Hammoudi, K.; Dornaika, F.; Soheilian, B.; Paparoditis, N. Extracting wire-frame models of street facades from 3D point clouds and the corresponding cadastral map. Remote Sens. Spat. Inform. Sci. 2010, 38, 91–96. [Google Scholar]
- Pu, S.; Vosselman, G. Building facade reconstruction by fusing terrestrial laser points and images. Sensors 2009, 9, 4525–4542. [Google Scholar] [PubMed]
- Krauß, T.; Lehner, M.; Reinartz, P. Generation of coarse 3D models of urban areas from high resolution stereo satellite images. In Proceedings of the ISPRS Congress 2008, Beijing, China, 3–11 June 2008; pp. 1091–1098.
- Eastman, C.; Eastman, C.M.; Teicholz, P.; Sacks, R. Bim Handbook: A Guide to Building Information Modeling for Owners, Managers, Designers, Engineers and Contractors; John Wiley & SonsHobke: Hoboken, NJ, USA, 2011. [Google Scholar]
- Anil, E.B.; Tang, P.; Akinci, B.; Huber, D. Assessment of the Quality of As-Is Building Information Models Generated From Point Clouds Using Deviation Analysis; International Society for Optics and Photonics: Bellingham, WA, USA, 2011; pp. 78613–78640. [Google Scholar]
- GSA, U. Gsa Bim Guide for 3D Imaging; US General Services Administration: Washington, DC, USA, 2009.
- Klein, L.; Li, N.; Becerik-Gerber, B. Imaged-based verification of as-built documentation of operational buildings. Autom. Constr. 2012, 21, 161–171. [Google Scholar] [CrossRef]
- El-Hakim, S.F.; Gruen, A. Videometrics and Optical Methods For 3D Shape Measurement; SPIE: Bellingham, WA, USA, 2001. [Google Scholar]
- Jaselskis, E.J.; Gao, Z.; Walters, R.C. Improving transportation projects using laser scanning. J. Constr. Eng. Manag. 2005, 131, 377–384. [Google Scholar] [CrossRef]
- Tang, P.; Akinci, B.; Huber, D. Quantification of edge loss of laser scanned data at spatial discontinuities. Autom. Constr. 2009, 18, 1070–1083. [Google Scholar] [CrossRef]
- Tang, P.; Huber, D.; Akinci, B.; Lipman, R.; Lytle, A. Automatic reconstruction of as-built building information models from laser-scanned point clouds: A review of related techniques. Autom. Constr. 2010, 19, 829–843. [Google Scholar] [CrossRef]
- Golparvar-Fard, M.; Bohn, J.; Teizer, J.; Savarese, S.; Peña-Mora, F. Evaluation of image-based modeling and laser scanning accuracy for emerging automated performance monitoring techniques. Autom. Constr. 2011, 20, 1143–1155. [Google Scholar] [CrossRef]
- Remondino, F.; Guarnieri, A.; Vettore, A. 3D modeling of Close-Range Objects: Photogrammetry or Laser Scanning. Int. Soc. Opt. Photonics 2005, 5665, 216–225. [Google Scholar]
- Martínez, J.; Soria-Medina, A.; Arias, P.; Buffara-Antunes, A.F. Automatic processing of terrestrial laser scanning data of building facades. Autom. Constr. 2012, 22, 298–305. [Google Scholar] [CrossRef]
- Boulaassal, H.; Landes, T.; Grussenmeyer, P.; Tarsha-Kurdi, F. Automatic Segmentation of Building Facades Using Terrestrial Laser Data; ISPRS: Espoo, Finland, 2007; pp. 65–70. [Google Scholar]
- Fischler, M.A.; Bolles, R.C. Random sample consensus: A paradigm for model fitting with applications to image analysis and automated cartography. Commun. ACM 1981, 24, 381–395. [Google Scholar] [CrossRef]
- Vosselman, G.; Dijkman, S. 3D building model reconstruction from point clouds and ground plans. Int. Arch. Photogramm. Remote Sens. Spat. Inform. Sci. 2001, 34, 37–44. [Google Scholar]
- Liu, Y.; Xiong, Y. Automatic segmentation of unorganized noisy point clouds based on the gaussian map. Comput. Aided Des. 2008, 40, 576–594. [Google Scholar] [CrossRef]
- Thrun, S.; Martin, C.; Liu, Y.; Hähnel, D.; Emery-Montemerlo, R.; Chakrabarti, D.; Burgard, W. A real-time expectation-maximization algorithm for acquiring multiplanar maps of indoor environments with mobile robots. IEEE Trans. Robot. Autom. 2004, 20, 433–443. [Google Scholar] [CrossRef]
- Schuster, H.-F. Segmentation of lidar data using the tensor voting framework. Int. Arch. Photogramm. Remote Sens. Spat. Inform. Sci. 2004, 35, 1073–1078. [Google Scholar]
- Rabbani, T.; van den Heuvel, F.; Vosselmann, G. Segmentation of point clouds using smoothness constraint. Int. Arch. Photogramm. Remote Sens. Spat. Inform. Sci. 2006, 36, 248–253. [Google Scholar]
- Rusu, R.B.; Cousins, S. 3D is here: Point cloud library (PCL). In Proceedings of the 2011 IEEE International Conference on Robotics and Automation (ICRA), Shanghai, China, 9–13 May 2011; pp. 1–4.
- Schnabel, R.; Wahl, R.; Klein, R. Efficient Ransac for Point-Cloud Shape Detection, Computer Graphics Forum; Wiley Online Library: Hoboken, NJ, USA, 2007; pp. 214–226. [Google Scholar]
- Douillard, B.; Underwood, J.; Kuntz, N.; Vlaskine, V.; Quadros, A.; Morton, P.; Frenkel, A. On the segmentation of 3D lidar point clouds. In Proceedings of the 2011 IEEE International Conference on Robotics and Automation (ICRA), Shanghai, China, 9–13 May 2011; pp. 2798–2805.
- Motameni, H.; Norouzi, M.; Jahandar, M.; Hatami, A. Labeling Method in Steganography. Proc. World Acad. Sci. Eng. Technol. 2007, 24, 349–354. [Google Scholar]
- Autodesk Revit 2014. Available online: http://www.autodesk.com (accessed on 10 May 2015).
- Falzon, K.; Williamson, I. Digital lodgement of cadastral survey data in australia-issues and options. Aust. Surv. 2001, 46, 62–71. [Google Scholar]
- Guo, R.; Li, L.; Ying, S.; Luo, P.; He, B.; Jiang, R. Developing a 3D cadastre for the administration of urban land use: A case study of shenzhen, china. Comput. Environ. Urb. Syst. 2013, 40, 46–55. [Google Scholar] [CrossRef]
- Shojaei, D.; Kalantari, M.; Bishop, I.D.; Rajabifard, A.; Aien, A. Visualization requirements for 3D cadastral systems. Comput. Environ. Urb. Syst. 2013, 41, 39–54. [Google Scholar] [CrossRef]
- Karki, S.; Thompson, R.; McDougall, K. Development of validation rules to support digital lodgement of 3D cadastral plans. Comput. Environ. Urb. Syst. 2013, 40, 34–45. [Google Scholar] [CrossRef]
- Van Oosterom, P.; Stoter, J.; Ploeger, H.; Lemmen, C.; Thompson, R.; Karki, S. Initial analysis of the second FIG 3D cadastres questionnaire: Status in 2014 and expectations for 2018. In Proceedings of the 4th International FIG 3D Cadastre Workshop, Dubai, United Arab Emirates, 9–11 November 2014.
- Jazayeri, I. Trends in 3D land information collection and management. A Natl. Infrastruct. Manag. Land Inform. 2012, 3, 81–87. [Google Scholar]
- Ying, S.; Guo, R.; Li, L.; He, B. Application of 3D Gis to 3D Cadastre in Urban Environment; Developments and Practices: Shenzhen, China, 2012; pp. 25–26. [Google Scholar]
- Elberink, S.O.; Vosselman, G. 3D modelling of topographic objects by fusing 2D maps and lidar data. In Proceedings of the ISPRS TC-IV Intl Symp on Geospatial Databases for Sustainable Development, Goa, India, 17–30 September 2006; pp. 199–204.
- Flamanc, D.; Maillet, G.; Jibrini, H. 3D city models: An operational approach using aerial images and cadastral maps. Int. Arch. Photogramm. Remote Sens. Spat. Inform. Sci. 2003, 34, 53–58. [Google Scholar]
- Stoter, J.E.; Van Oosterom, P. Technological aspects of a full 3D cadastral registration. Int. Arch. Photogramm. Remote Sens. Spat. Inform. Sci. 2005, 19, 669–696. [Google Scholar] [CrossRef]
- Vandysheva, N.; Ivanov, A.; Pakhomov, S.; Spiering, B.; Stoter, J.; Zlatanova, S.; Van Oosterom, P. Design of the 3D cadastre model and development of the prototype in the russian federation. In Proceedings of the 2nd International Workshop on 3D Cadastres, Delft, The Netherlands, 16–18 November 2011.
- Urban Planning Information System. Available online: http://www.upis.go.kr (accessed on 11 July 2015).
- Land Use Regulations Information System. Available online: http://luris.mltm.go.kr (accessed on 11 July 2015).
- Seoul Metro. Records of transportation in 2014, 2015. Available online: http://www.seoulmetro.co.kr/ (accessed on 25 May 2015).
- Reit, B. The 7-parameter transformation to a horizontal geodetic datum. Surv. Rev. 1998, 34, 400–404. [Google Scholar] [CrossRef]
- Hong Sung, E. Comparing efficiency of numerical cadastral surveying using total station and RTK-GPS. J. Korean Soc. Geo. Spat. Inform. Syst. 2007, 15, 87–96. [Google Scholar]
- Greenwalt, C.R.; Shultz, M.E. Principles of Error Theory and Cartographic Applications; DTIC Document: Fort Belvoir, VA, USA, 1962. [Google Scholar]
- Lee, H. Revision of 1/1000 digital map for application of 3 Dimensional Geospatial Data. J. Korean Soc. Surv. Geo. Photogramm. Cartogr. 2014, 32, 77–86. [Google Scholar] [CrossRef]
- IPMS. International Property Measurement Standards: Office Buildings; International Property Measurement Standards Coalition (IPMSC): London, UK, 2014. [Google Scholar]
© 2015 by the authors; licensee MDPI, Basel, Switzerland. This article is an open access article distributed under the terms and conditions of the Creative Commons by Attribution (CC-BY) license (http://creativecommons.org/licenses/by/4.0/).
Share and Cite
Kim, S.; Kim, J.; Jung, J.; Heo, J. Development of a 3D Underground Cadastral System with Indoor Mapping for As-Built BIM: The Case Study of Gangnam Subway Station in Korea. Sensors 2015, 15, 30870-30893. https://0-doi-org.brum.beds.ac.uk/10.3390/s151229833
Kim S, Kim J, Jung J, Heo J. Development of a 3D Underground Cadastral System with Indoor Mapping for As-Built BIM: The Case Study of Gangnam Subway Station in Korea. Sensors. 2015; 15(12):30870-30893. https://0-doi-org.brum.beds.ac.uk/10.3390/s151229833
Chicago/Turabian StyleKim, Sangmin, Jeonghyun Kim, Jaehoon Jung, and Joon Heo. 2015. "Development of a 3D Underground Cadastral System with Indoor Mapping for As-Built BIM: The Case Study of Gangnam Subway Station in Korea" Sensors 15, no. 12: 30870-30893. https://0-doi-org.brum.beds.ac.uk/10.3390/s151229833