An Expert System for Quantification of Bradykinesia Based on Wearable Inertial Sensors


Abstract
:1. Introduction
2. Materials and Methods
2.1. Measurement System
2.2. Subjects
2.3. Measurement Methodology
2.4. Scoring by Neurologists
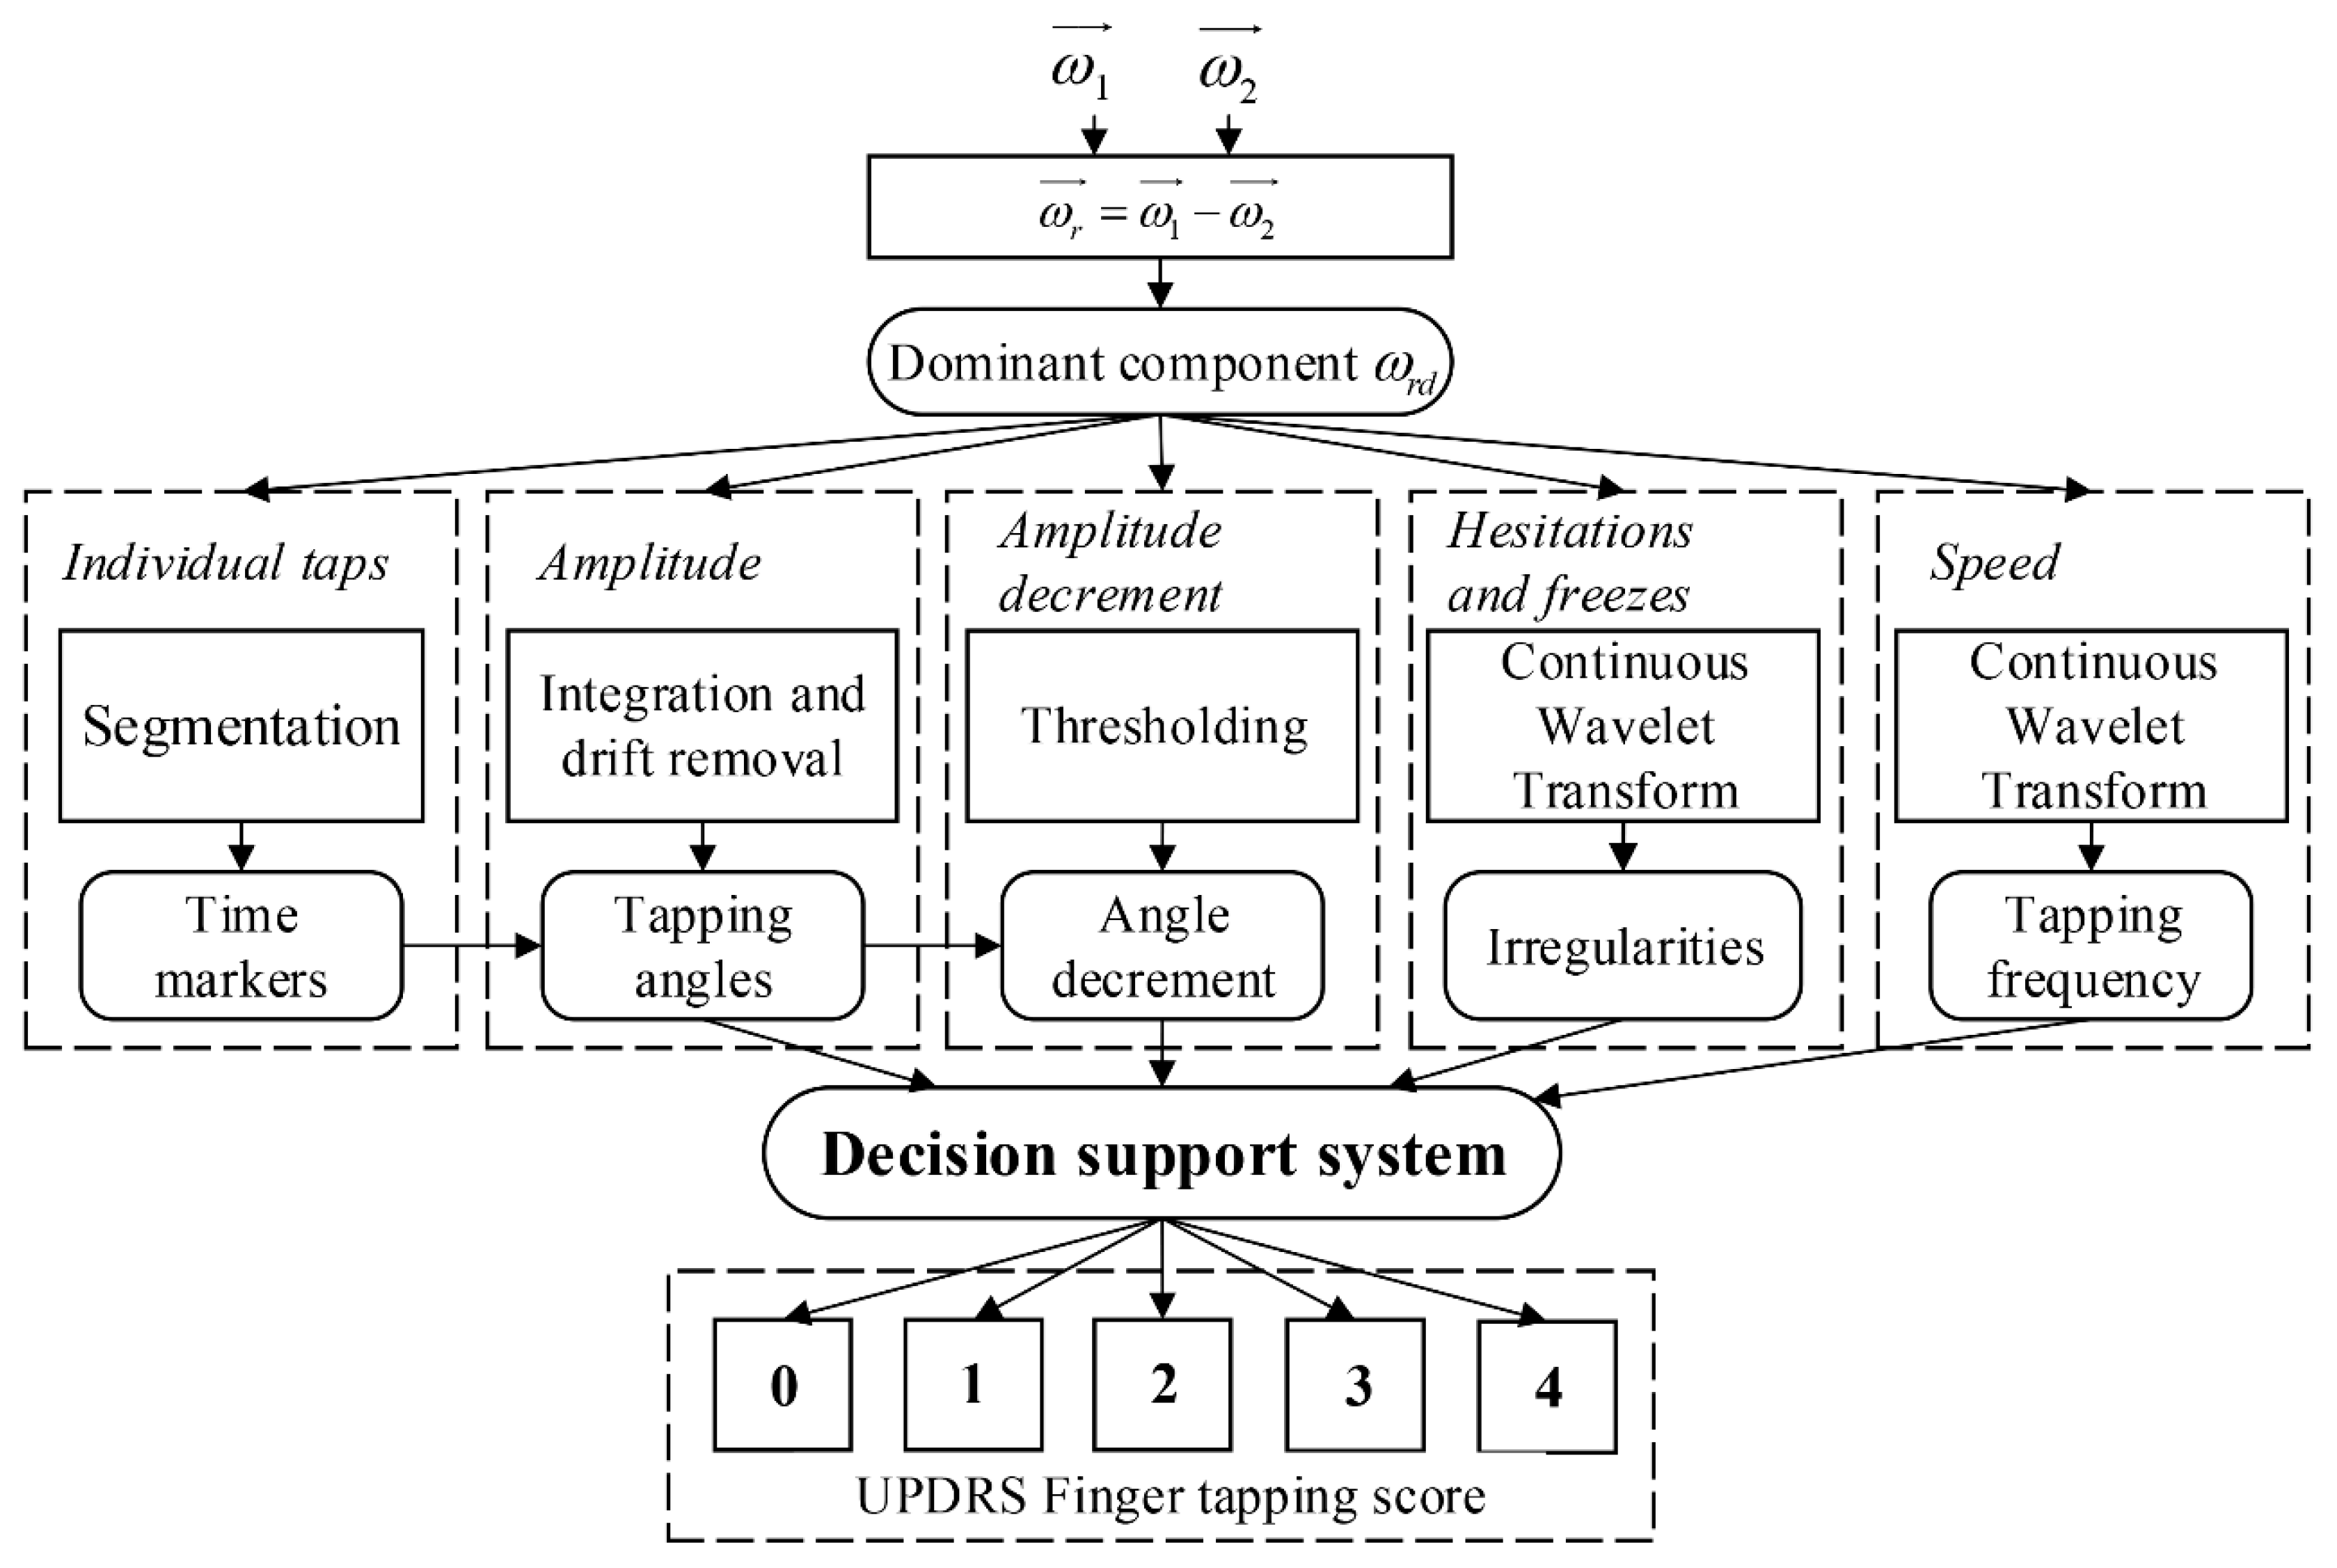
2.5. Data Processing and Analysis
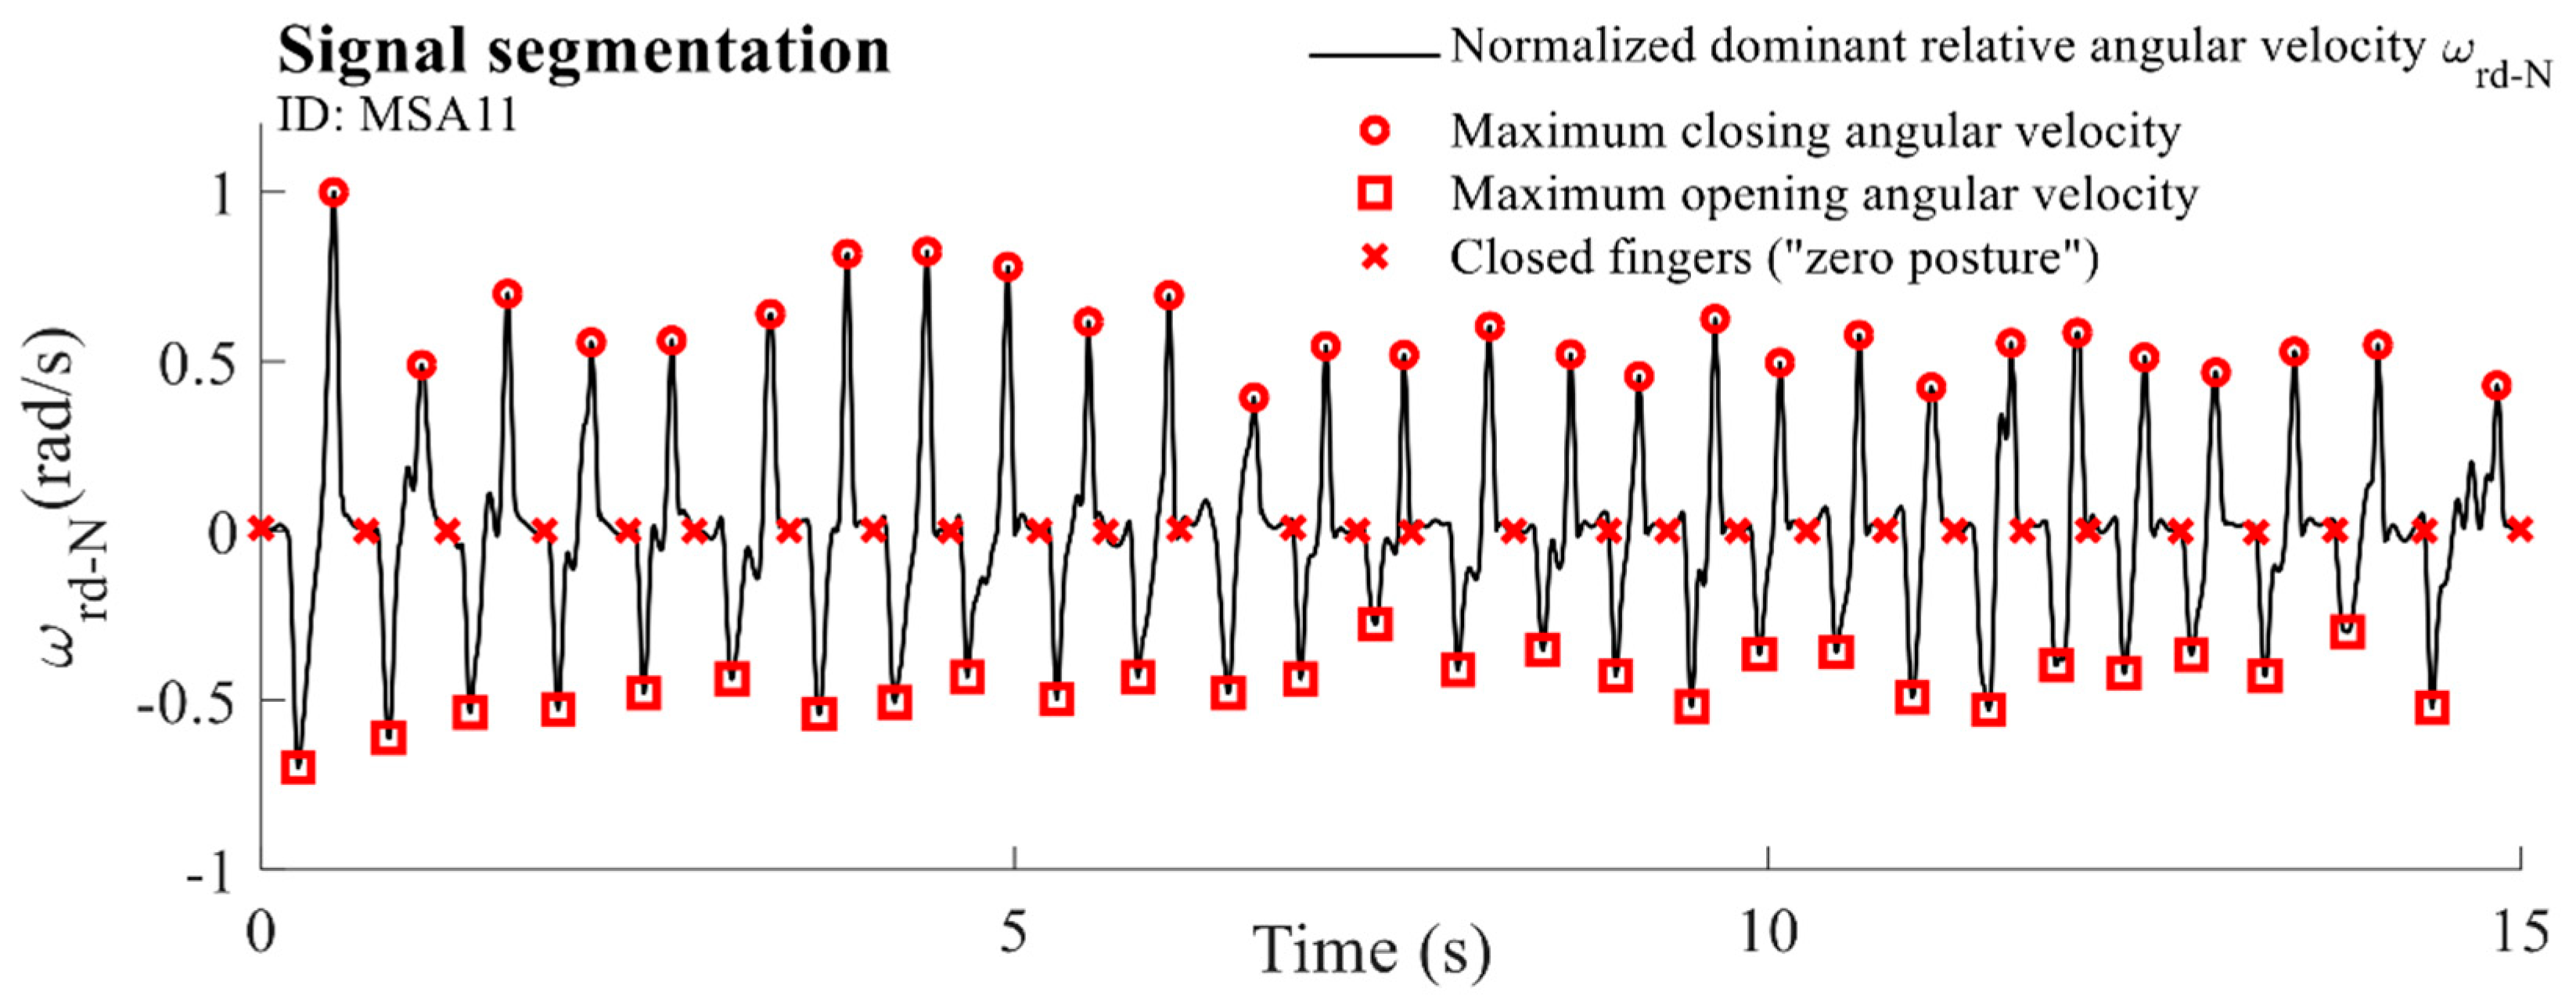
2.5.1. Individual Taps
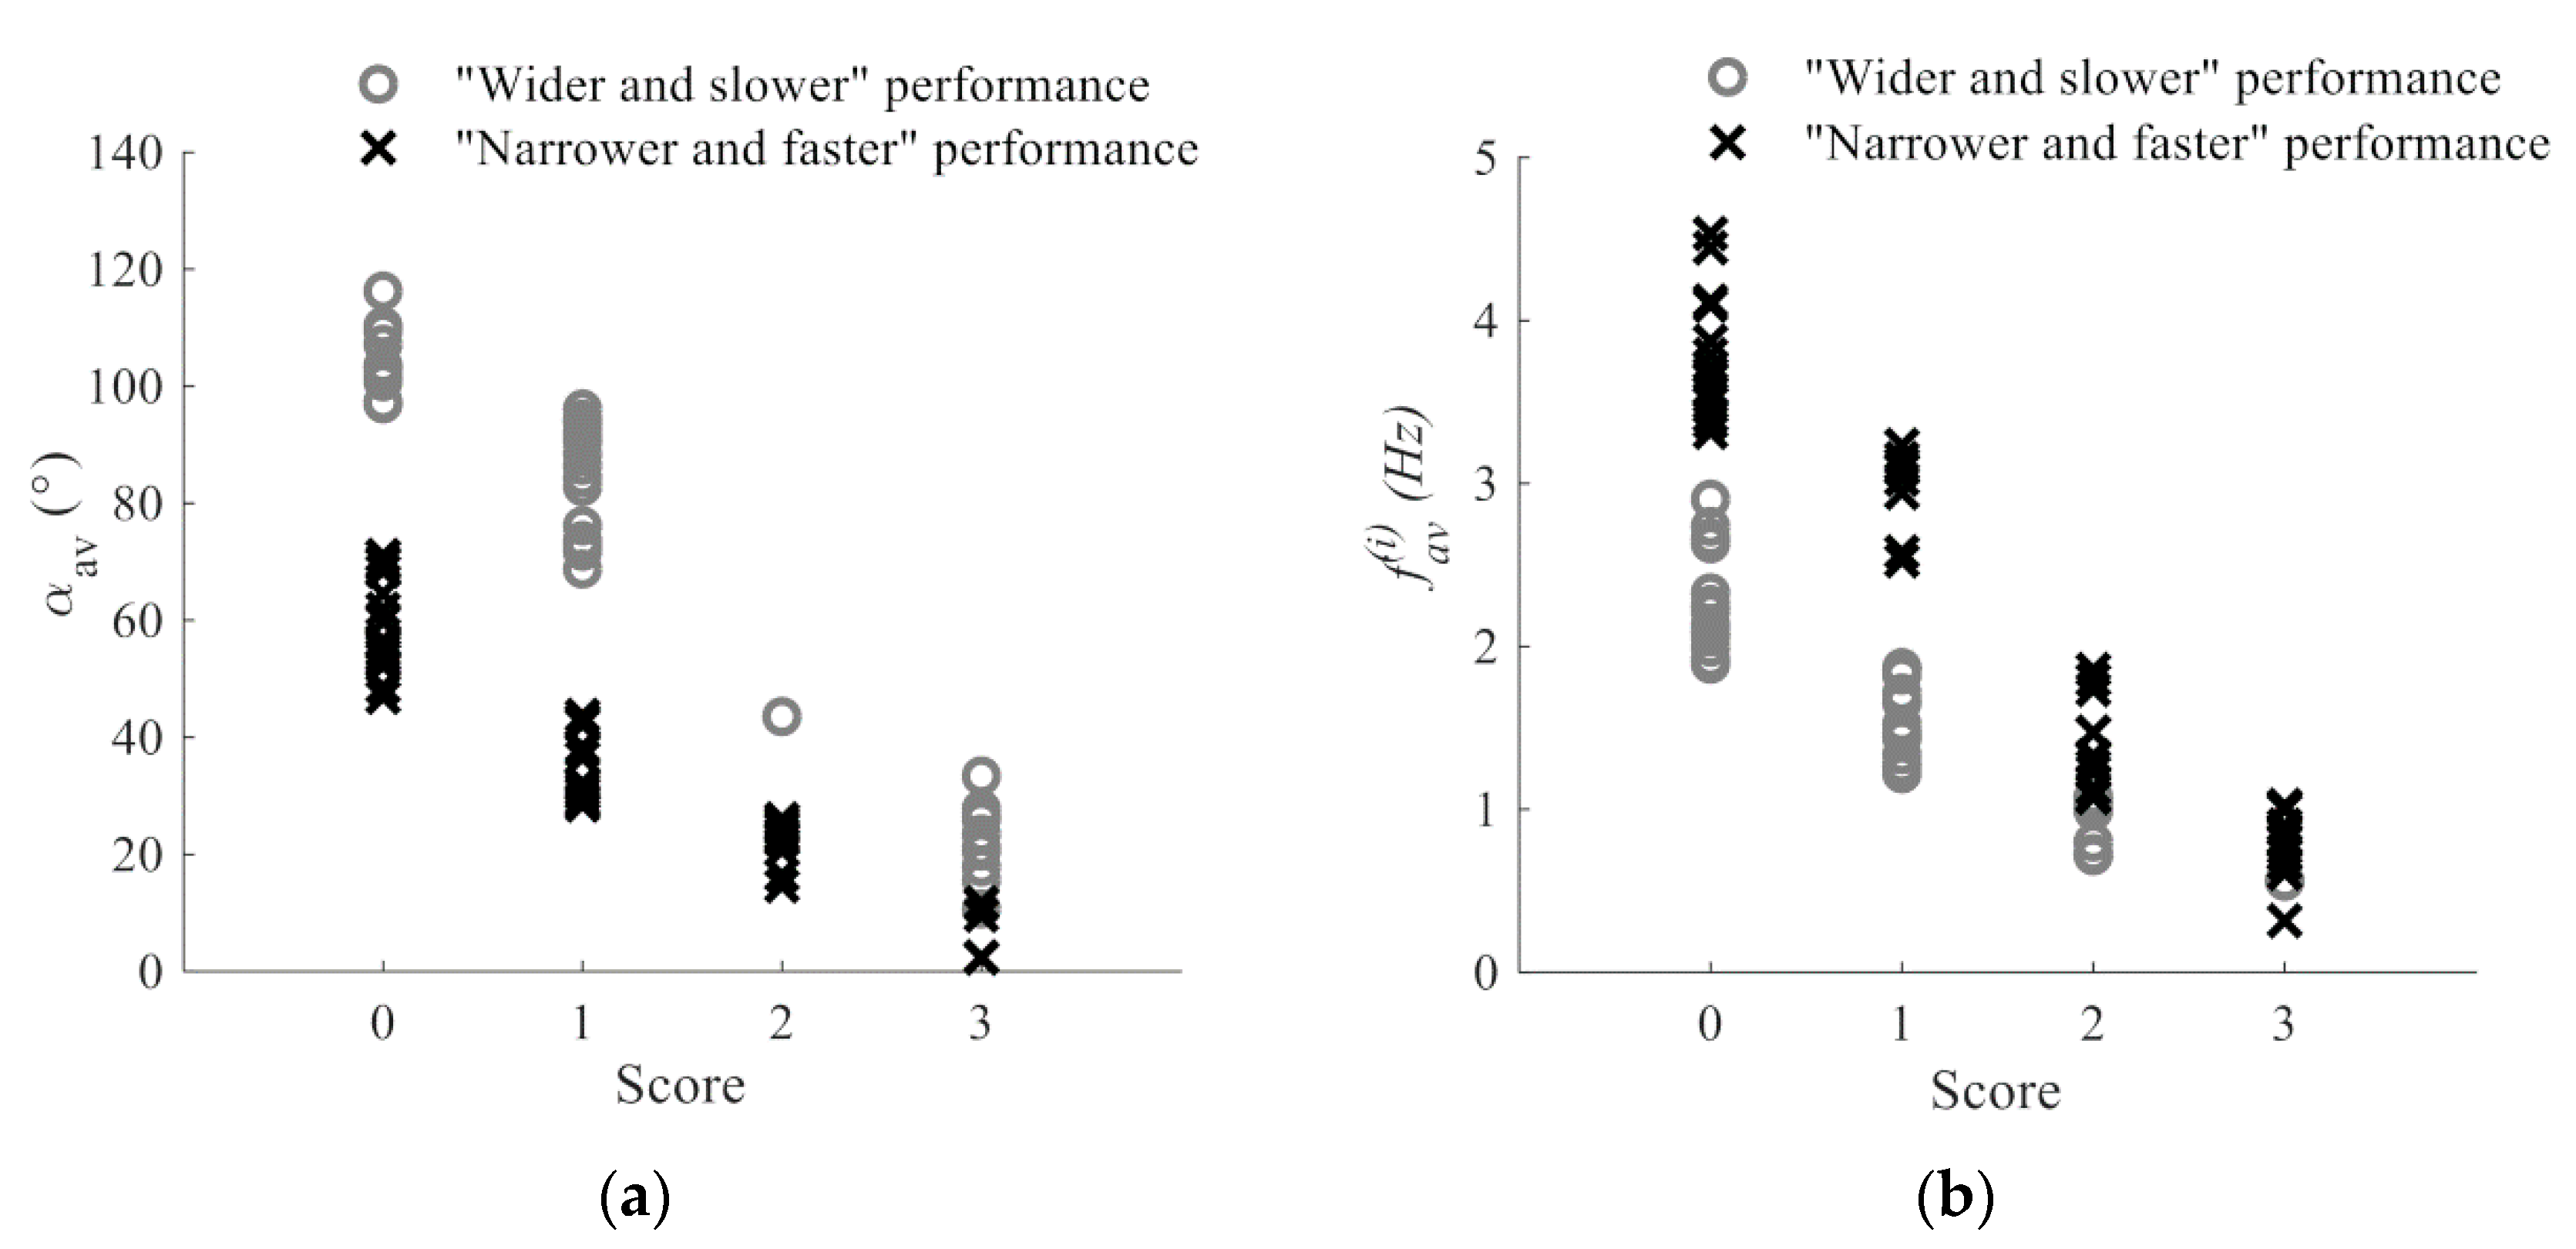
2.5.2. Amplitude
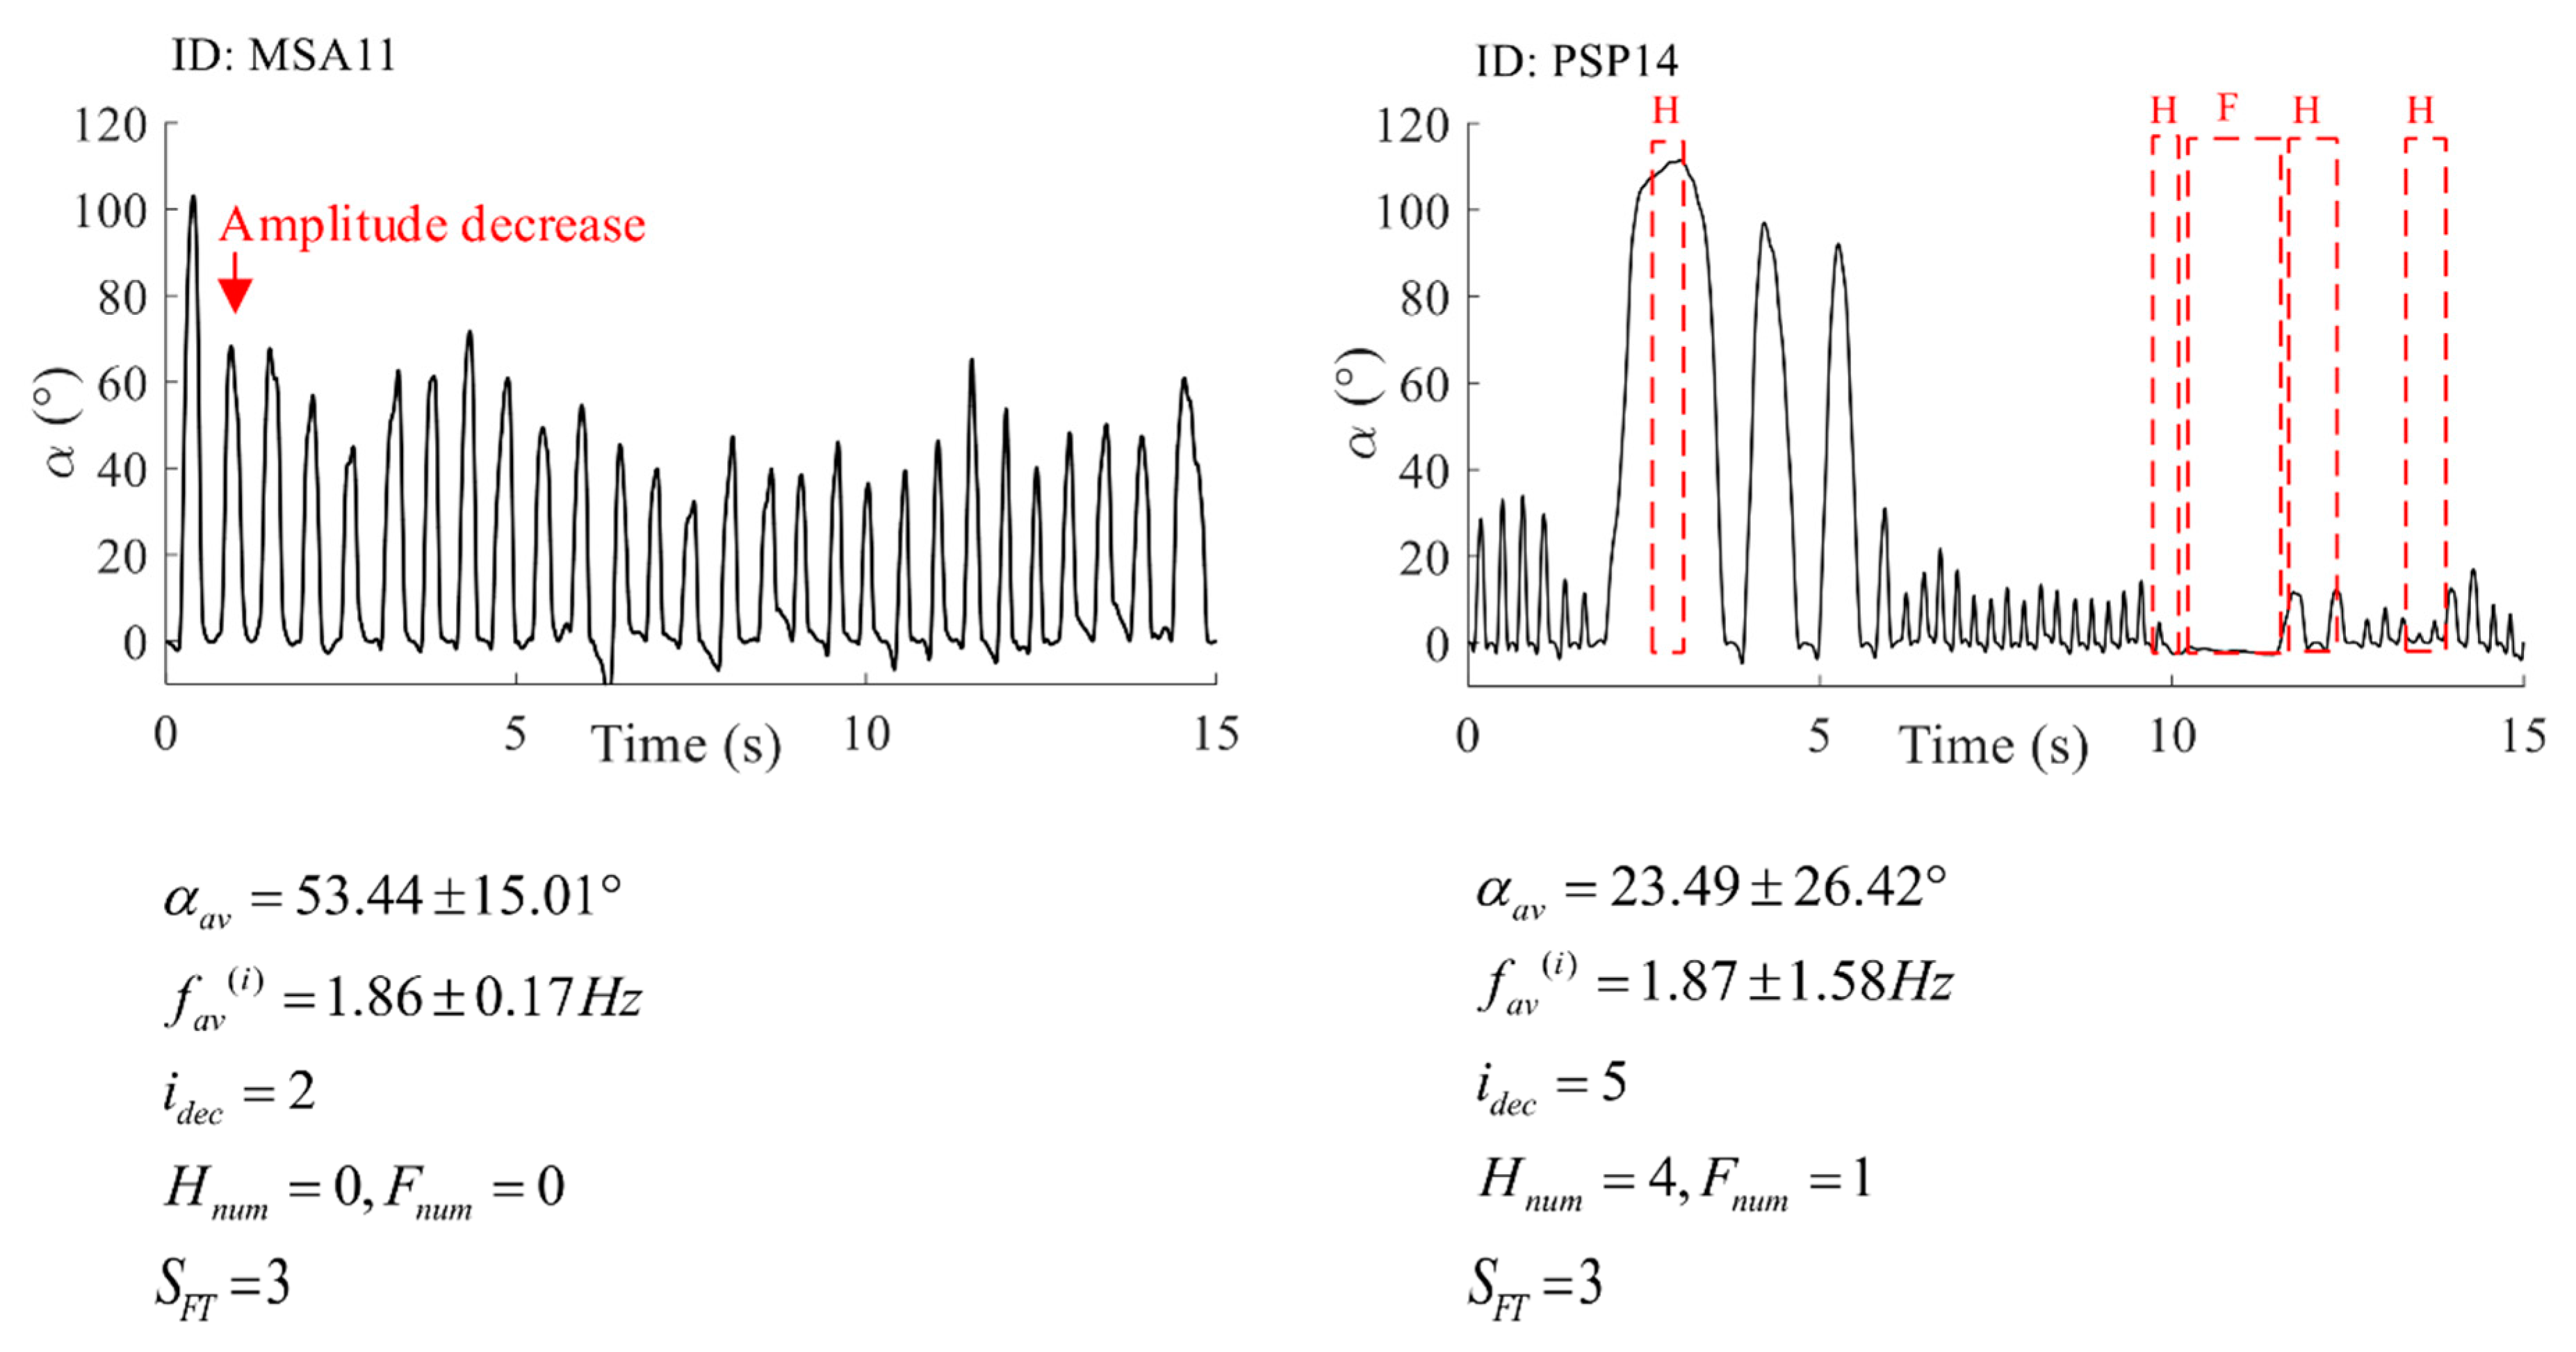
2.5.3. Amplitude Decrement
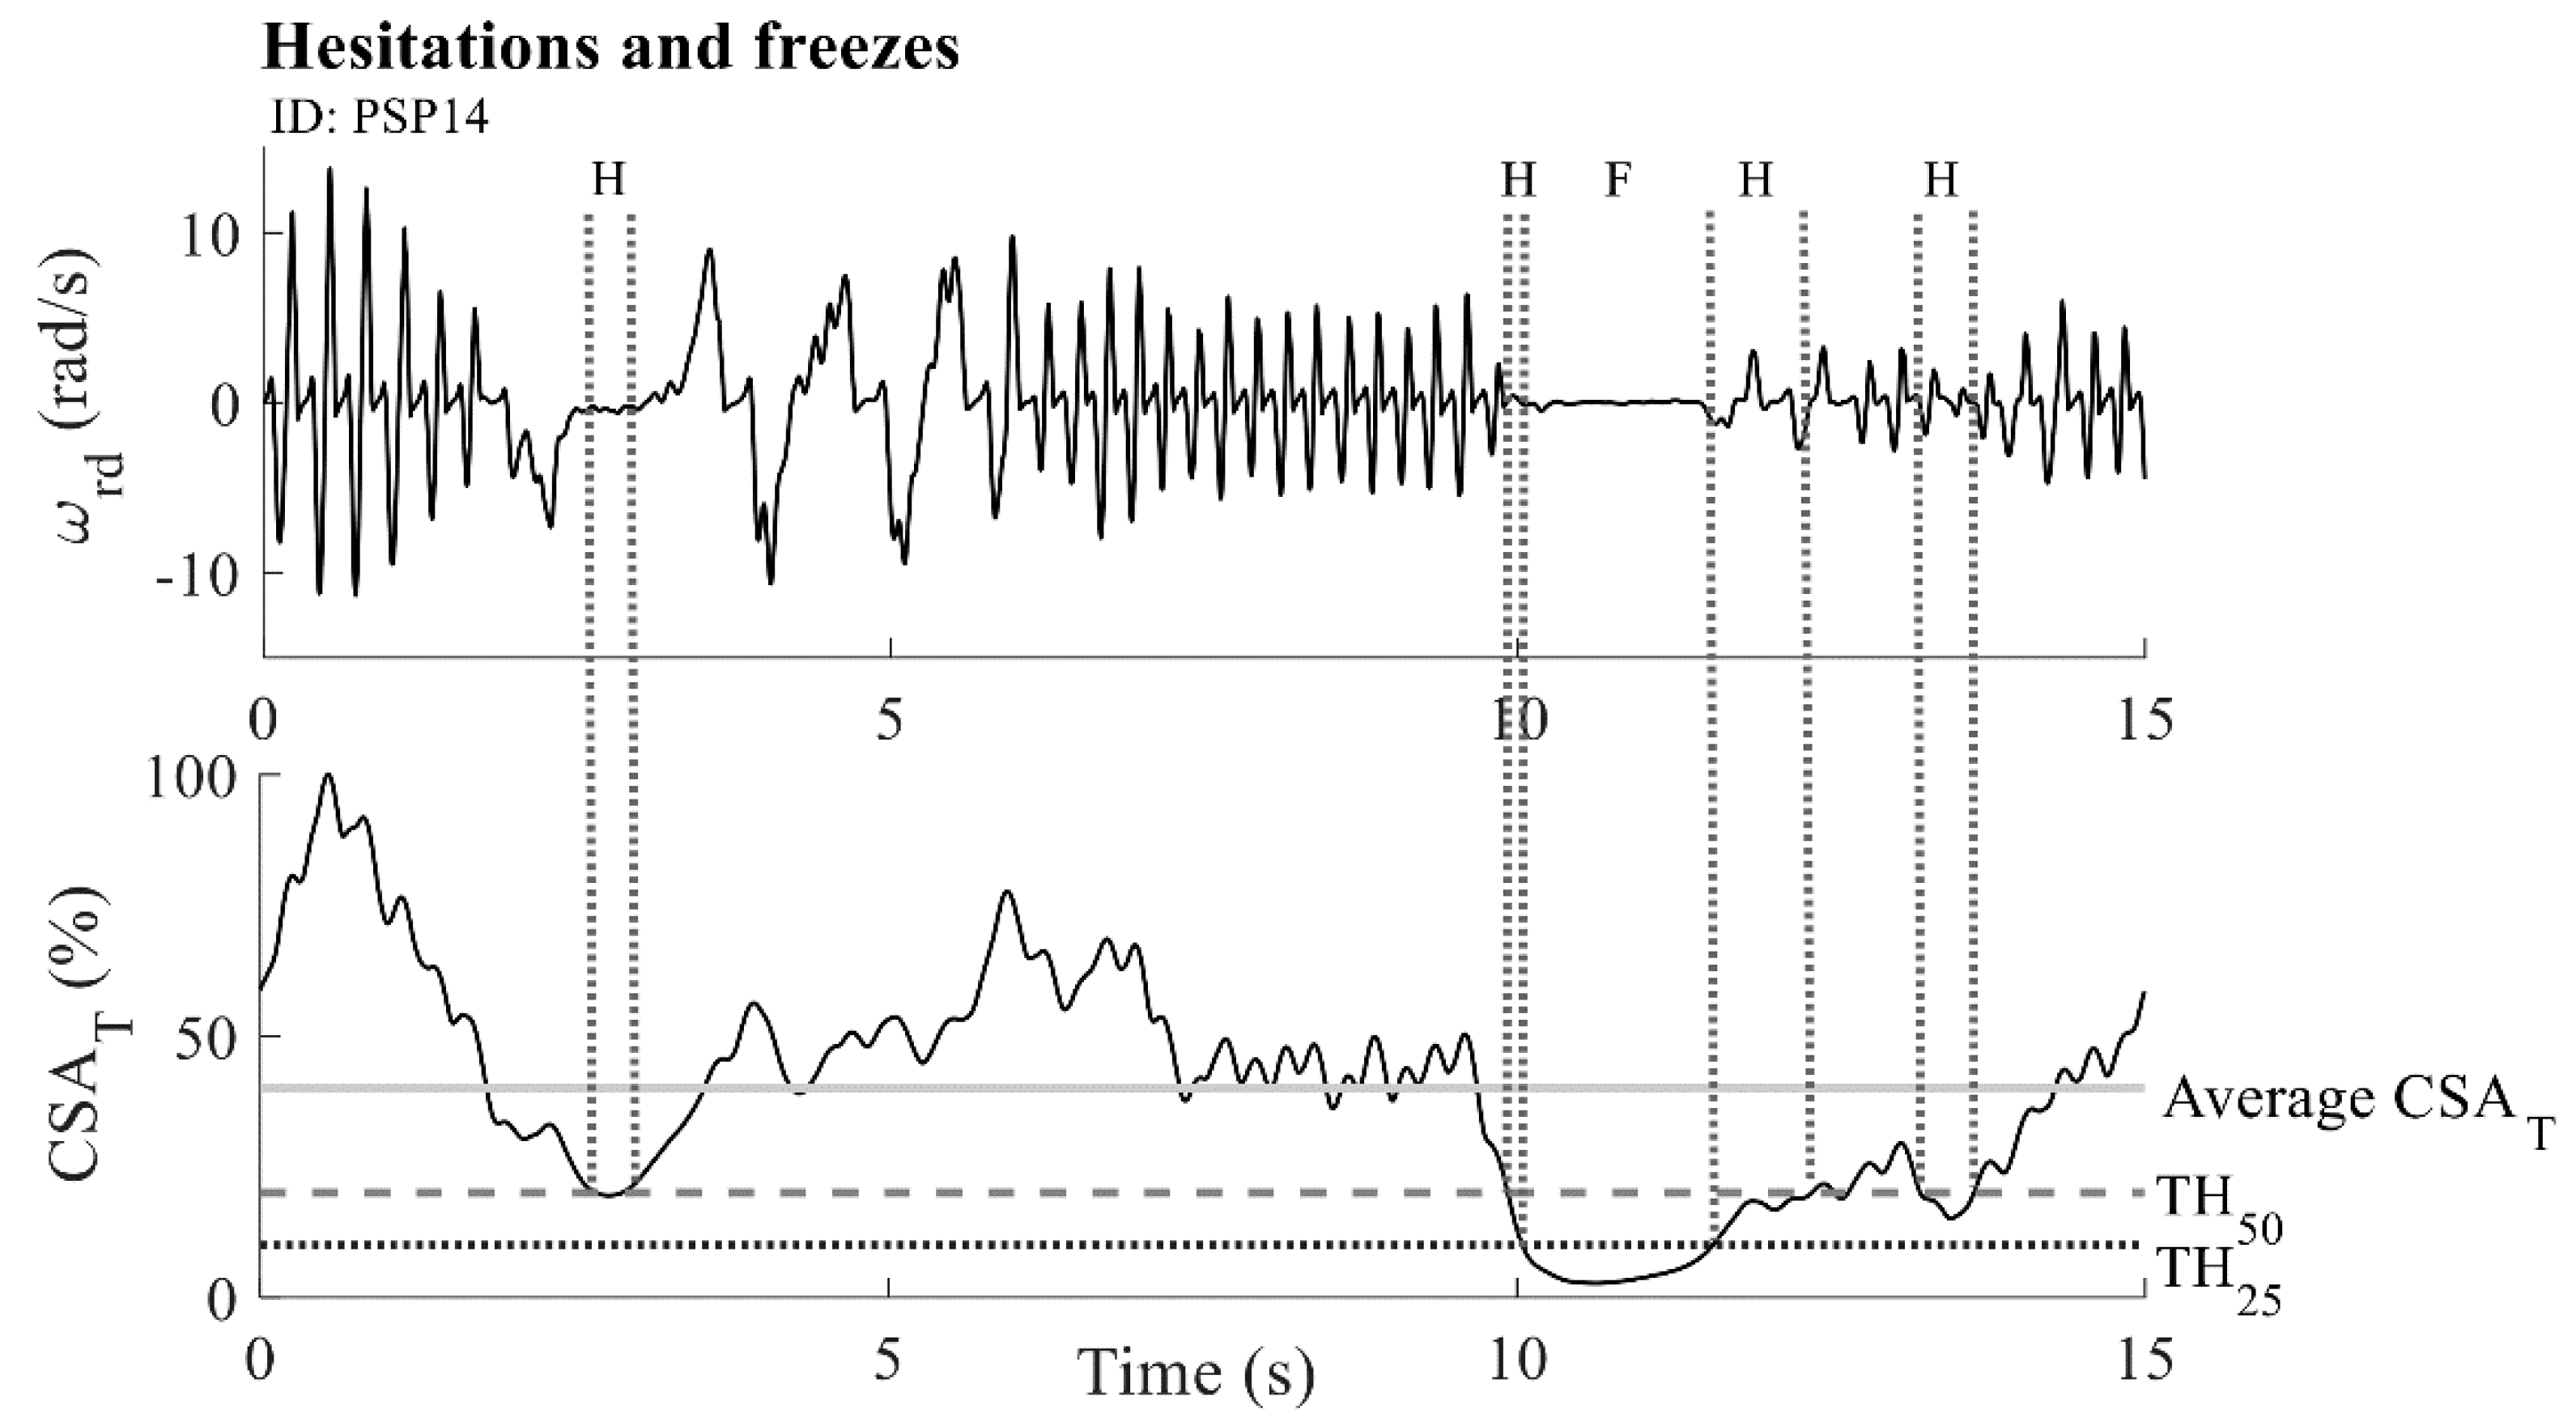
2.5.4. Hesitations and Freezes
2.5.5. Speed
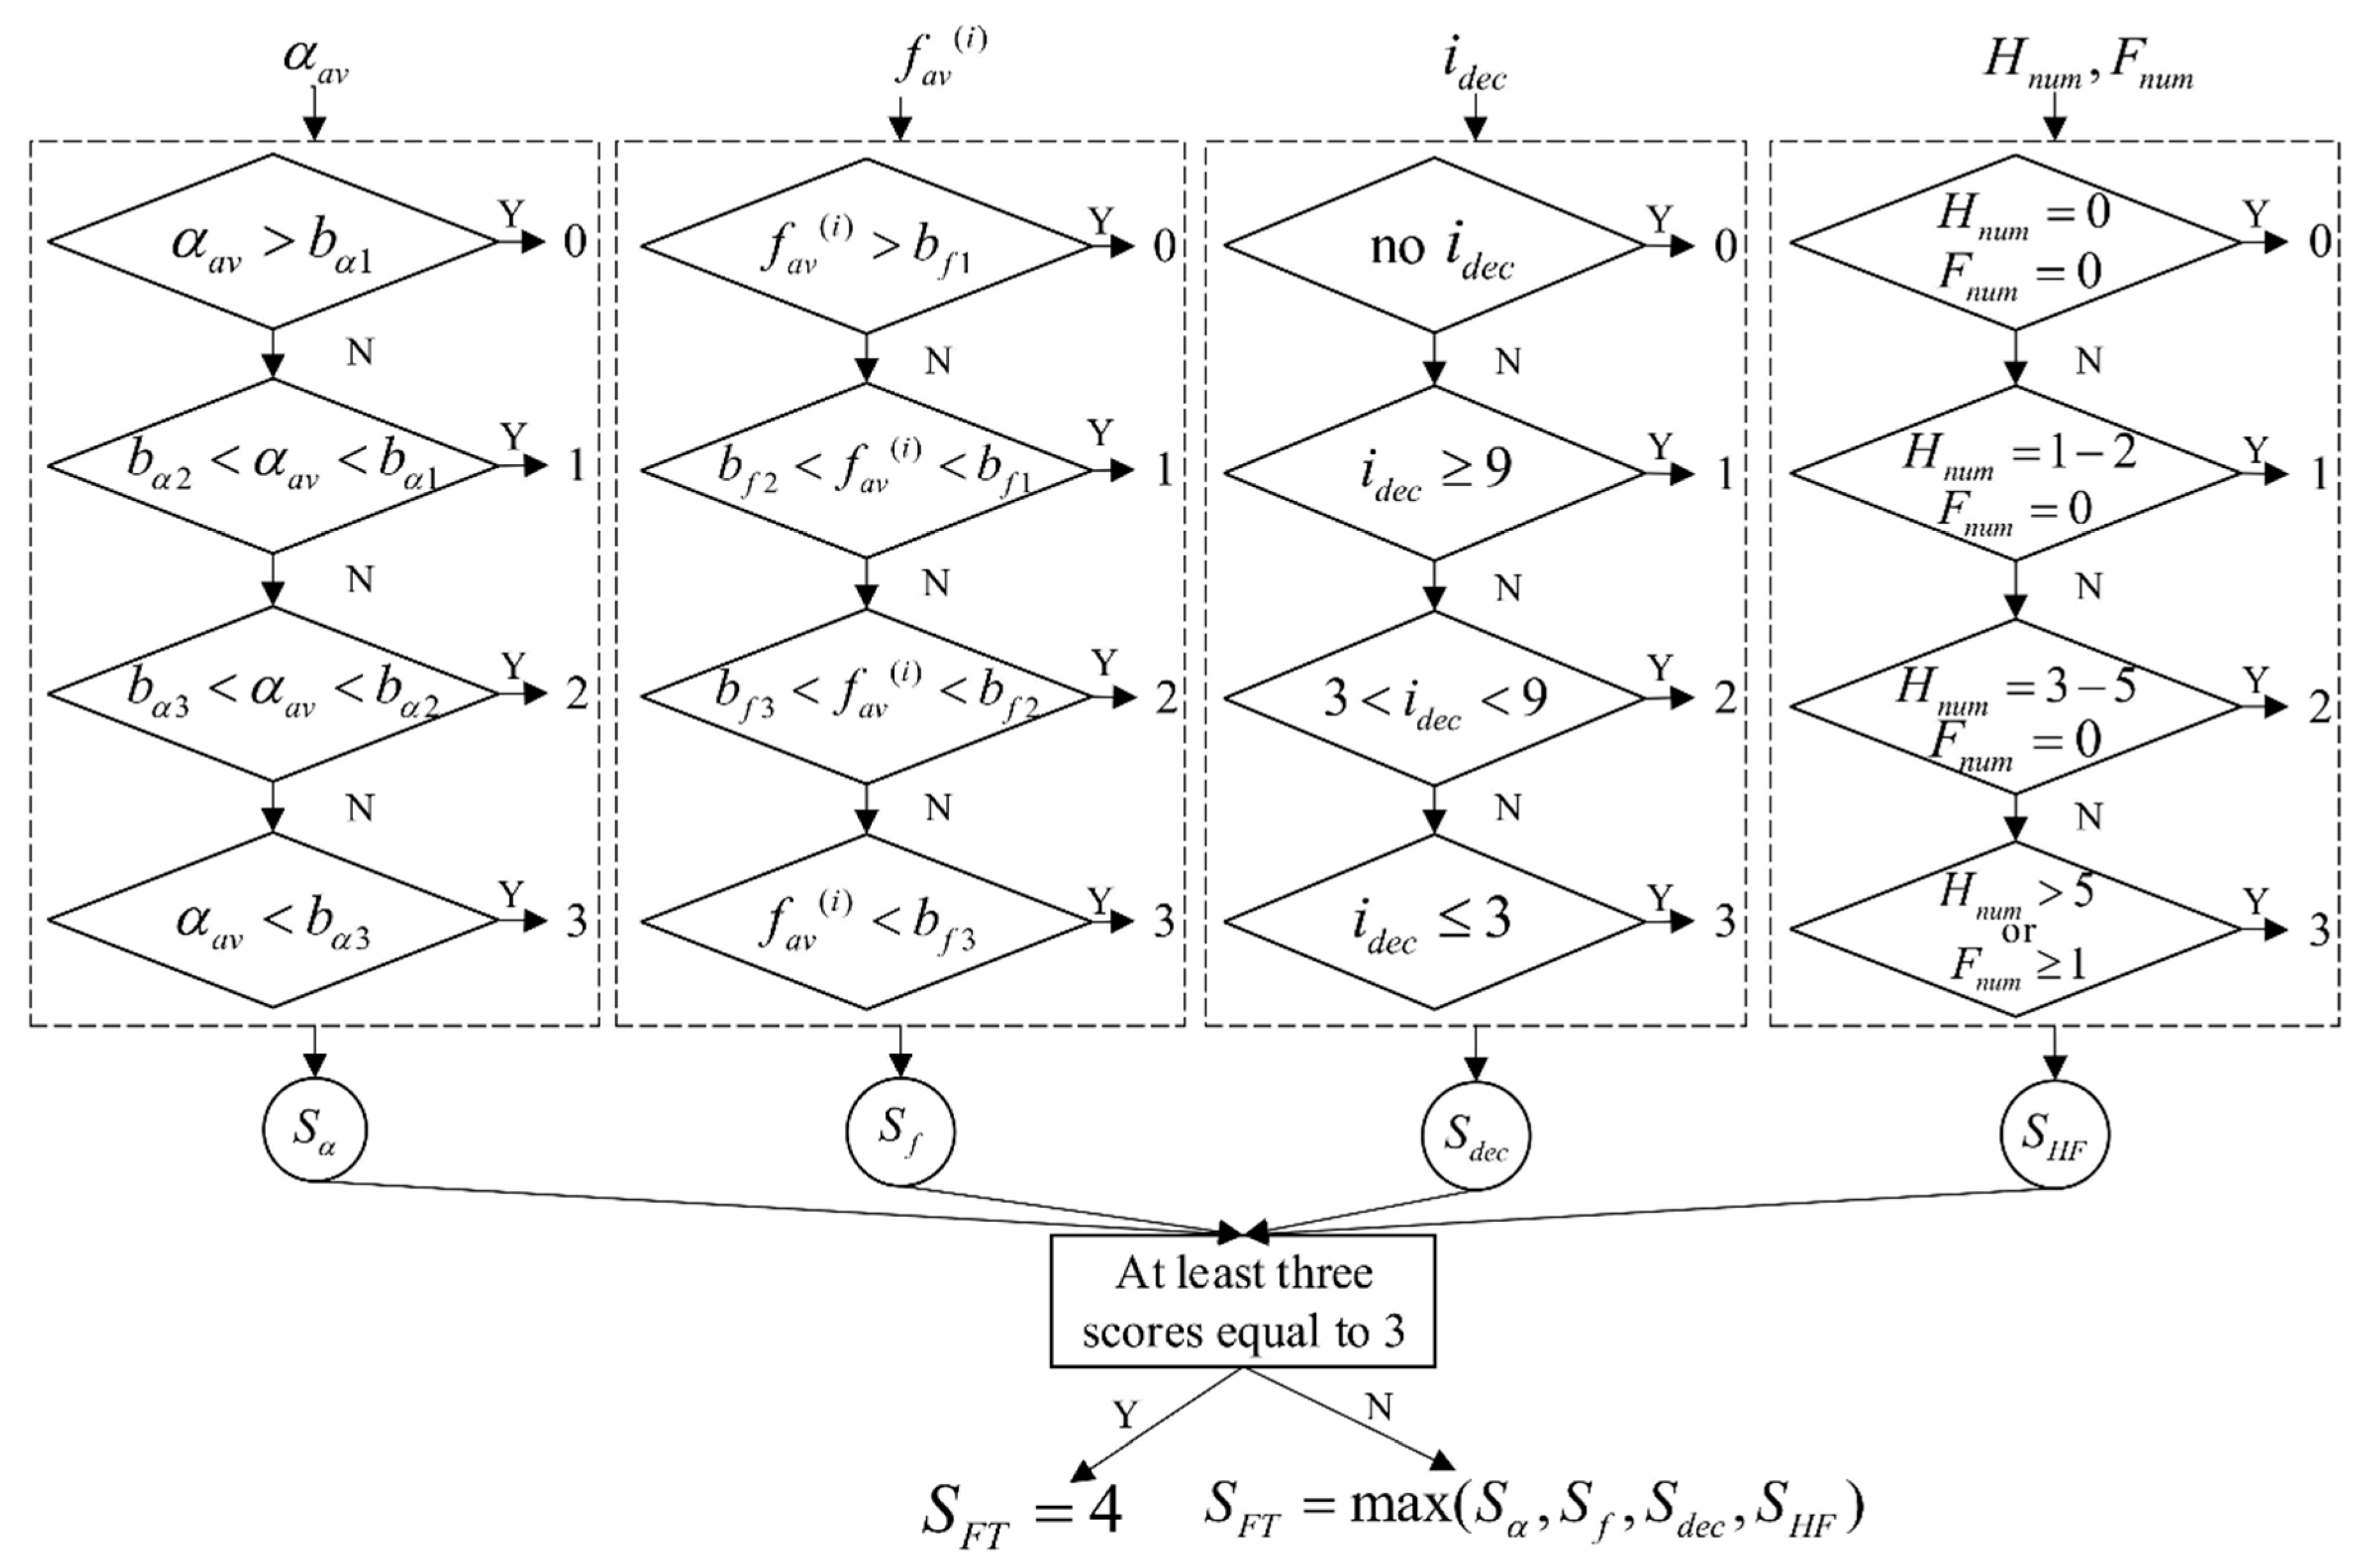
2.5.6. Decision Support System
- 0
- Normal: Regular rhythm, without hesitations or freezes. Fast movement, large amplitude, no amplitude decrement.
- 1
- Slight: Any of the following: (a) the regular rhythm is broken with one or two interruptions or hesitations of the tapping movement; (b) slight slowing; (c) the amplitude decrements near the end of the 10 taps.
- 2
- Mild: Any of the following: (a) three to five interruptions during tapping; (b) mild slowing; (c) the amplitude decrements midway in the 10-tap sequence.
- 3
- Moderate: Any of the following: (a) over five interruptions during tapping or at least one freeze in ongoing movement; (b) moderate slowing; (c) the amplitude decrements starting after the first tap.
- 4
- Severe: Cannot or can only barely perform the task due to slowing, interruptions, or decrements.
2.5.7. Statistical Analysis and Evaluation
3. Results
4. Discussion
Author Contributions
Funding
Acknowledgments
Conflicts of Interest
References
- Rovini, E.; Maremmani, C.; Cavallo, F. How wearable sensors can support parkinson’s disease diagnosis and treatment: A systematic review. Front. Neurosci. 2017, 11, 555. [Google Scholar] [CrossRef] [PubMed]
- Jankovic, J. Parkinson’s disease: Clinical features and diagnosis. J. Neurol. Neurosurg. Psychiatry 2008, 79, 368–376. [Google Scholar] [CrossRef] [PubMed]
- MDS UPDRS Rating Scale. Available online: https://www.movementdisorders.org/MDS-Files1/PDFs/Rating-Scales/MDS-UPDRS_English_FINAL.pdf (accessed on 31 January 2019).
- Lin, Z.; Xiong, Y.; Cai, G.; Dai, H.; Xia, X.; Tan, Y.; Lueth, T.C. Quantification of Parkinsonian Bradykinesia Based on Axis-Angle Representation and SVM Multiclass Classification Method. IEEE Access 2018, 6, 26895–26903. [Google Scholar] [CrossRef]
- Lainscsek, C.; Rowat, P.; Schettino, L.; Lee, D.; Song, D.; Letellier, C.; Poizner, H. Finger tapping movements of Parkinson’s disease patients automatically rated using nonlinear delay differential equations. Chaos An Interdiscip. J. Nonlinear Sci. 2012, 22, 013119. [Google Scholar] [CrossRef] [PubMed]
- Djuric-Jovicic, M.; Jovicic, N.; Radovanovic, S.; Jecmenica-Lukic, M.; Belic, M.; Popovic, M.; Kostic, V. Finger and foot tapping sensor system for objective motor assessment. Vojnosanit. Pregl. 2018. [Google Scholar] [CrossRef]
- Kim, J.-W.; Lee, J.-H.; Kwon, Y.; Kim, C.-S.; Eom, G.-M.; Koh, S.-B.; Kwon, D.-Y.; Park, K.-W. Quantification of bradykinesia during clinical finger taps using a gyrosensor in patients with Parkinson’s disease. Med. Biol. Eng. Comput. 2011, 49, 365–371. [Google Scholar] [CrossRef] [PubMed]
- Stamatakis, J.; Ambroise, J.; Crémers, J.; Sharei, H.; Delvaux, V.; Macq, B.; Garraux, G. Finger Tapping Clinimetric Score Prediction in Parkinson’s Disease Using Low-Cost Accelerometers. Comput. Intell. Neurosci. 2013, 2013, 1–13. [Google Scholar] [CrossRef] [PubMed]
- Garza-Rodríguez, A.; Sánchez-Fernández, L.P.; Sánchez-Pérez, L.A.; Ornelas-Vences, C.; Ehrenberg-Inzunza, M. Pronation and supination analysis based on biomechanical signals from Parkinson’s disease patients. Artif. Intell. Med. 2018, 84, 7–22. [Google Scholar] [CrossRef] [PubMed]
- Piro, N.; Piro, L.; Kassubek, J.; Blechschmidt-Trapp, R.; Piro, N.E.; Piro, L.K.; Kassubek, J.; Blechschmidt-Trapp, R.A. Analysis and Visualization of 3D Motion Data for UPDRS Rating of Patients with Parkinson’s Disease. Sensors 2016, 16, 930. [Google Scholar] [CrossRef]
- Ferraris, C.; Nerino, R.; Chimienti, A.; Pettiti, G.; Cau, N.; Cimolin, V.; Azzaro, C.; Albani, G.; Priano, L.; Mauro, A.; et al. A Self-Managed System for Automated Assessment of UPDRS Upper Limb Tasks in Parkinson’s Disease. Sensors 2018, 18, 3523. [Google Scholar] [CrossRef]
- Lee, W.L.; Sinclair, N.C.; Jones, M.; Tan, J.L.; Proud, E.L.; Peppard, R.; McDermott, H.J.; Perera, T. Objective evaluation of bradykinesia in Parkinson’s disease using an inexpensive marker-less motion tracking system. Physiol. Meas. 2019, 40, 014004. [Google Scholar] [CrossRef] [PubMed]
- Sano, Y.; Kandori, A.; Shima, K.; Yamaguchi, Y.; Tsuji, T.; Noda, M.; Higashikawa, F.; Yokoe, M.; Sakoda, S. Quantifying Parkinson’s disease finger-tapping severity by extracting and synthesizing finger motion properties. Med. Biol. Eng. Comput. 2016, 54, 953–965. [Google Scholar] [CrossRef] [PubMed]
- Arora, S.; Venkataraman, V.; Zhan, A.; Donohue, S.; Biglan, K.M.M.; Dorsey, E.R.R.; Little, M.A.A. Detecting and monitoring the symptoms of Parkinson’s disease using smartphones: A pilot study. Park. Relat. Disord. 2015, 21, 650–653. [Google Scholar] [CrossRef] [PubMed]
- Van den Noort, J.C.; Verhagen, R.; van Dijk, K.J.; Veltink, P.H.; Vos, M.C.P.M.; de Bie, R.M.A.; Bour, L.J.; Heida, C.T. Quantification of Hand Motor Symptoms in Parkinson’s Disease: A Proof-of-Principle Study Using Inertial and Force Sensors. Ann. Biomed. Eng. 2017, 45, 2423–2436. [Google Scholar] [CrossRef] [PubMed]
- Lin, Z.; Dai, H.; Xiong, Y.; Xia, X.; Horng, S.-J. Quantification assessment of bradykinesia in Parkinson’s disease based on a wearable device. In Proceedings of the 2017 39th IEEE Annual International Conference of the IEEE Engineering in Medicine and Biology Society (EMBC), Jeju Island, Korea, 11–15 July 2017; pp. 803–806. [Google Scholar]
- Dai, H.; Lin, H.; Lueth, T.C. Quantitative assessment of parkinsonian bradykinesia based on an inertial measurement unit. Biomed. Eng. Online 2015, 14, 68. [Google Scholar] [CrossRef] [PubMed]
- McKay, G.N.; Harrigan, T.P.; Brašić, J.R. A low-cost quantitative continuous measurement of movements in the extremities of people with Parkinson’s disease. MethodsX 2019, 6, 169–189. [Google Scholar] [CrossRef] [PubMed]
- Alam, M.; Tabassum, T.; Munia, K.; Tavakolian, K. A Quantitative Assessment of Bradykinesia Using Inertial Measurement Unit Performance Measurement View project Signal-Image Processing View project. In Proceedings of the 2017 Design of Medical Devices Conference, Minneapolis, MN, USA, 10–13 April 2017. [Google Scholar]
- Patel, S.; Lorincz, K.; Hughes, R.; Huggins, N.; Growdon, J.; Standaert, D.; Akay, M.; Dy, J.; Welsh, M.; Bonato, P. Monitoring motor fluctuations in patients with parkinsons disease using wearable sensors. IEEE Trans. Inf. Technol. Biomed. 2009, 13, 864–873. [Google Scholar] [CrossRef]
- Djurić-Jovičić, M.; Petrović, I.; Ječmenica-Lukić, M.; Radovanović, S.; Dragašević-Mišković, N.; Belić, M.; Miler-Jerković, V.; Popović, M.B.; Kostić, V.S. Finger tapping analysis in patients with Parkinson’s disease and atypical parkinsonism. J. Clin. Neurosci. 2016, 30, 49–55. [Google Scholar] [CrossRef]
- Delrobaei, M.; Tran, S.; Gilmore, G.; McIsaac, K.; Jog, M. Characterization of multi-joint upper limb movements in a single task to assess bradykinesia. J. Neurol. Sci. 2016, 368, 337–342. [Google Scholar] [CrossRef]
- Ornelas-Vences, C.; Sánchez-Fernández, L.P.; Sánchez-Pérez, L.A.; Martínez-Hernández, J.M. Computer model for leg agility quantification and assessment for Parkinson’s disease patients. Med. Biol. Eng. Comput. 2019, 57, 463–476. [Google Scholar] [CrossRef]
- Mentzel, T.Q.; Lieverse, R.; Levens, A.; Mentzel, C.L.; Tenback, D.E.; Bakker, P.R.; Daanen, H.A.M.; van Harten, P.N. Reliability and validity of an instrument for the assessment of bradykinesia. Psychiatry Res. 2016, 238, 189–195. [Google Scholar] [CrossRef] [PubMed]
- Memar, S.; Delrobaei, M.; Pieterman, M.; McIsaac, K.; Jog, M. Quantification of whole-body bradykinesia in Parkinson’s disease participants using multiple inertial sensors. J. Neurol. Sci. 2018, 387, 157–165. [Google Scholar] [CrossRef] [PubMed]
- Kinesia ONETM. Available online: https://glneurotech.com/kinesia/products/kinesia-one/ (accessed on 13 May 2019).
- Djurić-Jovičić, M.; Jovičić, N.; Roby-Brami, A.; Popović, M.; Kostić, V.; Djordjević, A.; Djurić-Jovičić, M.; Jovičić, N.S.; Roby-Brami, A.; Popović, M.B.; et al. Quantification of Finger-Tapping Angle Based on Wearable Sensors. Sensors 2017, 17, 203. [Google Scholar] [CrossRef] [PubMed]
- Bobic, V.; Djuric-Jovicic, M.; Jarrasse, N.; Jecmenica-Lukic, M.; Petrovic, I.; Radovanovic, S.; Dragasevic, N.; Kostic, V. Spectral parameters for finger tapping quantification. Facta Univ.-Ser. Electron. Energ. 2017, 30, 585–597. [Google Scholar] [CrossRef] [Green Version]
- Senhadji, L.; Wendling, F. Epileptic transient detection: Wavelets and time-frequency approaches. Neurophysiol. Clin. Neurophysiol. 2002, 32, 175–192. [Google Scholar] [CrossRef]


| Group | Statistics | H&Y | UPDRS Total | UPDRS III | FTN1 Score | FTN2 Score | ||
|---|---|---|---|---|---|---|---|---|
| Less AH | More AH | Less AH | More AH | |||||
| PD | Avg ± std | 1.80 ± 0.79 | 42.60 ± 16.93 | 24.60 ± 9.07 | 1.67 ± 0.89 | 2.17 ± 0.94 | 1.75 ± 0.97 | 2.17 ± 0.94 |
| Median | 2 | 36 | 19.5 | 2 | 2 | 2 | 2 | |
| MSA | Avg ± std | 3.18 ± 0.75 | 77.73 ± 13.70 | 46.64 ± 9.08 | 2.31 ± 0.70 | 2.81 ± 0.54 | 2.38 ± 0.72 | 2.81 ± 0.54 |
| Median | 3 | 79 | 45 | 2 | 3 | 2.5 | 3 | |
| PSP | Avg ± std | 3.45 ± 0.93 | 74.45 ± 20.08 | 42.91 ± 13.14 | 2.17 ± 0.94 | 2.62 ± 0.77 | 2.08 ± 0.79 | 2.77 ± 0.73 |
| Median | 4 | 79 | 46 | 2.5 | 3 | 2 | 3 | |
| HC | Avg ± std | / | / | / | 0.44 ± 0.63 | 0.50 ± 0.73 | ||
| Median | / | / | / | 0 | 0 | |||
| Group | |||||
|---|---|---|---|---|---|
| PD | 2.04 ± 0.87 | 63.08 ± 8.54 | 5.00 ± 5.66 | 0–4 | 0 |
| MSA | 1.71 ± 1.26 | 56.27 ± 36.11 | 4.03 ± 4.74 | 0–7 | 0–2 |
| PSP | 2.37 ± 1.11 | 44.87 ± 31.74 | 5.62 ± 4.88 | 0–4 | 0–1 |
| HC | 3.32 ± 0.89 | 80.48 ± 26.55 | 11.00 ± 10.99 | / | / |
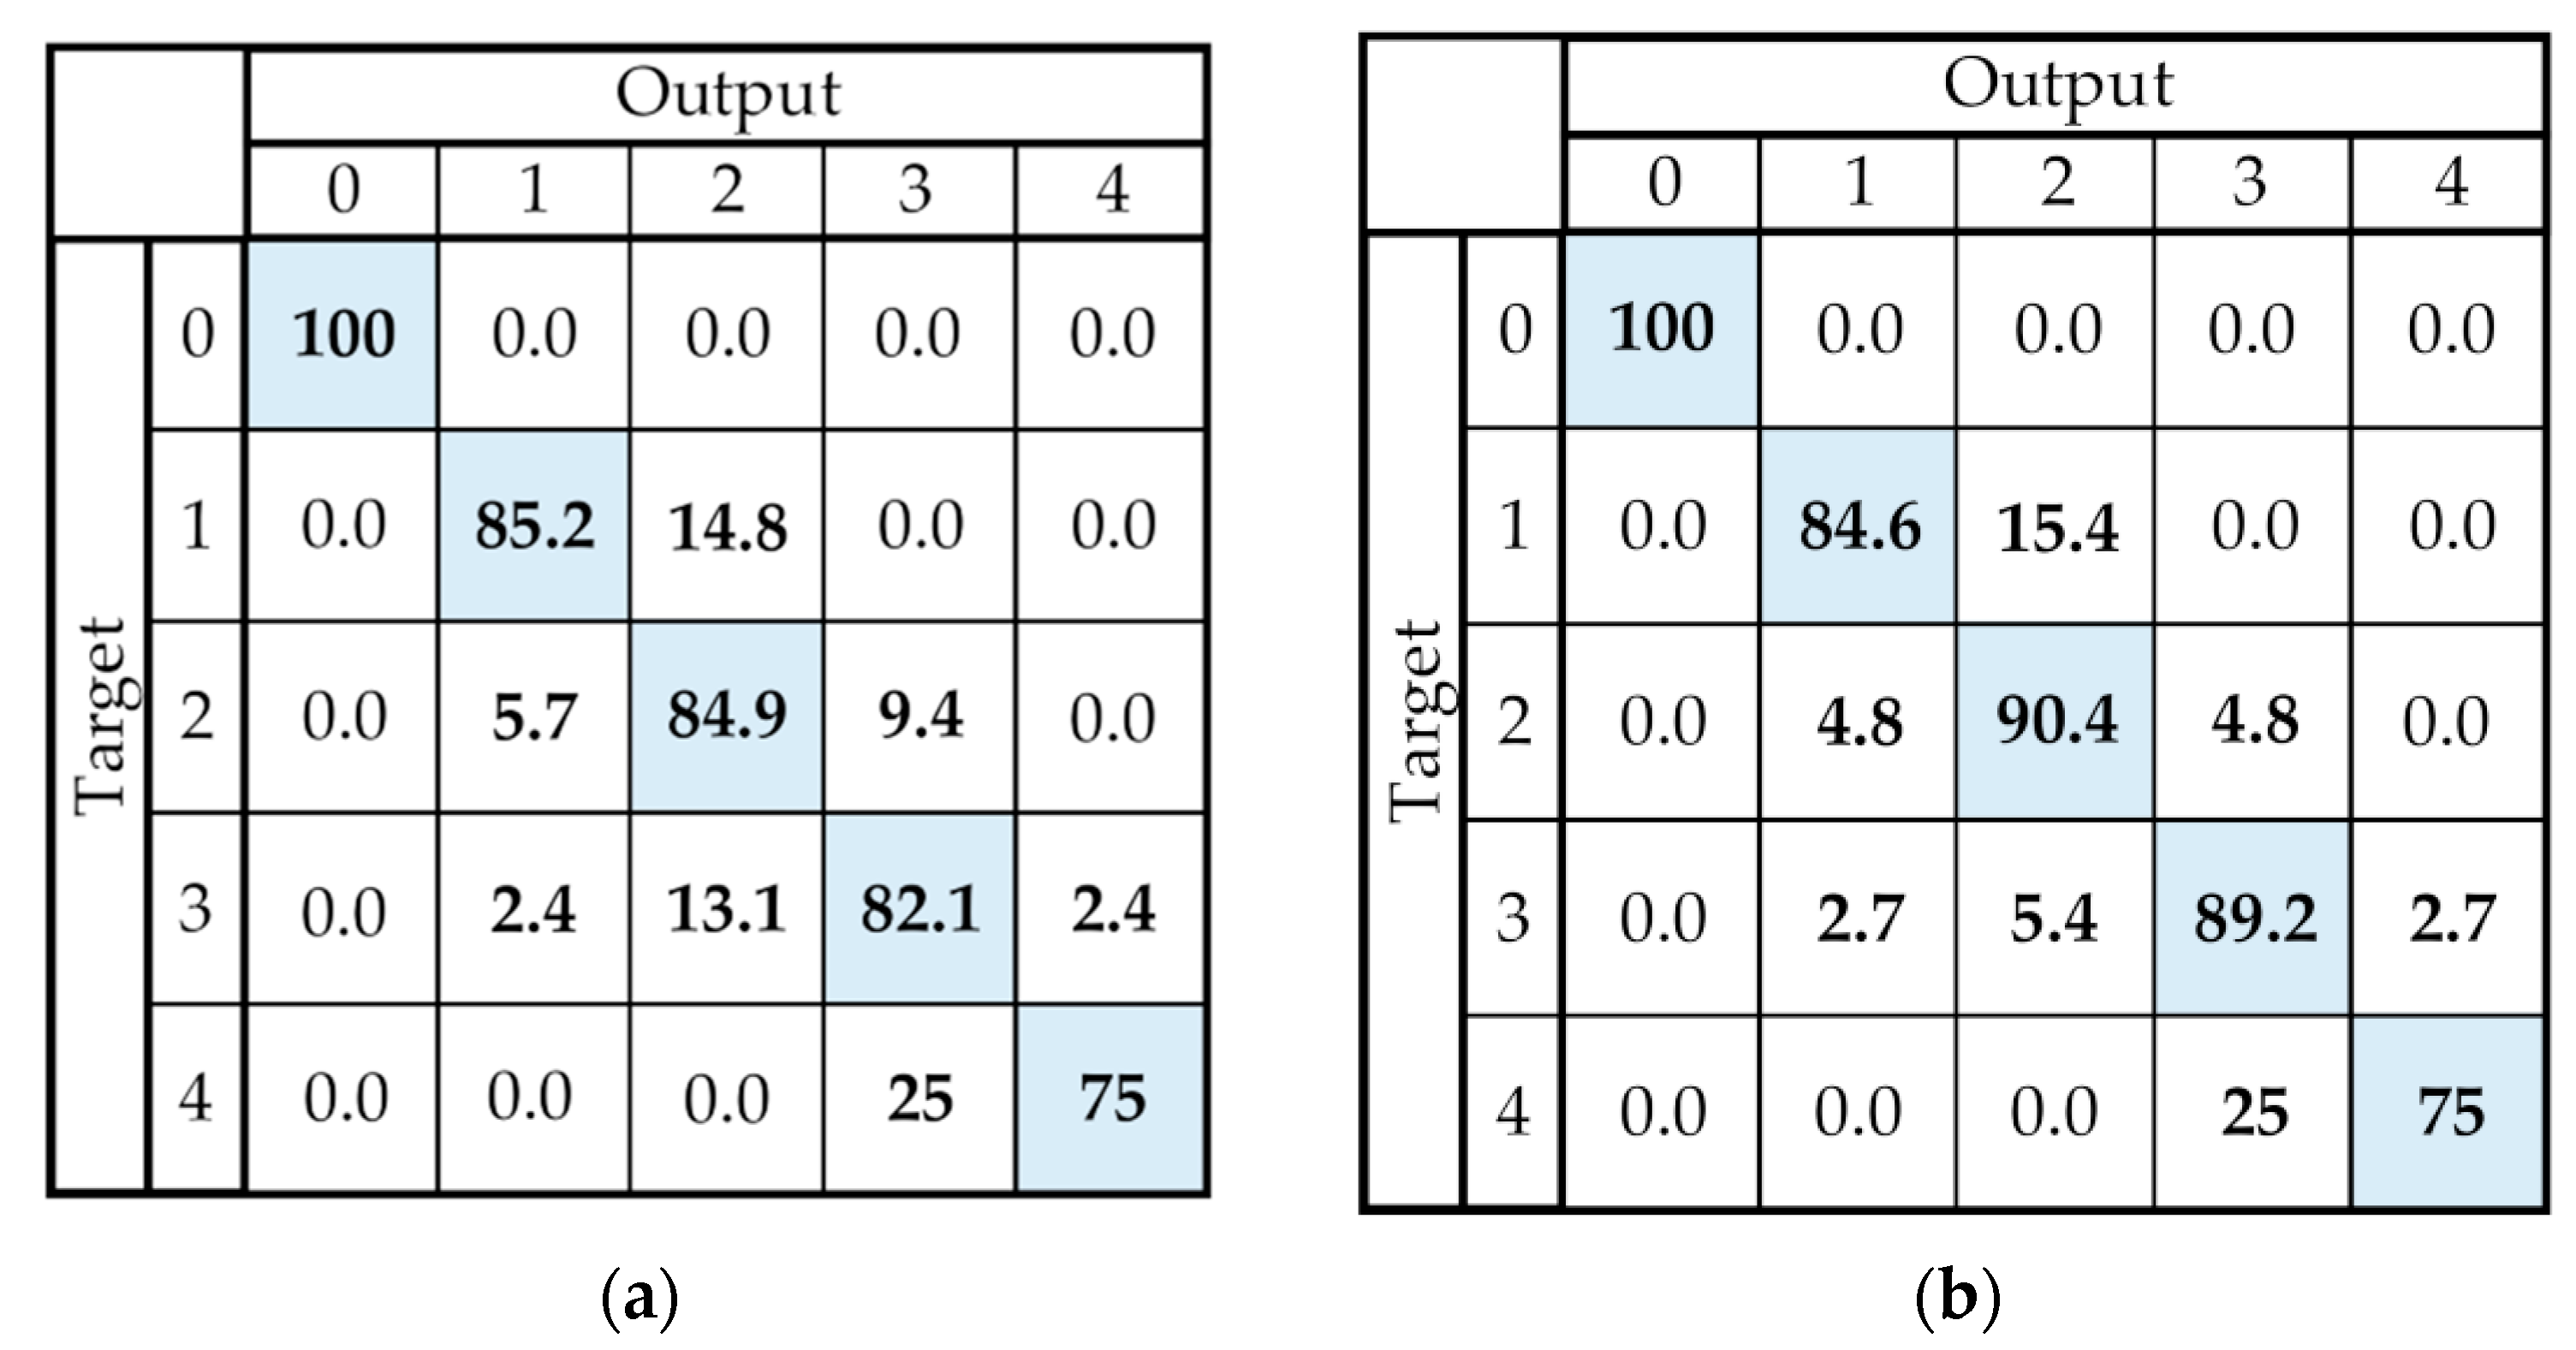
| Group | Case I Accuracy (%) | Case II Accuracy (%) |
|---|---|---|
| PD | 82.69 ± 2.72 | 84.00 |
| MSA | 82.36 ± 8.32 | 89.65 |
| PSP | 83.76 ± 7.86 | 90.91 |
| TOTAL | 83.33 ± 6.50 | 88.16 |
© 2019 by the authors. Licensee MDPI, Basel, Switzerland. This article is an open access article distributed under the terms and conditions of the Creative Commons Attribution (CC BY) license (http://creativecommons.org/licenses/by/4.0/).
Share and Cite
Bobić, V.; Djurić-Jovičić, M.; Dragašević, N.; Popović, M.B.; Kostić, V.S.; Kvaščev, G. An Expert System for Quantification of Bradykinesia Based on Wearable Inertial Sensors. Sensors 2019, 19, 2644. https://0-doi-org.brum.beds.ac.uk/10.3390/s19112644
Bobić V, Djurić-Jovičić M, Dragašević N, Popović MB, Kostić VS, Kvaščev G. An Expert System for Quantification of Bradykinesia Based on Wearable Inertial Sensors. Sensors. 2019; 19(11):2644. https://0-doi-org.brum.beds.ac.uk/10.3390/s19112644
Chicago/Turabian StyleBobić, Vladislava, Milica Djurić-Jovičić, Nataša Dragašević, Mirjana B. Popović, Vladimir S. Kostić, and Goran Kvaščev. 2019. "An Expert System for Quantification of Bradykinesia Based on Wearable Inertial Sensors" Sensors 19, no. 11: 2644. https://0-doi-org.brum.beds.ac.uk/10.3390/s19112644