Article

Sustainability of the Urban Transport System under Changes in Weather and Road Conditions Affecting Vehicle Operation

by
Dmitriy Zakharov
1,
Elena Magaril
2,* and
Elena Cristina Rada
3
1
Department of Road Transport Operation, Industrial University of Tyumen, Volodarskogo Street, 625000 Tyumen, Russia
2
Department of Environmental Economics, Ural Federal University, Mira Street, 19, 620002 Ekaterinburg, Russia
3
Department of Theoretical and Applied Sciences, Insubria University of Varese, via G.B. Vico, 46, I-21100 Varese, Italy
*
Author to whom correspondence should be addressed.
Sustainability 2018, 10(6), 2052; https://0-doi-org.brum.beds.ac.uk/10.3390/su10062052
Submission received: 28 April 2018 / Revised: 14 June 2018 / Accepted: 14 June 2018 / Published: 16 June 2018
(This article belongs to the Special Issue Travel Behaviour and Sustainable Transport of the Future)

Abstract

:
The paper suggests a methodological approach for assessing the sustainability of the urban transport system. Parameters were selected for assessing the sustainability of the transport system and significant factors affecting sustainability were determined. Parameters of the sustainability of the system when changes in the weather and road conditions affect vehicle operation were estimated on the basis of the simulation modeling. An integral indicator of sustainability was introduced to evaluate the sustainability of the transport flow management subsystem and the methodological approach to its calculation was substantiated. The results from changing the parameters of the traffic flow were demonstrated in the case of a significant amount of precipitation and the constraints put on the movement of vehicles on the road infrastructure unit due to snow-removal operations and road traffic accidents. Also, the parameters of road traffic under the reconstruction of the main street of regulated traffic into a street of uninterrupted traffic were presented.

1. Introduction

Transport services for the urban population is an important area of activity for municipal authorities. To this end, a transport system is formed which generally represents a coherent assembly of workers, vehicles and equipment, and elements of transport and transportation infrastructure, including a management system aimed at the efficient transportation of goods and passengers. A crucial function of the transport system is to meet the demands of the city residents and allow their unrestricted mobility. The transport system is part of a more complex life-support system of the city. At the same time, the transport system is a complex system in itself and includes several subsystems: urban passenger public transport, the route network, the street and road network, and the management of traffic lights These systems include elements such as intelligent transport systems, the traffic flow of light and heavy vehicles, and vehicles of individual owners, organizations, and taxi companies. An important factor affecting transport system operation is road safety. To achieve a high safety indicator, various measures are applied, including those related to the Internet of Things (IoT) [1,2,3], adaptive lighting control [4,5,6,7,8,9,10,11], etc.
Providing efficient transport services to the population with minimal budgetary costs is a highly relevant task. No less significant a task is meeting the demand for the movement of the city residents under conditions of temporary constraints or the cessation of both vehicular and pedestrian traffic [12,13,14,15].
Temporary limitations may be associated with adverse weather conditions, the construction and maintenance of roads, facilities associated with engineering infrastructure and capital construction, mass rallies and public events, and increased traffic during holidays.
A prediction algorithm is also used to estimate the effect of weather on many other types of human activity [16,17,18,19].
Reducing the impact of the negative consequences of temporary traffic constraints or reduced public transport services can be achieved in two ways: by creating a reserve for the transit and carrying capacity of the road network and by the prompt reorganization of traffic in the event of external disruptive factors.
Developing road infrastructure and increasing the capacity of the street-road network (through the reconstruction of streets of regulated traffic to the main streets of uninterrupted traffic) is one of the possible ways to improve the sustainability of the transport system.
Both of these approaches include a system of measures aimed at solving the problem. In order to determine the optimal solution and then form an appropriate system of measures, it is necessary to adequately assess changes in the state of the transport system, i.e., its sustainability, which is one of the most significant properties [20,21,22,23,24,25,26,27]. Sustainability is considered in relation to the system of urban public transportation, individual transportation providers, and municipal routes, as well as uneven spatial distribution of the severity of road accidents [28].
Sustainability as a characteristic of the transport system and its individual elements in relation to weather conditions was studied in References [29,30,31,32]. The application of “big data” and digital technologies in the urban transport system ensures a more accurate assessment of its performance [33]. Road traffic accidents and incidents on the roads have a significant impact on the short-term sustainability indicators of the urban transportation system [34,35,36,37]. Studies on the environmental assessment and justification of the methods for reducing emissions of CO2 and toxic substances within the exhaust gases of vehicles are also relevant [37,38,39,40,41,42,43,44,45,46,47].
The sustainability of the transport system can be enhanced by improving the adaptation properties of vehicles, as well as the choice of the rational application area of vehicles and vehicle brands and models most suitable to the specific operating conditions [48,49].
Implementation of the “Mobility as a Service (MaaS)” concept in cities is one method to improve the sustainability and efficiency of urban transport systems. It is crucial to take into account the interaction of different modes of transportation and types of transport in the formation of the transport supply [50,51,52].
The development of autonomous and self-driving vehicles will have a significant impact on the sustainability of the urban transport system in the future.
It was suggested in Reference [53] that sustainability should be considered instead of efficiency when choosing a road design, the cost of which would be justified by the efficient handling of accidents and other disruptions. Selecting appropriate indicators for sustainability assessment is a complex process [33], which determines the significance of research in this direction. The aim of this work is to develop an approach for assessing the sustainability of the urban transport system under varying weather, climate, and road conditions for vehicle operation.

2. Materials and Methods

The research was carried out in Tyumen—a transport hub as well as an important business and industrial center in Siberia, Russian Federation. Tyumen has a humid continental climate with warm, somewhat humid summers and long, cold winters.
The sustainability of the transport system was assessed with respect to the influence of the following factors:
  • amount and intensity of precipitation;
  • duration of road cleaning;
  • number of road sections with constraints or the cessation of vehicle traffic due to road traffic accidents.
These factors have an impact on variations in the operating conditions, which leads to changes in the traffic parameters.
The system theory and simulation modeling were applied in this work to study the transport system of the city. Simulation modeling was carried out using the PTV Vissim program. Vissim’s traffic flow model is a stochastic, timestep-based, microscopic model that treats driver-vehicle units as basic entities. The traffic flow model contains a psycho-physical car following a model for longitudinal vehicle movement and a rule-based algorithm for lateral vehicle movement. The models deployed are based on Wiedemann’s extensive research work [54].
The simulation model of the traffic was made for the main street of regulated traffic and had the following characteristics: the length of the highway in the main direction was 3.5 km, the length of all segments (road sections) in the model was 14 km, the number of traffic lanes was 6, the number of crossroads was 7, the number of traffic lights was 8, and the total number of vehicles in the system was 26,392 units. The total mileage of vehicles within the frame of modeling was 16,280 km.
The simulation period was taken to be equal to 1 h during the morning under the maximum load of the street-road network. For the vehicles that did not have enough time to enter the simulation area or finish their movement within it, the simulation time period was increased. This allowed the movement of all vehicles to be completed and meant that the traffic parameters could be obtained for different modeling scenarios with the same transport operation.
A linear object (part of the street) was simulated in the study with the detailing of each vehicle and pedestrian (micromodel). This type of modeling was chosen having taking into account the recommendations of certified experts on transport simulation in PTV Vision programs (developer PTV GROUP, Karlsruhe, Germany). It is critical that the micromodel be able to accept variable traffic parameters that correspond to different road and weather conditions. In macro models (for example, in the PTV Visum program) the standard parameters which correspond to normal weather conditions are usually applied, but these would not allow the research goal to be achieved. The composition of the fleet of vehicles was determined by video recording and counting the number of vehicles of different classes (cars and trucks, buses) at each crossroad.
When conducting the study during a period of snowfall, the minimum lateral separation distance for all types of vehicles (distance at rest), maximum visibility distances and limit of rear visibility, instantaneous speed on the selected road sections, and distance traveled by the vehicle at a constant speed mode, under acceleration and deceleration measurements, were performed on the approach to the crossroad, on the descent and entry onto the overpass, and on the road section with uninterrupted traffic. Based on the results of the measurements taken, the acceleration and deceleration of vehicles were calculated during start-up and braking. The speed value was read from the engine electronic control unit using special equipment.
The estimation of traffic parameters under adverse weather conditions was carried out after changing the values of the initial model parameters, which are given in Table 1.
The list of factors, important in assessing the sustainability of the transport system under varying weather, climate, and road conditions, as well as their weight, were determined on the basis of questionnaires and expert assessments. The expert team included researchers from Tyumen Industrial University, traffic police specialists in the Tyumen region, representatives of the enterprises of the transport complex, and the administration of Tyumen city.
The methodology proposed by the authors allows changes in the sustainability of the transport system to be assessed under different weather-climatic conditions. It is necessary to perform preliminary investigations, determine the values of the basic parameters on a small section of the road, and then apply the specified parameters to the simulation model.

3. Results

Investigations of the traffic management system as a subsystem of the urban transport system were carried out.
The system has a set of properties: organization, integrity, emergence, functionality, structural properties, sustainability, reliability, survivability, adaptability. The property of adaptability of the transport system in relation to the controlled crossroads was considered in Reference [55].
The state of the system is influenced by a large number of external and internal factors. With regard to the conditions of vehicle operation, external factors are generally divided into weather-climatic, road, and transport factors. These groups of factors have a significant effect on the efficiency of the transport system and its individual elements [56,57]. The degree of the factor impact on the transport system depends on the property being studied.
The main significant characteristics of the factors affecting the sustainability of the transport system include:
  • the duration of the disturbing factor’s influence on the system;
  • the strength of the factor;
  • the object of the negative effect of the factor (on the element of the system or relationship between the elements). The system is composed of interconnected elements. Disturbance of the equilibrium state of the system is caused by a factor’s influence on the elements or the breaking-down of the connection between them. This study considers the impact of a negative factor (snowfall) on road conditions (an element of the transport system).
By estimating the degree of the traffic parameters’ variation, one can speak of a change in the sustainability of the transport system. For example, snowfall affects the state of the carriage-way of the road. If there is snow cover on the road surface, the coefficient of tire adhesion to the supporting surface decreases from 0.7–0.8 to 0.2–0.3.
The value of the coefficient of tire adhesion to the road surface depends on the design and state of the tire tread; thus, this indicator cannot be taken into account when modeling. The influence of weather, climate, and road conditions for operation on the sustainability of the transport system reveals itself to the greatest extent in the autumn period with the first snowfall accompanied by a large amount of precipitation. During this period, many car owners are still using summer tires instead of winter tires. Under adverse road conditions the coefficient of adhesion of the summer tires to the road surface significantly reduces, reaching the value of 0.1 [58].
Under adverse road conditions, drivers usually act in two ways:
  • they decrease the maximum speed of the vehicle to reduce the length of the braking distance, or
  • they increase the distance between the moving car ahead to reduce the probability of collision of vehicles.
The influence of the maximum speed on the total travel time and average speed for an urban main street of regulated traffic is shown in Figure 1.
According to the experts’ conclusions made on the basis of the questionnaire, sustainability as a characteristic of the urban transport system is subject to changes in weather, climate, and road conditions for vehicle operation, including the impact of these changes on the route timetable, environmental safety of vehicle operation, accidents, and operating costs of the transport process. The system approach allows the consolidation of these heterogeneous factors for an integrated assessment.

3.1. Methodological Approach to Assessing the Sustainability of the Urban Transport System

To assess changes in the sustainability of the transport system in relation to traffic management, the authors propose the introduction of a traffic management coefficient KT, which characterizes the degree of increase in the total travel time under adverse climatic, road, or transport conditions in comparison with the standard conditions, given by Equation (1):
K T = t t ,
where t′ is the mean route travel time on route under adverse conditions (in minutes), while t is the mean route travel time on route under standard conditions (in minutes).
It is advisable in assessing changes in sustainability to take into account the impact of environmental degradation on the street-road network, especially in places with a large number of pedestrians (pedestrian crossings, stopping points).
To take into account the contribution of individual toxic substances to the total negative impact, their relative environmental hazard must be considered. This is taken into account when calculating damage De to the atmospheric air caused by toxic substances, emitted with the exhaust gases of vehicles (for example, according to the methodology proposed for Russia [59]), given by Equation (2):
D e = d · K e · J d · i = 1 N G i · K i
where d is an indicator of specific damage to the atmospheric air, caused by a mass unit of a toxic substance (in monetary unit/relative ton); Ke is the coefficient of environmental situation and ecological significance of the region; Jd is the index-deflator for the recalculation of specific damage from current prices to comparable ones; Gi is the actual mass of the i-th toxic substance emitted to the atmospheric air during the considered period of time ( intons); and Ki is an indicator of the relative environmental hazard of the i-th toxic substance, calculated as a quantity inversely proportional to the maximum allowable concentration of the i-th toxic substance (MACi) (in relative ton/ton).
To assess changes in the environmental sustainability of the transport system, the authors propose the introduction of a coefficient of environmental compatibility KE, which is determined by a relative change in the damage caused by toxic emissions, given by Equation (3):
K E = D e D e = N i = 1 G ´ i · K i N i = 1 G i · K i = G ´ G
where D e ´ ,   D e is the environmental damage to the atmospheric air, G i ´ , G i   is the actual mass of the i-th toxic substance entering the atmospheric air during the considered period of time, G ,   G is the equivalent mass of toxic emissions, taking into account the relative toxicity (in relative ton) when moving under adverse and standard conditions, respectively.
To account for the operating costs in assessing changes in the sustainability of the transport system, it is proposed to take into account the fuel consumption and its change under adverse conditions. For this purpose, the authors propose the introduction of a fuel efficiency coefficient, KQ, given by Equation (4):
K Q = Q Q ,
where ∑Q′ is the total fuel consumption of vehicles on the route or road segment considered when driving under adverse conditions (in liters), and ΣQ is the total fuel consumption of vehicles on the route or road segment considered when driving under standard conditions (in liters).
The fuel consumption in transport vehicles is directly proportional to the emissions of carbon dioxide in the process of operation, which makes it possible to assess changes in the sustainability of the transport system in terms of fuel efficiency, calculating the ratio of carbon dioxide emissions under adverse and standard weather conditions, given by Equation (5):
K Q = C O 2 C O 2 ,
where ∑СО2 is the total CO2 emissions emitted by all vehicles under adverse conditions (in tons), and ∑СО2 is the total CO2 emissions emitted by all vehicles under standard conditions (in tons).
Thus, Equations (4) and (5) can be used to calculate KQ depending on the type of source information available (fuel consumption, CO2 emissions).
To take into account socioeconomic factors, it is proposed to apply a traffic safety factor KMVC. The coefficient shows how many times the number of accidents on a given section of the road network increases under adverse road conditions in comparison with the standard conditions, given by Equation (6):
K M V C = N M V C N M V C ,
where N M V C   is the number of motor vehicle collisions (MVCs), or road incidents, on the road network section under adverse conditions (in units), and NMVC is the number of MVCs, or road incidents, on the road network section under standard conditions (in units).
The authors suggest that a change in transport system sustainability can be estimated using an integral indicator of sustainability, K, taking into account the weight of each factor λi (0 ≤ λi ≤ 1;   i = 1 N λ i = 1 ), which is evaluated by the coefficient Ki, as given by Equation (7):
K = i = 1 n K i · λ i = λ T · K T + λ E · K E + λ Q · K Q + λ M V C · K M V C ,
where n is the number of criteria involved in the evaluation. λi may vary for different municipalities and can be determined by the method of expert assessments considering the research purpose.

3.2. Assessment of Changes in the Sustainability of the Transport System of Tyumen City under Changes in Weather, Climate, and Road Conditions for Vehicle Operation

The proposed approach was tested in assessing changes in the sustainability of the transport system of the main street of regulated traffic of Tyumen city (Russia).
According to the results of the expert evaluation, the traffic management coefficient KT has the greatest weight under the conditions considered. This is determined by the significant problems in the organization of transport services for the population, insufficient road capacity, and the poor quality of public transport operation. After relevant improvements to the transport system have been implemented, the further efforts of specialists can be concentrated on reducing the number of road accidents, fuel consumption, and emissions of harmful substances with exhaust gases of vehicle internal combustion engines (ICEs). The value of the weight coefficient λT might decrease in the future and the values of the λE and λQ coefficients might increase.
When assessing the changes in the sustainability of the transport system, the traffic safety factor KMVC was not taken into account because, according to the experts’ opinion, its contribution to the integral indicator of sustainability in Tyumen is negligible, when considering the experience of driving in adverse weather conditions for most local drivers. Under adverse weather conditions, as a rule, drivers operate their vehicles more carefully. This is confirmed by statistics on the number of road accidents per month of the year, presented in Table 2. As can be seen from the data presented, in three of the four winter months the number of road accidents is less than the average annual values. An increase in values observed in December is due to a significant increase in traffic intensity (the number of trips) during winter holidays.
The criterion of fuel efficiency KQ was calculated from the change in fuel consumption. The integral indicator of sustainability, taking into account the weight of the factors, can be calculated by Equation (8):
  K = 0.85 · K T + 0.05 · K E + 0.1 · K Q

3.2.1. Change in the Road Traffic Parameters in the Case of Precipitation When a Large Amount Falls within a Short Period of Time

In the case of precipitation, when a large amount falls within a short period of time, the road conditions for vehicle operation become significantly worse. In winter, in the cold-temperate climatic zone (the Tyumen conditions), precipitation is characterized by several indicators:
  • the average decadal height of the snow cover is 38 cm;
  • the maximum decadal height of the snow cover is 63 cm;
  • the number of days in a year with snow cover is 161 days;
  • the number of days in the winter with solid precipitation is 67 days, including 10.6 days in November, 15.3 days in December, and 13.0 days in January [60].
The amount of precipitation for the period November–March in Tyumen is 107 mm. If an amount of precipitation in the range of 7 to 19 mm falls within 12 h (from 7 to 19 cm of snow), the weather conditions are considered to be difficult, with a precipitation amount of more than 20 mm indicating extremely difficult conditions.
The results of the traffic modeling under conditions of heavy snowfall and the surface of the road having freshly fallen, unconsolidated snow with a thickness of more than 7 cm are given in Table 3.
The results presented show that when the highway capacity decreases due to worsening road conditions caused by snowfall, the traffic parameters become worse. Under such conditions the average delay time increased by 23%, the average speed decreased by 17%, and the value of the traffic management coefficient KT was equal to 1.21.
The delay time of vehicles waiting for entry increased by 63%, which demonstrates deterioration in the traffic quality.
Under worsening road conditions, the fuel consumption of vehicles and the amount of emissions of harmful substances with exhaust gases of vehicle ICEs increase. This is due to an increase in the number of stops and traffic non-uniformity. The time when vehicles move in an unsteady mode of operation also increases.
In the simulations, the emissions of carbon monoxide (CO), nitrogen oxides (NOx), and volatile organic compounds (VOC) were taken into account. The indicators of relative hazard Ki (in relative ton/ton) of the specified pollutants were assumed to be equal to 0.4 for CO, 16.5 for NOx, and 0.7 for VOC, respectively [59]. The relevant role of NOx has also been confirmed in the latest literature. The influence of different regimes on the emissions of individual pollutants was ignored, which reduced the reliability of the estimation, but at the same time increased the availability of the method since there was no requirement for additional voluminous information for calculations. By taking into account this simplification, the change in emissions of all substances and the reduced mass of emissions with regard to their relative hazard will directly correlate with fuel consumption.
The values of fuel consumption and mass of emissions under different road conditions are given in Table 4.
If the road conditions worsen, these values increase by 13.8%. The values of the coefficients KQ and KE are equal to 1.14. The value of the integral indicator of sustainability K is equal to 1.2. A minor difference between the value of the integral indicator and the value of the partial coefficient of sustainability by the traffic management criterion is due to the highest weight value of this indicator being equal to 0.85.
Decreasing the speed value under worsening road conditions leads to an increase in the travel time. Consequently, the value of the sustainability coefficient of the system increases, which indicates deterioration in the quality of transport services for the city’s population.

3.2.2. Change in the Road Traffic Parameters during Snow-Removal Operations

The primary snow removal operations include treatment using anti-icing materials, shoveling and sweeping snow, and forming a snow bank for subsequent removal. The secondary operations consist of removal of snow, chipping ice, and the removal of snow-ice formations.
In the case of a large amount of precipitation, there can be a situation where a considerable period of time elapses between the operations of the first and second stages. This is typical for cities where there is not enough equipment for snow removal (dump trucks, loading and unloading machinery) and its disposal (snow melting units).
After carrying out technological operations of the first stage, the snow bank remains at the edge of the roadway until the moment of snow removal. The snow bank can reach 20–60 cm in height and 100–150 cm in base width. For urban roads with a lane width of 3–3.25 m, this can result in the actual cessation of traffic on the rightmost lane. This leads to a decrease in the capacity of the road sections with the snow bank formed. When the transport demand exceeds the capacity, transport congestion occurs and the traffic parameters worsen.
When creating a simulation model of the road traffic during the snow-removal period, the following assumptions were made:
  • the rightmost lane of the road in the main direction is occupied by a snow bank and special snow-removing equipment for its loading and removal,
  • the gap in the snow bank begins 50 m before the crossroad and ends 50 m after the crossroad.
If the gap in the snow bank before the crossroad turns out to be smaller, then the parameters of the traffic flow become significantly worse.
The change in the parameters of the traffic flow in the presence of a snow bank on the main street is given in Table 5.
With a decrease in the road capacity due to the snow bank formed on the rightmost lane, the traffic parameters became considerably worse. Under such conditions, the mean delay time increased by 55%, the average speed reduced by 31%, and the delay time of vehicles waiting for entry increased by 274%. This characterizes a significant deterioration in the quality of traffic.
The calculated value of the traffic management coefficient KT was equal to 1.44.
The values of the indicators presented in Table 3 and Table 5 characterize the simulated system as a whole. On some sections of the street-road network, changes in the indicators can be even more significant. For instance, in the model of the street of regulated traffic with the presence of a snow bank on the carriageway, the decrease in the average speed in the main direction was 49%.
With the road conditions worsening and the presence of the snow bank on the road, fuel consumption and the amount of emissions of harmful substances from the exhaust gases of motor vehicles increased by 26% (Table 6).
The value of the coefficients KQ and KE was 1.26. The value of the integrated coefficient of the transport system sustainability K was 1.41.
In the subsequent assessment, the simulation object considered was transformed into a main street of uninterrupted traffic. The separation of transport and pedestrian flows in space was achieved through the creation of two road junctions, a tunnel, and four aboveground as well as one underground pedestrian crosswalks. The traffic flow parameters for this model and their comparison are given in Table 7.
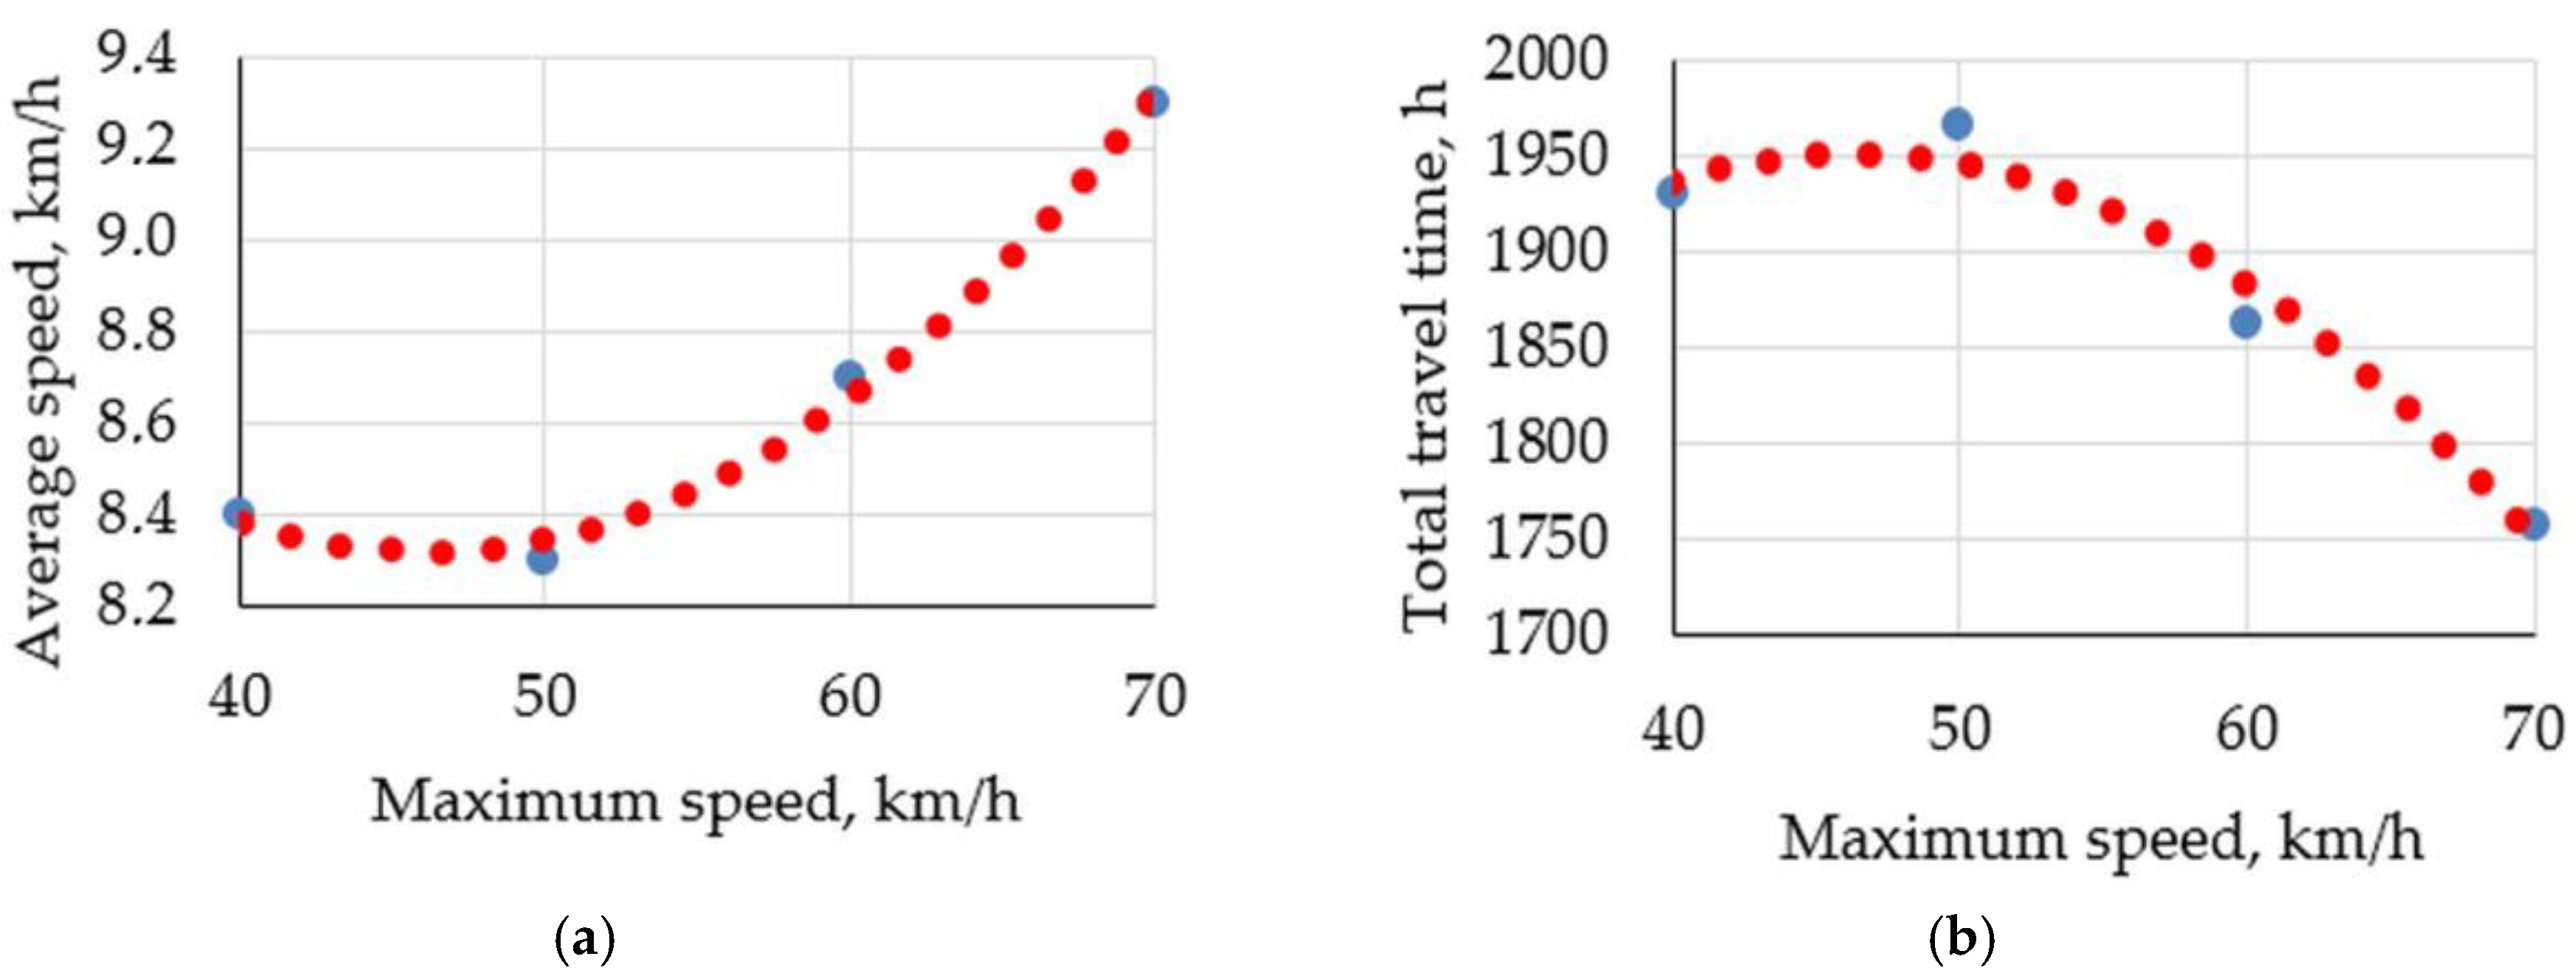
Parameters of the traffic flow in the model of the street of uninterrupted traffic were substantially improved: the average speed increased by 171% and the total travel time was reduced by 43%. This allows the basic values of the indicators in Equations (1)–(6) to be reduced.
Changes in the traffic flow parameters for adverse weather and road conditions along the main street of uninterrupted traffic are given in Table 8.
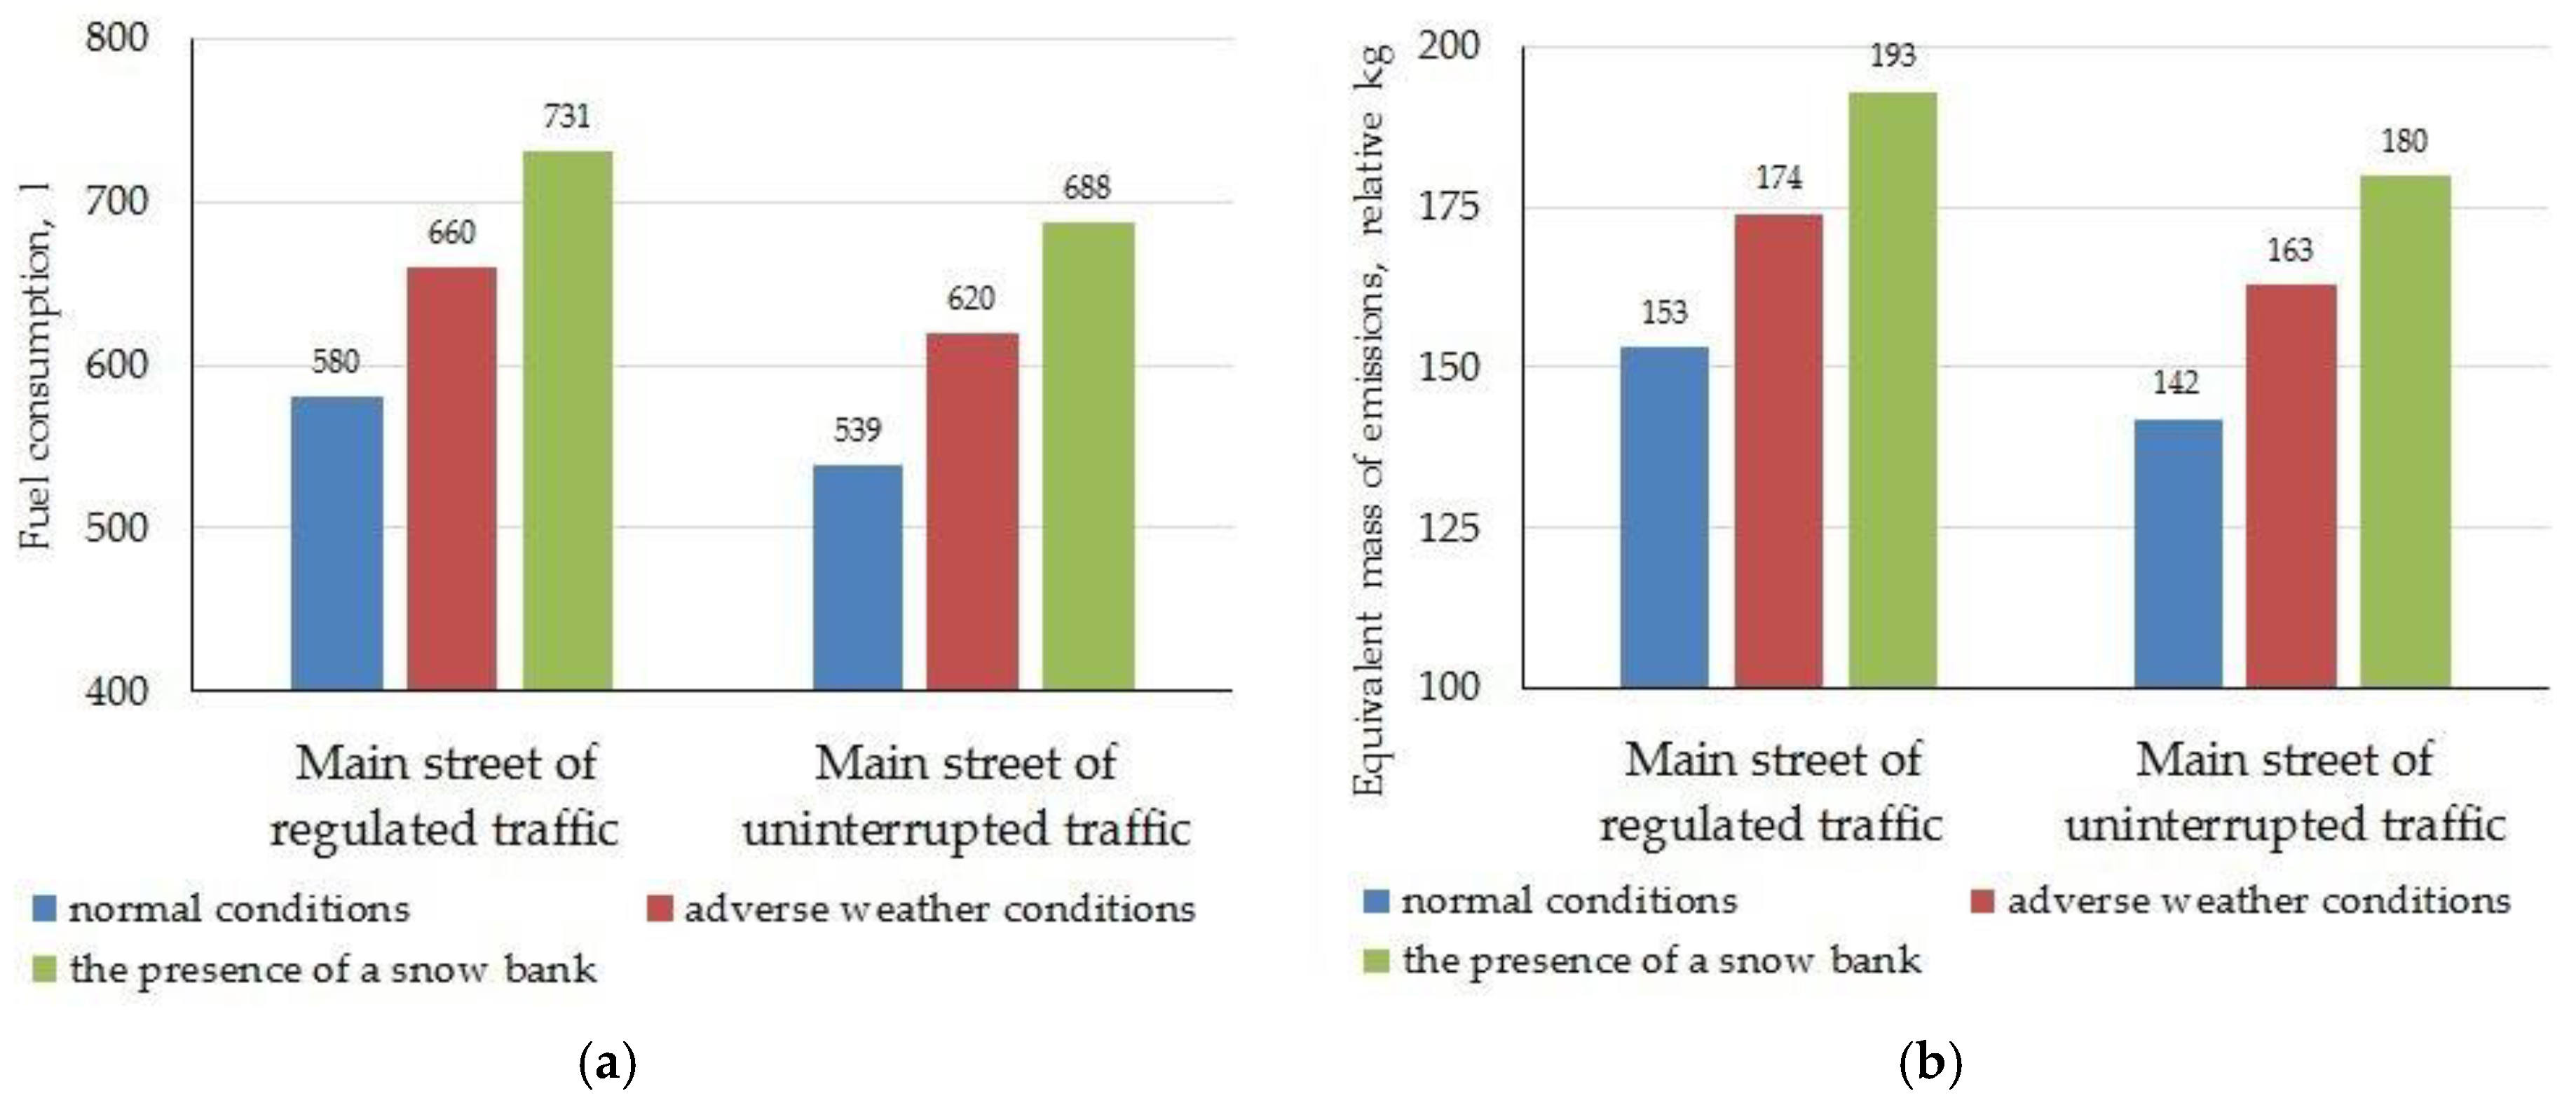
The parameters of traffic flow, fuel economy, and environmental compatibility under adverse weather and road conditions for the model of the main street of uninterrupted traffic are much better than those in the model of the street of regulated traffic, even under normal conditions. Figure 2 presents the examples of fuel efficiency and the environmental compatibility for the street of uninterrupted traffic under various operating conditions in comparison with the street of regulated traffic.
The influence of adverse weather, climate, and road conditions of operation on the parameters of the traffic flow for the main street of uninterrupted traffic will be less than that for the main street of regulated traffic. The indicator of sustainability of the transport system KT under worsening road conditions is 1.04 (for the regulated main street it is 1.22), while in the presence of a snow bank it is 1.41 (for the regulated main street it is 1.44).
Increasing the sustainability of the transport system in adverse weather conditions is possible by reducing the number of trips made by residents of the city in private vehicles and using the route transport. At the same time, the sustainability of the public transport system also significantly changes. Because it is not possible to increase the carrying capacity of public transport during such periods, the quality of passenger transportation and travel comfort significantly decrease.
The development of road infrastructure helps to ensure the sustainability of the transport system in the event of road accidents and incidents. In this study, the traffic flow was simulated after an accident (a collision of two cars on the approach to the crossroad at a distance of 10 m from the stop line in the center of the simulation model) within one lane using two variants: the main street of regulated and uninterrupted traffic under normal weather conditions.
After the accident, the parameters of the traffic flow on the main street of uninterrupted traffic will be better than when driving on the main street of regulated traffic without an accident (Table 9). 
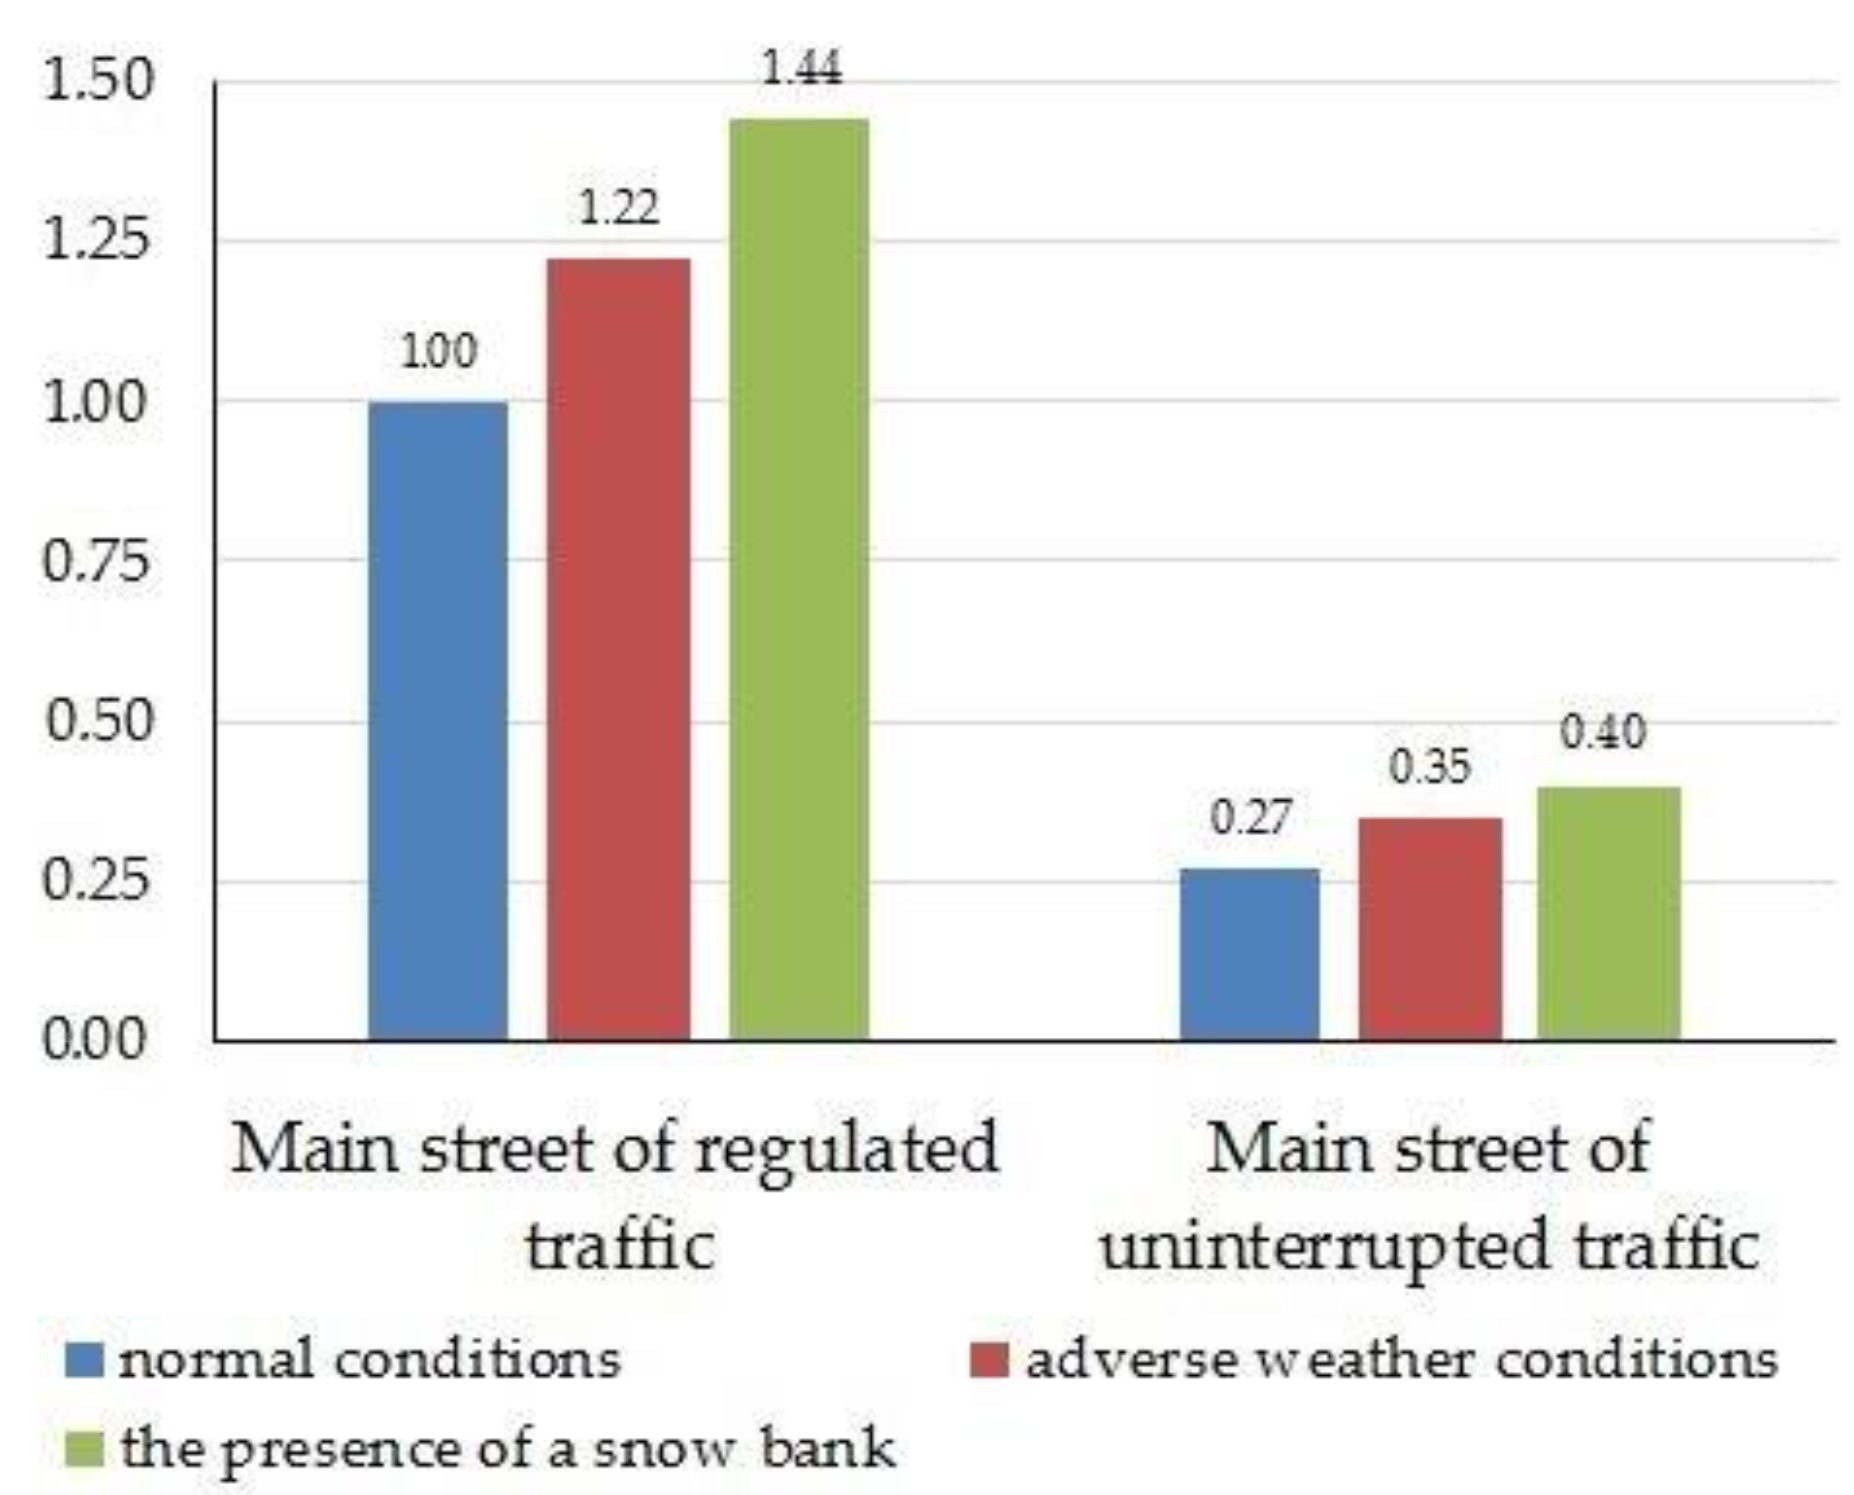
Figure 3 shows how many times the integral indicator of sustainability varies under different weather-climatic and road conditions in comparison with the initial value of the indicator. The indicator value for the main street of regulated traffic under normal weather conditions corresponds to 1.
Thus, the development of road infrastructure allows the sustainability of the transport system to be improved. Increasing the sustainability of the transport system, including creating a main street of uninterrupted traffic and increasing the capacity of the road, allows the introduction of measures to improve road safety (reducing the speed of traffic, preventing vehicles from moving into the lane of oncoming traffic, preventing the intersection of the trajectory of vehicles and pedestrians). The properties of sustainability and safety are interrelated and their joint development generates a synergistic effect.
The measures of rapid response of municipal authorities and traffic police that degrade the sustainability of the urban transport system include:
  • the identification of places and the installation of traffic signs with variable information;
  • the prompt change of the road traffic organization scheme by the traffic police;
  • the prompt change of operating modes of traffic signal installations on the sections of the street-road network with the greatest load;
  • the restriction of entry to certain areas;
  • the introduction of additional trips of scheduled passenger transport, or the adjustment of public transport timetables.
For a combination of these measures, the share of each measure in the plan is expedient to determine taking into account the predicted value of the system sustainability factor. Choosing a complex of effective measures will reduce the negative impact of adverse external factors on the urban transport system.

4. Discussion

As reported in a number of studies [61,62,63,64,65], in order to increase the sustainability of the transport system, the recommended measures include: reducing the number of trips taken by private transport, promoting the more extensive use of bicycles and public transport, and promoting taxis, car-sharing, and pedestrian movements. This concept has found wide application in most cities of the world and its implementation ensures the availability of transport, its ongoing safety, and a reduction in negative impacts on the environment. The results obtained by the authors supplement these conclusions with reference to the operation of the transport system under adverse weather conditions, as illustrated in Figure 2.
The influence of the transport flow on the environment was considered in Reference [61]; however, the authors did not take into account the travel time. An advantage of the presented study is the analysis of linkages between emissions into the atmosphere due to an increase in the amount of fuel consumed and the travel time. Unusual weather conditions further increase the amount of emissions of harmful substances, since, at the same distance, the travel time increases due to a decrease in the average speed.
Reference [62] considered the actual change in transport demand on the road with a road load factor of less than one (1). Our investigations were carried out at the maximum intensity of movement during the day under normal and adverse weather conditions. In both cases, the value of transport demand was assumed to remain constant. However, due to a decrease in the capacity of the road in the case of snowfall, the value of the road load factor increased and became more than one. Compared to Reference [61], in which the assessment of the degree of change in the transport demand was also carried out, in the presented study additional important information was obtained: the transport supply was evaluated relative to the transport demand under adverse weather conditions. In contrast to Reference [63], the present study did not take into account the transport mode distribution depending on the travel length, because the object of study is one of the subsystems of the city’s transport system—transport flow management. Studies on changes in the distribution of the number of trips made by different ways and modes of transportation, taking into account weather conditions, are very topical. For instance, in Siberia in winter, the choice of transportation mode depends on the air temperature. Residents of cities choose transport with comfortable conditions and abstain from walking or cycling.
In Reference [64], for the selection of measures for the development of the urban transport system, three categories of indicators of a sustainable transport system were offered, which were characterized by the possibility of use: A—in almost all situations, B—if necessary/possible; C—in the case when specific social needs arise.
This study demonstrated the changes in sustainability of the system under the influence of adverse weather conditions, which are typical for both Western Siberia and other northern regions.
The term sustainability has several definitions [64,65,66], since it is applied in different fields of science and technology for various technical and social systems. In addition, the definition of the term sustainability depends on the stage of the lifecycle of the system. When using the term sustainability with regard to the impact of weather conditions on the urban transport system, the authors based their discussion on the following considerations:
  • The main emphasis in the study is given to the change in the parameters of traffic in adverse weather and climate conditions. These conditions are supposed to be disruption factors. The ability of the system to resist changes under the influence of disruption factors determines its sustainability.
  • If the weather conditions worsen, the system’s sustainability and effectiveness are degraded.
  • Dealing with adverse weather conditions allows an improvement of sustainability.
  • The development of the street and road network is only one of the possible measures to increase sustainability. Other activities can include improving the route network and increasing the number of public transport vehicles, introducing parking fees and increasing existing fees, adopting the use of remotely controlled vehicles, introducing smart transport systems, and many others [55].
Further studies could be directed at obtaining correcting coefficients for mathematical models of traffic parameters under adverse weather and climate conditions. Models of parameter determination are widely used in software complexes for transport planning and simulation. However, in some programs weather conditions are not considered and in some programs they are underestimated. The inclusion of correcting factors that take into account weather conditions in such models would improve the simulation accuracy for the operational management of transport flows.

5. Conclusions

Theoretical and experimental studies carried out by the authors on the influence of weather, climate, and road conditions for vehicle operation on the sustainability of the transport system made it possible to formulate recommendations for its improvement. With worsening weather conditions and during snow-removal operations, the sustainability of the urban transport system was found to have deteriorated substantially. Developing road infrastructure and increasing the capacity of highways can improve the sustainability of the transport system and reduce the negative consequences of adverse weather and road conditions. The simulation model of traffic developed makes it possible to determine the parameters of the traffic flow under adverse weather conditions and inform the city residents about the predicted time for a trip to the city center. The simulation allows one to determine the maximum number of vehicles in a transport system, which, if exceeded, would lead to a traffic collapse in the urban system. These results are necessary to inform drivers about the traffic situation and adjust an intelligent transport system, in particular when imposing restrictive measures on the traffic to the central part of the city and choosing measures to improve the sustainability of the urban passenger transport system.

Author Contributions

Investigation, D.Z.; methodology, E.M.; validation, E.C.R. D.Z., E.M., and E.C.R. developed the hypothesis and theoretical part of the study, analyzed the results of the study, and wrote the text of the paper. D.Z. developed a simulation model of the traffic flow and conducted experimental studies.

Funding

This research received no external funding.

Acknowledgments

The work was supported by the Act 211 of the Russian Federation Government, contract No. 02.A03.21.0006.

Conflicts of Interest

The authors declare no conflict of the interests.

References

  1. Satrya, G.B.; Reda, H.T.; Kim, J.W.; Daely, P.T.; Shin, S.Y.; Chae, S. IoT and public weather data based monitoring & control software development for variable color temperature LED street lights. Int. J. Adv. Sci. Eng. Inf. Technol. 2017, 7, 366–372. [Google Scholar] [CrossRef]
  2. Masek, P.; Masek, J.; Frantik, P.; Fujdiak, R.; Ometov, A.; Hosek, J.; Andreev, S.; Mlynek, P.; Misurec, J. A harmonized perspective on transportation management in smart cities: The novel IoT-driven environment for road traffic modeling. Sensors (Switzerland) 2016, 16, 1872. [Google Scholar] [CrossRef] [PubMed]
  3. Asensio, Á.; Blanco, T.; Blasco, R.; Marco, Á.; Casas, R. Managing emergency situations in the smart city: The smart signal. Sensors (Switzerland) 2015, 15, 14370–14396. [Google Scholar] [CrossRef] [PubMed]
  4. Todorović, B.M.; Samardžija, D. Road lighting energy-saving system based on wireless sensor network. Energy Effic. 2017, 10, 239–247. [Google Scholar] [CrossRef]
  5. Sharmitha, D.; Maithili, P. Solar powered intelligent street lighting system for highway application. Int. J. Pure Appl. Math. 2017, 116, 151–160. [Google Scholar] [CrossRef]
  6. Ramadhani, F.; Bakar, K.A.; Hussain, M.A.; Erixno, O.; Nazir, R. Optimization with traffic-based control for designing standalone streetlight system: A case study. Renew. Energy 2017, 105, 149–159. [Google Scholar] [CrossRef]
  7. Leccese, F.; Leonowicz, Z. Intelligent wireless street lighting system. In Proceedings of the 2012 11th International Conference on Environment and Electrical Engineering, Venice, Italy, 18–25 May 2012; Art. No. 6221515. pp. 958–961. [Google Scholar] [CrossRef]
  8. Shahzad, G.; Yang, H.; Ahmad, A.W.; Lee, C. Energy-Efficient Intelligent Street Lighting System Using Traffic-Adaptive Control. IEEE Sens. J. 2016, 16, 5397–5405. [Google Scholar] [CrossRef]
  9. Leccese, F.; Cagnetti, M.; Trinca, D. A smart city application: A fully controlled street lighting isle based on Raspberry-Pi card, a ZigBee sensor network and WiMAX. Sensors (Switzerland) 2014, 14, 24408–24424. [Google Scholar] [CrossRef] [PubMed]
  10. Kul, B. IoT-GSM-based high-efficiency LED street light control system (IoT-SLCS). In Proceedings of the 2017 XXVI International Scientific Conference Electronics (ET), Sozopol, Bulgaria, 11–15 September 2017; pp. 1–5. [Google Scholar] [CrossRef]
  11. Soares, G.M.; Almeida, P.S.; Braga, H.A.C. A Fully Digital Smart LED Luminaire with Remote Management and Embedded Power Quality Analysis System. J. Control Autom. Electr. Syst. 2017, 28, 644–653. [Google Scholar] [CrossRef]
  12. Solodkij, A.; Gorev, A. System approach to elimination of traffic jams in large cities in Russia. World Appl. Sci. J. 2013, 23, 1112–1117. [Google Scholar] [CrossRef]
  13. Zyryanov, V.; Keridi, P.; Guseynov, R. Traffic modelling of network level system for large event. In Proceedings of the 16th World Congress on Intelligent Transport Systems and Services, Stockholm, Sweden, 21–25 September 2009; Transportation Research Board: Washington, DC, USA, 2009. Code 117201. [Google Scholar]
  14. Zhankaziev, S. Current trends of road-traffic infrastructure development. Transp. Res. Procedia 2017, 20, 731–739. [Google Scholar] [CrossRef]
  15. Zhankaziev, S.V.; Novikov, A.N.; Vorobyev, A.I.; Kulev, A.V.; Morozov, D.Y. Efficiency of operation and functioning of the system of an indirect transport flow regulation and control. Int. J. Appl. Eng. Res. 2017, 12, 3645–3652. [Google Scholar]
  16. Rojek, I. Models for better environmental intelligent management within water supply systems. Water Resour. Manag. 2014, 28, 3875–3890. [Google Scholar] [CrossRef]
  17. Ilić, S.; Selakov, A.; Vukmirović, S.; Erdeljan, A.; Kulić, F. Short-term load forecasting in large scale electrical utility using artificial neural network. J. Sci. Ind. Res. 2013, 72, 739–745. [Google Scholar]
  18. Ilić, S.A.; Vukmirović, S.M.; Erdeljan, A.M.; Kulić, F.J. Hybrid artificial neural network system for short-term load forecasting. Therm. Sci. 2012, 16 (Suppl. 1), S215–S224. [Google Scholar] [CrossRef]
  19. Caciotta, M.; Giarnetti, S.; Leccese, F. Hybrid neural network system for electric load forecasting of telecomunication station. In Proceedings of the 19th IMEKO World Congress, Lisbon, Portugal, 6–11 September 2009; Volume 1, pp. 586–590. [Google Scholar]
  20. Genon, G.; Panepinto, D.; Viggiano, F.; Magaril, E.; Abrzhina, L.; Magaril, R. Sustainability in automotive transport: Russian and Italian experience concerning actual situation and intervention tools. Int. J. Sustain. Dev. Plan. 2016, 11, 603–615. [Google Scholar] [CrossRef] [Green Version]
  21. Shen, L.; Yang, X.; Du, X.; Wang, J.; Hao, J. Sustainable strategies for transportation development in emerging cities in China: A simulation approach. Sustainability (Switzerland) 2018, 10, 844. [Google Scholar] [CrossRef]
  22. Barcellos de Paula, L.; Marins, F.A.S. Algorithms applied in decision-making for sustainable transport. J. Clean. Prod. 2018, 176, 1133–1143. [Google Scholar] [CrossRef]
  23. Venter, C.; Jennings, G.; Hidalgo, D.; Valderrama Pineda, A.F. The equity impacts of bus rapid transit: A review of the evidence and implications for sustainable transport. Int. J. Sustain. Transp. 2018, 12, 140–152. [Google Scholar] [CrossRef]
  24. Reyes-Rubiano, L.S. Sustainable Urban Freight Transport: A Simheuristic Approach. In Proceedings of the 2017 Winter Simulation Conference (WSC), Las Vegas, NV, USA, 3–6 December 2018; Volume Part F134102, pp. 4620–4621, Code 134102. [Google Scholar] [CrossRef]
  25. Currie, G.; De Gruyter, C. Exploring links between the sustainability performance of urban public transport and land use in international cities. J. Transp. Land Use 2018, 11, 325–342. [Google Scholar] [CrossRef]
  26. Qian, Y.; Ding, L.; Wang, W.; Qiao, G. Green Level and Sustainability Evaluation With Bus Enterprises. In CICTP 2017: Transportation Reform and Change—Equity, Inclusiveness, Sharing, and Innovation, Proceedings of the 17th COTA International Conference of Transportation Professionals 2017, Shanghai, China, 7–9 July 2017; pp. 3032–3041. [Google Scholar]
  27. Basbas, S.; Papanikolaou, A. Evaluation of a sustainable urban transport system through the use of the transecon methodology. Int. J. Sustain. Dev. Plan. 2009, 4, 18–34. [Google Scholar] [CrossRef]
  28. Petrov, A.; Petrova, D. Assessment of spatial unevenness of road accidents severity as instrument of preventive protection from emergency situations in road complex. IOP Conf. Ser. Mat. Sci. 2016, 142, 012116. [Google Scholar] [CrossRef]
  29. Dinesh, M.; Geetam, T. Sustainable transport systems: Linkages between environmental issues, public transport, non-motorised. Econ. Political Wky. 1999, 34, 1589–1596. [Google Scholar]
  30. Keay, K.; Simmonds, I. The association of rainfall and other weather variables with road traffic volume in Melbourne, Australia. Accid. Anal. Prev. 2005, 37, 109–124. [Google Scholar] [CrossRef] [PubMed]
  31. Koetse, M.J.; Rietveld, P. The impact of climate change and weather on transport: An overview of empirical findings. Transp. Res. D Transp. Environ. 2009, 14, 205–221. [Google Scholar] [CrossRef]
  32. Rakha, H.; Farzaneh, M.; Arafeh, M.; Hranac, R.; Sterzin, E.; Krechmer, D. Empirical Studies on Traffic Flow in Inclement Weather; Final Report—Phase I; U.S. Department of Transportation: Washington, DC, USA, 2007; FHWA-HOP-07-073. [Google Scholar]
  33. Cottrill, C.D.; Derrible, S. Leveraging big data for the development of transport sustainability indicators. J. Urban Technol. 2015, 22, 45–64. [Google Scholar] [CrossRef]
  34. Edwards, J.B. Weather-related road accidents in England and Wales: A spatial analysis. J. Transp. Geogr. 1996, 4, 201–212. [Google Scholar] [CrossRef]
  35. Edwards, J.B. The relationship Between Road Accident Severity and Recorded Weather. J. Saf. Res. 1998, 29, 249–262. [Google Scholar] [CrossRef]
  36. Torretta, V.; Rada, E.C.; Schiavon, M.; Viotti, P. Decision support systems for assessing risk involved in transporting hazardour materials: A review. Saf. Sci 2017, 92, 1–9. [Google Scholar] [CrossRef]
  37. Ciuta, S.; Schiavon, M.; Chistè, A.; Ragazzi, M.; Rada, E.C.; Tubino, M.; Badea, A.; Apostol, T. Role of feedstock transport in the balance of primary PM emissions in two case-studies: RMSW incineration vs. sintering plant. UPB Sci. Bull. Ser. D 2012, 74, 211–218. [Google Scholar]
  38. Schiavon, M.; Redivo, M.; Antonacci, G.; Rada, E.C.; Ragazzi, M.; Zardi, D.; Giovannini, L. Assessing the air quality impact of nitrogen oxide and benzene from road traffic and domestic heating and the associated cancer risk in an urban area of Verona (Italy). Atmos. Environ. 2015, 120, 234–243. [Google Scholar] [CrossRef]
  39. Chainikov, D.; Chikishev, E.; Anisimov, I.; Gavaev, A. Influence of Ambient Temperature on the CO2 Emitted with Exhaust Gases of Gasoline Vehicles. In Innovative Technologies in Engineering, VII International Scientific Practical Conference. Conference Proceedings; National Research Tomsk Polytechnic University: Tomsk, Russia, 2016; Volume 142, p. 12109. [Google Scholar] [CrossRef]
  40. Magaril, E. Increasing the efficiency and environmental safety of vehicle operation through improvement of fuel quality. Int. J. Sustain. Dev. Plan. 2015, 10, 880–893. [Google Scholar] [CrossRef] [Green Version]
  41. Magaril, E.; Magaril, R.; Abrzhina, L. Environmental Assessment of the Measures Increasing the Sustainability of Motor Transport. IOP Conf. Ser. Earth Environ. Sci. 2017, 72, 012003. [Google Scholar] [CrossRef]
  42. Stroe, C.-C.; Panaitescu, V.N.; Ragazzi, M.; Rada, E.C.; Ionescu, G. Some considerations on the environmental impact of highway traffic. Rev. Chim. 2014, 65, 152–155. [Google Scholar]
  43. Magaril, E.; Abrzhina, L.; Belyaeva, M. Environmental damage from the combustion of fuels: Challenges and methods of economic assessment. WIT Trans. Ecol. Environ. 2014, 190, 1105–1115. [Google Scholar] [CrossRef]
  44. Magaril, E.; Magaril, R. Fuel quality: Challenges to the sustainable development of automobile transport and approach to solution. E3S Web Conf. 2016, 6, 03001. [Google Scholar] [CrossRef]
  45. Boulter, P.G.; Latham, S. Emissions Factors 2009: Report 5—A Review of the Effects of Fuel Properties on Road Vehicle Emissions; TRL Report PPR358; TRL Limited: Wokingham, UK, 2009. [Google Scholar]
  46. Ionescu, G.; Apostol, T.; Rada, E.C.; Ragazzi, M.; Torretta, V. Critical analysis of strategies for PM reduction in urban areas. UPB Sci. Bull. Ser. D Mech. Eng. 2013, 75, 175–186. [Google Scholar]
  47. Pearson, R.J.; Turner, J.W.G. Using alternative and renewable liquid fuels to improve the environmental performance of internal combustion engines: Key challenges and blending technologies. In Alternative Fuels and Advanced Vehicle Technologies for Improved Environmental Performance. Towards Zero Carbon Transportation; Folkson, R., Ed.; Woodhead Publishing Ltd.: Cambridge, UK, 2014; pp. 52–89. ISBN 978-085709522-0. [Google Scholar] [CrossRef]
  48. Anisimov, I.A.; Magaril, E.R.; Magaril, R.Z.; Chikishev, E.M.; Chainikov, D.A.; Gavaev, A.S.; Ertman, S.A.; Ertman, J.A.; Ivanov, A.S. Improving vehicle adaptability to the operating conditions of «Smart» cities in the Northern regions. E3S Web Conf. 2016, 02003. [Google Scholar] [CrossRef]
  49. Anisimov, I.; Ivanov, A.; Chikishev, E.; Chainikov, D.; Reznik, L. Assessment of gas cylinder vehicles adaptability for operation at low ambient temperature conditions. WIT Trans. Ecol. Environ. 2014, 190, 685–695. [Google Scholar] [CrossRef]
  50. Noy, K.; Givoni, M. Is ‘smart mobility’ sustainable? Examining the views and beliefs of transport's technological entrepreneurs. Sustainability 2018, 10, 422. [Google Scholar] [CrossRef]
  51. Disney, J.; Rossiter, W.; Smith, D.J. Nottingham Express Transit: The role of green innovation in the drive for sustainable mobility through improved public transport. Int. J. Entrep. Innov. 2018, 19, 56–68. [Google Scholar] [CrossRef]
  52. Errampalli, M.; Chalumuri, R.S.; Nath, R. Development and evaluation of an integrated transportation system: A case study of Delhi. Proc. Inst. Civ. Eng. Transp. 2018, 171, 75–84. [Google Scholar] [CrossRef]
  53. Ganin, A.A.; Kitsak, M.; Marchese, D.; Keisler, J.M.; Seager, T.; Linkov, I. Resilience and efficiency in transportation networks. Sci. Adv. 2017, 3, e1701079. [Google Scholar] [CrossRef] [PubMed] [Green Version]
  54. PTV. 2017 PTV AG, VISSIM 10.06 User Manual; PTV: Karlsruhe, Germany, 2017.
  55. Ertman, S.; Ertman, J.; Zakharov, D. Adaptation of urban roads to changing of transport demand. E3S Web Conf. 2016, 6, 01013. [Google Scholar] [CrossRef] [Green Version]
  56. Abouhassan, M. Urban Transport System Analysis. WIT Trans. Built Environ. 2018, 176, 57–68. [Google Scholar] [CrossRef]
  57. Hurdle, V.F.; Merlo, M.I.; Robertson, D. Study of speed-flow relationships on individual freeway lanes. Transp. Res. Rec. 1997, 1591, 7–13. [Google Scholar] [CrossRef]
  58. Pauwelussen, J.P. Essentials of Vehicle Dynamics; Butterworth-Heinemann: Oxford, UK, 2015; pp. 7–74. ISBN 978-0-08-100036-6. [Google Scholar]
  59. Vershkov, L.V.; Groshev, V.L.; Gavrilov, V.V. Prevented Environmental Damage Identification Methodology; (main editor Chair of the State Committee for Environmental Protection Danilov-Danilyan, V.I); State Committee for Environmental Protection: Moscow, Russia, 1999. (In Russian) [Google Scholar]
  60. GOST 16350: USSR Climate Zoning and Statistical Parameters of Climatic Factors for Technical Purposes; Approved by the Resolution of the USSR State Committee on Standards on December 17, 1980, No. 5857. Moscow, 1985. As amended on December 21, 2017; Gosudarstvennye Standarty State Standard GOST: Moscow, Russian, 2017.
  61. Priester, P.; Miramontes, M.; Wulfhorst, G. A generic code of urban mobility: How can cities drive future sustainable development? Transp. Res. Procidia 2014, 4, 90–102. [Google Scholar] [CrossRef]
  62. Datla, S.; Sahub, P.; Roh, H.; Sharma, S. A Comprehensive Analysis of the Association of Highway Traffic with Winter Weather Conditions. Procedia Soc. Behav. Sci. 2013, 104, 497–506. [Google Scholar] [CrossRef]
  63. Jin, Y.; Denman, S.; Deng, D.; Rong, X.; Ma, M.; Wan, L.; Mao, Q.; Zhao, L.; Long, L. Environmental impacts of transformative land use and transport developments in the Greater Beijing Region: Insights from a new dynamic spatial equilibrium model. Transp. Res. Part D 2017, 52, 548–561. [Google Scholar] [CrossRef]
  64. Litman, T. Sustainable Transportation Indicators. Transp. Res. Board Ann. Meet. 2009, 9, 1–13. [Google Scholar]
  65. Hidalgo, D.; Huizenga, C. Implementation of sustainable urban transport in Latin America. Res. Transp. Econ. 2013, 40, 66–77. [Google Scholar] [CrossRef]
  66. Martos, A.; Pacheco-Torres, R.; Ordóñez, J.; Jadraque-Gago, E. Towards successful environmental performance of sustainable cities: Intervening sectors. A review. Renew. Sustain. Energy Rev. 2016, 57, 479–495. [Google Scholar] [CrossRef]
Figure 1. Influence of maximum speed of vehicles on the average speed (a) and total travel time (b).
Sustainability 10 02052 g001
Figure 2. Parameters of fuel economy and the environmental compatibility of the traffic flow under different operating conditions for the main streets of uninterrupted and regulated traffic: (a) total fuel consumption (in liters); (b) equivalent mass of emissions of harmful substances (in relative kg).
Sustainability 10 02052 g002
Figure 3. Integral indicator of sustainability of the transport system for the main streets of uninterrupted and regulated traffic under changing weather conditions.
Sustainability 10 02052 g003
Table 1. Parameters of the vehicle traffic under normal and adverse weather conditions.
Parameters of the Simulation ModelValue under Normal ConditionsValue under Adverse Weather ConditionsRelative Change of the Parameter Value, %
Maximum speed, km/h60.040.0−33.3
Maximum visibility distances, m250.0150.0−40.0
Maximum limit of back visibility, m150.050.0−66.7
Inherent maximum deceleration, m/s2−4.0−3.2−20.0
Inherent acceptable deceleration, m/s2−1.0−0.8−20.0
Acceptable deceleration of vehicle behind, m/s2−1.0−0.8−20.0
Minimum collision distance before/behind, m0.51.5200.0
Maximum deceleration for full braking, m/s2−3.0−2.0−33.3
Minimum side distance for all types of vehicles (distance at rest), m0.20.350.0
Table 2. Statistics on the number of traffic accidents by month in winter.
PeriodNumber of Accidents, Units during the Period
20152016
November11883
December128126
January12299
February10877
In a year14811395
Average number of accidents per month during the year123.4116.3
Table 3. Change in the parameters of the traffic flow under adverse conditions.
Parameters of the Traffic FlowValue under Normal ConditionsValue under Worsening Weather ConditionsRelative Change of the Parameter Value, %
Mean delay time, s20124723
Average number of stops4.14.59
Average speed, km/h97−17
Mean delay time in traffic congestion, s16521128
Total travel time, h1811.02196.221
Total delay time, h1471.71811.523
Total number of stops109,029119,2449
Delay time of vehicles waiting for entry, h686.41115.463
Table 4. Influence of adverse weather conditions on fuel consumption and the environmental compatibility of the transport system.
IndicatorsValue under Normal ConditionsValue under Adverse Weather Conditions
CO emission, kg40.5446.15
NOX emission, kg7.898.98
VOC emission, kg9.4010.70
Equivalent mass of emissions, relative kg152.98174.12
Fuel consumption, L580660
Table 5. Change in the traffic flow parameters during snow-removal operations.
Parameters of the Traffic FlowValue under Normal ConditionsValue in the Presence of a Snow BankRelative Change of the Parameter Value, %
Mean delay time, s20131155
Average number of stops4.14.919
Average speed, km/h96−31
Mean delay time in traffic congestion, s16526863
Total travel time, h1811.02616.944
Total delay time, h1471.72277.755
Total number of stops109,029130,28719
Delay time of vehicles waiting for entry, h686.42570.4274
Table 6. Change in fuel consumption and the environmental compatibility of the transport system under adverse weather conditions during snow-removal operations.
IndicatorsValue under Normal ConditionsValue in the Presence of the Snow Bank along the Street-Road Network
CO emission, kg40.5451.10
NOX emission, kg7.899.94
VOC emission, kg9.4011.84
Equivalent mass of emissions, relative kg152.98192.73
Fuel consumption, L580731
Table 7. Change in the traffic flow parameters when creating the main street of uninterrupted traffic.
Parameters of the Traffic FlowValue for the Main Street of Regulated TrafficValue for the Main Street of Uninterrupted TrafficRelative Change of the Parameter Value, %
Mean delay time, s20174−63
Average number of stops4.11.1−73
Average speed, km/h9.024.4171
Mean delay time in traffic congestion, s16561−63
Total travel time, h18111029−43
Total delay time, h1472541−63
Total number of stops109,02928,962−73
Total delay time in traffic congestion, h1208446−63
Table 8. Parameters of the traffic flow for the main street of uninterrupted traffic under adverse weather conditions during snow-removal operations.
Parameters of the Traffic FlowValue under Normal ConditionsValue under Adverse Weather ConditionsValue in the Presence of a Snow Bank along the Street-Road Network
Mean delay time, s7480131
Average number of stops1.11.42.1
Average speed, km/h24.423.417.3
Mean delay time in traffic congestion, s6162110
Total travel time, h102910721450
Total delay time, h541585962
Total number of stops28,96236,42354,707
Delay time of vehicles waiting for entry, s1517929
Table 9. Parameters of the traffic flow for the main streets of regulated and uninterrupted traffic in the case of a road accident.
Parameters of the Traffic FlowMain Street of Regulated TrafficMain Street of Uninterrupted Traffic
Without Road AccidentWith Road AccidentWithout Road AccidentWith Road Accident
Mean delay time, s20133174185
Average number of stops4.17.61.14.1
Average speed, km/h9.05.924.413.6
Mean delay time in traffic congestion, s16527361146
Total travel time, h1811276610291,841
Total delay time, h147124275411355
Total number of stops109,029200,93728,962107,425
Traffic management coefficient1.222.420.270.80

