Spatiotemporal Simulation of Future Land Use/Cover Change Scenarios in the Tokyo Metropolitan Area


1
Graduate School of Life and Environmental Science, University of Tsukuba, 1-1-1 Tennodai, Tsukuba City, Ibaraki 305-8572, Japan
2
Faculty of Life and Environmental Science, University of Tsukuba, 1-1-1 Tennodai, Tsukuba City, Ibaraki 305-8572, Japan
*
Author to whom correspondence should be addressed.
Sustainability 2018, 10(6), 2056; https://0-doi-org.brum.beds.ac.uk/10.3390/su10062056
Submission received: 14 May 2018
/
Revised: 10 June 2018
/
Accepted: 13 June 2018
/
Published: 17 June 2018
(This article belongs to the Special Issue Spatial Analysis of Urbanization towards Urban Sustainability)
Abstract
:Simulating future land use/cover changes is of great importance for urban planners and decision-makers, especially in metropolitan areas, to maintain a sustainable environment. This study examines the changes in land use/cover in the Tokyo metropolitan area (TMA) from 2007 to 2017 as a first step in using supervised classification. Second, based on the map results, we predicted the expected patterns of change in 2027 and 2037 by employing a hybrid model composed of cellular automata and the Markov model. The next step was to decide the model inputs consisting of the modeling variables affecting the distribution of land use/cover in the study area, for instance distance to central business district (CBD) and distance to railways, in addition to the classified maps of 2007 and 2017. Finally, we considered three scenarios for simulating land use/cover changes: spontaneous, sub-region development, and green space improvement. Simulation results show varied patterns of change according to the different scenarios. The sub-region development scenario is the most promising because it balances between urban areas, resources, and green spaces. This study provides significant insight for planners about change trends in the TMA and future challenges that might be encountered to maintain a sustainable region.
1. Introduction
In recent years, considerable attention has been paid to change occurring in land use/cover because of urbanization and industrialization [1]. Land use/cover change has widespread influence in many fields, not only in urban planning, but also in transportation, environment, policy, and economics [2,3,4,5]. For developed and developing countries, land use/cover has been divided into two categories: urban improvement and urban growth [6]. Compared to developing nations, the trend of land use/cover change in industrialized nations is more crucial to establish a green and rich environment and to enhance comprehensive competitiveness in the world [7].
Japan is one of the developed countries and has undergone drastic land use/cover changes over the last decades, mainly since the economic boom of the 1970s, resulting in the formation of many metropolitan areas across its mainland. Reduced population growth is considered among the serious factors that have inevitably resulted in land use/cover change. Indeed, decreasing population and aging have been recognized as being among the most severe problems in Japan. According to the World Bank [8], crude birth rate dropped from 17 to fewer than 8 births per 1000 persons between 1960 and 2015, and if the birth rate remains at current levels, it will directly affect the land use/cover structure in the near future [9]. Population change trends put pressure on green space and domestic installation due to the demand for a green environment and living convenience [10]. In recent years, maintaining a balance between the decreasing population and land use/cover change in Japan’s metropolitan areas is a crucial task [11]. To address this, government and city planners have proposed some policies to control the land use/cover development. Among the most influential policies is the zoning plan that was first proposed in 1968 [12].
Previous studies have found that a zoning plan in Japan is an essential method and a first step to establish a compact city without chaotic urban sprawl and wasted resources, and it also can enhance urban compactness [13,14,15]. The concept of compact city was initially proposed by mathematicians George Dantzig and Thomas L. Saaty in the early 1970s of the last century with the aim of offering good quality life conditions to citizens and sustainable use of resources [16]. The compact city model was found to be the best model for urban and design planning [17]. Among the main benefits of urban compactness is limiting built-up expansion, considering climate change measures, and improving the utilization rate of communal facilities such as recreation centers and parks [18]. Enlarging green space can not only enhance the quality of life for the aging population, but also provide the region with a disaster-proof environment that prevents fire, typhoon, and flood and guarantees a safe and secure life [19]. In this context, in all urban areas, planning management is crucial and several parameters influencing this process need to be taken into consideration including not only social and economic parameters but natural ones as well [20,21]. Park and Jeon estimated, using Analytic Hierarchy Process (AHP), the weights of factors that affect land use change by including a set of social, political, topographic and geographic factors [22]. They found out that topographic parameters are the most important ones to predict land use change. Natural factors are also essential if we see urban areas from a natural hazards vulnerability perspective. In fact, cities are vulnerable to damage caused by natural hazards, for instance, earthquakes, floods, and landslides. Fast expanding and vulnerable-to-disasters metropolitan areas like TMA require regular monitoring and assessment of the risks caused by such disasters to define and restrict dangerous zones and to provide their citizens, including elderly people, with safe shelters. Examples of similar approaches in other urban areas were detailed in studies carried out by Bathrellos and Skilodimou where the authors assessed urban development suitability based on multi-hazard maps in Peloponnesus, in the Greek basin of Xerias [23]. Another study was conducted by Papadopoulou-Vrynioti et al. to assess Karst collapse susceptibility in Athens [24].
Urban expansion is certainly a good indicator of healthy economic activities, and from social and economic perspectives it may impact positively the livelihoods of the population. However, such changes in the land use/cover have negative impacts as well. These consequences were summarized by Saaty and De Paola as pollution, consumption of energy, resources’ depletion, waste dumps and junk yards among others that may pose serious threats to urban sustainability if there are no interventions from urban planners and decision makers [17]. For those to be able to make wise decisions that achieve urban sustainability, simulated land use/cover maps representing different scenarios are essential references. In this context, recent studies have shown that the efficiency of land use/cover models to simulate land use/cover structure is based on complicated scenarios such as various government policies, the agenda of an intergovernmental panel on climate change, population trends, and environmental protection [25,26]. For instance, Jia and Ma have simulated expected land use/cover changes in Beijing in 2020 on the basis of ecological redline restrictions and socio-economic and natural driving factors [27]. Zhang and Wang have predicted 2020’s landscape changes in Chinese Tekes county according to four scenarios including two that support ecology and natural resources security [28]. By considering complex and multifaceted simulation results, scenario simulation has a place in urban planning[29].
Various techniques have been proposed and successfully implemented, including regression models [30], artificial neural networks [31], weights of evidence [32], the Markov model [33], cellular automata (CA) [34], and CA-Markov [35], among others. For instance, Estoque and Murayama analyzed the dynamics of a socio-ecological system and predicted land use/cover change under two scenarios in Baguio city by using the GeoMod model [36]. Liu predicted land use/cover distribution from 2010 to 2050 under four scenarios using a future land use simulation model [37]. Spatiotemporally monitoring of the transformations of land use/cover that have occurred helps us understand past trends and provides key insights into possible future changes by simulating and modeling conditions under different scenarios. This is an effective way to control the trends of land use/cover change and provide a flexible layout for government and city planners to refer to in order to keep a sustainable society maintaining the right balance between socio-economic development and natural environments.
There are many studies that simulated land use/cover change from different perspectives and for distinct purposes. Ahmed and Kamruzzaman predicted land use/cover changes in the capital city of Bangladesh and analyzed their interactions with land surface temperature in 2019 and 2029 [38]. Deilami and Kamruzzaman forecasted the urban heat island and its impact on land use/cover changes under three policy scenarios [39]. However, the influence of modeling variables has been overlooked in the simulation of land use/cover change. In this study, we did not only analyze the effect of modeling variables on land use/cover change by using CA-Markov model but also considered the influence of government policies. Accordingly, the distribution of land use/cover has been simulated under three scenarios which can provide prospective conditions. The original contribution of the present paper is to conduct a sound spatial analysis based on mathematical grounds that was successfully implemented by previous studies to simulate changes of land use/cover, taking into account specific Japanese government policies and respecting social and geographic contexts of the study area, implying that TMA is the largest metropolitan area in the world and witnessing a declining population and an increase in elderly people. We believe the results will be a useful reference for city planners and decision makers.
The purpose of this study is to examine the spatiotemporal pattern of land use/cover change in the TMA across 2001, 2007, and 2017 and consequently simulate change of land use/cover in 2027 and 2037 by considering government policies, decreasing population, and environmental protection. To provide a flexible layout of simulation, three scenarios have been considered: spontaneous, subregion development, and green space improvement scenarios. They represent a continuation of current trends, zoning regulations, and countryside strategy policy, respectively. Based on the spatiotemporal data of 2007 and 2017, a hybrid model consisting of cellular automata and Markov models was implemented to simulate the land use/cover conditions under the three scenarios in 2027 and 2037. To the best of our knowledge, there have been no studies done on simulating land use/cover changes in TMA using the CA-Markov model.
2. Materials and Methods
2.1. Study Area
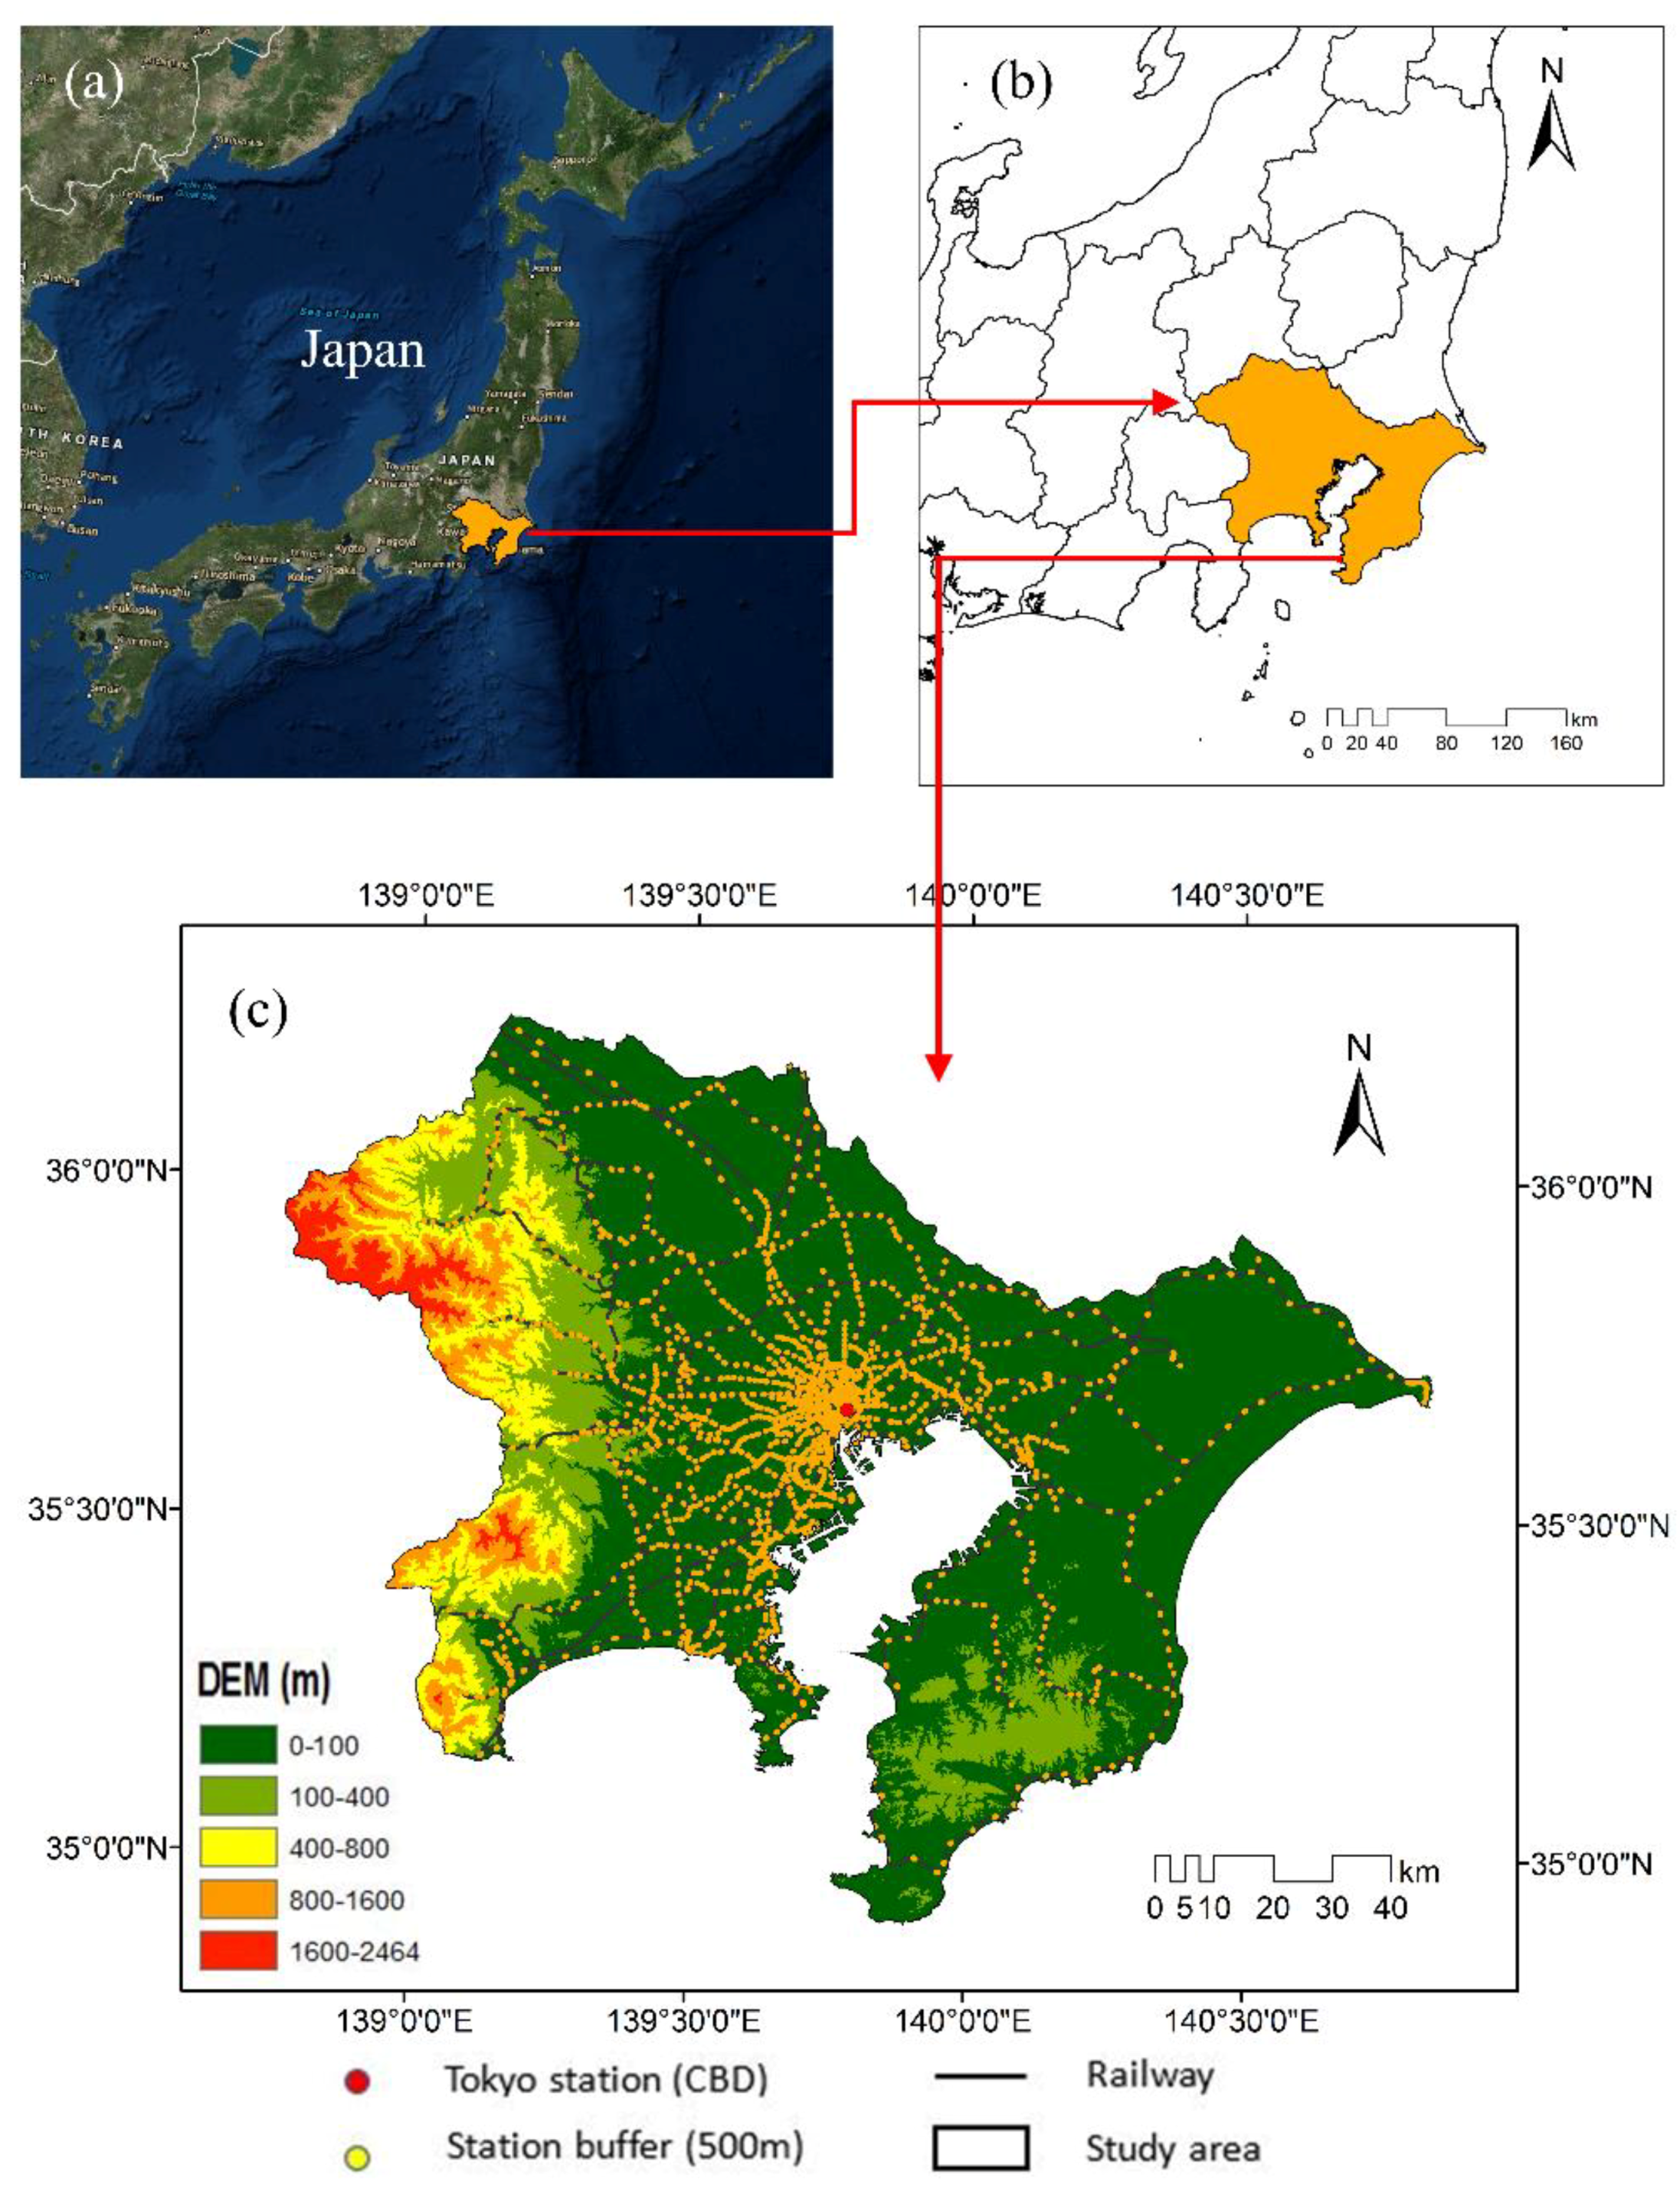
The Tokyo metropolitan area is recognized as one of the largest urban areas in the world and a successful example for other developing cities. In this study, the TMA consists of metropolitan Tokyo and Chiba, Kanagawa, and Saitama prefectures as the study area (Figure 1). Metropolitan Tokyo is the capital city of Japan and also the biggest city in the world, with the most complex transportation system. Metropolitan Tokyo with the surrounding prefectures compose a zone to accelerate economic development and industrial progress. According to the Japanese statistics bureau, the study area covers approximately 13,556 km2 and has a population of 36.3 million (2017). Even though the total population in Japan is decreasing because of the low birth rate, the proportion of the population in the study area is increasing. This means that the metropolitan area attracts both national and international businesses. As in other developed cities, the Japanese government launched some development policies to limit urban sprawl and save energy [12,40].
2.2. Data Specifications and Preprocessing Steps
In this study, the remote sensing images of Landsat-5 Thematic Mapper (TM), Landsat-7 Enhanced Thematic Mapper Plus (ETM+), and Landsat-8 Operational Land Imager/Thermal Infrared Sensor (OLI/TIRS) were obtained from United States Geological Survey (USGS) with a spatial resolution of 30 m (Table 1) [41]. In order to ensure the quality of the extracted land use/cover maps, all the acquired images were cloud-free (<10%) and were taken during same seasons in 2001, 2007, and 2017.
Due to the wideness of the study area, three cloud-free Landsat images relatively taken during the same seasons were selected and mosaicked for every year of 2001, 2007, and 2017. In this step, the mosaic tool was employed to pre-process Landsat images. We used the histogram matching module to match overlap areas. Band by band was chosen as histogram type, and the average was selected for grayscale calculation. Next, we set “0” as the background value to avoid the influence of black edges. Finally, the three Landsat images were mosaicked to new raster. This process was applied for the three years of 2001, 2007, and 2017. Other vector data, such as Tokyo station, which was defined as the center of the central business district (CBD) area, the boundary of the study area, railways, railway stations, urbanization promotion area (UPA), and urbanization control area (UCA), were obtained from the National Land Numerical Information download service [42] and used as ancillary data in this research. The protection area was collected from the World Database of Protected Areas (WDPA) in 2017, which includes, for instance, national parks and nature conservation areas [43]. High-resolution Google Earth imagery was used as reference data to check the accuracy of land use/cover maps.
2.3. Land Use/Cover Mapping
In order to analyze and simulate land use/cover changes, four classification categories were defined: built-up, cropland, green, and water. Built-up areas include urban and rural settlements, roads, and other human-constructed areas. Cropland includes paddy fields and horizontal terraced fields. Green refers to ground that is covered by grass and dense and scattered trees. Water includes rivers and lakes. Landsat images were exploited to extract classified land use/cover maps by using maximum likelihood supervised classification method in ArcGIS 10.2 software [44]. Maximum likelihood supervised classification is based on using training samples to assign a pixel to the most appropriate land use/cover class with highest probability of pixels and assign the pixels to the land use/cover categories [45]. The spatial resolution of all downloaded images was 30 m. Based on our knowledge of the local conditions in TMA, a total of 227 polygons were selected as training samples with characteristic features for land/use/cover categories, with pixels’ sizes ranging from 85 to 125.
2.4. Cellular Automata-Markov Model
The cellular automata-Markov (CA-Markov) model is composed of the cellular automata model and the Markov model. The Markov model is a statistical model to calculate the transition probability matrix between two states [46]. By using the transition probability matrix, the state of a future period can be simulated based on the state of a previous period [47]. The Markov model plays a critical role in land use/cover simulation. In this study, the land use/cover maps in 2007 and 2017 were employed to calculate the transition probability matrix by using the Markov model. The transition probability matrix can be expressed by the following equations:
where is the transition probability between two periods, and the sum of all is 1. is the transition matrix, and is the number of categories of land use/cover.
By using the transition probability matrix and land use/cover map in 2017, simulation maps for 2027 and 2037 can be predicted. The mathematical expression of transition models can be expressed as:
where denotes the state of land use/cover at time t + 1, depicts the state of land use/cover at time t, and represents an m × m transition probability matrix from time t to t + 1. For the land use/cover simulation, there is a limitation in the Markov model, as it is a statistical model and cannot calculate the spatial distribution of land use/cover. In order to overcome this limitation, the cellular automata model was also used in this study [48]. The cellular automata model is a spatiotemporal model that can analyze the relationships between different cells [49]. According to neighborhood interactions and rules, the state of a cell can be decided [50]. By combining the cellular automata model and the Markov model, the spatiotemporal distribution of land use/cover can be simulated [51]. In the CA-Markov model, determining the modeling variables is also a critical part of the simulation. Transition suitability maps can be obtained from modeling variables in the multi-criteria evaluation module [52]. In this study, all the steps of CA-Markov model have been executed using TerrSet 18.31 software.
2.5. Modeling Variables
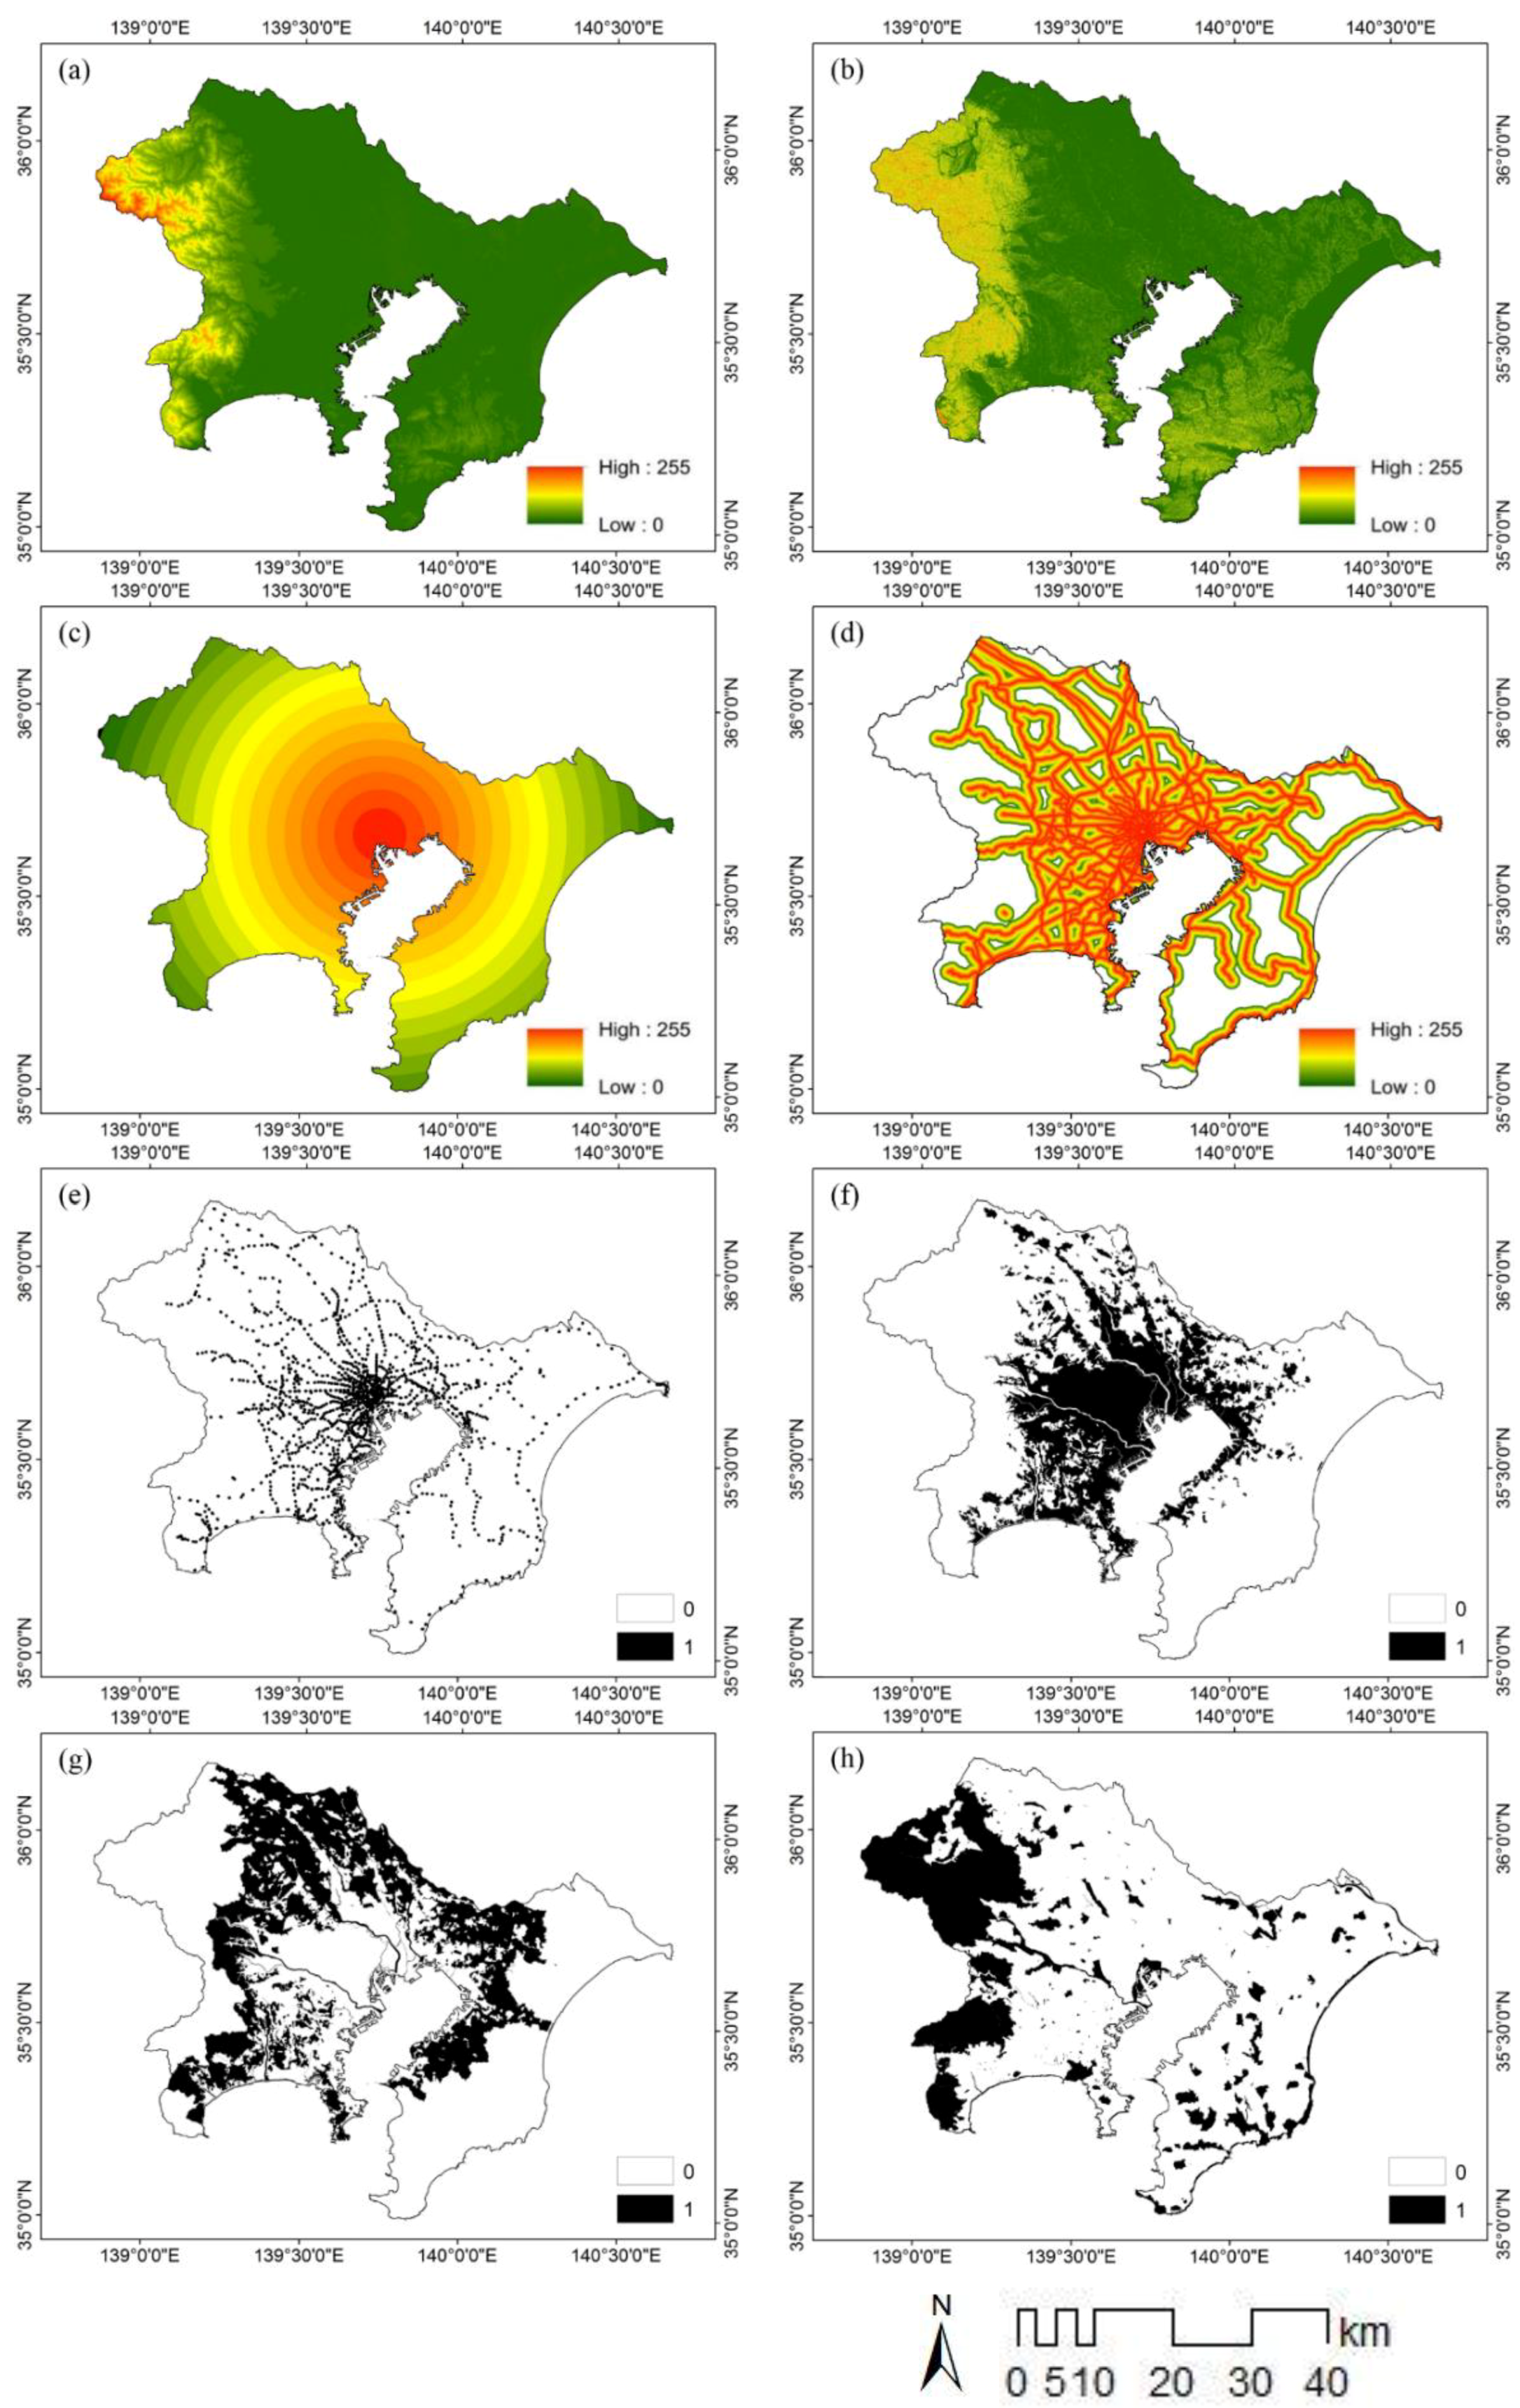
In the spatiotemporal simulation, determining modeling variables is always one of the critical factors that affect the distribution of land use/cover [53]. Based on historical trends and government policies, eight modeling variables were chosen in this study. These are the digital elevation model (DEM), slope, distance to Tokyo station, distance to railways, railway station buffer (500 m), UPA, UCA, and protection area.
DEM and slope were considered as primary variables and were employed in the simulation (Figure 2a,b). According to the extracted land use/cover maps, we found that the built-up area was spread out following a radial pattern from Tokyo station to surrounding areas. Thus, we set up Tokyo station as the CBD in the TMA. Trains are the primary means of transportation and railways have had major impacts on land use/cover change. In this context, the CBD and railways were used to generate the distance to CBD layer, and distance to railways was extracted by employing the Euclidean distance tool offered in ArcGIS 10.2 software as modeling variables for land use/cover change (Figure 2c,d). To standardize the influence of original data, we established fuzzy membership function, and all the corresponding factors should keep the same range. The output data format is shown in two types: Real (0–1) and Byte (0–255). By considering we will use the Multi-Criteria Evaluation (MCE) method to analyze all the modeling variables; the MCE method requires byte data format and output scaling of 0–255. To make the same output scaling with the MCE method, we didn’t use the Real (0–1) which is in binary code. The Byte (0–255) in decimal scale has been selected to show the output format in this study. The Byte (0–255) has been selected for output data format. In this study, all the modeling variables should be scaled in byte range from 0 to 255 by employing the fuzzy module in TerrSet 18.31 software.
According to the Tokyo city plan (revised in 2014), to meet the needs of communication and convenience, the area within 500 m around every station is chosen as the key intensive development zone (Figure 2e). These zones are convenient in transportation. Their development could not only advance city development, but also strengthen international competitiveness. Urbanization promotion area (UPA) and urbanization control area (UCA) were proposed by Urban Land Use Planning System in Japan (2nd edition, March 2007) [12]. The purpose is to protect the balance between the natural and living environment by establishing order on land use/cover in cities. In this study, we used the UPA as a constraint area suitable for increased build-up (Figure 2f). The UCA was also considered as a constraint area to ensure that cropland will not be covered by build-up in urban planning and green areas, which will already be developed in the UCA (Figure 2g).
The last factor is protection area, which refers to areas where urbanization is prohibited, such as national parks used as restricted areas to avoid the chaotic sprawl of urban areas (Figure 2h). All the constraint factors have been classified as 1 for a restricted area or 0 for an allowed area for urbanization.
2.6. Scenarios
During the development period from 1955 to 1999 and similar to other developed countries, a total of 20% of cropland areas in Japan had been covered by built-up areas for urbanization and industrialization purposes [54]. Virgin forest located in the margins of urban areas had been converted to cropland [55]. By considering the high transaction costs and sustainable development, the Japanese government decided to control land use/cover change by proposing land use policies. Urban land use planning systems in Japan have been offered one after another, such as the Tokyo city plan. In urban planning, preventing chaotic urban sprawl is not only crucial to minimize expenses and save resources, but also to reduce pressure on the environment. In order to keep vitality in the Tokyo metropolitan area and prevent chaotic urban sprawl, the Japanese government set an urban land use planning system that specifies zoning regulations. According to this system, there are two types of urban area: urbanization promotion area (UPA) and urbanization control area (UCA). UPAs include areas that are already urbanized and should be developed within 10 years. In UCAs, urban development activities, such as converting farmlands to urban land uses, are prohibited. To summarize, this system is achieved by establishing land use order. From 1999, Japan entered a maturity stage, but another problem occurred: population decrease. According to the report from the National Institute of Population and Social Security Research in 2015, the population in Japan will continue dropping. Meanwhile, land use/cover has been changing as a consequence of falling birth rates. With the population decline and the aging process, the Japanese government encourages that the existing built-up area should be used efficiently and city parks should be protected to establish compact and convenient living environment for people. In the rural area, the government encourages that the green area should be improved and preserved to create a green city and a pleasant environment. In order to provide meaningful information for city planners during the maturity period, three illustrative scenarios have been considered based on the government policies to simulate land use/cover changes in 2027 and 2037: spontaneous, sub-region development, and green space improvement scenarios. These scenarios are explained in the following.
The spontaneous scenario (SS) assumes that development in the study area in the near future will be without natural disasters and sudden swings and changes in the economy, policies, market forces [56]. In the present study, SS refers to a scenario in which the trends of changes in land use/cover from 2007 to 2017 will continue unaltered until 2027 and 2037 regardless of the modeling variables and human factor.
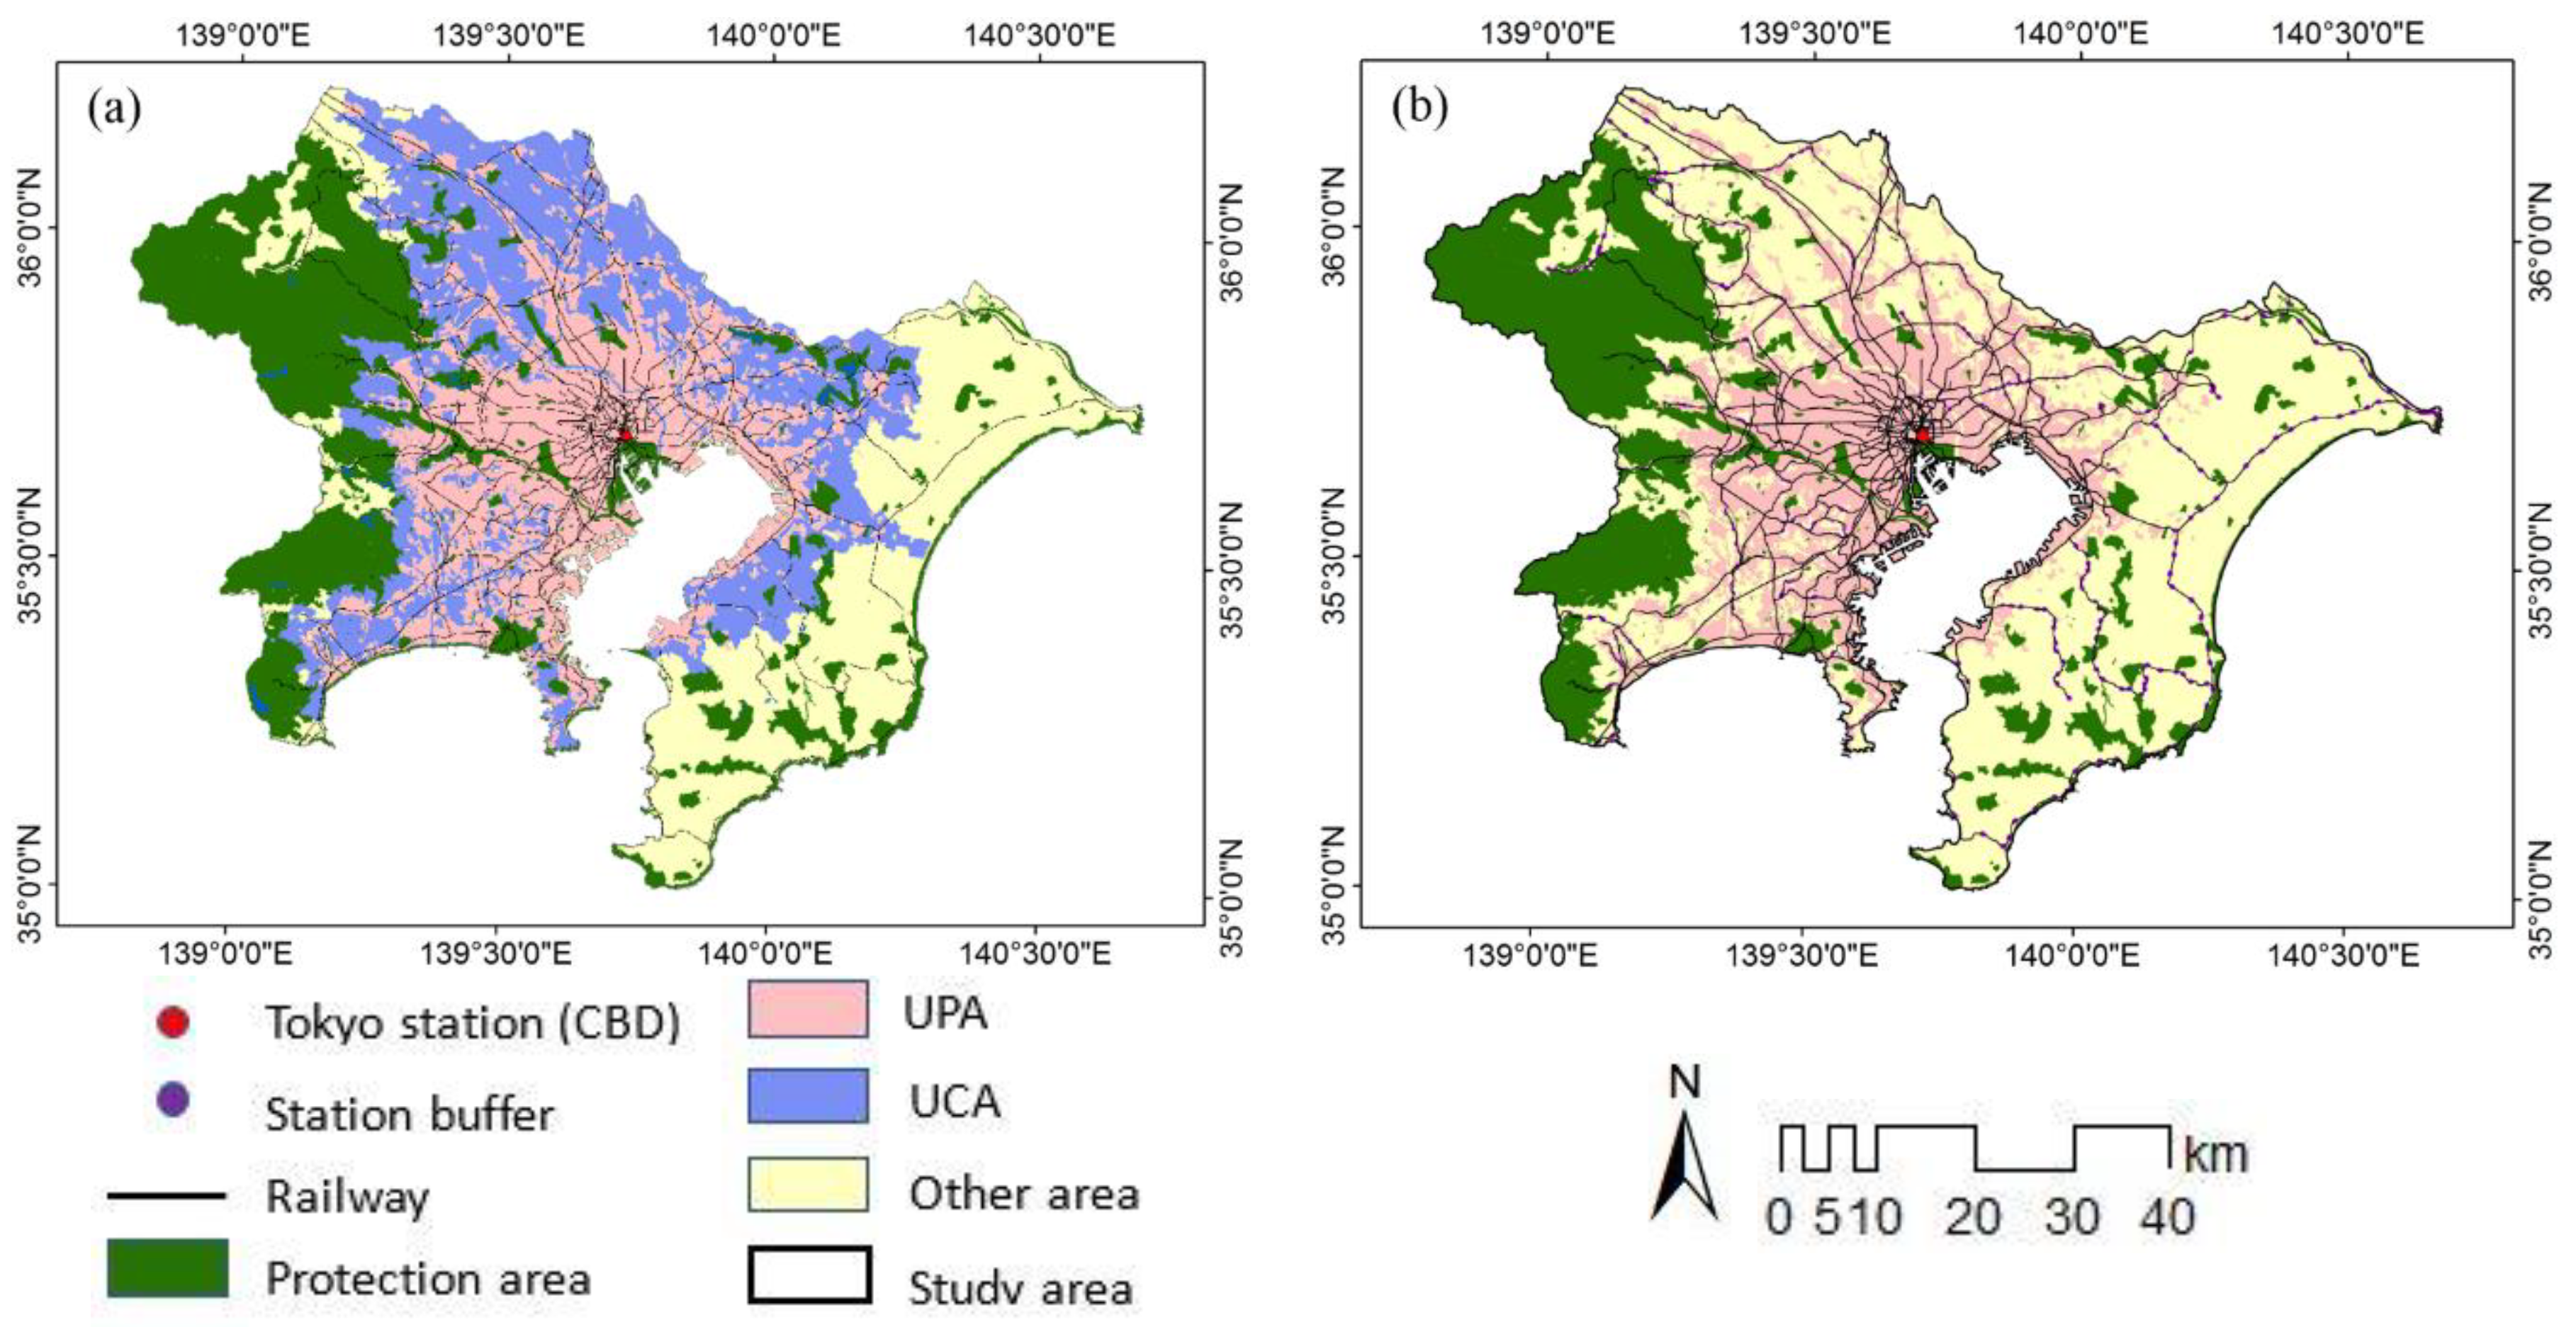
The sub-region development (SRD) scenario considers the government zoning plan and current circumstances, and establishes a flexible layout of construction in urban and rural areas [12]. A zoning plan has been considered in this scenario. Figure 3a shows the variables considered for SRD. The distance to Tokyo station (CBD) and to railways is the essential influencing factor of land use/cover change. Based on government policy, UPA has been set as a built-up major development region, UCA as a cropland and green area development region, and other areas as a green area improvement region. For future simulation, protection areas are set as restricted areas in 2007 and 2017 classified maps and should keep this status in 2027 and 2037.
The green space improvement (GSI) scenario, which considers the Urban Green Space Conservation Act (revised in 2017) and population aging, implies increasing green space in areas outside the pedestrian zones along railways. The variables of GSI are shown in Figure 3b. In this scenario, the distance to Tokyo station (CBD) and to railways influences the built-up categories and UPA is considered as a restricted area to limit the built-up sprawl. According to the requirements of countryside strategy policy proposed in 2010, in the countryside area, to improve the green space and establish a compact city, the outside part from railway stations to the circle of walkability should be changed into green areas. Within other areas shown in Figure 3b, the outside of buffer regions around the stations have been recognized as green space improvement regions. Similar to SRD, we have also put the protection area as a no change region in GSI.
2.7. Simulation of Land Use/Cover in 2027 and 2037
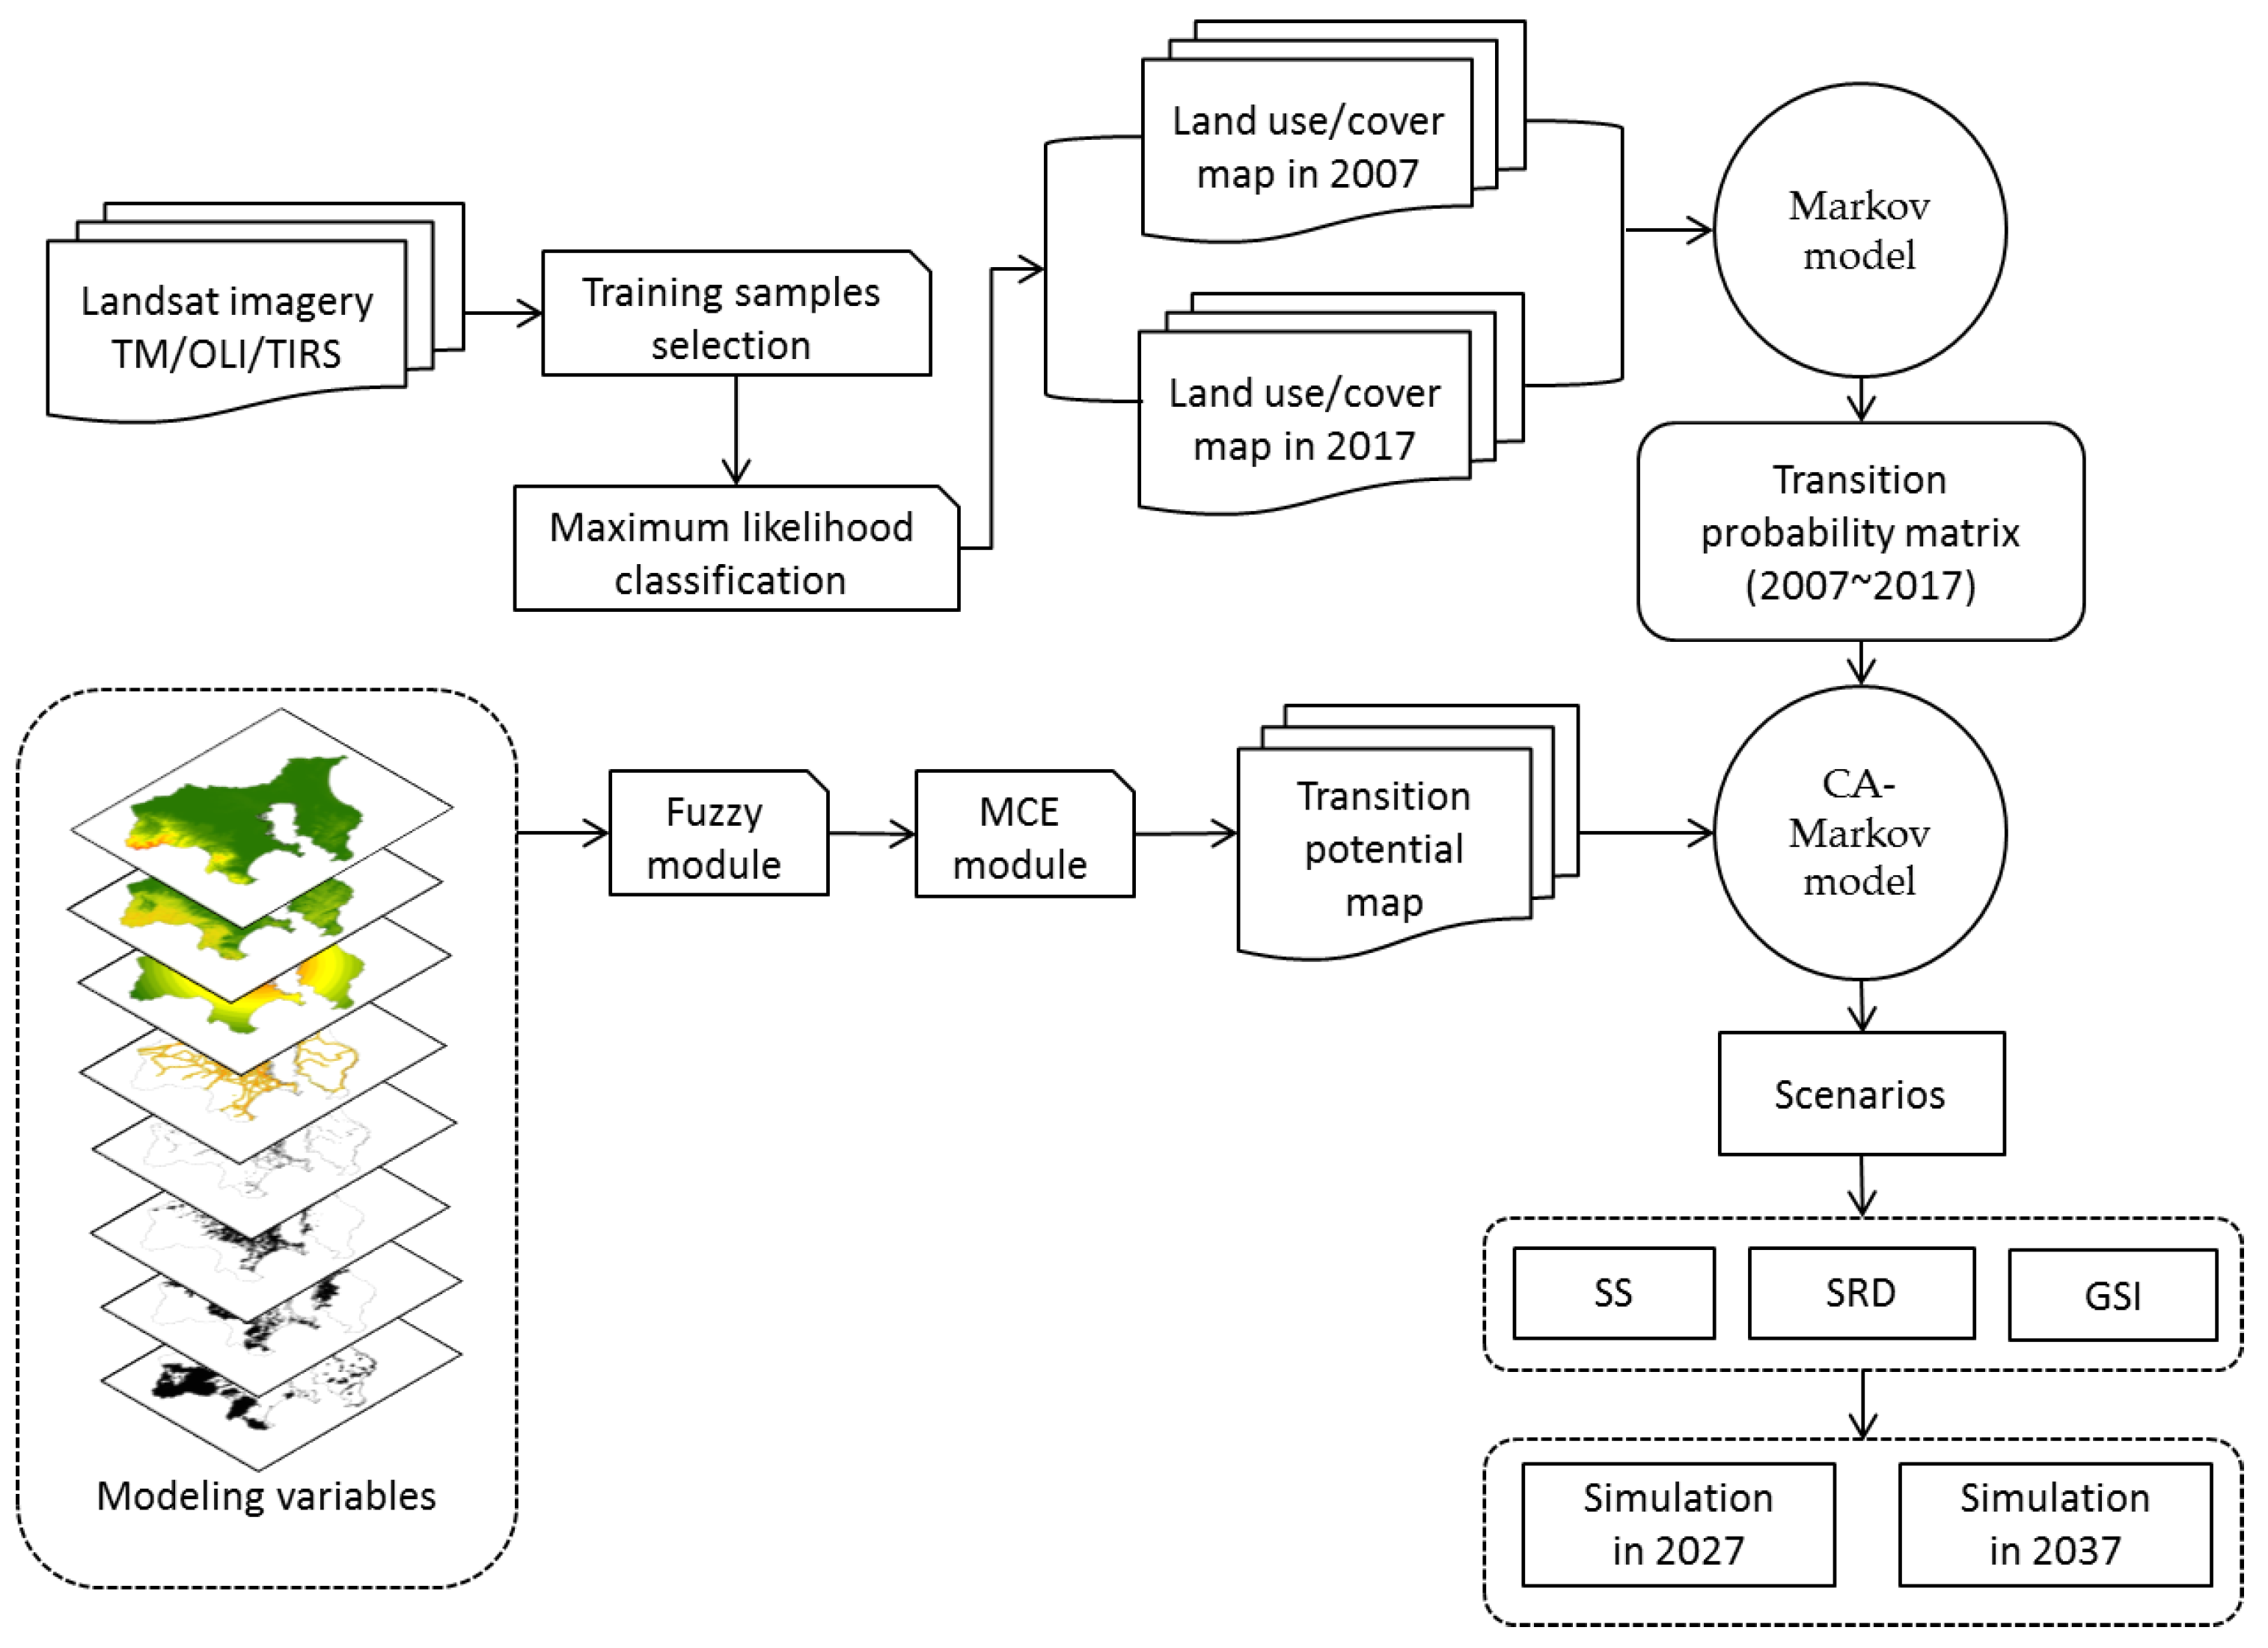
The modeling process of future simulation is shown in Figure 4. First, we used the likelihood supervised classification method in ArcGIS 10.2 to extract the land use/cover classified maps of 2007 and 2017. Second, the transition probability matrix was obtained using the Markov model. Third, the DEM, slope, distance to Tokyo station (CBD), distance to railways, railway station buffer, UPA, UCA and protection area were set as modeling variables and integrated into the fuzzy module and multicriteria evaluation module to generate the transition potential map of each scenario. Finally, we added transition probability matrix and transition potential map as inputs to the cellular automata–Markov model to simulate land use/cover changes in 2027 and 2037 under the three scenarios.
3. Results
3.1. Land Use/Cover Mapping
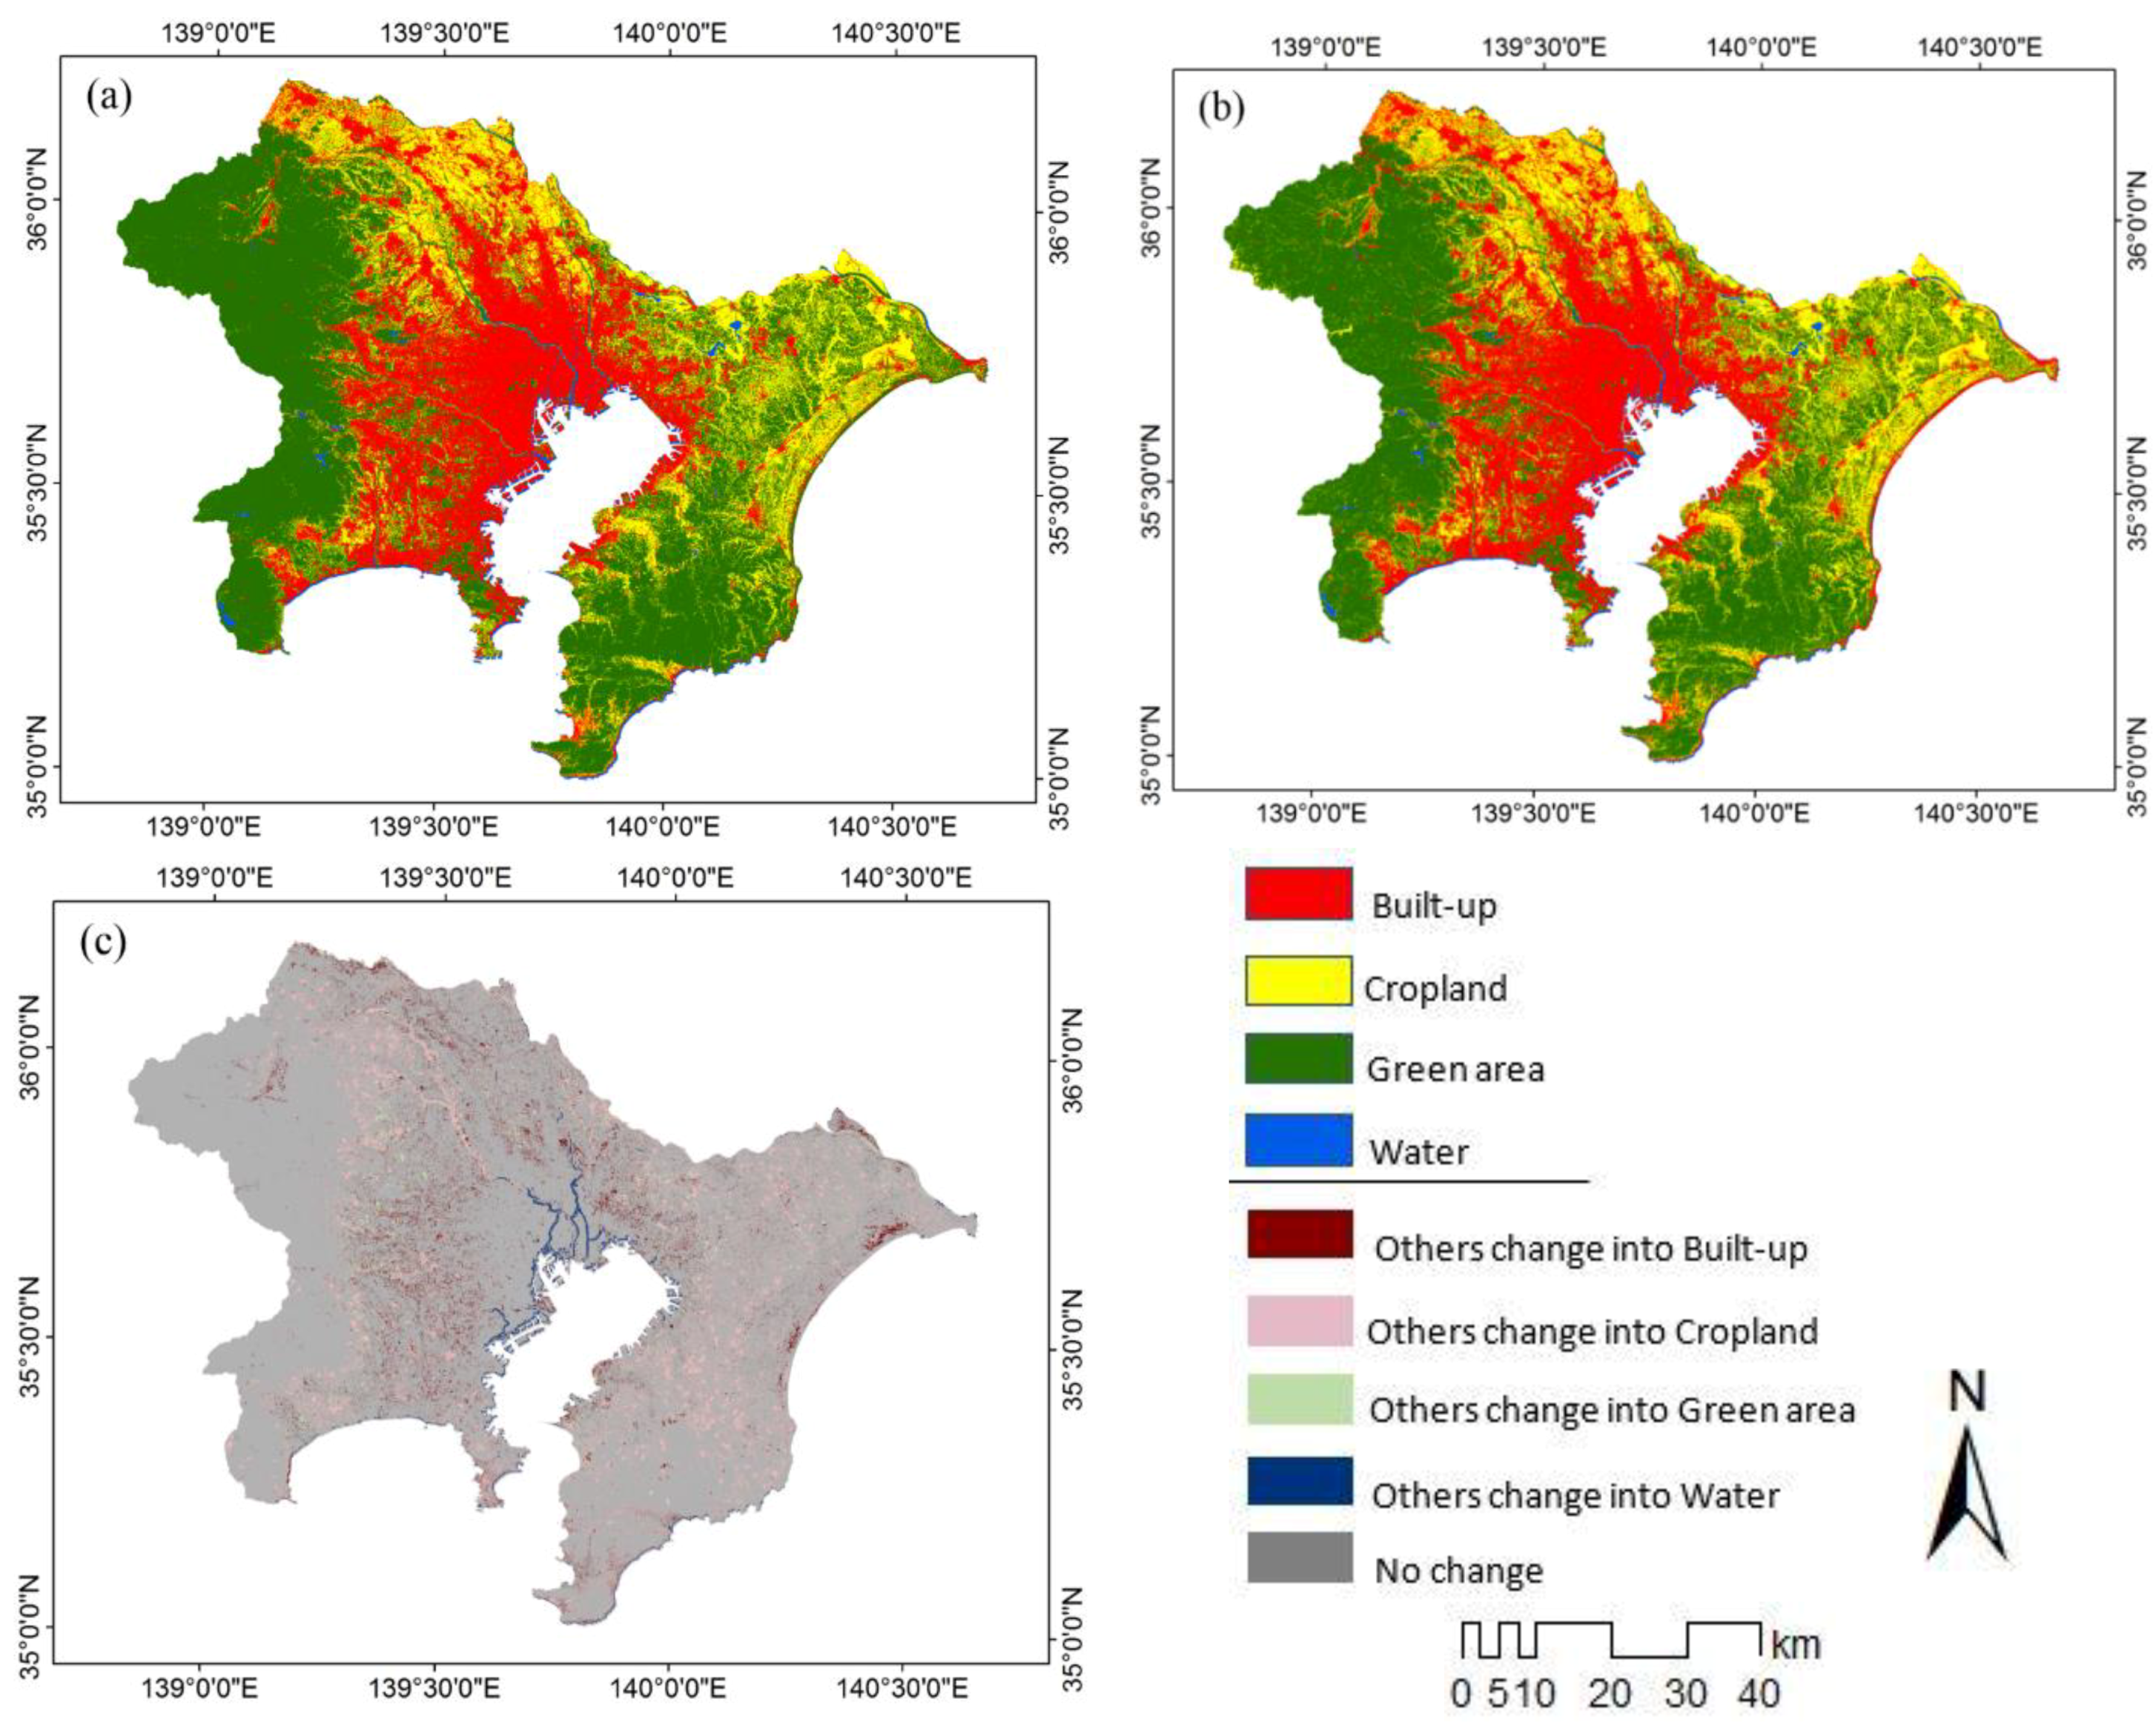
Figure 5 shows the classified land use/cover maps of the study area in 2007 and 2017. They are classified into four categories: built-up, cropland, green area, and water. Due to the roughness and complex structure of crops in the Landsat images and since the color of paddy fields and grassland are quasi-similar in the Landsat images taken during summer, we used winter and spring seasons’ images for better classification results. From Figure 5a, which depicts land use/cover in 2007, we can find that the built-up area spread from Tokyo city to surrounding flat areas, whereas the surrounding mountains were mainly covered by forest. In contrast, land use/cover in the 2017 map, illustrated in Figure 5b, shows that only a small amount of built-up area increased and distributed over the edge of the previous built constructions. Correspondingly, a total of 82.56 km2 changed from cropland to other land use/cover types. Figure 5c presents the change map between 2007 and 2017, and the gained area of build-up is located mainly in the central area.
3.2. Accuracy Assessment of Classification Results
To verify the performance of land use/cover classification results, a total of 400 random points were generated using the “create random points” tool in ArcGIS 10.2. Next, the function named “extract values to points” was applied to extract the land use/cover category from land use/cover maps into points. Finally, the random points data was converted into KML files in Google Earth software. Points information was compared with actual land use/cover information, and the overall accuracy of land use/cover maps was obtained. Overall accuracy is 81.00%, 81.75%, and 83.75% for 2001, 2007, and 2017, respectively (See Appendix A for more details). The misclassified points were mainly distributed in the mixed areas with multiple classes [57,58]. According to the land use/cover status in the study area and our objective, the results of accuracy assessment is acceptable.
3.3. Transition Probability
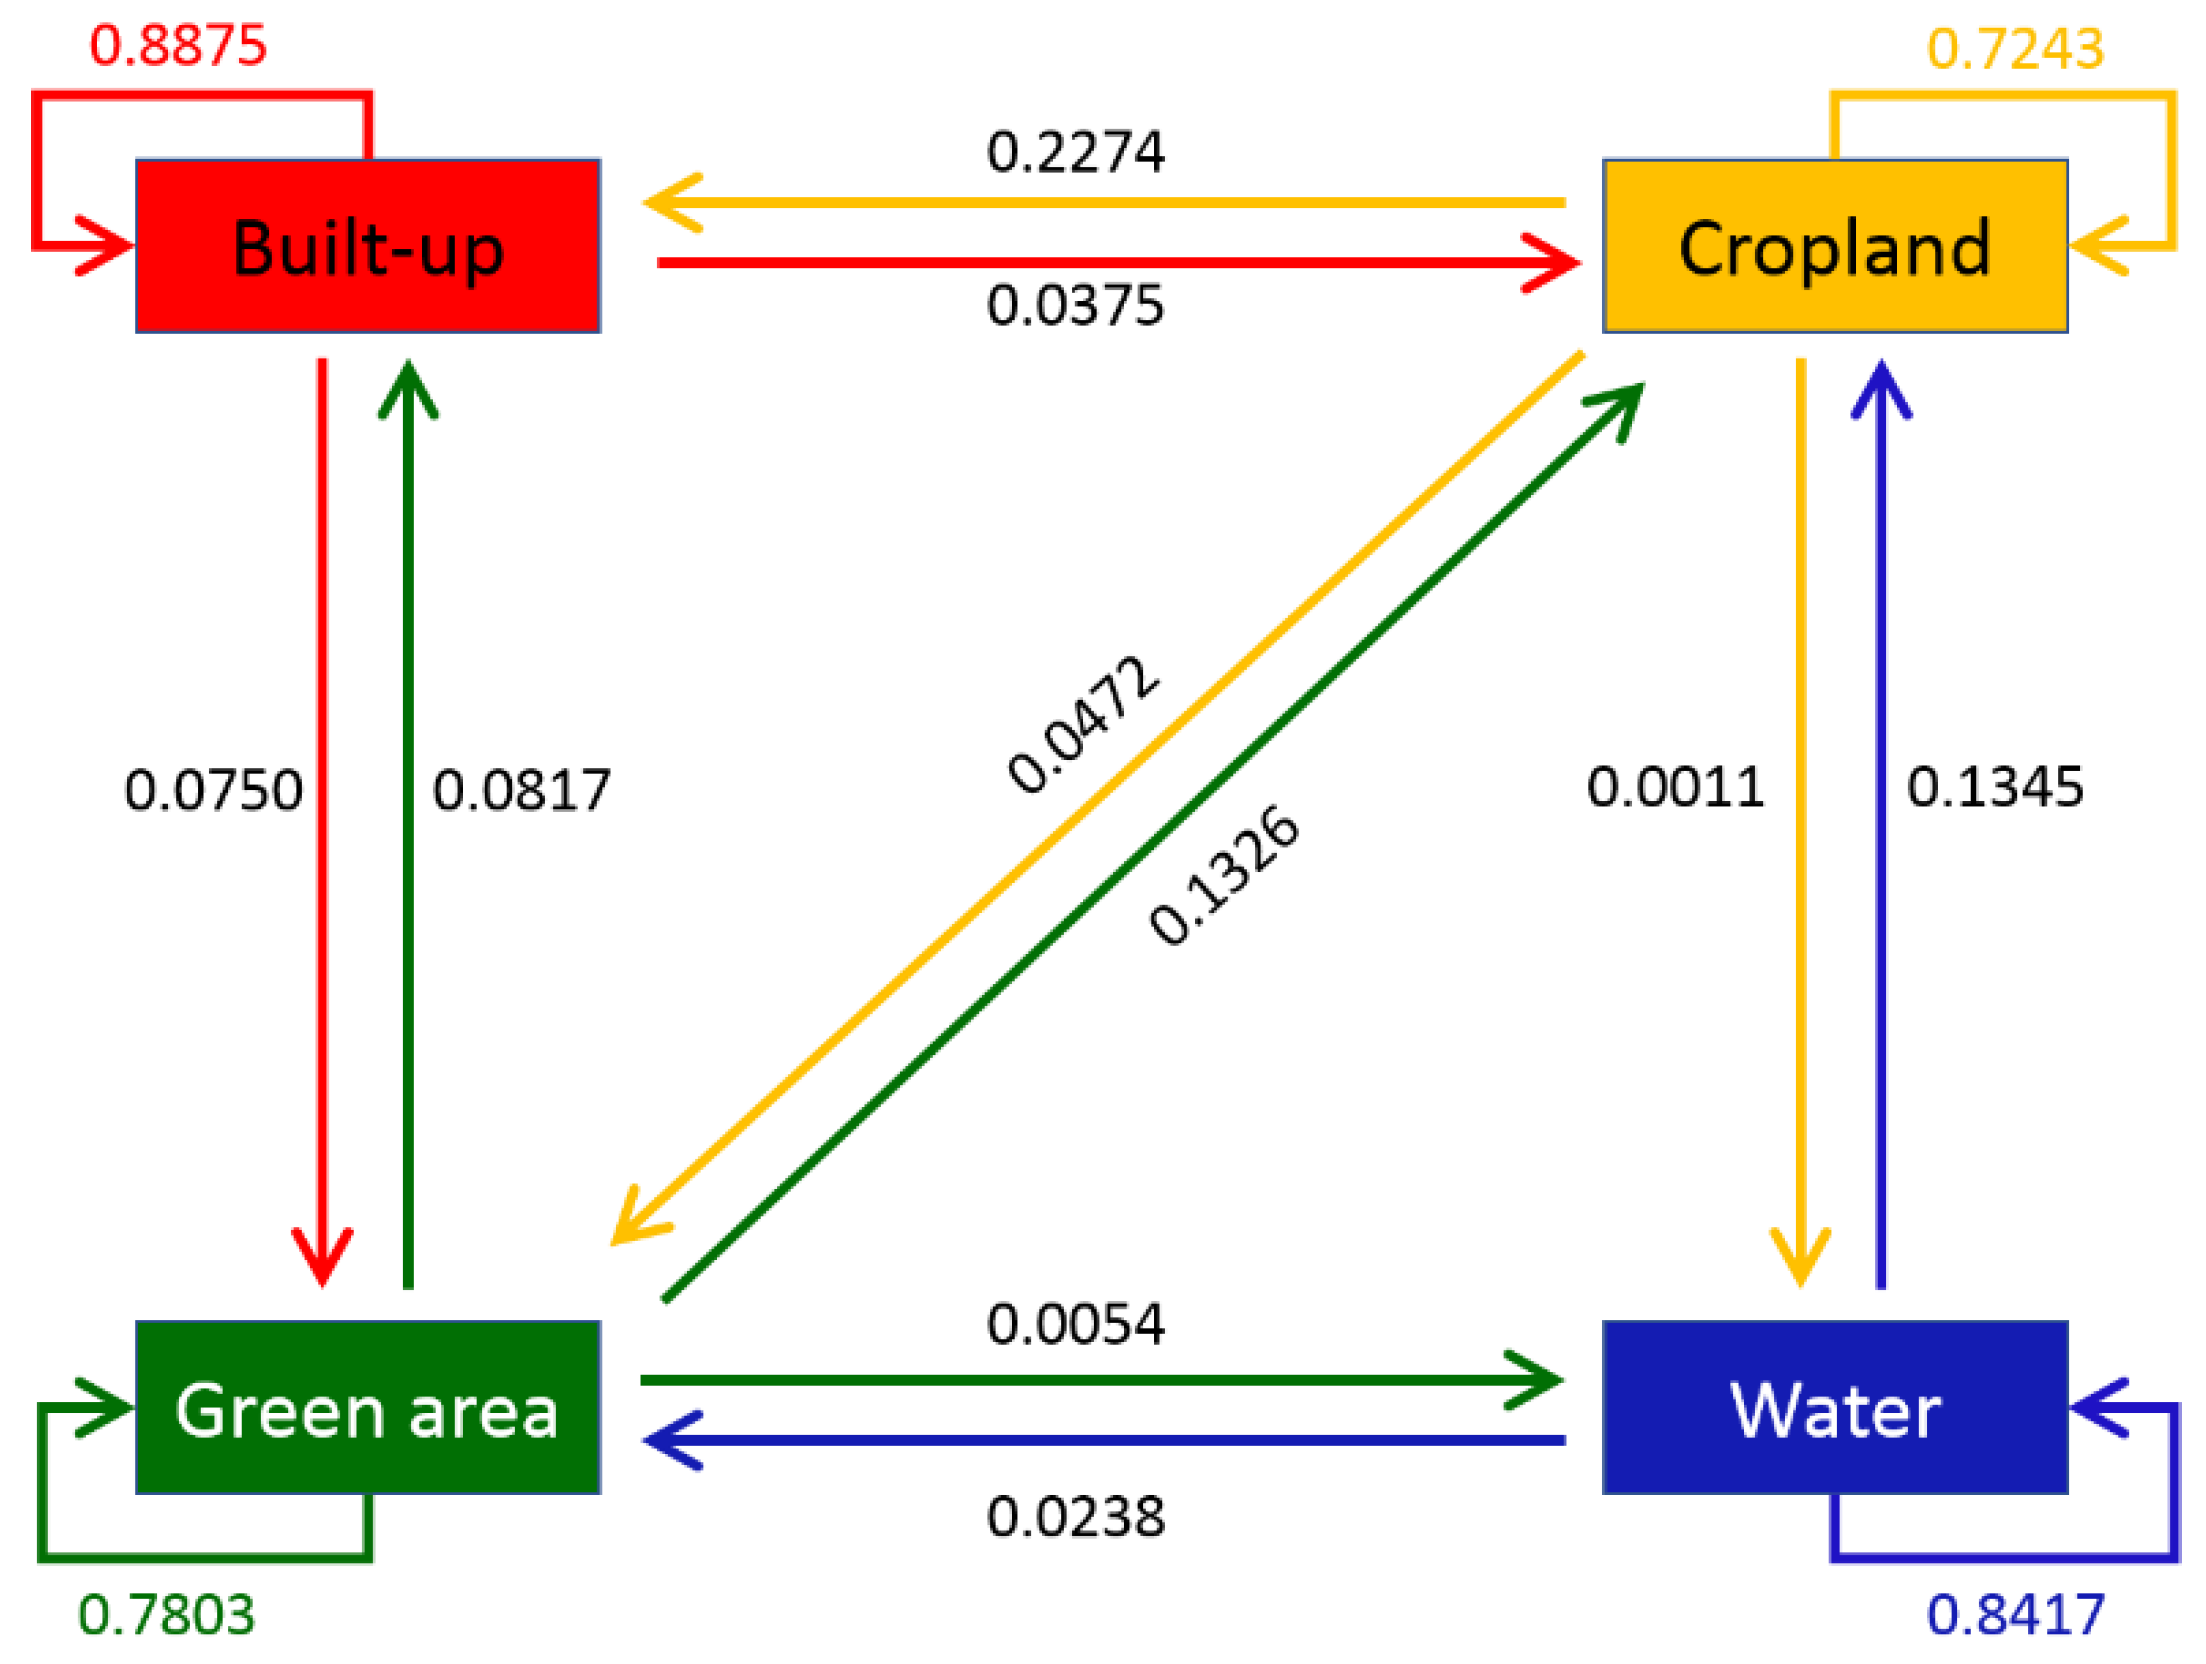
By using land use/cover maps in 2007 and 2017, a transition probability matrix was obtained. In Figure 6, arrows mark the transition probabilities from 2007 to 2017. During this period, 23% of the total cropland area was transformed into built-up areas. At the same time, 23% of forest and grassy areas that belonged to green space changed to cropland. Built-up areas owned by individuals and water areas remained without significant changes. The interesting point is that 7.5% of built-up areas were transformed into green areas and 8.17% of green areas were changed to built-up settlements. The reason behind that is probably population decline and aging and the requirement for a good quality environment. Some green areas have been rejuvenated and adjusted to meet people’s demands. This transition probability matrix was used as a previous trend indicator and added to the cellular automata model to get the simulation results of the distribution of land use/cover under the three scenarios.
Validation is an essential step in checking the effectiveness of land use/cover change models. In this study, first we used land use/cover maps in 2001 and 2007 to calculate a transition probability matrix. Second, we integrated the transition probability matrix and modeling variables in the CA-Markov model to derive the 2017’s simulation map. Third, we compared the resulting simulation map with the actual classified map of 2017. In this study, owing to the CA-Markov model being a spatiotemporal model, kappa value alone cannot accurately reflect spatial changes [59]. The Map Comparison Kit 3 is a good alternative to present the different errors not only in quantity, but also in location [60]. By considering this reason, the Map Comparison Kit 3 was selected to validate our simulation results [61]. Consequently, we compared the simulated and classified maps of 2017, and kappa histogram, kappa location, and kappa simulation were calculated to be 0.942, 0.928, and 0.874, respectively. These results confirm the validity of our simulation model.
3.4. Simulation Scenarios
Using the land use/cover map of 2017, modeling variables, and transition probability between 2007 and 2017 (Figure 6), we performed land use/cover change simulation for the years 2027 and 2037 under the three scenarios mentioned above (SS, SRD and GSI). Figure 7 shows the simulated spatiotemporal maps with four categories: built-up, cropland, green area, and water. In 2017, the proportion of built-up is 29.49%, under SS, the proportion of built-up is expected to increase by 34.30% and 38.96% in 2027 and 2037, respectively. At the same time, cropland is expected to decrease and be changed to built-up areas. If the same historical trends from 2007 to 2017 continue without any policies or limitations, the cropland and green space areas are going be covered by built-up areas. On the other hand, under SRD and GSI, only a small area of build-up is anticipated to be added in both 2027 and 2037, and little cropland changed to built-up areas. In contrast with SS and SRD, under GSI, green space is predicted to increase to 46% by 2027 and to record a slight decrease to 45% by 2037.
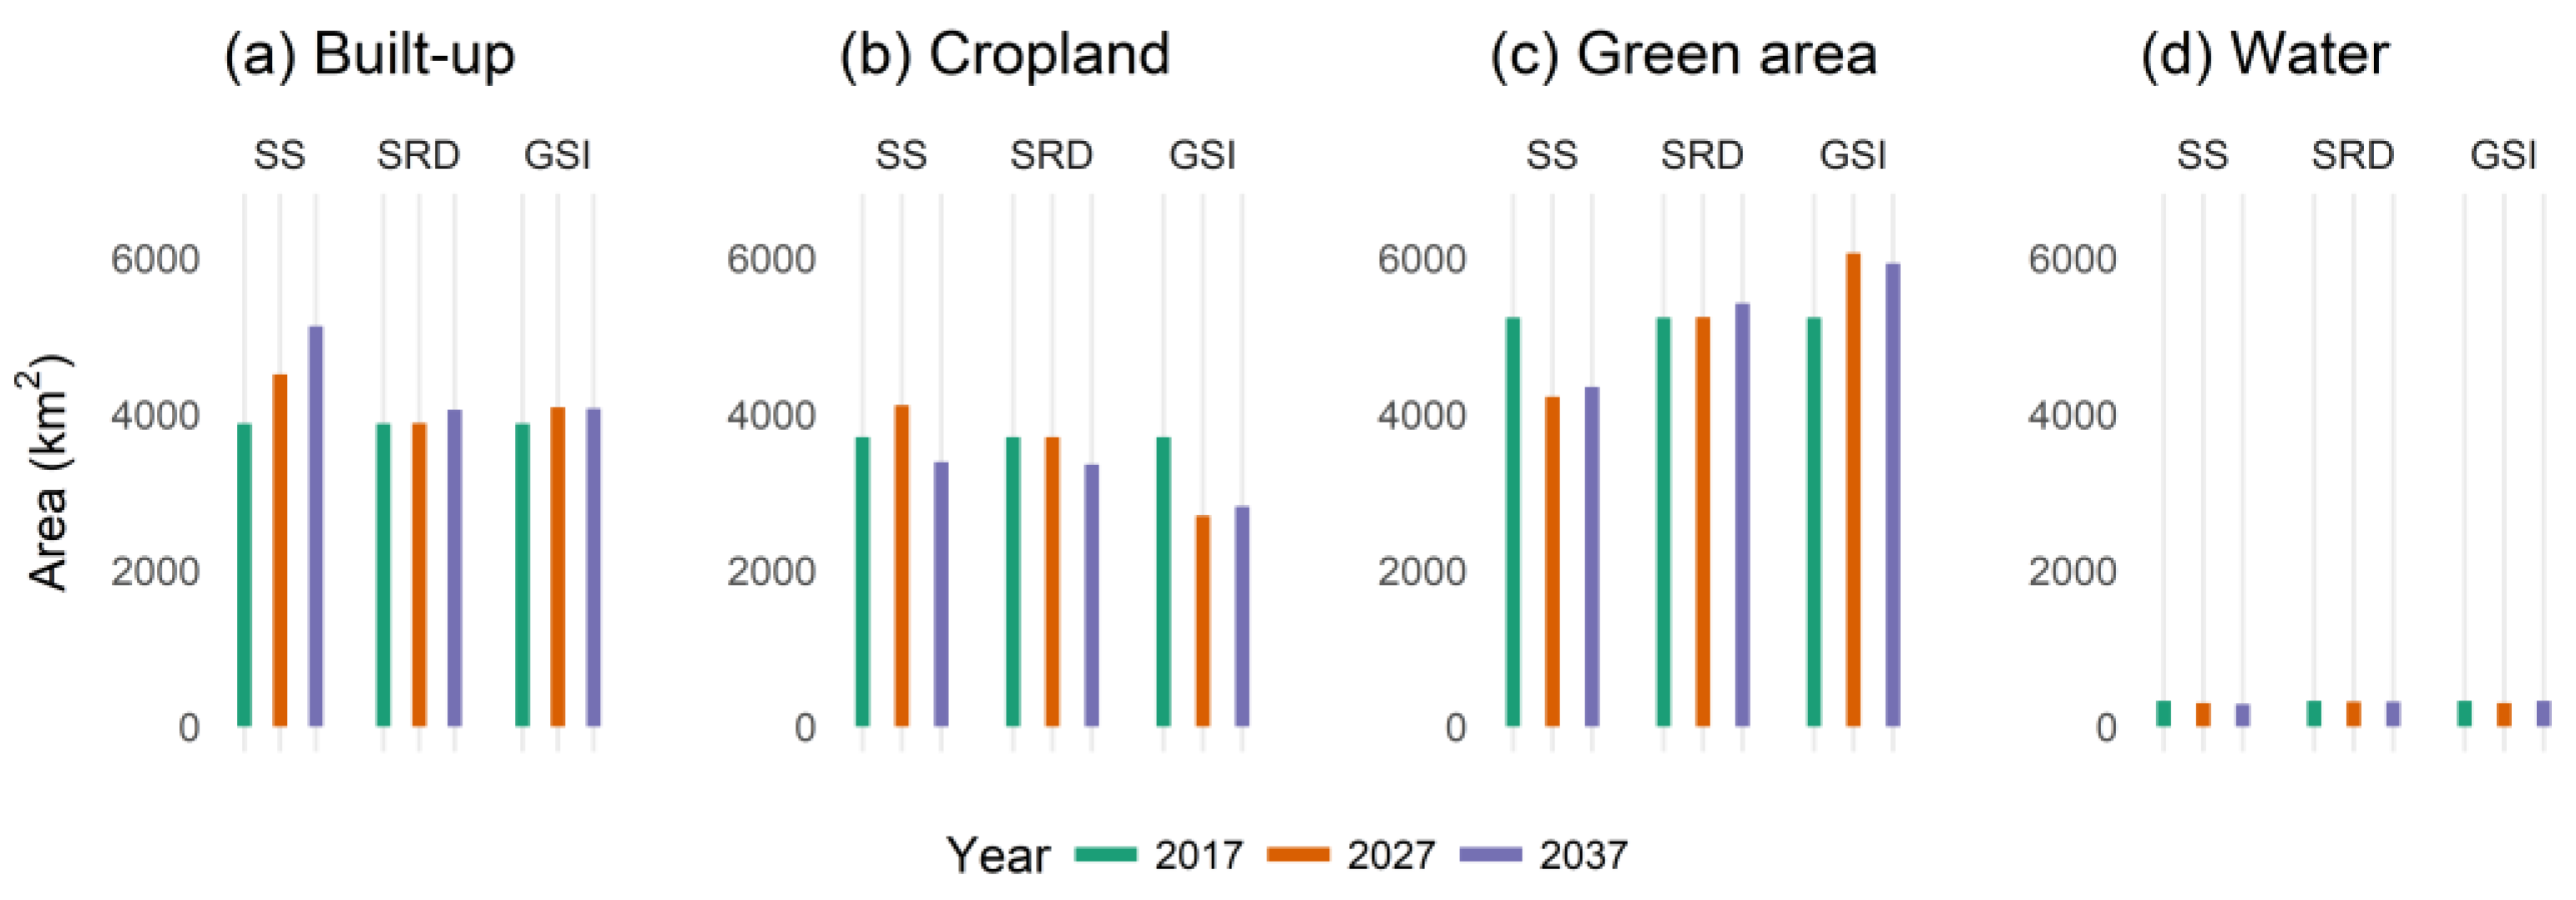
Figure 8 illustrates the area changes for each category under the three scenarios. Under SS, the built-up area increases persistently from 2017 to 2037. From 2017 to 2037, a total of 12.14% of area from other land use/cover types is expected to be transformed into built-up area. Under SRD, all the classes register only a small change from 2017 to 2027. However, between 2027 and 2037, 0.04% of cropland area is anticipated to be changed into built-up area. Under GSI, a decrease of 0.13% of built-up area is expected to occur from 2027 to 2037 due to the fact that built-up areas are controlled to establish a compact city. In addition, the green area under GSI has the biggest proportion among the three scenarios.
4. Discussion
Existing studies have found a correlation between land use/cover change and government policies, indicating that urban sprawl and green space improvement are influenced by various factors, for instance population trends and zoning plans [5,26]. In Japan, many policies have been implemented for urban planning, resulting in better gains and good effects [62]. For example, after the Second World War, with the population increase and economic boom, the government of Japan concentrated on establishing the railway system. After that, sub-region development began along the railway lines, and the railway stations have gradually emerged as local centers [63]. Although there are many big metropolitan areas in Japan, the Tokyo metropolitan area is always considered as a successful example that developing cities can learn from. However, some problems have appeared during urban development. One of the most serious is population decline. Projections of the Japanese National Institute of Population and Social Security Research, indicate that if the birth rate remains at the present level, by 2050 the current population of 126 million is expected to fall to 90 million [64]. At the same time, with aging of the population at unprecedented levels, a lot of problems are expected to appear, such as the need to improve the living environment and remain urban-competitive, energy conservation issues, and so on [64,65]. Based on these circumstances, simulation under various scenarios is an effective way to provide meaningful information for government and city planners.
In this study, by considering sustainable development and government policies, combining past conditions and spatial factors, SS, SRD, and GSI scenarios have been considered to estimate future land use/cover changes. Spatiotemporal simulation under the three scenarios reflects that even if historical trends and interactions in space are the driving forces in the simulation process, government regulations are also a significant driving factor for urban development. Moreover, previous studies declared that during the land use/cover change process, government policies play a crucial role in sustainable development and environmental improvement [52,66]. During the decade from 2007 to 2017, land use/cover change in the study area revealed a lot of problems related to population aging, green space improvement, and an imbalance in terms of district development. To overcome these issues, city planners and governments adopted new plans and policies to control future development. From the simulation results for 2027 and 2037, we find that SRD and GSI are different than SS. If we only concentrate on historical trends, the built-up zones will continue to enlarge until all space is changed into built-up areas. SRD and GSI suggest that establishing a zoning plan can be effective to avoid chaotic urban sprawl and wasted public facilities. The cropland area under the SRD scenario is more considerable than the one under the GSI scenario; the reason for this is that in SRD, UCA is considered as a restricted area to limit urban sprawl and ensure the balance between cropland and green space. In the near future, due to the population decreasing and aging, it is expected that there will be greater demand for green than for cropland; subsequently, the structure of land use/cover in the study area is anticipated to change from the state under SRD to that under GSI.
To achieve the selected three scenarios’ simulation results, a hybrid CA-Markov model was employed in this study. By changing modeling variables and settings of restricted areas, we detected the potential change parts in the study area. Based on these changes and the historical trends, the three scenarios could be simulated. In this study, we selected the Tokyo metropolitan area, composed of the capital city Tokyo and Chiba, Saitama, and Kanagawa prefectures, as a case study to perform a detailed analysis of land use/cover change estimation for 2027 and 2037. Similar to other metropolitan areas, like Beijing and Shanghai, the Tokyo metropolitan area has more than 10% of cropland areas that potentially can be changed to built-up areas. However, the difference is in the population change rate; in other words, the birth rate in Japan is very low, and if it continues decreasing, the built-up areas located in sub-regions will disappear, and as a result, the study area will become a shrunken city [67,68]. For these reasons, predicting land use/cover distribution in the immediate future gets more and more critical, thus simulating conditions under different scenarios can provide valuable information in order to avoid many issues, including chaotic urban sprawl.
Our study affirms that government policies play an important role in simulation under the three scenarios. Considering that the population is decreasing and aging, the demand for green space is expected to increase for a healthy living environment. Normally, cropland and green space loss is indirectly caused by built-up expansion based on policies and previous trends; keeping a balance between cropland and green space is a critical challenge in this study. It is essential for the Japanese government to put more attention on promoting green space, especially in residential areas.
5. Conclusions
This study presents an overview of land use/cover changes that are expected to occur in the Tokyo metropolitan area in 2027 and 2037, relying on past spatiotemporal trends of urban growth detected across the decade 2007 to 2017 using GIS techniques and remotely sensed data. To that end, a hybrid model composed of cellular automata and Markov model was employed. The inputs of the model consisted of the classified maps of 2007 and 2017 and the modeling variables that influence the distribution of land use/cover. The outcomes of the present study reveal that the metropolitan area has undergone major transformations from 2007 to 2017, demonstrated by an increase in its built-up and cropland areas (approximately 23%). To diversify the possible outcomes, three scenarios were considered based on sustainable development and government policies: SS, SRD, and GSI. SS is based on previous trends without any limitation to simulate land use/cover changes in the near future. SRD is designed based on the Urban Land Use Planning System in Japan to keep the balance between urban and rural areas. GSI is considered by the Urban Green Space Conservation Act to establish a significant environment for living and sustainable development.
Simulation results show varied patterns of changes depending on the scenario. First, if the present trends of changes of land use/cover remain without any interventions or enforced policies by the government, urban areas are expected to expand during the next two decades at the expense of cropland areas, which means strong pressure of urban development processes over land resources. In addition, the percentage of green spaces is predicted to stay unchanged, keeping in mind that the increasing aging population requires a healthy environment, and will present several issues in terms of urban living conditions, mainly for aged individuals. Second, if the government enforces zoning policy, urban areas are expected to increase at a very slow rate. Similar to the first scenario, croplands are expected to shrink, however at a slow pace. Last, if the government opts to improve green spaces, minimal variations are forecasted for all landscape categories. The last two scenarios are pro green spaces. However, SRD seems to be the most balanced scenario in terms of a slow urban development process, minimum pressure exercised on environment resources, and encouragement of green areas.
Considered one of the largest urban areas in the world, the Tokyo metropolitan area is under pressure because of changes of its land use/cover. Such transformations cause many issues related essentially to the depletion of resources and the quality of the environment. For sustainable urban development, proper planning based on the output of reliable mathematically based models is crucial. This study provides valuable information on the spatiotemporal changes expected to happen in 2027 and 2037. Additionally, it shows the strength of integrating optimized GIS techniques and freely available remotely sensed data to extract useful information.
Author Contributions
R.W. and Y.M. together conceived the idea and research design of this study. R.W. collected the data, performed data analysis and wrote the original draft of the manuscript. A.D. performed data analysis, partly wrote and writing-reviewed the original draft of the manuscript.
Funding
This study was supported by JSPS Grant-in-Aid for Challenging Exploratory Research 16K12816.
Acknowledgments
The authors would like to thank the anonymous reviewers for their valuable comments and suggestions.
Conflicts of Interest
The authors declare no conflict of interest.
Appendix A

Table A1.
Confusion matrix of land use/cover classification map in 2001.
| Classified Data | Reference Data | Total | User’s Accuracy (%) | |||
|---|---|---|---|---|---|---|
| Built-Up | Cropland | Forest | Water | |||
| Built-up | 81 | 3 | 5 | 1 | 90 | 90 |
| Cropland | 7 | 108 | 19 | 6 | 140 | 77 |
| Forest | 7 | 15 | 114 | 8 | 144 | 79 |
| Water | 0 | 2 | 3 | 21 | 26 | 81 |
| Total | 95 | 128 | 141 | 36 | 400 | |
| Producer’s Accuracy (%) | 85 | 84 | 81 | 58 | ||
Table A2.
Confusion matrix of land use/cover classification map in 2007.
| Classified Data | Reference Data | Total | User’s Accuracy (%) | |||
|---|---|---|---|---|---|---|
| Built-Up | Cropland | Forest | Water | |||
| Built-up | 93 | 6 | 8 | 0 | 107 | 87 |
| Cropland | 6 | 97 | 15 | 5 | 123 | 79 |
| Forest | 8 | 13 | 118 | 7 | 146 | 81 |
| Water | 0 | 3 | 2 | 19 | 24 | 79 |
| Total | 107 | 119 | 143 | 31 | 400 | |
| Producer’s Accuracy (%) | 87 | 82 | 83 | 61 | ||
Table A3.
Confusion matrix of land use/cover classification map in 2017.
| Classified Data | Reference Data | Total | User’s Accuracy (%) | |||
|---|---|---|---|---|---|---|
| Built-Up | Cropland | Forest | Water | |||
| Built-up | 105 | 4 | 9 | 0 | 118 | 89 |
| Cropland | 3 | 92 | 13 | 7 | 115 | 80 |
| Forest | 6 | 13 | 117 | 3 | 139 | 84 |
| Water | 0 | 4 | 3 | 21 | 28 | 75 |
| Total | 114 | 113 | 142 | 31 | 400 | |
| Producer’s Accuracy (%) | 92 | 81 | 82 | 68 | ||
References
- Thapa, R.B.; Murayama, Y. Examining spatiotemporal urbanization patterns in Kathmandu Valley, Nepal: Remote Sensing and Spatial Metrics Approaches. Remote Sens. 2009, 1, 534–556. [Google Scholar] [CrossRef]
- Zhang, R.; Matsushima, K.; Kobayashi, K. Can land use planning help mitigate transport-related carbon emissions? A case of Changzhou. Land Use Policy 2018, 74, 32–40. [Google Scholar] [CrossRef]
- Khoi, D.D.; Murayama, Y. Delineation of suitable cropland areas using a GIS based multi-criteria evaluation approach in the tam dao national park region, vietnam. Sustainability 2010, 2, 2024–2043. [Google Scholar] [CrossRef]
- Waddell, P. Urbansim: Modeling urban development for land use, transportation, and environmental planning. J. Am. Plan. Assoc. 2002, 68, 297–314. [Google Scholar] [CrossRef]
- Chi, G.; Ho, H.C. Population stress: A spatiotemporal analysis of population change and land development at the county level in the contiguous United States, 2001–2011. Land Use Policy 2018, 70, 128–137. [Google Scholar] [CrossRef] [PubMed]
- Cohen, B. Urban growth in developing countries: A review of current trends and a caution regarding existing forecasts. World Dev. 2004, 32, 23–51. [Google Scholar] [CrossRef]
- Pielke, R.A.; Marland, G.; Betts, R.A.; Chase, T.N.; Eastman, J.L.; Niles, J.O.; Niyogi, D.; Dutta, S.; Running, S.W. The influence of land-use change and landscape dynamics on the climate system: Relevance to climate-change policy beyond the radiative effect of greenhouse gases. Phil. Trans. R. Soc. Lond. A 2002, 360, 1705–1719. [Google Scholar] [CrossRef] [PubMed]
- The Word Bank. Available online: http://databank.worldbank.org (accessed on 12 May 2018).
- Faruqee, H.; Mühleisen, M. Population aging in Japan: Demographic shock and fiscal sustainability. Jpn. World Econ. 2003, 15, 185–210. [Google Scholar] [CrossRef]
- Bloom, D.E.; Chatterji, S.; Kowal, P.; Lloyd-Sherlock, P.; McKee, M.; Rechel, B.; Rosenberg, L.; Smith, J.P. Macroeconomic implications of population ageing and selected policy responses. Lancet 2015, 385, 649–657. [Google Scholar] [CrossRef] [Green Version]
- Oliver, M. Population ageing and economic growth in Japan. Int. J. Sociol. Soc. Policy 2015, 35, 841–863. [Google Scholar] [CrossRef]
- AKASHI, T. Urban Land Use Planning System in Japan (2nd Edition). Available online: https://jica-net-library.jica.go.jp (accessed on 4 May 2018).
- Yamagata, Y.; Seya, H. Simulating a Future Smart City: An Integrated Land Use-Energy Model. Appl. Energy 2013, 112, 1466–1474. [Google Scholar] [CrossRef]
- Iwata, K.; Managi, S. Can land use regulations and taxes help mitigate vehicular CO2 emissions? An empirical study of Japanese cities. Urban Policy Res. 2016, 34, 356–372. [Google Scholar] [CrossRef]
- Jaeger, J.A.G.; Bertiller, R.; Schwick, C.; Kienast, F. Suitability criteria for measures of urban sprawl. Ecol. Indic. 2010, 10, 397–406. [Google Scholar] [CrossRef]
- Dantzig, G.B.; Saaty, T.L. Compact City: A Plan for a Liveable Urban Environment; W. H. Freeman: San Francisco, CA, USA, 1973; pp. 225–233. ISBN 978-0-7167-0784-4. [Google Scholar]
- Saaty, T.L.; De Paola, P. Rethinking design and urban planning for the cities of the future. Buildings 2017, 7, 76. [Google Scholar] [CrossRef]
- Yokohari, M.; Takeuchi, K.; Watanabe, T.; Yokota, S. Beyond greenbelts and zoning: A new planning concept for the environment of Asian mega-cities. Landsc. Urban Plan. 2000, 47, 159–171. [Google Scholar] [CrossRef]
- Zhao, Y.; Murayama, Y. Effect of spatial scale on urban land-use pattern analysis in different classification systems. Theory Appl. GIS 2006, 14, 29–42. [Google Scholar] [CrossRef]
- Shi, G.; Jiang, N.; Yao, L. Land use and cover change during the rapid economic growth period from 1990 to 2010: A case study of shanghai. Sustainability 2018, 10, 426. [Google Scholar] [CrossRef]
- Bathrellos, G.D.; Gaki-Papanastassiou, K.; Skilodimou, H.D.; Papanastassiou, D.; Chousianitis, K.G. Potential suitability for urban planning and industry development using natural hazard maps and geological–geomorphological parameters. Environ. Earth Sci 2012, 66, 537–548. [Google Scholar] [CrossRef]
- Park, S.; Jeon, S.; Kim, S.; Choi, C. Prediction and comparison of urban growth by land suitability index mapping using GIS and RS in South Korea. Landsc. Urban Plan. 2011, 99, 104–114. [Google Scholar] [CrossRef]
- Bathrellos, G.D.; Skilodimou, H.D.; Chousianitis, K.; Youssef, A.M.; Pradhan, B. Suitability estimation for urban development using multi-hazard assessment map. Sci. Total Environ. 2017, 575, 119–134. [Google Scholar] [CrossRef] [PubMed]
- Papadopoulou-Vrynioti, K.; Bathrellos, G.D.; Skilodimou, H.D.; Kaviris, G.; Makropoulos, K. Karst collapse susceptibility mapping considering peak ground acceleration in a rapidly growing urban area. Eng. Geol. 2013, 158, 77–88. [Google Scholar] [CrossRef]
- Su, S.; Sun, Y.; Lei, C.; Weng, M.; Cai, Z. Reorienting paradoxical land use policies towards coherence: A self-adaptive ensemble learning geo-simulation of tea expansion under different scenarios in subtropical China. Land Use Policy 2017, 67, 415–425. [Google Scholar] [CrossRef]
- Lai, S.; Leone, F.; Zoppi, C. Land cover changes and environmental protection: A study based on transition matrices concerning Sardinia (Italy). Land Use Policy 2017, 67, 126–150. [Google Scholar] [CrossRef]
- Jia, Z.; Ma, B.; Zhang, J.; Zeng, W. Simulating spatial-temporal changes of land-use based on ecological redline restrictions and landscape driving factors: A case study in beijing. Sustainability 2018, 10, 1299. [Google Scholar] [CrossRef]
- Zhang, Y.; Wang, P.; Wang, T.; Cai, C.; Li, Z.; Teng, M. Scenarios simulation of spatio-temporal land use changes for exploring sustainable management strategies. Sustainability 2018, 10, 1013. [Google Scholar] [CrossRef]
- He, C.; Shi, P.; Chen, J.; Li, X.; Pan, Y.; Li, J.; Li, Y.; Li, J. Developing land use scenario dynamics model by the integration of system dynamics model and cellular automata model. Sci. China Ser. D 2005, 48, 1979–1989. [Google Scholar] [CrossRef]
- Hoek, G.; Beelen, R.; de Hoogh, K.; Vienneau, D.; Gulliver, J.; Fischer, P.; Briggs, D. A review of land-use regression models to assess spatial variation of outdoor air pollution. Atmos. Environ. 2008, 42, 7561–7578. [Google Scholar] [CrossRef]
- Civco, D.L. Artificial neural networks for land-cover classification and mapping. Int. J. Geogr. Inf. Syst. 1993, 7, 173–186. [Google Scholar] [CrossRef]
- Harvey, M.; Pilgrim, S. The new competition for land: Food, energy, and climate change. Food Policy 2011, 36, S40–S51. [Google Scholar] [CrossRef]
- Rimal, B.; Zhang, L.; Keshtkar, H.; Sun, X.; Rijal, S. Quantifying the spatiotemporal pattern of urban expansion and hazard and risk area identification in the Kaski district of Nepal. Land 2018, 7, 37. [Google Scholar] [CrossRef]
- Chen, Y.; Li, X.; Liu, X.; Ai, B. Modeling urban land-use dynamics in a fast developing city using the modified logistic cellular automaton with a patch-based simulation strategy. Int. J. Geogr. Inf. Sci. 2014, 28, 234–255. [Google Scholar] [CrossRef]
- Traore, A.; Mawenda, J.; Komba, A.W. Land-cover change analysis and simulation in conakry (Guinea), using hybrid cellular-automata and markov model. Urban Sci. 2018, 2, 39. [Google Scholar] [CrossRef]
- Estoque, R.C.; Murayama, Y. Landscape pattern and ecosystem service value changes: Implications for environmental sustainability planning for the rapidly urbanizing summer capital of the Philippines. Landsc. Urban Plan. 2013, 116, 60–72. [Google Scholar] [CrossRef]
- Liu, X.; Liang, X.; Li, X.; Xu, X.; Ou, J.; Chen, Y.; Li, S.; Wang, S.; Pei, F. A future land use simulation model (FLUS) for simulating multiple land use scenarios by coupling human and natural effects. Landsc. Urban Plan. 2017, 168, 94–116. [Google Scholar] [CrossRef]
- Ahmed, B.; Kamruzzaman, M.; Zhu, X.; Rahman, M.S.; Choi, K. Simulating Land Cover Changes and Their Impacts on Land Surface Temperature in Dhaka, Bangladesh. Remote Sens. 2013, 5, 5969–5998. [Google Scholar] [CrossRef] [Green Version]
- Deilami, K.; Kamruzzaman, M. Modelling the urban heat island effect of smart growth policy scenarios in Brisbane. Land Use Policy 2017, 64, 38–55. [Google Scholar] [CrossRef]
- Tokyo City Plan (In Japanese). Available online: http://www.toshiseibi.metro.tokyo.jp (accessed on 4 May 2018).
- USGS. Earth Explorer. Available online: http://earthexplorer.usgs.gov/ (accessed on 12 April 2015).
- National Land Numerical Information Download Service. Available online: http://nlftp.mlit.go.jp/ (accessed on 7 May 2018).
- Protect Planet 2017–2018. Available online: https://www.protectedplanet.net (accessed on 30 April 2018).
- Subasinghe, S.; Estoque, R.C.; Murayama, Y. Spatiotemporal analysis of urban growth using GIS and remote sensing: A case study of the Colombo metropolitan area, Sri Lanka. ISPRS Int. J. Geo-Inf. 2016, 5, 197. [Google Scholar] [CrossRef]
- Phiri, D.; Morgenroth, J. Developments in Landsat Land Cover Classification Methods: A Review. Remote Sens. 2017, 9, 967. [Google Scholar] [CrossRef]
- Jokar Arsanjani, J.; Helbich, M.; Kainz, W.; Darvishi Boloorani, A. Integration of logistic regression, Markov chain and cellular automata models to simulate urban expansion. Int. J. Appl. Earth Obs. Geoinf. 2013, 21, 265–275. [Google Scholar] [CrossRef]
- Wang, R.; Murayama, Y. Change of land use/cover in Tianjin city based on the markov and cellular automata models. ISPRS Int. J. Geo-Inf. 2017, 6, 150. [Google Scholar] [CrossRef]
- Howard, D.M.; Howard, P.J.A.; Howard, D.C. A markov model projection of soil organic carbon stores following land use changes. J. Environ. Manag. 1995, 45, 287–302. [Google Scholar] [CrossRef]
- Gaudreau, J.; Perez, L.; Drapeau, P. BorealFireSim: A GIS-based cellular automata model of wildfires for the boreal forest of Quebec in a climate change paradigm. Ecol. Inf. 2016, 32, 12–27. [Google Scholar] [CrossRef]
- Mitsova, D.; Shuster, W.; Wang, X. A cellular automata model of land cover change to integrate urban growth with open space conservation. Landsc. Urban Plan. 2011, 99, 141–153. [Google Scholar] [CrossRef]
- Gong, W.; Yuan, L.; Fan, W.; Stott, P. Analysis and simulation of land use spatial pattern in Harbin prefecture based on trajectories and cellular automata—Markov modelling. Int. J. Appl. Earth Obs. Geoinf. 2015, 34, 207–216. [Google Scholar] [CrossRef]
- Yang, X.; Zheng, X.-Q.; Chen, R. A land use change model: Integrating landscape pattern indexes and Markov-CA. Ecol. Model. 2014, 283, 1–7. [Google Scholar] [CrossRef]
- Shafizadeh-Moghadam, H.; Tayyebi, A.; Ahmadlou, M.; Delavar, M.R.; Hasanlou, M. Integration of genetic algorithm and multiple kernel support vector regression for modeling urban growth. Comput. Environ. Urban Syst. 2017, 65, 28–40. [Google Scholar] [CrossRef]
- Bagan, H.; Yamagata, Y. Landsat analysis of urban growth: How Tokyo became the world’s largest megacity during the last 40 years. Remote Sens. Environ. 2012, 127, 210–222. [Google Scholar] [CrossRef]
- Kondoh, A.; Nishiyama, J. Changes in hydrological cycle due to urbanization in the suburb of Tokyo Metropolitan area, Japan. Adv. Space Res. 2000, 26, 1173–1176. [Google Scholar] [CrossRef]
- Votsis, A. Utilizing a cellular automaton model to explore the influence of coastal flood adaptation strategies on Helsinki’s urbanization patterns. Comput. Environ. Urban Syst. 2017, 64, 344–355. [Google Scholar] [CrossRef]
- Lu, D.; Weng, Q. Urban classification using full spectral information of landsat ETM+ imagery in Marion county, Indiana. Photogr. Eng. Remote Sens. 2005, 71, 1275–1284. [Google Scholar] [CrossRef]
- Wickham, J.D.; Stehman, S.V.; Gass, L.; Dewitz, J.; Fry, J.A.; Wade, T.G. Accuracy assessment of NLCD 2006 land cover and impervious surface. Remote Sens. Environ. 2013, 130, 294–304. [Google Scholar] [CrossRef]
- Jr, R.G.P.; Millones, M. Death to Kappa: Birth of quantity disagreement and allocation disagreement for accuracy assessment. Int. J. Remote Sens. 2011, 32, 4407–4429. [Google Scholar] [CrossRef]
- Ahmed, B.; Ahmed, R.; Zhu, X. Evaluation of model validation techniques in land cover dynamics. ISPRS Int. J. Geo-Inf. 2013, 2, 577–597. [Google Scholar] [CrossRef]
- Visser, H.; de Nijs, T. The Map Comparison Kit. Environ. Model. Softw. 2006, 21, 346–358. [Google Scholar] [CrossRef]
- Evans, N. Machi-zukuri as a new paradigm in Japanese urban planning: Reality or myth? Jpn. Forum 2002, 14, 443–464. [Google Scholar] [CrossRef]
- Sorensen, A. Land readjustment, urban planning and urban sprawl in the Tokyo Metropolitan Area. Urban Stud. 1999, 36, 2333–2360. [Google Scholar] [CrossRef]
- Millward, H. Urban containment strategies: A case-study appraisal of plans and policies in Japanese, British, and Canadian cities. Land Use Policy 2006, 23, 473–485. [Google Scholar] [CrossRef]
- Shimada, K.; Tanaka, Y.; Gomi, K.; Matsuoka, Y. Developing a long-term local society design methodology towards a low-carbon economy: An application to Shiga Prefecture in Japan. Energy Policy 2007, 35, 4688–4703. [Google Scholar] [CrossRef]
- Ashina, S.; Nakata, T. Energy-efficiency strategy for CO2 emissions in a residential sector in Japan. Appl. Energy 2008, 85, 101–114. [Google Scholar] [CrossRef]
- Hospers, G.-J. Policy Responses to Urban Shrinkage: From Growth Thinking to Civic Engagement. Eur. Plan. Stud. 2014, 22, 1507–1523. [Google Scholar] [CrossRef]
- Yang, J.; Su, J.; Chen, F.; Xie, P.; Ge, Q. A local land use competition cellular automata model and its application. ISPRS Int. J. Geo-Inf. 2016, 5, 106. [Google Scholar] [CrossRef]
Figure 1.
(a) Location of Japan; (b) location of the study area; and (c) extent of the study area.

Figure 2.
Spatial patterns of the eight variables: (a) digital elevation model (DEM); (b) slope; (c) distance to Tokyo station (CBD); (d) distance to railways; (e) railway station buffer (500 m); (f) urbanization promotion area (UPA); (g) urbanization control area (UCA); and (h) protection area.
Figure 2.
Spatial patterns of the eight variables: (a) digital elevation model (DEM); (b) slope; (c) distance to Tokyo station (CBD); (d) distance to railways; (e) railway station buffer (500 m); (f) urbanization promotion area (UPA); (g) urbanization control area (UCA); and (h) protection area.

Figure 3.
Variables considered for the (a) sub-region development (SRD) scenario and (b) green space improvement (GSI) scenario.
Figure 3.
Variables considered for the (a) sub-region development (SRD) scenario and (b) green space improvement (GSI) scenario.

Figure 4.
Proposed methodological framework for land use/cover change simulation.

Figure 5.
Land use/cover map and change transition. (a) Land use/cover map in 2007; (b) land use/cover map in 2017; and (c) change map between 2007 and 2017.
Figure 5.
Land use/cover map and change transition. (a) Land use/cover map in 2007; (b) land use/cover map in 2017; and (c) change map between 2007 and 2017.

Figure 6.
Transition probabilities from 2007 to 2017.

Figure 7.
Land use/cover change maps (2017–2027 and 2027–2037) and land use/cover maps in 2027 and 2037 based on spontaneous scenario (SS), sub-region development (SRD) scenario, and green space improvement (GSI) scenario.
Figure 7.
Land use/cover change maps (2017–2027 and 2027–2037) and land use/cover maps in 2027 and 2037 based on spontaneous scenario (SS), sub-region development (SRD) scenario, and green space improvement (GSI) scenario.

Figure 8.
Land use/cover change delineation analysis under the three scenarios.

Table 1.
Landsat images used in this study.
| Data Type | Date Acquired (Day-Month-Year) | Season | Path | Row | Spatial Resolution (m) |
|---|---|---|---|---|---|
| Landsat-7 ETM+ | 27-11-2001 | Winter | 108 | 035 | 30 |
| 11-11-2001 | Winter | 107 | 035 | 30 | |
| 20-12-2001 | Winter | 107 | 036 | 30 | |
| Landsat-5 TM | 12-02-2007 | Winter | 108 | 035 | 30 |
| 12-05-2007 | Spring | 107 | 035 | 30 | |
| 12-05-2007 | Spring | 107 | 036 | 30 | |
| Landsat-8 OLI/TIRS | 16-02-2017 | Winter | 108 | 035 | 30 |
| 20-03-2017 | Spring | 107 | 035 | 30 | |
| 23-05-2017 | Spring | 107 | 036 | 30 |
© 2018 by the authors. Licensee MDPI, Basel, Switzerland. This article is an open access article distributed under the terms and conditions of the Creative Commons Attribution (CC BY) license (http://creativecommons.org/licenses/by/4.0/).
Share and Cite
MDPI and ACS Style
Wang, R.; Derdouri, A.; Murayama, Y. Spatiotemporal Simulation of Future Land Use/Cover Change Scenarios in the Tokyo Metropolitan Area. Sustainability 2018, 10, 2056. https://0-doi-org.brum.beds.ac.uk/10.3390/su10062056
AMA Style
Wang R, Derdouri A, Murayama Y. Spatiotemporal Simulation of Future Land Use/Cover Change Scenarios in the Tokyo Metropolitan Area. Sustainability. 2018; 10(6):2056. https://0-doi-org.brum.beds.ac.uk/10.3390/su10062056
Chicago/Turabian StyleWang, Ruci, Ahmed Derdouri, and Yuji Murayama. 2018. "Spatiotemporal Simulation of Future Land Use/Cover Change Scenarios in the Tokyo Metropolitan Area" Sustainability 10, no. 6: 2056. https://0-doi-org.brum.beds.ac.uk/10.3390/su10062056
Note that from the first issue of 2016, this journal uses article numbers instead of page numbers. See further details here.