Startups’ Roads to Failure


1
Politecnico di Torino, 10129 Turin, Italy
2
ICT for City Logistics and Enterprises Center, Politecnico di Torino, 10129 Turin, Italy
3
Centre Interuniversitaire de Recherche sur les Réseaux d’Entreprise, la Logistique et le Transport (CIRRELT), Montreal, H3T 1J4 QC, Canada
*
Author to whom correspondence should be addressed.
Sustainability 2018, 10(7), 2346; https://0-doi-org.brum.beds.ac.uk/10.3390/su10072346
Submission received: 14 June 2018
/
Revised: 2 July 2018
/
Accepted: 3 July 2018
/
Published: 6 July 2018
(This article belongs to the Collection Firm Size and Sustainable Innovation Management)
Abstract
:The role of a relatively small cadre of high-tech startup firms in driving innovation and economic growth has been well known and amply celebrated in recent history. At the same time, it is well recognized that, while the overall contribution of startups is crucial, the high-risk and high-reward strategy followed by these startups leads to significant failure rates and a low ratio of successful startups. So, it is curious to notice that literature tends to focus on successful startups and on quantitative studies looking for determinants of success while neglecting the numerous lessons that can be drawn by examining the stories of startups that failed. This paper aims to fill this gap and to contribute to the literature by providing a repeatable and scalable methodology that can be applied to databases of unstructured post-mortem documents deriving startup failure patterns. A further and related contribution is the analysis carried out with this methodology to a large database of 214 startup post-mortem reports. Descriptive statistics show how the lack of a structured Business Development strategy emerges as a key determinant of startup failure in the majority of cases.
1. Introduction
One of the most evident phenomena in the contemporary economy is the impact of new firms on innovation trajectories and the economy itself. Some authors note that innovation is driven and done by a small subset of the new firms, while a large part of the enterprises plays a marginal role [1]. While in the 20th century the interest in ‘Schumpeterian’ entrepreneurs was relatively limited [2], in recent years a new spotlight was placed over the figure of startup entrepreneurs, with researchers and the generalist media recognizing the ability to create outsized value. More recently, new processes followed by entrepreneurs in creating successful startups have been studied and codified (i.e., the popular Lean Startup approach) and researchers have started studying how entrepreneurs operate within such frameworks [3]. A long-lasting research topic in studies of entrepreneurship and new business venturing is the understanding of the determinants behind failure and success of new ventures. This is particularly relevant for high-tech startups, given that these firms follow high-risk and high-reward strategies that tend to lead them to either failure or vast success, a strategy that well suits the business model of the venture capital firms that fund them. Success and failure of startup firms are usually studied with quantitative approaches based on financial data, and by looking at correlations with elements that can be conjectured to have a role such as the entrepreneur’s ability, the company’s core competencies, and the characteristics of the relevant market. This stream of literature is endlessly rich, and only a few examples can be provided in this paper. For instance, early approaches [4,5] proposed to use a firm’s financial data to predict its probability to fail. The first statistical models developed were based on discriminant analysis [5] and multiple discriminant analysis [4], followed by more recent approaches exploiting regression [6,7,8]. Since the 80s, artificial intelligence methods started to be used as well to predict ventures success/failure. Suggested solutions relied on decision trees algorithms [9], artificial neural networks [10], clustering [11] and hybrid genetic algorithms [12]. Approaches based on financial data had the advantage of being potentially applied to a high number of companies, since data could be gathered from their annual reports. Nonetheless, company revenues were frequently consequences of other aspects, such as entrepreneur’s ability, company’s core competencies, market, etc. In this view, other research works investigated whether such aspects could contribute as well to the success or failure of a venture. For instance, analysis conducted on entrepreneurs examined the influence of their gender and ethnic origin on the likelihood to succeed or fail [13,14]. The work in [15] conducted a logistic regression analysis based on 15 independent variables success versus failure prediction model in Israel, including the management experience, the education, and the age of the owner. The logistic regression analysis was also adopted in [16] to model the relationship between small business mortality rates and the aggregate levels of internal and external risks (e.g., bankruptcy related to interest rates, discontinuance of business or of ownership, etc.). Other researchers focused on entrepreneurial attitudes and linked startup failure to dissonances between corporate goals and the goals of its founders [17]. Others presented failure as the result of entrepreneurs’ overconfidence and hubris [18]. In contrast, other researchers argued that, without a reasonable level of positive perception of one’s abilities, several successful companies would not have been created [19]. Always in this stream of research, the impact of cognitive biases such as overconfidence, illusion of control and belief in the law of small numbers on risk perception and on the decision to create a new venture was analyzed by [20]. Other works started working on the concept of failure (which, as mentioned, is a much more frequent outcome than success). Failure is usually analyzed from the standpoint of the entrepreneur [21,22,23]. These authors started from the assumption that, even though the emotional impact of failure is high, a failing entrepreneur could learn many lessons from his/her mistakes, thus avoiding repeating the same errors while creating a new venture [21]. In fact, in territories that show a high business failure ratio, the most well-known example being Silicon Valley, failure appears to be more tolerated than in other contexts [21]. Actually, several works [24,25,26,27] underlined that the environment could also influence startups’ success. Factors investigated by such works were mainly related to differences among regions and/or existing industrial structure. More recent works analyzed other potential determinants of success by looking at specific choices made during the venturing process, such as deciding to innovate a product [28], or to rely on the support of a business angel/venture capitalist [29].
All in all, the aforementioned literature tends to work top-down, with researchers hypothesizing causal models for new venture success or failure, and then testing such hypothesis on cross-sectional datasets. Moreover, and despite the fact that failure is a highly common outcome of high-tech startup venturing, researchers’ attention will tend to be skewed towards studying success (or the degree of success), if only because of better availability of data.
In this paper, we advocate the need, and make a preliminary proposal, for a methodology that analyzes failures by starting “bottom-up” from entrepreneurs’ own narratives and by tapping into the vast and growing information source of startup post-mortem reports and analyses, at the same time allowing results to be reproducible and incrementally updated. In greater detail, the main contributions of the paper can be summarized in the following two points. First, we present a simple and reproducible methodology for dealing the with multi-dimensional analysis of failures. To this purpose, we extend the SHELL methodology, which is a well-known approach that has been adopted since over 40 years in the aviation sector for describing accident causes, and we modify it to fit the problem of entrepreneurial outcomes [30]. This led to a repeatable and scalable methodology that can be applied to a database of unstructured post-mortem documents deriving startup failure patterns. The main difference with the scant literature that followed a somewhat similar approach is that, instead of presenting a simple and unstructured list of causes [31] or an a-posteriori identification of families of factors [21,25,32,33] in this work we propose a structured classification based on a well-know taxonomy of failure factors, and we modify it to fit the entrepreneurial dimension. Moreover, by using unstructured startup postmortem reports instead of multiple-choice questions [13,25,27,34,35,36] we reduce biases due to the survey questions and structure. Finally, by using existing well-known repositories of narratives, we do not restrict the analysis to a given geographical area [13,21,22,25,27,31,35,36,37,38,39]. In fact, as stated in [15,40] there is a need to test models in multiple countries to assess the robustness of the finding. A related second contribution is the preliminary statistics we derive from a first application of the SHELL methodology to a large database of 214 startups postmortem reports taken from the Autopsy.io website [41]. The literature shows how the success/failure of a company was rarely caused by a single factor. Hence, an increasing number of works addressed this issue by using a multi-dimensional approach [21,31,32,33,34,35,36,37,42]. A first example was shown in [37]: one of the findings of this work was that, when investigating the reasons behind a failure, company’s resources and human competencies should be considered together with environmental data such as sector’s competition. Human competencies were considered also in another work, in combination with financial data, to foresee the failure, the survival, and eventually the growth of a venture [34]. Such study was subsequently replicated and extended in [35], by considering also environmental data. A recent work [33] proposed to combine environmental data and company’s resources analysis with entrepreneurs’ personality traits and linked failure also to psychological/emotive aspects of entrepreneurship. Moreover, in this work a wider meaning was assigned to failure, being it not only the exit from a business—generally due to economic factors—but also the persistence with an under-performing firm or with entrepreneur’s disappointment. Entrepreneurs’ personality traits were already investigated in [32], in combination with management issues and strategic choices, enabling the identification of five entrepreneurial exit patterns. In [36] a different perspective was adopted: here the authors analyzed ventures from the point of view of industrial sector, regional data such as the presence of other companies, and age, and evaluated failure risk by means of a multi-dimensional analysis. A wider number of factors was considered in [21], where financial issues, environment and market, management and strategic choices were analyzed together with internal and external expectations to identify whether failure was linked to mistakes or misfortunes. Similarly, [31] collected a high number of contributing and impeding factors—mainly related to environment, resources, management and strategy as well as financial issues—by interviewing pharmacist companies’ staff and business experts, and discovered that in the majority of cases success is attributed to internal causes, whereas failure to external ones. While the results of this work were unstructured, another work [43] proposed a framework for grouping factors related to new venture creation, and identified four macro-areas, related to individual, organizational, environmental and process dimensions. This framework was used in several works, including [38], which, instead of analyzing startup failures, considered pre-startup phase and investigated which factors could affect the setting-up of a business.
However, the limited number of startups analyzed and the survey-based data collection allowed only a partial vision of the startup failure process [42]. On the contrary, we show more evident findings concerning how the different factors could contribute to a company’s failure.
The paper is organized as follows. Section 2 describes the adaptation of the SHELL methodology used to categorize the startup failures. A description of the sources of primary data and a detailed analysis of the failure database we obtained is reported in Section 3, whereas Section 4 summarizes some final remarks.
2. Methodology
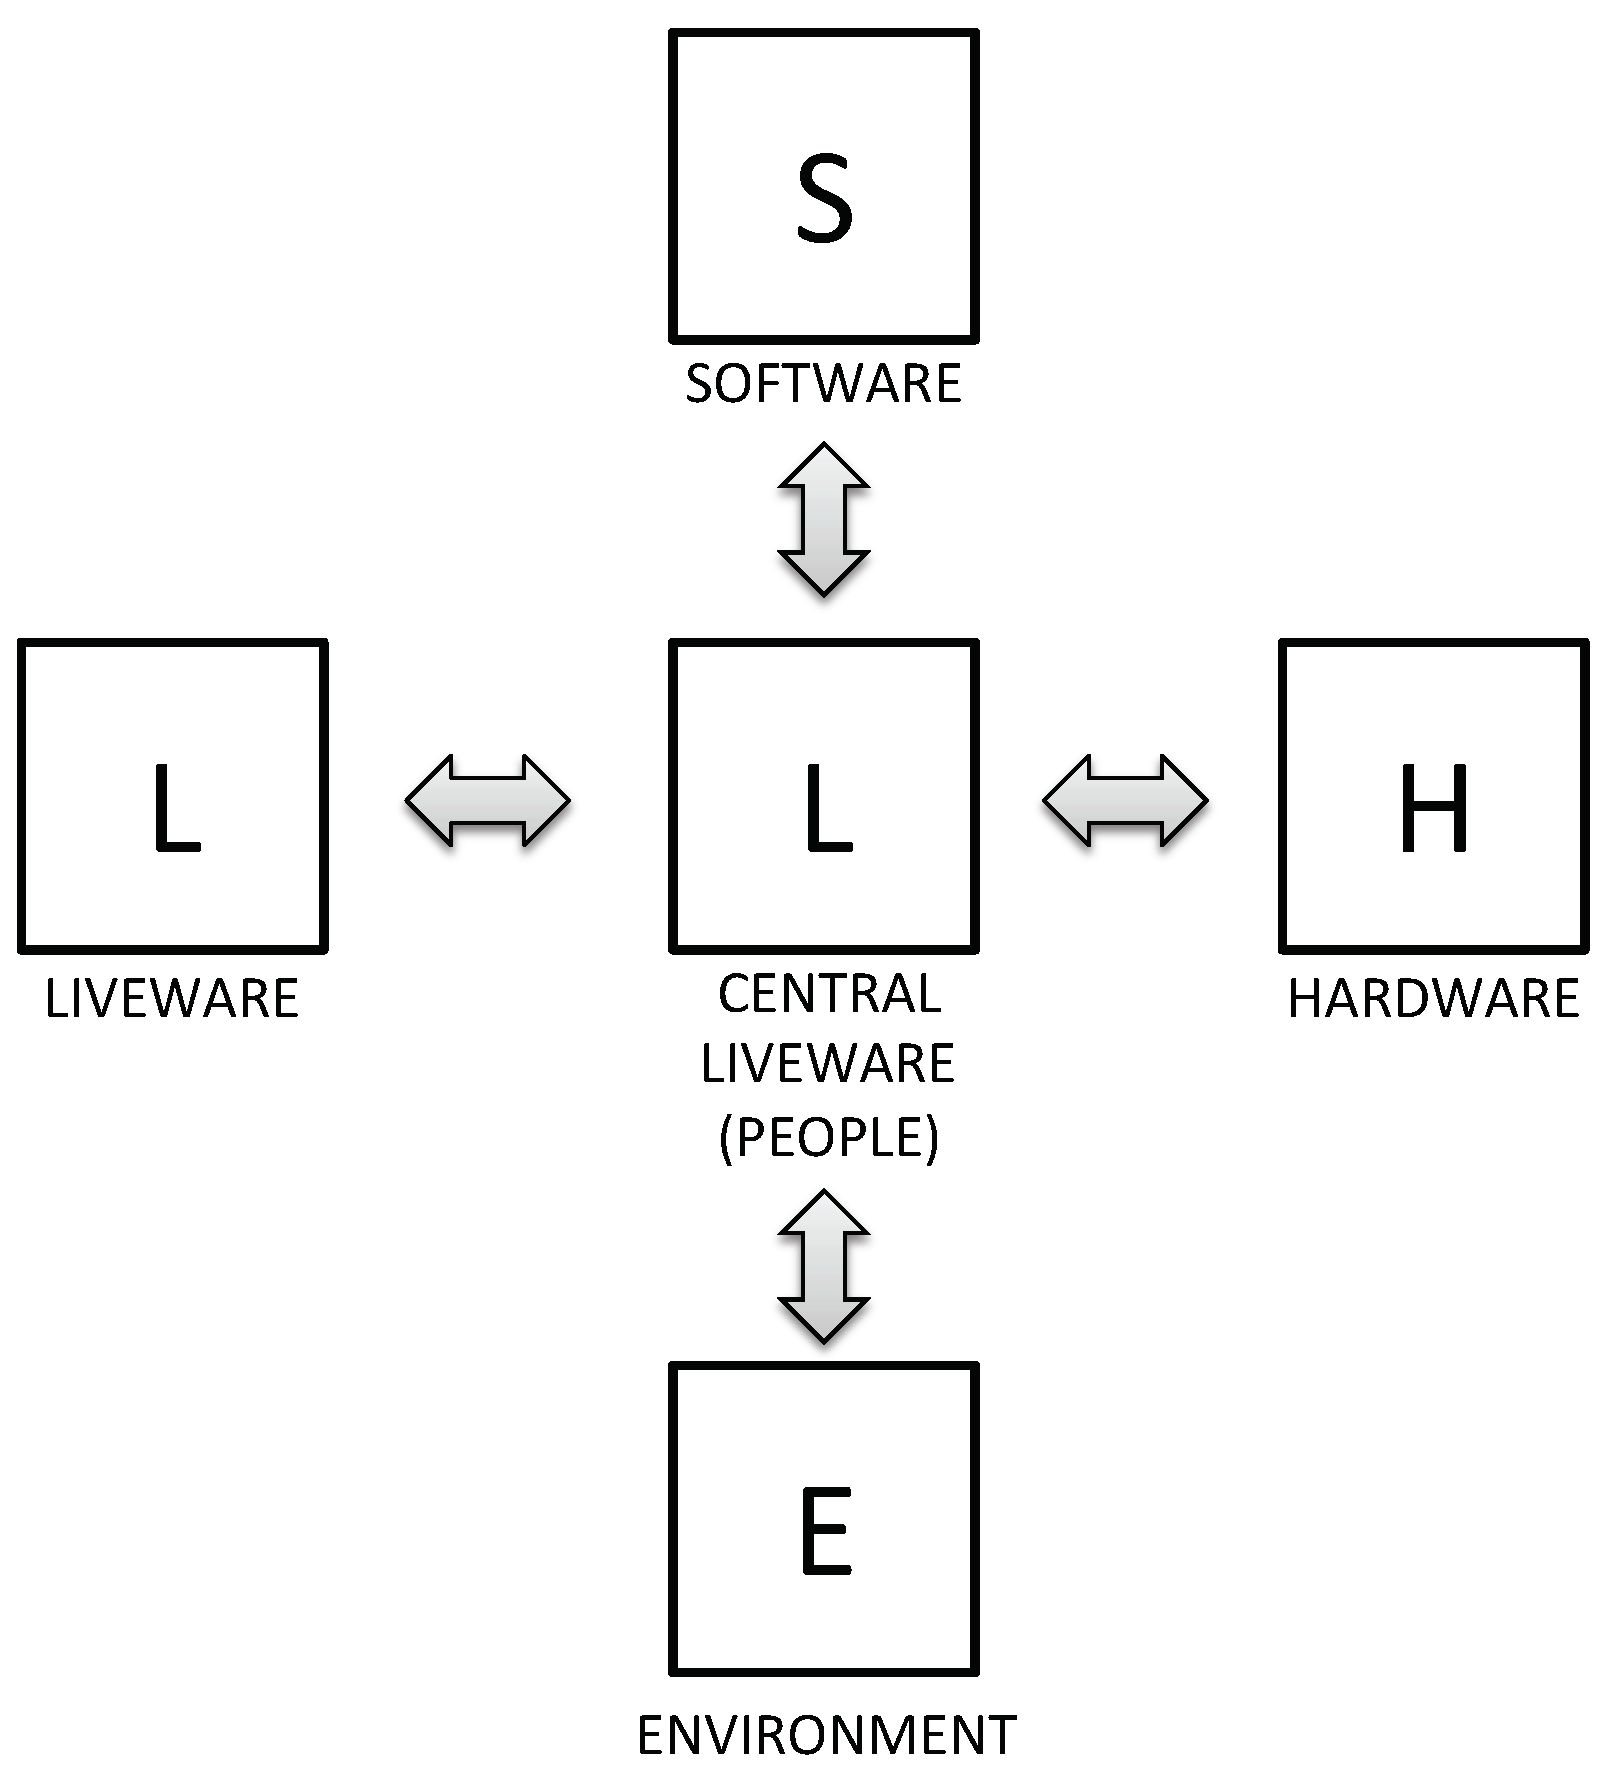
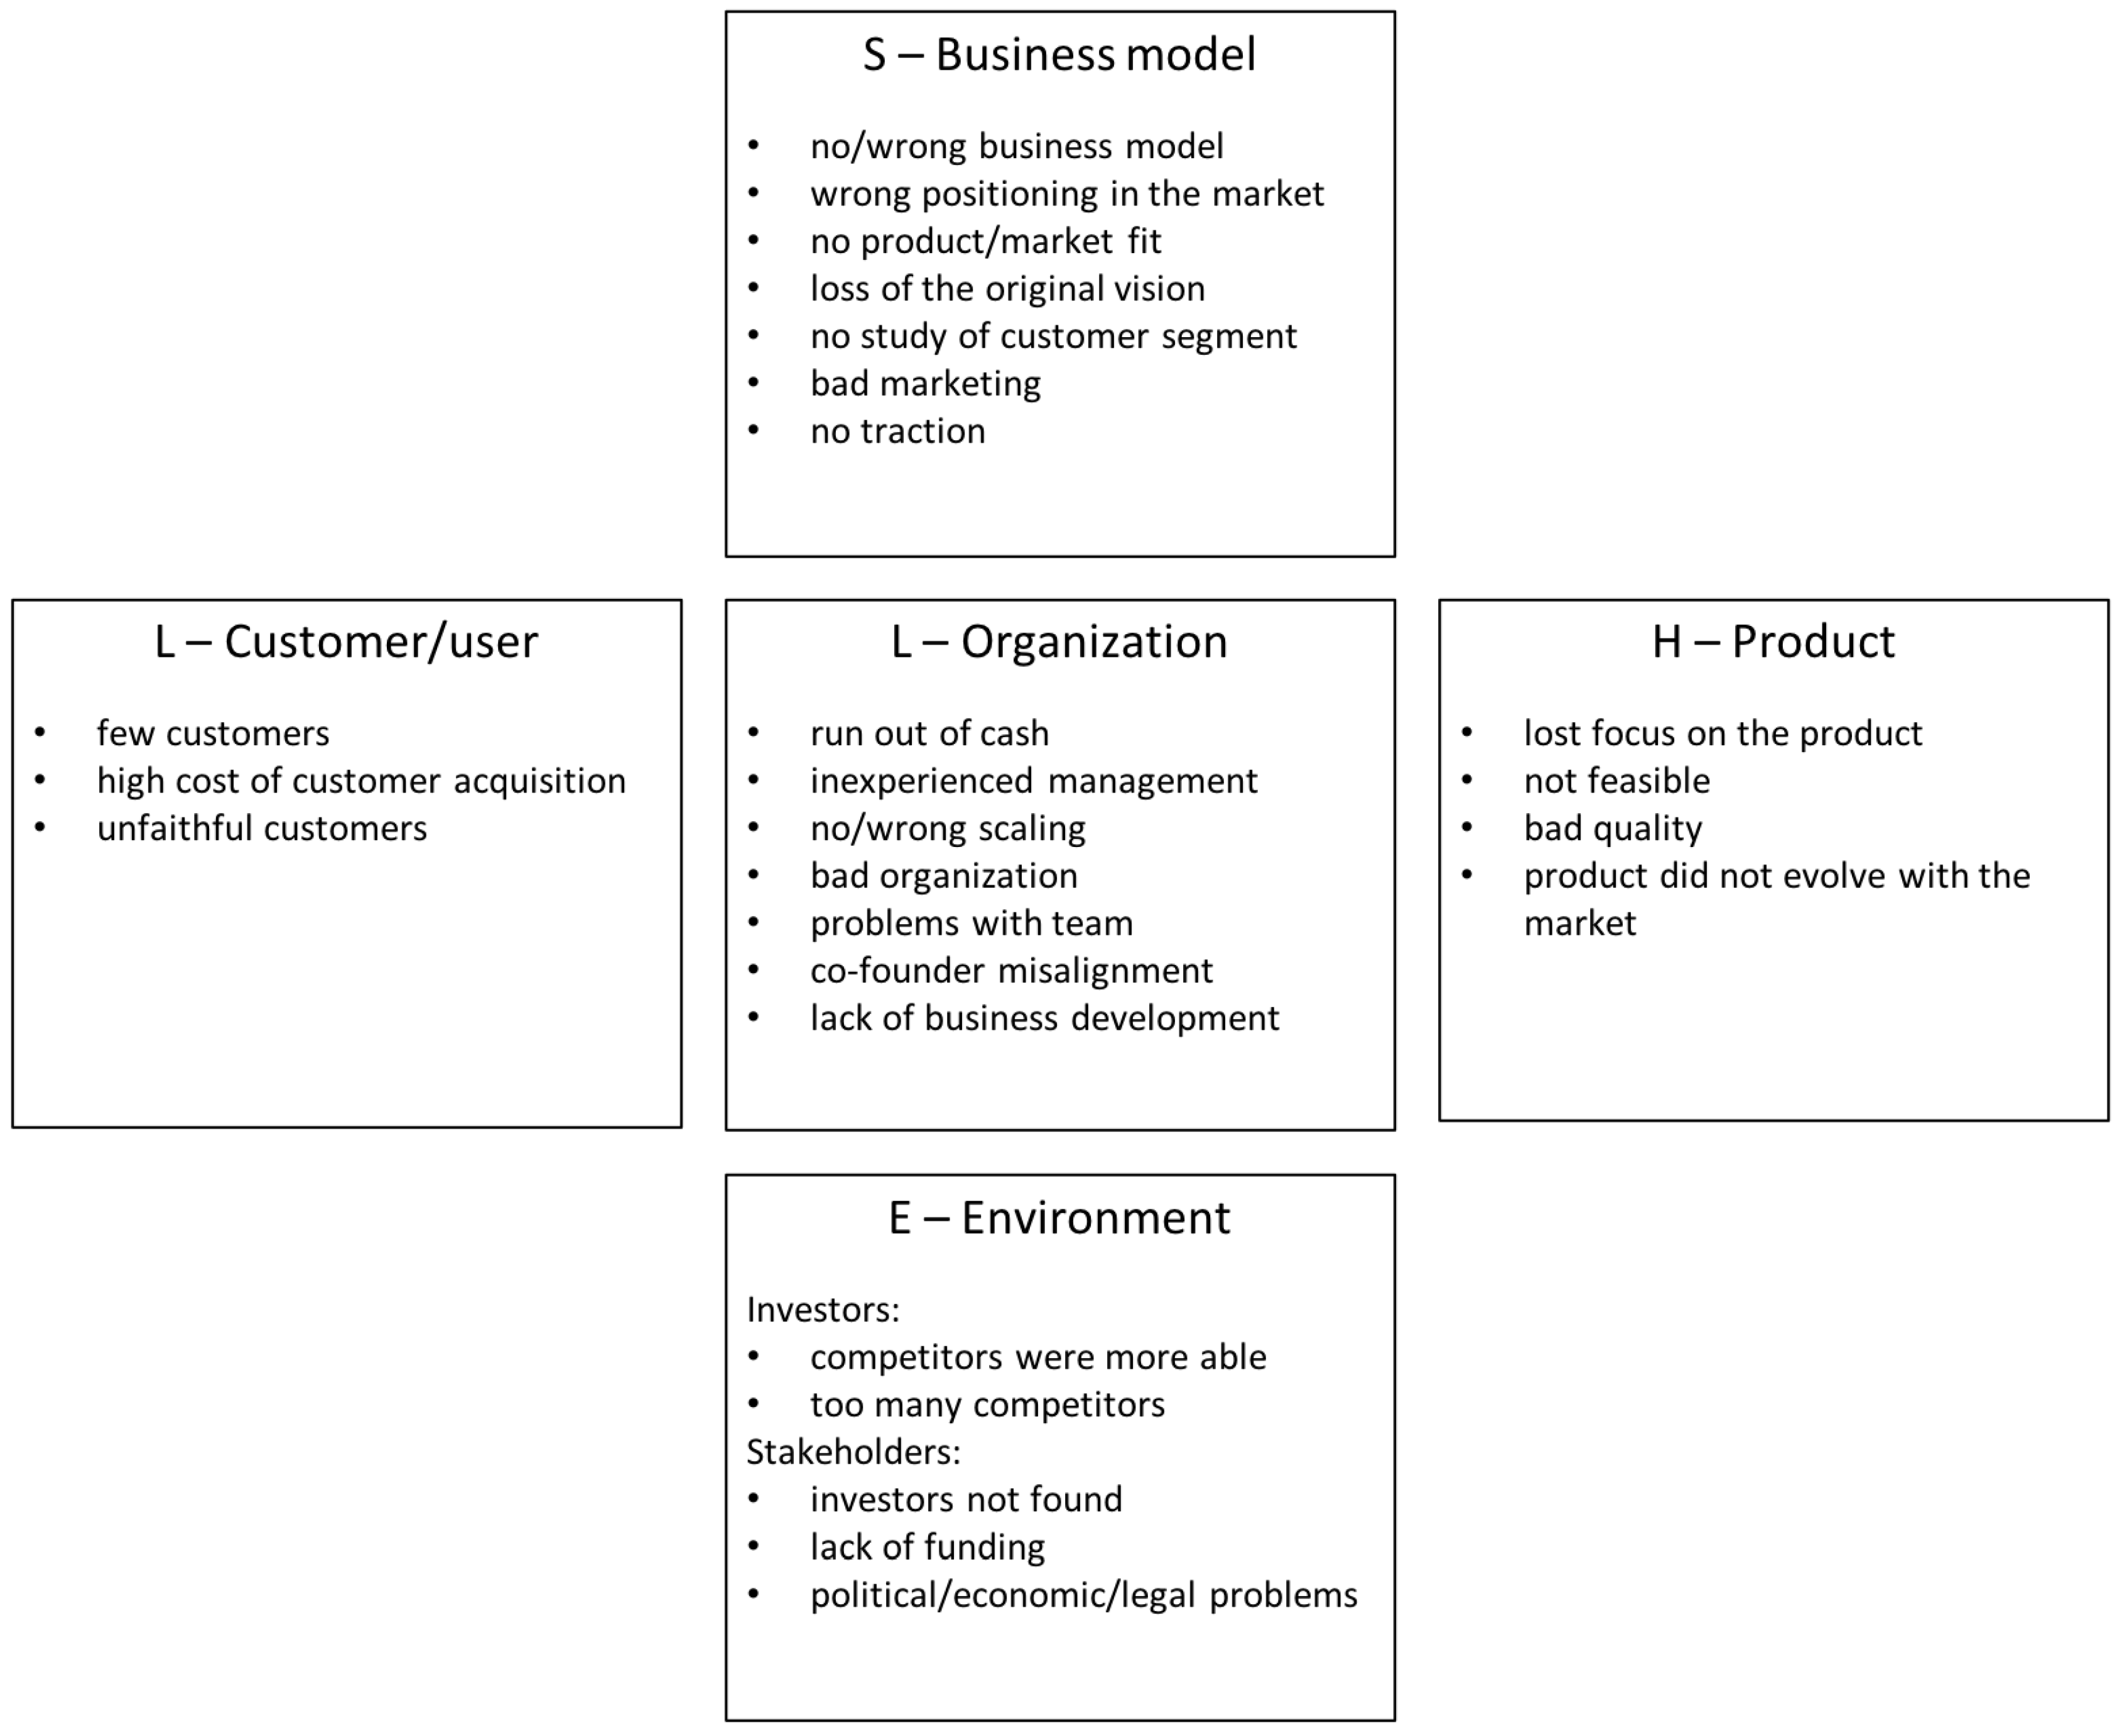
The methodology adopted for the analysis of startup failure is based on the SHELL model, originally implemented to classify aviation accidents and errors, and here adapted to the entrepreneurship sector. The SHELL model, whose name derives from the initial letters of its components, Software, Hardware, Environment, Liveware People and Liveware Environment, was developed by Hawkins in 1975 basing on the original work proposed by Edwards in 1972 under the name SHEL model. In particular, Hawkins urged to add to the original Liveware (Environment) the necessity of another Liveware (People) and modified the model into a “building- block” structure (depicted in Figure 1), illustrating the interactions between the person (central Liveware) and each of other four systems [30,44]. Due to this human-centered structure, the SHELL model is defined as the relationship between human factors and the aviation environment [45]. In fact, it is a conceptual framework focused on the identification of the human factors and of the relationships between human interfaces and the other resources in the aviation system, investigating on their contribution on the realization of incidents/accidents. The model adopts a system perspective that suggests that the human being is rarely the only cause of an accident. In fact, there are different factors interacting with the human operator and affecting performance. Thus, the SHELL model considers both active failures and latent failures. Active failures typically occur at the operational end, while latent failures are hidden in the organization’s structure, not known or observed by the organization [46]. Although different models are applied to aviation safety, such as the Domino [47], the Swiss Cheese [48], the Human Factors Analysis and Classification System (HFACS) [49] and the Systemic Occurrence Analysis Methodology (SOAM) [50], the SHELL concept remains the most widely used because of its simplicity and capability to better highlight the effects of the human factors in the accidents. Thus, it is a concrete starting point for any investigation on accidents and lends itself well to being applied in other fields, also in other contexts such as the entrepreneurial. In this paper, we present an adaptation of the SHELL model (Figure 2) for the classification of startups failure and, similarly to the aviation field, the model has the aim to identify the relationships between the human factors and the other components of a startup. The error-centered approach that characterizes SHELL and its focus on interactions between human errors and other elements (e.g., technological, environmental and organizational issues) can be seen as a significant departure from more common approaches. In fact, the SHELL methodology has proven effective in categorizing the human factor of an accident, while giving hints about the recurrent patterns in the accidents too [44]. Most importantly, the SHELL model emphasizes the interfaces between a person and the other four components more than the individual impact of the components themselves. Specifically, the SHELL model requires analyzing how each person acted and interacted with the other four components. The different interactions between the person and each of the other components are considered as the human possibility, while a mismatch between the central Liveware and any other four components leads to a source of human error [51]. For the aforementioned reasons, we decided to adopt the basic framework of the SHELL model and to adapt it to the analysis of startup failures.
To implement the model, we followed a three-step method. First, we conducted a preliminary analysis on a database composed by 214 failure reports, identifying a high number of failure categories. In the second stage, we clustered such categories. Finally, the third stage is to envision a mental concept of these clusters and to find a correspondence between these elements and the SHELL macro-categories, to review the unstructured failure reports, giving them a framework and a more comparable form. As a result, we found that the main building blocks of the SHELL structure remain the original ones. After the model construction and the classification of each failure report according to the SHELL structure, we conducted a more quantitative analysis investigating the following aspects:
- focusing on the SHELL categories, which are the typical failure patterns?
- do causes for failure change over the lifecycle of startups?
- are there clear relationships between startups failures cause and the industry in which they operate?
The different subcomponents of our SHELL model are discussed in the following:
- Software. It is the non-physical and intangible part of the startup and principally consists of the business model that, according to the definition proposed by [52], describes the rationale of how an organization creates, delivers, and captures value. Thus, in this context, the term software does not refer to Information Technology but is composed by all the aspects that are thought to ensure the success of the product or service offered by the startup in the market, in a more commercial perspective. In particular, this building block includes the following subcategories:
- -
- No/Wrong Business Model. As mentioned earlier, the business model is a representation of the way in which the firm creates value for its customers and captures part of it to generate profits. According to [53], business models are a defining feature of any firm, but the clarity of the business model is particularly true when dealing with technological innovations. The business model should not be considered as a definitive and static representation of the startup. A business model is provisional, in the sense that it must be continuously evaluated and improved, based on feedback from the market and from the broader ecosystem where the startup operates [54]. Thus, the right business model is rarely clear early on in emerging industries: entrepreneurs who have a good—albeit imperfect business model—but are able to learn and make it evolve, are those more likely to succeed [53,54].
- -
- Wrong positioning in the market. The absence of a product/market fit is damaging the product/service itself and the success of the business model. In fact, the product/market fit means being in the right market with the right product or service capable to satisfy it. On the contrary, the wrong positioning implies the wrong knowledge of the product/service with consequent bad performance or the risk to begin in the “stuck in the middle” position identified by [55].
- -
- No product/market fit. A more severe case of wrong product/market fit occurs when the product or service can potentially satisfy needs or solve problems, but these are actually not perceived by the customers.
- -
- Loss of the original vision. This case occurs when the founders of a startup are too focused on the product, and its technical development and improvement, and end up losing their initial vision and customer orientation. Unfortunately, they realize the deviation from the original vision only when too close to failure.
- -
- Wrong customer development. According to [52], customers comprise the heart of any business model. Each segment of customers is characterized by specific needs, behavior, and willingness to pay for the product or service offered. Thus, it is important to identify the different segments carefully and to take a conscious decision about the ones to serve, to focus the marketing campaign for the right customers. In fact, a good product or service sold to the wrong segment would not lead to the success.
- -
- Bad marketing. This case refers to marketing campaigns that are not correctly conceived or executed.
- -
- No traction. The term business traction refers to the progress of a startup and the motion it gains as the business grows. Not having enough traction implies the startup is unable to grow at sufficient speed, therefore losing competitive advantage and/or interest by investors and other stakeholders.
- Hardware. It is the physical element of the startup and it is mainly represented by the product or service offered to the customer segments (i.e., materials, devices, platforms, websites, etc.). It includes the following subcategories:
- -
- Lost focus on the product. This is related to the insufficient attention paid to product development. In fact, according to [56], a startup fails when it ignores a user’s wants and needs, whether consciously or accidentally, and offers a user-unfriendly product.
- -
- Not feasible/sustainable. This subcategory includes issues related to the technical feasibility ignored by the startup or emerged later, making impossible the design and the development of the product.
- -
- Bad quality. It refers to more general problems related to the product and its quality. For example, this issues affect services or mobile applications (e.g., the product does not work well, there are bugs in the code, the mobile app is not responding as it should do, there are problems in the operations, etc.).
- -
- Product did not evolve with the market. The product or service continues to fulfill the original need for which they were thought, but the current market is changed. Thus, the functionality it is not fitting with the current customers’ needs.
- Environment. This building block illustrates the physical context in which the startup operates. It involves the internal environment, which includes the impact that the competitors have on the startup and the external one that considers the effect of the stakeholders’ operations, also considering the economic and political situation around the startup. From the competitors’ point of view, the environment is composed of two subcategories:
- -
- Competitors were more able. Often, a startup deals with too strong competitors, which have a consolidated positioning with a relevant market share and the access to the distribution channels or to technologies, resources, and complementary assets. Thus, although the startup offers a good product, these conditions make difficult to gain a good portion of the customer segment.
- -
- Too many competitors. The more fragmented market, characterized by a high number of competitors with small share does not allow new incomers to gain a relevant position.
While, from the stakeholders’ point of view, the environment includes:- -
- Investors not found. One of the main common reason for running out of cash is related to a lack of investors’ interest either at the seed follow-on stage or at all. This could be caused by a bad presentation of the product or service offered or connected to one of the previous categories [56].
- -
- Lack of funding. The absence of investors is not the only reason for the startup’s failure. In fact, many startups deal with the problem of raising small amounts of investments, which are not enough for the development of the business, combined with a bad organization of these resources.
- -
- Political/Economic/Legal problems. The political and economic situations of the environment where the startup operates could affect its success, due to regulations or economic conditions, influencing the willingness-to-pay of the potential customer segments. Moreover, in specific fields like the music industry or those where the copyright is highly critical, the legal challenges represent a reason for the startup failure, due to the consequent expenditures on lawyers and royalties [56].
- Liveware It means the human side of the startup system (founders, management, and workers). This component considers human performance, organization, capabilities, and limitations. It is divided into two parts: one referred to the external environment, which considers the customer/user side and the second one related to the internal part, composed by the people and the organization within the startup.
- L-Customer/user
- -
- Few Customers. This factor of startup failure is related to the previous reasons, especially to the wrong positioning, the maturity of the market and the competition effects or the positioning in a niche market, etc. All these reasons could determinate the reach of only a small part of customers, which is not enough for the sustainability of the business.
- -
- Problems in customer acquisition. Wrong marketing efforts could generate a high cost to acquire customers, not balanced by the number of customers really acquired.
- -
- Unfaithful customers. In the recent years, the customers became more conscious and attracted from the different promotions offered by the competitors, increasing the level of competition and the risk of a continuous war of prices that make customers’ loyalty fragile.
- L-Organization
- -
- Run out of cash. This reason is normally correlated to one or more of the previous categories, as consequence of a bad management of the resources and the investments, or bad business development, wrong customer, market study, etc.
- -
- Inexperienced management. Frequently, the startup founders have hard skills and very technical backgrounds with a lack of cross-domain and commercial knowledge. This brings to a well- developed product/service but the absence of business model and business development.
- -
- No/Wrong scaling. The decision of a startup to undertake a systematic growth could reveal the threat of a failure, due to a difficult pivot or a premature scaling compared to the market situation, or to a higher working capital requirement than the scaling operation might need. Thus, the decision to scale should be taken after a deep study of the startup position and situation to understand if the startup is ready to manage higher volumes, how big the growth can be and if increasing volumes will also increase the profit.
- -
- Bad organization. A startup is usually a chaotic environment. Thus, rules, roles, and tasks have to be well organized and assigned to each member of the team for efficiently managing all the activities. Moreover, one of the aspects related to the organization issue is the location of the team.
- -
- Problems with team. Disharmony on the team is one of the critical factor to the success of a startup, combined with a poor communication between the co-founders and the team, or within the components of the team itself [56].
- -
- Co-founder misalignment. Different backgrounds, qualifications, and specializations can create disagreements between co-founders and thus, cause bad decisions and bad management. These problems, if not solved, can lead a co-founder to leave or startup to fail, in the long run.
- -
- Lack of business development. As above mentioned, the highly technical team risks to have a lack of business development and thus, the absence of a commercial perspective, which includes the study of how to increase customers, sales and profits, and make the business more profitable and self-perpetuating.
3. Detailed Analysis
3.1. Data Settings
The analysis of the startups’ failures is conducted on a sample of 214 startups extracted from the databases of the Autopsy.io website [41] and of the CB Insights platform [57]. These two databases include respectively 133 and 166 startup failures postmortem reports that contain the description of the startup, the ending date the activity, the main primary reasons of the failure, with a link to a report where all the reasons are thoroughly explained and finally, the lessons learned. These databases are based on the subjective point of view of the founders and of their willingness to provide information about their startup story, highlighting a lack of a more structured and accessible reporting concerning the drivers of startups failures. Our study is an attempt to overcome this issue. In particular, after the first selection of 214 startups from these databases according to the availability of enough information, an expert-based analysis supported by the use of the SHELL methodology has been conducted, assigning each startup failure to one or more subcategories to standardize the reasons for failure.
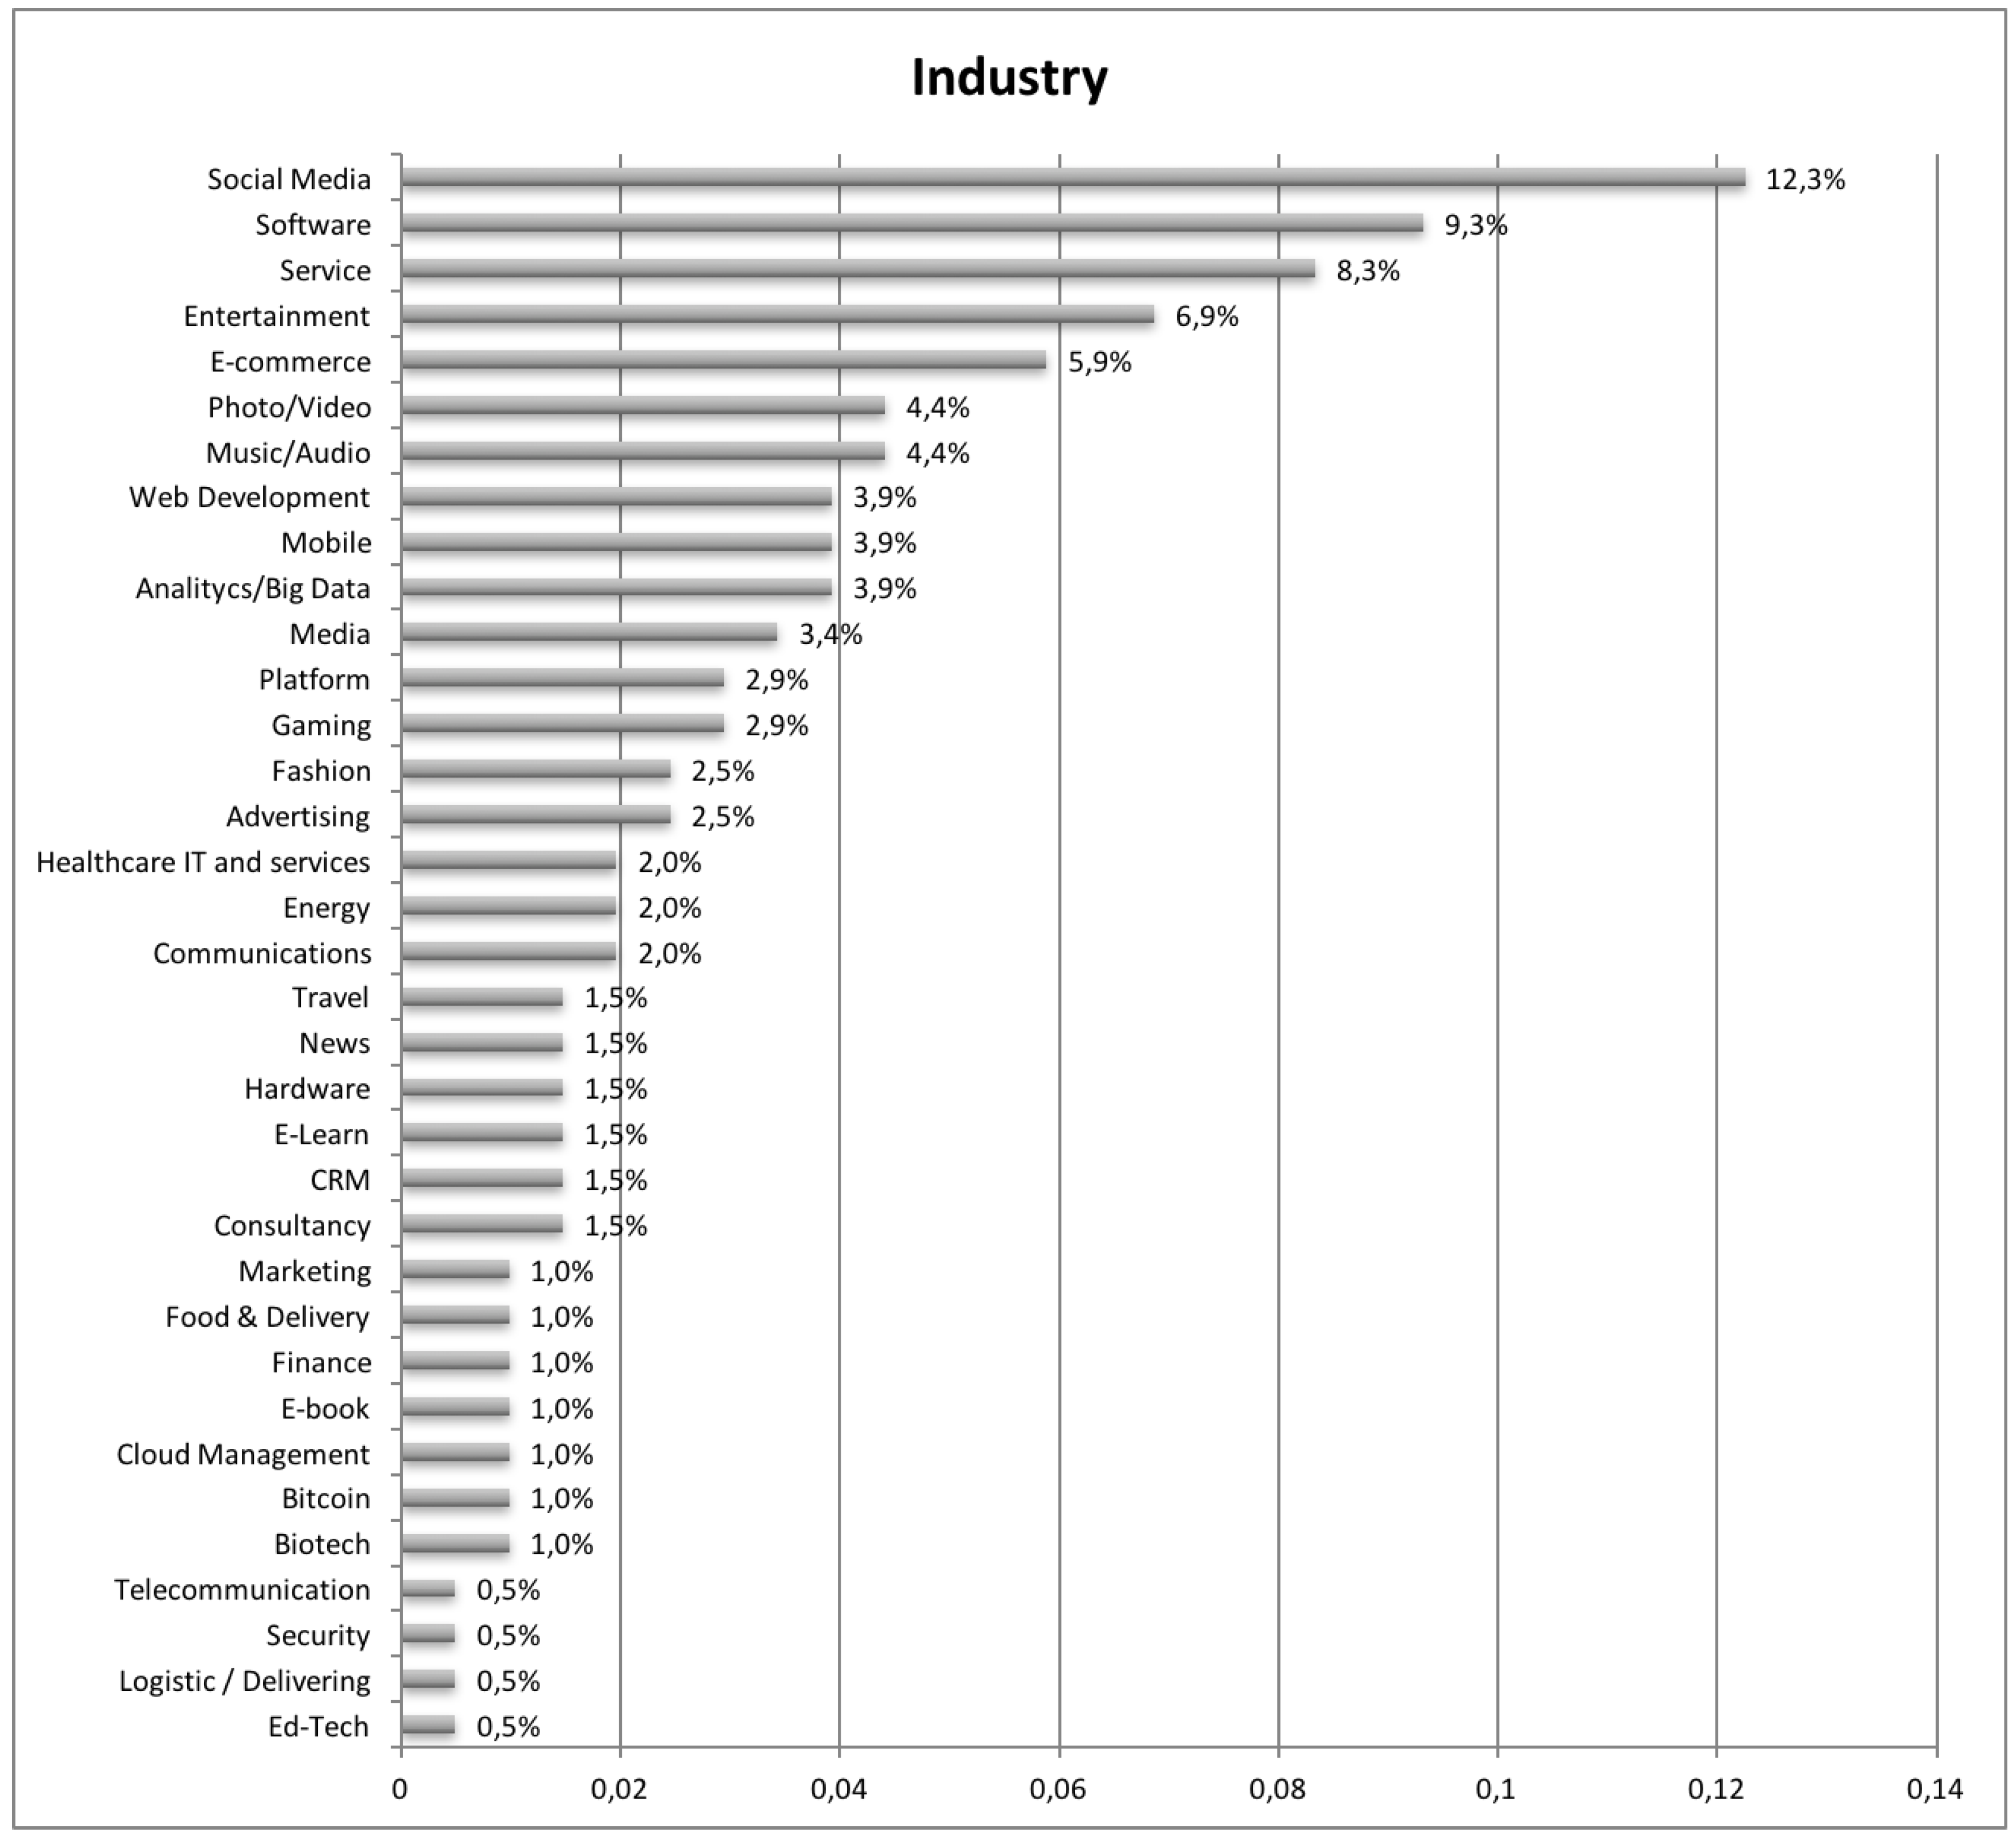
Figure 3 reports the distribution of the 214 startups considered for the study (a preliminary classification has been done to assign startups to a sector). In particular, the sector showing the highest number of postmortem reports on the two databases analyzed is Social Media, with the 12.3%. The Software industry and the Service one take, respectively, the second and third place, with the 9.3% and the 8.3% of the total amount of collected reports. Entertainment and E-commerce industries come next (7% and the 6% respectively). For what it concerns lowest ranks, the industries with the lowest amount of collected/reported startups failures are the Telecommunication, the Security, the Logistic and Delivering and finally, the Educational Technology, which all count for the 0.5%.
3.2. Results
Standardized reasons for failure collected have then been analyzed to identify some common failure patterns. In particular, a first analysis of failures has been done on two different axes, namely:
- the SHELL categories;
- the duration of the startup.
Such analysis was able to highlight respectively which were the most relevant causes of lack of success, and which were the most critical years of life for a company. Since failure is rarely due to a single cause, an additional analysis was performed, aimed at investigating how failure subcategories were interlinked and mutually took part in determining the ending of a company. This analysis was done by relying on several co-occurrence matrices of causes, which were drafted both by considering the whole database, both by restricting the field of interest to a given industry/year of life to investigate if groups of failure causes were more likely to appear in a given industry or at a given lifetime. In the following, analytics emerging from this analysis are reported and summarized.
3.2.1. SHELL Classification
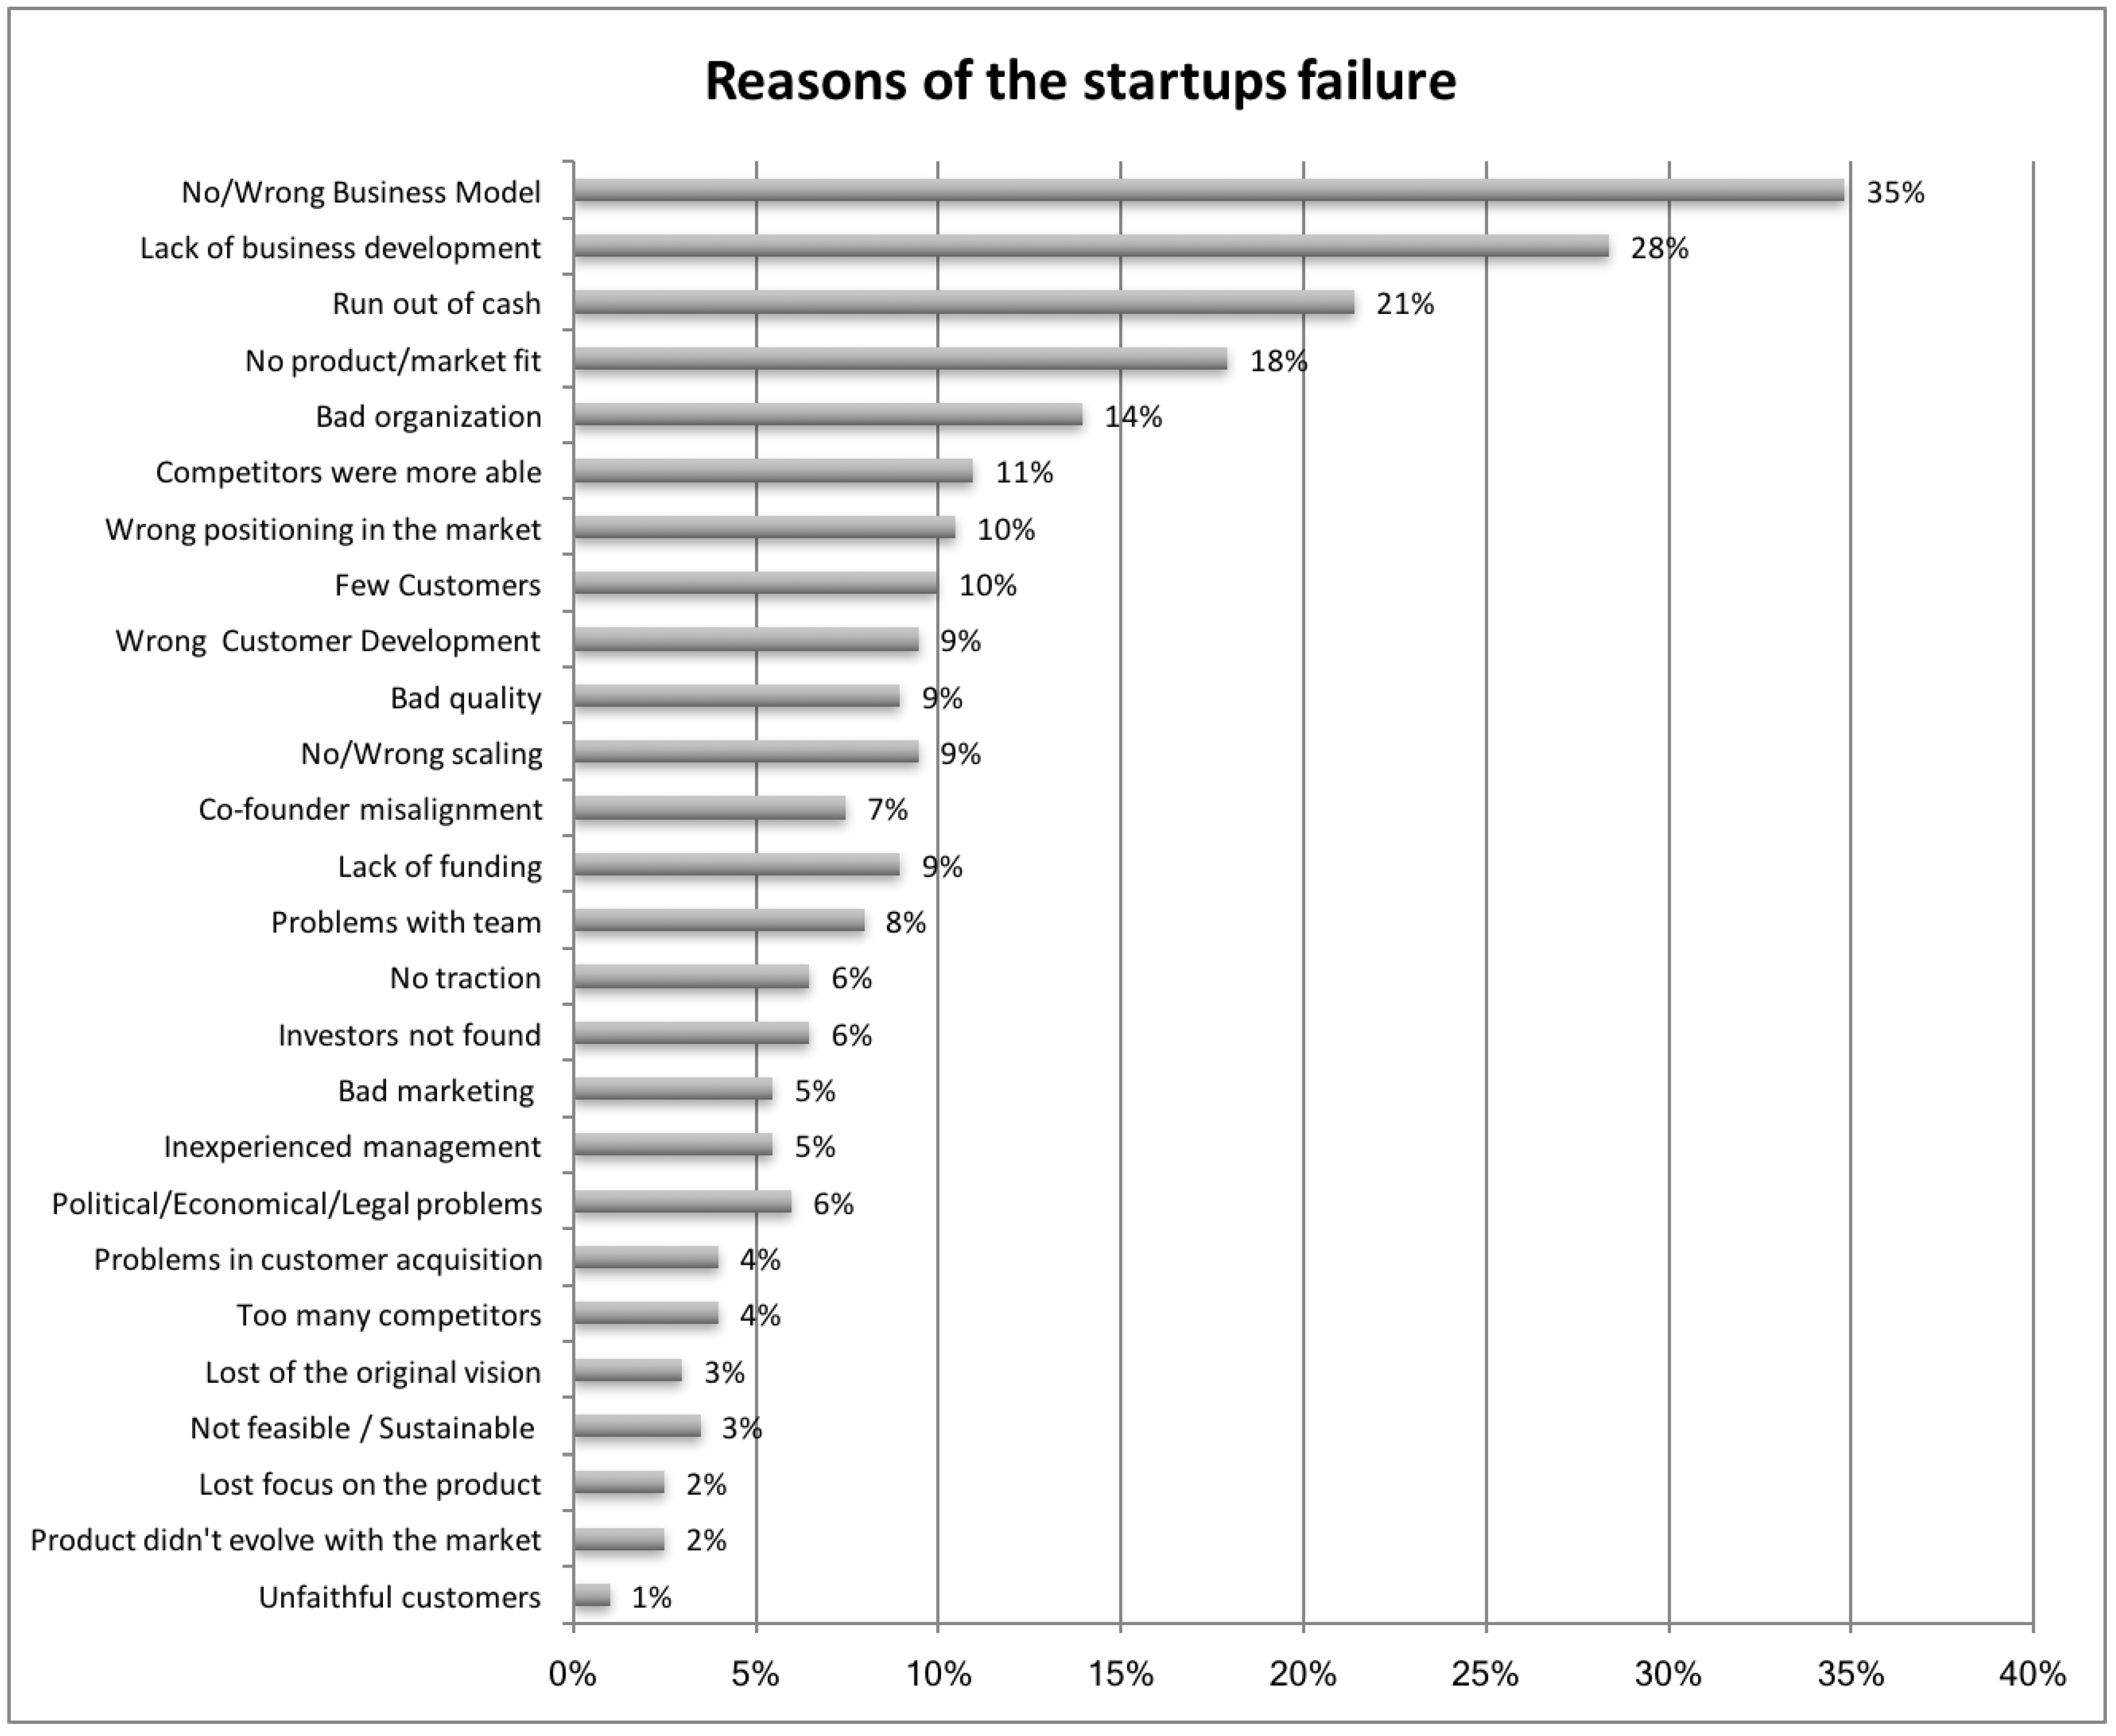
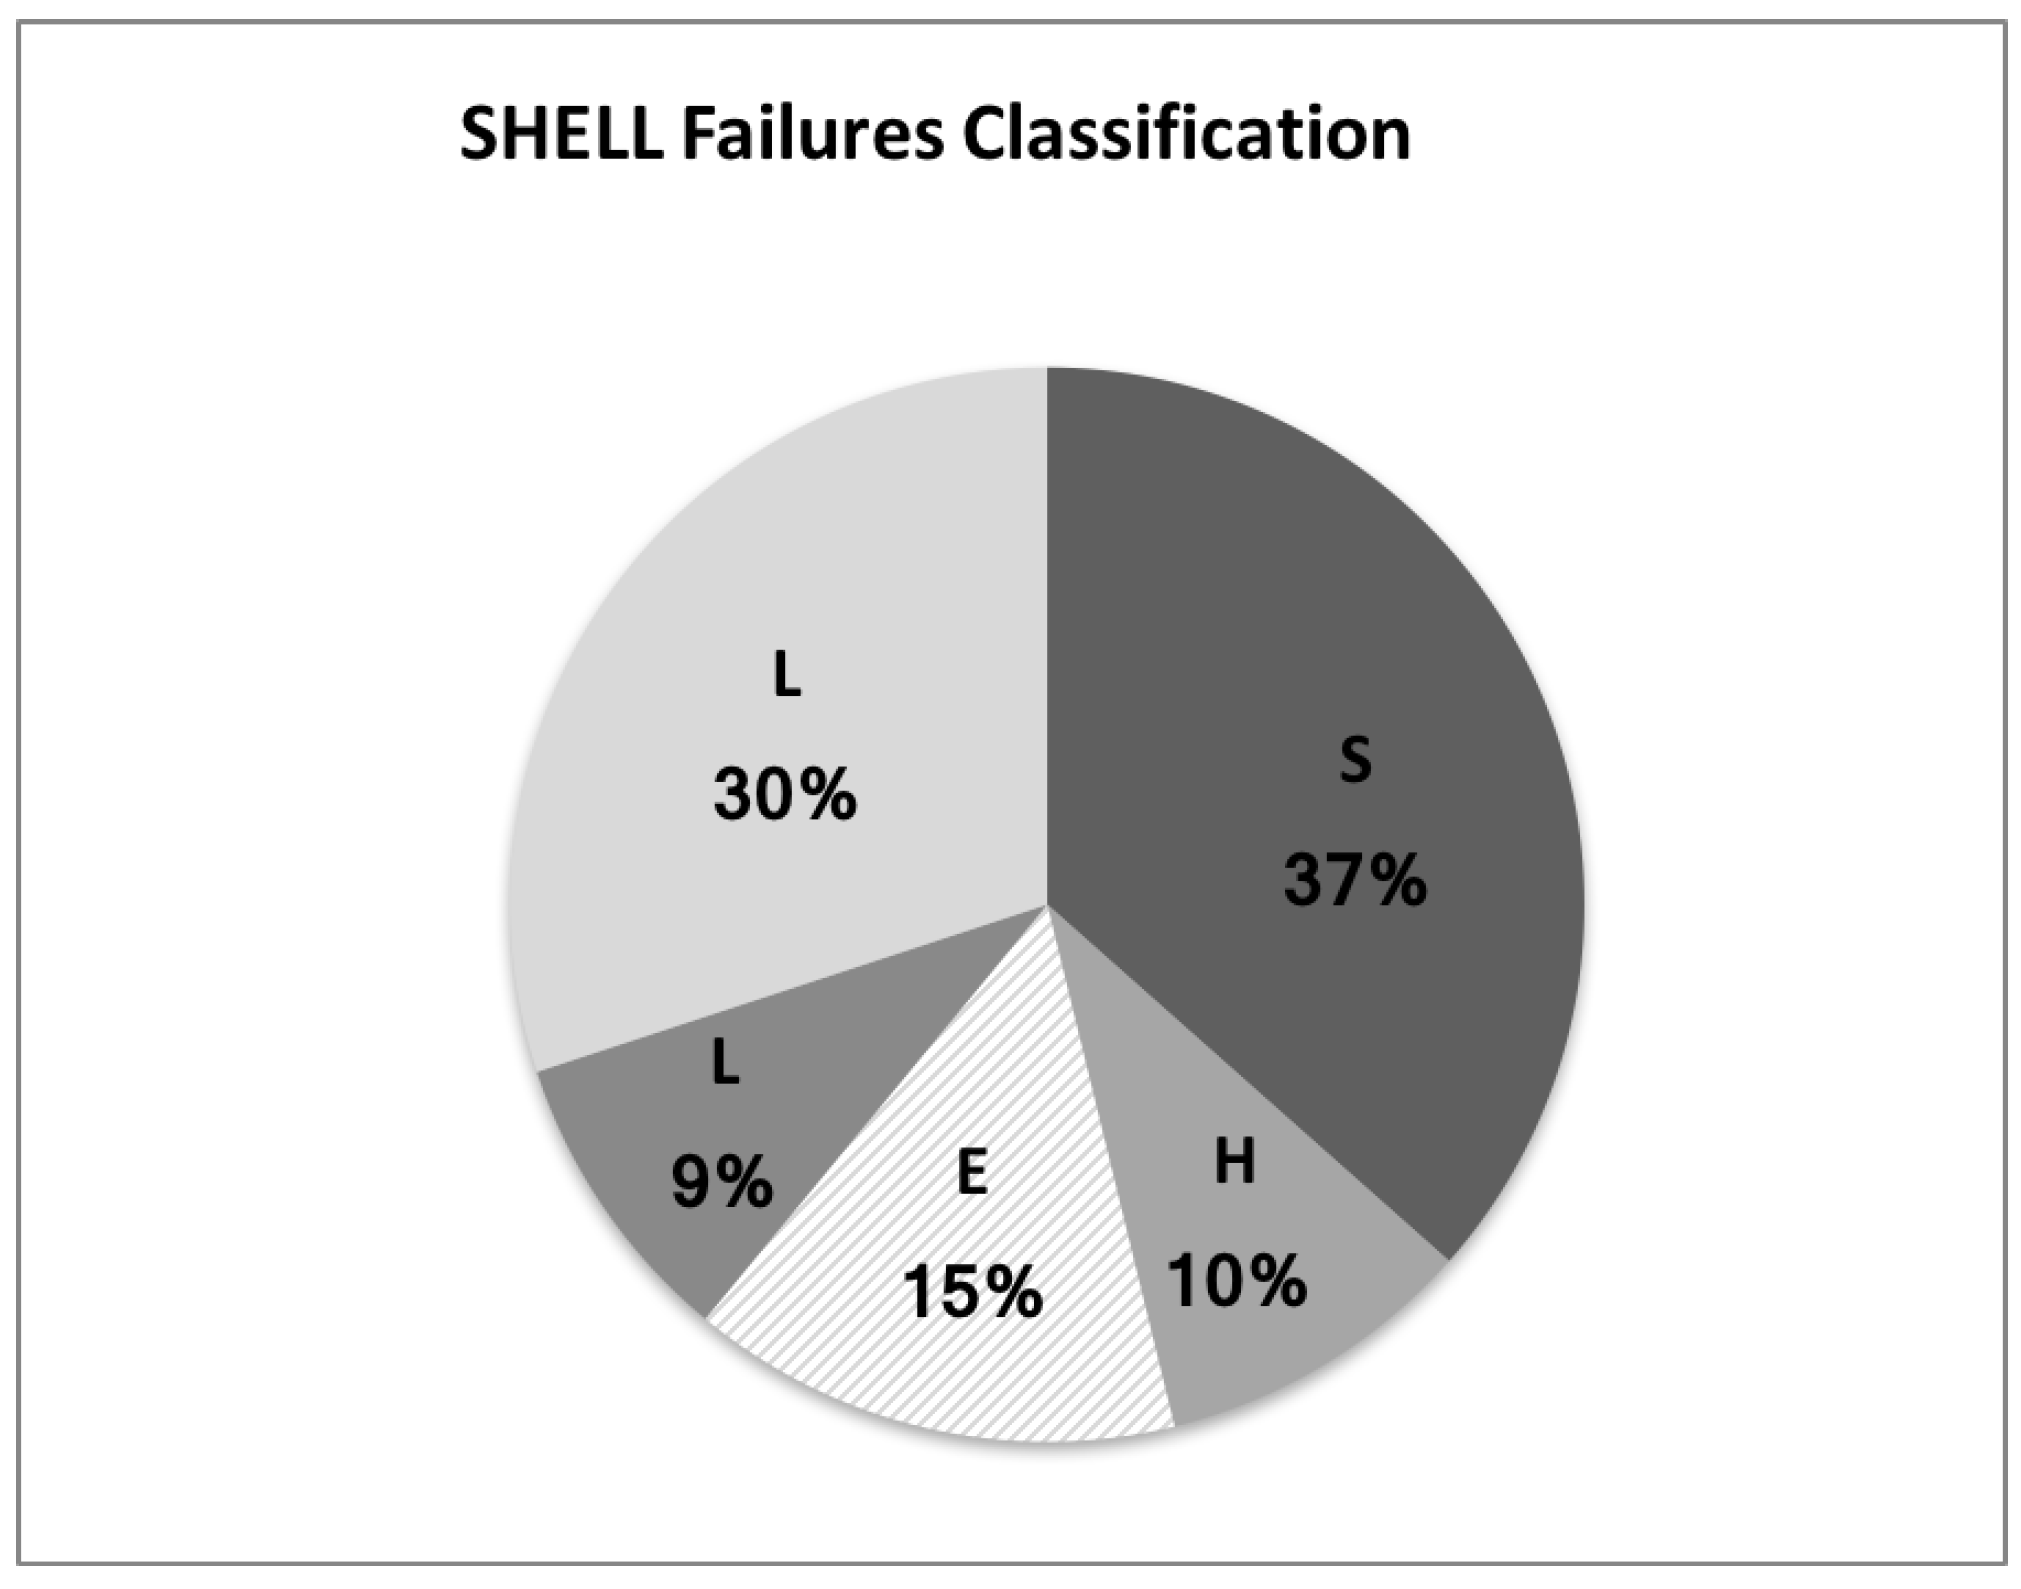
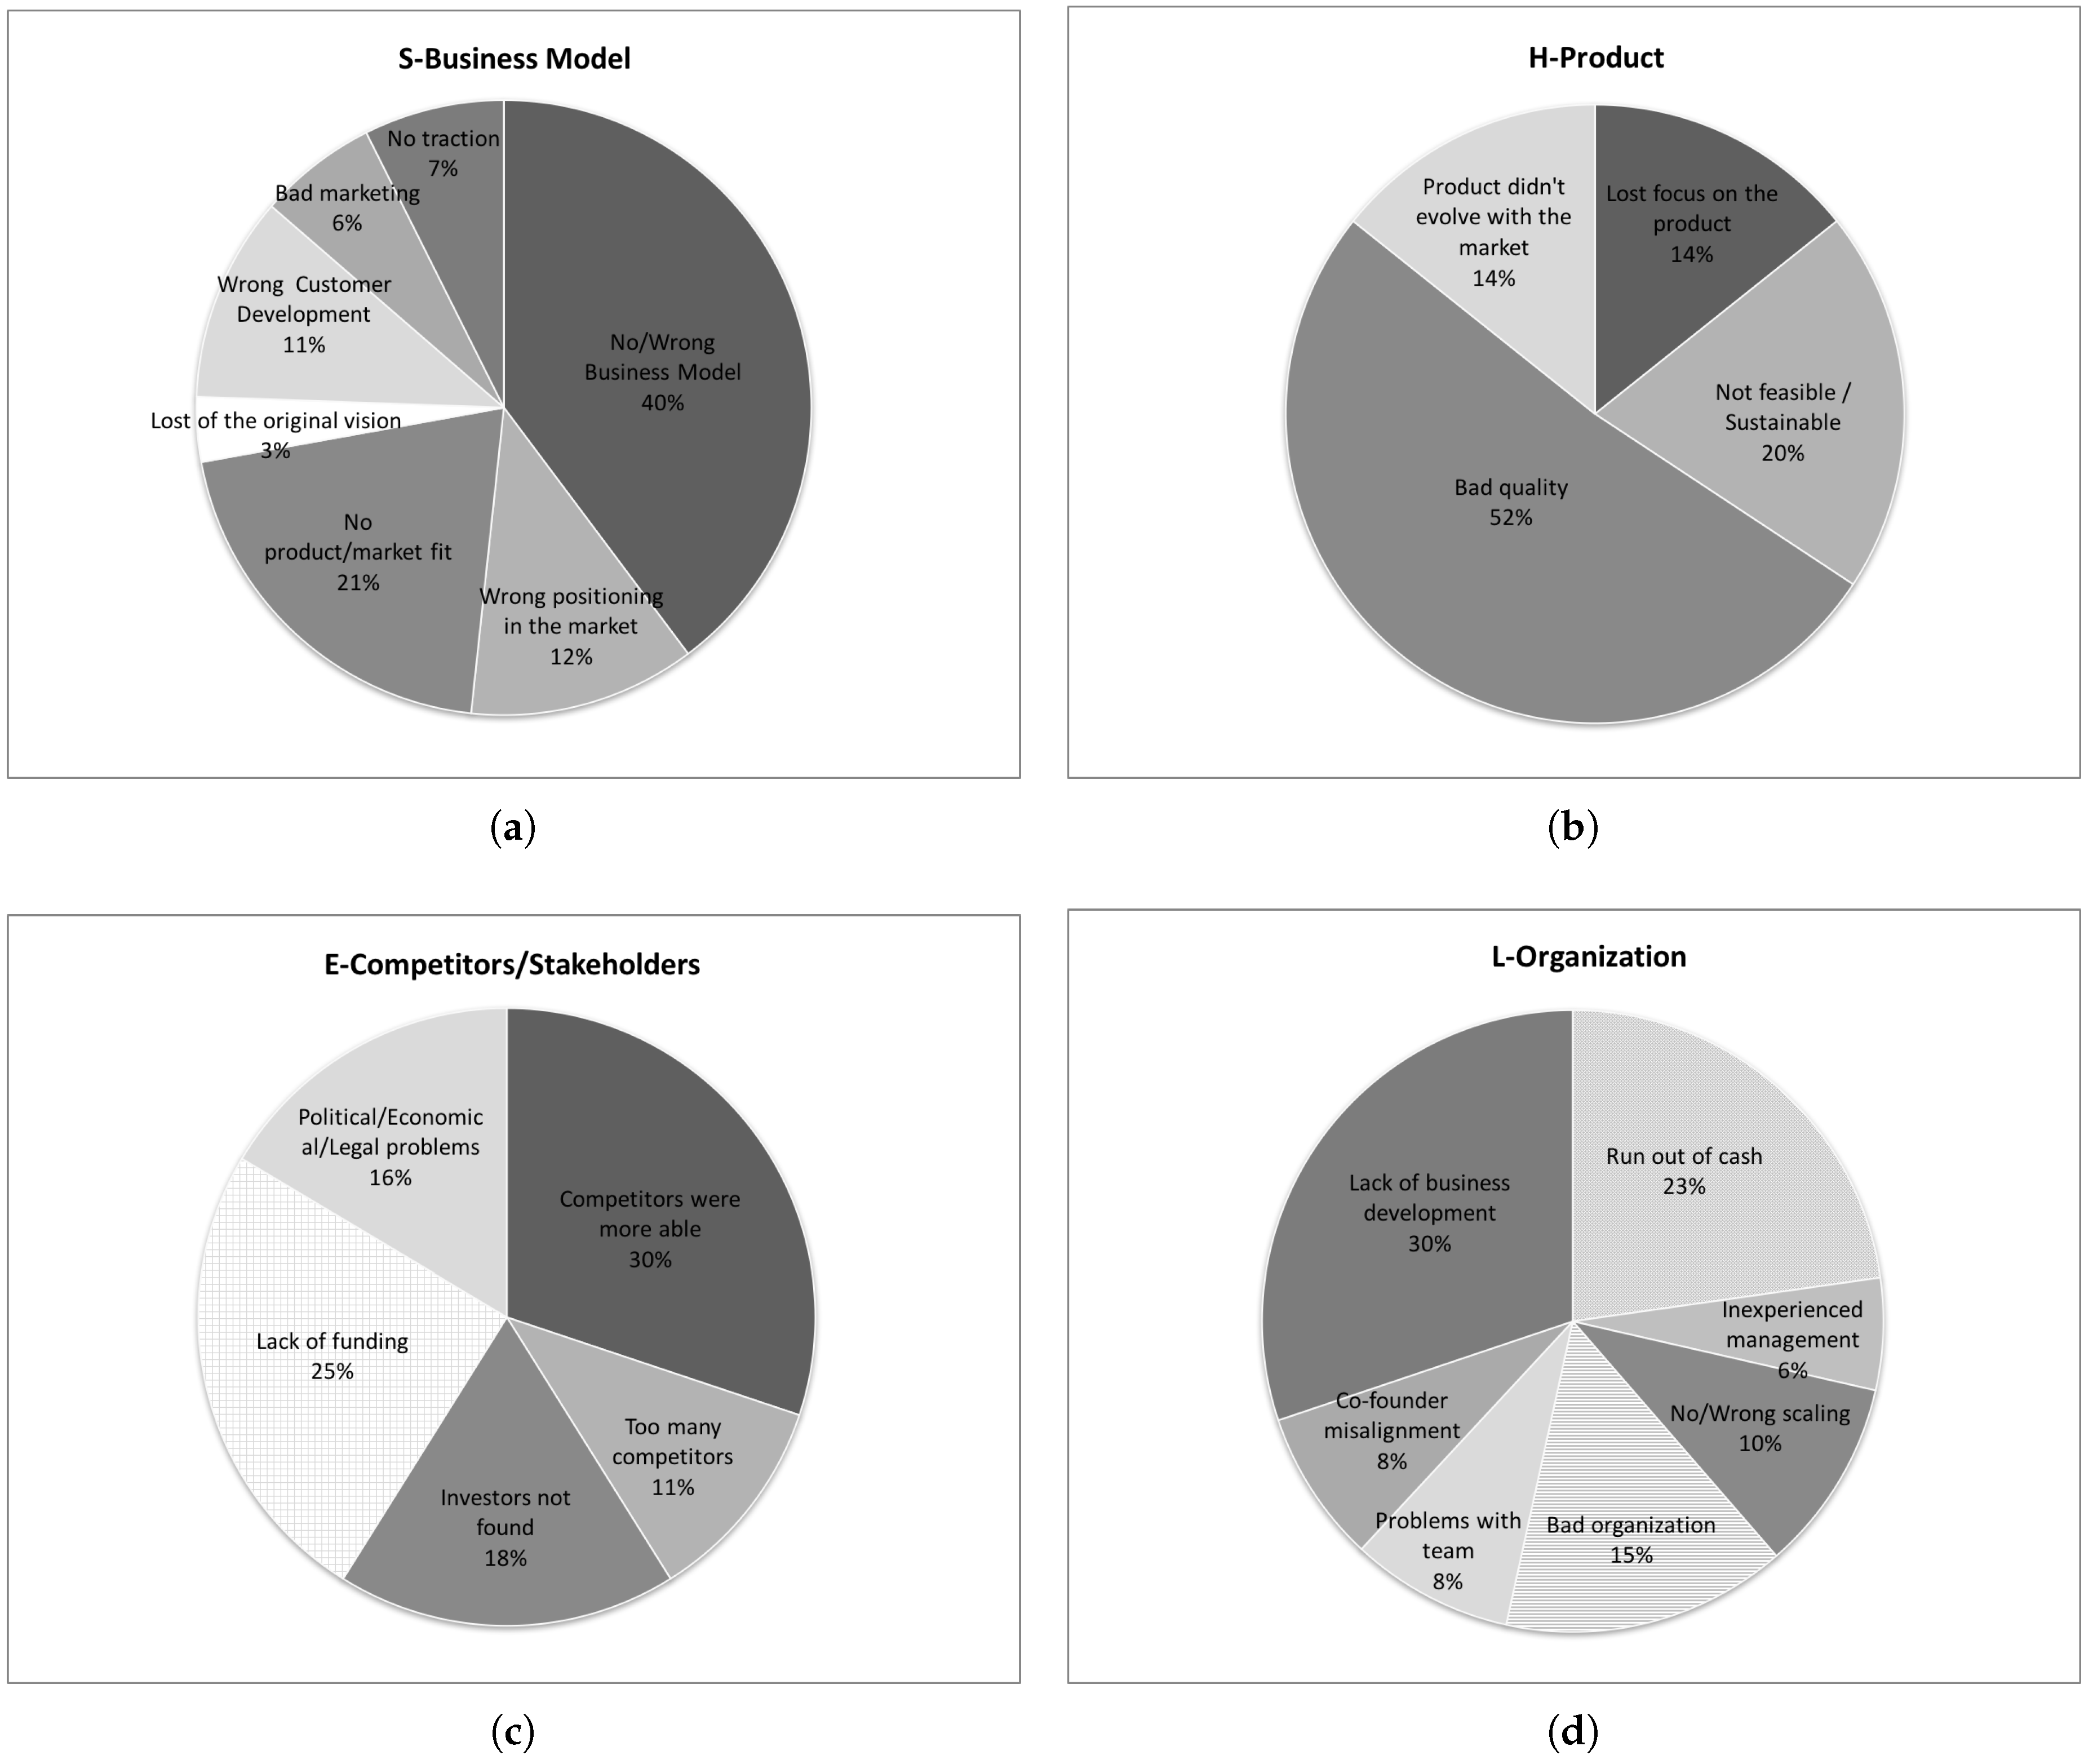
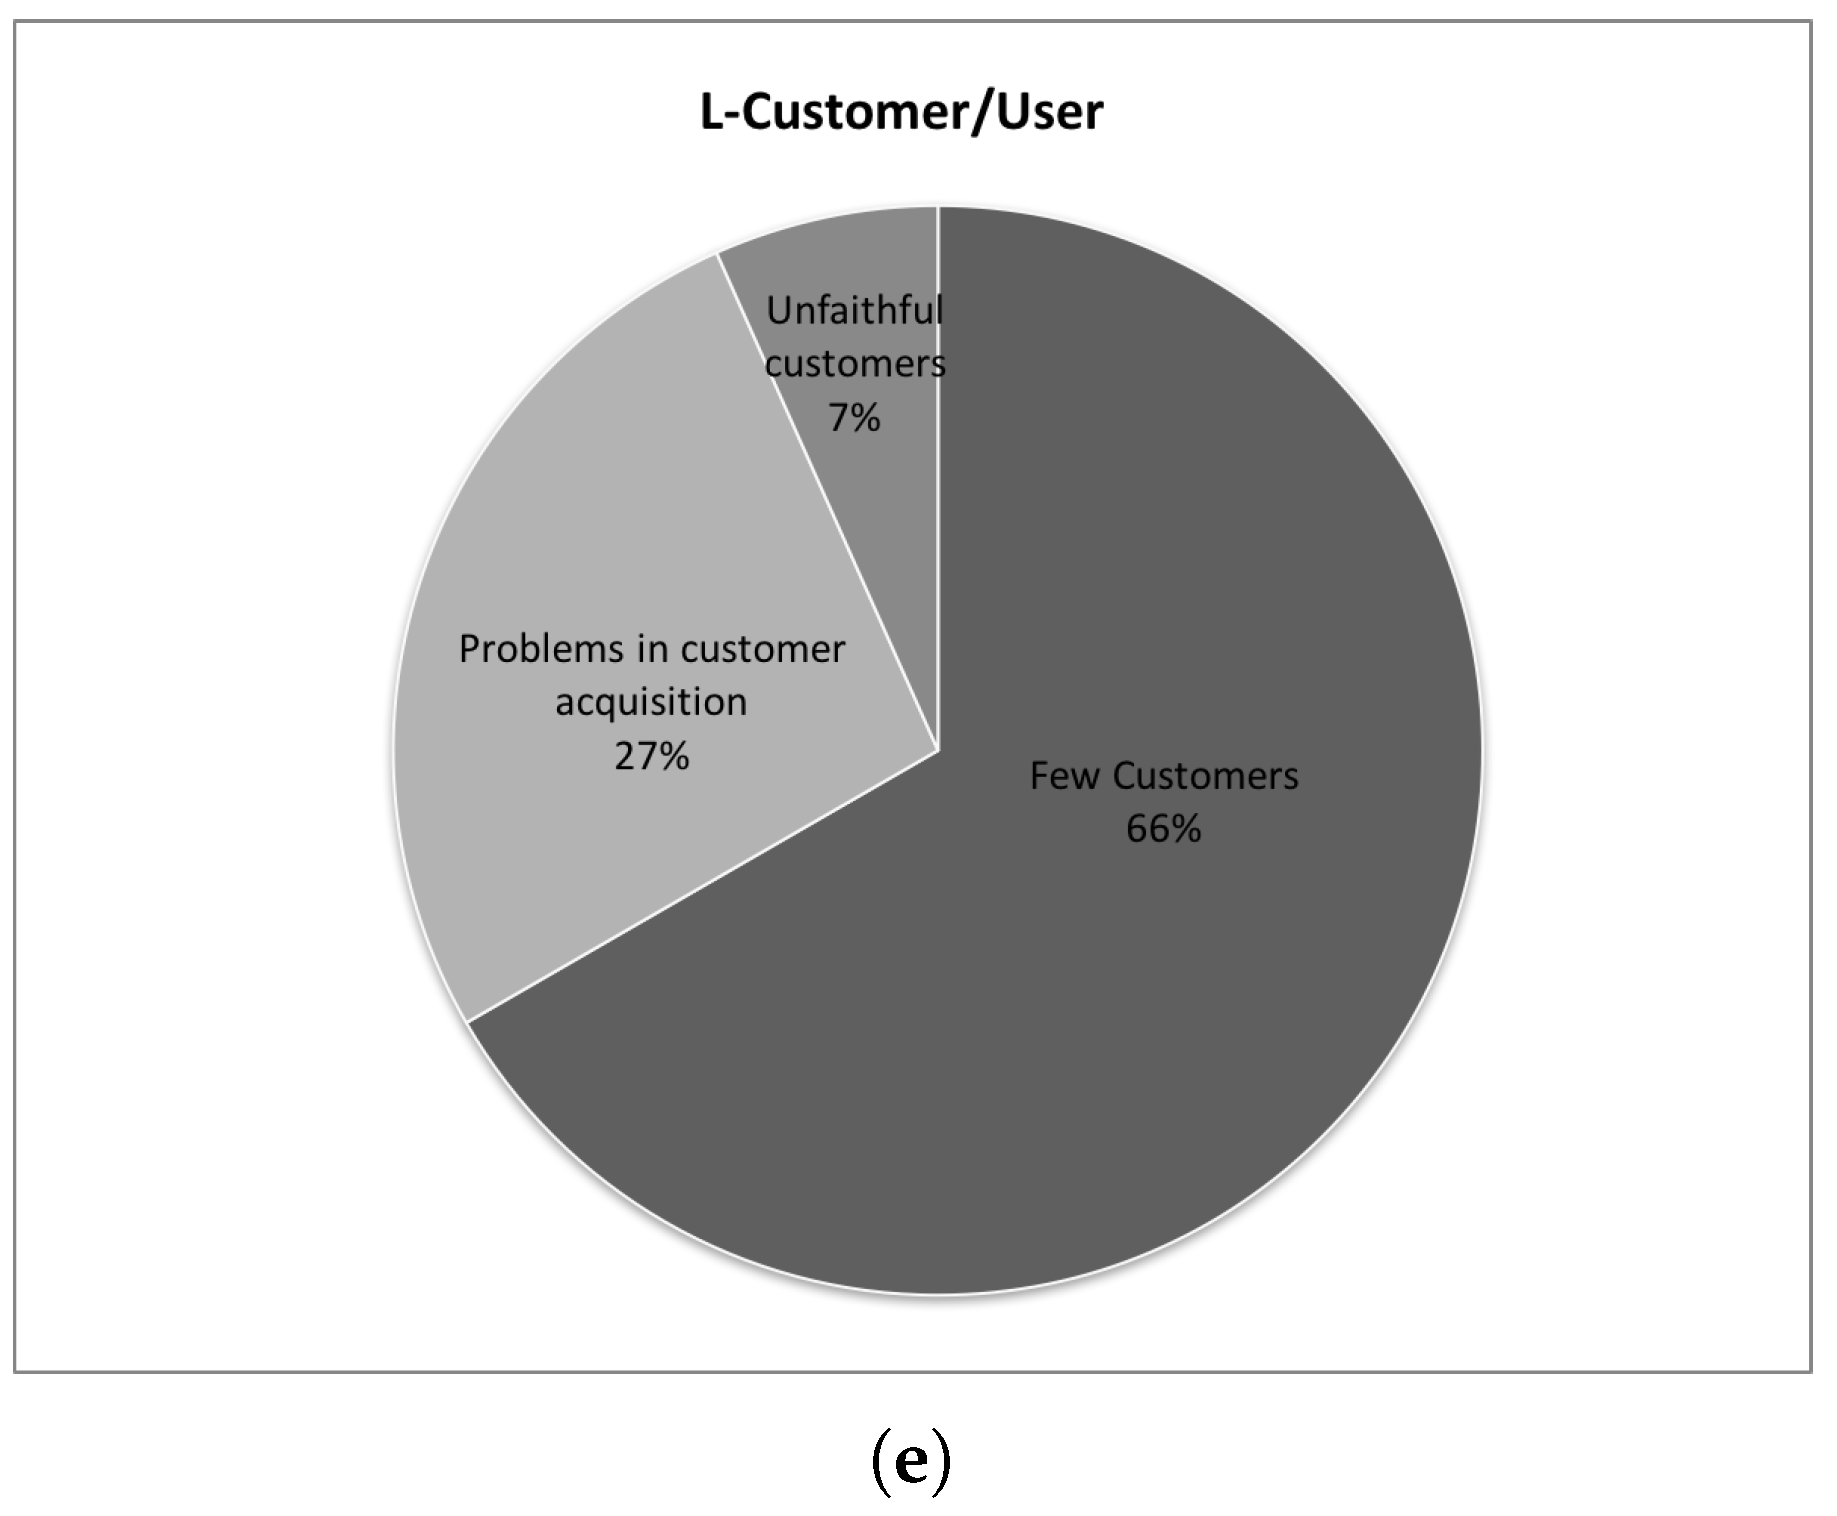
The results of the analysis conducted by means of the SHELL methodology are shown in the Figure 4, which highlights that the failure of a startup is rarely the consequence of only one reason, instead different factors influence its failure, leading an excess compared to the total 100%. The figure shows how the two main reasons for failure are the absent or the wrong business model and the lack of business development, respectively with 35% and 28% occurrences. Behind these issues, there is a high focus on the product or service by the management and founders, but an insufficient attention to commercial development. Moreover, 21% of the startups were reported to have run out of cash, which can be either attributed to a wrong use of the investment received (even though it could also be seen as a signal that investors did not commit to further financing rounds because they did not perceive sufficient elements supporting the decision). Finally, the fourth main reason for failure, with 18% occurrence, is connected to a lack of the product/market fit. Moving the analysis according to the SHELL classification perspective, the reasons for failure above presented are mainly related to the Software and Liveware/Organization components. In fact, as shown in the following chart (Figure 5), and looking at the five components of the SHELL model, startup failures are largely originated by these two categories, that count respectively 37% and 30% of failures. Moreover, 15% of the problems are caused by the environment and specifically related to the competition (about 14%) and to investors (19%). The Liveware/Customers and Users and the Hardware categories have the lowest impact on the failure of the startups, with only 9% and 10%, respectively. For more details about the percentages of the reasons of startups failure for each component of the SHELL model see Figure 6.
3.2.2. Years of Life
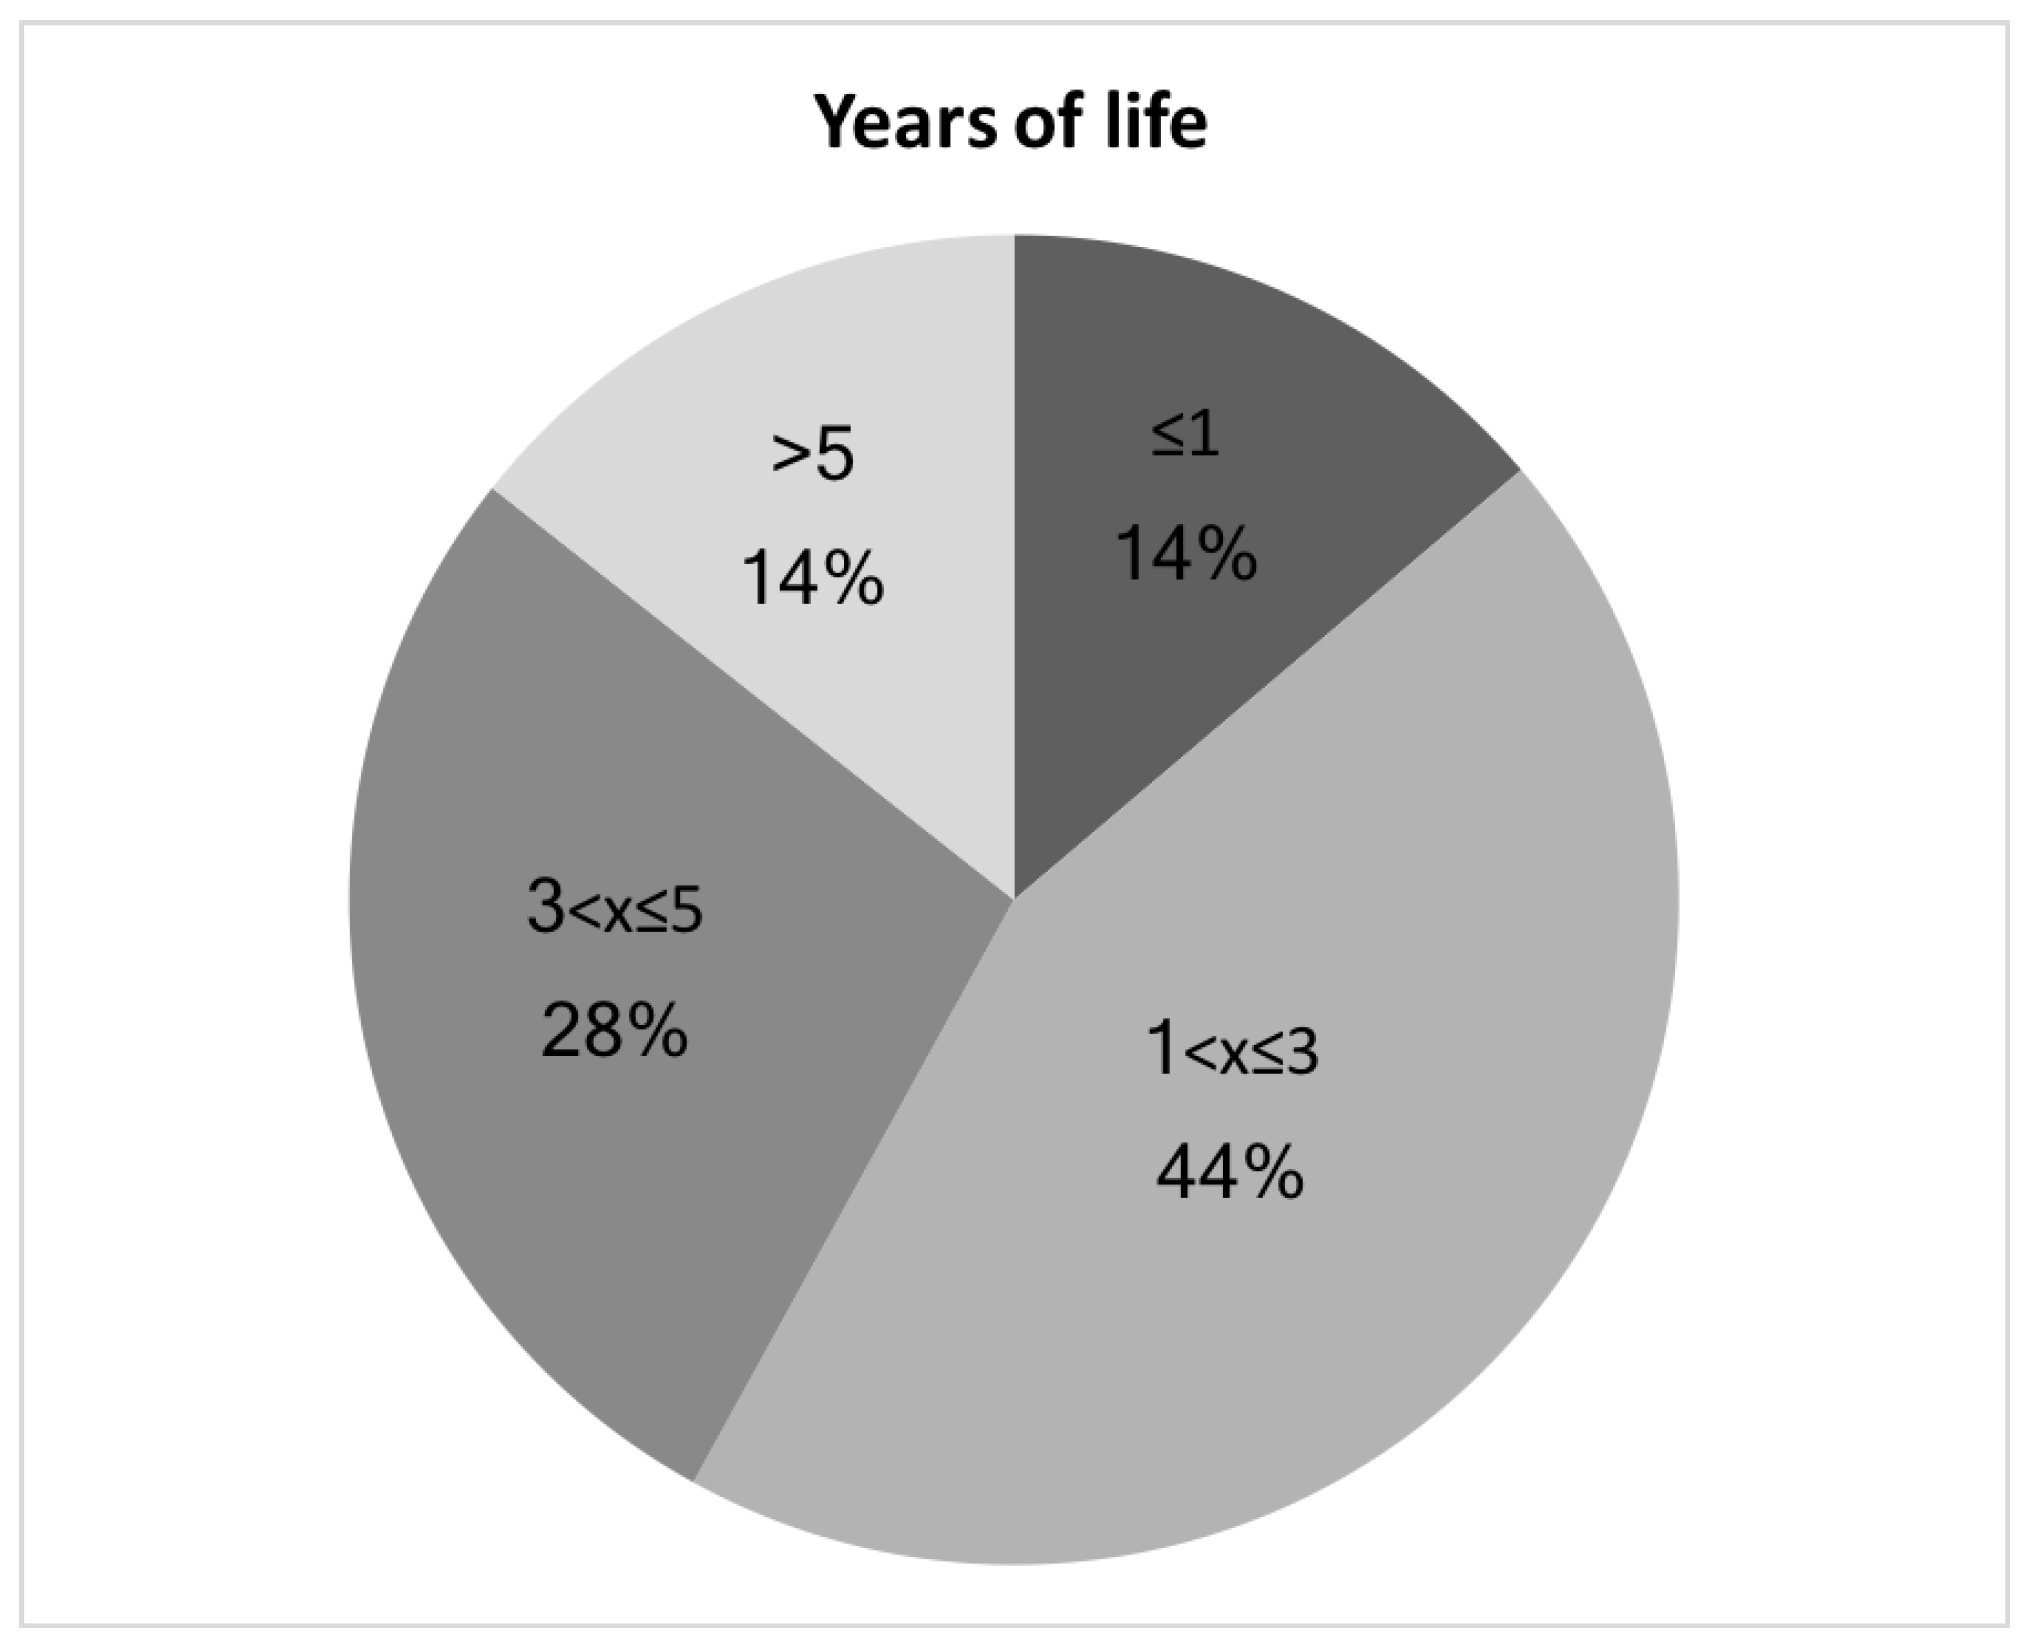
An interesting analysis conducted has the aim to study how the different causes of failure, identified through the SHELL model, occur over the years of life of the startups, identifying the relationship between the reasons and specific periods of the startup life (e.g., in the early stage) and their trends. First, by analyzing the age of the startups as shown in Figure 7, it emerges that the 44% of them managed to run the activity around 2 and 3 years, and 28% between 3 and 5 years. 14% of the startups failed in less than one year and 14% lived more than 5 years. Each startup, with an age of more than 5 years, has closed an average of 2.16 rounds of investments including the seed, receiving an average amount of 16.39 millions of dollars.
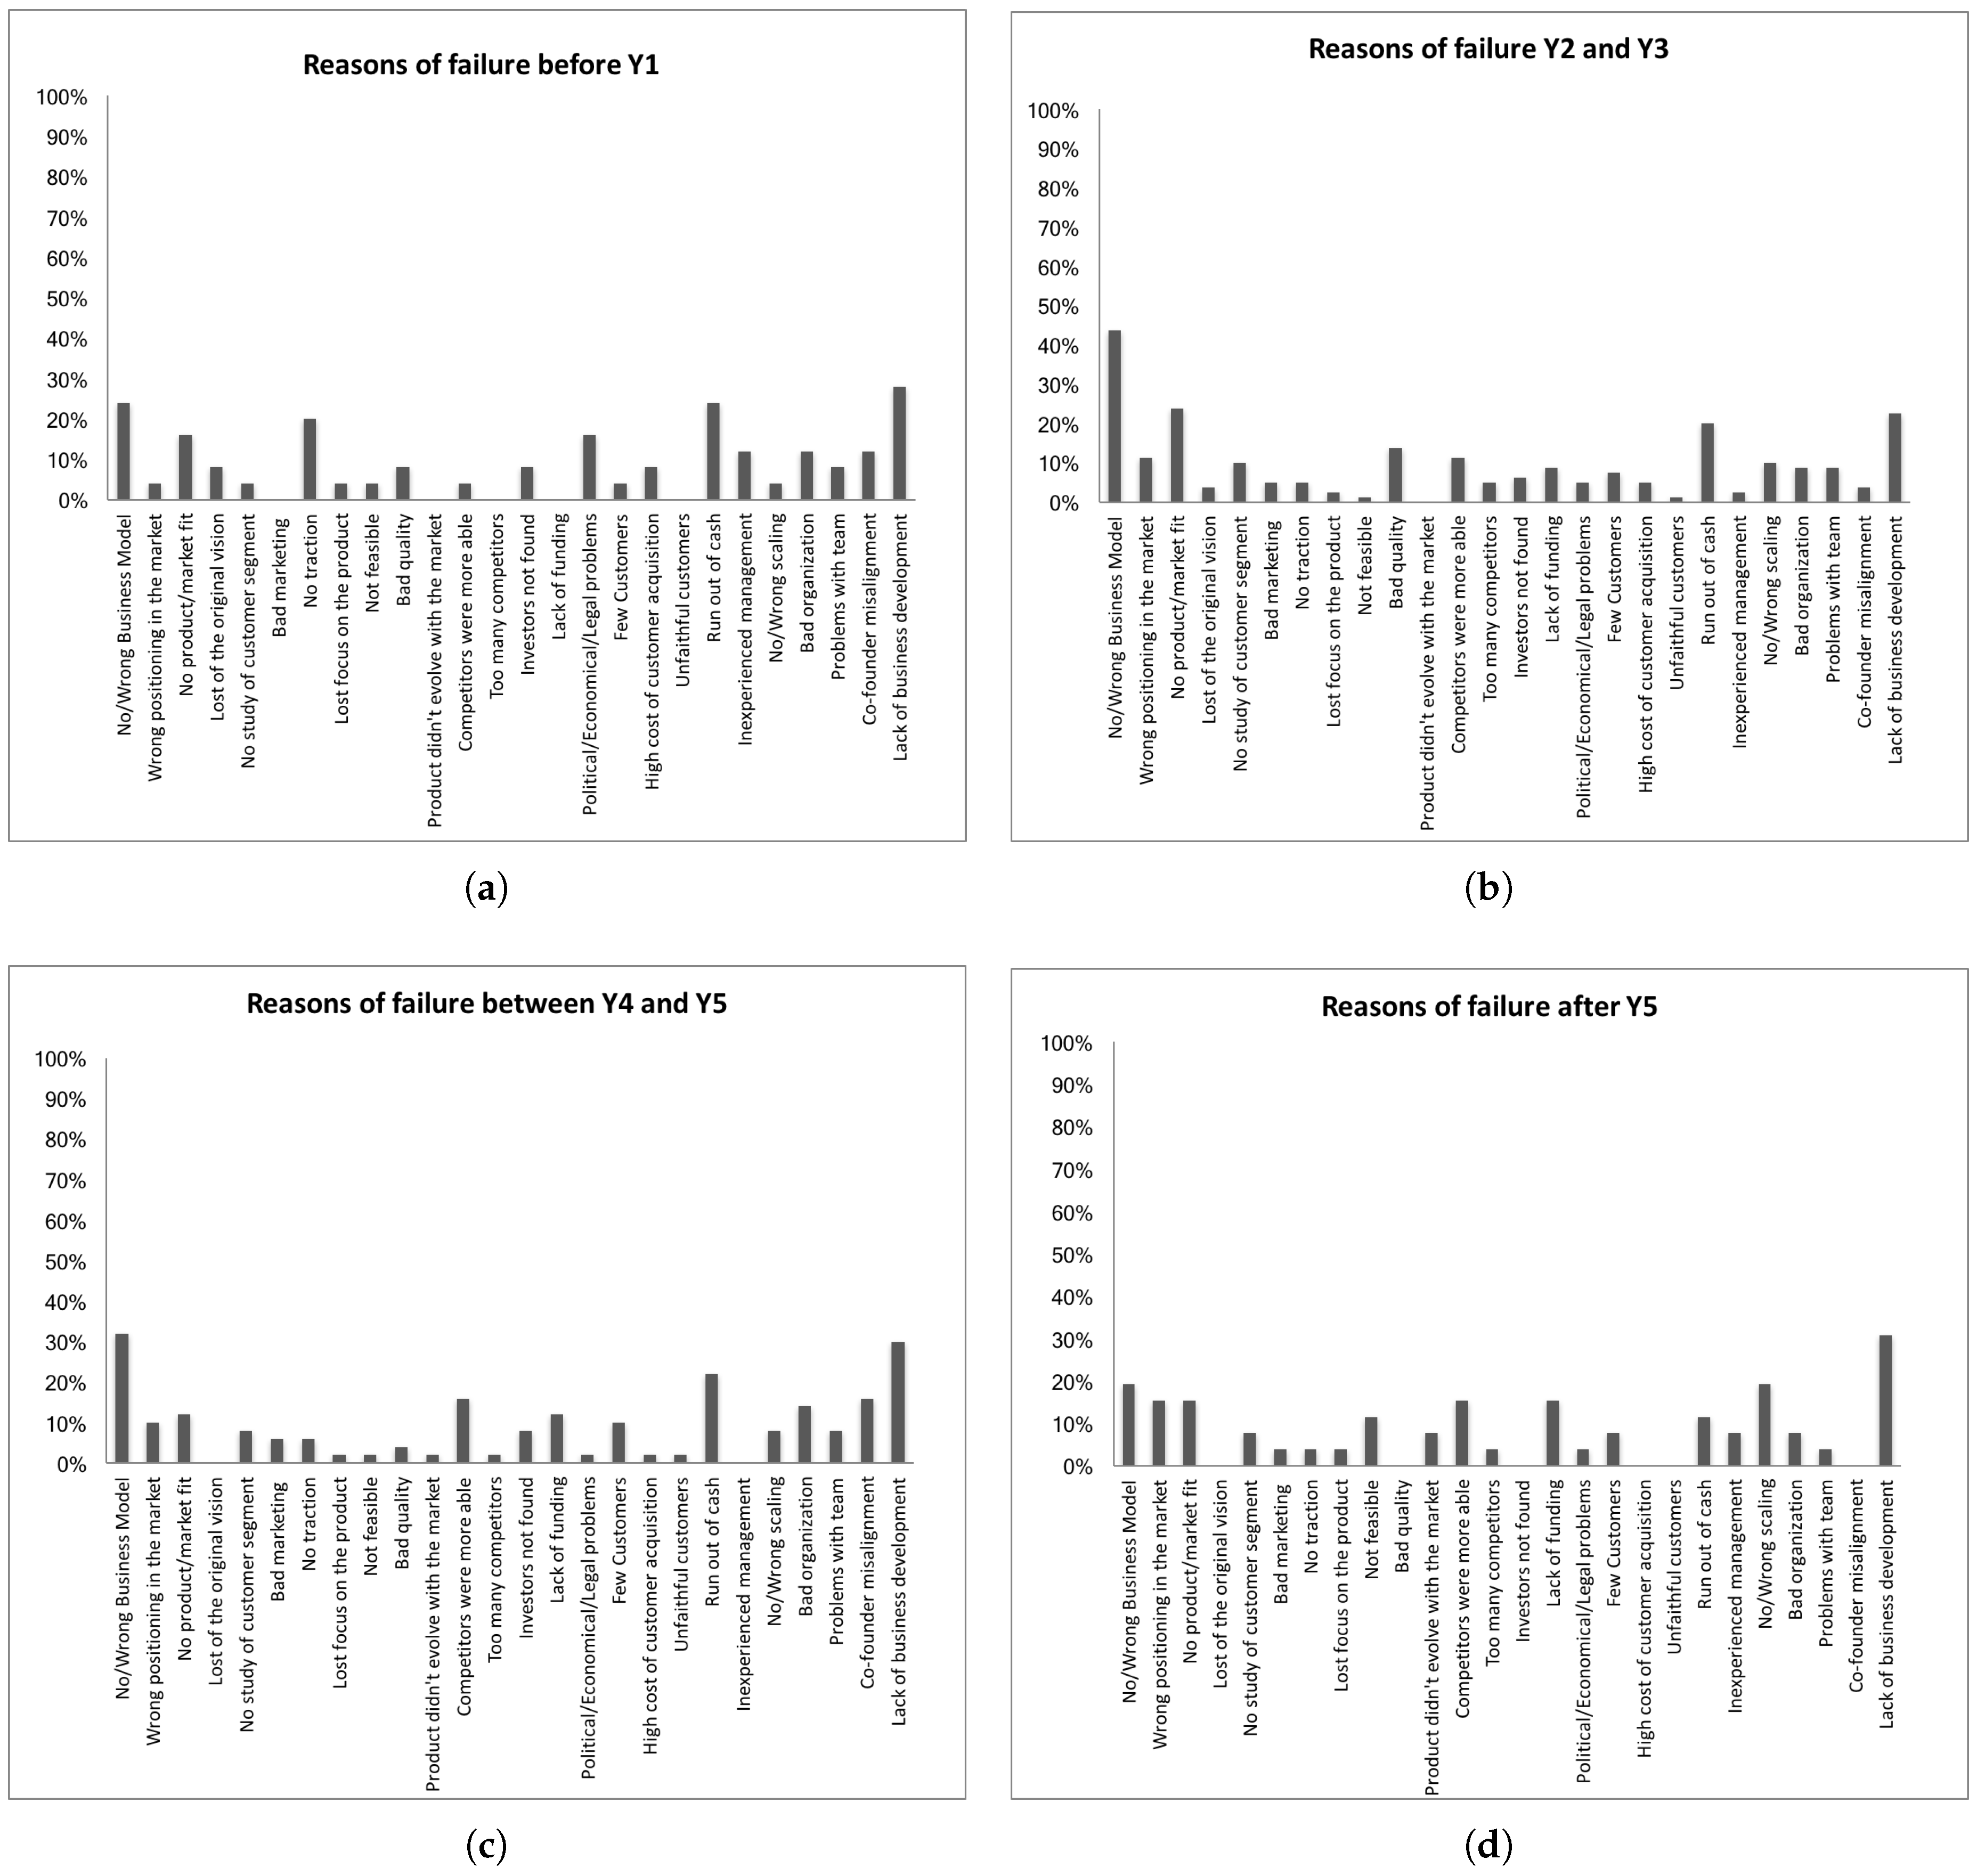
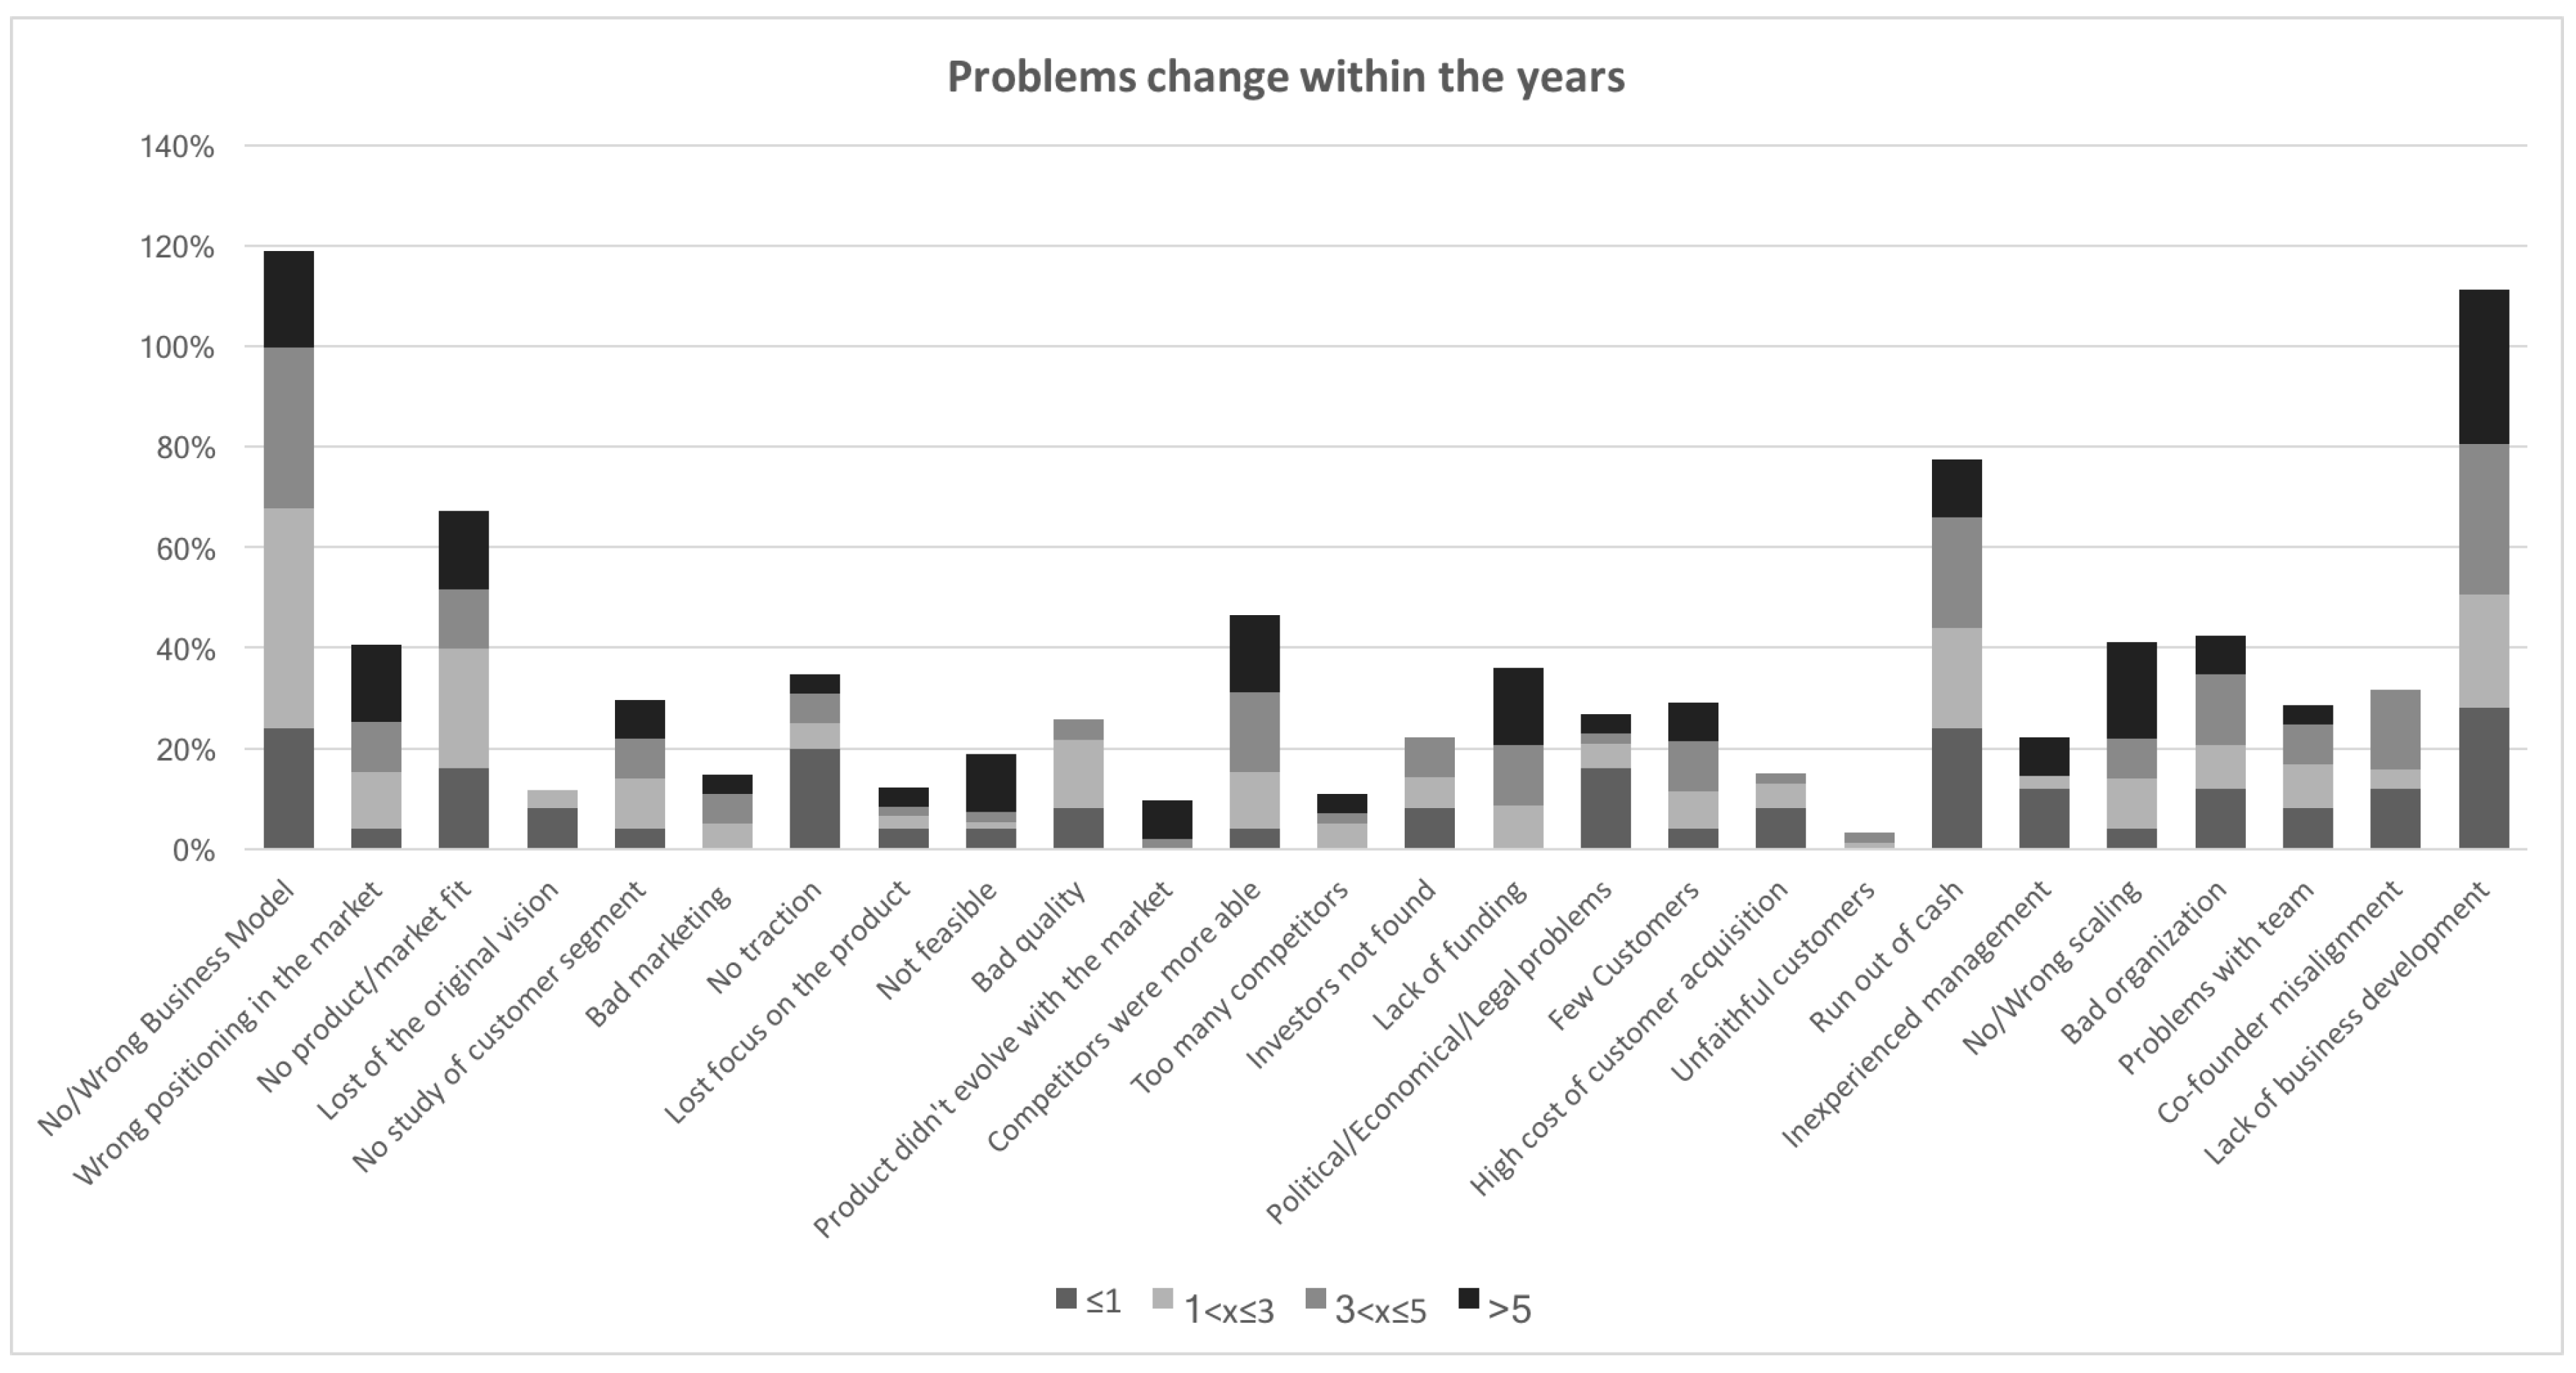
Figure 8 shows the reasons for failure split by years of life of the startup. The two main reasons for failure before the first year of life are the lack of a business model and business development, respectively with 24% and 28%. Other reasons are the run out of cash (24%), no traction (24%), and inexperienced management (12%). This result should not be surprising seeing that the inexperience influences mostly the younger startups. During the second and the third year, the lack of business development (23%) starts to become less relevant than issues in the business model, which grows from 24% of the first year to 44%. In addition to these problems, startups deal with issues about product/market fit (24%) and the availability of money (20% of cases of run out of cash). Concerning this last reason for failure, it plays an essential role in these years, because the first signals and results of the bad business development begin to appear. Thus, if the business model does not work as well, compromising its profitability, together with other problems (e.g., the bad marketing and organization, failed pivot or the wrong customer segments, etc.), the economic sustainability of the model is more affected by the running out of cash. This is due both to a reduced investors attraction and to cash flows delayed in time. Moving to the fourth and fifth years, a wrong or absent business model remains a relevant cause of the startup’s failure. However, in this time interval, problems among founders become to emerge, due to misalignment about the goals.
The aforementioned results highlight that, in general, the leading causes for failure lie in the lack of managerial perspective and, in particular, on business development (Figure 9). This is due to the life cycle of the startups too anchored to a classical vision, according to which after an early stage in an incubator, the business development is conducted by a member of the team, who has the role of Chief Business Development Officer (CBDO) [58]. However, as emerged by the classification of the failures, often the team has high technology-based skills, leading to a lack or wrong business development. On the contrary, a strengthening of the business development by the founders is needed through a proper process. This includes a first phase of supervised training and mentorship of the team, by an external expert, to provide managerial competencies useful to drive in the future the business development of the startup.
3.2.3. Mutual Contribution of Failure Causes
As previously mentioned, companies rarely die due to a single failure cause. To better understand the chain of causes is driving a startup to a probable failure, we performed a statistical analysis of all our database using IBM SPSS modeler 18. The statistical model we built performs the following steps:
- We first make a broad clustering analysis on the startups using, as variables, all the startup failure reasons. More in depth, we considered, as clustering methods, k-means, Kohonem network and two-step cluster analysis [59]. When needed, the number of the cluster was fixed to 3, 4 and 5. Given all the combinations of clustering method and number of clusters, the combination with the best silhouette coefficient computed as , where denotes cluster labels which do not include case i as a member, while is the cluster label which includes case i. If , the Silhouette of case i is not used in the average operations.
- Given the best combination of method and parameters, for each cluster we analyzed the importance of the startup failures as predictors by computing importance of the predictor i as , where is the set of predictor fields and is the significance of predictor i defined as its .
The best method was k-means with 3 clusters. One cluster covers 62% of the startups, while the second one 24% and the third one just the 13%. The main predictors of startup failures are Lack of business development (I = 1.0), followed by No product/marketing mix (I = 0.54) and Few Customers (I = 0.41) and No/Wrong Business Model (I = 0.24). The other predictors have a significance less than 0.05, so can be considered as ancillary for the clustering. In order to investigate the presence of a list of association rules between these predictors, we applied a Continuous Association Rule Mining Algorithm (CARMA) discovery algorithm to discover association rules in the data [60]. The model identified the No Product/Marketing Mix and the Run out of cash as ancestors of the No/Wrong Business Model.
If we perform a similar process by segmenting the companies according to their age at the failure, the reasons for failure during the first year are a combination of No/wrong business model and lack of business development, which results in a premature run out of cash. The inexperience of the management is underlined, and, in some cases, their failure is due to a missing product/market fit and a high cost of customers’ acquisition. When the company’s age is between two and three years, the missing product/market fit linked to a No/wrong business model acquires even more relevance. In this time frame, a high number of companies also reported, as a cause of failure, a reduced competitive advantage with respect to competitors, and bad financial management. Finally, for companies’ age between two and three years, the relationship between business development and product/market fit and customer segmentation becomes relevant. In older companies (4–5 and 5+ years of life) the lack of business development acquires even more importance. Therefore, failure causes are no more mainly related to the SHELL category S-business model and they are instead mainly linked to L-Customers/users and L-Organization. In fact, problems such as a missing or wrong scaling, or organization issues become relevant, highlighting that the failing company was not able to adapt its organization to remain competitive in a broader market.
To investigate how failure causes affect each industry, industries are grouped in Industrial sectors (Table 1). When one focuses on the three most relevant sectors (ICT and Telecommunications, Entertainment and Education and Services, showing the highest number of industries postmortem analysis), some differences appear. In particular, in the Entertainment and Education sector the lack of competitiveness is more relevant than in the other two sectors. In addition, it appears that the risk of failing due to the lack of funding is higher than in the other two sectors. The ICT and Telecommunications sector seems to suffer less from the lack of funding and seems to be a sector characterized by companies able to compete on the market. Nonetheless, a correct product/market fit is still required to succeed. Some critical aspects related to the organization have been highlighted as well, such as the inexperience of the management, a bad organization or a misalignment among co-founders. Finally, companies failing in the Services sector highlighted some difficulties in finding investors, as well as a high cost of customers acquisition, mainly due to a missing product/market fit and to a limited number of customers.
4. Final Remarks
Given the above analysis, the SHELL appears to be a powerful model, especially if applied to a large database, because it allows the development of a standard model or survey for the autopsy of the startups failed, allowing to define a sort of taxonomy useful to identify the more frequently patterns. More in general, a typical failure pattern related to the Business Development process emerges. Actually, after consolidating the Business Model, entrepreneurs seem to focus directly on the sales or on the product/service improvement, disregarding the design of a reliable, measurable and engineered Business Development phase. This comes in different forms, including running out of cash, difficulty in finding customers or high cost in acquiring the customers. Unfortunately, this is also a general lack in the scientific literature, which literally neglects the Business Development process, relegating it to a mere sales process. From the point of view of the startups, entrepreneurs are usually in love with their product/service (e.g., building a solution looking for a problem instead of targeting a market need) and they usually lack in Business Development expertise [56]. Moreover, in case the company undergoes an incubation/acceleration process (3/4 years) the focus of mentors is in clarifying the Business Model and create a first, reliable structure. After that period, the startup starts to play its game in the market almost alone. Thus, in our opinion, there are two main actions that should be done for reducing the impact of an incorrect Business Development process. From the scientific point of view, there is the need of studies on engineered Business Development processes that can be applied with a limited effort and a limited knowledge of the management and marketing theory by the startuppers. Second, the incubators/accelerators should think to a post-incubation phase where a company/group specialized in Business Development is put aside the startup. A partial answer to the first point is emerging from some developments of the Lean Startup philosophy, as the GUEST Business method [61,62,63].
Moreover, there is still work for automatizing the process presented in this paper for analyzing a larger database and build a comprehensive taxonomy of startup failures. In fact, at present, the analysis of postmortem reports has been done manually, by identifying relevant factors in the text and subsequently structuring them according to the modified failure taxonomy. The outcomes of this process highlight the need in the future, of enhancing the methodology and applying the taxonomy in a more structured and comprehensive way, on larger databases of startup failures, as those gathered by the accelerators and incubators ecosystem in Europe. However, given the limitations of processing and handling large datasets manually, the findings of this work could be used to build intelligent systems based on data mining approaches, able to identify failure causes from natural language texts and automatically classify them. Moreover, extending the analysis on extensive databases might be used to extrapolate the effect of the policies, for example in compliance with the Horizon 2020 programme and the SME Instrument for supporting startups.
Author Contributions
Authors contributed equally to design the research and writing the paper. All authors proofread and approved the final manuscript.
Funding
Partial funding for this work was provided by the Canadian Natural Sciences and Engineering Research Council (NSERC) through its Discovery Grants Program.
Acknowledgments
While working on this paper, the third author was the head of the Urban Mobility and Logistics Systems (UMLS) initiative of the interdepartmental Center for Automotive Research and Sustainable mobility (CARS) at Politecnico di Torino, Italy. The authors are grateful to the Area Editor and anonymous referees whose comments have contributed to improve the quality of this paper.
Conflicts of Interest
The authors declare no conflict of interest.
References
- Nightingale, P.; Coad, A. Muppets and gazelles: Political and methodological biases in entrepreneurship research. Ind. Corp. Chang. 2014, 23, 113–143. [Google Scholar] [CrossRef]
- Landström, G.; Harirchi, H.; Åström, F. Entrepreneurship: Exploring the knowledge base. Res. Policy 2012, 41, 1154–1181. [Google Scholar] [CrossRef] [Green Version]
- Frederiksen, D.; Brem, A. How do entrepreneurs think they create value? A scientific reflection of eric ries’ lean startup approach. Int. Entrep. Manag. J. 2017, 13, 169–189. [Google Scholar] [CrossRef]
- Altman, E.I. Financial ratios, discriminant analysis and the prediction of corporate bankruptcy. J. Financ. 1968, 23, 589–609. [Google Scholar] [CrossRef]
- Beaver, W.H. Financial ratios as predictors of failure. J. Account. Res. 1966, 4, 71–111. [Google Scholar] [CrossRef]
- Kolari, J.; Glennon, D.; Shin, H.; Caputo, M. Predicting large us commercial bank failures. J. Econ. Bus. 2002, 54, 361–387. [Google Scholar] [CrossRef]
- Martin, D. Early warning of bank failure. J. Bank. Financ. 1977, 1, 249–276. [Google Scholar] [CrossRef]
- Zmijewski, M.E. Methodological issues related to the estimation of financial distress prediction models. J. Account. Res. 1984, 22, 59–82. [Google Scholar] [CrossRef]
- Frydman, H.; Altman, E.I.; Kao, D.-L. Introducing recursive partitioning for financial classification: The case of financial distress. J. Financ. 1985, 40, 269–291. [Google Scholar] [CrossRef]
- Tam, K.Y. Neural network models and the prediction of bank bankruptcy. Omega 1991, 19, 429–445. [Google Scholar] [CrossRef]
- Ozkan, I.; Türkşen, I.; Canpolat, N. A currency crisis and its perception with fuzzy c-means. Inf. Sci. 2008, 178, 1923–1934. [Google Scholar] [CrossRef]
- Chiam, S.C.; Tan, K.C.; Mamun, A.A. A memetic model of evolutionary pso for computational finance applications. Expert Syst. Appl. 2009, 36, 3695–3711. [Google Scholar] [CrossRef]
- Arne, L.; Kalleberg, K.T.L. Gender and Organizational Performance: Determinants of Small Business Survival and Success. Acad. Manag. J. 1991, 34, 136–161. [Google Scholar]
- Sexton, E.A.; Robinson, P.B. The Economic and Demographic Determinants of Self-Employment; Frontiers of Entrepreneurship Research, Babson College: Babson Park, MA, USA, 1989; pp. 28–42. [Google Scholar]
- Marom, S.; Lussier, R.N. A business success versus failure prediction model for small businesses in Israel. Bus. Econ. Res. 2014, 4, 63–81. [Google Scholar] [CrossRef]
- Everett, J.; Watson, J. Small business failure and external risk factors. Small Bus. Econ. 1998, 11, 371–390. [Google Scholar] [CrossRef]
- Seshadri, D. Understanding new venture failure due to entrepreneur-organization goal dissonance. Vikalpa 2007, 32, 55–74. [Google Scholar]
- Hayward, M.L.; Shepherd, D.A.; Griffin, D. A hubris theory of entrepreneurship. Manag. Sci. 2006, 52, 160–172. [Google Scholar] [CrossRef]
- Ottesen, G.G.; Grønhaug, K. Positive illusions and new venture creation: Conceptual issues and an empirical illustration. Creat. Innov. Manag. 2005, 14, 405–412. [Google Scholar] [CrossRef]
- Simon, M.; Houghton, S.M.; Aquino, K. Cognitive biases, risk perception, and venture formation: How individuals decide to start companies. J. Bus. Ventur. 2000, 15, 113–134. [Google Scholar] [CrossRef]
- Cardon, M.S.; Stevens, C.E.; Potter, D.R. Misfortunes or mistakes?: Cultural sensemaking of entrepreneurial failure. J. Bus. Ventur. 2011, 26, 79–92. [Google Scholar] [CrossRef]
- Cope, J. Entrepreneurial learning from failure: An interpretative phenomenological analysis. J. Bus. Ventur. 2011, 26, 604–623. [Google Scholar] [CrossRef] [Green Version]
- Hmieleski, K.M.; Lerner, D.A. The dark triad and nascent entrepreneurship: An examination of unproductive versus productive entrepreneurial motives. J. Small Bus. Manag. 2016, 54, 7–32. [Google Scholar] [CrossRef]
- Isaksen, A. Towards increased regional specialization? the quantitative importance of new industrial spaces in norway, 1970–1990. Nor. Geol. Tidsskr. 1996, 50, 113–123. [Google Scholar] [CrossRef]
- Littunen, H.; Storhammar, E.; Nenonen, T. The survival of firms over the critical first 3 years and the local environment. Entrep. Reg. Dev. 1998, 10, 189–202. [Google Scholar] [CrossRef]
- Spilling, O.R. Regional variation of new firm formation: The Norwegian case. Entrep. Reg. Dev. 1996, 8, 217–244. [Google Scholar] [CrossRef]
- Vaillant, Y.; Lafuente, E. Do different institutional frameworks condition the influence of local fear of failure and entrepreneurial examples over entrepreneurial activity? Entrep. Reg. Dev. 2007, 19, 313–337. [Google Scholar] [CrossRef]
- Mackelprang, A.W.; Habermann, M.; Swink, M. How firm innovativeness and unexpected product reliability failures affect profitability. J. Oper. Manag. 2015, 38, 71–86. [Google Scholar] [CrossRef]
- Dutta, S.; Folta, T.B. A comparison of the effect of angels and venture capitalists on innovation and value creation. J. Bus. Ventur. 2016, 31, 39–54. [Google Scholar] [CrossRef]
- Hawkins, F.; Orlady, H. Human Factors in Flight; Routledge: London, UK, 1993. [Google Scholar]
- Rogoff, E.G.; Lee, M.S.; Suh, D.C. Who done it? Attributions by entrepreneurs and experts of the factors that cause and impede small business success. J. Small Bus. Manag. 2004, 42, 364–376. [Google Scholar] [CrossRef]
- Hammer, M.; Khelil, N. Exploring the different patterns of entrepreneurial exit: The causes and consequences. In Proceedings of the 59th Annual International Council for Small Business World Conference, Dublin, Ireland, 11–14 June 2014. [Google Scholar]
- Khelil, N. The many faces of entrepreneurial failure: Insights from an empirical taxonomy. J. Bus. Ventur. 2016, 31, 72–94. [Google Scholar] [CrossRef]
- Cooper, A.C.; Gimeno-Gascon, F.J.; Woo, C.Y. Initial human and financial capital as predictors of new venture performance. J. Bus. Ventur. 1994, 9, 371–395. [Google Scholar] [CrossRef]
- Dahlqvist, J.; Davidsson, P.; Wiklund, J. Initial conditions as predictors of new venture performance: A replication and extension of the cooper et al. study. Enterp. Innov. Manag. Stud. 2000, 1, 1–17. [Google Scholar] [CrossRef] [Green Version]
- Fritsch, M.; Brixy, U.; Falck, O. The effect of industry, region, and time on new business survival—A multi-dimensional analysis. Rev. Ind. Organ. 2006, 28, 285–306. [Google Scholar] [CrossRef]
- Thornhill, S.; Amit, R. Comprendre l’échec: Mortalité Organisationnelle et Approche Fondée sur les Ressources; Statistique Canada: Ottawa, ON, Canada, 2003.
- Van Gelderen, M.; Thurik, R.; Bosma, N. Success and risk factors in the pre-startup phase. Small Bus. Econ. 2005, 24, 365–380. [Google Scholar] [CrossRef]
- Duchesneau, D.A.; Gartner, W.B. A profile of new venture success and failure in an emerging industry. J. Bus. Ventur. 1990, 5, 297–312. [Google Scholar] [CrossRef]
- Bono, J.E.; McNamara, G. Publishing in AMJ—Part 2: Research Design. Acad. Manag. J. 2011, 54, 657–660. [Google Scholar] [CrossRef]
- Autopsyio. Lessons from Failed Startups. Available online: http://autopsy.io (accessed on 3 August 2016).
- Van Gelderen, M.; Thurik, R.; Patel, P. Encountered problems and outcome status in nascent entrepreneurship. J. Small Bus. Manag. 2011, 49, 71–91. [Google Scholar] [CrossRef]
- Gartner, W.B. A conceptual framework for describing the phenomenon of new venture creation. Acad. Manag. Rev. 1985, 10, 696–706. [Google Scholar] [CrossRef]
- Hawkins, F. Human Factors in Flight, 2nd ed.; Ashgate: Aldershot, UK, 1987. [Google Scholar]
- Reinhart, R. Basic Flight Physiology, 2nd ed.; McGraw-Hill: New York, NY, USA, 1996. [Google Scholar]
- The Swedish Club Academy. Information to Maritime Administrations and Training Providers. Maritime Resource Management; A Brief Guide on the STCW Manila Amendments in Respect of Resource Management and Leadership & Teamwork Training; The Swedish Club Academy: Gothenburg, Sweden, 2011. [Google Scholar]
- Bird, F.E. Management Guide to Loss Control; Institute Press: Atlanta, GA, USA, 1974. [Google Scholar]
- Reason, J. Human Error; Cambridge University Press: Cambridge, UK, 1992. [Google Scholar]
- Wiegmann, D.; Shappell, S. A Human Error Approach to Aviation Accident Analysis: The Human Factors Analysis and Classification System; England Ashgate Publishing Ltd.: Aldershot, UK, 2004. [Google Scholar]
- EuroControl EAM 2/GUI 8. Guidelines on the Systemic Occurrence Analysis Methodology (SOAM); EuroControl: Brussels, Belgium, 2005. [Google Scholar]
- Marine Accident Investigator’s International Forum. 2000. Available online: http://www.maiif.org/imo (accessed on 28 June 2018).
- Osterwalder, A.; Pigneur, Y. Business Model Generation. A Handbook for Visionaries, Game Changers, and Challengers; Wiley: Hoboken, NJ, USA, 2010. [Google Scholar]
- Teece, D. Business model, business strategy and innovation. Long Range Plan. 2010, 43, 172–194. [Google Scholar] [CrossRef]
- Shirky, C. Here Comes Everybody: The Power of Organizing without Organizations; Penguin: New York, NY, USA, 2008. [Google Scholar]
- Porter, M. Competitive Strategy: Techniques for Analyzing Industries and Competitors; The Free Press: New York, NY, USA, 1980. [Google Scholar]
- CBInsights. The Top 20 Reasons Startups Fail. From Lack of Product-Market Fit to Disharmony on the Team, We Break Down the Top 20 Reasons for Startup Failure by Analyzing 101 Startup Failure Post-Mortem. 2016. Available online: https://www.cbinsights.com/ (accessed on 18 February 2018).
- CBInsights. 166 Startup Failure Post-Mortems. 2016. Available online: https://www.cbinsights.com/blog/startup-failure-post-mortem/ (accessed on 28 July 2016).
- Blank, S. The Four Steps to the Epiphany: Successful Strategies for Products That Win; BookBaby: Pennsauken, NJ, USA, 2013. [Google Scholar]
- Marsland, S. Machine Learning: An Algorithmic Perspective; CRC Press: Boca Raton, FL, USA, 2015. [Google Scholar]
- Hidber, C. Online association rule mining. In Proceedings of the 1999 ACM SIGMOD International Conference on Management of Data, Philadelphia, PA, USA, 31 May–3 June 1999; Delis, A., Faloutsos, C., Ghandeharizadeh, S., Eds.; ACM Press: New York, NY, USA, 1999; Volume 28, pp. 145–156. [Google Scholar]
- Perboli, G.; Ferrero, F.; Musso, S.; Vesco, A. Business models and tariff simulation in car-sharing services. Transp. Res. Part A Policy Pract. 2017. [Google Scholar] [CrossRef]
- Perboli, G.; Musso, S.; Rosano, M.; Tadei, R.; Godel, M. Synchro-modality and slow steaming: New business perspectives in freight transportation. Sustainability 2017, 9, 1843. [Google Scholar] [CrossRef]
- The GUEST Initiative. 2017. Available online: http://www.theguestmethod.com (accessed on 20 April 2017).
Figure 1.
SHELL Model.

Figure 2.
SHELL Model adapted for the classification of startups failure.

Figure 3.
Startups failures by industry.

Figure 4.
Reasons of the startups failure.

Figure 5.
Results of the SHELL classification.

Figure 6.
Results for each component of the SHELL model. (a) Software-business model; (b) hardware-product; (c) environment-environment; (d) liveware-organization; (e) liveware-customer and user.
Figure 6.
Results for each component of the SHELL model. (a) Software-business model; (b) hardware-product; (c) environment-environment; (d) liveware-organization; (e) liveware-customer and user.


Figure 7.
Years of life of the startups.

Figure 8.
Reasons of startups failure per years of life. (a) Reasons for failure before the first year of life; (b) reasons for failure between the second and the third year of life; (c) reasons for failure between the fourth and the fifth year of life; (d) reasons for failure after the fifth year of life.

Figure 9.
Trend of the main reasons for failure along the years of life.


Table 1.
Organization of industries in sectors.
| Sector | Industry | Number of Industries | Sector | Industry | Number of Industries |
|---|---|---|---|---|---|
| ICT and Telecomm. | Analitycs/Big Data | 8 | Entertainment and Education | E-book | 2 |
| Cloud Management | 2 | E-Learn | 3 | ||
| Hardware | 3 | Ed-Tech | 1 | ||
| Mobile | 8 | Entertainment | 15 | ||
| Telecomm. | 1 | Fashion | 6 | ||
| Web Development | 8 | Gaming | 6 | ||
| Software | 19 | Media | 7 | ||
| Platform | 6 | Music/Audio | 9 | ||
| Healthcare and Biotech | Biotech | 2 | News | 3 | |
| Healthcare IT and services | 4 | Photo/Video | 9 | ||
| Services | Advertising | 5 | Social Media | 27 | |
| Communications | 4 | Travel | 3 | ||
| Consultancy | 3 | Food and Grocery | Food & Grocery | 2 | |
| CRM | 3 | Manufacturing and Logistics | Logistic/ Delivery | 1 | |
| Energy | 4 | Commerce and Finance | Bitcoin | 2 | |
| Marketing | 2 | E-commerce | 12 | ||
| Security | 2 | Finance | 3 | ||
| Service | 17 |
© 2018 by the authors. Licensee MDPI, Basel, Switzerland. This article is an open access article distributed under the terms and conditions of the Creative Commons Attribution (CC BY) license (http://creativecommons.org/licenses/by/4.0/).
Share and Cite
MDPI and ACS Style
Cantamessa, M.; Gatteschi, V.; Perboli, G.; Rosano, M. Startups’ Roads to Failure. Sustainability 2018, 10, 2346. https://0-doi-org.brum.beds.ac.uk/10.3390/su10072346
AMA Style
Cantamessa M, Gatteschi V, Perboli G, Rosano M. Startups’ Roads to Failure. Sustainability. 2018; 10(7):2346. https://0-doi-org.brum.beds.ac.uk/10.3390/su10072346
Chicago/Turabian StyleCantamessa, Marco, Valentina Gatteschi, Guido Perboli, and Mariangela Rosano. 2018. "Startups’ Roads to Failure" Sustainability 10, no. 7: 2346. https://0-doi-org.brum.beds.ac.uk/10.3390/su10072346
Note that from the first issue of 2016, this journal uses article numbers instead of page numbers. See further details here.