Tracking of Physical Activity, Sport Participation, and Sedentary Behaviors over Four Years of High School

 , , and
Abstract
:1. Introduction
2. Materials and Methods
2.1. Study Participants
2.2. Physical Activity Assessment
2.3. Sedentary Behavior Assessment
2.4. Sport Participation Assessment
2.5. Data Analysis
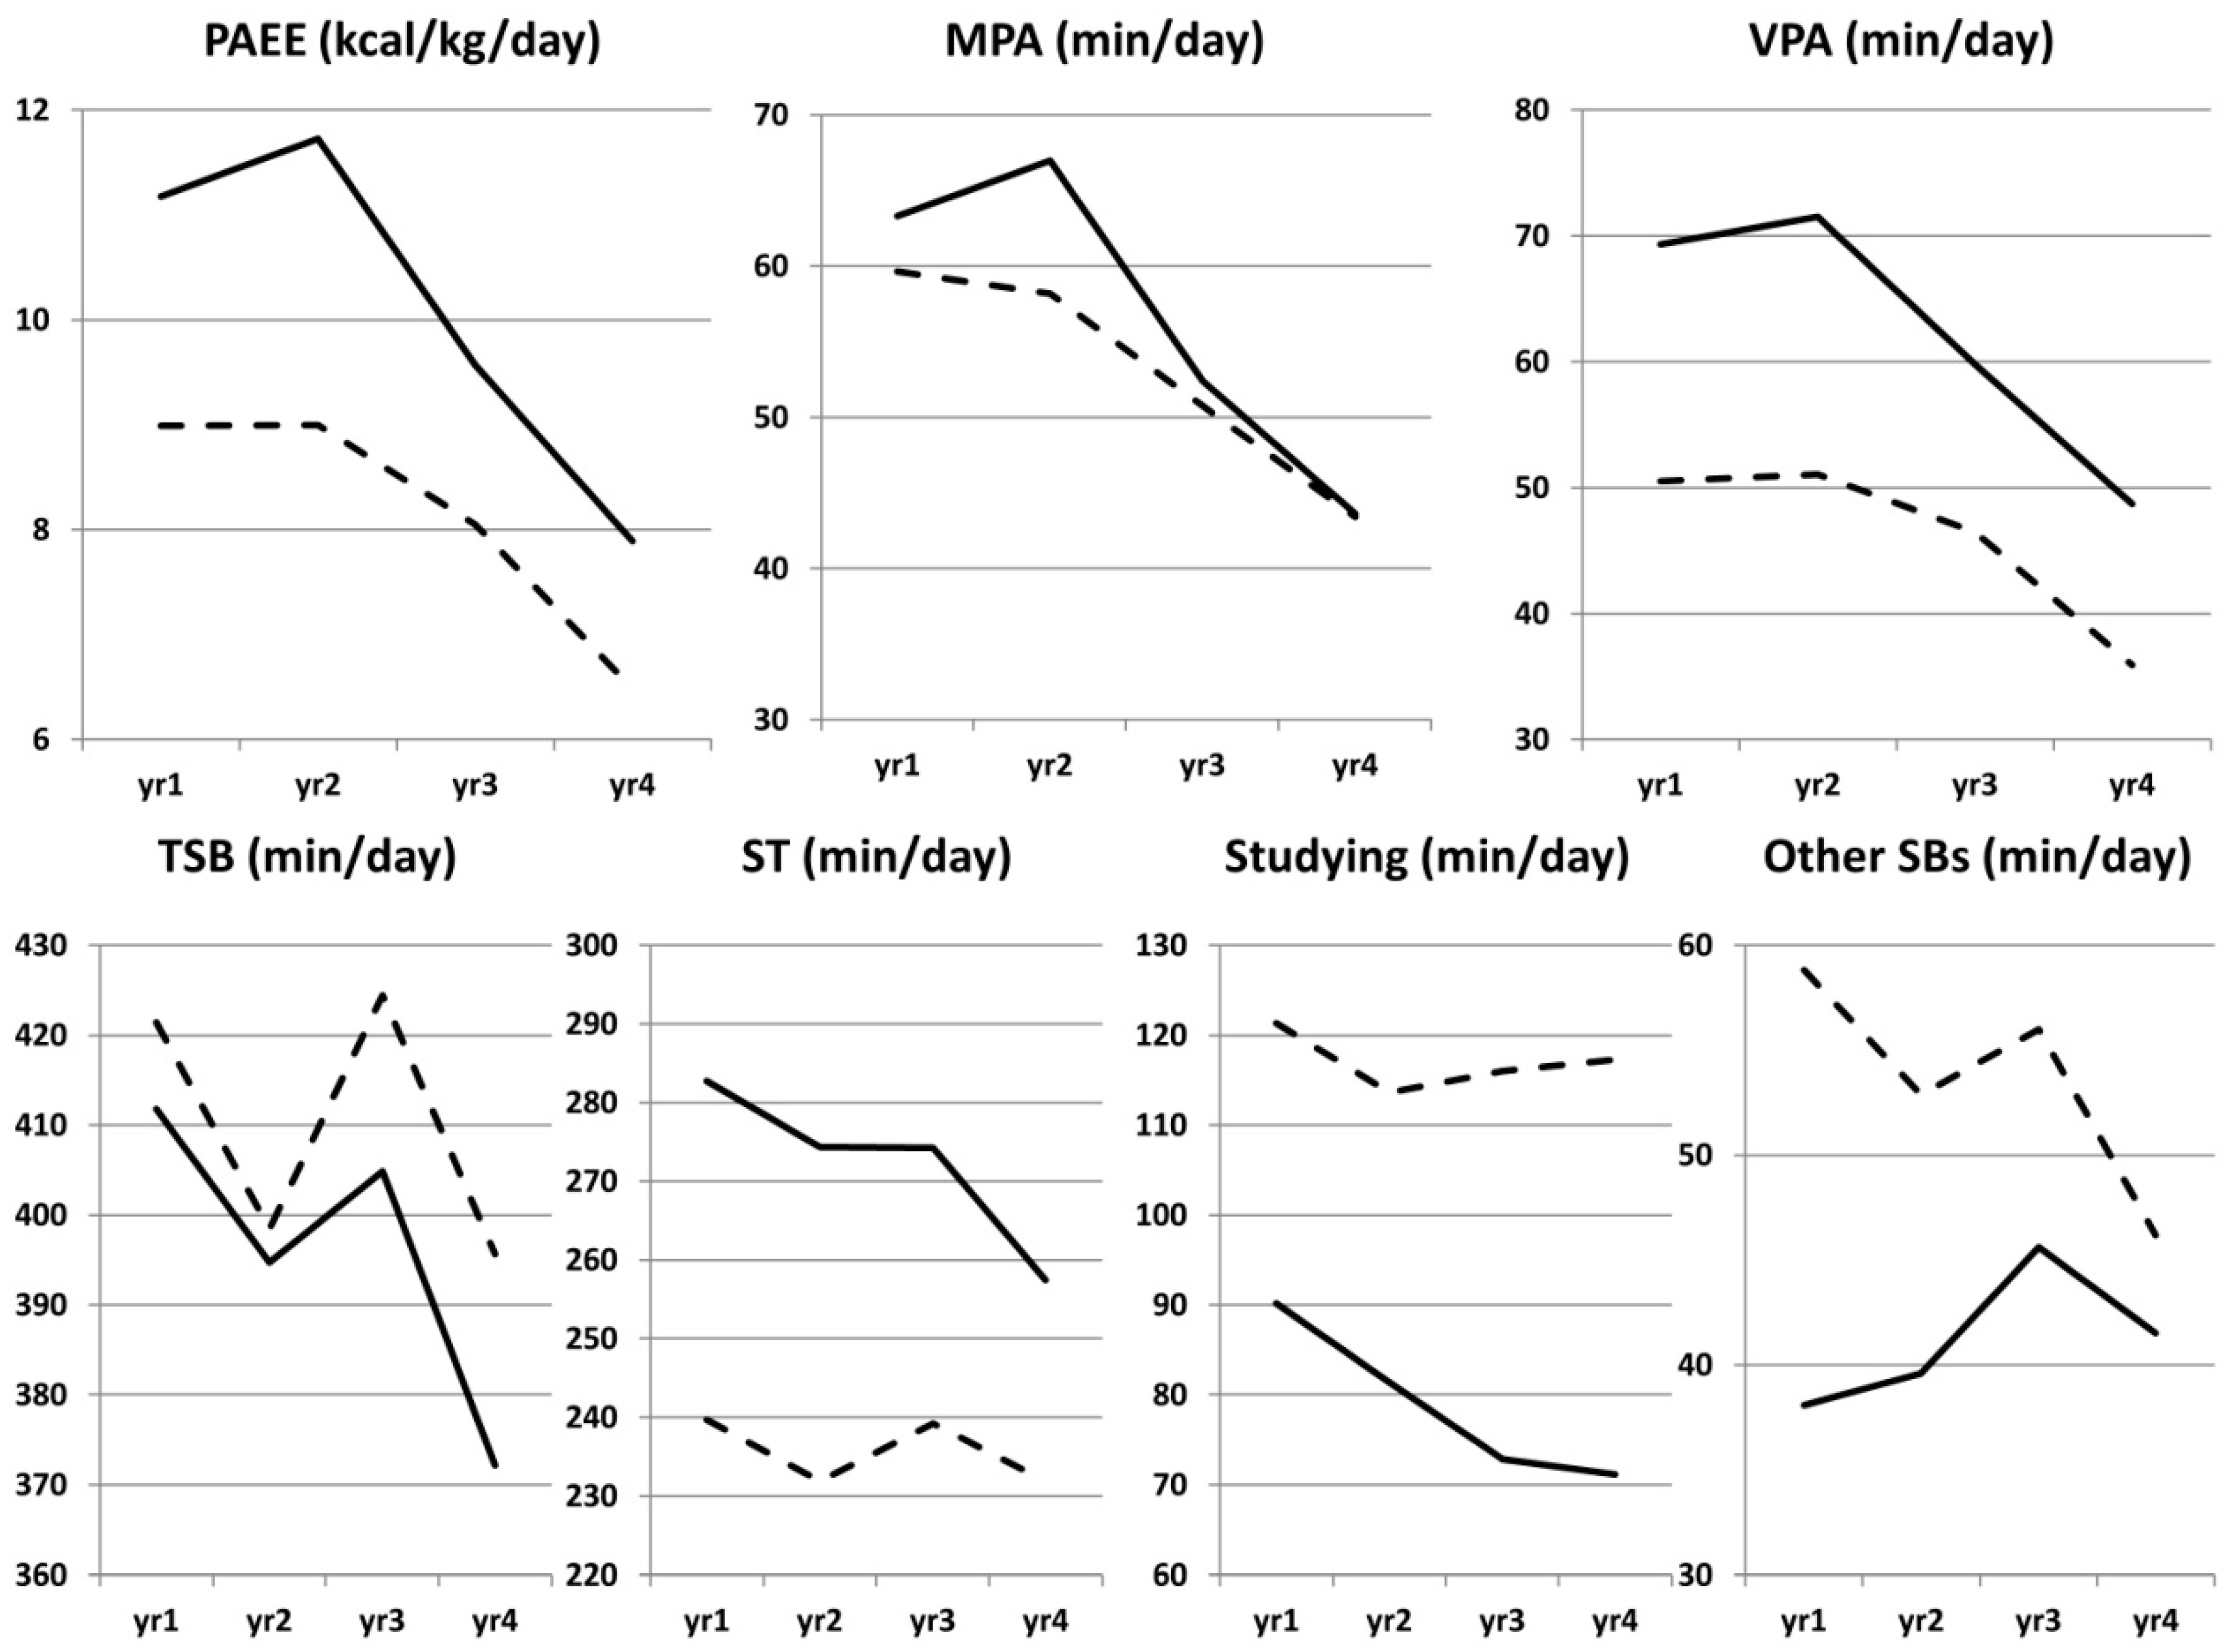
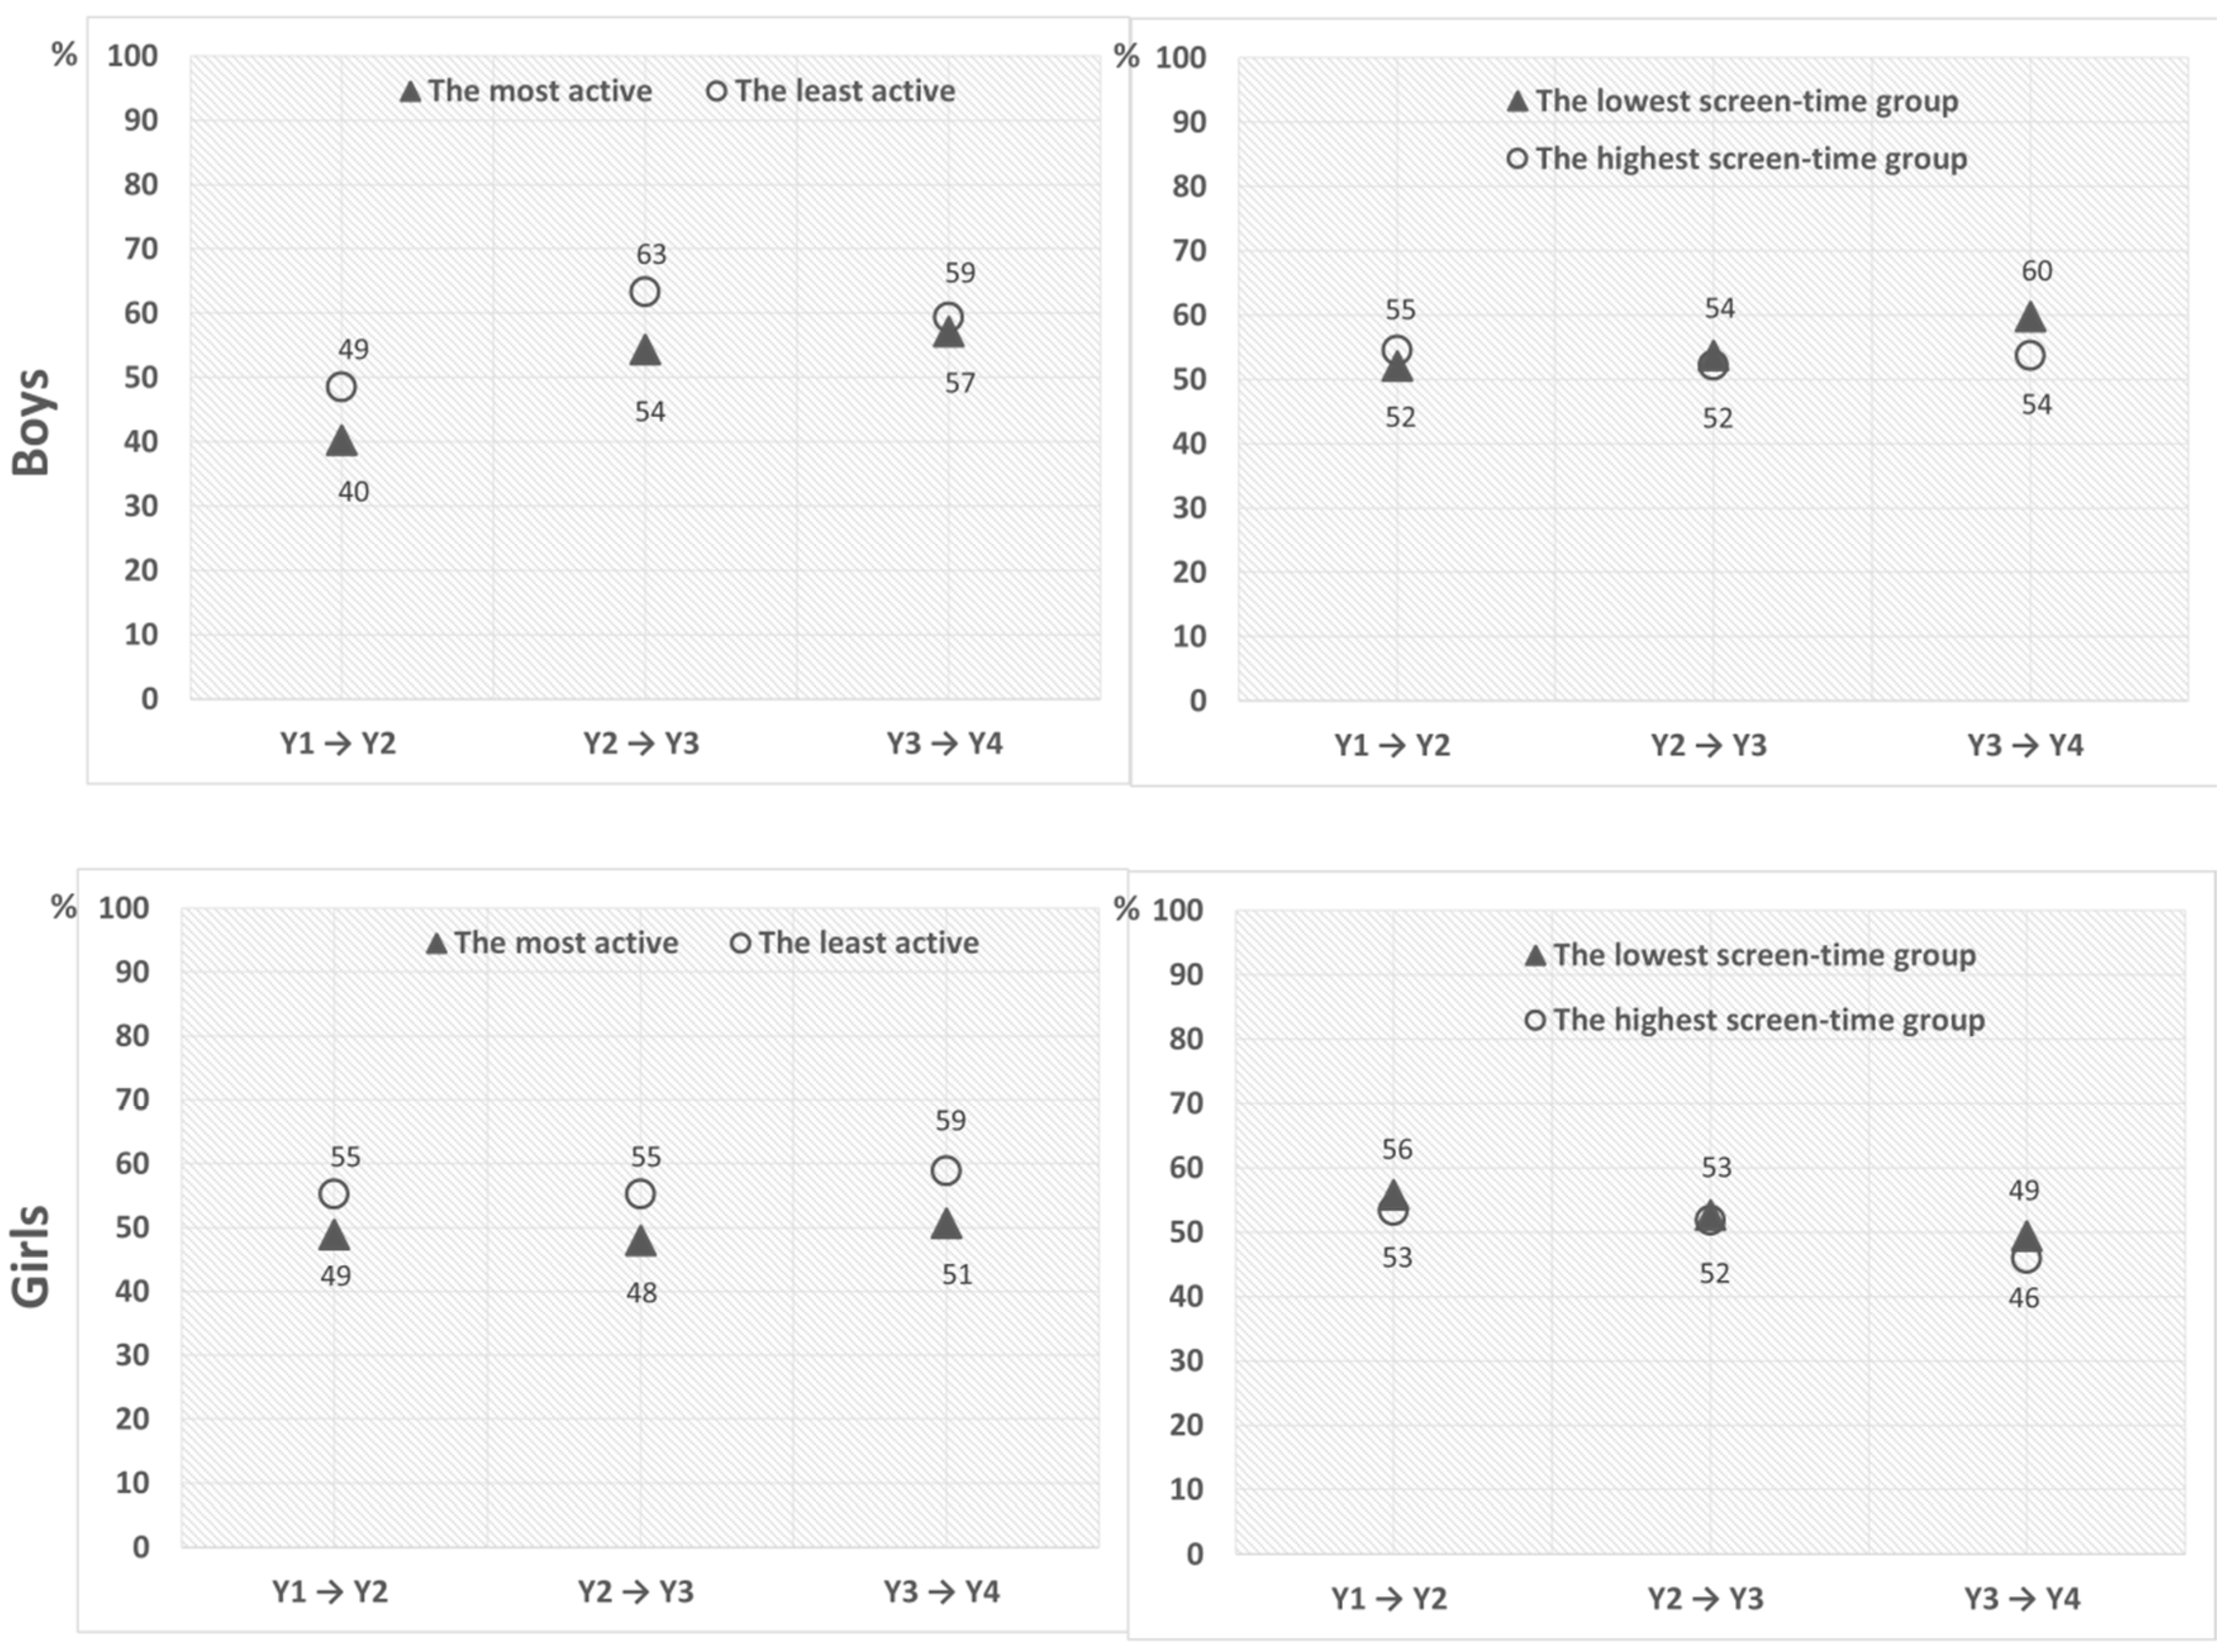
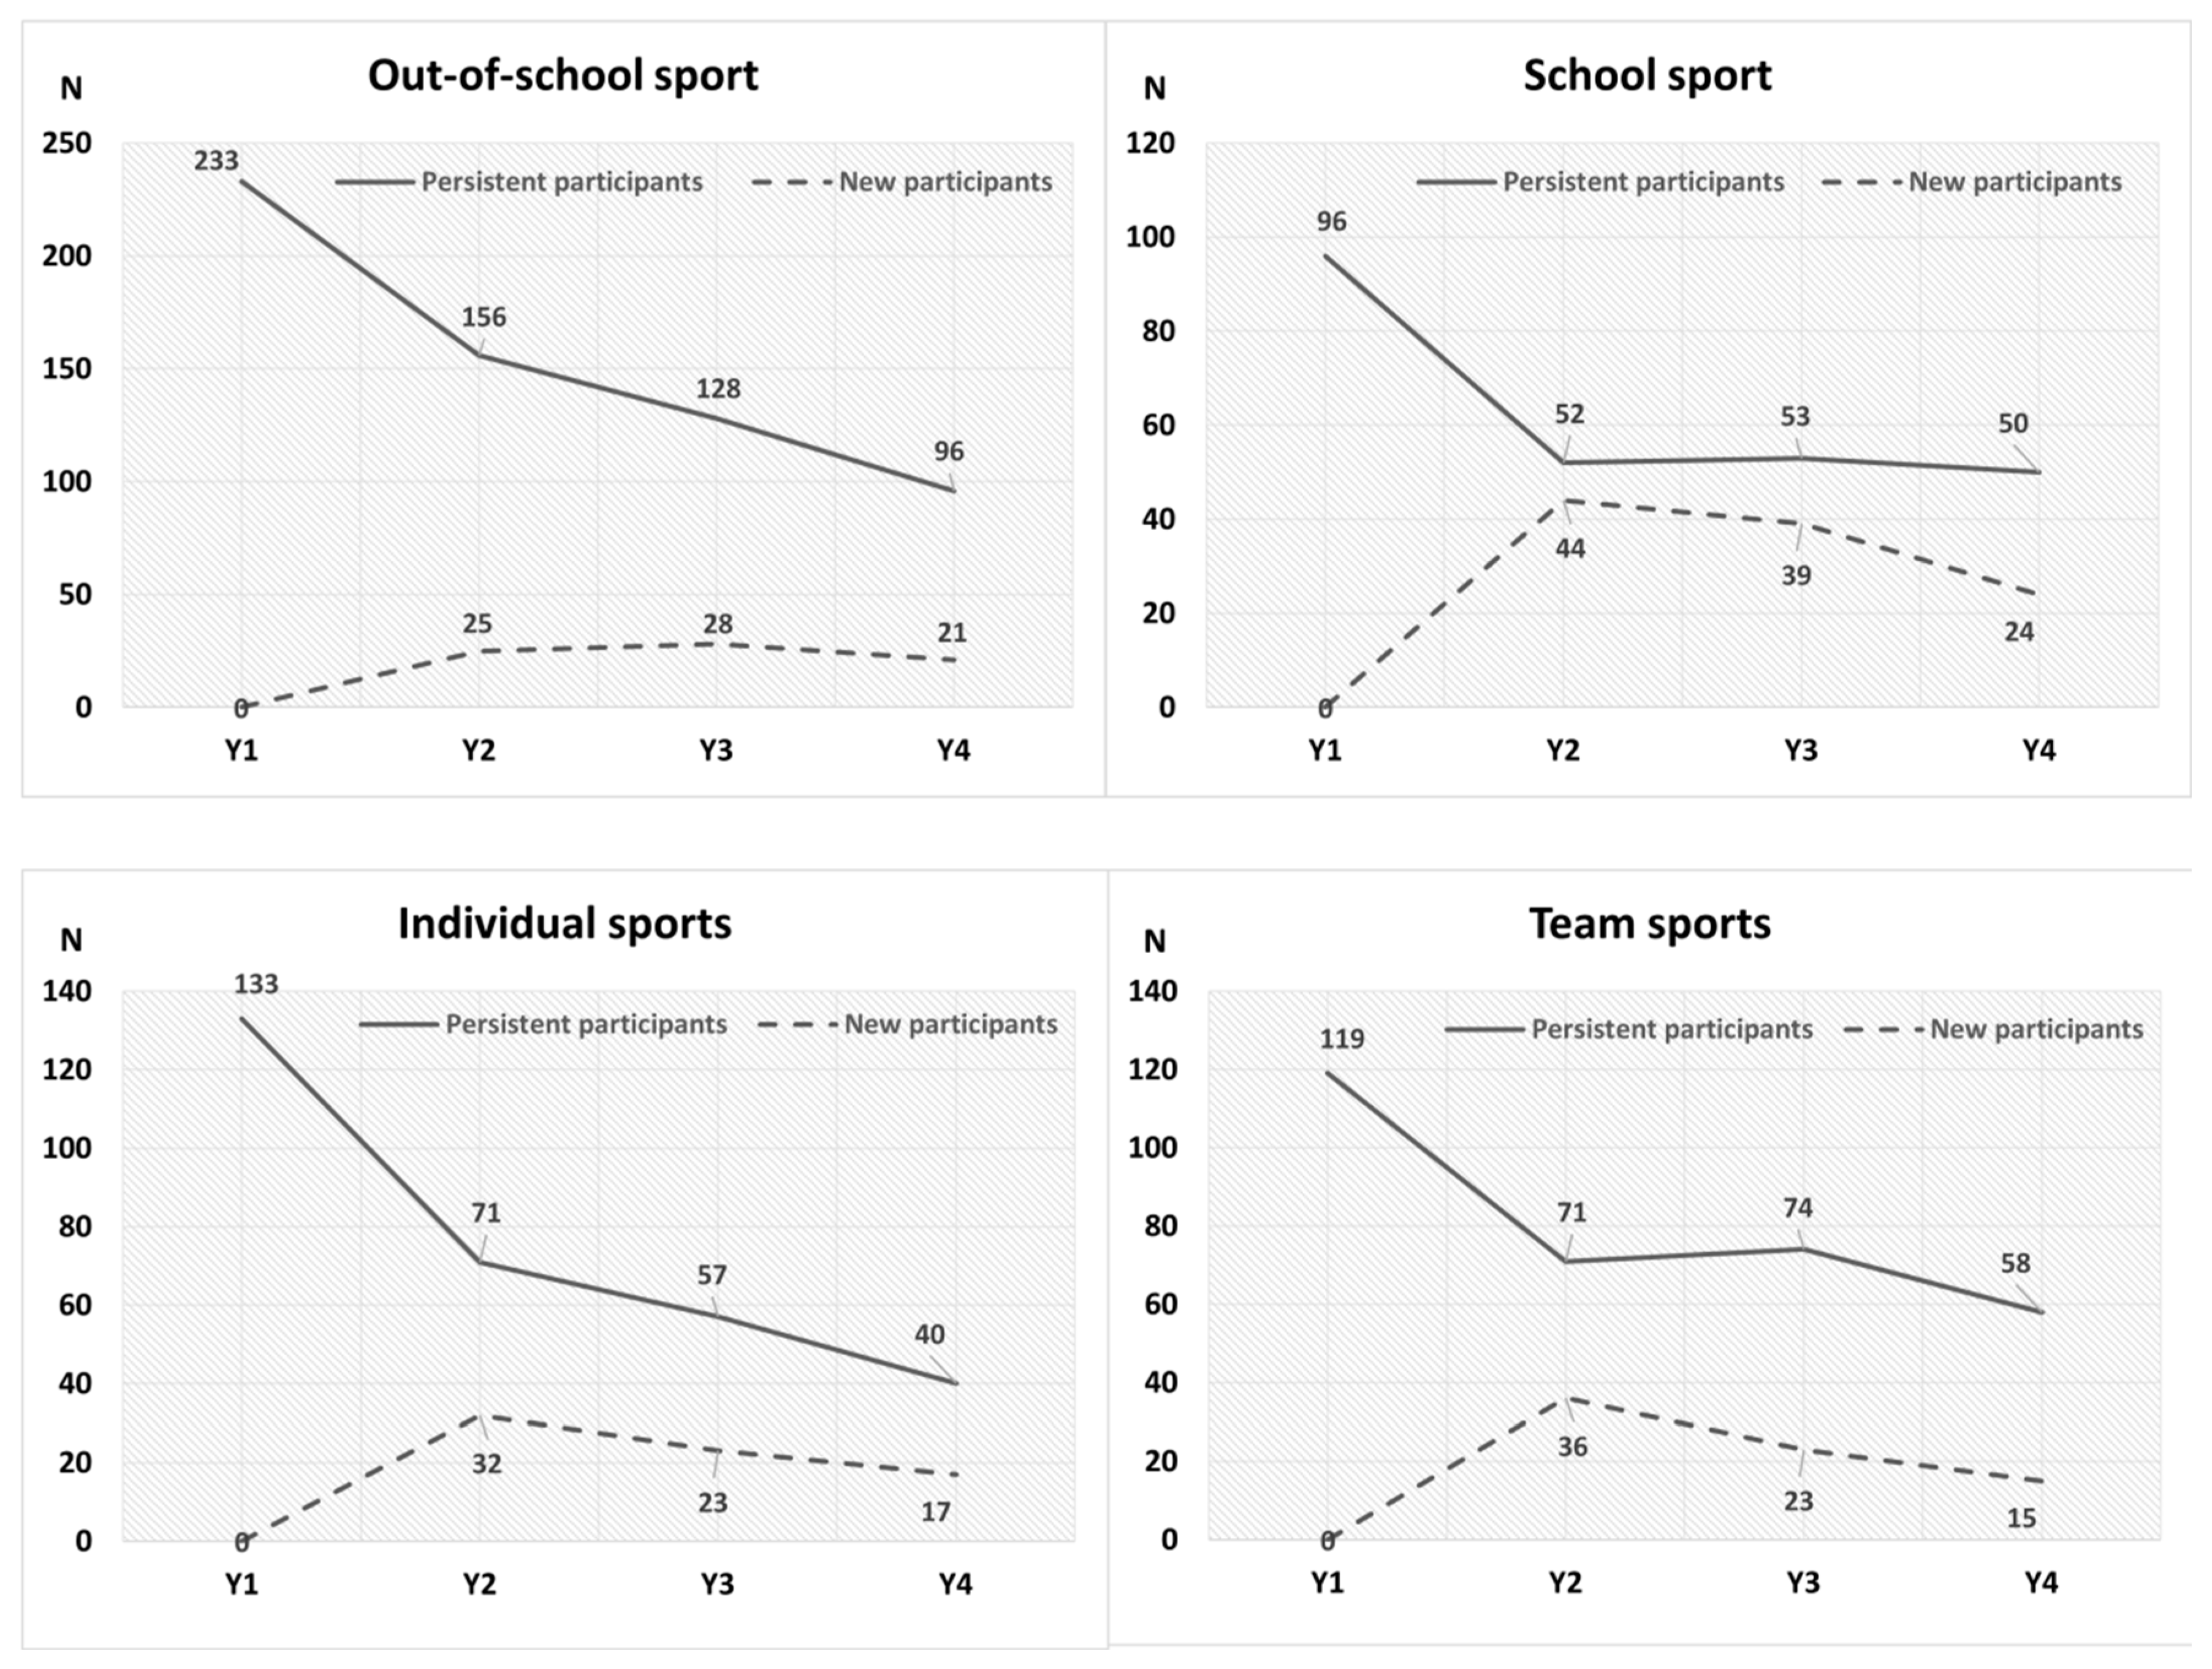
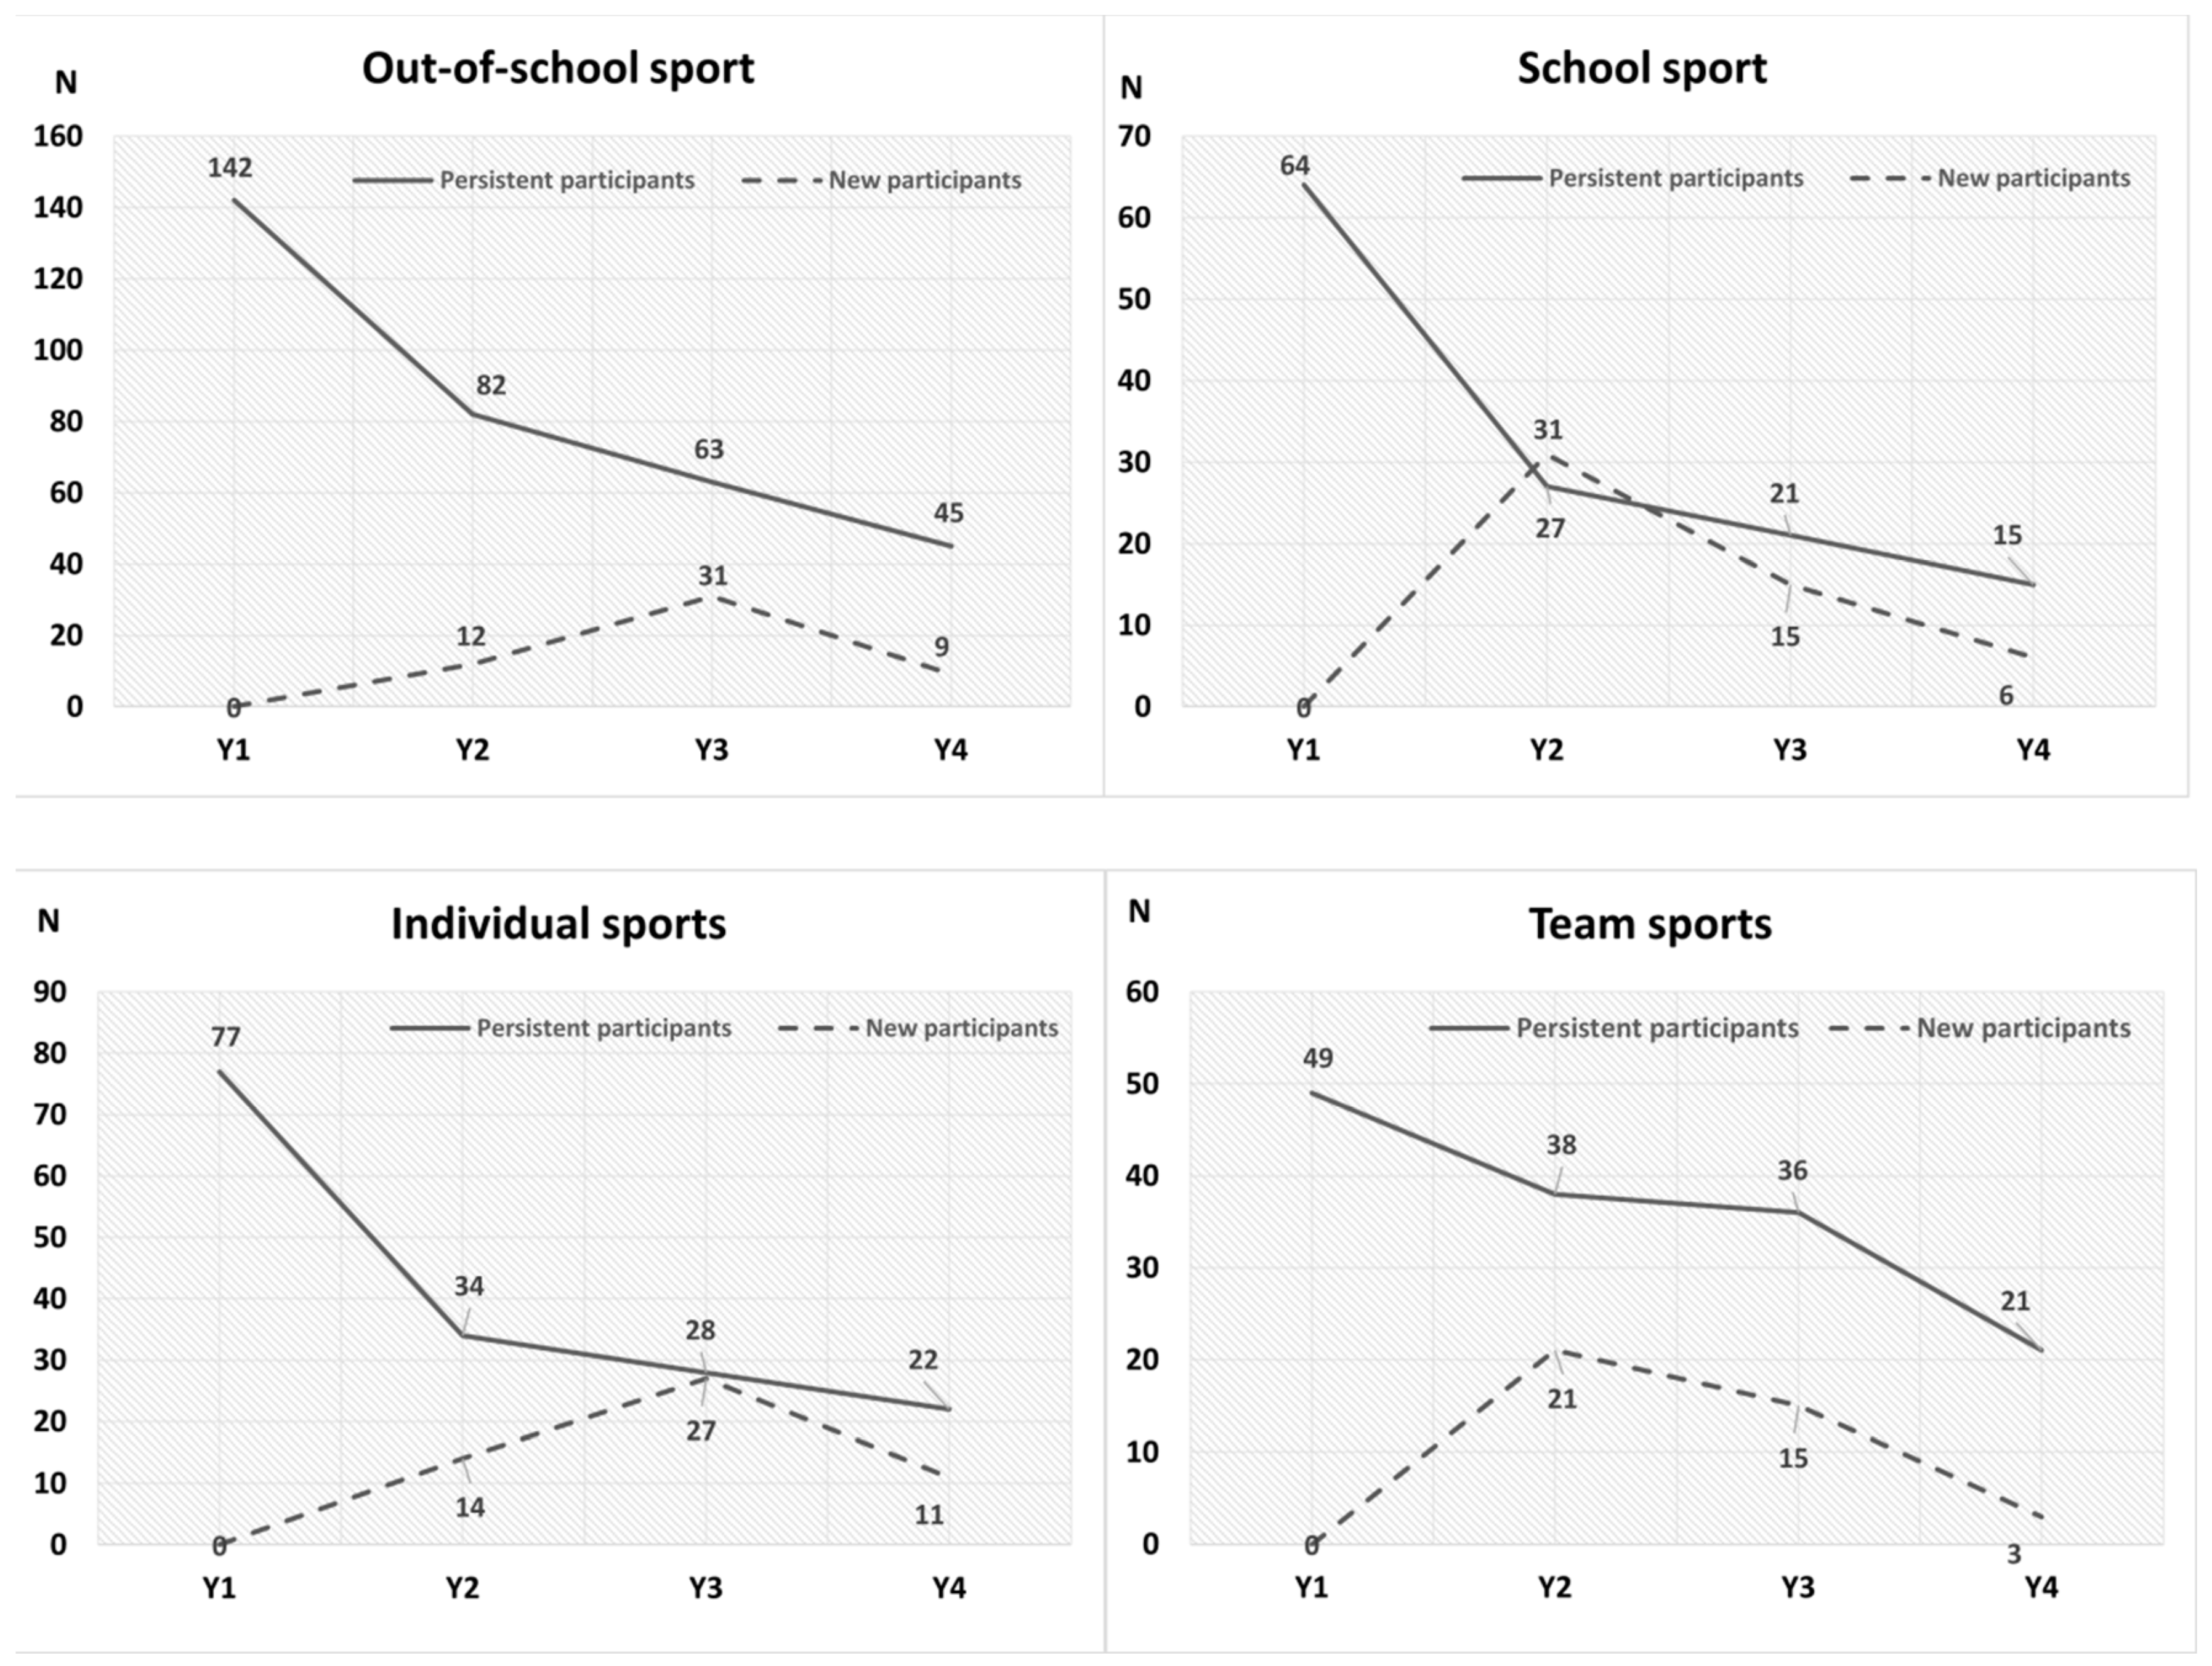
3. Results
4. Discussion
5. Conclusions
Author Contributions
Funding
Acknowledgments
Conflicts of Interest
Abbreviations
| BMI | Body-mass index |
| CRO-PALS | Croatian Physical Activity in Adolescence Longitudinal Study |
| GEE | Generalized estimating equations |
| MET | Metabolic equivalent |
| MPA | Moderate physical activity |
| MVPA | Moderate to vigorous physical activity |
| OR | Odd ratio |
| PA | Physical activity |
| PAEE | Physical activity energy expenditure |
| SB | Sedentary behavior |
| SHAPES | School Health Action, Planning and Evaluation System questionnaire |
| SP | Sport participation |
| SPSS | Statistical Package for Social Sciences |
| ST | Screen-time |
| S4SF | Sum of four skinfolds |
| TSB | Total sedentary behavior |
| TV | Television viewing |
| VPA | Vigorous physical activity |
| 95% CI | 95 percent confident interval |
References
- World Health Organization. Global Recommendations for Physical Activity and Health; WHO Press: Geneva, Switzerland, 2010. [Google Scholar]
- Katzmarzyk, P.T.; Church, T.S.; Craig, C.L.; Bouchard, C. Sitting time and mortality from all causes, cardiovascular disease, and cancer. Med. Sci. Sports Exerc. 2009, 41, 998–1005. [Google Scholar] [CrossRef] [PubMed]
- Janssen, I.; LeBlanc, A.G. Systematic review of the health benefits of physical activity and fitness in school-aged children and youth. Int. J. Behav. Nutr. Phys. Act. 2010, 7, 40. [Google Scholar] [CrossRef] [PubMed] [Green Version]
- Tremblay, M.S.; LeBlanc, A.G.; Kho, M.E.; Saunders, T.J.; Larouche, R.; Colley, R.C.; Goldfield, G.; Connor Gorber, S. Systematic review of sedentary behaviour and health indicators in school-aged children and youth. Int. J. Behav. Nutr. Phys. Act. 2011, 8, 98. [Google Scholar] [CrossRef] [PubMed] [Green Version]
- WHO. Global School-Based Student Health Survey. 2011. Available online: http://www.who.int/chp/gshs/en/ (accessed on 15 August 2018).
- Nelson, M.C.; Neumark-Stzainer, D.; Hannan, P.J.; Sirard, J.R.; Story, M. Longitudinal and secular trends in physical activity and sedentary behavior during adolescence. Pediatrics 2006, 118, 1627–1634. [Google Scholar] [CrossRef] [PubMed]
- Rauner, A.; Jekauc, D.; Mess, F.; Schmidt, S.; Woll, A. Tracking physical activity in different settings from late childhood to early adulthood in Germany: The MoMo longitudinal study. BMC Public Health 2015, 15, 391. [Google Scholar] [CrossRef] [PubMed]
- Janssen, X.; Mann, K.D.; Basterfield, L.; Parkinson, K.N.; Pearce, M.S.; Reilly, J.K.; Adamson, A.J.; Reilly, J.J. Development of sedentary behavior across childhood and adolescence: Longitudinal analysis of the Gateshead Millennium Study. Int. J. Behav. Nutr. Phys. Act. 2016, 13, 88. [Google Scholar] [CrossRef] [PubMed]
- Melkevik, O.; Torsheim, T.; Iannotti, R.J.; Wold, B. Is spending time in screen-based sedentary behaviors associated with less physical activity: A cross national investigation. Int. J. Behav. Nutr. Phys. Act. 2010, 7, 46. [Google Scholar] [CrossRef] [PubMed] [Green Version]
- Howley, E.T. Type of activity: Resistance, aerobic and leisure versus occupational physical activity. Med. Sci. Sports Exerc. 2001, 33, 364–369. [Google Scholar] [CrossRef]
- Eime, R.; Harvey, J.; Sawyer, N.; Craike, M.; Symons, C.; Polman, R.; Payne, W. Understanding the contexts of adolescent female participation in sport and physical activity. Res. Q. Exerc. Sport 2013, 84, 157–166. [Google Scholar] [CrossRef] [PubMed]
- Mäkelä, S.; Aaltonen, S.; Korhonen, T.; Rose, R.J.; Kaprio, J. Diversity of leisure-time sport activities in adolescence as a predictor of leisure-time physical activity in adulthood. Scand. J. Med. Sci. Sports 2017, 27, 1902–1912. [Google Scholar] [CrossRef] [PubMed]
- Zimmermann-Sloutskis, D.; Wanner, M.; Zimmermann, E.; Martin, B. Physical activity levels and determinants of change in young adults: A longitudinal panel study. Int. J. Behav. Nutr. Phys. Act. 2010, 7, 2–10. [Google Scholar] [CrossRef] [PubMed] [Green Version]
- Department of Health and Ageing. Australian National Children’s Nutrition and Physical Activity Survey: Main Findings, 2008; Department of Health and Ageing: Canberra, Australia, 2007.
- Eime, R.M.; Casey, M.M.; Harvey, J.T.; Sawyer, N.A.; Symons, C.M.; Payne, W.R. Socioecological factors potentially associated with participation in physical activity and sport: A longitudinal study of adolescent girls. J. Sci. Med. Sport 2015, 18, 684–690. [Google Scholar] [CrossRef] [PubMed]
- Eime, R.; Payne, W.; Casey, M.; Harvey, J. Transition in participation in sport and unstructured physical activity for rural living adolescent girls. Health Educ. Res. 2010, 25, 282–293. [Google Scholar] [CrossRef] [PubMed]
- Malina, R.M. Tracking physical activity across the life span. Res. Q. Exerc. Sport 1996, 67, 48–57. [Google Scholar] [CrossRef]
- Foulkes, M.A.; Davis, C.E. An index of tracking for longitudinal data. Biometrics 1981, 37, 439–446. [Google Scholar] [CrossRef]
- Telama, R. Tracking of physical activity from childhood to adulthood: A review. Obes. Facts 2009, 2, 187–195. [Google Scholar] [CrossRef] [PubMed]
- Biddle, S.J.H.; Pearson, N.; Ross, G.M.; Braithwaite, R. Tracking of sedentary behaviours of young people: A systematic review. Prev. Med. 2010, 51, 345–351. [Google Scholar] [CrossRef] [PubMed] [Green Version]
- Trang, N.H.; Hong, T.K.; Van Der Ploeg, H.P.; Hardy, L.L.; Kelly, P.J.; Dibley, M.J. Longitudinal sedentary behavior changes in adolescents in Ho Chi Minh City. Am. J. Prev. Med. 2013, 44, 223–230. [Google Scholar] [CrossRef] [PubMed]
- Štefan, L.; Sorić, M.; Devrnja, A.; Podnar, H.; Mišigoj-Duraković, M. Is school type associated with objectively measured physical activity in 15-year-olds? Int. J. Environ. Res. Public Health 2017, 14, 1417. [Google Scholar] [CrossRef] [PubMed]
- Wong, S.L.; Leatherdale, S.T.; Manske, S.R. Reliability and validity of a school-based physical activity questionnaire. Med. Sci. Sports Exerc. 2006, 38, 1593–1600. [Google Scholar] [CrossRef] [PubMed]
- Twisk, J.W.R. Applied Longitudinal Data Analysis for Epidemiology. A Practical Guide; Cambridge University Press: New York, NY, USA; Cambridge, UK, 2003. [Google Scholar]
- Aarnio, M.; Winter, P.; Peltonen, J.; Kujala, U.M.; Kaprio, J. Stability of leisure-time physical activity during adolescence—A longitudinal study among 16-, 17- and 18-year-old Finnish youth. Scan. J. Med. Sci. Sports 2002, 12, 179–185. [Google Scholar] [CrossRef]
- Raustorp, A.; Svenson, K.; Perlinger, T. Tracking of pedometer-determined physical activity: A 5-year follow-up study of adolescents in Sweden. Pediatr. Exerc. Sci. 2007, 19, 228–238. [Google Scholar] [CrossRef] [PubMed]
- Baggett, C.D.; Stevens, J.; McMurray, R.G.; Evenson, K.R.; Murray, D.M.; Catellier, D.J.; He, K. Tracking of physical activity and inactivity in middle school girls. Med. Sci. Sports Exerc. 2008, 40, 1916–1922. [Google Scholar] [CrossRef] [PubMed]
- Berkey, C.S.; Rockett, H.R.H.; Gillman, M.W.; Colditz, G.A. One-year changes inactivity and in inactivity among 10- to 15-year-old boys and girls: Relationship to change in body mass index. Pediatrics 2003, 111, 836–843. [Google Scholar] [CrossRef] [PubMed]
- Motl, R.W.; Mcauley, E.; Birnbaum, A.S.; Lytle, L.A. Naturally occurring changes in time spent watching television are inversely related to frequency of physical activity during early adolescence. J. Adolesc. 2006, 29, 19–32. [Google Scholar] [CrossRef] [PubMed]
- Morton, K.L.; Atkin, A.J.; Corder, K.; Suhrcke, M.; van Sluijs, E.M. The school environment and adolescent physical activity and sedentary behaviour: A mixed-studies systematic review. Obes. Rev. 2016, 17, 142–158. [Google Scholar] [CrossRef] [PubMed]
- Hynynen, S.T.; van Stralen, M.M.; Sniehotta, F.F.; Araújo-Soares, V.; Hardeman, W.; Chinapaw, M.J.M.; Vasankari, T.; Hankonen, N. A systematic review of school-based interventions targeting physical activity and sedentary behaviour among older adolescents. Int. Rev. Sport Exerc. Psychol. 2016, 9, 22–44. [Google Scholar] [CrossRef] [PubMed]
- Richards, R.; Williams, S.; Poulton, R.; Reeder, A.L. Tracking club sport participation from childhood to early adulthood. Res. Q. Exerc. Sport 2007, 78, 413–419. [Google Scholar] [CrossRef] [PubMed]
- Marques, A.; Martins, J.; Santos, F.; Sarmento, H.; Carreiro da Costa, F. Correlates of school sport participation: A cross-sectional study in urban Portuguese students. Sci. Sports 2014, 29, 31–38. [Google Scholar] [CrossRef]
- Tammelin, T.; Näyhä, S.; Hills, A.P.; Järvelin, M.R. Adolescent participation in sports and adult physical activity. Am. J. Prev. Med. 2003, 24, 22–28. [Google Scholar] [CrossRef]
- Gillison, F.B.; Standage, M.; Skevington, S.M. Relationship among adolescents’ weight perceptions, exercise goals, exercise motivation, quality of life and leisure-time exercise behaviour: A self-determination theory approach. Health Educ. Res. 2006, 21, 836–847. [Google Scholar] [CrossRef] [PubMed]
- Engelen, P.; Bundy, A.C.; Naughton, G.; Simpson, J.M.; Bauman, A.; Ragen, J.; Baur, L.; Wyver, S.; Tranter, P.; Niehues, A.; et al. Increasing physical activity in young primary school children—It’s child’s play: A cluster randomized controlled trial. Prev. Med. 2013, 56, 319–325. [Google Scholar] [CrossRef] [PubMed]
- Powell, E.; Woodfield, L.A.; Nevill, A.M. Increasing physical activity levels in primary school physical education: The SHARP principles models. Prev. Med. Rep. 2016, 3, 7–13. [Google Scholar] [CrossRef] [PubMed]


| Basic Descriptive Variables | Boys (N = 429) | Girls (N = 415) |
|---|---|---|
| Age (years) | 15.7 (0.4) | 15.6 (0.4) |
| Biological age (years from PHV) | 1.9 (0.7) | 2.0 (0.4) |
| Body-mass index (kg/m2) | 21.9 (3.6) | 21.4 (3.1) |
| Sum of 4 skinfolds * (mm) | 37.3 (18.9) | 50.0 (16.2) |
| PAEE (kcal/kg/day) | 11.2 (7.0) | 9.0 (6.1) |
| Screen time (min/week) | 282.8 (165.3) | 240.7 (147.4) |
| Study Variables | Boys (N = 429) | Girls (N = 415) | ||||
|---|---|---|---|---|---|---|
| Tracking Coefficient | 95% CI | p | Tracking Coefficient | 95% CI | p | |
| Physical activity | ||||||
| VPA | 0.61 | 0.54 to 0.67 | <0.001 | 0.59 | 0.52 to 0.66 | <0.001 |
| MPA | 0.49 | 0.43 to 0.56 | <0.001 | 0.53 | 0.45 to 0.60 | <0.001 |
| PAEE | 0.57 | 0.51 to 0.63 | <0.001 | 0.59 | 0.52 to 0.67 | <0.001 |
| Sedentary behaviors | ||||||
| TSB | 0.63 | 0.57 to 0.69 | <0.001 | 0.60 | 0.53 to 0.66 | <0.001 |
| ST | 0.60 | 0.54 to 0.66 | <0.001 | 0.64 | 0.58 to 0.70 | <0.001 |
| Studying | 0.66 | 0.61 to 0.72 | <0.001 | 0.70 | 0.65 to 0.76 | <0.001 |
| Other SB | 0.72 | 0.64 to 0.81 | <0.001 | 0.63 | 0.55 to 0.71 | <0.001 |
| Boys | Girls | |||||
|---|---|---|---|---|---|---|
| Y1 → Y2 | Y2 → Y3 | Y3 → Y4 | Y1 →Y2 | Y2 → Y3 | Y3 → Y4 | |
| Physical activity | % | % | % | % | % | % |
| The lowest quartile | 40 | 54 | 57 | 55 | 55 | 59 |
| The highest quartile | 49 | 63 | 59 | 49 | 48 | 51 |
| Screen time | ||||||
| The lowest quartile | 54 | 52 | 53 | 56 | 53 | 49 |
| The highest quartile | 51 | 53 | 59 | 52 | 51 | 46 |
| Study Variables | Boys | Girls | ||
|---|---|---|---|---|
| Persistent Participants | New Participants | Persistent Participants | New Participants | |
| N | N | N | N | |
| Out-of-school sport | ||||
| Baseline | 233 | / | 142 | / |
| Year 2 | 156 | 25 | 82 | 12 |
| Year 3 | 128 | 28 | 63 | 31 |
| Year 4 | 96 | 21 | 45 | 9 |
| School sport | ||||
| Baseline | 96 | / | 64 | / |
| Year 2 | 52 | 44 | 27 | 31 |
| Year 3 | 53 | 39 | 21 | 15 |
| Year 4 | 50 | 24 | 15 | 6 |
| Individual sports | ||||
| Baseline | 133 | / | 77 | / |
| Year 2 | 71 | 32 | 34 | 14 |
| Year 3 | 57 | 23 | 28 | 27 |
| Year 4 | 40 | 17 | 22 | 11 |
| Team sports | ||||
| Baseline | 119 | / | 49 | / |
| Year 2 | 71 | 36 | 38 | 21 |
| Year 3 | 74 | 23 | 36 | 15 |
| Year 4 | 58 | 15 | 21 | 3 |
© 2018 by the authors. Licensee MDPI, Basel, Switzerland. This article is an open access article distributed under the terms and conditions of the Creative Commons Attribution (CC BY) license (http://creativecommons.org/licenses/by/4.0/).
Share and Cite
Štefan, L.; Mišigoj-Duraković, M.; Devrnja, A.; Podnar, H.; Petrić, V.; Sorić, M. Tracking of Physical Activity, Sport Participation, and Sedentary Behaviors over Four Years of High School. Sustainability 2018, 10, 3104. https://0-doi-org.brum.beds.ac.uk/10.3390/su10093104
Štefan L, Mišigoj-Duraković M, Devrnja A, Podnar H, Petrić V, Sorić M. Tracking of Physical Activity, Sport Participation, and Sedentary Behaviors over Four Years of High School. Sustainability. 2018; 10(9):3104. https://0-doi-org.brum.beds.ac.uk/10.3390/su10093104
Chicago/Turabian StyleŠtefan, Lovro, Marjeta Mišigoj-Duraković, Antonela Devrnja, Hrvoje Podnar, Vilko Petrić, and Maroje Sorić. 2018. "Tracking of Physical Activity, Sport Participation, and Sedentary Behaviors over Four Years of High School" Sustainability 10, no. 9: 3104. https://0-doi-org.brum.beds.ac.uk/10.3390/su10093104