Article

A Quantitative Assessment of Comprehensive Ecological Risk for a Loess Erosion Gully: A Case Study of Dujiashi Gully, Northern Shaanxi Province, China

1
Shaanxi Key Laboratory of Earth Surface System and Environmental Carrying Capacity, Northwest University, Xi’an 710127, China
2
College of Urban and Environmental Science, Northwest University, Xi’an 710127, China
*
Author to whom correspondence should be addressed.
Sustainability 2018, 10(9), 3239; https://0-doi-org.brum.beds.ac.uk/10.3390/su10093239
Submission received: 11 July 2018 / Revised: 7 September 2018 / Accepted: 8 September 2018 / Published: 11 September 2018

Abstract

:
As a tool that can effectively support ecosystem management, ecological risk assessment is closely related to the sustainable development of ecosystems and human well-being and has become an active area of research in ecology, geography and other disciplines. Taking Dujiashi Gully for the study of gully loess erosion, a comprehensive risk assessment system for identifying risk probability, sensitivity and impairment was established. The spatial distribution of comprehensive ecological risk was analyzed, the ecological risk management categories were simultaneously delineated based on the risk dominant factor and the risk management strategies were formulated in loess regions. The results were as follows: (1) the spatial differences in comprehensive ecological risk were significantly different in the research area. The regions with extremely high and high risk were mainly located in gully areas and secondary erosion gullies, which are in 28.02% of study area. The extremely low-risk areas covered 1/3 of the study area and were mainly distributed to the northwest and south of the study area, where hills are widely spaced. (2) The combined analysis of ecological risk and terrain found that the elevation decreased first and then rose but the comprehensive ecological risk increased first and then decreased from north to south. Comprehensive ecological risk and terrain generally showed an inverse relationship. (3) The study area was divided into four types of risk management categories. Risk monitoring zones, habitat recovery zones, monitoring and recovery zones and natural regulation zones encompass 14.84%, 12.44%, 26.47% and 46.25% of the study area, respectively. According to four types of risk management categories, different risk reduction measures were designed to improve regional sustainable development capacity. Risk identification and risk management categories based on comprehensive ecological risk model can design a sustainable development path for social ecosystem and local farmers and provide a method for sustainable development for similar gully landscapes.

1. Introduction

The Earth has entered a new geological time period, known as the “Anthropocene” [1]. During this time interval, changes in the Earth’s surface system have been profoundly affected by human social-economic interactions [2]. Global landscape patterns and ecosystems have changed under the background of land use change, which has resulted in many ecological risks caused by natural hazards and human activities. The scientific understanding and evaluation of these ecological risks have become prominent in physical geography and macroecology research to address the comprehensive management of social-ecological systems [3].
Ecological risk refers to a possibility or probability of some negative effects under certain circumstances that impart some specific environmental pressures [4,5]. Accurately identifying and analyzing ecological risk based on the coupled perspective of humans and the natural environment is the first requirement for the effective avoidance, active adaptation and comprehensive management of regional ecological risk [6]. Ecological risk assessment provides a theoretical basis for ecological construction and environmental restoration by analyzing the probability of damage to an ecosystem under multiple risk sources and clarifies the ability to mitigate and absorb risks [7,8]. Ecological risk assessment initially assessed the impact of chemical pollutants on human health and then the risk receptors gradually transited from human health to regional natural environment [9]. Mirzabeygi et al. measured the heavy metal concentration in drinking water and assessed the possibility of cancer risk in local people [10]. Potential ecological risk assessment was carried out through heavy metal monitoring in southern Italian river [11]. However, more and more scholars realize that risk assessment based on single risk source is difficult to carry out risk management on complex natural environment system [9]. With the increase of risk factors, ecological risk assessments have been transformed from representing a single risk source to a comprehensive representation of multiple risk sources [12] and the risk receptors have gradually expanded to capture complex regional social-economic-natural ecosystems [13]. In the classical evaluation framework of “probability-impairment” [14], evaluation methods using regional ecological risk assessment [15,16,17,18,19,20] and landscape ecological risk assessment [21,22,23,24] have been widely used in ecological risk assessment. The evaluation method of regional ecological risk assessment pays great attention to the probability of multiple risk sources and ecological impairment and focuses on the spatial difference of single and comprehensive ecological risk factors [6]. Zhang et al. drew attention to potential ecological risks caused by the intensification of flooding and reduced ecosystem services [12]. Risk assessment was completed based on risk probability, risk range and severity [16]. The landscape ecological risk assessment focuses more on the spatio-temporal heterogeneity of ecological risk and its scale effects from the perspective of the coupling of spatial patterns and ecological processes [23]. Landscape loss index was constructed by using the degree of interference and vulnerability to analyze the spatio-temporal differentiation of risk [23,24]. Zhang et al. made risk predictions based on land use and CA-Markov [25]. At the same time, the representation impairment using natural indicators and socio-economic indicators is also concerned by Li et al. and Yu et al. [18,26]. In the above studies, the selection of risk source indicators based on the actual situation of the study area, the characterization of natural losses based on interference and vulnerability and the characterization of risk losses based on comprehensive natural indicators and socio-economic indicators have been widely recognized [13,18,20].
Semi-arid, ecologically fragile areas, especially in hilly loess hilly regions, exhibit strong responses to global changes [6]. Erosional gullies are the typical landform units. The natural vulnerability of these landscapes is impacted by soil erosion, and frequent agricultural cultivation and unreasonable township construction makes the gully ecosystem more fragile [27], both of which are manifested in the increase of ecological risk and thus affect the sustainable development of regional socio-ecological systems. The landslide caused cave dwelling collapse, causing the migration of farmers. The continuing emigration of the population makes the socio-economic sustainability difficult. The increase of saline land in the dam area due to the flooding, resulting in reduced food production and farmers’ income. Because of the natural hazards, farmers are forced to work poor soils, which will lead to further increase of ecological risks and make the social ecosystem into an unsustainable path. On the other hand, driven by economic interests, young people go out to work to alleviate the human disturbance of regional ecosystem, which is conducive to the reduction of ecological risks. The environmental problems of gully erosion are mainly caused by agricultural cultivation and ecological environment, which together affect social ecosystems [28]. Therefore, risk assessment for these landscapes should be based on specific social, economic and natural environments. The current risk assessment is not much and existing studies mainly focus on drought and land use risk [29], geological disasters and soil erosion [30]. The impact of ecological risk on the socio-ecological complex system is of limited concern and the improvement of the ecological risk assessment system with the socio-economic factors as risk receptors is scarce in the loess hilly gully region.
Ecological risk assessment of erosion gully needs to analyze multi-source risks from the perspective of overall regional sustainability. In this study, we use the ecological risk model to quantify the ecological risk of Dujiashi Gully to answer the following questions:
(1)
How can an evaluation system that fully reflects regional ecological risks be constructed?
(2)
How can risk management categories based on the results of risk assessment be conducted to promote regional sustainability?
Specifically, the goals of this study are to (1) establish an ecological risk indicator system for risk probability-sensitivity-impairment, to enrich the risk assessment theory; (2) analyze the spatial differentiation of ecological risk in the research area; (3) design risk management categories and differential risk management to promote the sustainability of this social ecosystem.

2. Materials and Methods
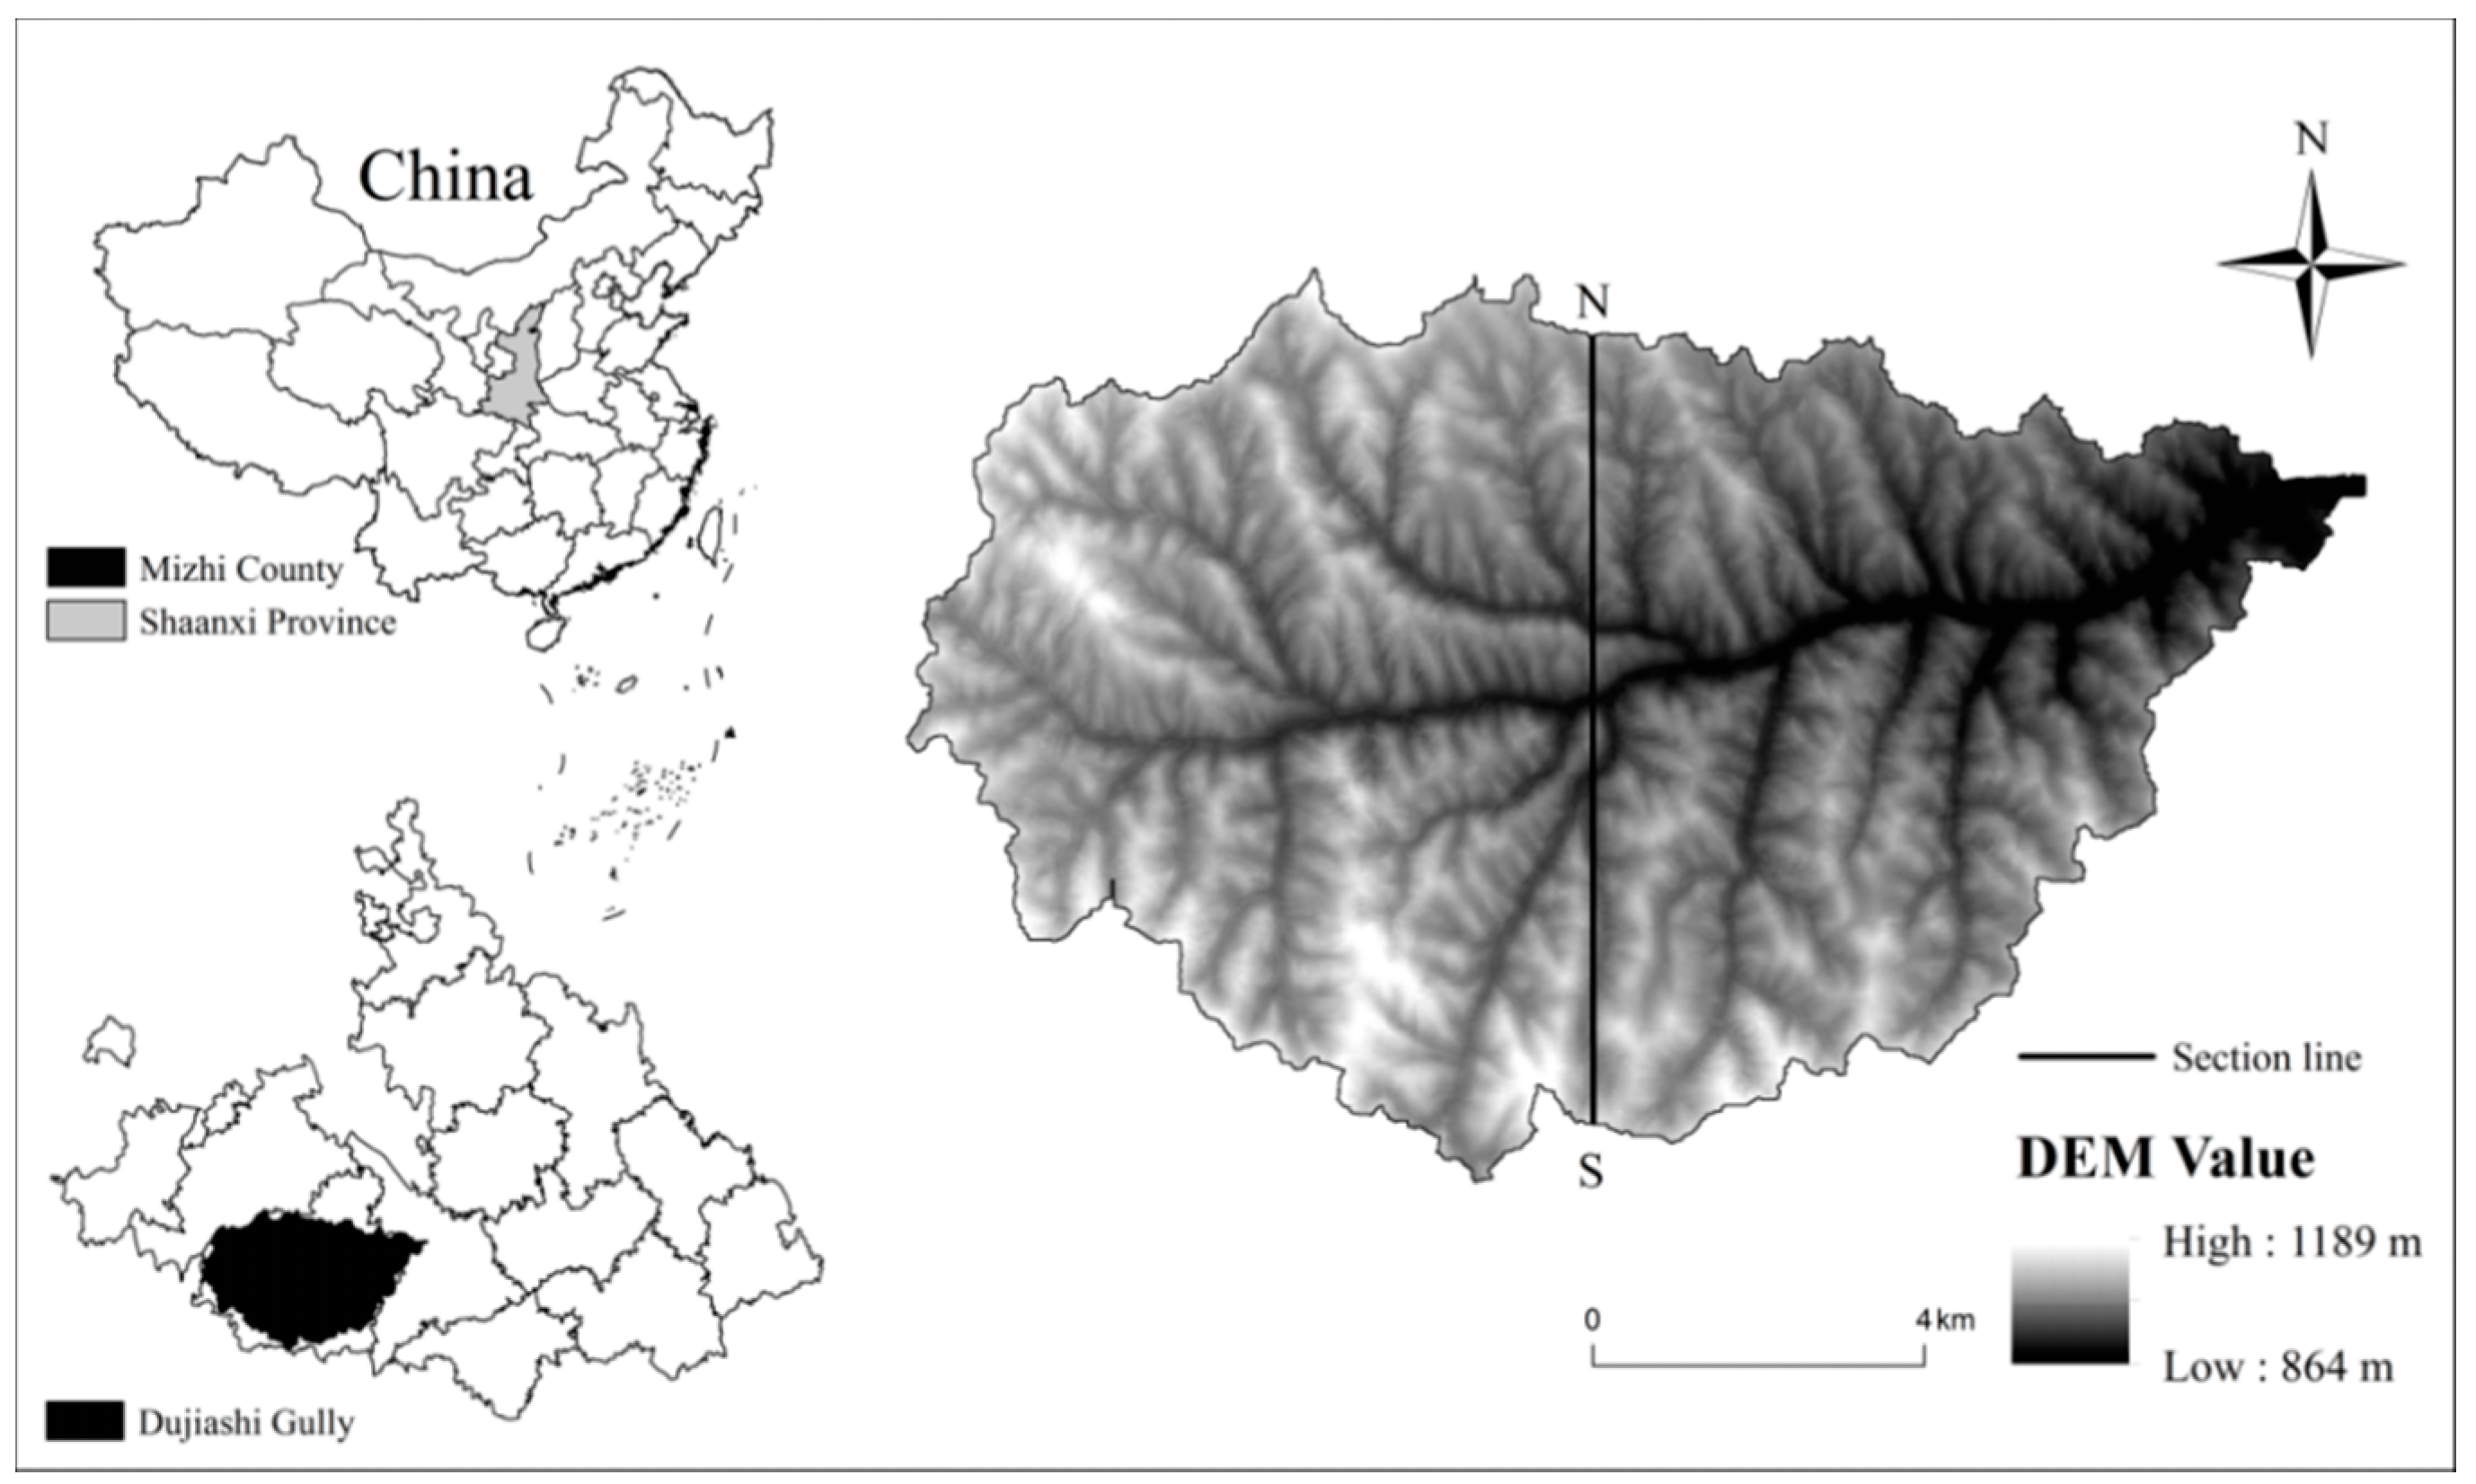
2.1. Study Area

The Dujiashi Gully is located in the southwestern region of Mizhi County, northern Shaanxi Province, China (Figure 1). The administrative divisions of the study area include 49 villages, which account for a total catchment area of 119.12 km2. The area has a moderate temperate semi-arid climate with infrequent precipitation but frequent heavy rains fall events, mostly occurring in the summer [31,32]. As the largest erosion gully in Mizhi County, Dujiashi Gully is characterized by high relief, a discontinuous vegetation coverage and prominent incision into the terrain. Severe types of geologic hazard events (landslide, flooding and debris flows) frequently occur under such climate and topographic conditions. Agriculture is well developed in the area; however, the linkage between agricultural production and the environmental issues related to land use (e.g., large amounts of pesticides and fertilizers and planting on steep slopes, is important. Because of this relationship, the ecological environment in the study area is vulnerable that has caused a range ecological risks. Taking the above factors into consideration, the study area provides an appropriate research area for a quantitative assessment of comprehensive ecological risk. Risk management categories research [13,33] can also provide a basis for ecological restoration and the sustainable development in similar gullied landscapes.

2.2. Data Source and Processing

A land-use map of Dujiashi Gully, a digital elevation model (DEM) and farmer survey data were needed for this study. The DEM was constructed from data sourced from the Geospatial Data Cloud (http://www.gscloud.cn). A 10 m × 10 m grid was resampled and the elevation and slope data for the region were extracted. The range of gully erosion gully was determined using the Hydrological Analysis Module in ESRI’s ArcGIS 10.2 software. The land-use map of Dujiashi Gully was constructed from remotely sensed image data and field survey data acquired for Mizhi County in 2015. The first high-resolution image (321 bands) of Dujiashi Gully was processed using ENVI 5.1 software, including image geometric correction and image enhancement. The land-use map was developed through supervised classification and artificial visual interpretation, while the kappa index of the interpretation result reached 0.86, which met the accuracy requirement for ecological risk assessment. By referring to the national land resources classification system and existing land use conditions, seven types of land use in the area can be categorized: farmland, forest, grassland, orchard, water bodies, constructed land (incl. residential, transportation corridors, industrial land) and wasteland. Farmers’ individual survey data and village overall survey data were mainly obtained during 456 interviews or surveys between 10 July 2010 and 28 July 2017. After the retrieval and screening of the questionnaires, the number of valid responses was determined to be 430; nearly 95% of the questionnaires distributed.
Considering the grid size when spatially registering the comprehensive ecological risk index and more targeted ecological risk management measures, 199 small watersheds were identified as the auxiliary evaluation units by using ESRI’s Hydrological Analysis Tools for ArcGIS 10.2. This method maintains the integrity of the natural ecological structure within the same unit and the spatial heterogeneity of the natural environment among different units, thus facilitating the comprehensive analysis of the ecological risk pattern [13].

2.3. Ecological Risk Assessment Framework

Based on ecological risk causal chains, this study assessed comprehensive ecological risk in terms of risk stressors and receptors, exposure and response processes and ecological endpoints [13]. As a result, risk probability, sensitivity and impairment were established to build a comprehensive ecological risk assessment framework that may be used for assessing the ecological environment state of the study area [9,19] (Table 1). The comprehensive ecological risk model is expressed by the formula below:
Comprehensive   ecological   risk   =   Riak   probability × Sensitivity × Impairment
The risk stressors caused by natural hazards and farming are of great concern in calculating risk probability. Natural hazard risk includes landslide hazard risk and flood hazard risk. Farming activity risk is dependent on soil pollution risk and external pressure risk. Secondly, sensitivity focuses on the vulnerability of the ecosystem in a threat source environment and is a direct response of risk receptors exposed to risk sources. Sensitivity in this study was quantified by evaluating habitat quality in the InVEST model (Integrated Valuation of Ecosystem Services and Tradeoffs model) [34] as the intermediate linkage between risk stressors and risk receptors to complete the ecological risk causal chain. Thirdly, the impairment degree was the ecological end point in the risk causal chain model and was informed by the adverse ecological effects under natural disasters and farming. The impairment degree was evaluated through a quantitative calculation of natural and social-economic indicators. Finally, the weight of the index layer was calculated by using entropy weight because this method is based on objective information and data to weigh the assessment index and is usually more objective [35].

2.3.1. Risk Probability

In this study, considering the regional particularities of gulley erosion, the risk probability was the possibility of adverse conditions caused by multiple ecological risk sources including natural hazards and farming.
The study area has one of the highest soil erosion rates in the world [31,36]. The risk probability was quantified by considering landslide hazard risk and flood hazard risk related to soil erosion. Based on the predicted landslide hazards, elevation, slope and NDVI were selected to calculate the landslide hazard risk probability [13,37]. The vertical differences in water system growth, soil types and human activities is caused by elevation zoning, which affects the aggregation and distribution of loose debris. In general, the lower the elevation, the greater the probability that the surface materials may be disturbed. Landslides are gravitationally formed landforms [13] where the steeper. The slope, the higher gravitational force on the soil sliding along the planes of weakness. The stability of the bank slope is largely maintained in areas with high vegetation coverage. The measure of vegetation coverage in this paper was estimated using NDVI.
The spatial differentiation of the flood hazard risk probability was expressed using environments that have experienced flooding and the ecological characteristics of land-use types [12,38]. Elevation and the linear distance from water bodies were chosen to illustrate flood disaster environments. Different land-use types had different vulnerabilities to flood hazard. The formula for natural hazard risk is given as follows:
LHRP = 1 E × N D V I × S
FHRP = 1 E × D W × D i
where LHRP is the landslide hazard risk probability; E is the land surface elevation; S is the slope; and NDVI is the normalized difference vegetation index. The three indicators were divided into five groups using the natural breaks method in ArcGIS 10.2 and then these data were normalized. The flooding hazard risk probability (FHRP) is calculated by comparing; DW (distance from water bodies) and Di known as vulnerability of land use types. Reviewing the related research [12], the vulnerability of land-use type to flooding was rated low to high, where from water bodies to forest, to grassland, to wasteland, to constructed land, to orchard and farmland. During the analyses, these data were normalized.
Land use was the most pervasive transformation of the natural environment by farmers in the study area and this process was associated with many environmental problems [39,40]. Thus, farming activity risk is closely related to land-use types and should receive greater attention. The probability of farming activity risk in this study was determined by evaluating soil pollution risk and external pressure risk. Taking into account the scarcity of water resources and the backwardness of industries in the study area, agricultural soil pollution risk should be focused on and compared to water pollution and industrial pollution in the region. The intensity of pesticide and chemical fertilizer applications were selected to characterize soil pollution risk under agricultural planting practices [36]. The external pressure risk depicts the degree of disturbance on different landscapes types under agricultural activities. In general, the closer the area is to the road, the lower the slope and the greater the risk for reduced ecosystem services from the ecological systems represented by various landscape types under the influence of human activities [33]. External pressure risk can be calculated by the formula below [41]:
S l o p e = { 1 , s l o p e 5 ° 0.05 s l o p e + 1.25 , 5 ° < s l o p e < 25 ° 0 , s l o p e 25 °
R o a d = 1 1 + ( d / a i )
where d is the distance between the landscape unit and the road and ai is the distance attenuation coefficient, which can be expressed as the degree of dependence of land use attributes on the road. According to the different degrees of road dependence of construction land, farmland, orchard, water bodies, grassland, forest and wasteland, ai ranges of 1000, 500, 500, 100, 10, 1 and 1 respectively [41]. These data were normalized.

2.3.2. Sensitivity

Sensitivity is the vulnerability of an ecosystem exposed to multiple ecological risk sources [19]. Whether the regional habitat is sensitive is related to the threat distance of the risk source and the vulnerability of the habitat itself. Constructing a comprehensive quantification and spatial demonstration of these factors in the sensitivity assessment was important.
The InVEST model is the most mature and widely used ecosystem service evaluation model [42]. The habitat quality module was selected in InVEST to represent habitat sensitivity and can effectively quantify multiple factors and display spatial differentiation. Habitat quality is an important index for species reproduction potential and is also critical for the maintenance of regional ecological security and human well-being. Habitat quality can be calculated by the formula below:
Q x j = H j [ 1 ( D x j z D x j z + k z ) ] ;     D x j = r = 1 R y = 1 Y r ( w r r = 1 R w r ) r y i r x y β x S j r  
where Qxj is the habitat quality of land use j in grid x; Hj is the habitat of land use j; Dxj is the habitat degradation of land use j in grid x; k is the half saturation constant; z is normalized constants, the value of which was 2.5; R is the number of threat factors; Wr is the weight of the threat factor r; Yr is the number of grids of threat factors r; ry is the value of the threat factor of grid y; irxy is the threat level of grid y’s threat factor r to grid x; βx is the ability of grid x to reach threat factors; and Sjr is the sensitivity of habitat type j to threat factor r.
Habitat quality is a function of four factors, namely, each threat’s relative impact, the relative sensitivity of each habitat type to each threat, the distance between habitats and sources of threats and the degree to which the land was legally protected [34]. The first three factors were mainly considered in this paper and the impact of these threats on habitats decreases exponentially with increasing distance. The selection of threat factors and habitat types and the maximum impact distance and sensitivity settings were comprehensively considered using the InVEST user guide [43], relevant scholars’ studies [44,45] and the actual situation in the study area (Table 2). Sensitivity can be generated from the InVEST model directly and then the spatial distribution map of sensitivity was obtained based on ESRI’s Zonal Statistics Tool in ArcGIS 10.2.

2.3.3. Impairment

Impairment is the ecological endpoint in the risk causal chain and is represented by the unfavorable ecological effects caused by the external pressures of natural disasters and human activities. In this study, the comprehensive impairment was calculated by the degree of natural system loss including the landscape loss index and the degree of social system loss including population density and food production.
The ecosystems represented by the landscape types can be damaged by the disturbance of natural hazards and farming, which can be directly reflected in the ecosystem structure and composition [21]. Different landscape types are exposed to various locations in the region and have different degrees of disturbance and resistance capability in the face of external interference [18]. In this study, a landscape disturbance index and landscape vulnerability index were constructed on the basis of landscape metrics that have been extensively used to quantify the characteristics of landscape patterns [22]. Then, a quantitative expression of landscape loss index was established by means of the relationship between landscape patterns and natural impairment based on 199 small watersheds. The landscape loss index can be expressed by the formula below:
LLI k = i = 1 n S k i S k E i × F i
where LLIk denotes the landscape loss index of a small watershed k; n is the number of landscape types; Ei is the landscape disturbance index of landscape i; Fi is the landscape vulnerability index of landscape i; Ski is the area of landscape components i in a small watershed k; and Sk is the total area of a small watershed k. By referring to previous studies [21,24,46,47], the detailed calculation methods of Ei and Fi were given in Table 3.
Different ecological hazards occurred in different evaluation units, which may lead to completely different results. Impairment was calculated using not only the natural attributes of risk receptors but also social-economic attributes [18]. Population was the foundation of regional development and food production was the key to farmers’ welfare in the social-economic system of the study area as an agricultural area, which is the most sensitive to damage to risk receptors in the study region. The social loss index was defined as the degree of impairment to the social system and was constructed by using two social-economic indices, including the population density and food production. These data were derived from village overall survey data and were normalized. The spatial distribution map of impairment was obtained using Zonal Statistics Tool and Overlay Analysis Tool.

3. Results

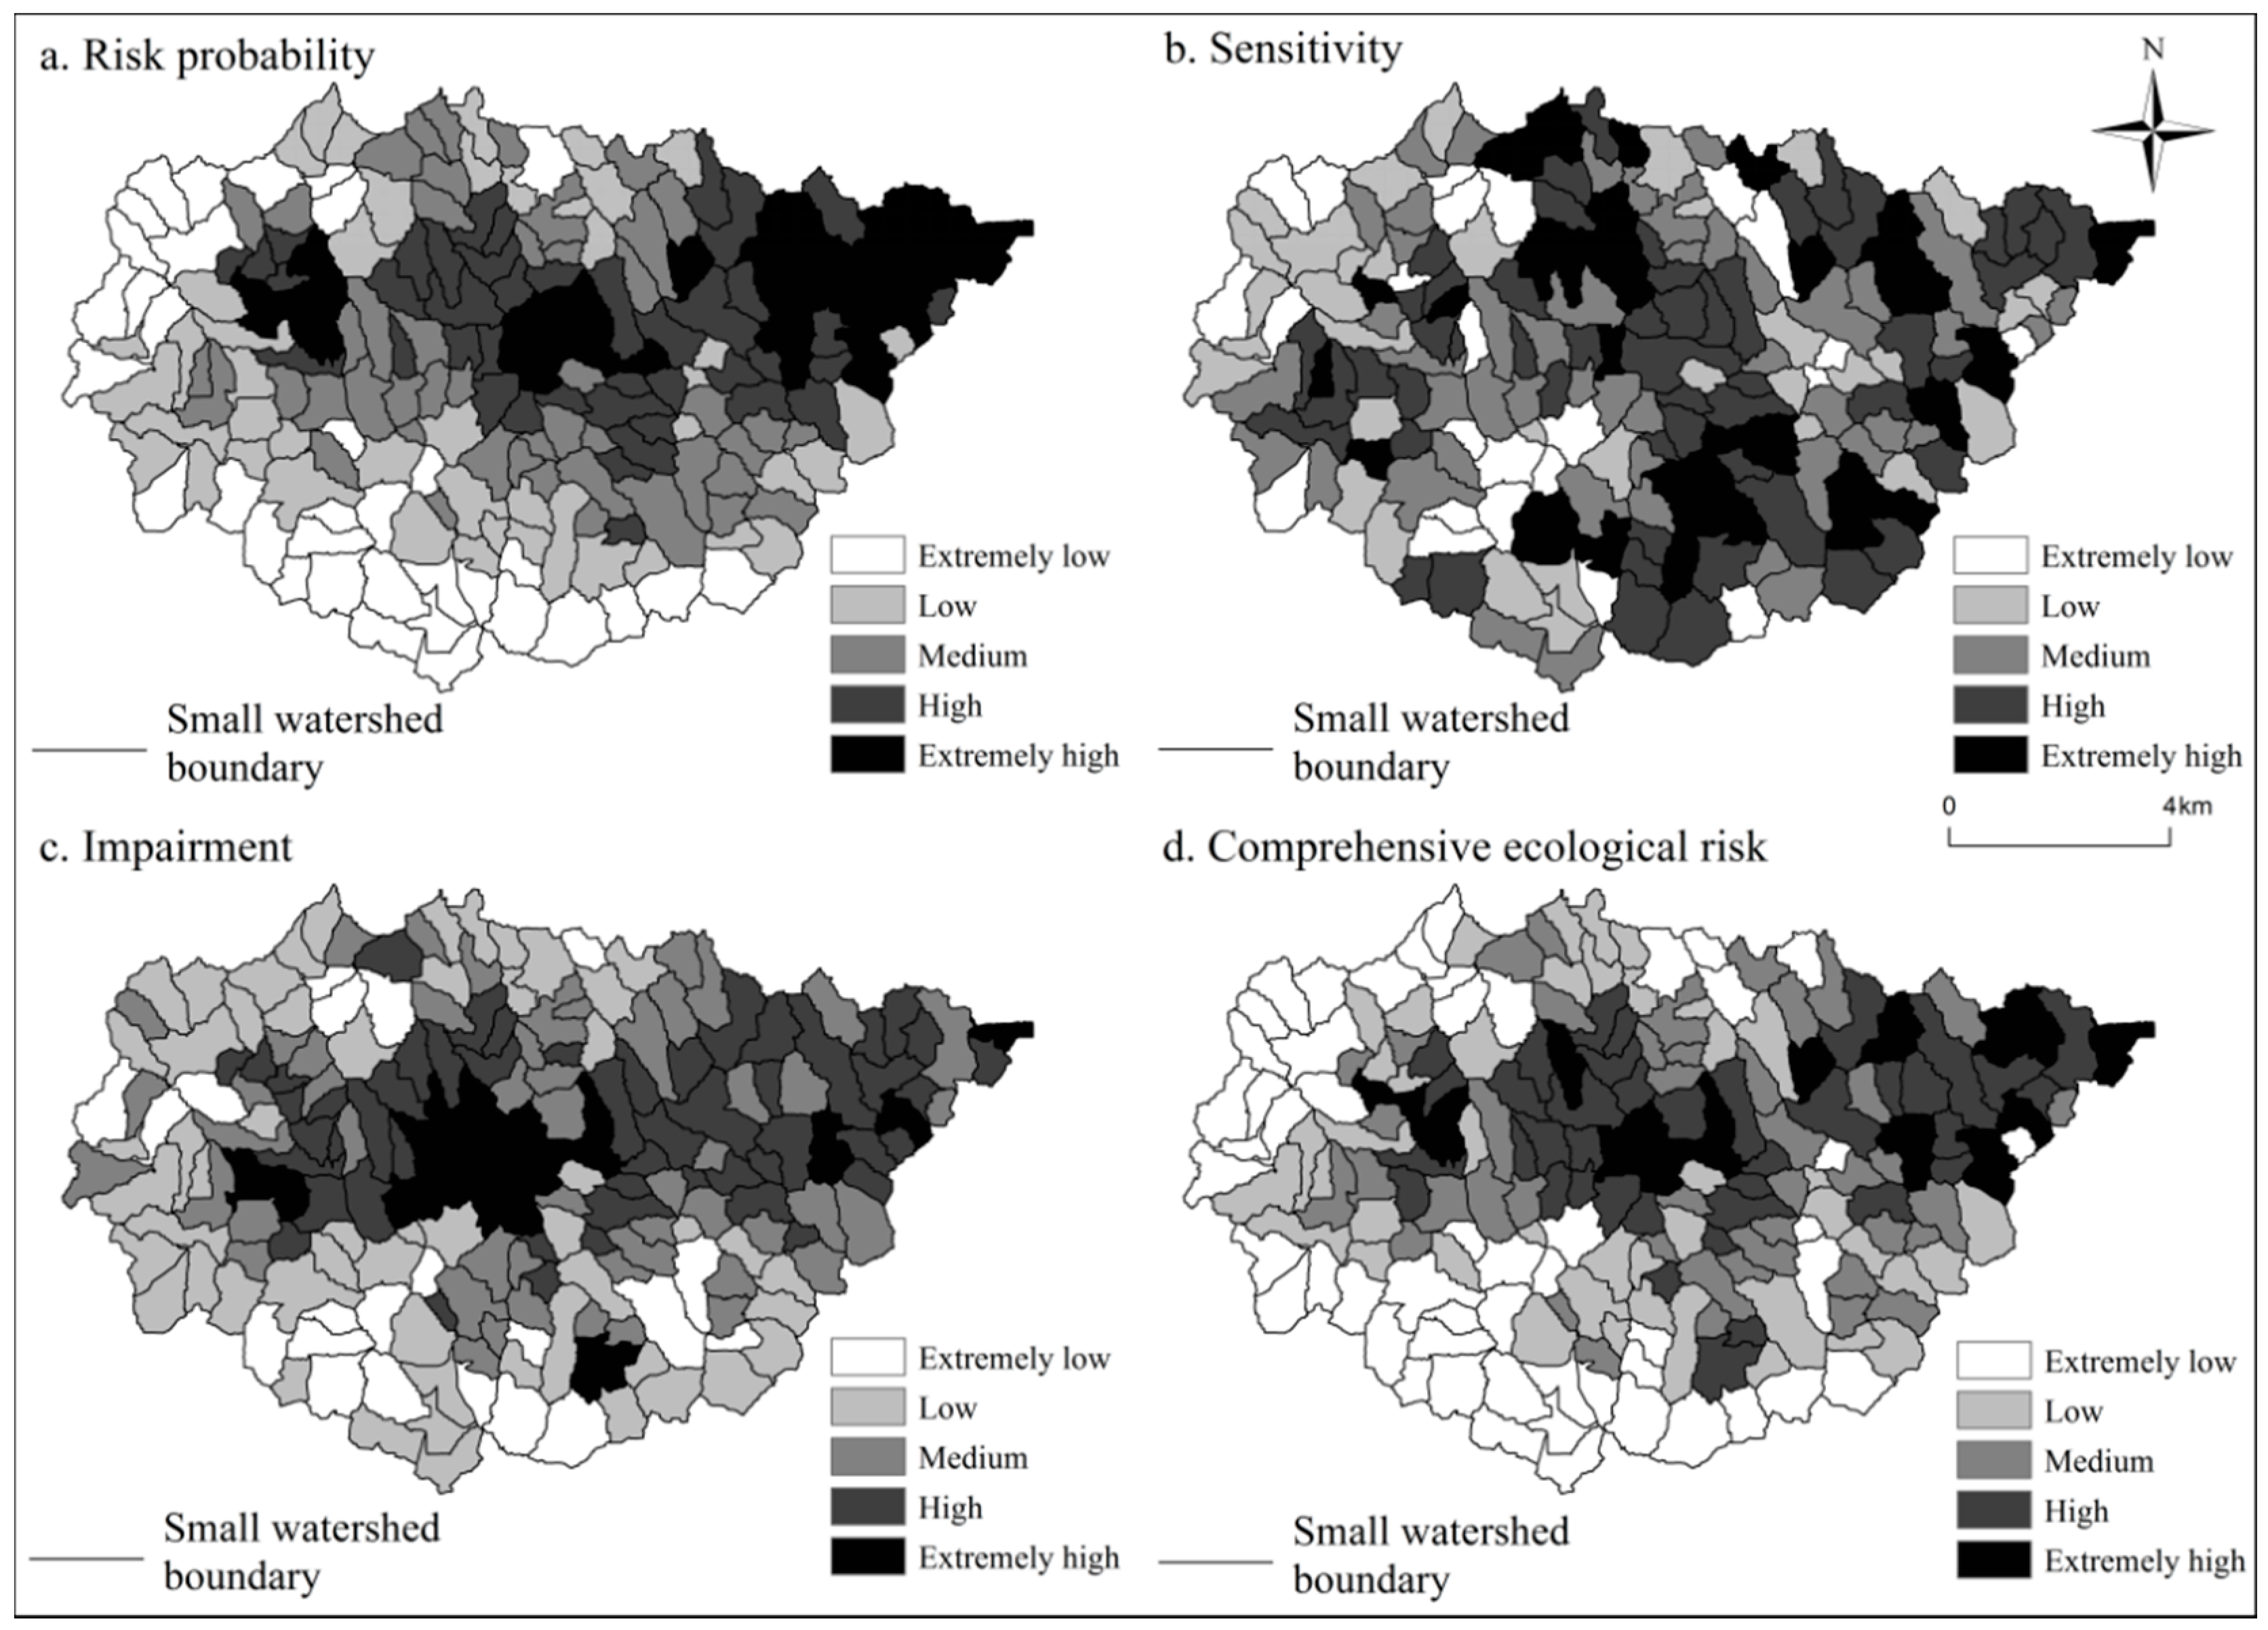
3.1. Spatial Differences in Criteria Layers

To analyze the characteristics of the criteria layers in the study area, the risk probability, sensitivity and impairment values of the 199 small watersheds were divided into five categories (extremely low, low, medium, high and extremely high) using natural breaks. Based on the detailed criteria layer grade division standard, spatial difference maps for risk probability, sensitivity and impairment covering the study area were generated (Figure 2).
The results indicated that the difference between the criteria layer maps was significant due to the different basic structures and meaning of the criteria layers. The risk probability was highest in the central and eastern region and lowest in the west and southern parts of the region (see Figure 2a). The region with high, and extremely high, risk probabilities account for 18.46% and 14.33% of the study area, respectively. These areas were mainly located in the eastern part of the Mizhi County and central gully area. The centers of extremely high risk probability were in the eastern, central and western regions (see Figure 2a). Severe flood hazard risk was directly related to extremely high risk probability, which occurred in the eastern region due to the low topography and the widely distributed dams. Soil salinization was aggravated in dam land and impacted by long-term flooding. Subsequently, fertile farmland was gradually transformed into wasteland with low fertility, that began a vicious cycle of soil impairment. Part of the study area where overlap between the extremely high and the central area of constructed land became greater. The stability of loess-covered hillsides was severely damaged by road construction on steep slopes, which led to an increased landslide activity. The core area of in western areas with an extremely high grade was covered by fruit tree planting and has faced more serious soil pollution. The areas of extremely low and low risk probability occupy for 21.97% and 23.84% of the study area, respectively and were mostly located in the western and southern regions. Because the hills and terraces were widely distributed, landslide and flood risk was reduced and the natural risk probability was low. At the same time, the risk from external pressure risk is low compared with that in the gullied area, because road building in the hilly areas is limited. The spatial patterns for sensitivity are more complicated (see Figure 2b). There are certain spatial correlations between the research result and the status of land use because the spatial differences in the habitat sensitivity assessment in the study area was based on the land-use types in the InVEST model. The regions of high and extremely high sensitivity were mainly located in the gullied areas in the south and north sides of the main valley and in the small gullies in the eastern regions, which encompassed approximately half of the study area. Areas with extremely low and low sensitivity areas represented 12.27% and 17.91% of the study area, respectively and mainly located in the northwest and southwest parts of the study area. The degree of impairment was highest in the middle and eastern regions (see Figure 2c). The regions with extremely high degree of impairment were mostly located in the center of the Dujiashi Gully, which encompasses 8.22% of the study area. The impairment to the social system in this area was relatively high as the population density and food production were both significantly higher in this region. However, the regional landscape structure changed into complexity, with heterogeneous and discontinuous patches of higher risk due to frequent human disturbances. At the same time, a reduction in the ability of the ecosystem to resist external disturbances was observed because of the relative concentration of landscape types such as construction land, wasteland and farmland, which thus increased the natural system impairment index. The regions of impairment with low and extremely low grades included 14.48% and 30.36% of the study area, respectively. These areas were distributed across the southern and western regions. The natural system impairment was lower because of the high degree of terrain relief in the region, the wide distribution of forest and grassland and the optimal landscape structure and ecological environmental conditions, while the social system impairment was low because of the limited population and the limited food production in the steep terrain compared to the dense population and superior farming conditions supported by the water and soil in the gully.

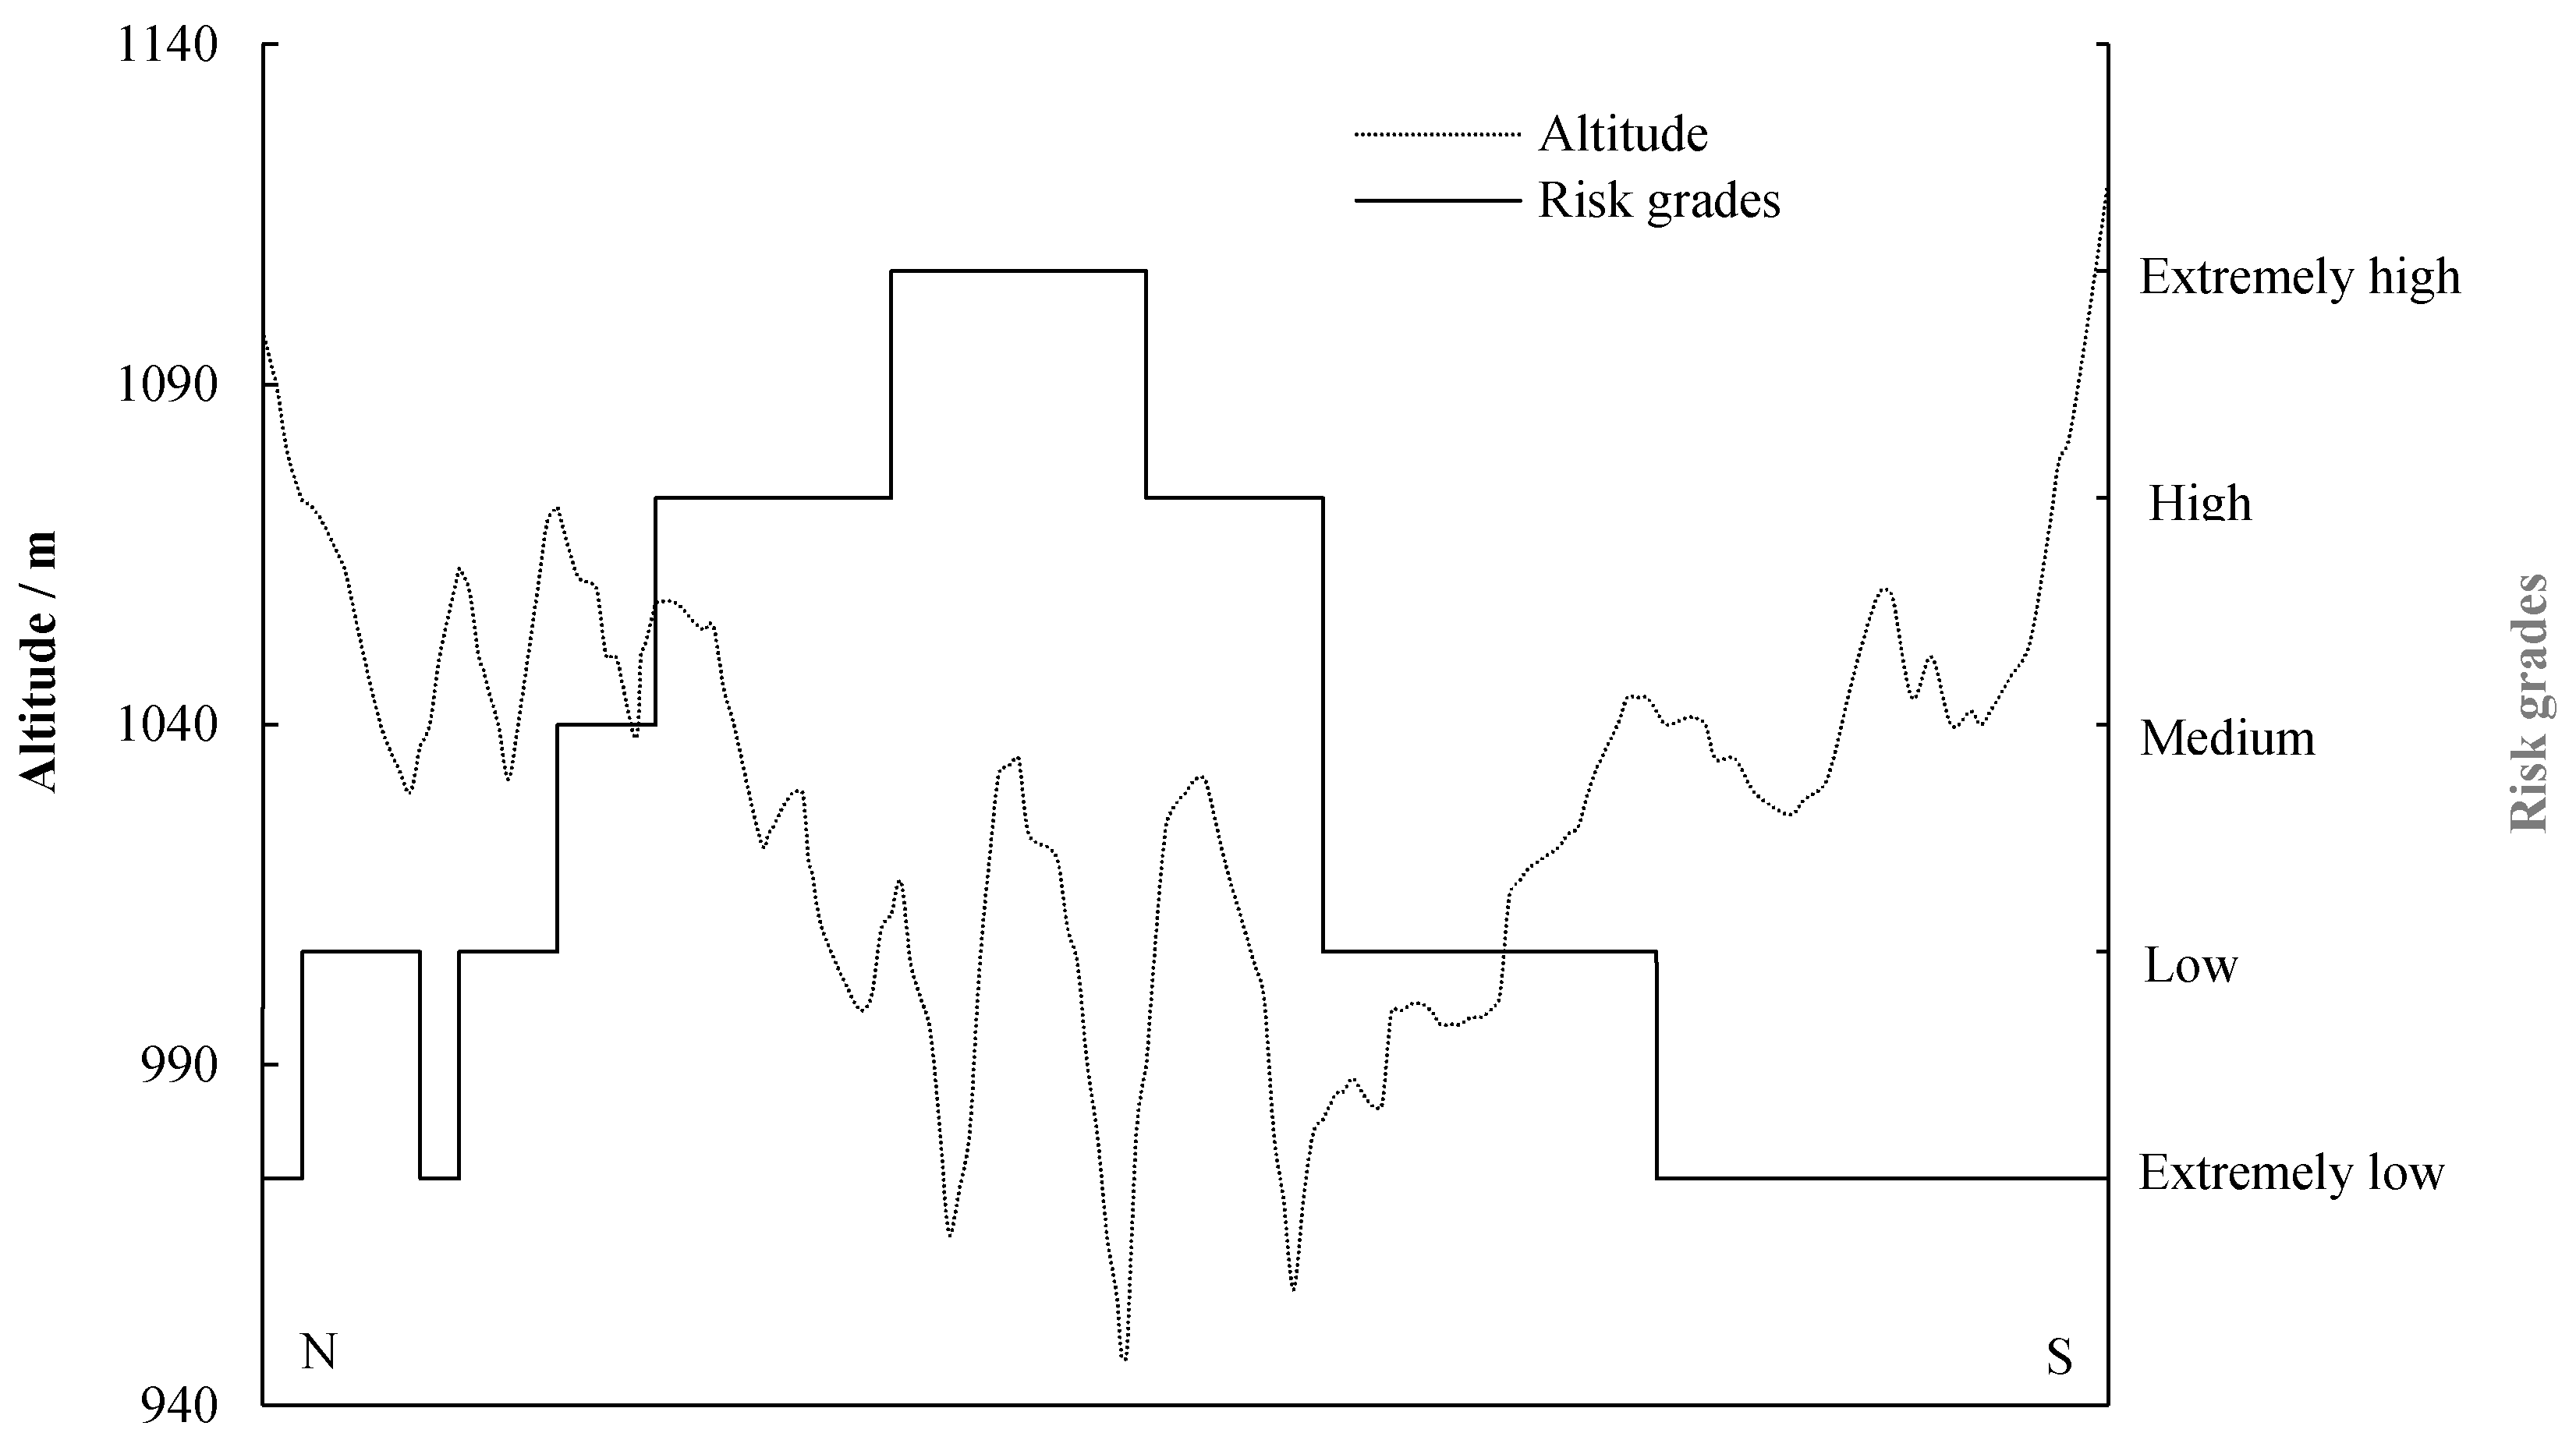
3.2. Spatial Differences in Comprehensive Ecological Risk and Analysis of the Section Line

The comprehensive ecological risk at the small watershed scale was calculated by multiplying the equal weights in formula 1. The map of comprehensive ecological risk was generated using the natural breaks tool (Figure 2d). To be specific, the regions with extremely high and high probabilities were mainly located in gully areas and secondary erosion gullies, which are in 28.02% of study area. The extremely low-risk areas covered 1/3 of the study area and were mainly distributed to the northwest and south of the study area, where hills are widely spaced.
In the erosion prone gullies, natural disasters and human activities are limited and the spatial distribution of land use is naturally controlled by topographic features. The distribution of regional ecological risk pressure and land use structure exhibited consistent changes with topography, resulting in comprehensive ecological risk changing with the terrain [39,48]. To clarify the relationship between ecological risk and topography, the section line analysis method was adopted using 3D Analyst Tool in ArcGIS10.2 [33]. The section of terrain and comprehensive ecological risk were produced along a straight line from north to south (Figure 1) and the result is shown in Figure 3 and the elevation decreased first and then rose but the comprehensive ecological risk increased first and then decreased from north to south. The comprehensive ecological risk grades were mainly extremely low and low in the hills to the south and north. Areas with high altitudes were less likely to be impacted by natural disasters, such as flooding and the lower population led to very limited external interference. In addition, the terraced fields are widely distributed across the region and are concentrated in their number, so the degree of landscape separation is low and the ecosystem was relatively stable that resulted in low natural system impairment. The regions of high and extremely high comprehensive ecological risk were mainly located in the middle part of the gully. The probability of landslides and flooding hazard in the region was high due to the paving of roads in the gully, the construction of townships and the increase in saline soils. The agricultural risk probability was also high because of the dense population and the developed of agriculture in this region. Natural system impairment was also high due to the disorganization and fragility of land use structure. At the same time, the degree of social system impairment increased due to the larger area needed for food production. In general, the pressure of natural disasters and farming activities decreased as elevation increased, showing a transition from artificial ecosystems to semi-natural ecosystems. At the same time, this transition was accompanied by differences in habitat sensitivity, landscape impairment and other factors and ultimately affected the spatial differentiation of comprehensive ecological risk.

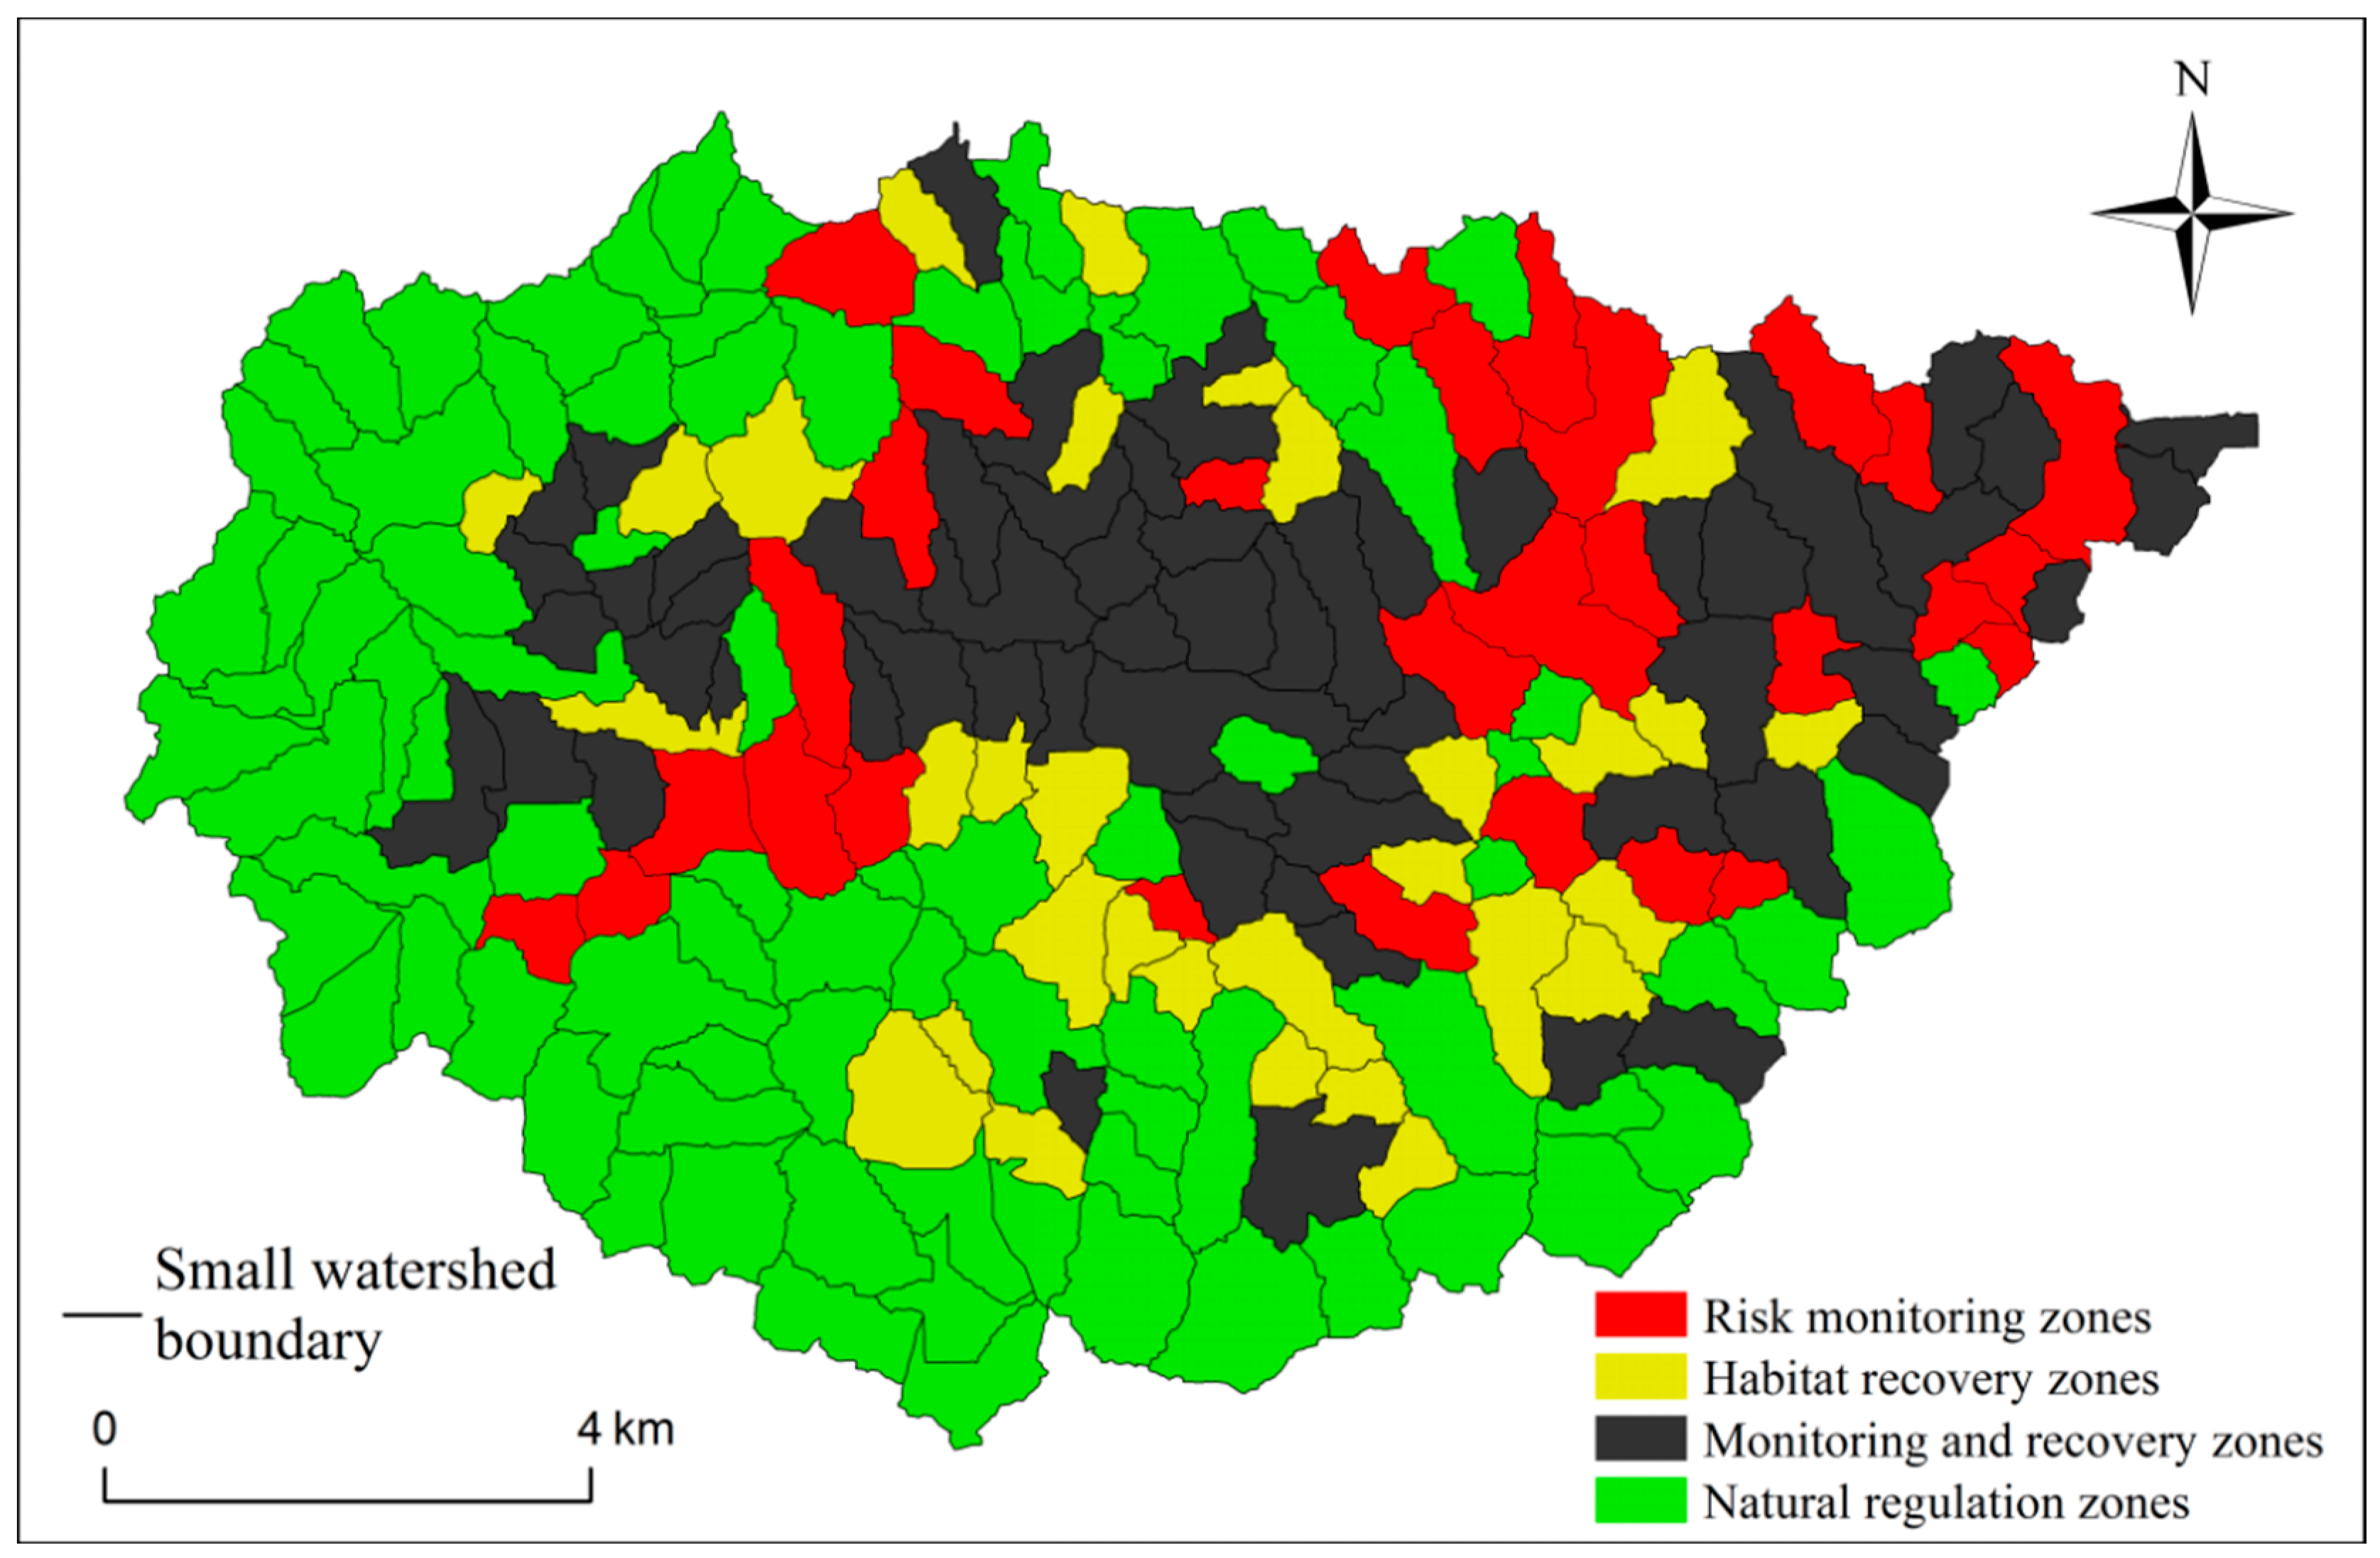
3.3. Risk Management Categories

Risk management refers to dividing risk management categories on the basis of ecological risk assessment and risk dominant factor, so as to provide guidance for targeted risk precaution [49]. In this study, based on the risk probability grade, sensitivity grade, comprehensive ecological risk grade, the study of ecological risk management categories was carried out. Factors and environments contributing to disasters were the main considerations in risk management, therefore, impairment assessment was not included in risk management [13]. This result is because in the loess hilly gully region, which has a fragile ecological environment, the restoration and reconstruction of natural ecosystems is more conducive to the reduction of ecological risk and the improvement of sustainability. If the ecological system experience serious impairment from natural disasters or agricultural activities, these changes inevitably lead to the fragmentation of landscape structure and the decline of productivity. Therefore, risk management should include the causes of disasters and sensitivity and also focus on reducing the risk probability and sensitivity of regional ecological risks.
Based on the above consideration, the average of comprehensive ecological risk, risk probability and sensitivity were calculated respectively for the entire study area [13,33]. Meanwhile, taking small watersheds as the basic evaluation unit, value of comprehensive ecological risk, risk probability and sensitivity in each area was compared with their respective averages. Furthermore, 199 small watersheds were divided into four categories of risk (Figure 4). Risk monitoring zones are small watersheds with high comprehensive ecological risk, high risk probability and low sensitivity. They are dominated by risk probability, in which ecological risk reduction is the focus. Habitat recovery zones are small watersheds with high comprehensive ecological risk, low risk probability and high sensitivity. They are dominated by sensitivity and in which sensitivity reduction is the focus. Monitoring and recovery zones are small watersheds with high comprehensive ecological risk, high risk probability and high sensitivity where risk probability and sensitivity dominate and are hot spots for risk management that should focus on the reduction of risk probability and sensitivity. Natural regulation zones are small watersheds with high comprehensive ecological risk, low risk probability and low sensitivity. Also, they have low comprehensive ecological risk and classified as “cold spots” for risk management because the dominant factor was unknown or the overall comprehensive ecological risk was low. These regions mainly resisted the external risk stress because of their resilience.
Our research results show that risk monitoring zones, habitat recovery zones, monitoring and recovery zones and natural regulation zones encompass 14.84%, 12.44%, 26.47% and 46.25% of the study area, respectively. Specifically, the monitoring and recovery zones are relatively concentrated in the central and eastern regions. Risk monitoring zones were also distributed along the main gully, while the habitat recovery zones were more scattered and mostly situated in the southern region. The natural regulation zones were mainly located in the west and south of the study area with higher elevation.
The risk management categories based on the risk dominant factor was conducive to exploring the intrinsic mechanism of regional risk occurrence and can provide more targeted preventive measures to promote the sustainable development of the ecological environment. For risk monitoring zones, it is necessary to recognize the risk environments exposed to natural disasters and agricultural stress. Based on remote sensing data, an investigation of geological and hydrological hazards should be conducted and disaster risk areas be designated. Risk management should focus on the implementation of the policy of Returning Farmland to Forests in the region, the reduction of farmland on steep slopes and river monitoring during the flood seasons, among other approaches. Engineering measures can be taken to reduce the risk probability of landslides in areas where slope failures occur frequently. Silt dams should be constructed and dams with high repair indices should be reconstructed so that ecological impairment caused by regional flood hazards be reduced. The regional application of pesticides and fertilizers is of great concern and agricultural science and technology personnel are being trained so the use of pesticides and fertilizers can be reduced, while increasing the efficiency of agricultural production. A model with high efficiency, high quality and sustainability, which can effectively reduce the ecological risks brought about by agricultural activity, should be developed. For habitat recovery zones, the effects of regional risk stressors on sensitive risk receptors need to be recognized. Planning the use of industrial and mining land to carry out ecological rehabilitation of mined-out lands to prevent soil erosion during ground subsidence and stripping of topsoil is important. Roads in hilly terrain, especially paved roads, should be constructed to reduce soil erosion and road be built along greenbelts to adverse effects. The expansion of townships should be carried with care. Meanwhile, borrowing land to construct buildings should be strictly prohibited. It is necessary to harden and fence high-slope excavated land. Water is fundamental to the sustainable livelihoods of rural households in the Loess Plateau region. Therefore, it is necessary to strengthen the protection of water supply and quality. Agricultural irrigation should be carried out rationally and flood water be fully utilized for agricultural irrigation. The national policy of Returning Farmland to Forests and Grasslands should be widely implemented. Areas of grassland should be further increased and the area of farmland should be reduced. Meanwhile, the agricultural planting structure should be transformed; for example, the scale of economic crops should be expanded. Agricultural production methods should be improved through cooperative economic organizations to achieve the sustainable development of regional agriculture and further reduce regional habitat sensitivity. For monitoring and recovery zones, the above two aspects of risk prevention strategies should be taken into consideration. Natural regulation zones belong to “cold spots” of risk management. Excessive man-made management measures do not need to be implemented. The natural regulation of ecological risks is achieved through the resilience of the ecosystem itself.

4. Discussion

As a tool that can effectively support ecosystem management [50], ecological risk assessment has become an important research issue in ecology, geography and other disciplines [14]. Based on the traditional ecological risk framework, the exposure process from risk sources to risk receptors was emphasized through sensitivity characterization here to reveal the interactions of regional ecosystem structure and function. The ecological risk assessment framework was refined through the characterization of sensitivity based on the InVEST model as an intermediate assessment of probability from risk source to risk receptor. Also, a three-dimensional framework of “risk probability-sensitivity-impairment” was constructed. This method provided theoretical support for the enrichment of information in the process of quantifying regional ecological risk. As a basic evaluation unit for multiple data source integration, small watersheds can ensure the unity of ecosystem structure and processes while ensuring the heterogeneity of the natural environment of different evaluation units to avoid the fragmentation of natural geographical connections [13,47]. This risk unit segmentation method can be used to effectively analyze ecological risk patterns and accurately control risk management zoning. For research purposes, the related research on ecological risk paid more attention to the spatial and temporal differences in ecological risk [24,47], risk accumulation effects [21] and risk prediction [25,46]. Specific suggestion for ecological restoration based on differentiated risk management categories is relatively rare and thus, it is often difficult for risk assessment results to inform more specific applications. According to the results of ecological risk research, based on the risk dominant factor, differentiated risk management categories and specific risk management measures were provided, which represents a practical application of the ecological risk evaluation results [33].
Within a region with some of the most serious soil erosion in the world [32], modern agricultural development and fragile natural environments in the study area experience tradeoffs, making regional sustainable development difficult. Due to unique geological and geomorphological processes, surface water and soil processes and frequent human activities, serious ecological risks are present in the loess hilly gully region. Therefore, the identification and quantification of ecological risks is very important [51]. At the same time, related research [29] showed that the ecological risk had increased in this region (Mizhi County), in the 21st century. The Dujiashi Gully is the largest erosion gully and the most active area of agricultural production in Mizhi County. In recent years, frequent natural disasters and high losses have caused populations to move out and affect regional socio-economic sustainability. Farmers with limited economic capacity living in this area are facing many livelihood risks. For example, the destruction of rural roads has blocked the exchanges between settlements and towns. The loss of soil nutrients caused by flooding has reduced food production and farmers have to use a lot of fertilizer to increase yields. As fertilizer purchases increasing daily spending, farmers are trapped in a cycle of poverty. The frequent occurrence of many socio-economic phenomena caused by ecological risk has great impact on the promotion of regional sustainable development [28]. In this study, the study of risk management categories and risk management measures can design a stable and sustainable development path for local farmers from the perspectives of natural environment restoration and social-economic transformation. Ecological risk and socio-economic factors influence each other and affect the social ecosystem together. It is because of this correlation that the recognition of socio-economic factors is very important in ecological risk assessment. In future ecological risk assessment, further improvement of social-economic indicators can better relate ecological risk and sustainability, making risk assessment an effective method to promote regional sustainable development.

5. Conclusions

In the Dujiashi Gully, the regional ecological risk was comprehensively characterized based on the “risk probability-sensitivity-impairment” ecological risk assessment framework. Multiple element indicators and spatialized displays were synthesized. Ecological risk management categories were designed based on the risk dominant factor and the risk management strategies were explored, so as to reduce the possibility of ecological risk and promote regional sustainable development.
The results were as follows: (1) The spatial heterogeneity in comprehensive ecological risk were very significant. The regions with extremely high and high ecological risk accounted for 28.02% of study area which were mainly located in gully areas and secondary erosion gullies. The areas with extremely low ecological risk covered 1/3 of the study area and were mainly distributed to the northwest and south of the study area, where hills are widely spaced. (2) Relying on the section line analysis of ecological risk and elevation, the comprehensive ecological risk and elevation generally showed inverse relationships. The elevation decreased first and then rose but the comprehensive ecological risk increased first and then decreased from north to south. (3) 199 small watersheds were divided into four types of risk management categories based on risk dominant factor. Research results showed that monitoring and recovery zones (26.47%) were relatively concentrated in the central and eastern regions. Risk monitoring zones (14.84%) were also distributed along the main gully, while the habitat recovery zones (12.44%) were more scattered and mostly situated in the southern region. Natural regulation zones (46.25%) were mainly located in the west and south of the study area with higher elevation. (4) For risk monitoring zones, risk mitigation measures, ranging from disaster engineering measures and agricultural technology promotion, were implemented. For habitat recovery zones, precise measures for habitat restoration were adopted from the reduction of threat sources, the implementation of the policy of Returning Farmland to Forests and the adjustment of agricultural economic structure. For monitoring and recovery zones, the above two aspects of risk management strategies were fully considered. For natural regulation zones, the natural control of ecological risk was realized through the resilience of the ecosystem.

Author Contributions

D.L., X.L. and H.C. designed the research and wrote the paper. H.Z., N.M. analyzed the data. All authors read and approved the final manuscript.

Funding

This research was funded by National Natural Science Foundation of China (Grant No. 41671086 & 41271103) and the APC was funded by Grant No. 41671086.

Acknowledgments

Supports from the National Natural Science Foundation of China are gratefully acknowledged.

Conflicts of Interest

The authors declare no conflict of interest.

References

  1. Fu, B.J. Geography: From knowledge, science to decision making support. Acta Geogr. Sin. 2017, 72, 1923–1932. [Google Scholar]
  2. Fan, J.H.; Wang, Y.; Zhou, Z.; You, N.S.; Meng, J.J. Dynamic ecological risk assessment and management of land use in the middle reaches of the Heihe River based on landscape patterns and spatial statistics. Sustainability 2016, 8, 536. [Google Scholar] [CrossRef]
  3. Chang, H.F.; Peng, J.; Wang, Y.L.; Wu, W.B.; Yang, P.; Liu, Y.X.; Song, Z.Q.; Hsueh, I.C. Characteristics of landscape system in the context of global change. Prog. Geogr. 2017, 36, 1167–1175. [Google Scholar]
  4. Forbes, V.E.; Calow, P. Developing predictive systems models to address complexity and relevance for ecological risk assessment. Integr. Environ. Assess. Manag. 2013, 9, E75–E80. [Google Scholar] [CrossRef] [PubMed]
  5. Pollino, C.A.; Thomas, C.R.; Hart, B.T. Introduction to models and risk assessment. Hum. Ecol. Risk Assess. 2012, 18, 13–15. [Google Scholar] [CrossRef]
  6. Peng, J.; Dang, W.X.; Liu, Y.X.; Zong, M.L.; Hu, X.X. Review on landscape ecological risk assessment. Acta Geogr. Sin. 2015, 70, 664–677. [Google Scholar]
  7. Suter, G.W.; Norton, S.B.; Barnthouse, L.W. The evolution of frameworks for ecological risk assessment from the Red Book ancestor. Hum. Ecol. Risk Assess. 2003, 9, 1349–1360. [Google Scholar] [CrossRef]
  8. Landis, W.G. Twenty years before and hence: Ecological risk assessment at multiple scales with multiple stressors and multiple endpoints. Hum. Ecol. Risk Assess. 2003, 9, 1317–1326. [Google Scholar] [CrossRef]
  9. Peng, J.; Zong, M.L.; Hu, Y.N.; Liu, Y.X.; Wu, J.S. Assessing Landscape ecological risk in a mining city: A case study in Liaoyuan City, China. Sustainability 2015, 7, 8312–8334. [Google Scholar] [CrossRef]
  10. Mirzabeygi, M.; Abbasnia, A.; Yunesian, M.; Nodehi, R.N.; Yousefi, N.; Hadi, M.; Mahvi, A.H. Heavy metal contamination and health risk assessment in drinking water of Sistan and Baluchistan, Southeastern Iran. Hum. Ecol. Risk Assess. 2017, 23, 1893–1905. [Google Scholar] [CrossRef]
  11. Protano, C.; Zinna, L.; Giampaoli, S.; Romano, S.V.; Chiavarini, S.; Vitali, M. Heavy Metal Pollution and Potential Ecological Risk in Rivers: A Case Study from Sounthern Italy. Bull. Environ. Contam. Toixcol. 2014, 92, 75–80. [Google Scholar] [CrossRef] [PubMed]
  12. Chang, H.F.; Wang, R.S.; Li, Z.G.; Li, F.; Wu, J.S.; Huang, J.L.; Yu, Y.Y. Comprehensive assessment of urban ecological risks: The case of Huaibei City. Acta Ecol. Sin. 2011, 31, 6204–6214. [Google Scholar]
  13. Du, Y.Y.; Peng, J.; Zhao, S.Q.; Hu, Z.C.; Wang, Y.L. Ecological risk assessment of landslide disasters in mountainous areas of Southwest China: A case study in Dali Bai Autonomous Prefecture. Acta Geogr. Sin. 2016, 71, 1544–1561. [Google Scholar]
  14. Cao, Q.W.; Zhang, X.W.; Ma, H.K.; Wu, J.S. Review of landscape ecological risk and an assessment framework based on ecological services: ESRISK. Acta Geogr. Sin. 2018, 73, 843–855. [Google Scholar]
  15. Fu, Z.Y.; Xu, X.G.; Lin, H.P.; Wang, X.L. Regional ecological risk assessment of in the Liaohe River Delta wetlands. Acta Ecol. Sin. 2001, 21, 365–373. [Google Scholar]
  16. Malekmohammadi, B.; Blouchi, L.R. Ecological risk assessment of wetland ecosystems using multi criteria decision making and geographic information system. Ecol. Indic. 2014, 41, 133–144. [Google Scholar] [CrossRef]
  17. Zhang, S.F.; Zhang, L.; Zhang, Y.H. Ecological risk assessment of the Yulin coal mining area based on the petarmethod. Resour. Sci. 2011, 33, 1914–1923. [Google Scholar]
  18. Li, X.H.; Wang, L.; Li, J.Y. Regional ecological risk assessment in catchment area along the Weihe River based on GIS. Acta Ecol. Sin. 2009, 29, 5523–5534. [Google Scholar]
  19. Xu, Y.; Gao, J.F.; Guo, J.K. The ecological risk assessment of Taihu Lake watershed. Acta Ecol. Sin. 2013, 33, 2896–2906. [Google Scholar]
  20. Zhang, Y.Z.; Xie, X.P. Regional ecological risk assessment in Nansi Lake based on RS and GIS. Acta Ecol. Sin. 2015, 35, 1371–1377. [Google Scholar] [CrossRef]
  21. Xie, H.L.; Wang, P.; Huang, H.S. Ecological risk assessment of land use change in the Poyang Lake eco-economic zone, China. Int. J. Environ. Res. Public Health 2013, 10, 328–346. [Google Scholar] [CrossRef] [PubMed]
  22. Gong, J.; Yang, J.X.; Tang, W.W. Spatially explicit landscape-level ecological risks induced by land use and land cover change in a national ecologically representative region in China. Int. J. Environ. Res. Public Health 2015, 12, 14192–14215. [Google Scholar] [CrossRef] [PubMed]
  23. Liu, C.Y.; Zhang, K.; Liu, J.P. A long-term site study for the ecological risk migration of landscapes and its driving forces in the Sanjiang Plain from 1976 to 2013. Acta Ecol. Sin. 2018, 38, 3729–3740. [Google Scholar]
  24. Wang, P.; Wang, Y.J.; Liu, X.P.; Chen, X.; Kong, F.X. Ecological risk assessment of an ecological migrant resettlement region based on landscape structure: A case study of Hongsibu in Ningxia. Acta Ecol. Sin. 2018, 38, 2672–2682. [Google Scholar] [CrossRef]
  25. Zhang, Y.; Zhang, F.; Wang, J.; Ren, Y.; Ghulam, A.; Kung, H. Ecological risk assessment and prediction of Ebinur Lake region based on Land use/Land cover change. China Environ. Sci. 2016, 36, 3465–3474. [Google Scholar]
  26. Yu, Y.N.; Zhu, J.; Wu, S.H.; Zhou, S.L.; Li, B.J. Assessment of Land Ecological Risks Driven by Multi-sources: A Case Study of Sheyang County, Jiangsu Province. J. Nat. Resour. 2016, 31, 1264–1274. [Google Scholar]
  27. Zhao, W.W.; Fang, X.N. Landscape sustainability and landscape sustainability science. Acta Ecol. Sin. 2014, 34, 2453–2459. [Google Scholar]
  28. Jia, H.; Chen, H.; Mao, N.Z.; Nie, X. Landscape sustainable development in highly sensitive ecological fragile areas. Res Sci. 2018, 40, 1277–1286. [Google Scholar]
  29. Ren, Z.Y.; Sun, Y.J.; Wu, L.X. Comprehensive evaluation of ecological risk of land during 1990–2012 in Yulin City. Chin. J. Eco-Agric. 2017, 25, 656–664. [Google Scholar]
  30. Pan, X.; Shi, P.J.; Wu, N. Spatial identification of ecological risk and development balance in loess hilly and gully region: A case study of Lanzhou. Acta Sci. Circumstantiae 2018, 38, 380–389. [Google Scholar]
  31. Chen, H.; Lo´pez-Carr, D.; Tan, Y.; Liang, X.Y. China’s Grain for Green policy and farm dynamics: Simulating household land-use responses. Reg. Environ. Chang. 2016, 16, 1147–1159. [Google Scholar] [CrossRef]
  32. Chen, H.; Marter-Kenyon, J.; López-Carr, D.; Liang, X.Y. Land cover and landscape changes in Shaanxi Province during China’s Grain for Green Program (2000–2010). Environ. Monit. Assess. 2015, 187, 644. [Google Scholar] [CrossRef] [PubMed]
  33. Peng, J.; Xie, P.; Liu, Y.X.; Hu, X.X. Integrated ecological risk assessment and spatial development trade-offs in low-slope hilly land: A case study in Dali Bai Autonomous Prefecture, China. Acta Geogr. Sin. 2015, 70, 1747–1761. [Google Scholar]
  34. Wu, J.S.; Mao, J.Y.; Lin, Q.; Li, J.C. Urban growth boundary based on the evaluation of habitat quality: Taking the Yangtze River Delta as an Example. Sci. Geogr. Sin. 2017, 37, 28–36. [Google Scholar]
  35. Wang, X.F.; Wang, S.; Ren, L.; Zeng, Z.Z. Spatial distribution of rainstorm hazard risk based on EW-AHP in mountainous scenic area of China. Hum. Ecol. Risk Assess. 2017, 23, 925–943. [Google Scholar] [CrossRef]
  36. Wang, Z.T.; Yang, L.; Cai, G.J.; Mo, B.R.; Chai, C.S. A quantitative health evaluation of an eco-economy in the Semi-Arid Loess Plateau of China. Hum. Ecol. Risk Assess. 2015, 21, 1884–1902. [Google Scholar] [CrossRef]
  37. Liu, Y.X.; Wang, Y.L.; Peng, J.; Zhang, T.; Wei, H. Urban landscape ecological risk assessment based on the 3D framework of adaptive cycle. Acta Geogr. Sin. 2015, 70, 1052–1067. [Google Scholar]
  38. Wu, L.Y.; He, D.J.; You, W.B.; Deng, X.P.; Tan, Y.; Ji, Z.R. Disaster ecological risk assessment in Dongshan Island: Spatio-temporal evolution. Acta Ecol. Sin. 2016, 36, 5027–5037. [Google Scholar]
  39. Xu, Y.; Zhong, Y.X.; Feng, X.H.; Hu, L.T.; Zheng, L. Ecological risk pattern of Poyang Lake basin based on land use. Acta Ecol. Sin. 2016, 36, 7850–7857. [Google Scholar] [CrossRef]
  40. Graham, R.L.; Hunsaker, C.T.; O’neill, R.V.; Jackson, B.L. Ecological risk assessment at the regional scale. Ecol. Appl. 1991, 1, 196–206. [Google Scholar] [CrossRef] [PubMed]
  41. Li, J.G.; He, C.Y.; Li, X.B. Landscape ecological risk assessment of natural/semi-natural landscapes in fast urbanization regions—A case study in Beijing, China. J. Nat. Resour. 2008, 23, 33–47. [Google Scholar]
  42. Wong, C.P.; Jiang, B.; Kinzig, A.P.; Lee, K.N.; Ouyang, Z.Y. Linking ecosystem characteristics to final ecosystem services for public policy. Ecol. Lett. 2015, 18, 108–118. [Google Scholar] [CrossRef] [PubMed]
  43. Richard, S.; Rebecca, C.K.; Spencer, W. InVEST 3.3.0 User’s Guide[M/OL]. 2015. Available online: http://data.natural capital project.org/nightly-build/invest-users-guide/html/habitat quality.html (accessed on 10 September 2018).
  44. Mei, Y.J. The Study on the Quantification and Integrated Assessment of Landscape Services in the Fragile Area: The Study of Mizhi County of Shannxi Province; Northwest University: Xi’an, China, 2017. [Google Scholar]
  45. Liu, C.F.; Wang, C.; Liu, L.C. Spatio-temporal variation on habitat quality and its mechanism within the transitional area of the Three Natural Zones: A case study in Yuzhong county. Geogr. Res. 2018, 37, 419–432. [Google Scholar]
  46. Li, Y.; Huang, S.L. Landscape ecological risk responses to land use change in the Luanhe River Basin, China. Sustainability 2015, 7, 16631–16652. [Google Scholar] [CrossRef]
  47. Li, J.L.; Pu, R.L.; Gong, H.B.; Ye, M.Y.; Feng, B.X. Evolution characteristics of landscape ecological risk patterns in coastal zones in Zhejiang Province, China. Sustainability 2017, 9, 584. [Google Scholar] [CrossRef]
  48. Ha, K.; Ding, Q.L.; Men, M.X.; Xu, H. Spatial distribution of land use and its relationship with terrain factors in hilly area. Geogr. Res. 2015, 34, 909–921. [Google Scholar]
  49. Chang, Q.; Liu, D.; Liu, X.W. Ecological risk assessment and spatial prevention tactic of land destruction in mining city. Trans. Chin. Soc. Agric. Eng. 2013, 29, 245–254. [Google Scholar]
  50. Zhao, Z.N.; Zhang, T.Z. Integration of ecosystem services into ecological risk assessment for implementation in ecosystem based river management: A case study of the Yellow River, China. Hum. Ecol. Risk Assess. 2013, 19, 80–97. [Google Scholar] [CrossRef]
  51. Chen, L.D.; Wang, J.; Fu, B.J.; Qiu, Y. Land-use change in a small catchment of northern Loess Plateau, China. Agric. Ecosyst. Environ. 2001, 86, 163–172. [Google Scholar] [CrossRef] [Green Version]
Figure 1. Location of the study area.
Sustainability 10 03239 g001
Figure 2. Spatial heterogeneity of criteria layer and comprehensive ecological risk.
Sustainability 10 03239 g002
Figure 3. Section line of terrain and comprehensive ecological risk.
Sustainability 10 03239 g003
Figure 4. Categories of risk precaution in Dujiashi Gully at watershed level.
Sustainability 10 03239 g004
Table 1. Comprehensive ecological risk assessment framework.
Target LayerCriteria LayerIndex Layer/Weight
Comprehensive ecological riskRisk probabilityLandslide hazard risk/0.25
Flood hazard risk/0.23
Soil pollution risk/0.35
External pressure risk/0.17
SensitivityHabitat quality/1
ImpairmentLandscape loss index/0.62
Population density/0.22
Food production/0.16
Table 2. Sensitivity of habitat type to threat factor, maximum distance of influence and weight of threat factor.
Threat Factor
Habitat TypeHabitatResidentialTransportation CorridorsIndustrial LandWastelandFarmland
Water body0.90.90.850.90.40.3
Orchard0.30.50.50.50.30.3
Forest10.750.70.80.50.75
Grassland0.60.550.50.550.80.35
Max-distance/km0.80.810.250.25
Weight10.60.40.050.2
Table 3. Calculation methods for landscape loss index.
NameCalculation Methods
Landscape fragmentation index (Ci) C i = n i / A i
Landscape isolation index (Si) S i = A 2 A i n i A
Landscape dominance index (DOi) D O i = ( Q i / M i ) / 4 + L i / 2
Landscape disturbance index (Ei) E i = a C i + b S i + c D O i
Landscape vulnerability index (Fi)Construction land (grade 1; lowest), forest (grade 2), grassland (grade 3), orchard (grade 4), farmland (grade 5), water body (grade 6) and wasteland (grade 7; highest) [37]
Note: ni is the number of patches in the ith landscape; Ai is the area of the ith landscape; A is the area the entire landscape; Qi is the sample number of the ith pattern/total number of samples; Mi is the number of ith patches/total number of patches; Li is the area of the ith patches/area of samples; a, b and c represented the weights of landscape fragmentation, landscape isolation and landscape dominance index, respectively; and a + b + c = 1. As suggested in the literature [39], a = 0.5, b = 0.3 and c = 0.2 in this study. The landscape vulnerability index for landscape types was obtained after the grades of vulnerability were normalized.

