Assessing Urban Fragmentation at Regional Scale Using Sprinkling Indexes
by
 , and
, and
Lucia Saganeiti
1,* ,
,
Antonella Favale
1,
Angela Pilogallo
1,
Francesco Scorza
1 and
and
Beniamino Murgante
1,2
1
School of Engineering, University of Basilicata, 85100 Potenza, Italy
2
Environmental Observatory Foundation of Basilicata Region (FARBAS), Corso Vittorio Emanuele II n. 3, 85052 Marsico Nuovo (PZ), Italy
*
Author to whom correspondence should be addressed.
Sustainability 2018, 10(9), 3274; https://0-doi-org.brum.beds.ac.uk/10.3390/su10093274
Submission received: 31 July 2018
/
Revised: 4 September 2018
/
Accepted: 11 September 2018
/
Published: 13 September 2018
(This article belongs to the Special Issue Sustainable Land Uses and Rural Governance)
Abstract
:Artificial land use trends could represent an effective indicator of the settlement process quality and could also provide information about the efficacy of protection and exploitation policies in natural and rural areas. This work discusses an analytic procedure for the time series investigation of urban settlement development at the regional scale to verify the nexus between urban growth and demographic trends connected with the phenomenon of land take. In Italy, since 1950, the land take phenomenon has been a consequence of several factors: urbanization, realization of transport infrastructures including ports, airports, and highways, and the enhancement of industrial and productive systems. We analyzed all these territorial transformations that create waterproof soil, and more generally, a transition from natural and semi-natural uses toward artificial land use. After World War II, the demographic growth and the consequent housing demand generated a strong urbanization process in the main poles of economic development areas in Italy. Since the early 2000s, the situation has completely changed and the land take phenomenon is no longer mainly based on real need for new urban expansion areas based on effective urban planning tools, but is strongly related to a scattered demand for new housing in a weak territorial spatial planning system not able to drive effective urban development that minimizes speculative real estate initiatives. This uncontrolled occupation of soil generated, in Italy, a landscape fragmentation called the urban sprinkling phenomenon, different from urban sprawl, which is a wider phenomenon characterized by disordered urban growth. The present document aims to assess how uncontrolled expansion in areas characterized by low settlement density can generate fragmentation. To define if the territory is affected by the urban sprinkling phenomenon, two 50-year time series concerning urban expansion of buildings and demographic trends are analyzed calculating population and building density indices and their variation over the years. The sprinkling index is used to analyze the variation in the fragmentation degree at two different scales (regional and municipal). Finally, we discuss the context where this phenomenon has developed, analyzing the buildings located in hydrogeological risk zones and protected areas, and the correlation between demographic changes and the degree of territorial fragmentation variation.
1. Introduction
Urban transformation has changed the concept of a city based on a center and suburbs surrounding it, with the space outside the urban area mostly characterized by rural landscapes. City boundaries are often unrecognizable, and it is possible to identify large urban regions where intermediate areas—generated by settlement dispersion—develop continuously and create unsustainable criticalities in terms of urban services management and consequent quality of life decline.
Many authors have analyzed the urban sprawl phenomenon [1,2,3,4] from different viewpoints, producing a shared definition: “the spreading of urban developments (such as houses and shopping centers) on undeveloped land near a city”(Merriam Webster) [5]. The urban sprawl phenomenon concerns the fast and disordered growth of the city, mainly concentrated in suburban areas with a low population density affecting rural areas located at the borders of the urban area [6].
The rural landscape suffers particularly from the so-called sprinkling phenomenon, which fragments the territory in many patches, often distant from each other, that struggle to be connected with the main service centers. The sprinkling phenomenon can be defined as, “a small quantity distributed in drops or scattered particles” [7]. This phenomenon is characteristic of the Italian peninsula and also of other territories of Europe, and mainly concerns territories with very low population density as defined through appropriate indicators [8,9]. It can be considered as a sort of “pulverization” of the territory.
Another important aspect is the urban fragmentation phenomenon, which involves the transformation of large patches of natural habitats into smaller ones (fragments) that tend to be isolated from the original [4,10]. In this specific case, urban fragmentation is related to morphological changes in urban areas and their consequent dispersion in space [11].
Therefore, the analysis of urban fragmentation represents one of the main component of the research on land take [1,12]. A key focus regarding the spatial assessment of urban sprawl is the application of spatial analysis techniques and indexes allowing the semi-automatic interpretation of available urban fabric data. At the regional scale, sprinkling indexes represent a robust indicator to detect and classify the urban sprawl phenomena according to the sprawl model [13,14,15,16], which has been used to characterize European urban development trends. Among the main information provided by this urban development model, it is possible to recognize the destructuring of settlement fabric, urban fragmentation, and natural landscape degradation.
If the rural landscape is the main area where the impact of urban sprinkling phenomena generates problems, from our research perspective [17], it was relevant to consider the fragmentation process of the natural landscape. We considered two main components: the disappearance of natural environments and reduction of their surface, and the progressive insularization and redistribution of residual environments in space. These processes depend on the increasing demand for new urban spaces connected with several uses (residential, services, leisure, productive, etc.) as a consequence of traditional policies preferring urban growth to reuse or renovate existing urban areas no longer suitable for contemporary standards.
It is common sense to preferentially build new residential neighborhoods, abandoning existing ones, than develop a new process or perform urban renovation. The first option aims at creating a compact urban structure and preserving natural and semi-natural uses of the territory; the second realizes a fragmented urban structure with negative consequences on public services distribution, infrastructure costs, social segregation, and landscape transformations, affecting both agricultural and natural soil. At the regional scale, ongoing urban development trends have led to the formation of small–medium urban centers, geographically decentralized from the main urban poles [18,19]. Among other effects, land cover dynamics influence the spatiotemporal evolution of Rural Urban Interface (RUI), which are the areas most prone to human-caused risks [20]. For instance, in 2015, wooded and non-wooded areas of the Basilicata region in Italy damaged by fire were 1.6/1000 km2 [21].
It is possible to confirm that sprawl and sprinkling phenomena influence urban sustainability through multiple impacts, assessable in terms of economic, social, and environmental costs [22]. More specifically, these phenomena in low population density areas generate a growth of public expenditures in providing services and an increase in the use of private cars, related to a deficit of accessibility [22,23,24].
As demonstrated by Romano et al. [25], urban sprinkling generates effects more serious than urban sprawl due to its irreversibility (possible only in the long-term). This uncontrolled soil consumption generates landscape fragmentation assessable by the reduction in resilience of habitats, populations, and ecosystems [26]. The irreversibility of the phenomenon and the limited effectiveness of policies aimed at limiting its future evolution are elements of considerable concern [25].
The fragmentation is therefore a direct consequence of uncontrolled and often unregulated soil consumption. Frequently, this phenomenon is not correlated with housing demand and affects segments of territories that are not suitable for transformation, such as hydrogeological risk areas and zones protected by specific regulations such as network of nature protection areas in the territory of the European Union NATURA2000 sites.
In the present study, starting from the comparison of 50-year time series of built-up areas, demographic trends in building density and population density indices, and their variation over the years were calculated to determine if the urban sprinkling phenomenon is occurring in the Basilicata region in Italy.
The sprinkling (SPX) index [8] was then used to analyze the degree of fragmentation changes at two different scales: regional and municipal. The discussion concerns the context in which this phenomenon has developed, with reference to the correlation between demographic variation and the degree of fragmentation changes, to buildings located in hydrogeological risk zones and protected areas (NATURA2000 sites) and to land transformation policies. The conclusions highlight the obtained results and possible developments of this work.
2. Materials and Methods
2.1. Study Area
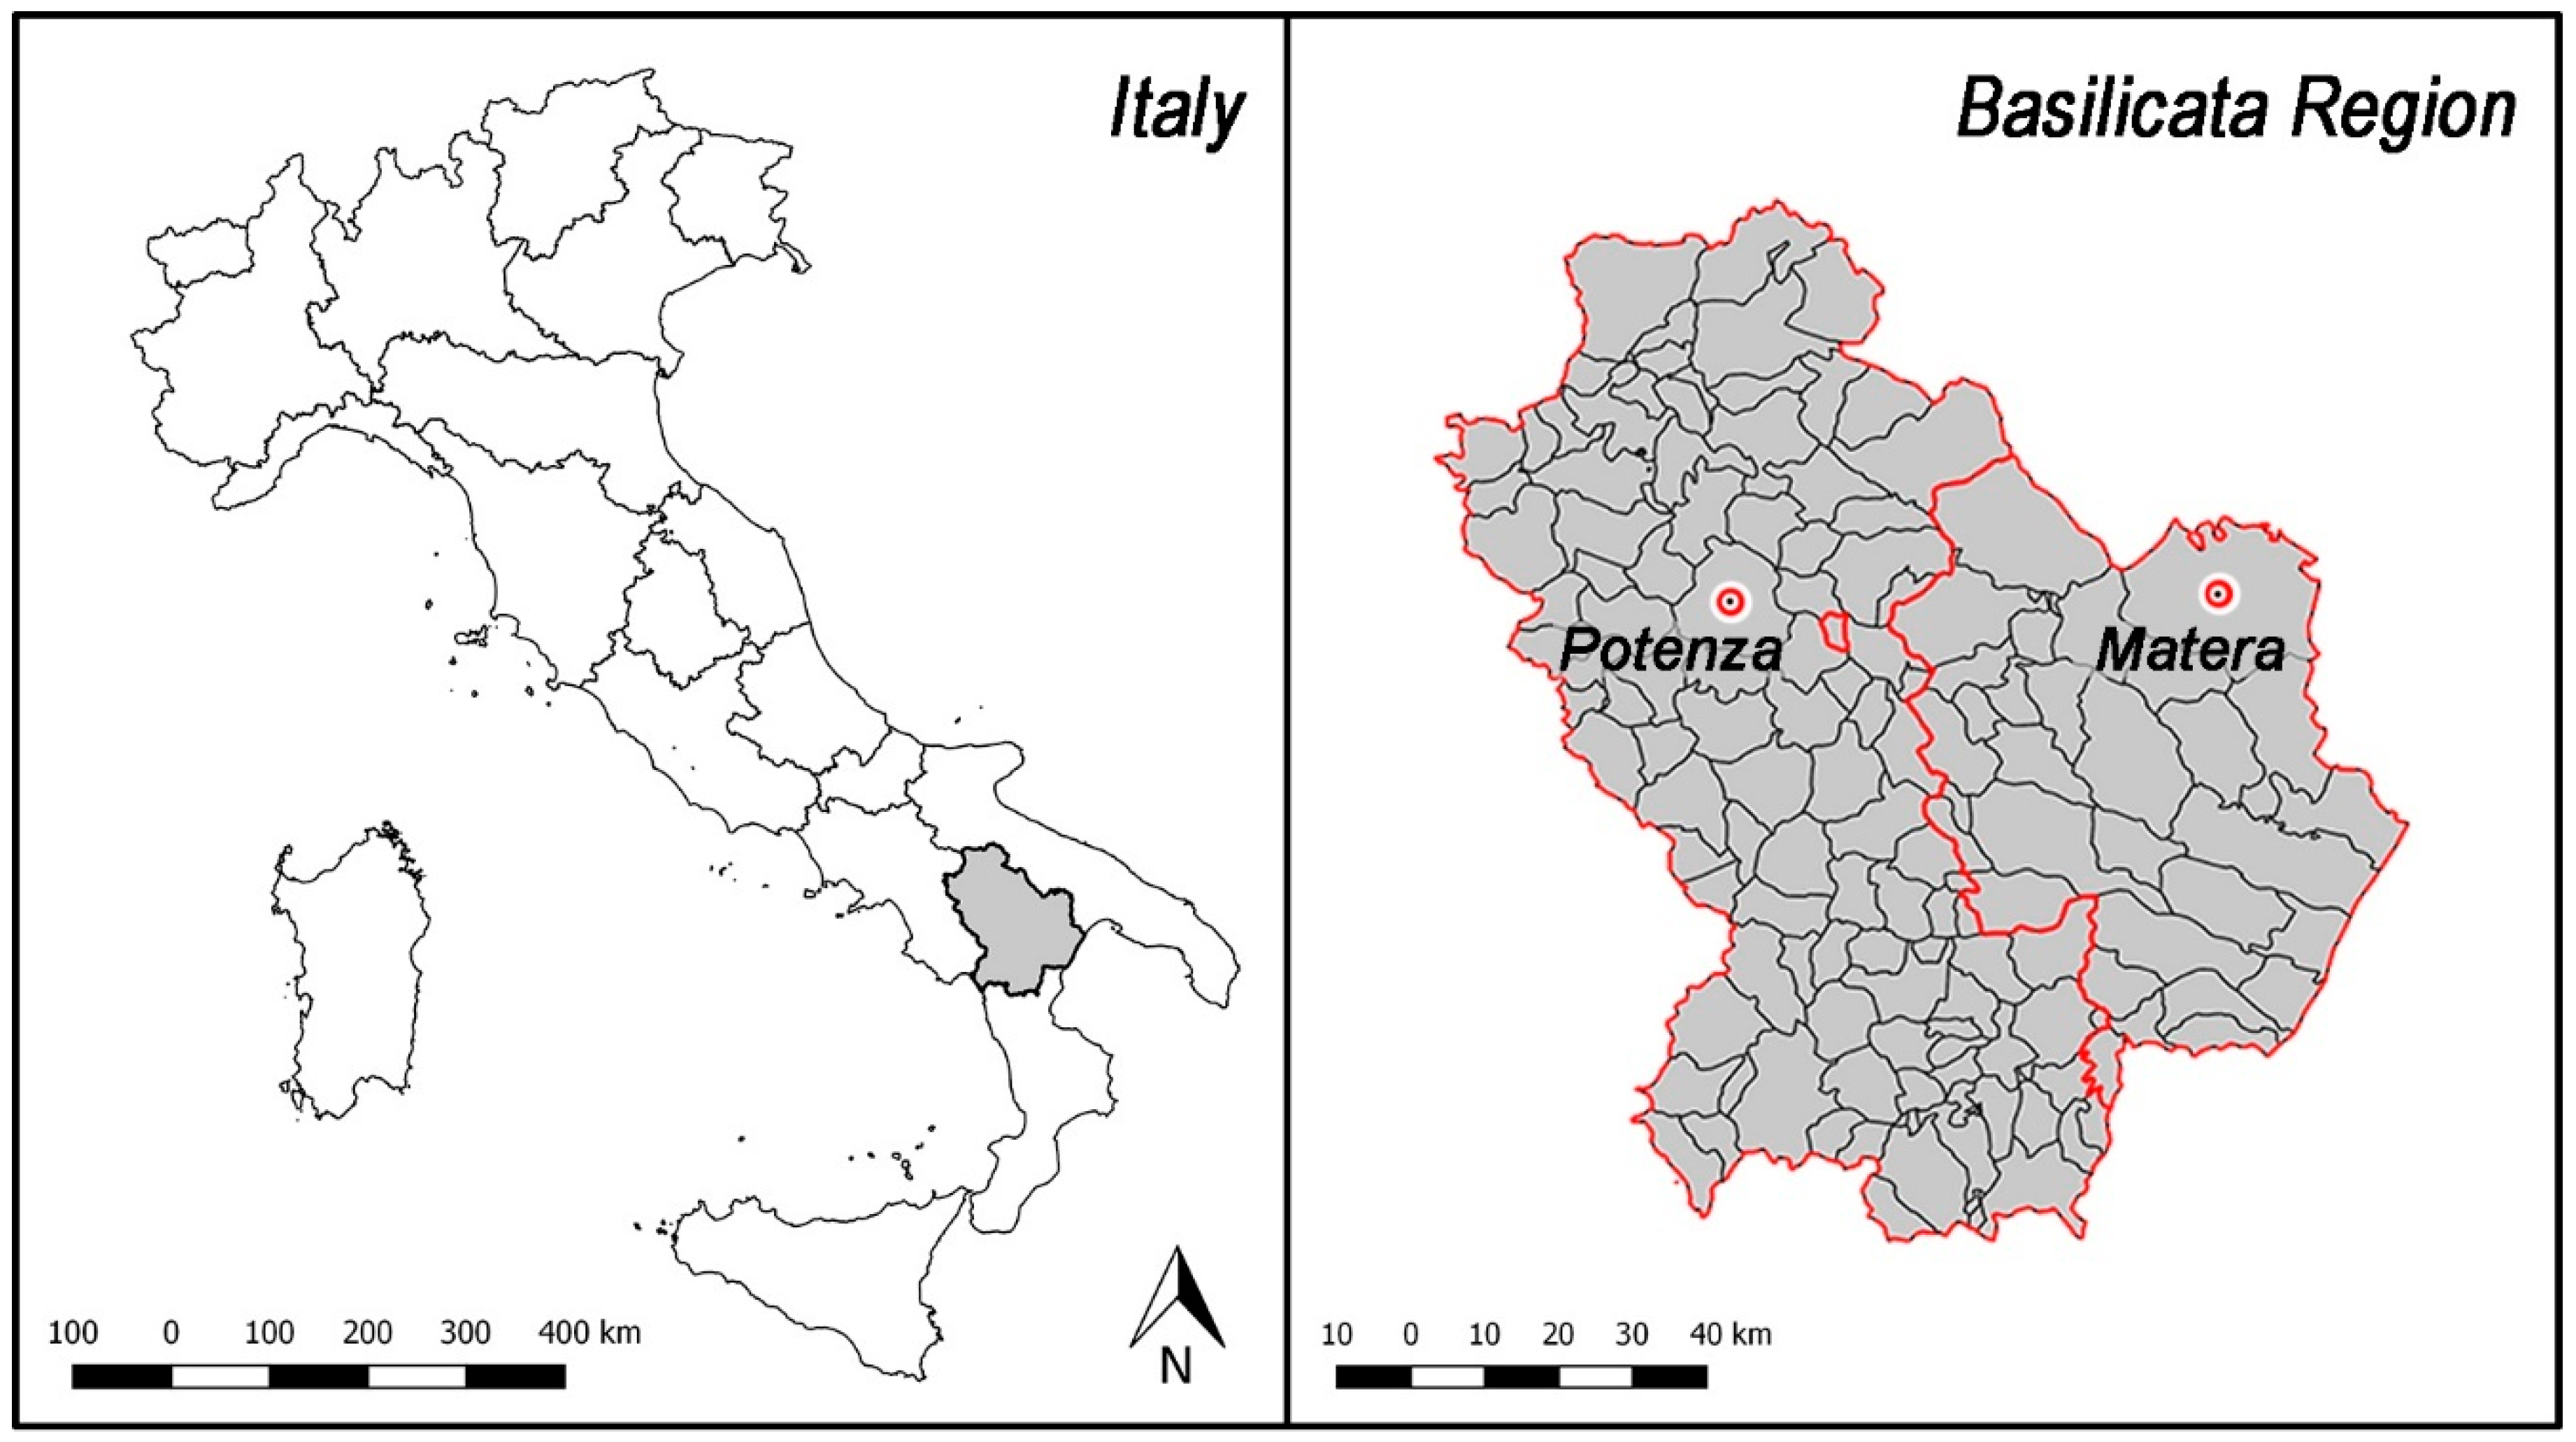
The study area included the whole territory of the Basilicata region in Southern Italy (Figure 1), which covers about 10,000 km2 and has a population of 570,365 inhabitants [27] with a density of 5793 inhabitants/Km2.
The population of Basilicata region accounts for about 0.9% of Italy’s total population and 2.7% of Southern Italy inhabitants. The region is not particularly attractive: foreign residents, at 20,783, are only 3.6% of the population. The population trend in the region has been declining for several years, with a natural rate tending to zero and disproportionately large internal migration outflows. Since 2007, the demographic has been increasingly influenced by migratory flows, predominantly outward directed, and a constantly decreasing birth rate [22].
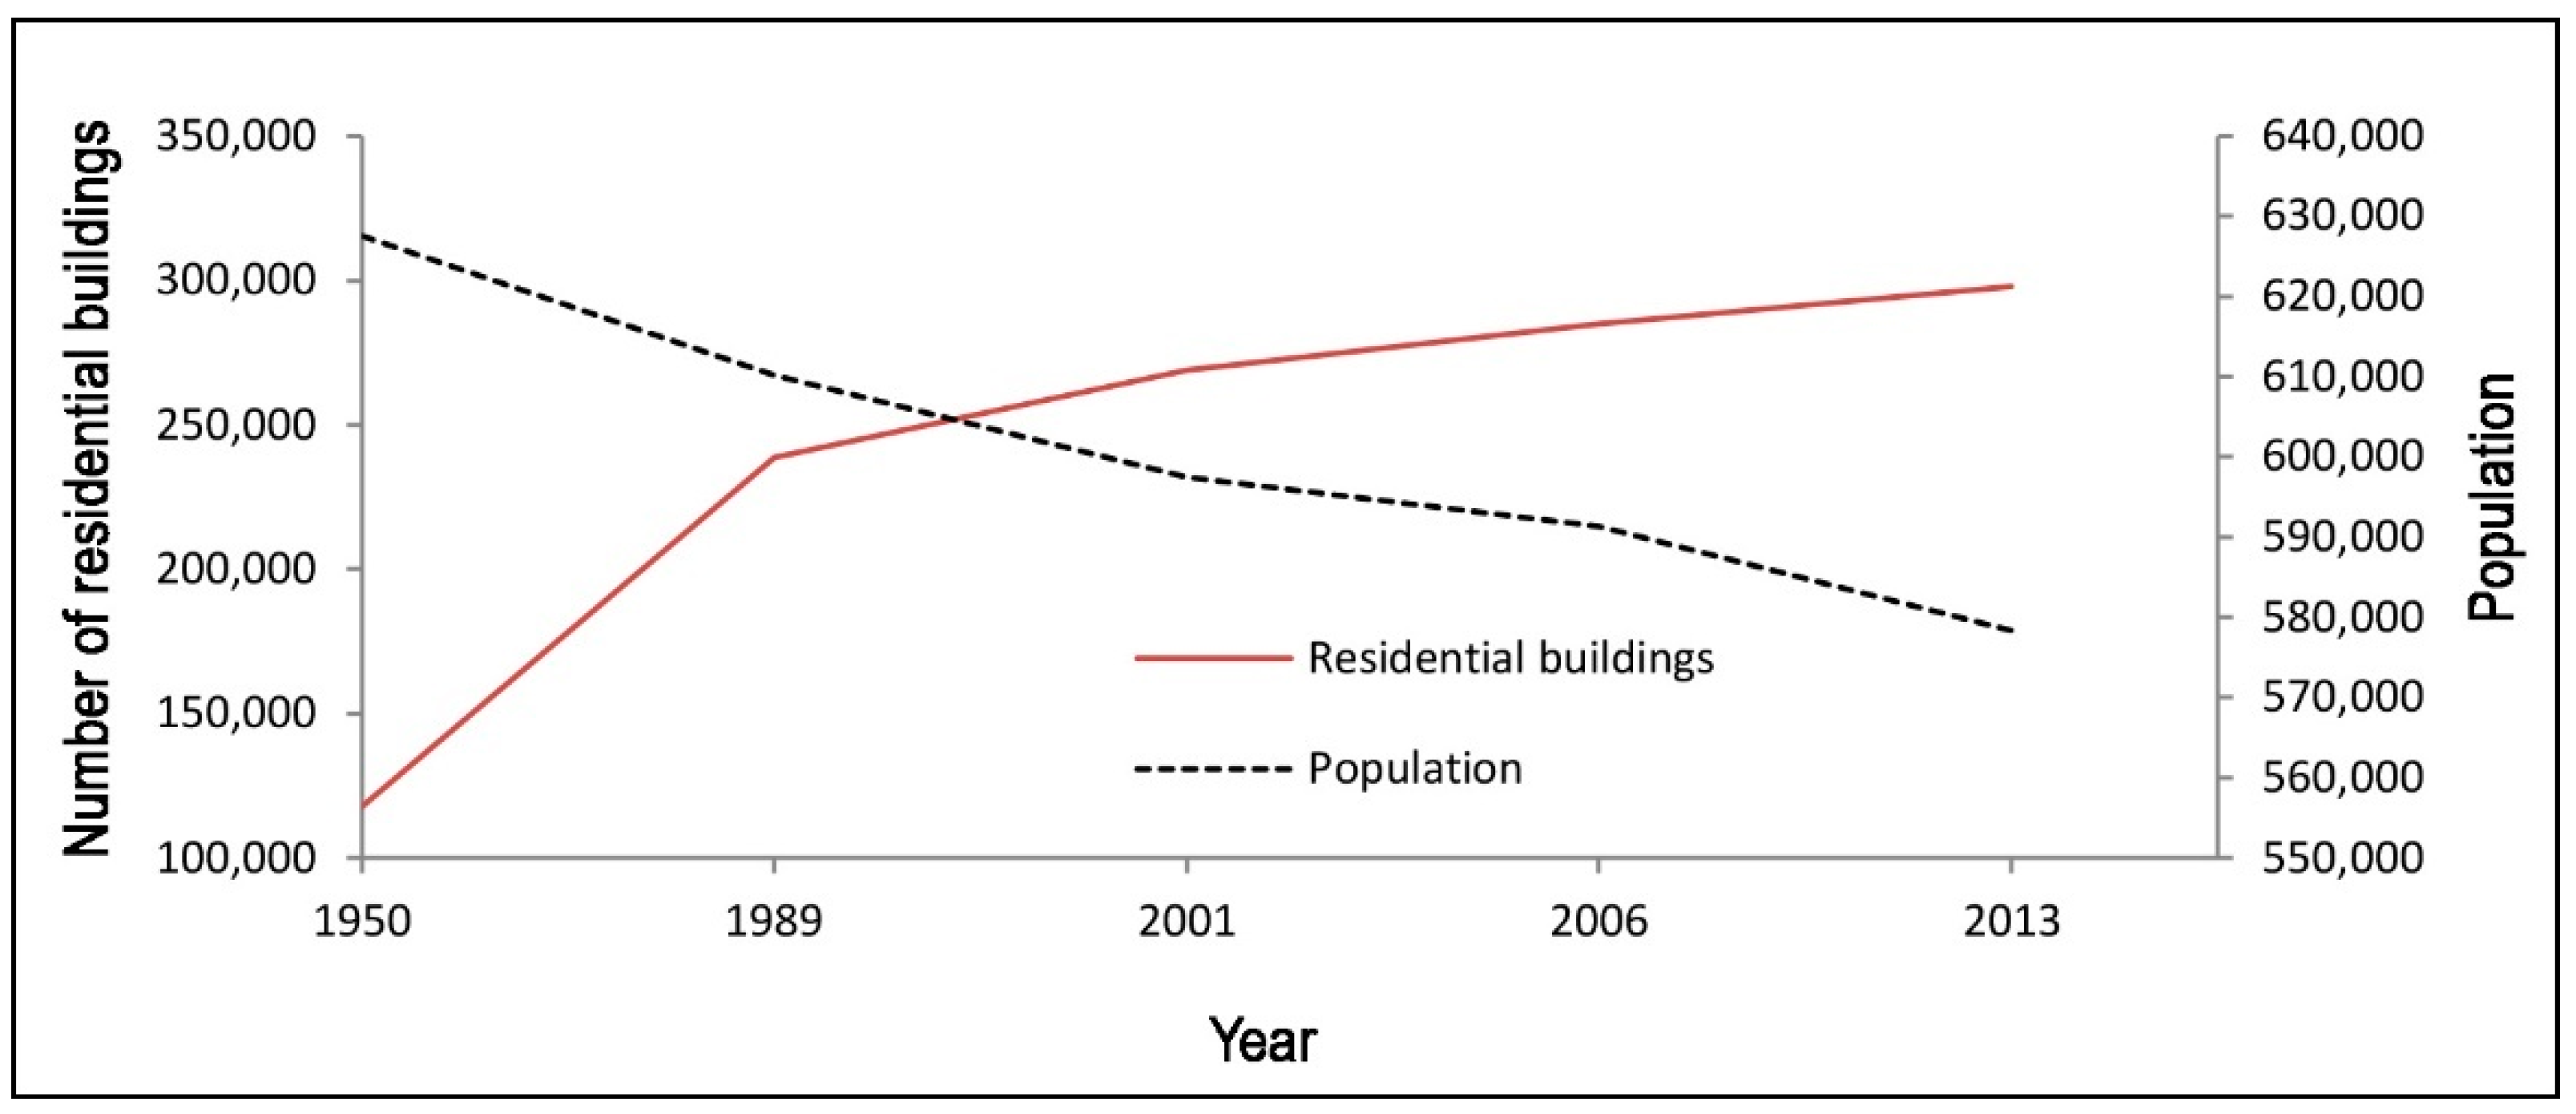
The population of the region has been continuously decreasing since the 1980s, completely in contrast with urban settlement development, which has increased during the same period (Table 1).
The Basilicata region is not immune to soil consumption, even though it is characterized by a low population density and a mostly rural environment. According to the Italian Institute for Environmental Protection and Research (ISPRA) forecast, in 2018, the percentage of land taken was around 3.4% [28]. This was due to the expansion of urban areas, the transformation of rural areas, and the use of agricultural land for energy production through the construction of ground-mounted photovoltaic systems.
The Basilicata region, due to its low population density outlines a useful case for analyzing the degree of urban fragmentation generated by uncontrolled expansion.
2.2. Data Source and Processing
The data sources we accessed for the analysis of the evolution of settlement system in the Basilicata region included: the geo-topographic regional database (Regional Spatial Data Infrastructure (RSDI) [29] Basilicata Region) and orthophotos from the national geoportal of the Ministry of the Environment and the Military Geographic Institute (IGM) cartography. These data sources are open and provide basic information generally available for all European regions. This approach enables the replicability of the study in other territorial contexts. Concerning the temporal dimensions of the analysis, selected sources allowed us to identify five time phases: 1950–1989–1998–2006–2013. These specific time intervals were chosen based on the availability of homogeneous data for the whole study area. The analysis was developed starting from the 1950s, which is considered the period of greatest economic and demographic growth in Italy.
According to the scale of the time lapse analyzed, several sources were used to create the database related to the built environment. The regional cartography (scale 1:5000) of the Basilicata region, updated in 2013, was considered the basis for spatial analysis. This spatial database is the most updated and accurate representation of the current built environment in Basilicata.
Starting from this representation, we proceeded backward, comparing this information with former cartography and orthophotos. Such comparison with orthophotos, available as a Web Map Service (wms) on the National Geoportal of the Environment Ministry [30], allowed us to build spatial time series analysis based on the following aerial photogrammetric surveys: 2006, 1998/2000, and 1988/1989. To analyze the urban growth that occurred after the Second World War, when the urban growth trend was the highest in Italy, we compared our spatial data with the 1:25,000 scale maps produced by the IGM in the 1950s. The comparisons of different maps that provided information on building distribution for different dates provided a method for quantitatively identifying the increase in the built environment over time. Although these maps are not detailed, they provide the oldest reliable technical representation of the Basilicata region, including buildings and urban spaces.
Demographic statistical analyses were based on the databases of the National Statistical Institute (ISTAT). These data were subsequently compared with the building distribution on different dates to identify the correlation between resident population trends and urban growth. To this end, the aggregation of the municipalities was analyzed, considering the population over the different years: 1950–1989–1998–2006–2013.
To discuss buildings located in hydrogeologically risky and protected areas, the following datasets were used (available from RSDI): (1) Hydrogeological Management Plan (PAI) 2016: perimeter of areas subjected to landslide risk on the basis of the Hydrogeological Structure Plan of Basilicata Basin Authority; and (2) NATURA2000 network sites and official list of protected areas (EUAP): the perimeter of sites of community importance (SCI), special area of conservation (SAC), and special protection areas (SPA), which are protected natural areas that are part of the Official List of the Ministry of the Environment.
The regional technical map, provided by RSDI, represents the built environment dated 2013 for the whole region. The RSDI map outlines infrastructure for territorial information, aligned with the indications of the Infrastructure for Spatial Information in Europe (INSPIRE directive), open to the participation of local authorities and local companies interested in territorial information systems, according to the principle of data sharing and cooperation and geographic services. All the available data are open.
Starting from this layer, we obtained the estimation of area and volume for each building. The comparison between this shape file, the orthophotos of the national geoportal, and the IGM maps allowed the creation of five datasets representing the built environment on different dates:
- (1)
- Volumetric units in 2013 deduced based on the regional technical map of Basilicata.
- (2)
- Volumetric units in 2006 deduced based on digital color orthophotos of the Italian territory with a resolution of 1:10,000 and viewable only at scales above 1: 100,000 in wms service.
- (3)
- Volumetric units in 2000 deduced from digital color orthophotos of the Italian territory with a resolution of 1:10,000 through wms service. Photogrammetric flights occurred from 1998 to 2000 according to the area.
- (4)
- Volumetric units in 1989 based on black and white orthophotos of the Italian territory with a resolution of 1:10,000 and viewable only at scales above 1:100,000 in wms service. Photogrammetric flights occurred from 1988 and 2000 according to the area.
- (5)
- Volumetric units in 1950 deduced based on the topographic map of Italy at a scale of 1:25,000 (IGM).
Following this temporal analysis, data concerning the resident population and the buildings classification were reported for each municipality.
The analysis of building historical evolution was carried out throughout the regional territory, obtaining results for all 131 municipalities. The limits of the dataset described above can be summarized in the following points: loss of data regarding possible increase in volumes, error due to differences in cartographic bases and their differences in scale, reproduction time, and differences in survey techniques.
Despite these limitations, visual analyses are preferred to remote sensing images analyses. Data on small buildings scattered in the rural landscape, the most useful for our analysis purposes, are often not detected using low-resolution images.
Considering only buildings for residential use, this classification allowed us to obtain the building density and to quantify the amount of buildings in risky and protected areas. For each municipality of the region, two indices were calculated: population density Dp (Equation (1)) and total amount of residential buildings per hectare Db, (Equation (2)). The indices were calculated for the five time phases, whereas their variation was calculated between 1950 and 2013.
2.3. Methodology
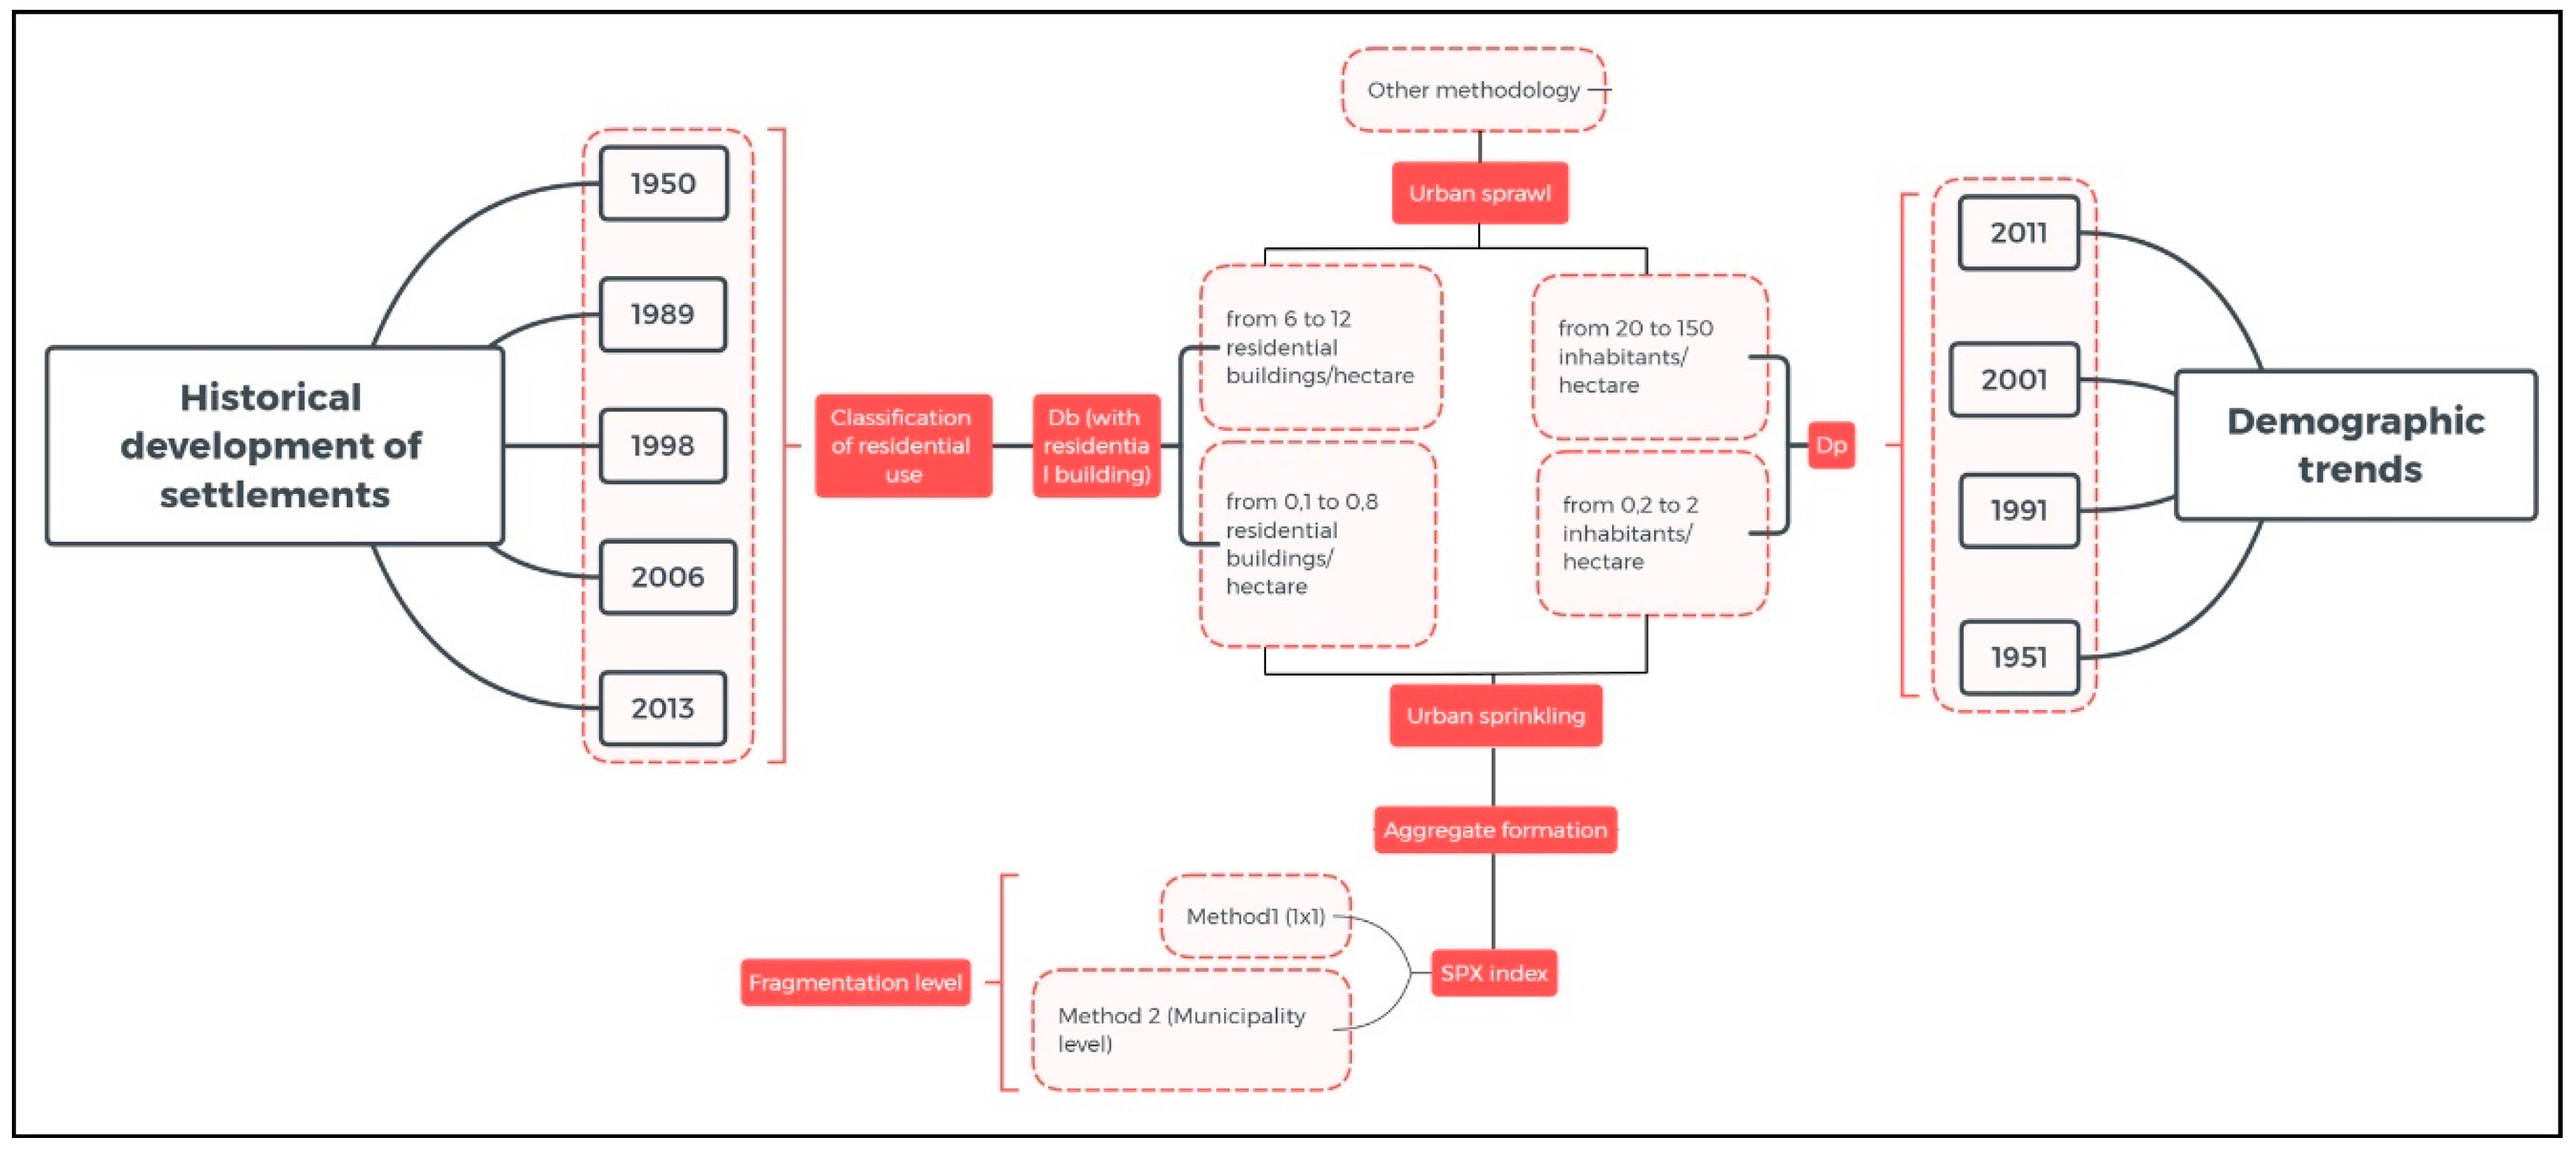
A diagram of the methodology adopted in this paper is shown in Figure 2. The historical evolution of built-up areas and demographic trends was analyzed. The urban sprinkling phenomenon was identified by comparing the respective results, distinguishing it from that of sprawl, not the subject of present study.
The two phenomena are described by specific indicators present in the literature [8]: population (Dp) and residential density (Db). Urban sprawl is characterized by Dp values between 6 and 12 residential buildings per hectare and Db values between 20 and 150 inhabitants per hectare. Urban sprinkling, on the other hand, has much lower densities: a Dp value between 0.1 and 0.8 residential buildings per hectare and Db between 0.2 and 2 inhabitants per hectare. These indices were calculated for each municipality for all the historical phases analyzed. Urban sprinkling occurred in all municipalities of the Basilicata region. Consequently, to define the degree of fragmentation, buildings were aggregated, and SPX index was calculated. The adopted methodology is outlined in detail in the following paragraphs.
2.3.1. Aggregates Formation
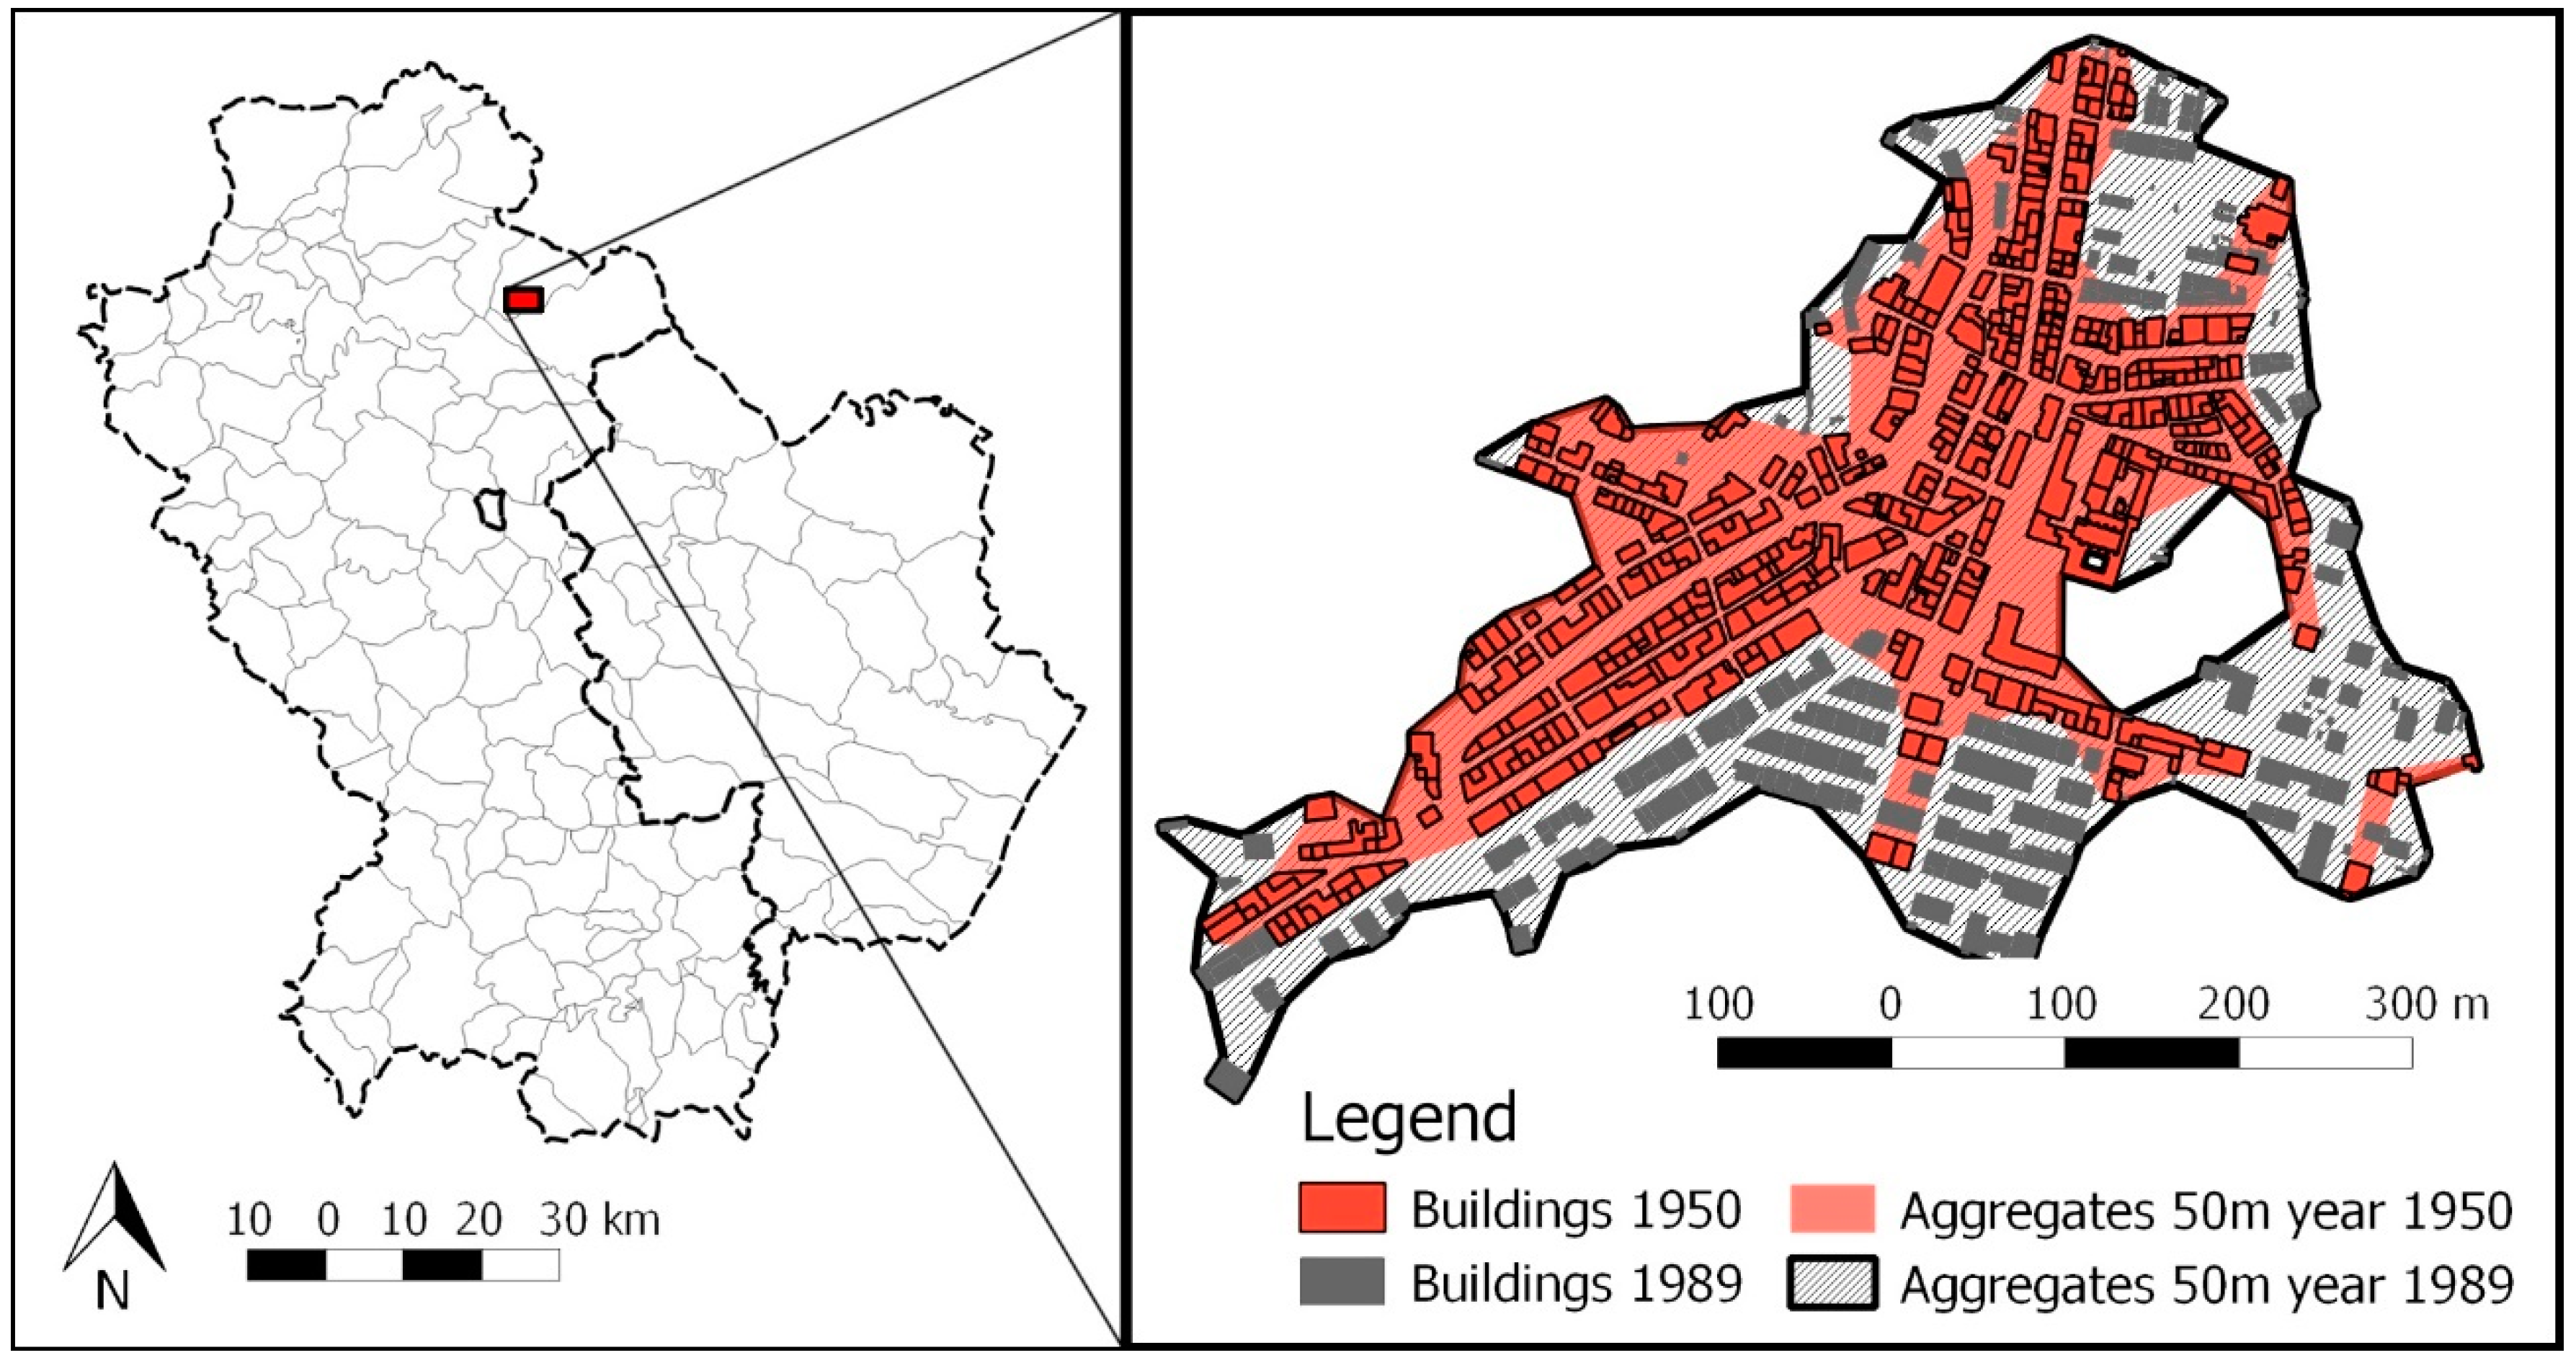
To understand the urban settlement evolution dynamics, buildings were aggregated. We transformed single building shapes in more complex polygons including multiple buildings in a fixed distance band. This phase helped us to understand how urban expansion occurred around the existing urban areas. Notably, an increase in the number of buildings does not always correspond to a higher number of aggregates. Indeed, in a rational urban growth model, only an increase in the aggregate area is expected. Therefore, two or more buildings can be considered an aggregate when the distances between the buildings’ polygons are less than a pre-established threshold. The 50-m aggregation was chosen among the various aggregates obtained with distances set at 50, 100, and 200 m, which allowed the perimetration of urban aggregates for each temporal phase. This distance was the most appropriate to represent the aggregation of buildings in the Basilicata region.
Figure 3 represents the evolution of the built environment considering aggregate extension between 1950 and 1989.
It is necessary to specify the difference between urban aggregates and population centers. The latter is defined as uninterrupted perimeters including all continuously built areas and all interclosed lots. In this context; however, we refer to aggregates simply as a new method of representing groups of buildings within an urbanized area.
2.3.2. SPX Index and Degree of Fragmentation
Many indices are available to calculate urban fragmentation: patch density, edge density, mean Euclidean nearest neighbor distance, area-weighted shape index, and aggregation index [31,32,33,34]. This research adopted the sprinkling (SPX) index [8,25] (mean Euclidean nearest neighbor distance), which analyses the fragmentation of a urban settlement through a purely geometric assessment.
The SPX index was applied for the first time by Romano et al. to divide the Umbria region in a regular grid with 1 km2 grids (Method 1). In subsequent experiments by other authors [35], the index was applied at the municipal scale, following the same principle of a regular grid, but for analyzing the extension of a municipal territory (Method 2).
Assuming the circular form as compact as possible, the index is essentially based on the calculation of distances between different urbanized areas. It is expressed with the following formula:
where xi and yi are the coordinates of the centroid of each polygon of urbanized areas falling in each cell of 1 km2 of the grid in Method 1, and in each municipality in Method 2, respectively; x* and y* are the coordinates of the centroid of the greater nucleus. In Method 1, the greater nucleus of each cell at each temporal instant is considered. In Method 2, the greater nucleus of each municipality at time t0 (i.e., the first temporal instant considered) is considered. R is the radius of the circular area of similar size to that of the sum of urbanized areas present, for each cell (Method 1) and for each municipality (Method 2).
In both methods, SPX has a range of allowable values from 0 to +∞. The higher the index, the higher the degree of fragmentation of the territory. The null value represents the optimal situation, difficult to find in reality—a sort of urbanization developed according to the shape of the circumference. The SPX index was calculated considering as fragmented elements areas occupied by buildings grouped together as aggregates.
Although both methods provide an overview of changes in land use in the region, each has advantages and disadvantages.
Method 1 allows the “measurement” of the phenomenon; however, the quantification itself cannot be considered univocal, as the translation of the grid would be sufficient to obtain different results.
Method 2 enables the evaluation of the phenomenon on a municipal scale, which is the same one used by decision-makers, even if it has not considered all the boundary conditions that may exist (which would explain the remoteness of a settlement from the nucleus of its own municipality) and the possible dependence on the size and shape of the surface of a municipality (since the value of the SPX index is a function of the distance between urban aggregates).
2.3.2.1. Method 1
The SPX fragmentation index was applied to the whole regional territory. The Basilicata region was divided into cells 1 km2 through a grid randomly located following the regional perimeter. The SPX index calculated using Equation (3) produced a value for each grid cell that, through the subdivision into six categories shown in Table 2, allowed us to identify the degree of territorial fragmentation. The values ranged between 0 (no fragmentation) and about 300,000 (high fragmentation).
2.3.2.2. Method 2
Method 2 enabled us to calculate the SPX index for each municipality in the Basilicata region. The index ranged between values of 0 (low fragmentation) to about 15,000 (high fragmentation). To guarantee an overall view, the index threshold values (divided by 1000) were identified for all the municipalities, thus allowing us to classify the fragmentation into five categories (Table 3).
3. Results
3.1. Building Density and Population Density
We classified the buildings for each of the five temporal phases and extrapolated those buildings characterized by residential use.
The graph presented in Figure 4 shows a comparison between residential buildings and buildings used for other purposes (agricultural, public-administrative, commercial, industrial, place of worship, residential, and others) for each date considered for the analysis. It emerged that the growth trend of the first phase (1950), corresponding to the national economic boom, was higher than the others.
Db and Dp were calculated for each date according to Equation (1). The Db analysis only concerned only residential buildings.
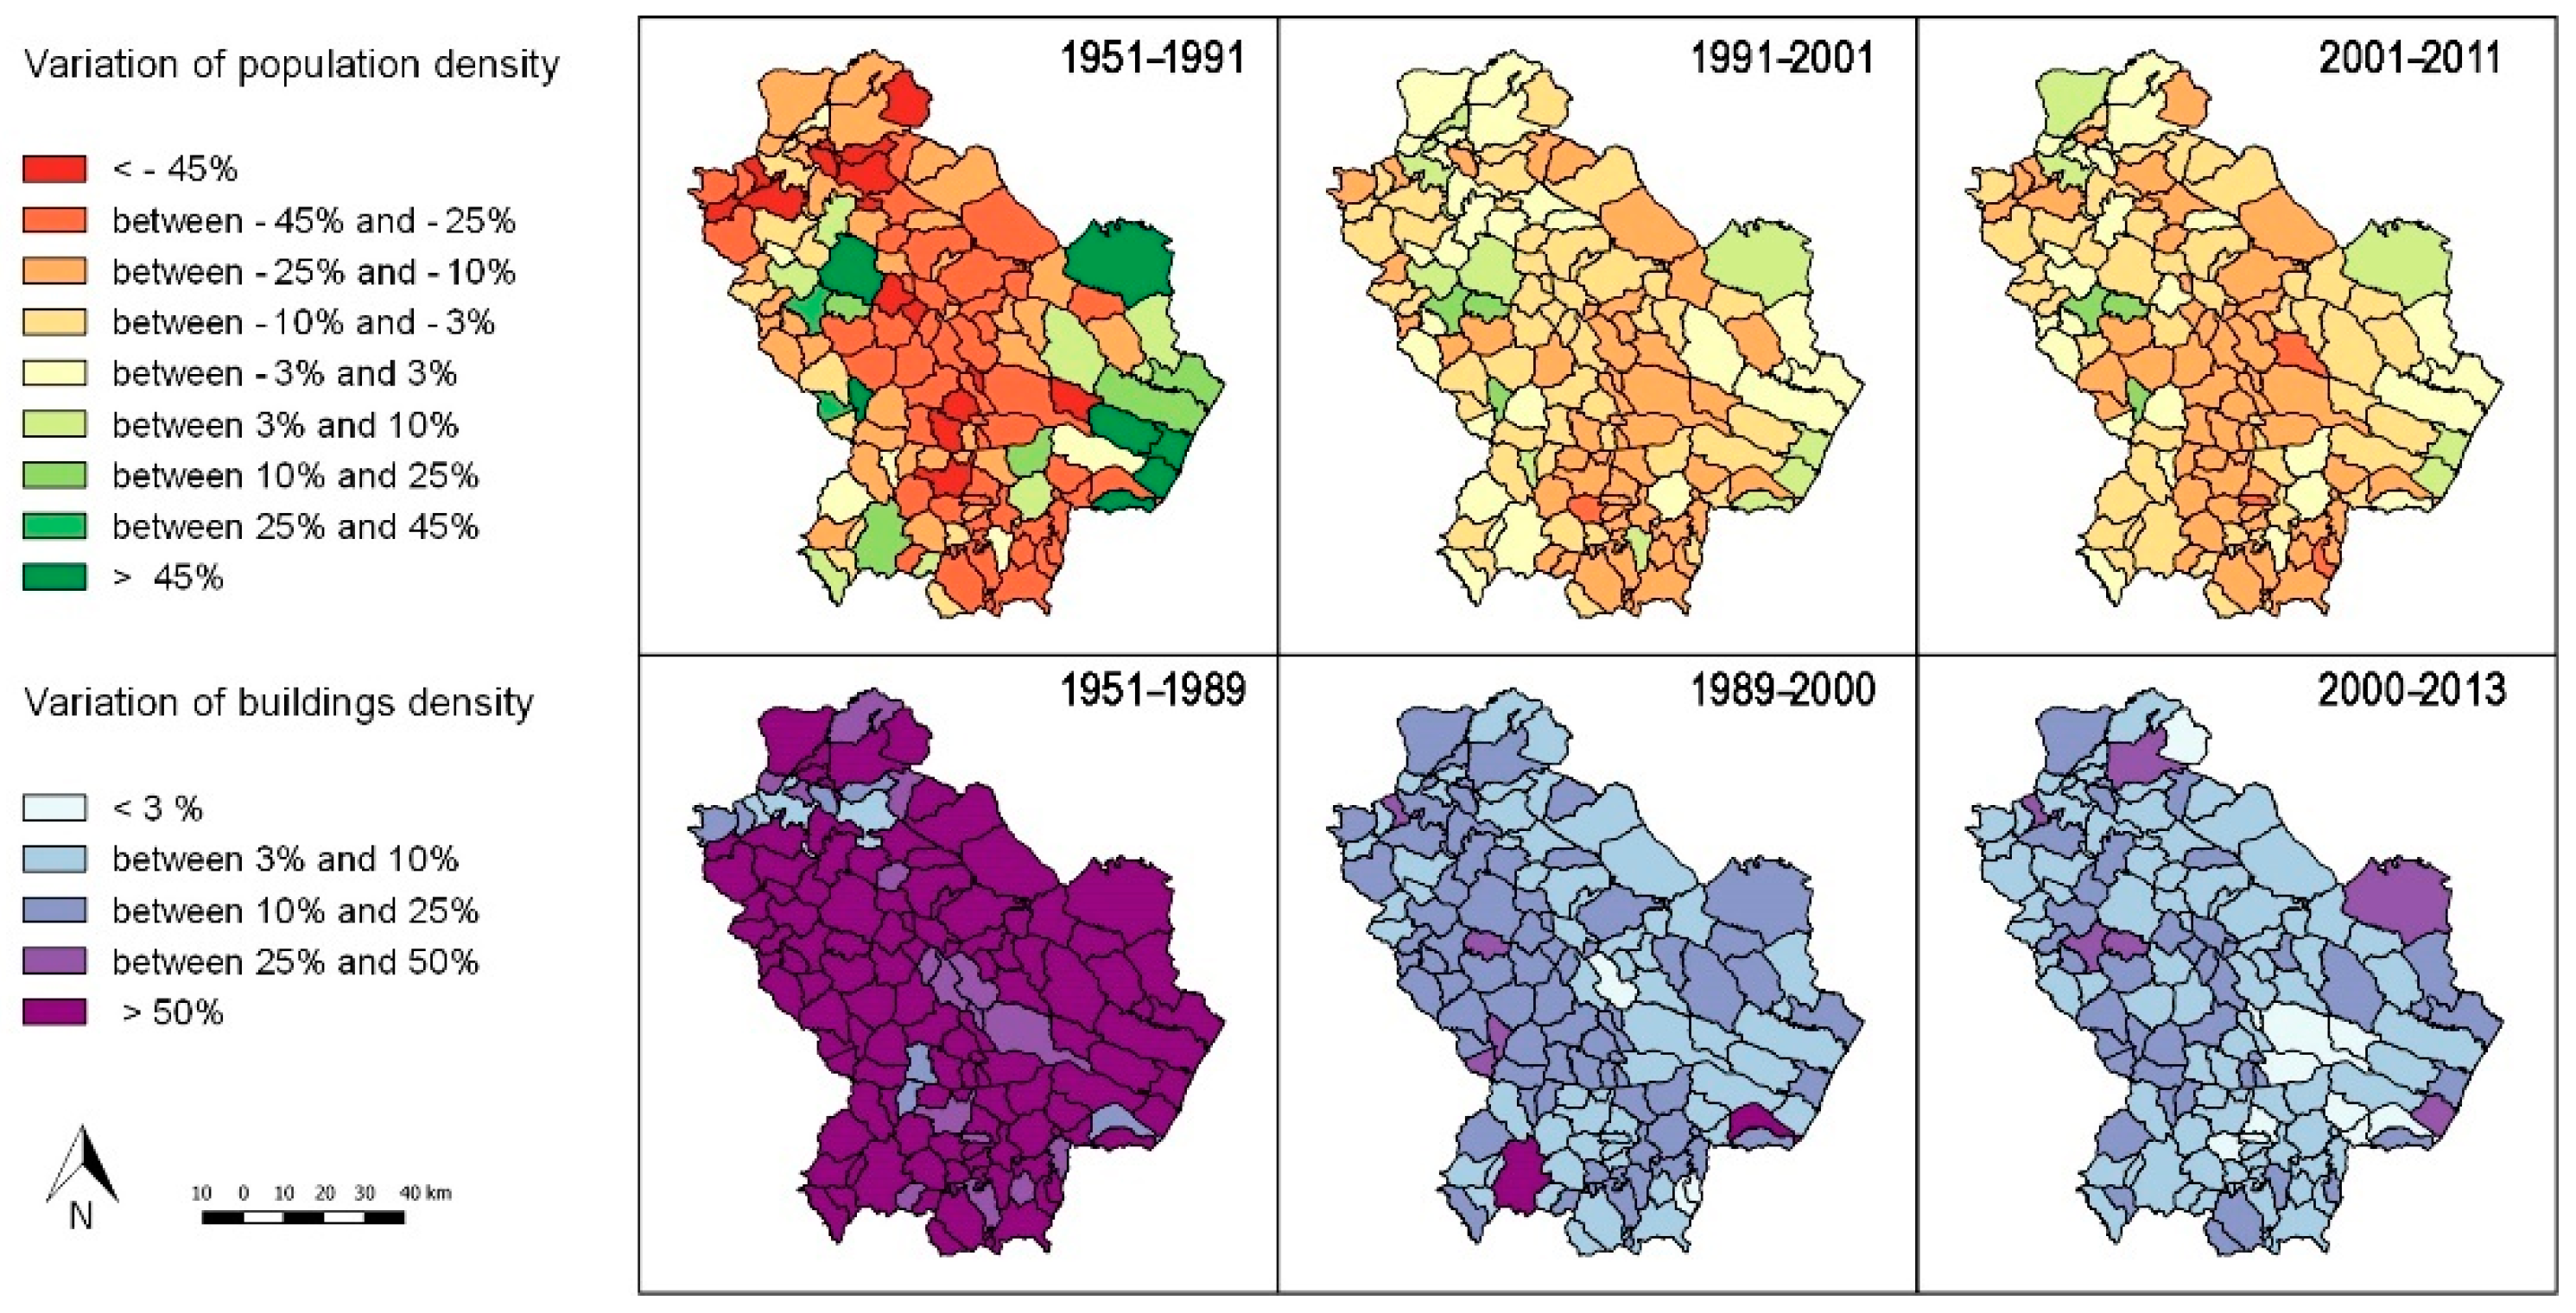
Table 4 shows the results grouped for the whole region and for each of the considered periods. Figure 5 shows a graphic comparison of the variation in the two indices: the first was based on census data in 1951–1991–2001–2011, and the second considered the phases of the historical evolution of settlements in 1951–1989–2000–2013. Data obtained show that between 1950 and 2013, in 108 of 131 municipalities, a negative demographic variation was not matched with a reduction in urban expansion, which, on the contrary, had a positive trend (Figure 6). In most municipalities, the expansion of housing was totally disproportionate to demographic change, highlighting that the development of settlements was not due to a real housing need.
We observed how the increase in residential building stock in the region did not fit the population trends. In particular, whereas resident population decreased from 1950 to 2013, the residential stocks increased over time. Such evidence allowed us to consider a preliminary assumption: the divergence between demand and supply of residential function at the regional level may depend on the lack of an urban regulation system, and be related to a specific demand for new residential buildings characterized by higher standards in technological and architectural features.
Discrepancies between demographic and settlement evolutions can also be examined using the maps provided in Figure 5. A comparison between the variation in population density at three different periods, the dates of ISTAT censuses, and the variation in building density in the corresponding three phases are represented.
In 2013, residential and building density had values of around 0.2–0.5 inhabitants per hectare and 0.1 buildings per hectare, respectively, for 107 of the 131 municipalities. Following the average territorial parameters defined by Romano et al. [7] for the identification of urban sprawl and urban sprinkling phenomena, a considerable part of the territory of Basilicata can be considered affected by urban sprinkling phenomenon when considering the Italian extended model. The remaining minimal part was affected by urban sprinkling phenomenon according to the Italian linear model.
3.2. Aggregates Formation and Degree of Fragmentation
For each of the five phases of settlement evolution, buildings were aggregated with a methodology explained in Section 2.3.1. by the non-orthogonal features and considering a minimum distance of 50 m.
In this paper, we chose to calculate the SPX index for the historical phases analyzed, considering both the regional territory divided with a regular grid and the entire municipal areas (Methods 1 and 2, respectively, introduced in Section 2.3.2.1. and Section 2.3.2.2.).
3.2.1. SPX Index: Method 1
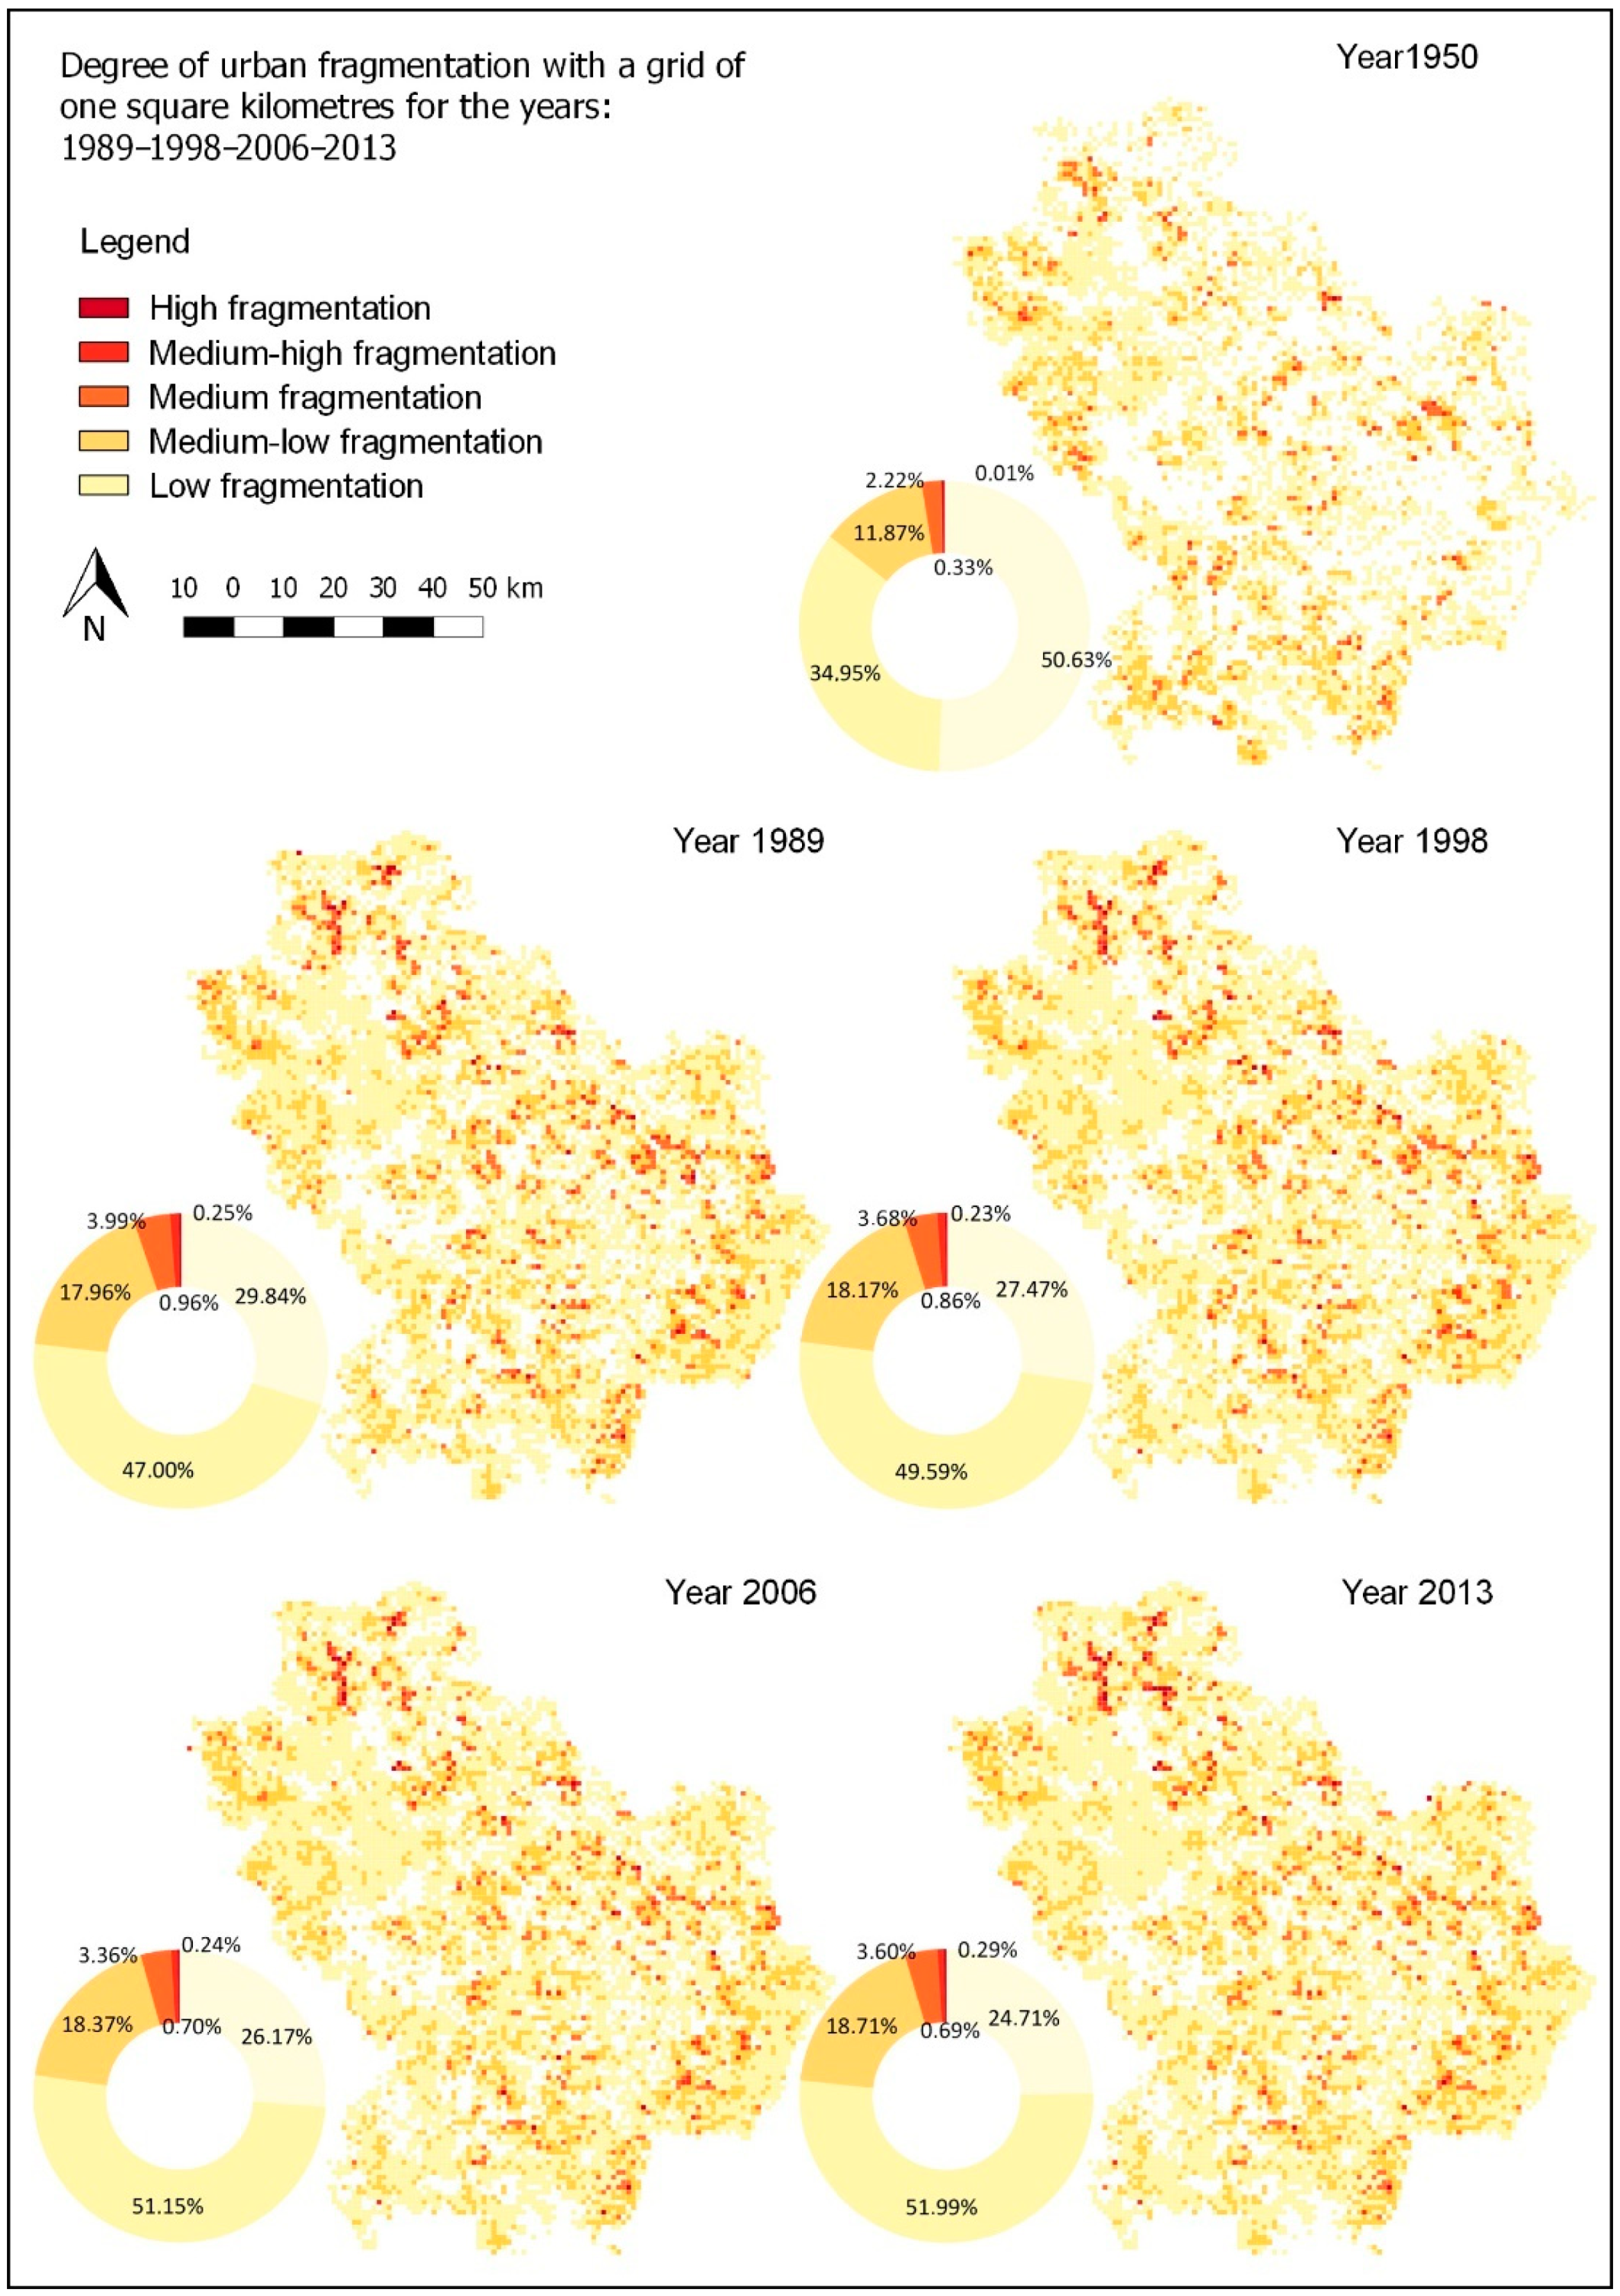
Figure 7 shows the percentage of regional area affected by sprinkling at different times. Since the processing was carried out on a 1 km2 grid, the same percentage is an expression of the actual km2 of surface area affected by fragmentation. A comparison among obtained graphs revealed that areas not affected by fragmentation decreased over years, while fragmented areas encreased. This implies an increase in land take. The greatest variation occured between 1950 and 1989, when unfragmented surfaces decreased from 50.63% to 29.84%. This variation was justified by the economic boom after the second post-war period, with a consequent increase in the demand for new settlements.
In some cases, grid cells characterized by low fragmentation at time t0 shifted to high fragmentation values at time t1 and vice versa. This means, in the first case, that new buildings in the cell were built following the sprinkling dynamics; whereas in the second case (from high to low fragmentation), new transformations affecting the cell occurred adjacent to the previous ones, compacting with the existing aggregates and reducing the fragmentation degree in that cell.
3.2.2. SPX Index: Method 2
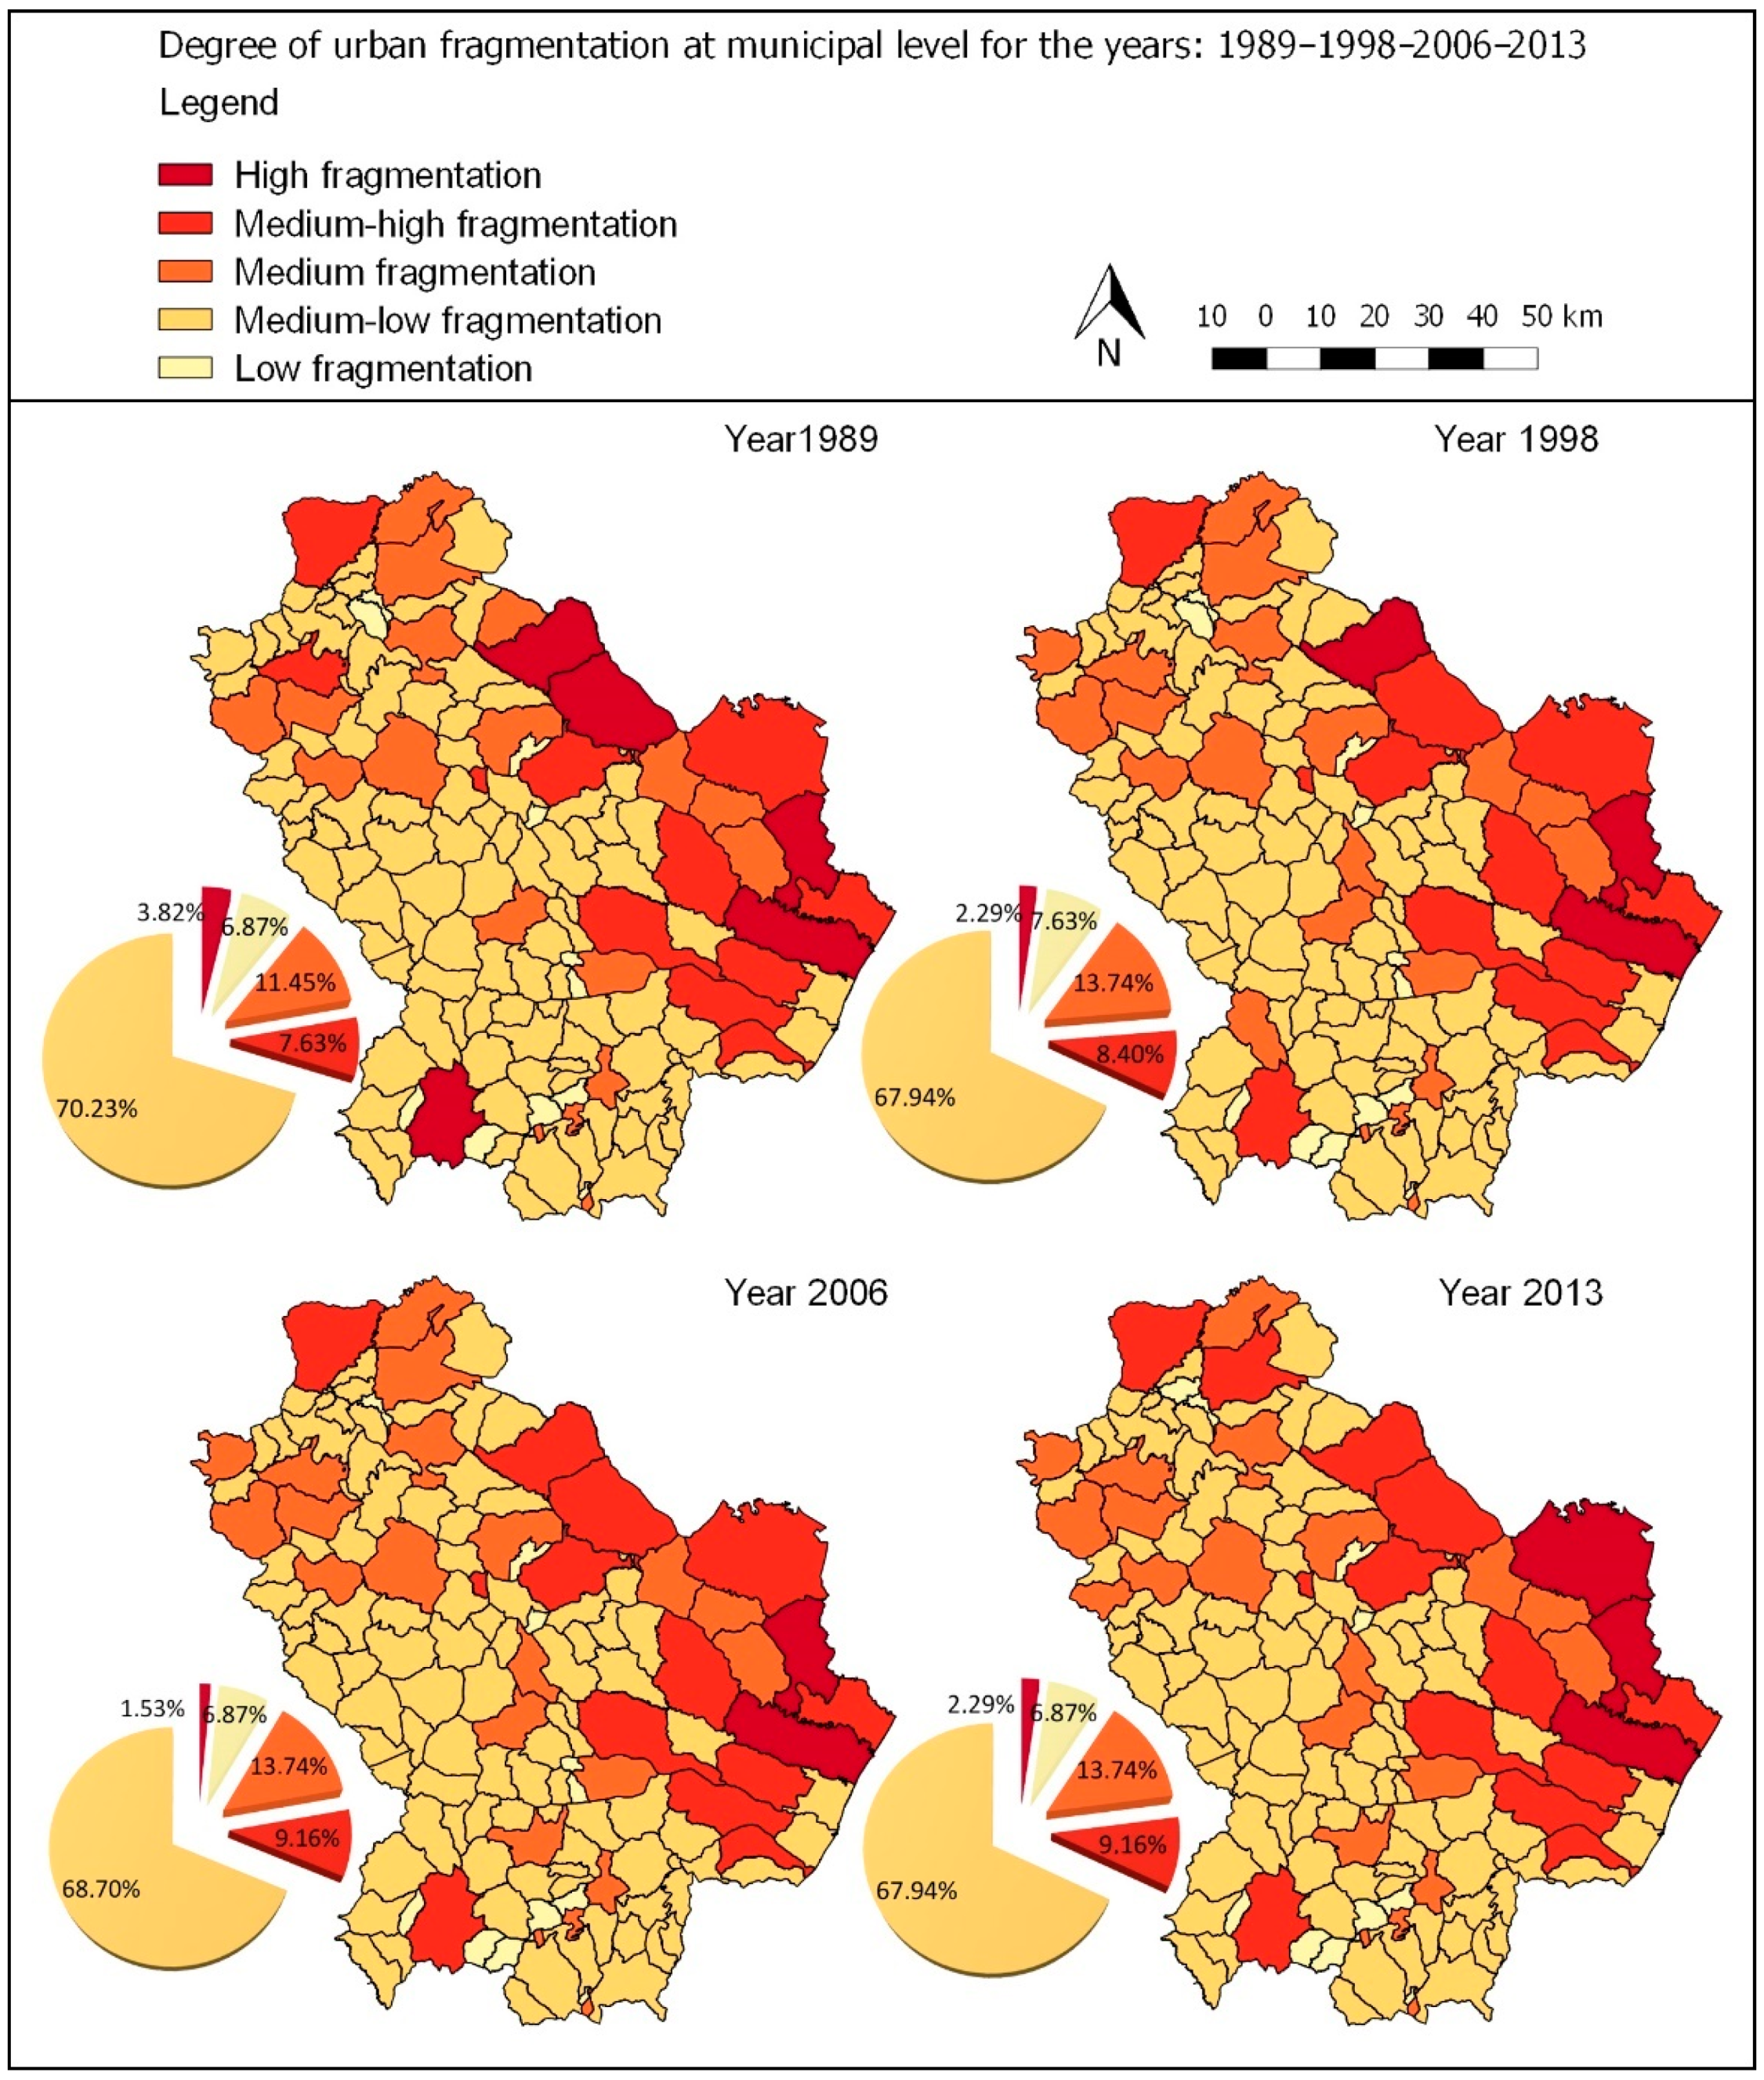
Four maps (Figure 8) were produced representing the degree of fragmentation at the municipal level for the years: 1989–1998–2006–2013. The fragmentation category assigned to the highest number of municipalities was medium-low. The main differences between the various time phases concern the transfer of some municipalities from one class to another. For example, between 1989 and 1998, the number of municipalities with medium-low fragmentation decreased from 92 to 89, while the number of municipalities with average fragmentation increased by the same amount. Between 1998 and 2013, the situation remained almost unchanged. The positive aspect is that between 1988/1989 and 2013, the number of municipalities characterized by high fragmentation decreased (from five to three), highlighting an urban compaction trend.
4. Discussion
Results obtained show that Basilicata has suffered a clear transformation of its territory between 1950 and 2013. Specifically, a significant increase in the number of residential buildings occurred: about half of the municipalities (59 out of 131) underwent a positive change between 100% and 200%; whereas in about 16% of the municipalities, an increase in the number of buildings with a percentage of more than 200% occurred. Since Basilicata is an area with a low population density, it was considered appropriate to relate the density index of buildings to the density index of the population. The comparison showed a disjointed trend, defined in the literature as “decoupling” [36,37]. In fact, against a significant demographic decline (107 municipalities showed a negative variation), between 1950 and 2013, there was an equally significant increase in residential buildings.
Even though the considerable discrepancy between 1950 and 1988–1989 data is justified by the fact that 1950 represented a period of economic growth and post-war reconstruction, in which settlement development derived from real housing needs; land consumption between 1988 and 1989 and 2013 is not justified and seems to be a response to an unsustainable culture of living that considers land as a product.
Through the calculation of the SPX sprinkling spatial index, the level of fragmentation at both the regional and municipal levels was assessed. Method 1 provided a quantitative evaluation of urban dispersion phenomenon in Basilicata, allowing us to measure fragmentation.
More specifically, it was possible to calculate the percentage of the territorial area affected by sprinkling compared with the total regional extension (Figure 7), after the calculation of an SPX index value for each cell of the grid and the definition of six categories of territorial fragmentation, equidistant from each other.
The application of Method 2 provided a qualitative assessment. It was possible to attribute a level of fragmentation to each municipality at different times, classified into five categories equidistant from them. This method did not provide numerical measurements of the sprinkling phenomenon, but allowed us to evaluate the tendency of each municipality to consume soil. Considering economic and settlement dynamics that characterized the 1950s, we preferred to consider the time span from 1988 to 2013. In this period, 51% of municipalities (67) had a positive percentage change in the SPX index, and therefore a more or less accentuated tendency to fragmentation. The remaining 49% showed, instead, a propensity for compaction. However, most municipalities were characterized by a medium or low level of fragmentation at any given time.
The comparison between SPX percentage change and demographic change (Figure 9) allows further considerations. Municipalities are distributed in four quadrants depending on their evolutionary dynamics. The fourth quadrant, containing most of the municipalities in the region, represents the worst situation. A negative demographic change is reflected in a positive SPX change. Although there was no real housing demand, land take continued to occur. The second quadrant, representing the best situation, contains a small number of municipalities (about 10%). A positive demographic change corresponds to a negative change in the fragmentation index. In other words, these municipalities have implemented, over the years, policies in favor of a compaction of the existing urban core.
Observing the two graphs in Figure 9 it can be seen how several municipalities moved from one quadrant to the others between two historical phases. For example, Tito’s municipality improved its behavior in terms fragmentation, shifting from the second quadrant to the first. Bella’s municipality, on the other hand, worsened its behavior by moving from the third quadrant to the fourth.
Among the multiple causes of the increase in the fragmentation degree, the uncontrolled urban expansion due to the lack of effective urban planning tools must be highlighted. Additionally, such phenomena brought people to settle new urban fabric on territorial areas not suitable for urban development, such as on hydrogeological risk zones and on NATURA2000 protected sites.
In the Basilicata region, there are 58 NATURA2000 sites accounting for 200,000 ha, corresponding to about 20% of the territorial area classified, as shown in Figure 10a.
Hydrogeological instability is one of the most important environmental problems. Such phenomena occur in almost all adjacent and included areas in urban centers located along the main and secondary reliefs of the Lucanian Apennines (Figure 10b). This vulnerability depends on many factors: susceptible natural conditions, such as geological, geomorphological, hydrogeological and seismic characteristics; and anthropogenic factors, among which land use and its evolution over time are of particular importance. Other aspects to be considered are huge deforestation and tillage operations that have affected mountains and hillsides over time, generating erosion and disruption processes.
The intersection between residential buildings and risk areas with a high hydrogeological risk and a high level of danger (R3) and areas with a very high hydrogeological risk and a very high level of danger (R4) of the landslide perimeter of PAI allowed us to determine the amount of buildings for residential use built in landslide risk areas. This elaboration is related to 2006 and 2013. It should be noted that the Basilicata region’s PAI was developed in accordance with Article 65 of Legislative Decree 152/2006.
From the data collected in Table 5, over seven years, the number of buildings located in risk areas R3 and R4 increased by 1.6%. Despite the high risk for human safety, construction activity continued in these areas. According to the ISPRA report of 2018 on hydrogeological risk [38] the percentage of buildings at risk in hazardous areas (P3 and P4) by PAI landslide is 7.5% of the total.
A similar trend was found analyzing protected areas listed on the EUAP, the SPA, and the SCI. The analyses were performed on 2006 and 2013 data. In Basilicata, 55 SCIs (54 of which have been designated as Special Conservation Areas; SCAs), and 17 SPAs (14 of which are type C sites, or SCIs/SCAs coinciding with SPAs) were identified (Figure 10a) [30]. There are, however, 14 EUAP [39] areas divided into Regional and Interregional Natural Parks (NRP), National Parks (NPZ), State Nature Reserves (RNS), and Regional Nature Reserves (RNR).
The tables in Appendix A (Table A1 and Table A2) show for each site: type, name, biographical region, date of last update for the SCI, the institution measure for EUAP, surface area of the site in hectares, municipality or municipalities where the area is located, and number of residential buildings in 2006 and 2013.
The designation of SACs ensures that specific conservation measures for a site are fully implemented, providing greater security for the management of the NATURA2000 network, due to its strategic role in achieving the objective of reducing loss of biodiversity in Europe by 2020. The tables also show significant cases, such as the SAC “Costa Ionica foce Agri” in the municipalities of Scanzano Jonico, and Policoro, which, from 2006 to 2013, underwent to an increase of about 300 buildings. Reasons for this significant change are that, in 1995, the European Commission proposed this site as a SCI, but the Basilicata region implemented its conservation measures only in 2015 (DGR 904 of 27 July 2015). In most cases, therefore, buildings were built before the designation of SACs or at least before the conservation measures were drawn up.
Another important issue that contributed to the territory fragmentation in Basilicata concerns the policies framework regulating urban and territorial transformations. Although the main national law in Italy (n. 1150/1942) on urban planning is dated 1942, the regional normative system is also quite out of date in Basilicata. Relevant delays in implementing a structured multi-scale planning system has occurred. The region approved its first territorial government law only in 1999, and since then, this law has not been fully implemented at the regional and municipal levels. Before 1968, no municipality had an approved urban plan, between 1968 and 1978 only 15 municipalities had a plan, and in 1985 only 26 municipalities approved a plan [40]. This means that in the greatest expansion period only a few municipalities adequately managed this phenomenon of urban growth. In fact, the high degree of fragmentation generated by the urban expansion that occurred between 1950 and 1989 was not managed by appropriate planning tools and was generally facilitated as a driver for economic growth (building sector industry is a major pillar of the Italian economy). In that period, sustainability objectives on landscape and natural land use protection were not on the agenda.
5. Conclusions
The information obtained using the proposed methodology for the analysis of urban development in the Basilicata region defines a fragmented picture of the study area.
Concerning the issue of new standards in residential building demand, the analyses confirmed that the majority of land take in Basilicata derived from residential building purposes. The results from 1950 to 2013 show an ever-increasing trend in the number of urban aggregates. This involves, on one side, a decrease in aggregate average area, and on the other, their increase in number. The whole territory has been subjected to different fragmentation levels of the settlement system. Even if the households’ motivations in creating new buildings for residential purposes was not the focus of this research, we may affirm that the progressive phenomena of depopulation and abandonment of historical settlements is a consequence of a social behavior oriented to use land properties for residential scope, more than for productive activities. The consequent urban expansion occurred with a pulverized growth model and this fragmented territorial system structure increased land take and has had a significant environmental impact [41,42,43,44,45].
The two methods proposed for the calculation of the SPX index, despite the different scales of application, produced very similar results. The regional territory was characterized, to the greatest extent, by a fragmentation degree varying from low, in the first case, to medium-low in the second case. These results show consistency with those obtained using the density index of aggregates (DA) [17], where most municipalities showed a low degree of fragmentation in both variation between 1950 and 1989 and between 1989 and 2013.
Intersection between the number of residential buildings and risk areas showed that 8.15% of the residential buildings in 2013 were in areas at high and very high risk, testifying how building activities occurred despite the provisions of the PAI. Similarly, the spatial comparison between SCIs, SACs, SPAs, EUAP areas, and residential buildings showed that local authorities were not able to contain the exploitation of these areas.
Our conclusion was assessed, although it was not possible to establish whether buildings were built before or after the designation of the protected areas, considering that construction was allowed in these areas by an assessment of project impact. This fact highlights the growth in the fragmentation degree of the settlements, even on portions of territory regulated by rules aimed to prevent or at least limit the transformations. Rules are, as discussed above, often issued late and in the presence of transformations already in place (so therefore not reversible). The phenomenon of sprinkling in the territorial context of Basilicata mainly affected rural areas that are progressively undergoing irreversible transformations. The results discussed in this work are representative of low-density settlement regions, where a weak presence of resident population places the impacts of land take in the background. The strongest effort must be directed at introducing a planning system orienting future territorial transformations toward a sustainable and landscape sensitive perspective. Further research development should examine data availability on building classifications and typologies, the relation between urban sprawl and road infrastructure development, and recent development in Renewable Energy Sources installations.
Author Contributions
All authors contributed equally to this work. In particular, experiment design and writing of the manuscript was developed jointly by all authors. However, A.F. and A.P. performed the experiments, while B.M., L.S., and F.S. focused on the interpretation of results and on the elaboration of the discussion.
Funding
This research was funded by Environmental Observatory Foundation of Basilicata Region (FARBAS) with the projects “Indicizzazione delle criticità ambientali regionali” (Indexing of regional environmental criticalities) grant number [INDICARE-2017], and “Metodologie avanzate per la valutazione del consumo di suolo” (Advanced methodologies for the evaluation of soil consumption) grant number [MEV-CSU-2018].
Acknowledgments
This research has been supported by the Environmental Observatory Foundation of Basilicata Region (FARBAS) and by the University of Basilicata.
Conflicts of Interest
The authors declare no conflicts of interest.
Appendix A

Table A1.
List of NATURA2000 sites: SCIs, SACs and SPAs with their municipalities of interest and number of buildings as of 2006 and 2013.
Table A1.
List of NATURA2000 sites: SCIs, SACs and SPAs with their municipalities of interest and number of buildings as of 2006 and 2013.
| Type of Site | Denomination | Biographical Region | Refresh | ha | SCI-SCA | SPA | Municipalities | BR 2006 | BR 2013 |
|---|---|---|---|---|---|---|---|---|---|
| C | Gravine di Matera | Mediterranea | 2012 | 6968.49 | SAC | SPA | Matera—Montescaglioso | 798 | 843 |
| B | Serra di Calvello | Mediterranea | 2012 | 1641.35 | SAC | Calvello—Marsico Nuovo | 17 | 17 | |
| C | Valle del Tuorno—Bosco Luceto | Mediterranea | 2010 | 75.35 | SAC | SPA | Savoia di Lucania | 0 | 0 |
| B | Abetina di Laurenzana | Mediterranea | 2012 | 324.39 | SAC | Laurenzana | 1 | 1 | |
| B | Abetina di Ruoti | Mediterranea | 2010 | 162.01 | SAC | Ruoti | 33 | 33 | |
| B | Acquafredda di Maratea | Mediterranea | 2010 | 552.25 | SAC | Maratea | 41 | 41 | |
| C | Bosco Cupolicchio | Mediterranea | 2010 | 1762.85 | SAC | SPA | Albano di Lucania—S.Chirico Nuovo—Tolve | 37 | 39 |
| B | Bosco di Rifreddo | Mediterranea | 2010 | 519.67 | SAC | Pignola | 10 | 11 | |
| B | Bosco Mangarrone (Rivello) | Mediterranea | 2012 | 369.52 | SAC | Rivello | 8 | 8 | |
| B | Faggeta di Moliterno | Mediterranea | 2010 | 242.56 | SAC | Moliterno | 2 | 2 | |
| B | Faggeta di Monte Pierfaone | Mediterranea | 2010 | 756.15 | SAC | Abriola—Sasso di Castalda | 13 | 25 | |
| B | Grotticelle di Monticchio | Mediterranea | 2010 | 342.18 | SAC | Atella—Rionero in Vulture | 3 | 3 | |
| B | Isola di S. Ianni e Costa Prospiciente | Mediterranea | 2010 | 417.67 | SAC | Maratea | 135 | 139 | |
| B | Lago La Rotonda | Mediterranea | 2010 | 70.97 | SAC | Lauria | 3 | 3 | |
| C | Lago Pantano di Pignola | Mediterranea | 2010 | 164.68 | SAC | SPA | Pignola | 0 | 0 |
| C | Lago S. Giuliano e Timmari | Mediterranea | 2010 | 2574.50 | SAC | SPA | Grottole—Matera—Miglionico | 107 | 138 |
| B | Marina di Castrocucco | Mediterranea | 2012 | 810.72 | SAC | Maratea | 197 | 203 | |
| C | Monte Paratiello | Mediterranea | 2010 | 1140.01 | SAC | SPA | Muro Lucano | 6 | 6 |
| C | Monte Vulture | Mediterranea | 2012 | 1903.98 | SAC | SPA | Atella—Melfi—Rionero in Vulture | 64 | 67 |
| B | Monte Li Foi | Mediterranea | 2012 | 970.32 | SAC | Picerno—Potenza—Ruoti | 5 | 5 | |
| B | Murge di S. Oronzio | Mediterranea | 2012 | 5459.95 | SAC | Roccanova | 172 | 191 | |
| C | Valle Basento—Ferrandina Scalo | Mediterranea | 2010 | 732.94 | SAC | SPA | Ferrandina—Miglionico—Pomarico | 13 | 13 |
| C | Valle Basento Grassano Scalo—Grottole | Mediterranea | 2010 | 881.98 | SAC | SPA | Calciano—Garaguso—Grassano—Salandra | 97 | 97 |
| B | Valle del Noce | Mediterranea | 2010 | 967.61 | SAC | Lauria—Trecchina | 103 | 117 | |
| C | Monte Coccovello—Monte Crivo—Monte Crive | Mediterranea | 2009 | 2981.11 | SAC | SPA | Maratea—Rivello—Trecchina | 78 | 86 |
| C | Lago del Rendina | Mediterranea | 2009 | 670.33 | SCI | SPA | Lavello—Melfi—Rapolla—Venosa | 27 | 27 |
| B | Lago Duglia, Casino Toscano e Piana di S.Francesco | Mediterranea | 2012 | 2425.89 | SAC | Francavilla sul Sinni—S.Severino Lucano—Terranova di Pollino | 11 | 14 | |
| B | Timpa delle Murge | Mediterranea | 2012 | 153.22 | SAC | Terranova di Pollino | 1 | 1 | |
| B | Serra di Crispo, Grande Porta del Pollino e Pietra Castello | Mediterranea | 2012 | 460.99 | SAC | Terranova di Pollino | 0 | 0 | |
| B | Monte Sirino | Mediterranea | 2012 | 2619.36 | SAC | Lagonegro—Lauria—Nemoli—Rivello | 32 | 34 | |
| B | Monte Raparo | Mediterranea | 2012 | 2019.97 | SAC | Castelsaraceno—S.Chirico Raparo | 23 | 23 | |
| B | Monte La Spina, Monte Zaccana | Mediterranea | 2012 | 1065.24 | SAC | Castelluccio Superiore—Lauria | 91 | 91 | |
| B | Monte della Madonna di Viggiano | Mediterranea | 2012 | 791.67 | SAC | Marsicovetere—Viggiano | 12 | 12 | |
| B | Monte Caldarosa | Mediterranea | 2012 | 583.63 | SAC | Viggiano | 1 | 1 | |
| B | Monte Alpi—Malboschetto di Latronico | Mediterranea | 2006 | 1561.08 | SAC | Castelsaraceno—Latronico—Lauria | 39 | 39 | |
| B | Madonna del Pollino Località Vacuarro | Mediterranea | 2012 | 982.15 | SAC | Terranova di Pollino | 7 | 7 | |
| B | Lago Pertusillo | Mediterranea | 2012 | 2042.04 | SAC | Grumento Nova—Montemurro—S.Martino D’Agri—Spinoso | 208 | 211 | |
| B | La Falconara | Mediterranea | 2012 | 70.69 | SAC | Terranova di Pollino | 3 | 3 | |
| C | Dolomiti di Pietrapertosa | Mediterranea | 2003 | 1312.52 | SAC | SPA | Accettura—Castelmezzano—Pietrapertosa | 164 | 195 |
| B | Bosco Vaccarizzo | Mediterranea | 2012 | 291.66 | SAC | Carbone | 1 | 1 | |
| B | Bosco Magnano | Mediterranea | 2012 | 1224.87 | SAC | Castelluccio Inf.—Chiaromonte—Episcopia—Fardella—Latronico—S.Severino Lucano—Viggianello | 2 | 2 | |
| B | Bosco di Montepiano | Mediterranea | 2012 | 522.79 | SAC | Accettura—Cirigliano—Pietrapertosa | 13 | 13 | |
| B | Bosco della Farneta | Mediterranea | 2012 | 297.96 | SAC | Noepoli—S.Costantino Albanese | 6 | 6 | |
| B | Monte Volturino | Mediterranea | 2012 | 1858.45 | SAC | Calvello—Marsico Nuovo | 11 | 12 | |
| C | Foresta Gallipoli—Cognato | Mediterranea | 2012 | 4288.78 | SAC | SPA | Accettura—Calciano—Oliveto Lucano—Tricarico | 46 | 48 |
| B | Piano delle Mandre | Mediterranea | 2013 | 333.00 | SAC | Terranova di Pollino | 5 | 5 | |
| B | Pozze di Serra Scorzillo | Mediterranea | 2013 | 25.83 | SAC | Terranova di Pollino | 0 | 0 | |
| B | Timpa dell’Orso-Serra del Prete | Mediterranea | 2013 | 2595.62 | SAC | Rotonda—Viggianello | 2 | 2 | |
| B | Valle Nera-Serra di Lagoforano | Mediterranea | 2013 | 288.45 | SAC | Terranova di Pollino | 0 | 0 | |
| B | Bosco di Chiaromonte-Piano Iannace | Mediterranea | 2013 | 1052.63 | SAC | Chiaromonte—Terranova del Pollino | 0 | 0 | |
| C | Bosco Pantano di Policoro e Costa Ionica Foce Sinni | Mediterranea | 2013 | 1794.10 | SAC | SPA | Policoro—Rotondella | 49 | 51 |
| B | Costa Ionica Foce Agri | Mediterranea | 2013 | 2414.68 | SAC | Policoro—Scanzano Jonico | 245 | 572 | |
| B | Costa Ionica Foce Bradano | Mediterranea | 2013 | 1155.66 | SAC | Bernalda | 114 | 289 | |
| B | Costa Ionica Foce Cavone | Mediterranea | 2013 | 2043.98 | SAC | Pisticci—Scanzano Jonico | 146 | 147 | |
| B | Costa Ionica Foce Basento | Mediterranea | 2013 | 1392.75 | SAC | Bernalda—Pisticci | 81 | 83 | |
| A | Appennino Lucano, Monte Volturino | Mediterranea | 2007 | 9736.45 | SPA | Abriola—Calvello—Laurenzana—Marsico Nuovo—Marsicovetere—Viggiano | 519 | 522 | |
| A | Appennino Lucano, Valle Agri, Monte Sirino, Monte Raparo | Mediterranea | 2012 | 37,491.91 | SPA | Aliano—Armento—Calvera—Carbone—Castelsaraceno—Gallicchio—Grumento Nova—Lagonegro—Lauria—Missanello—Moliterno—Montemurro—Nemoli—Rivello—Roccanova—S.Chirico Raparo—S.Martino D’Agri—Sarconi—Spinoso—Teana | 5442 | 5533 | |
| A | Massiccio del Monte Pollino e Monte Alpi | Mediterranea | 2012 | 88,052.45 | SPA | Calvera—Carbone—Castelluccio Inf.—Castelluccio Sup.—Castelsaraceno—Castronuovo S.Andrea—Chiaromonte—Cersosimo—Episcopia—Fardella—Francavilla sul Sinni—Latronico—Lauria—Noepoli—Rotonda—S.Costantino Albanese—S.Giorgio Lucano—S.Paolo Albanese—S.Severino Lucano—Senise—Teana Terranova—Valsinni—Viggianello | 19,593 | 20,161 |
Table A2.
List of EUAPs and their municipalities of interest and number of buildings as of 2006 and 2013.
Table A2.
List of EUAPs and their municipalities of interest and number of buildings as of 2006 and 2013.
| Type of EUAP | Denomination | Managing | Decree | ha | Municipalities | BR 2006 | BR 2013 |
|---|---|---|---|---|---|---|---|
| PNZ | Parco nazionale del Pollino | Ente parco | L. 67, 11/03/1988 L. 305, 28/08/1989 D.M. 31/12/1990 D.P.R. 15/11/1993 D.P.R. 02 | 88,585.95 | Calvera—Carbone—Castelluccio Inf.—Castelluccio Sup.—Castelsaraceno—Castronuovo S.Andrea—Chiaromonte—Cersosimo—Episcopia—Fardella—Francavilla sul Sinni—Latronico—Lauria—Noepoli—Rotonda—S.Costantino Albanese—S.Giorgio Lucano—S.Paolo Albanese—S.Severino Lucano—Senise—Teana Terranova—Valsinni—Viggianello | 19,740 | 20,309 |
| PNZ | Parco nazionale dell’Appennino Lucano—Val d’Agri—Lagonegrese | Ente Parco | D.P.R. 8/12/2007 | 68,917.31 | Abriola—Anzi—Armento—Brienza—Calvello—Carbone—Castelsaraceno—Gallicchio—Grumento Nova—Lagonegro—Laurenzana—Lauria—Marsicovetere—Marsico Nuovo—Moliterno—Montemurro—Nemoli—Paterno—Pignola—Rivello—S.Chirico Raparo—S.Martino D’Agri—Sarconi—Sasso di Castalda—Satriano di Lucania—Spinoso—Tito—Tramutola—Viggiano | 11,812 | 12,003 |
| PNR | Parco naturale di Gallipoli Cognato—Piccole Dolomiti Lucane | Ente parco | L.R. 47, 24/11/1997 | 27,047.88 | Accettura—Calciano—Castelmezzano—Oliveto Lucano—Pietrapertosa | 3841 | 4061 |
| RNS | Riserva naturale I Pisconi | ex A.S.F.D. Potenza | D.M. 29/03/1972 | 153.20 | Filiano | 20 | 20 |
| RNS | Riserva naturale Coste Castello | ex A.S.F.D. Potenza | D.M. 29/03/1972 | 23.47 | Avigliano | 11 | 11 |
| RNR | Riserva regionale Lago Pantano di Pignola | Provincia di Potenza | D.P.G.R. 795, 19/06/1984 | 145.21 | Pignola | 0 | 0 |
| RNS | Riserva naturale Grotticelle | ex A.S.F.D. Potenza | DD.MM. 11.09.71/02/03/1977 | 212.18 | Rionero in Vulture | 1 | 1 |
| RNS | Riserva naturale Marinella Stornara | ex A.S.F.D. Potenza | D.M. 13/07/1977 | 41.55 | Bernalda | 0 | 0 |
| RNS | Riserva naturale Metaponto | ex A.S.F.D. Potenza | DD.MM. 29/03/1972–02/03/1977 | 268.35 | Bernalda | 60 | 70 |
| RNR | Riserva regionale San Giuliano | Provincia di Matera | L.R. 39, 10/04/2000 | 2423.71 | Grottole—Matera—Miglionico | 103 | 119 |
| PNR | Parco archeologico storico naturale delle Chiese rupestri del Materano | Ente parco | LL.RR. 11, 03/04/1990/2, 07/01/1998 | 7577.02 | Matera—Montescaglioso | 1368 | 1493 |
| RNR | Riserva naturale orientata Bosco Pantano di Policoro | Provincia di Matera | L.R. 28, 08/09/1999 | 998.39 | Policoro—Rotondella | 18 | 20 |
| RNR | Riserva regionale Lago Piccolo di Monticchio | Provincia di Potenza | D.P.G.R. 1183, 30/08/1984 | 187.37 | Atella | 8 | 8 |
| RNS | Riserva naturale Agromonte Spacciaboschi | ex A.S.F.D. Potenza | D.M. 29/03/1972 | 45.47 | Filiano | 0 | 0 |
References
- Herold, M.; Couclelis, H.; Clarke, K.C. The role of spatial metrics in the analysis and modeling of urban land use change. Comput. Environ. Urban Syst. 2005, 29, 369–399. [Google Scholar] [CrossRef]
- Galster, G.; Hanson, R.; Ratcliffe, M.R.; Wolman, H.; Coleman, S.; Freihage, J. Wrestling Sprawl to the Ground: Defining and measuring an elusive concept. Hous. Policy Debate 2001, 12, 681–717. [Google Scholar] [CrossRef]
- Hasse, J.E.; Lathrop, R.G. Land resource impact indicators of urban sprawl. Appl. Geogr. 2003, 23, 159–175. [Google Scholar] [CrossRef]
- Jaeger, J.A.G. Landscape division, splitting index, and effective mesh size: New measures of landscape fragmentation. Landsc. Ecol. 2000, 15, 115–130. [Google Scholar] [CrossRef]
- Urban Sprawl. Definition of Urban Sprawl by Merriam-Webster. Available online: https://www.merriam-webster.com/dictionary/urban%20sprawl (accessed on 4 July 2018).
- Romano, B.; Zullo, F. The urban transformation of Italy’s Adriatic coastal strip: Fifty years of unsustainability. Land Use Policy 2014, 38, 26–36. [Google Scholar] [CrossRef]
- Romano, B.; Zullo, F.; Ciabò, S.; Fiorini, L.; Marucci, A. Geografie e modelli di 50 anni di consumo di suolo in Italia. Sci. Ric. 2015, 5, 17–28. [Google Scholar]
- Romano, B.; Zullo, F.; Fiorini, L.; Ciabò, S.; Marucci, A. Sprinkling: An Approach to Describe Urbanization Dynamics in Italy. Sustainability 2017, 9, 97. [Google Scholar] [CrossRef]
- Romano, B.; Zullo, F.; Fiorini, L.; Marucci, A.; Ciabò, S. Land transformation of Italy due to half a century of urbanization. Land Use Policy 2017, 67, 387–400. [Google Scholar] [CrossRef]
- De Montis, A.; Martín, B.; Ortega, E.; Ledda, A.; Serra, V. Landscape fragmentation in Mediterranean Europe: A comparative approach. Land Use Policy 2017, 64, 83–94. [Google Scholar] [CrossRef] [Green Version]
- You, H. Quantifying Urban Fragmentation under Economic Transition in Shanghai City, China. Sustainability 2015, 8, 21. [Google Scholar] [CrossRef]
- Nagendra, H.; Munroe, D.K.; Southworth, J. From pattern to process: Landscape fragmentation and the analysis of land use/land cover change. Agric. Ecosyst. Environ. 2004, 101, 111–115. [Google Scholar] [CrossRef]
- Di Palma, F.; Amato, F.; Nolè, G.; Martellozzo, F.; Murgante, B. A SMAP Supervised Classification of Landsat Images for Urban Sprawl Evaluation. ISPRS Int. J. Geo-Inf. 2016, 5, 109. [Google Scholar] [CrossRef]
- Brueckner, J.K. Urban Sprawl: Diagnosis and Remedies. Int. Reg. Sci. Rev. 2000, 23, 160–171. [Google Scholar] [CrossRef]
- Zanganeh Shahraki, S.; Sauri, D.; Serra, P.; Modugno, S.; Seifolddini, F.; Pourahmad, A. Urban sprawl pattern and land-use change detection in Yazd, Iran. Habitat Int. 2011, 35, 521–528. [Google Scholar] [CrossRef]
- Amato, F.; Pontrandolfi, P.; Murgante, B. Using Spatiotemporal Analysis in Urban Sprawl Assessment and Prediction; Springer: Cham, Switzerland, 2014; pp. 758–773. [Google Scholar]
- Saganeiti, L.; Pilogallo, A.; Scorza, F.; Mussuto, G.; Murgante, B. Spatial Indicators to Evaluate Urban Fragmentation in Basilicata Region; Springer: Cham, Switzerland, 2018; pp. 100–112. [Google Scholar]
- Foley, J.A.; DeFries, R.; Asner, G.P.; Barford, C.; Bonan, G.; Carpenter, S.R.; Chapin, F.S.; Coe, M.T.; Daily, G.C.; Gibbs, H.K.; et al. Global Consequences of Land Use. Science 2005, 309, 570–574. [Google Scholar] [CrossRef] [PubMed] [Green Version]
- Hennig, E.I.; Schwick, C.; Soukup, T.; Orlitová, E.; Kienast, F.; Jaeger, J.A.G. Multi-scale analysis of urban sprawl in Europe: Towards a European de-sprawling strategy. Land Use Policy 2015, 49, 483–498. [Google Scholar] [CrossRef] [Green Version]
- Amato, F.; Tonini, M.; Murgante, B.; Kanevski, M. Fuzzy definition of Rural Urban Interface: An application based on land use change scenarios in Portugal. Environ. Model. Softw. 2018, 104, 171–187. [Google Scholar] [CrossRef]
- Istituto Nazionale di Statistica. Il Benessere Equo e Sostenibile in Italia; Istituto Nazionale di Statistica: Rome, Italy, 2017; ISBN 978-988-458-1935-3.
- ISTAT. Forme, Livelli e Dinamiche dell’Urbanizaizone in Italia; Istituto Nazionale di Statistica: Rome, Italy, 2011; ISBN 9788845819162.
- Gibelli, M.C.; Salzano, E. No Sprawl; Alinea: Firenze, Italy, 2006; ISBN 8860550637. [Google Scholar]
- Camagni, R.; Gibelli, M.C.; Rigamonti, P. Urban mobility and urban form: The social and environmental costs of different patterns of urban expansion. Ecol. Econ. 2002, 40, 199–216. [Google Scholar] [CrossRef]
- Romano, B.; Fiorini, L.; Zullo, F.; Marucci, A. Urban Growth Control DSS Techniques for De-Sprinkling Process in Italy. Sustainability 2017, 9, 1852. [Google Scholar] [CrossRef]
- Andrén, H. Effects of Habitat Fragmentation on Birds and Mammals in Landscapes with Different Proportions of Suitable Habitat: A Review. Oikos 1994, 71, 355. [Google Scholar] [CrossRef]
- Istat.it. Available online: https://www.istat.it/ (accessed on 5 April 2018).
- ISPRA. Consumo di Suolo, Dinamiche Territoriali e Servizi Ecosistemici; ISPRA, Rapporti: Roma, Italia, 2018; ISBN 978-988-448-0902-7.
- RSDI—Geoportale Basilicata. Available online: https://rsdi.regione.basilicata.it/ (accessed on 6 March 2018).
- Home—Geoportale Nazionale. Available online: http://www.pcn.minambiente.it/mattm/ (accessed on 10 February 2018).
- De Montis, A.; Ledda, A.; Ortega, E.; Martín, B.; Serra, V. Landscape planning and defragmentation measures: An assessment of costs and critical issues. Land Use Policy 2018, 72, 313–324. [Google Scholar] [CrossRef]
- Romano, B.; Zullo, F. Valutazione della pressione insediativa—Indicatori e sperimentazioni di soglie. In Biodiversità, Disturbi, Minacce; Editrice Universitaria: Udinese, Udine, 2013; pp. 170–177. [Google Scholar]
- Corridore, G.; Romano, B. L’interferenza ecosistemica dell’insediamento. tecniche di analisi e valutazione. In UrbIng Alta Formazione, Atti delle Giornate di Lavoro sull’Alta Formazione Nelle Discipline della Pianificazione, Gestione e Governo del Territorio; Las Casas, G., Pontrandolfi, G., Murgante, B., Eds.; Università della Basilicata: Potenza, Italy, 2005. [Google Scholar]
- Astiaso, D.; Bruschi, D.; Cinquepalmi, F. An Estimation of Urban Fragmentation of Natural Habitats: Case Studies of the 24 Italian National Parks. CET 2015, 32, 49–54. [Google Scholar] [CrossRef]
- Messina, G.; Sottile, M. Analisi Spaziali e Valutazioni Economiche dei Fenomeni di Sprawl e Sprinkling sulla Base della Frammentazione Urbana nella Provincia di Lodi. Tesi di Laurea del Politecnoco di Milano. Available online: https://www.politesi.polimi.it/handle/10589/114121 (accessed on 31 August 2018).
- Song, W.; Liu, M. Assessment of decoupling between rural settlement area and rural population in China. Land Use Policy 2014, 39, 331–341. [Google Scholar] [CrossRef]
- Wang, C.; Liu, Y.; Kong, X.; Li, J. Spatiotemporal decoupling between population and construction land in urban and rural Hubei province. Sustainability 2017, 9, 1258. [Google Scholar] [CrossRef]
- ISPRA. Dissesto Idrogeologico in Italia: Pericolosità e Indicatori di Rischio; ISPRA Rapporti: Roma, Italia, 2018.
- SIC, ZSC e ZPS in Italia. Ministero Dell’Ambiente e Della Tutela del Territorio e del Mare. Available online: http://www.minambiente.it/pagina/sic-zsc-e-zps-italia (accessed on 9 July 2018).
- Cozzi, M. La Carta Regionale dei Suoli della Basilicata: Modelli Interpretativi degli Areali Agricoli e Ambientali. Available online: https://www.researchgate.net/publication/307841409_La_Carta_Regionale_dei_Suoli_della_Basilicata_modelli_interpretativi_degli_areali_agricoli_e_ambientali (accessed on 31 August 2018).
- Kew, B.; Lee, B. Measuring Sprawl across the Urban Rural Continuum Using an Amalgamated Sprawl Index. Sustainability 2013, 5, 1806–1828. [Google Scholar] [CrossRef] [Green Version]
- Amato, F.; Maimone, B.; Martellozzo, F.; Nolè, G.; Murgante, B. The Effects of Urban Policies on the Development of Urban Areas. Sustainability 2016, 8, 297. [Google Scholar] [CrossRef] [Green Version]
- Amato, F.; Martellozzo, F.; Nolè, G.; Murgante, B. Preserving cultural heritage by supporting landscape planning with quantitative predictions of soil consumption. J. Cult. Herit. 2017, 23, 44–54. [Google Scholar] [CrossRef]
- Murgante, B.; Salmani, M.; Molaei Qelichi, M.; Hajilo, M. A Multiple Criteria Decision-Making Approach to Evaluate the Sustainability Indicators in the Villagers’ Lives in Iran with Emphasis on Earthquake Hazard: A Case Study. Sustainability 2017, 9, 1491. [Google Scholar] [CrossRef]
- Martellozzo, F.; Amato, F.; Murgante, B.; Clarke, K.C. Modelling the impact of urban growth on agriculture and natural land in Italy to 2030. Appl. Geogr. 2018, 91, 156–167. [Google Scholar] [CrossRef]
Figure 1.
The location of Basilicata region in Italy on the left and the location of the provinces of Potenza and Matera with their relative municipalities on the right.
Figure 1.
The location of Basilicata region in Italy on the left and the location of the provinces of Potenza and Matera with their relative municipalities on the right.

Figure 2.
Conceptual map of our methodology.

Figure 3.
Aggregation of buildings at two different temporal phases: 1950 and 1989.

Figure 4.
Comparison between residential buildings and other uses in the five time phases considered.
Figure 4.
Comparison between residential buildings and other uses in the five time phases considered.

Figure 5.
Comparison between variation in population density and building density for each municipality in the Basilicata region at three time periods.
Figure 5.
Comparison between variation in population density and building density for each municipality in the Basilicata region at three time periods.

Figure 6.
Comparison between residential settlement and population evolution from 1950 to 2013.

Figure 7.
Degree of urban fragmentation determined using Method 1.

Figure 8.
Degree of urban fragmentation obtained using Method 2.

Figure 9.
Comparison between the SPX percentage change and the percentage population change between 1989 and 1998 and 1998 and 2013.
Figure 9.
Comparison between the SPX percentage change and the percentage population change between 1989 and 1998 and 1998 and 2013.

Figure 10.
(a) Percentage of areas in NATURA2000 sites in relation to regional area; (b) Percentage of areas at risk of landslides: high level of danger R3 and very high level of danger R4 in relation to the regional area.
Figure 10.
(a) Percentage of areas in NATURA2000 sites in relation to regional area; (b) Percentage of areas at risk of landslides: high level of danger R3 and very high level of danger R4 in relation to the regional area.

Table 1.
Comparison between settlement evolution concerning residential buildings and population evolution from 1950 to 2013.
Table 1.
Comparison between settlement evolution concerning residential buildings and population evolution from 1950 to 2013.
| Year | Population (No. Inhabitants) | Increase Rate (%) | Residential Buildings [BR] (n) | Increase Rate (%) |
|---|---|---|---|---|
| 1950 | 627,586 | Nd 1 | 117,687 | Nd 1 |
| 1989 | 610,186 | –2.7 | 238,603 | 102.7 |
| 1998 | 597,468 | –2.1 | 269,019 | 12.75 |
| 2006 | 591,338 | –1.0 | 285,072 | 6.0 |
| 2013 | 578,391 | –2.2 | 297,810 | 4.5 |
1 nd: no data available.
Table 2.
Degree of urban fragmentation according to the value of the Sprinkling (SPX) index determined using Method 1.
Table 2.
Degree of urban fragmentation according to the value of the Sprinkling (SPX) index determined using Method 1.
| Fragmentation Degree | SPX 1 |
|---|---|
| Not fragmented | SPX = 0 |
| Low fragmentation | 0 < SPX < 50 |
| Medium-low fragmentation | 50 ≤ SPX < 100 |
| Medium fragmentation | 100 ≤ SPX < 150 |
| Medium-high fragmentation | 150 ≤ SPX < 200 |
| High fragmentation | SPX ≥ 200 |
1 All SPX index values were divided by 1000.
Table 3.
Degree of urban fragmentation according to the value of the SPX index calculated using Method 2.
Table 3.
Degree of urban fragmentation according to the value of the SPX index calculated using Method 2.
| Fragmentation Degree | SPX 1 |
|---|---|
| Low fragmentation | SPX < 1 |
| Medium-low fragmentation | 1 ≤ SPX < 3.5 |
| Medium fragmentation | 3.5 ≤ SPX < 6 |
| Medium-high fragmentation | 6 ≤ SPX < 8.5 |
| High fragmentation | SPX ≥ 8.5 |
1 All SPX index values were divided by 1000.
Table 4.
Variation of population and buildings in the Basilicata region over time.
| Year | Population (No.) | Residential Buildings [BR] (n) | Dp (Inhabitants/ha) | Db (BR/ha) |
|---|---|---|---|---|
| 1950 | 627,586 | 117,687 | 0.63 | 0.12 |
| 1989 | 610,186 | 238,603 | 0.61 | 0.24 |
| 1998 | 597,468 | 269,019 | 0.60 | 0.27 |
| 2006 | 591,338 | 285,072 | 0.59 | 0.28 |
| 2013 | 578,391 | 297,810 | 0.58 | 0.30 |
Table 5.
Number of residential buildings in R3 and R4 landslide risk areas.
| Year | Residential Buildings (n) | Residential Buildings in R3 (n) | Residential Buildings in R4 (n) | Residential Buildings in R3 and R4 (n) | Residential Buildings in R3 and R4 (% Total) |
|---|---|---|---|---|---|
| 2006 | 285,072 | 10,816 | 13,079 | 23,895 | 8.38 |
| 2013 | 297,810 | 11,012 | 13,266 | 24,278 | 8.15 (+1.60%) |
© 2018 by the authors. Licensee MDPI, Basel, Switzerland. This article is an open access article distributed under the terms and conditions of the Creative Commons Attribution (CC BY) license (http://creativecommons.org/licenses/by/4.0/).
Share and Cite
MDPI and ACS Style
Saganeiti, L.; Favale, A.; Pilogallo, A.; Scorza, F.; Murgante, B. Assessing Urban Fragmentation at Regional Scale Using Sprinkling Indexes. Sustainability 2018, 10, 3274. https://0-doi-org.brum.beds.ac.uk/10.3390/su10093274
AMA Style
Saganeiti L, Favale A, Pilogallo A, Scorza F, Murgante B. Assessing Urban Fragmentation at Regional Scale Using Sprinkling Indexes. Sustainability. 2018; 10(9):3274. https://0-doi-org.brum.beds.ac.uk/10.3390/su10093274
Chicago/Turabian StyleSaganeiti, Lucia, Antonella Favale, Angela Pilogallo, Francesco Scorza, and Beniamino Murgante. 2018. "Assessing Urban Fragmentation at Regional Scale Using Sprinkling Indexes" Sustainability 10, no. 9: 3274. https://0-doi-org.brum.beds.ac.uk/10.3390/su10093274
Note that from the first issue of 2016, this journal uses article numbers instead of page numbers. See further details here.