Article

Spatial Pattern Evolution and Optimization of Urban System in the Yangtze River Economic Belt, China, Based on DMSP-OLS Night Light Data

1
School of Resources and Environmental Sciences, Wuhan University, Wuhan 430072, China
2
Key Laboratory of Geographic Information System, Wuhan University, Wuhan 430079, China
*
Author to whom correspondence should be addressed.
Sustainability 2018, 10(10), 3782; https://0-doi-org.brum.beds.ac.uk/10.3390/su10103782
Submission received: 17 September 2018 / Revised: 14 October 2018 / Accepted: 15 October 2018 / Published: 19 October 2018
(This article belongs to the Special Issue Urban Sprawl and Sustainability)

Abstract

:
It is of great significance to research the spatial pattern of the urban system of the Yangtze River economic belt to analyze the characteristics and laws of the spatial structure of the Yangtze River economic belt and to promote the optimal development of the urban system of the Yangtze River economic zone. In this paper, the time data of the Yangtze River economic zone are corrected using Landsat satellite data and the clustering analysis method. The threshold of the urban built area is obtained by comparing the auxiliary data with other auxiliary data. Based on this threshold, a total of eight typical landscape pattern indicators—including the total area of the landscape, the total patch number, and the aggregation index—are used, and then FRAG-STATS 4.2 software is used to analyze the spatial pattern of urban development in the Yangtze River economic zone from 1992 to 2013. The results show the following: (1) During the period from 1992 to 2013, the urbanization of the Yangtze River economic zone expanded rapidly; the area of urban built-up area increased by a factor of 9.68, the number of patches increased by a factor of 2.39, and the patch density increased greatly, indicating that the Yangtze River economic zone, with an increasing number of towns and urban areas, continues to expand. (2) The complexity of the landscape patch shape gradually increased, the small and medium-sized cities continued to grow, more small towns emerged, and the total length of the border and the average density had average annual growth rates of 21.56% and 21.58%; the degree of aggregation and the mutual influence are increasing. (3) The maximum plaque index and the aggregation index show an overall declining trend. However, there are some fluctuations and disorder in the process of evolution, such as the total area of the landscape, the total patch number and the total patch density, which reflects that the Yangtze River economic zone is in the process of urbanization and has irregular and disordered characteristics.

1. Introduction

An urban agglomeration is a relatively complete urban “aggregate” consisting of a large number of cities of different natures, types and grades within a specific geographical area [1]. As the main form of promoting the rapid development of urbanization, urban agglomerations have become the basic unit of globalization and regional division of labor, playing an increasingly important role in the process of urban regionalization and regional urbanization [2]. Urban agglomeration is a highly developed spatial form of integrated cities. It occurs when the relationships among cities shift from mainly competition to both competition and cooperation. Cities are highly integrated within an urban agglomeration, which renders the agglomeration one of the most important carriers for global economic development [3].
This paper has carried out active research work on large-scale regional research in the spatial pattern evolution of urban systems, and then adopted research based on Defense Meteorological Satellite Program (DMSP)/Operational Linescan System (OLS) lighting data. In this paper, the spatial pattern evolution of urban land use in 11 provinces and cities in the Yangtze River Economic Belt is discussed. The remote sensing monitoring of this large area shows us the macroscopic spatial change information. Additionally, this research work has certain innovations in terms of research object selection and method selection. It can reveal the dynamic evolution characteristics and laws of the spatial pattern of the urban system in the Yangtze River Economic Belt.
Presently, the academic community has performed much research related to the spatial patterns of urban agglomerations. From the research perspective, the main topics are Formation and Evolution [4,5], Urban form [6], and the Urban development model [7]. The study area is mainly based on the china [8,9], South Asia [10], and Wu Han [11,12]. The research methods, mainly include the Landscape index method [13,14], a gravity model [15,16], the social network analysis method [17], and Landscape analysis [18]. The current academic research on the Yangtze River Economic Belt mainly focuses on the sustainable development [19,20,21,22], urbanization [23,24,25], and industrial analysis [26,27,28]. It is obvious that there is relatively little research on the spatial pattern of the urban system in the Yangtze River Economic Belt. Research on the spatial pattern of urban agglomerations in China is facing a growing bottleneck in development. It is urgent to expand new methodologies and new data sources, especially in the form of simple but connotative evaluation methods.
The Operational Linescan System (OLS) sensor on the US Defense Weather Satellite’s Defense Meteorological Satellite Program (DMSP) makes it possible to capture nighttime light data [29]. The sensor can work at night, and can not only use moonlight for cloud monitoring but can also detect low-intensity lights, such as city lights and even small-scale residential lighting and traffic flow [30]. The night light index is a simple but rich evaluation index, which realizes the organic integration of a single statistical indicator and a comprehensive indicator system. Presently, domestic and foreign scholars have conducted much research based on DMSP/OLS data, mainly focusing on urbanization expansion research [31,32,33,34,35], population and economic estimation [36,37,38], power consumption estimation [39,40,41], and carbon emissions [42,43,44].
At the same time, in the rare research on the application of DMSP/OLS data to the spatial pattern evolution of urban agglomerations, it is mainly based on coastal developed urban agglomerations such as the Surrounding the Bo sea city group [45]. Therefore, a summarization reveals that academic research on the use of DMSP/OLS data to determine the spatial pattern evolution of the Yangtze River Economic Belt urban system is relatively lacking. The study of the spatial pattern evolution of the urban system in the Yangtze River Economic Belt based on DMSP/OLS nighttime lighting data is urgently needed and is of great significance to enriching the depth and breadth of relevant research and promoting the optimization of the spatial pattern of the Yangtze River Economic Belt.

2. Research Area and Data

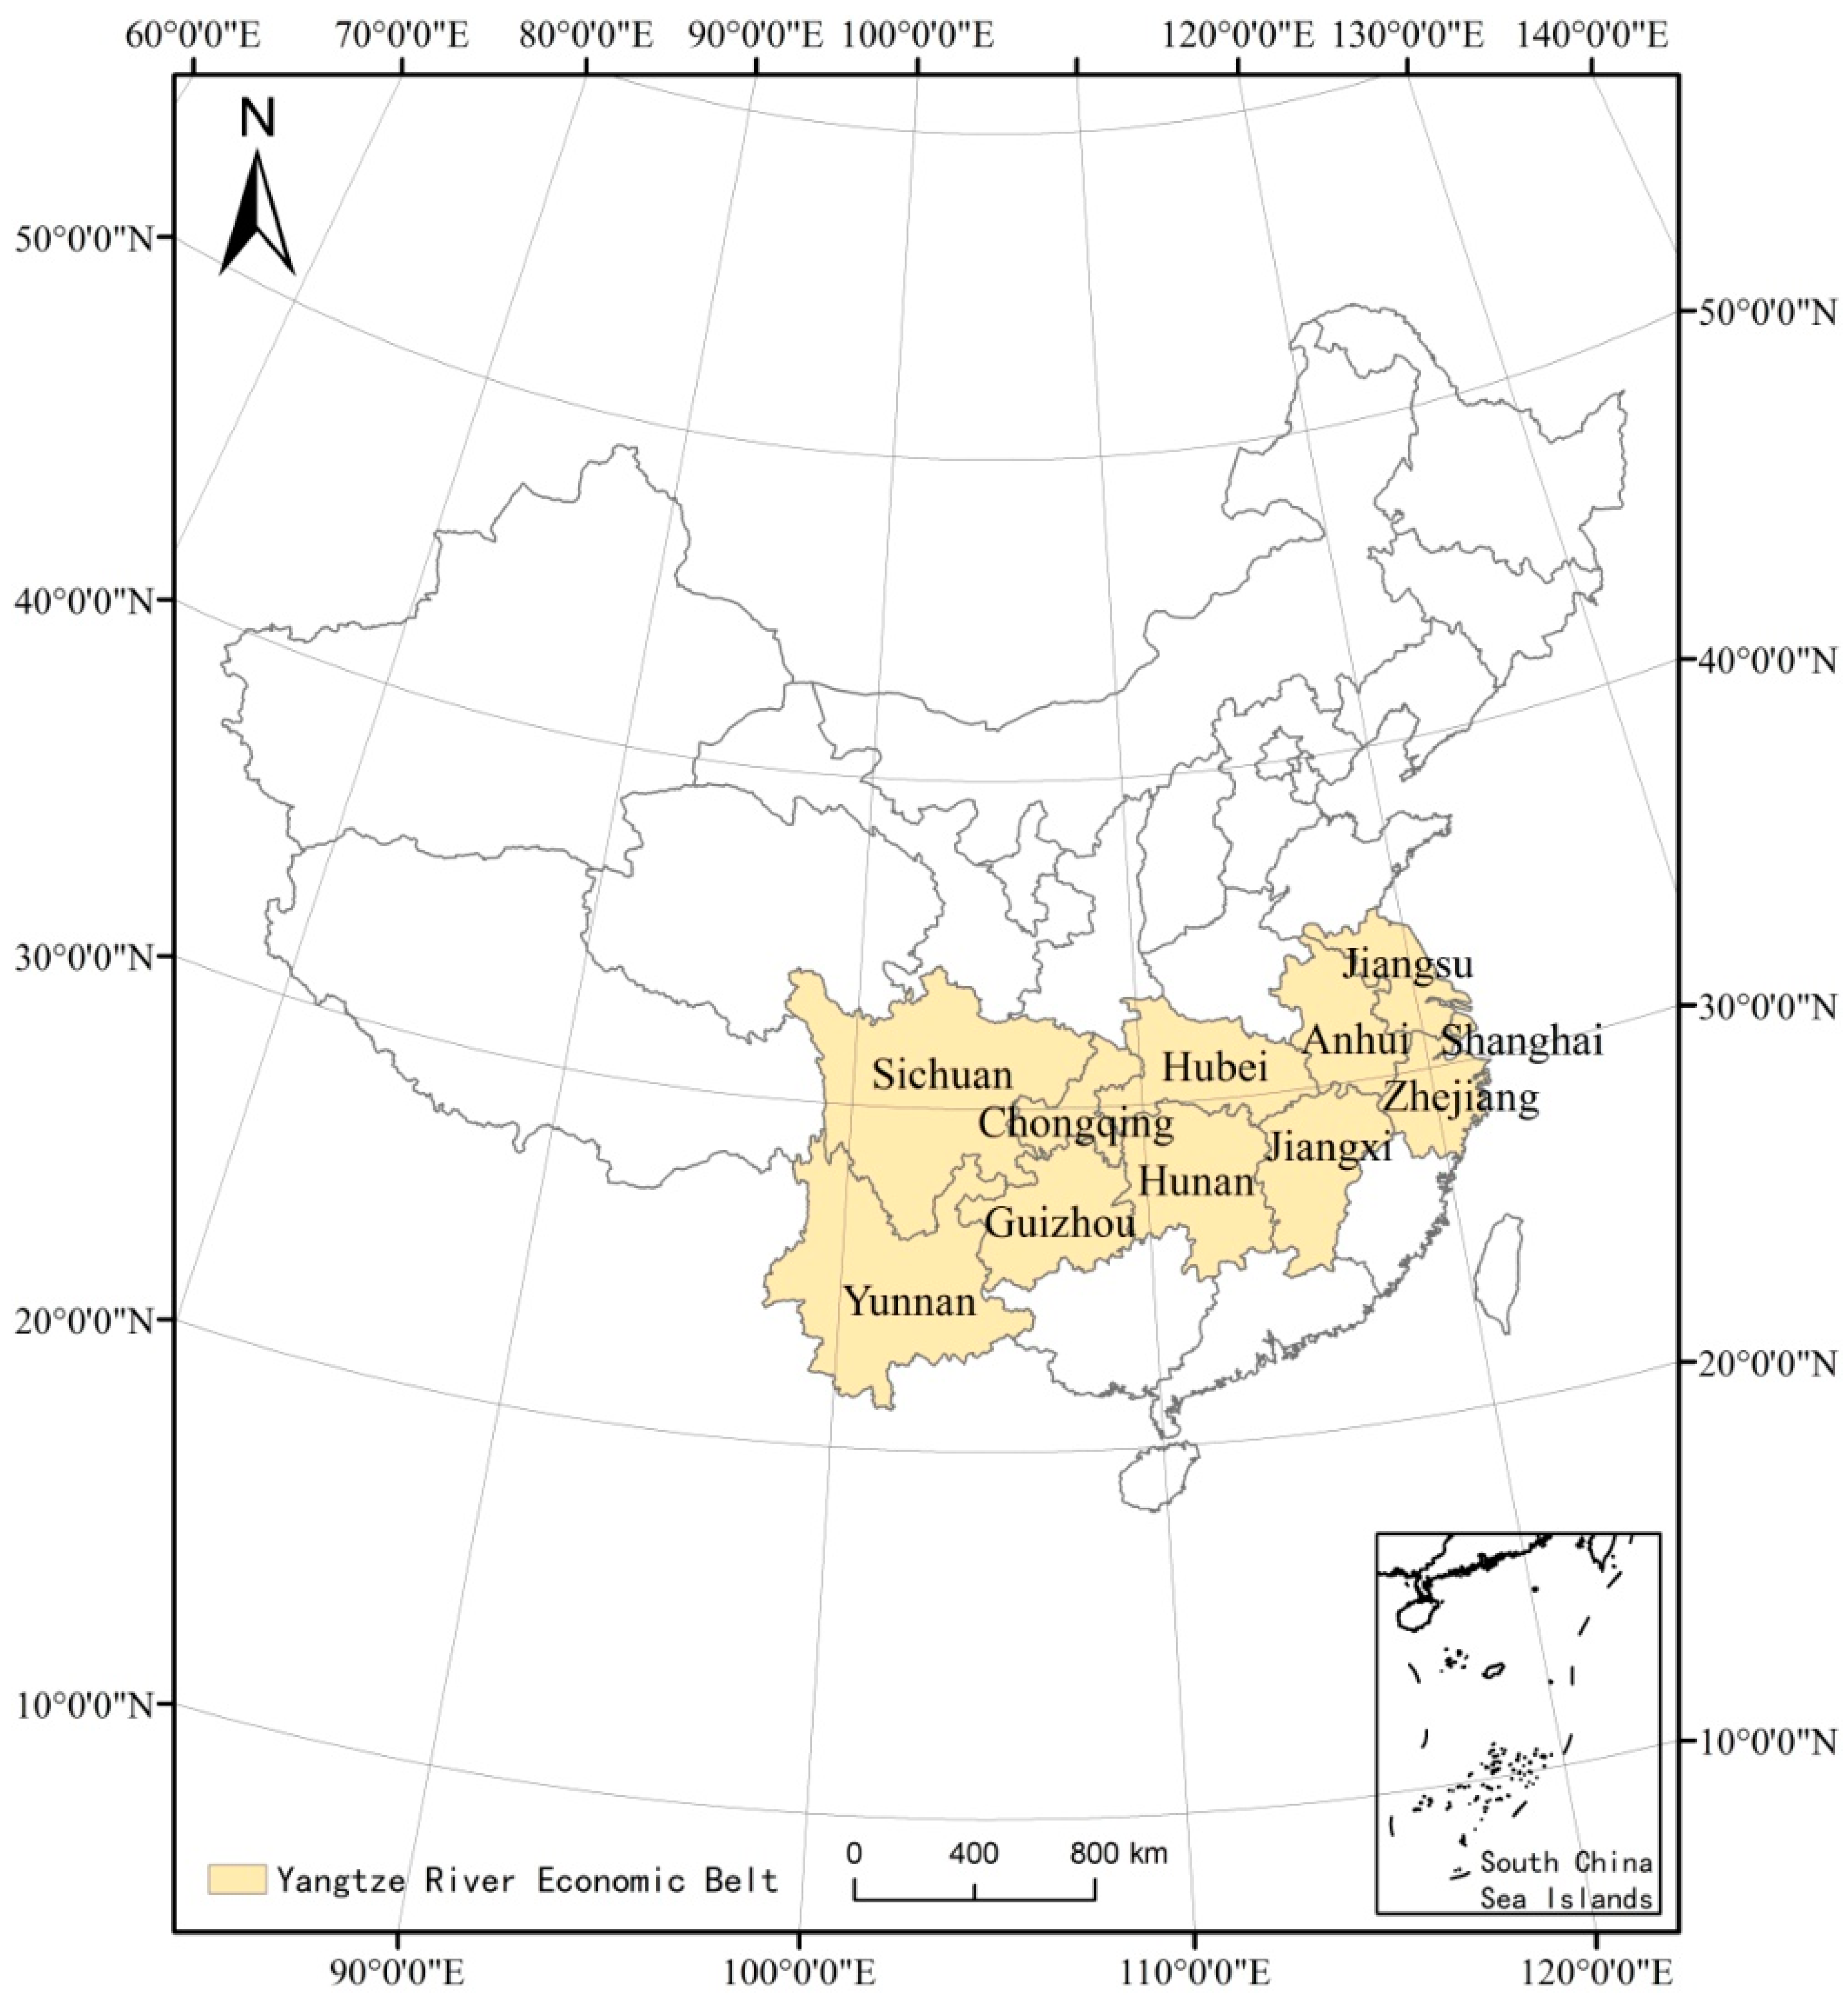
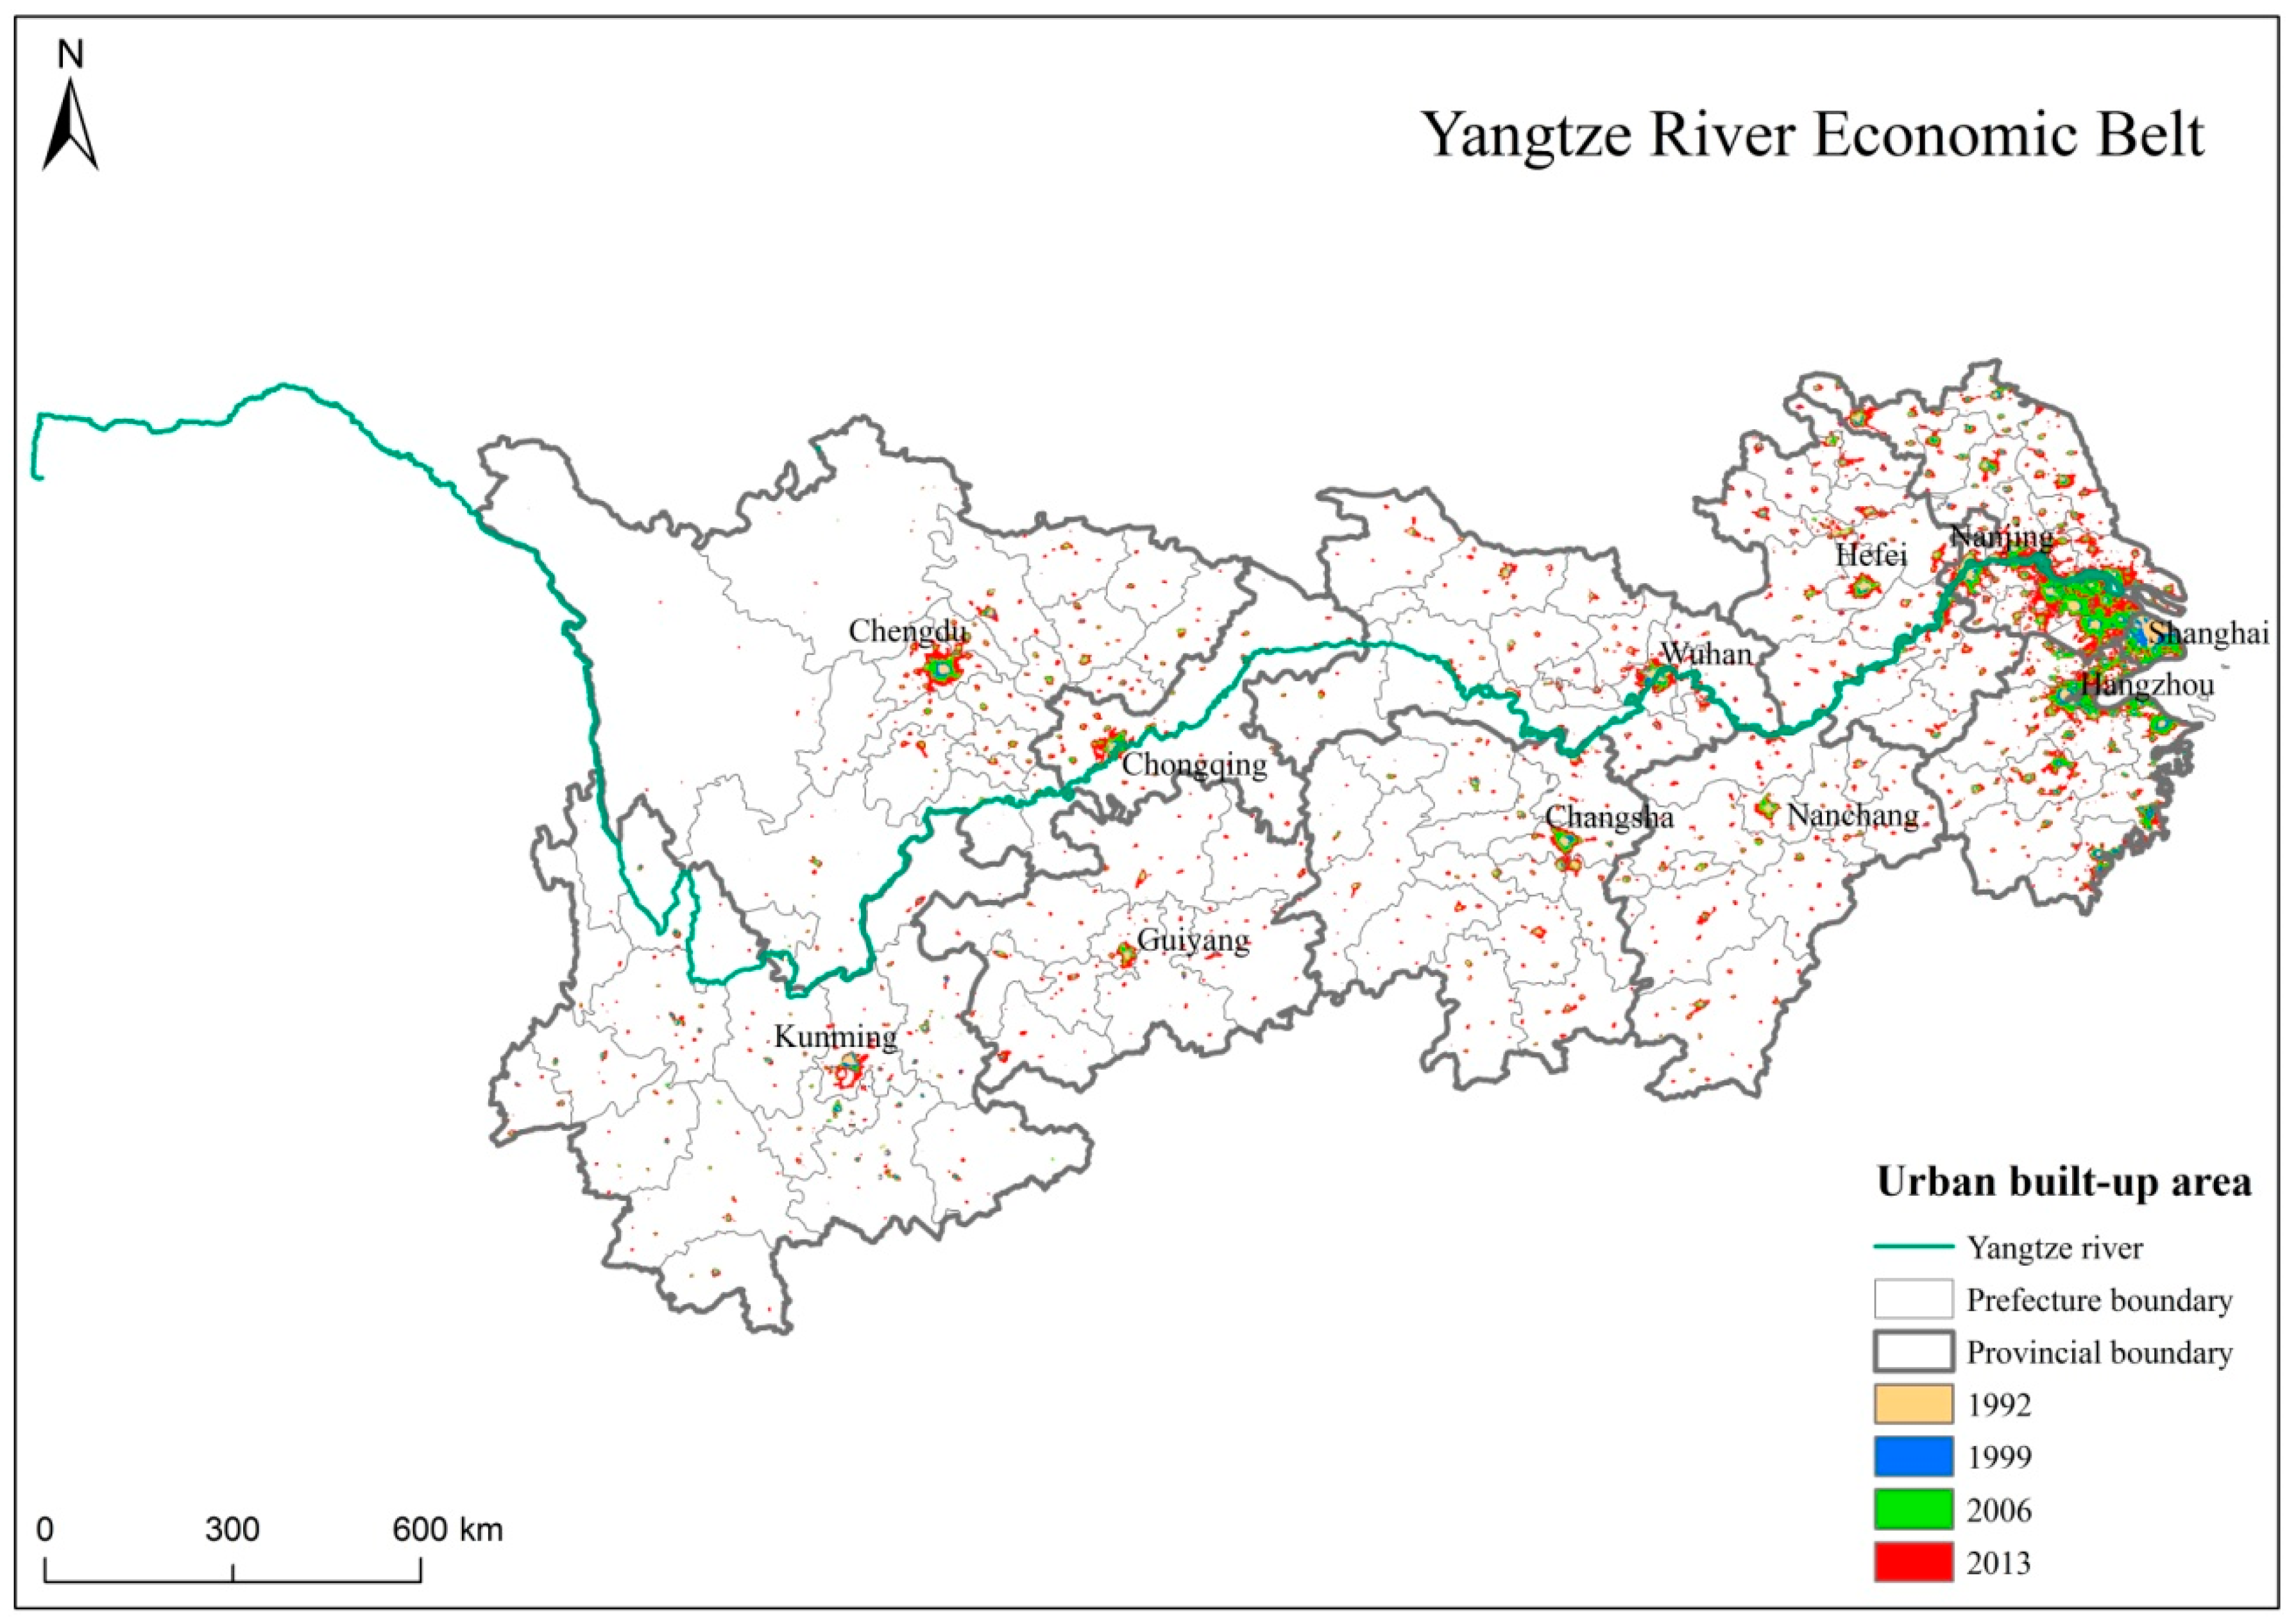
2.1. Research Area Introduction

The Yangtze River Economic Belt is a dense urban belt in China and is also the largest economic zone in China with the highest economic density (Figure 1). It is responsible for realizing China’s future economic sustainable development. The Yangtze River Economic Belt includes 11 provinces and cities, such as Shanghai, Jiangsu, Zhejiang, Anhui, Jiangxi, Hubei, Hunan, Chongqing, Sichuan, Yunnan, and Guizhou, covering an area of approximately 2.05 million square kilometers and accounting for 21% of the country, and its population and economic aggregates are both exceeded. As 40% of the country, it has an important ecological status, strong comprehensive strength, and significant development potential.
In June 2016, the programmatic document accompanying the “Outline for the Development of the Yangtze River Economic Belt”, a major national strategy for promoting the development of the Yangtze River Economic Belt, was officially issued, marking the start of a more detailed and concrete development plan for the Yangtze River Economic Belt. This paper takes the nine provinces and two cities delineated by the “Outline” as the research scope, adopts the vision based on DMSP/OLS nighttime lighting data, and uses various data and research methods to analyze and research the spatial pattern evolution of the urban system of the Yangtze River Economic Belt.

2.2. Data

2.2.1. DMSP/OLS Night Light Data

This study utilizes 22-year DMSP-OLS nonradiation-calibrated nighttime stable lighting data from 1992 to 2013, from the National Geophysical Data Center. The DMSP/OLS night light remote sensing data projection is WGS-84. The nonradio-calibrated DMSP-OLS nighttime stable lighting data has a spatial resolution of 30 arc seconds and is approximately 1 km at the equator. The gray value of the data ranges from 0 to 63. A value of 0 indicates no light in the area. The larger the gray value, the higher the brightness value of the light. The data contains towns and other types of stable lights and has been processed strictly. The effects of fire, sunlight, moonlight, clouds, and aurora have been addressed. The stable lighting data includes lights from cities, towns and other places with long-lasting light sources and removes background noise. Therefore, these data are used in this research. For the research period, F101992, F141999, F162006, and F182013 are selected. A period image of the frequency statistics of the gray value distribution of the data of the Yangtze River Economic Belt year by year is shown in Figure 2. To verify the accuracy of the model results, the study used the Landsat TM series satellite synchronization data to correct the nighttime lighting data. The data was obtained from the International Scientific Data Service Platform of the Computer Network Information Center of the Chinese Academy of Sciences. Additionally, to meet the research requirements, this paper uses the quadratic regression function method to correct the original DMSP/OLS nighttime light data to improve its comparability in the time series.

2.2.2. Land Use Data

The data comes from the National Land Cover Data (NLCD) with a spatial resolution of 1 km, is of an area in China in the 1995, 2000, and 2005 and is published on the Earth System Science Data Sharing Platform. In the land use/cover classification system of the data, there are six first-level types of “cultivated land”, “forestland”, “grassland”, “waters”, “urban and rural areas, industrial and mining, residential land”, and “unutilized land”. Among the “urban and rural areas, industrial and mining, and residential land”, there are three secondary types of “urban land”, “rural residential sites”, and “other construction land” [23]. Therefore, from the data set, 1995, 2000, and 2005 types of “urban land” of grade two are obtained, and then the auxiliary data is used to determine the optimum threshold of the area of the urban built-up area of the Yangtze River Economic Belt 1992–2013 year by year based on the DMSP/OLS night light data.

2.2.3. Vegetation Index Data

The vegetation index data used in this paper are mainly composed of the 10-day synthetic 1992, 1993, 1995, and 1996 NOAA/AVHRR NDVI data and the 1998–2012 SPOT/VG data, which are derived from the United States Geological Survey (United States Geological Survey, USGS, Reston, VA, USA) and the VITO website (http://free.vgt.vito.be).

2.2.4. Surface Temperature Data

The surface temperature data used in this paper is the nighttime LST data from the 2000–2010 MOD11A2-Lev-el38-day synthetic LST product released by the National Aeronautics and Space Administration (NASA, Washington, DC, USA). The download siteis (Http://lad-sweb.nascom.nasa.gov).

3. Research Methods

3.1. Cluster Analysis of Raw Lighting Data

The DMSP/OLS nighttime light data has a gray value range of 0–63. A value of 0 indicates a no-light area, and the larger the gray value, the higher the brightness value of the light. Because the next study is based on the comparison method of auxiliary data, the study determines the optimal threshold for extracting the urban built-up area, and as auxiliary data, it downloads the space of the three phases of China during 1995, 2000, and 2005, which were released from the Earth System Science Data Sharing Platform. The land use/coverage grid dataset (NLCD) data has a resolution of 1 km. Therefore, to ensure that the threshold extraction of the next built-up area of the city is more precise, the DMSP/OLS nighttime light data of the three years 1995, 2000, and 2005 are clustered to analyze the distribution of the gray value of the nighttime light data. The classification is used to understand the distribution characteristics of the brightness value of the nighttime light data itself and to compare and determine the optimal threshold for extracting the urban built-up area based on the auxiliary data comparison method. The results of the cluster analysis are shown in Table 1. The nighttime light intensity values in 1995, 2000, and 2005 were 10.81, 11.97, and 14.81, respectively. It can be seen that the Yangtze River Economic Belt was in 1995, 2000, and 2005. In the past three years, the brightness values of nighttime lights during the past three years are relatively low overall, and the brightness values of the urban lights are quite different. Additionally, the brightness values and total number of nighttime lights in 1995, 2000, and 2005 are gradually increased during the year. It can be seen that the Yangtze River Economic Belt expanded rapidly, and the urban built-up area is expanding continuously, while the small and medium-sized cities (towns) continue to grow and develop.

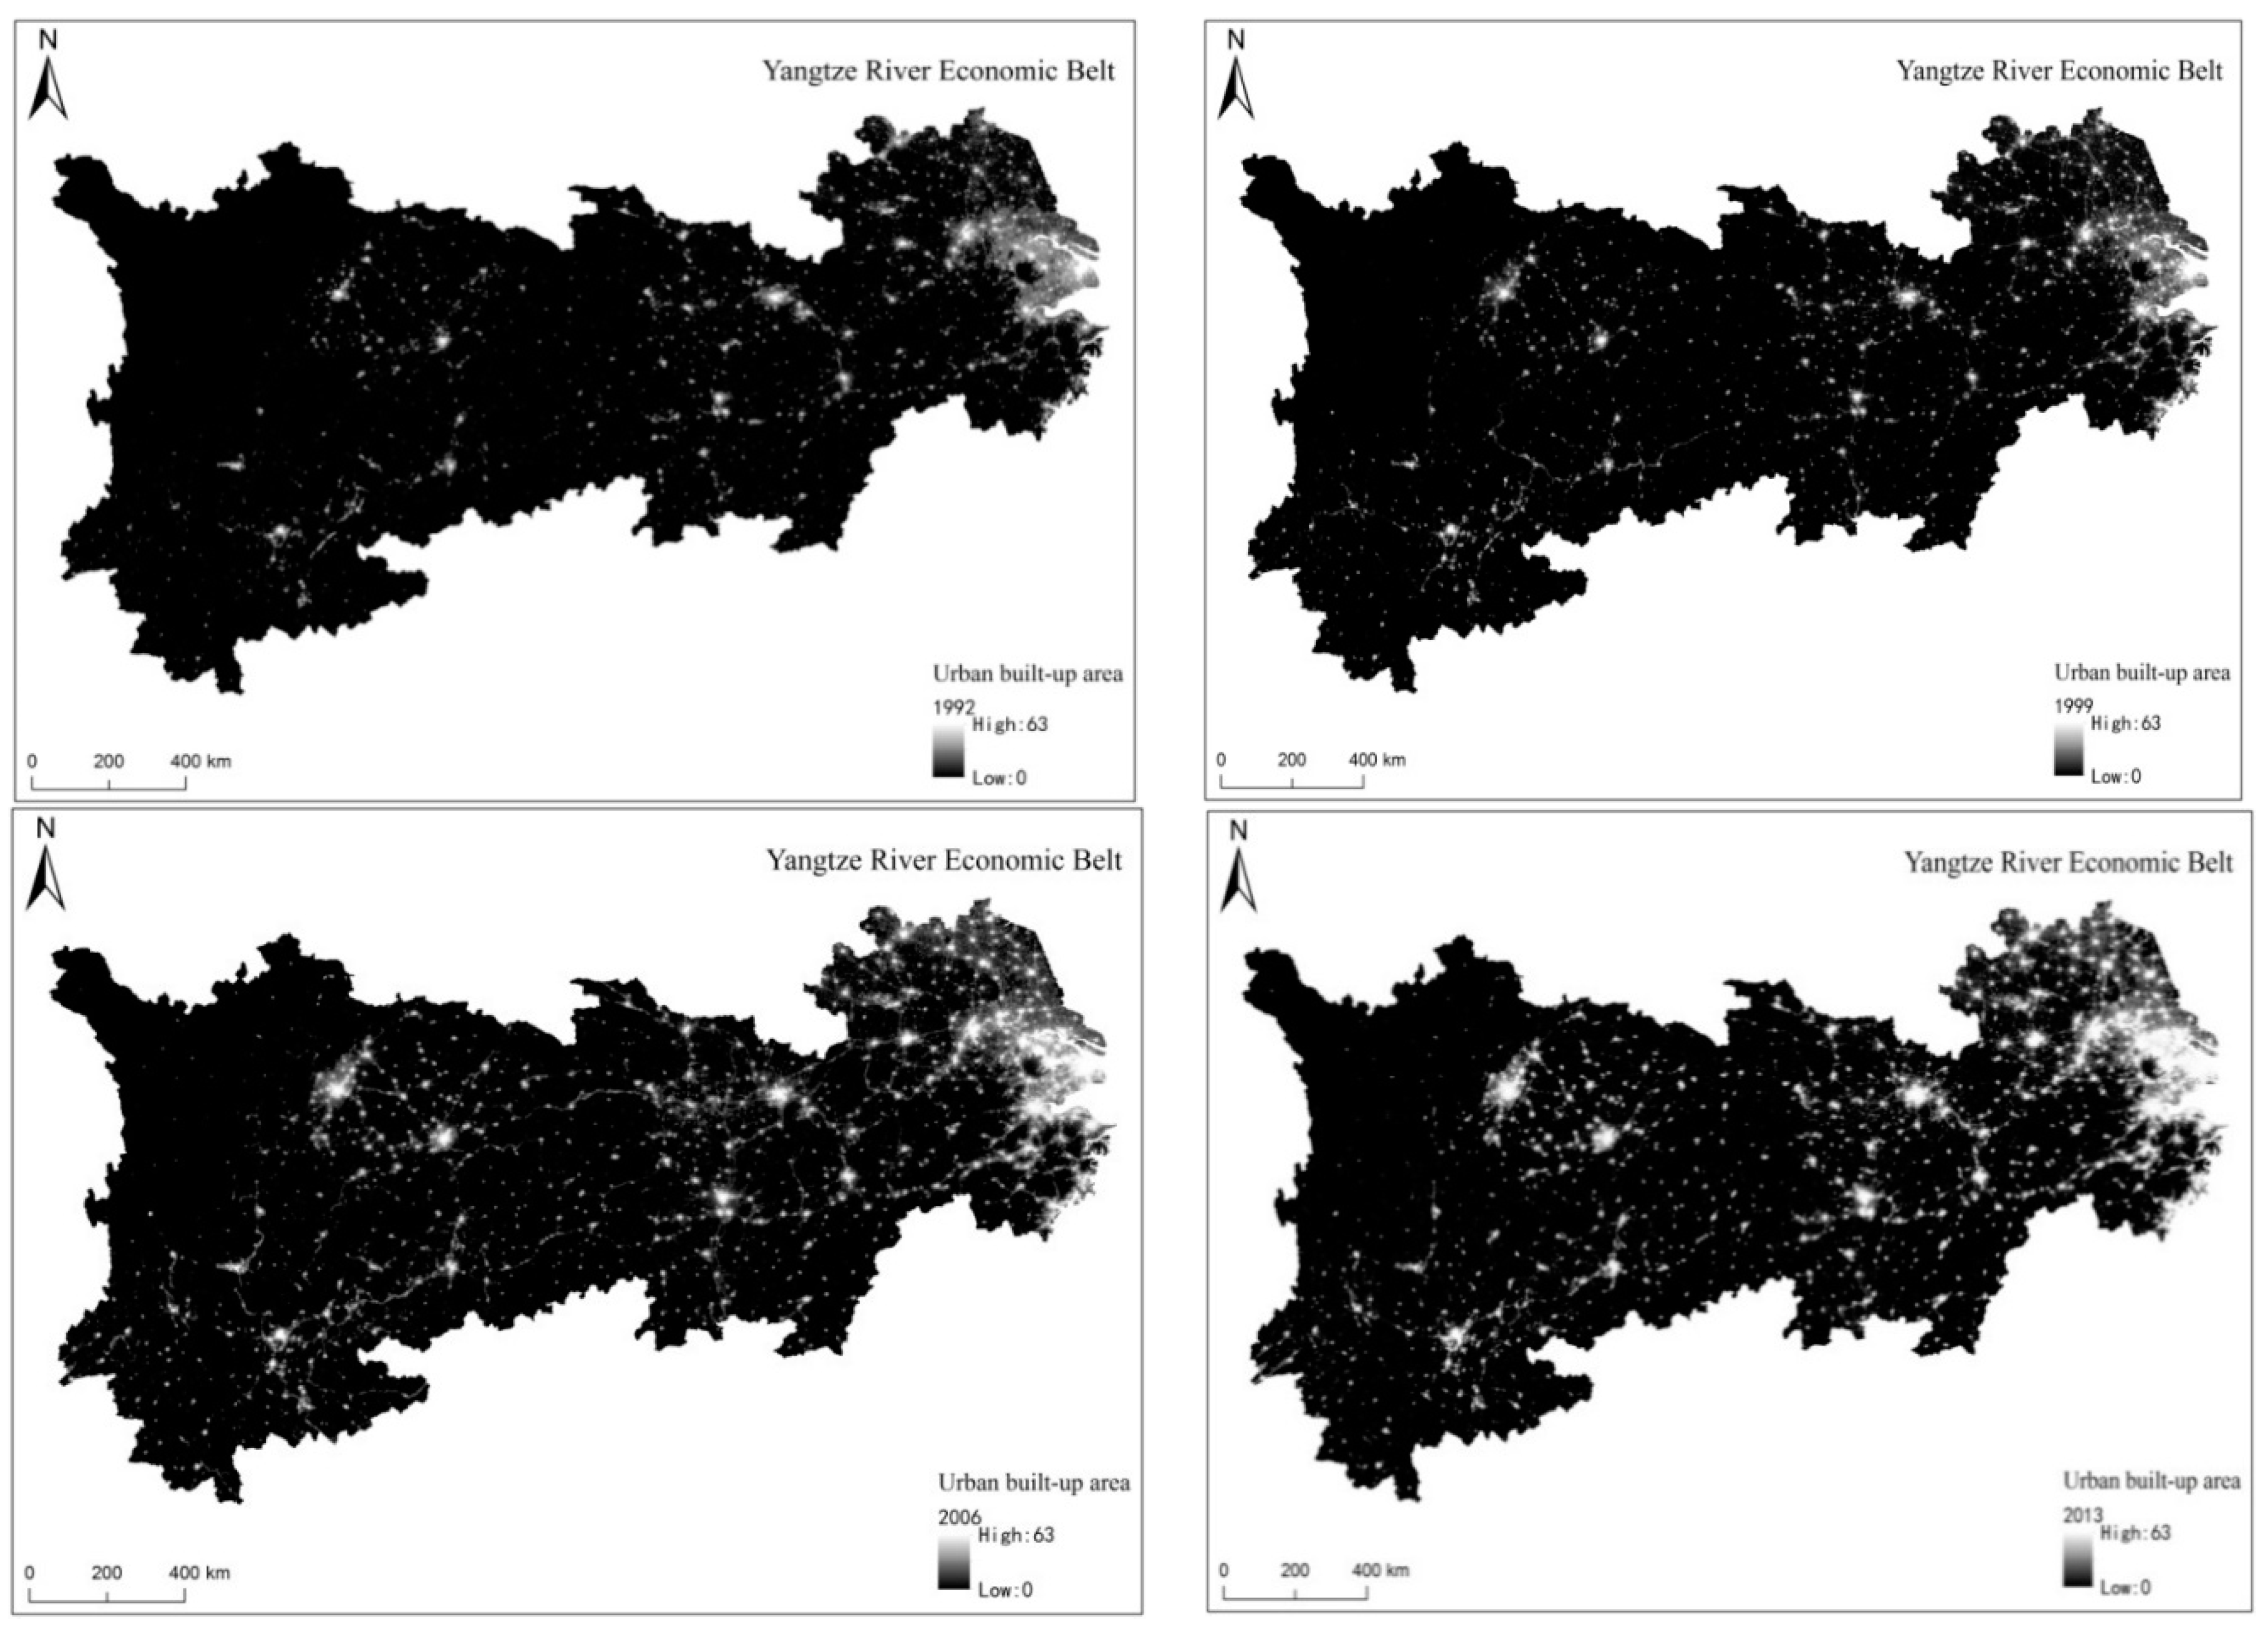
3.2. Extract the Area of Urban Built-Up Area

To compare the two methods of extracting the area of the built-up area of the long-term sequence based on the DMSP/OLS nighttime data from China and abroad, namely, the image classification method and the threshold method, the auxiliary data based on the threshold extraction method is also considered. The comparative method can better meet the needs of the spatial pattern evolution of the long-term sequence of the Yangtze River economic zone urban system in this study. Therefore, the comparison method based on auxiliary data is selected, and the three-phase land use/coverage grid dataset with the spatial resolution of 1 km in China during 1995, 2000 and 2005 is released from the “Earth System Science Data Sharing Platform”. The NLCD data, United States Geological Survey (USGS), and VITO website (http://free.vgt.vito.be) download synthetic vegetation index data, and the surface temperature data released by NASA, is used to determine the optimal threshold for extracting the urban built-up area and then to extract the urban built-up area of the Yangtze River Economic Belt in each year. The detailed steps for extracting urban land use information can be found in the relevant literature [46]. Based on this method, the area with the light threshold of ≥25 is selected as the urban built-up area. The urban built-up area of the Yangtze River Economic Belt in each year is extracted, and subsequent research is performed.

3.3. Use Landscape Pattern Change Analysis Method

Landscape metrics have been extensively used for quantifying landscape patterns and their change [47]. In the literature, landscape patterns are commonly measured by a set of indices associated with area, shape, aggregation, and diversity to reflect the characteristics and compositions of landscape patches [48]. The urban spatial information extracted from the Yangtze River Economic Belt in 1992, 1999, 2006, and 2013 was analyzed using the landscape index method in landscape ecology [26]. This study accounts for the complexity of the landscape type data of the urban built-up area data of the Yangtze River Economic Belt extracted from the DMSP-OLS lighting data and selects the total landscape area (TA), total plaque number (NP), plaque density (PDh), Maximum plaque index (LPI), total boundary length (TE), average boundary density (ED), landscape shape index (LSI), and aggregation index (AI), together with eight typical landscape pattern indicators, then, using FRAG-STATS 4.2. The software calculates eight typical landscape pattern indicators.

4. Results and Discussion

4.1. Evolution Characteristics of Urban System Spatial Patterns in the Yangtze River Economic Belt

Landscape indicators are measures of the size, shape, and spatial juxtaposition of particular land types as well as the complexity and configuration of all land types within an area [49]. The results from the FRAG-STATS 4.2 software are shown in Table 2. The results of the landscape pattern indices shown in Table 2 are analyzed using regression analysis, and the trend of the changes, as shown in Figure 3, for the 22 years of 1992 through 2013 years is obtained.

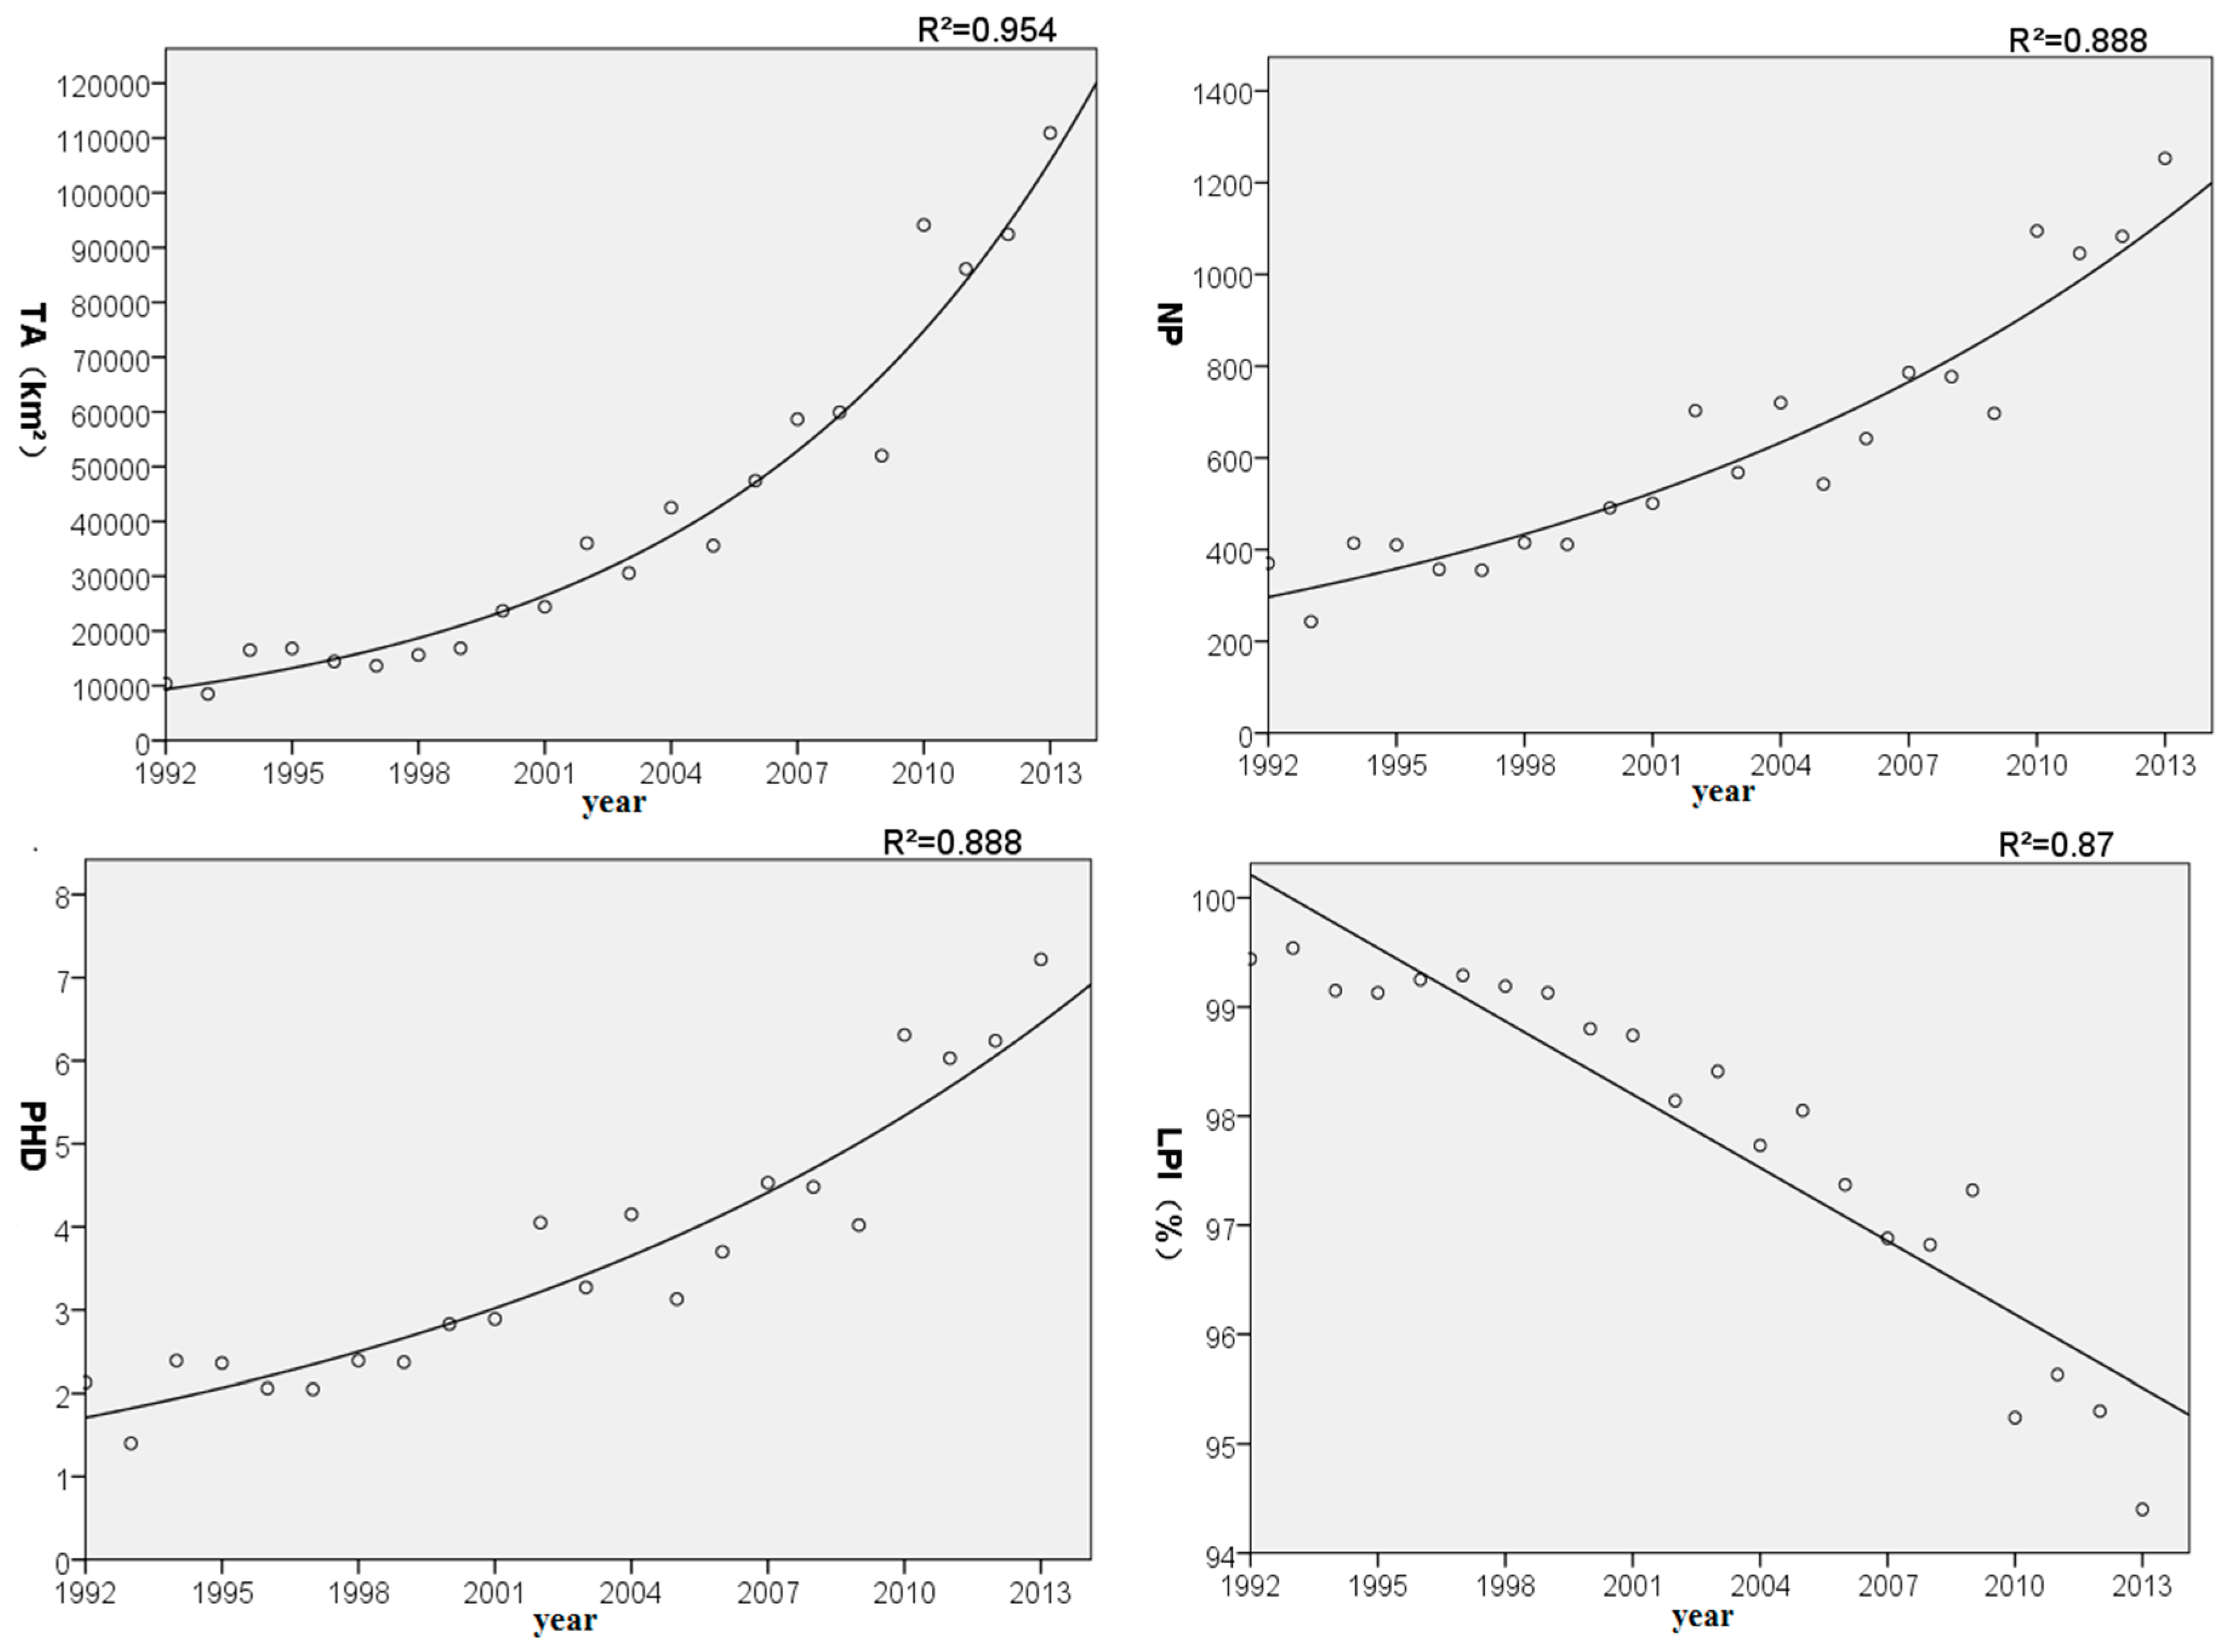
4.1.1. Trends in the Indicators of Total Landscape Area, Total Plaque and Plaque Density

Landscape pattern indices can be used to quantify the spatial pattern (composition and configuration) of land cover features [50]. The three indicators of the total landscape area (TA), total plaque number (NP), and plaque density (PDh) show an increasing trend year by year, reflecting the overall development of the Yangtze River Economic Belt in the process of urbanization expansion. The area and the number of towns have been increasing. The average annual growth rate of these three indicators has reached 44.01%, 10.85%, and 10.86%, respectively, and the increase in 2003–2013 is significantly higher than the increase in 1992–2002, especially for 2010. The increase in 2013 was the most obvious. Specifically, the increase in isolated urban sectors is more obvious, indicating that during the 22-year period from 1992 through 2013, there were more small and medium-sized cities and emerging towns in the Yangtze River Economic Belt. However, the fluctuations of these three indicators are also more obvious, in particular the fluctuations of the two stages in 1992–1998 and 2003–2010 are the most obvious. The three indicators also show obvious correlation, further reflecting instability and volatility in the process of development and growth within the Yangtze River Economic Belt.

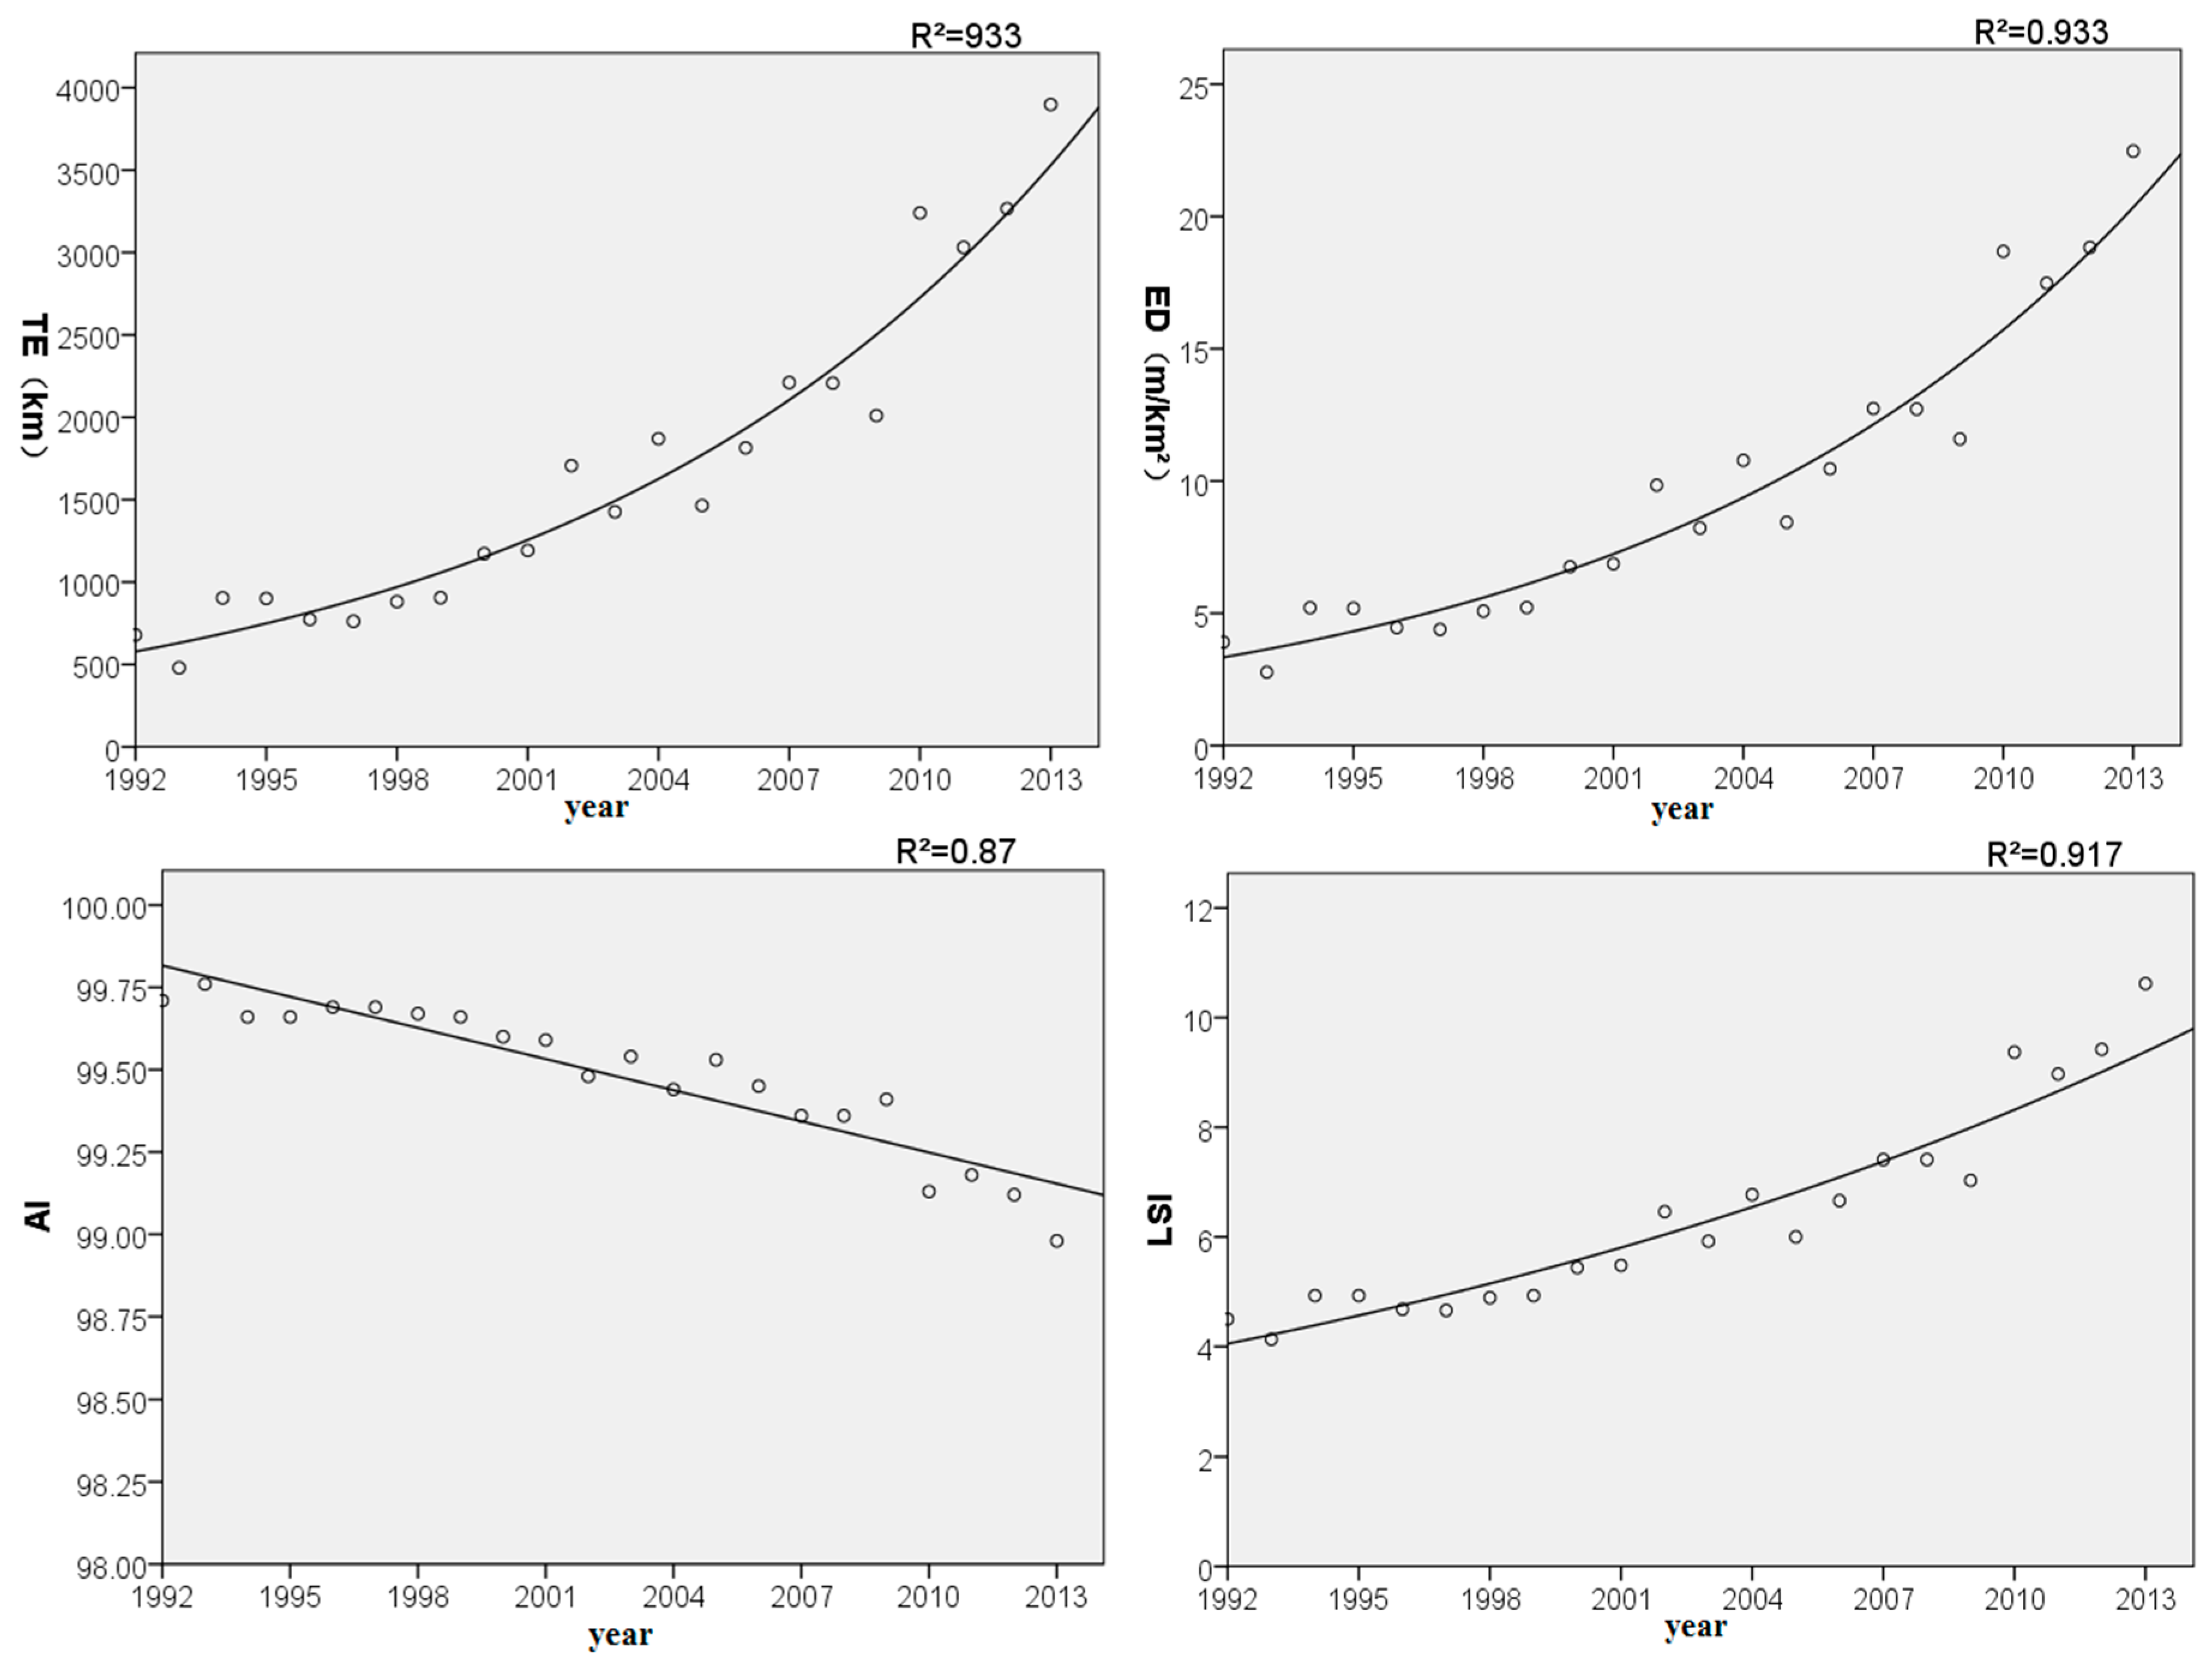
4.1.2. Trends in the Indicators of Total Boundary Length, Average Boundary Density and Landscape Shape Index

The three indicators of the total boundary length (TE), average boundary density (ED), and landscape shape index (LSI) also have an increasing trend year by year, and the average annual growth rate of the total boundary length (TE) and average boundary density (ED) are 21.56% and 21.58% respectively. The increase in 2003–2013 is significantly higher than that in 1992–2002. The increase in landscape shape index (LSI) is 6.18%, indicating that the shape complexity of urban areas in the Yangtze River Economic Belt is gradually increasing. Further showing that the Yangtze River Economic Belt is becoming increasingly concentrated in cities and towns, and the mutual influence is increasing. However, the fluctuations of the development of these three indicators are also obvious, especially in 1992–1998 and 2003–2010. The fluctuations of the two phases are relatively large, which reflects the uncoordinated and irregular nature of the development of the Yangtze River Economic Belt, which lacks a rational division of labor and the core role of the internal cities.

4.1.3. Trends in the Indicators of Maximum Plaque Index and Aggregation Index

The two indicators of the maximum plaque index (LPI) and the aggregation index (AI) are characterized by a year-on-year decline. The fluctuation of the largest plaque index (LPI) is the most obvious and can be clearly be seen in 2001–2013. The maximum plaque index (LPI) fluctuates the most, indicating that there is uncertainty in the change of the core urban area of the urban agglomeration and that it is characterized by irregularity and disorder. Therefore, we need to concentrate on promoting the development of core cities; the change of the aggregation index (AI) shows the characteristics of gradual decline year by year, reflecting that in the process of urbanization development of the Yangtze River Economic Belt the relations between cities and towns are increasingly becoming closer with more frequent exchanges and that the degree of fragmentation is gradually being reduced. The level of development continues to increase.

4.2. Countermeasures and Suggestions on Optimizing the Development of Spatial Pattern of Urban System in the Yangtze River Economic Belt

4.2.1. Implementation of the Outline of the Development Plan for the Yangtze River Economic Belt and a Formulation of Other Relevant Plans with High Specifications

In June 2016, the programmatic document accompanying the “Outline for the Development of the Yangtze River Economic Belt”, a major national strategy for promoting the development of the Yangtze River Economic Belt, was officially issued, marking the more programmatic, detailed, and specific development of the Yangtze River Economic Belt. The Yangtze River Economic Belt covers 11 provinces and cities, such as Shanghai, Jiangsu, Zhejiang, Anhui, Jiangxi, Hubei, Hunan, Chongqing, Sichuan, Yunnan, and Guizhou. There must be certain barriers within the region. Therefore, the development of the Yangtze River Economic Belt must implement the Yangtze River. The Outline of Economic Belt Development Plan actively promotes the coordination, exchanges and interactions of the Yangtze River Economic Belt in Shanghai, Nanjing, Hangzhou, Wuhan, Chongqing, and Chengdu, as well as other cities and regions in the fields of economy, trade, tourism, and culture in order to achieve a rational regional division of labor and coordinated development of the Yangtze River Economic Belt. For the other relevant plans for the Yangtze River Economic Belt to finally be developed rapidly, high standards are required, and ecological and efficiency concerns are both considered equally.

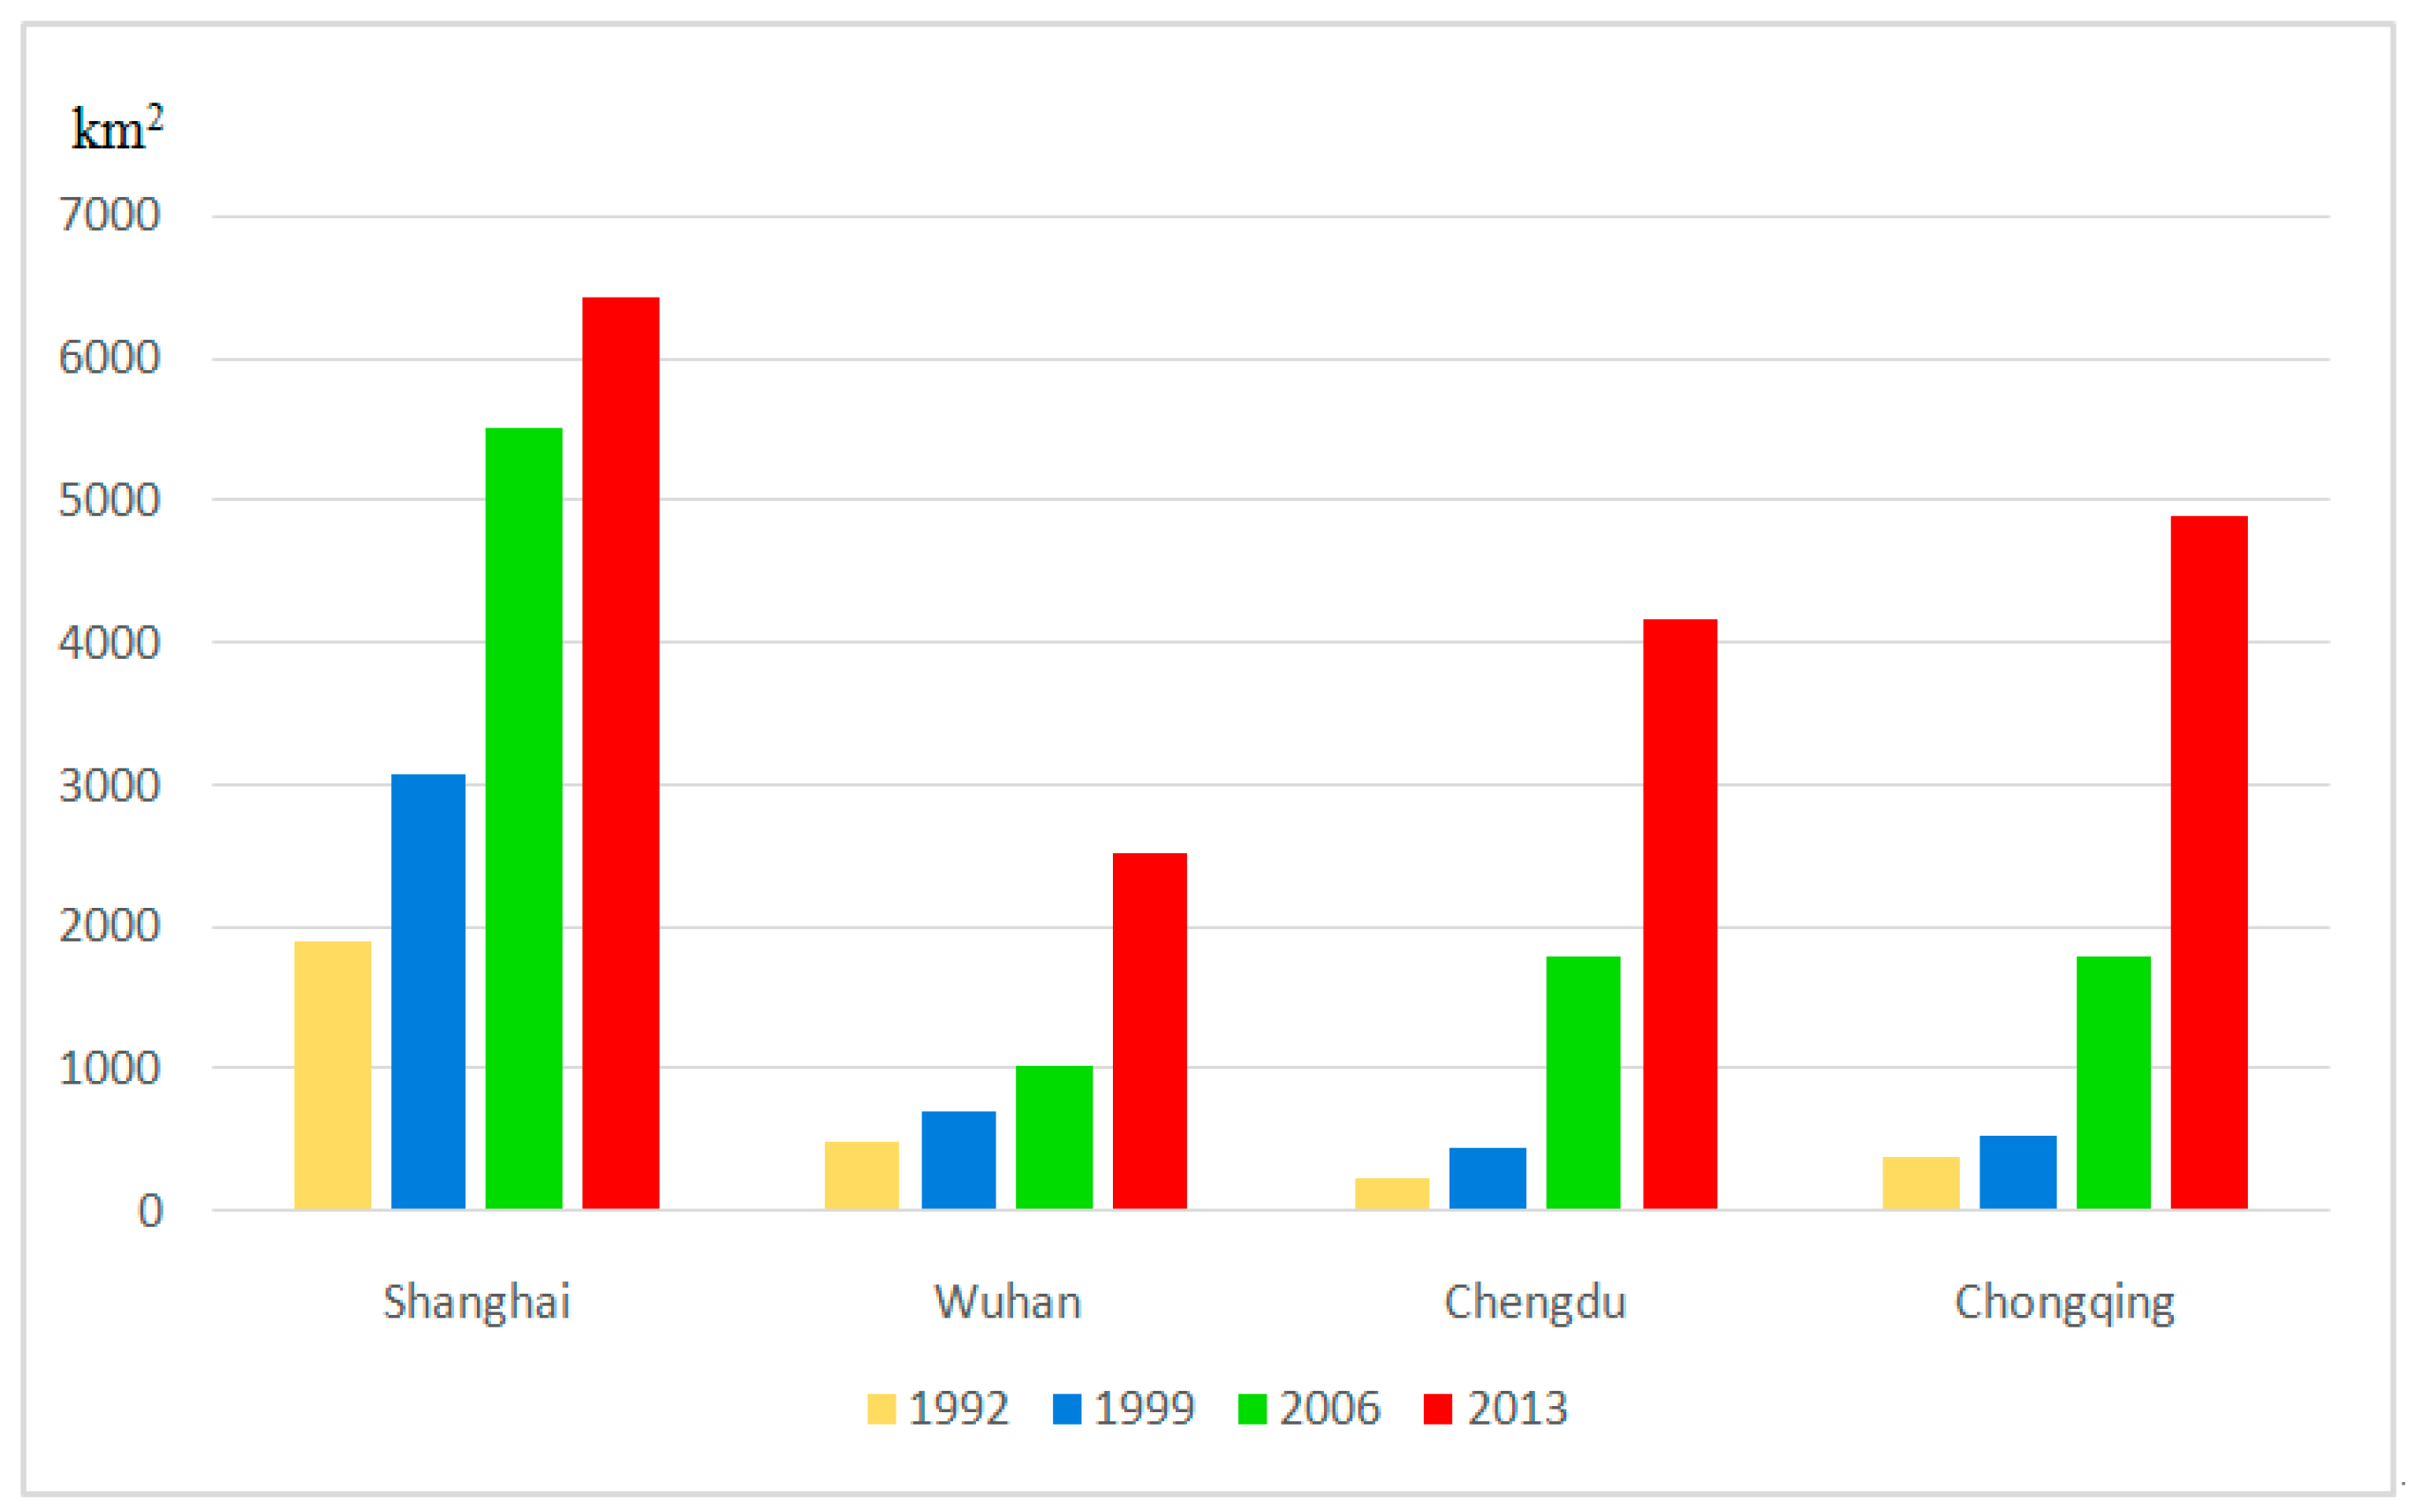
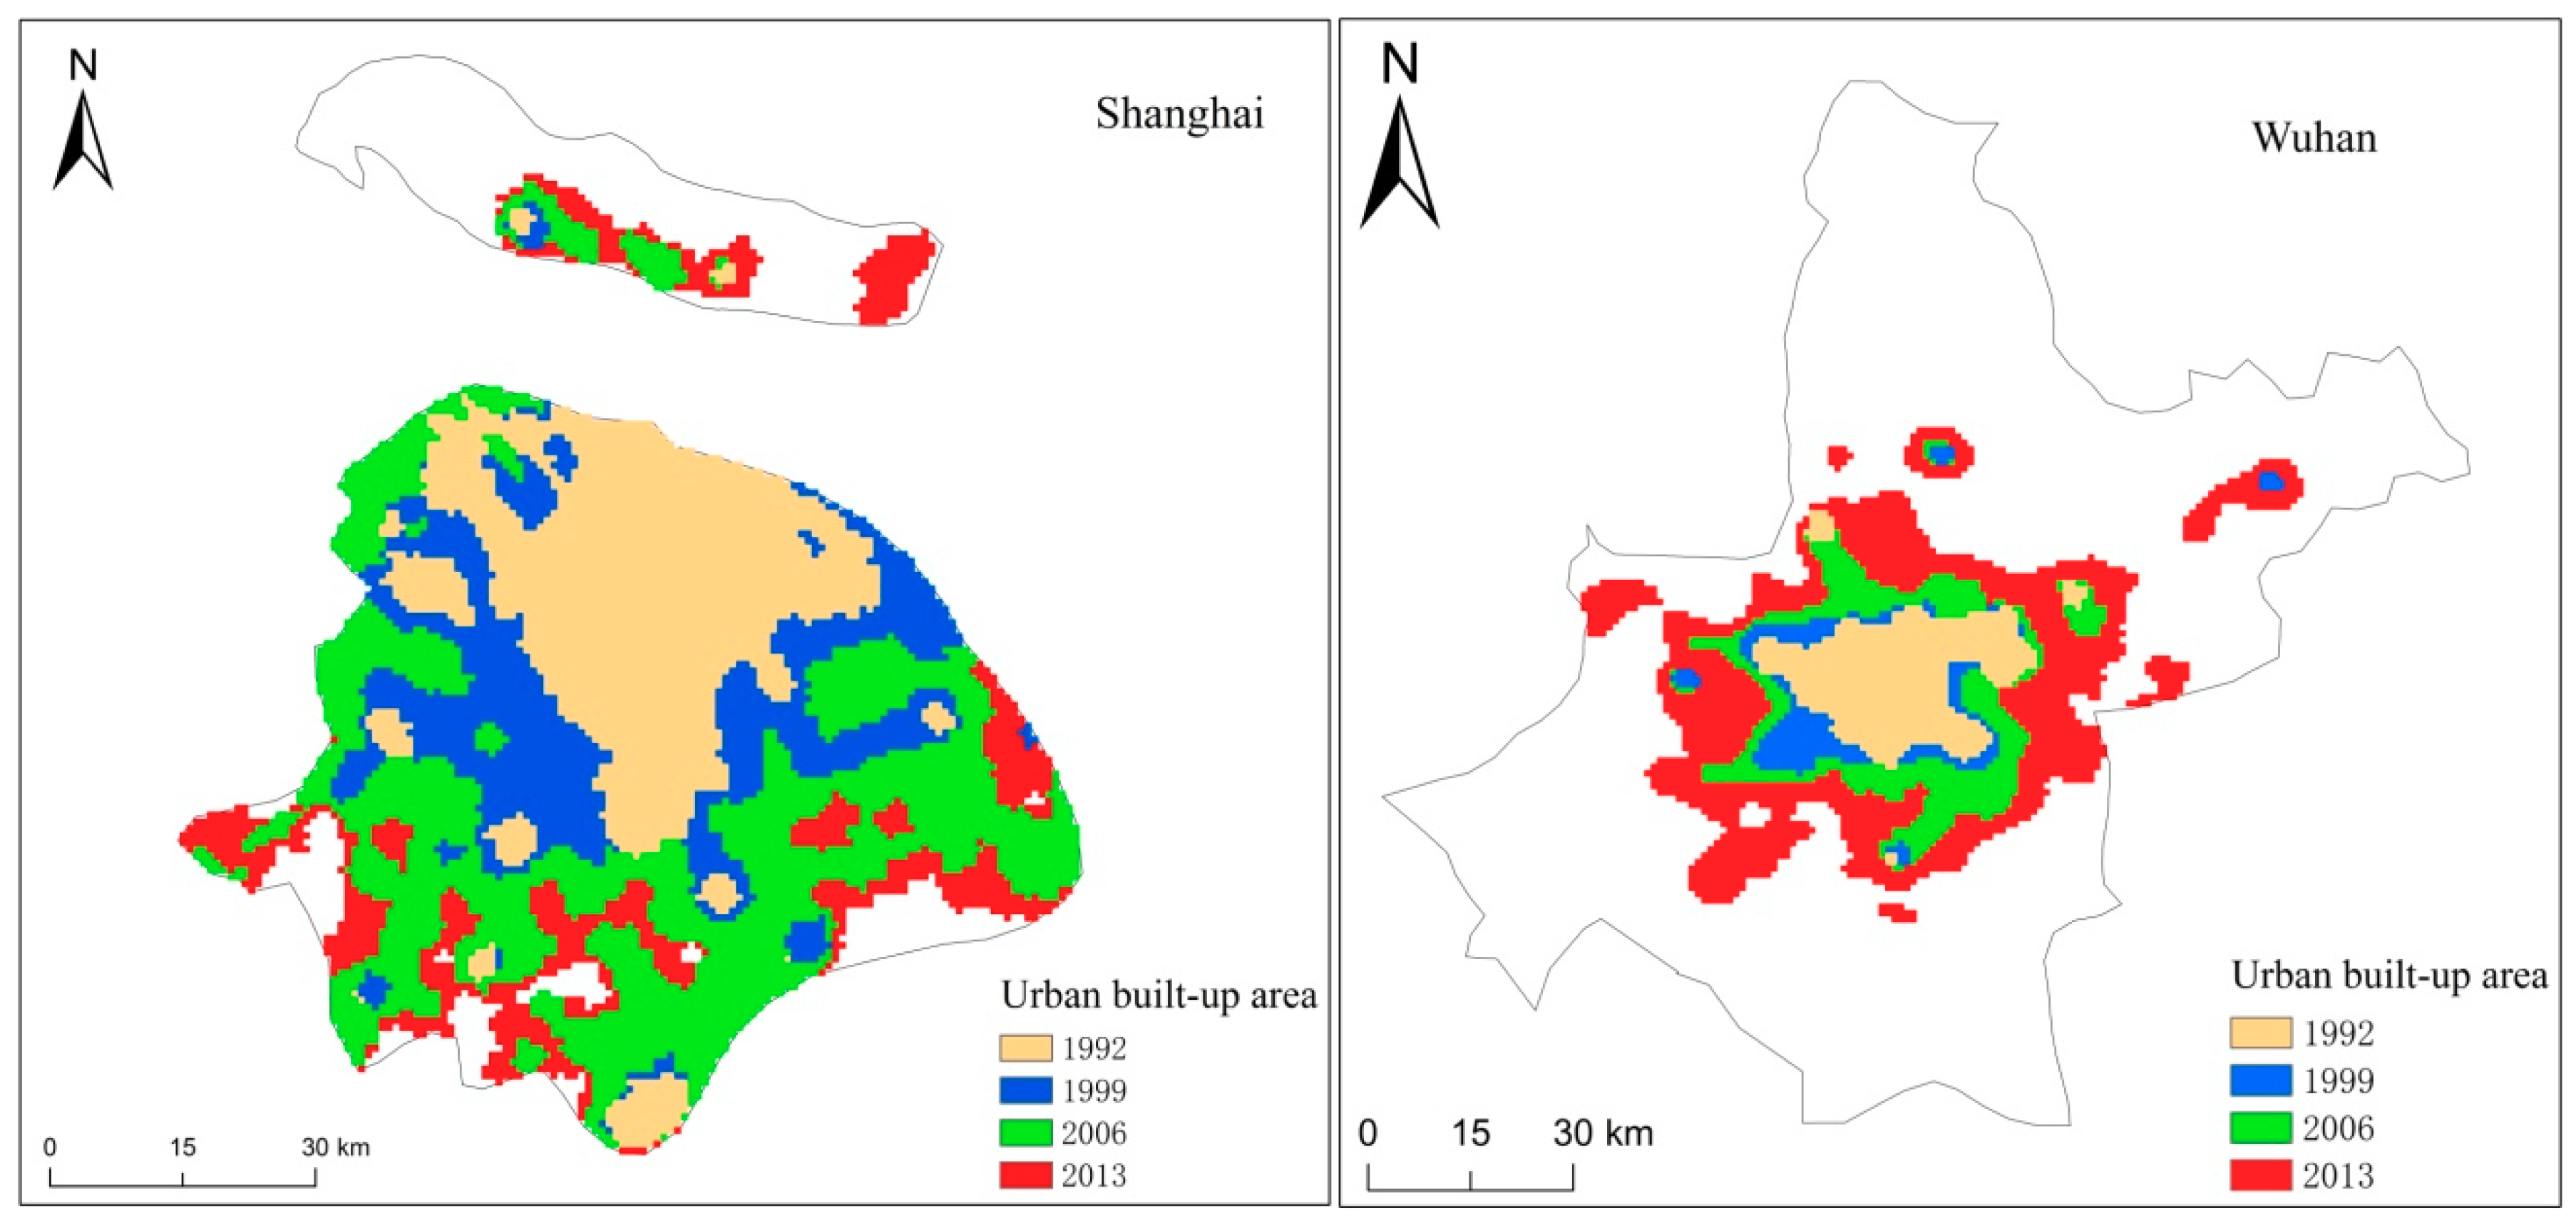
4.2.2. Concentration on the Development of Shanghai, Wuhan, Chengdu and Chongqing, and the Enhancement of the Core Role and Radiation of These Four Core Cities

The Yangtze River Economic Belt has four core cities, namely, Shanghai, Wuhan, Chengdu, and Chongqing. They are the core growth poles of the Yangtze River Delta urban agglomeration, the middle reaches of the Yangtze River and the Chengdu–Chongqing urban agglomeration. They have obvious advantages within their respective urban agglomerations. They are the key to the development of the Yangtze River Economic Belt and its respective suburban clusters. However, within the Yangtze River Delta urban agglomeration, the middle reaches of the Yangtze River and the Chengdu–Chongqing urban agglomeration, the core functions of these four core cities are different. Presently, Shanghai’s urban strength and influence play a vital role in the development of the Yangtze River Delta urban agglomeration, and it is the core of the entire Yangtze River Economic Belt. Shanghai’s core needs to be further strengthen to play a leading role. Wuhan City’s strength and influence are at the core of the middle reaches of the Yangtze River, but the middle reaches of the Yangtze River cover Hubei Province, Hunan Province, and Jiangxi Province. Therefore, it is necessary to further accelerate the development of Wuhan City and promote cooperation and exchange within the region; Chengdu and Chongqing are at the core of Chengdu–Chongqing City Group. As the capital of Sichuan Province, Chengdu plays a key role in driving the development of Sichuan Province. As the only municipality in the western region of China, Chongqing has a superior development advantage. It is necessary to further promote the development of Chengdu and Chongqing, to simultaneously increase the interaction between the two core cities, and ultimately to drive the development of the entire Chengdu–Chongqing urban agglomeration. Therefore, it is necessary to further strengthen the role of the first city in the four core cities and ultimately to achieve a point-to-face development pattern.

4.2.3. Actively Develop Large and Medium-Sized Cities and Steadily Expand the Scale of Development of Small Towns, thus Building a Scientific and Rational Town Hierarchy

The megacities and large cities in the Yangtze River Economic Belt are mainly concentrated in the Yangtze River Delta. In the central and western regions of the Yangtze River Economic Belt, except for the provincial capitals, which are large or large cities, the cities are mostly large and medium-sized cities, accompanied by the Yangtze River Economic Belt. The development of small and medium-sized cities has further expanded, and many new small towns have emerged. However, the urban development of the Yangtze River Economic Belt is characterized by irregularity and disorder, reflecting the unreasonable urban structure of the Yangtze River Economic Belt. Therefore, it is necessary to actively develop large, medium, and small-sized cities, build a green development axis along the Yangtze River, and support the cultivation of local growth poles, so that large, medium, and small cities can effectively share some of the functions of the first city, promote their rapid growth, and become the first city to contact. Important bridges between small and medium-sized cities, while steadily expanding the scale of development of small towns, adhere to the path of new urbanization, improve the quality of urban development and development, select and cultivate some towns with development prospects, and gradually upgrade their development to small cities, thus producing the ultimate scientific and reasonable town unit.

4.3. Evolution Process of the Spatial Pattern of Urban Systems in the Yangtze River Economic Belt

Urban expansion is a geospatial process with unique characteristics [51]. In this study, DMSP-OLS nighttime stable lighting data was used, and the spatial pattern evolution map of urban construction land in the Yangtze River Economic Belt in 1992, 1999, 2006, and 2013 was extracted using the comparative method based on auxiliary data, as well as Shanghai, Wuhan, and Chengdu. The scope of urban built-up areas within the administrative scope of the city and the four cities of Chongqing is shown in Figure 4, Figure 5 and Figure 6. With the development of a social economy, the urbanization rate of the entire Yangtze River Economic Belt has been accelerating, and the urban built-up areas of the four core cities of Shanghai, Wuhan, Chengdu, and Chongqing have been greatly expanded.
Urbanisation is a dynamic complex phenomenon involving large scale changes in the land uses at local levels. Analyses of changes in land uses in urban environments provide a historical perspective of land use and give an opportunity to assess the spatial patterns, correlation, trends, rate, and impacts of the change, which would help in better regional planning and good governance of the region [52]. At present, China’s urban agglomerations are in rapid expansion, among which are the Yangtze River Economic Belt, around the Bo sea City Group, the Yangtze River Delta City Group, and the Pearl River Delta City Group. As the main representative, unlike the around the Bo sea City Group, the Yangtze River Delta urban agglomeration and the Pearl River Delta urban agglomeration, the Yangtze River Economic Belt Strategy is a new regional open development strategy for China’s new round of reform and opening up transformation, and is a global influential inland economic belt. The coordinated development zone of interaction and cooperation with the eastern, central and western regions, and the development of its four core cities (Shanghai, Wuhan, Chongqing, and Chengdu) are extremely important for the development of the city along the Yangtze River Economic Belt. The urban built-up area of Shanghai increased from 1897.99 km2 in 1992 to 6419.93 km2 in 2013, an increase of 2.38 times over 22 years. The urban built-up area of Wuhan increased from 501.37 km2 in 1992 to 2 516.35 km2 in 2013, an increase of 4.02 times over 22 years. The urban built-up area of Chengdu increased from 245.33 km2 in 1992 to 4157.96 km2 in 2013, an increase of 15.95 times over 22 years, the highest increase among the three core cities in the middle reaches of the Yangtze River. The urban built-up area of Chongqing has increased from 377.80 km2 in 1992 to 4878.17 km2 in 2013, an increase of 11.9 times over 22 years, and the increase is also obvious. The area of urban built-up area in the four core cities of the Yangtze River Economic Zone is expanding continuously, and the overall strength of the city has been promoted continuously, thus ensuring the leading role of the core growth pole in the rise of the four core cities in the development and rise of the middle reaches of the Yangtze River.

5. Conclusions

Based on the perspective of DMSP/OLS nighttime lighting data, this paper studies the spatial pattern evolution of the Yangtze River Economic Belt from 1992 to 2013 for a total of 22 years. The results show that the following: (1) During the period from 1992 to 2013, the urbanization of the Yangtze River Economic Belt expanded rapidly, and the urban built-up area increased by 9.68 times, the number of plaques increased by 2.39 times, and the plaque density also increased greatly, reflecting the increasing number of towns in the Yangtze River Economic Belt; (2) The complexity of the landscape plaque shape gradually increased, and the small and medium-sized cities continued to grow. There are more emerging small towns. The average annual growth rate of total boundary length and average boundary density is 21.56% and 21.58%, respectively. (3) The two indicators of the maximum plaque index and the aggregation index show a downward trend year by year, but eight indicators, including the total landscape area, total plaque number and plaque density, existed during the evolution process. Certain fluctuations and disordering reflect the characteristics of the Yangtze River Economic Belt showing irregularity and disorder in the process of urbanization. Additionally, the countermeasures and suggestions for optimizing the spatial pattern of the Yangtze River Economic Belt based on the evolution of the spatial pattern of the Yangtze River Economic Belt have certain guiding significance for promoting the optimization of the spatial pattern of the Yangtze River Economic Belt.
The Yangtze River Economic Belt Development Strategy is an important measure for China to promote new urbanization and coordinated development of East, Central, and West. Therefore, it is obvious that the study of the spatial pattern of the urban system of the Yangtze River Economic Belt in China has certain significance and value. The DMSP/OLS nighttime lighting satellite data has unparalleled advantages for monitoring urbanization and analyzing the evolution of urban spatial patterns. Based on this, this paper combines multiple data sources, such as Landsat satellite data, land use data, vegetation index data, surface temperature data and statistical data, and uses an auxiliary data comparison method, a quadratic regression function method, cluster analysis, a landscape pattern analysis method, a regression analysis, and other methods to ensure the extraction of nighttime light thresholds; these data calculation processes and analyses of research results have a high degree of feasibility. However, in practical applications, there are problems, such as the low resolution of the DMSP/OLS nighttime lighting satellite data, resulting in low data accuracy in small urban areas, such as small cities, county towns and small towns, and more detailed data through higher resolution data would be valuable. Quantitative research can improve this situation, so future research should be performed.

Author Contributions

Writing—original draft, Y.Z.; Writing—review & editing, A.L.; Participate in data processing and analysis, Z.Z. and F.C.

Funding

Simulation Study on Early Warning Response of Agricultural Drought and Hydrological Drought to Meteorological Drought: 41301586.

Conflicts of Interest

The authors declare no conflict of interest.

References

  1. Yao, S.M.; Zhu, Y.M.; Chen, Z.G. Chinese City Group; University of Science and Technology Press: Hefei, China, 2001. (In Chinese) [Google Scholar]
  2. Wu, S.D.; Li, T.T. Industrial Spatial Structure and Evolution of the Hercynian Urban Agglomeration. Geogr. Sci. 2011, 31, 309–315. (In Chinese) [Google Scholar]
  3. Fang, C.L.; Yu, D.L. Urban agglomeration: An evolving concept of an emerging phenomenon. Landsc. Urban Plan. 2017, 162, 126–136. [Google Scholar] [CrossRef]
  4. Mehebub, S.; Haoyuan, H.; Haroon, S. Analyzing urban spatial patterns and trend of urban growth using urban sprawl matrix: A study on Kolkata urban agglomeration, India. Sci. Total Environ. 2018, 628–629, 1557–1566. [Google Scholar]
  5. Yang, Y.Y.; Liu, Y.S.; Liu, Y.R.; Du, G.M. Quantifying spatio-temporal patterns of urban expansion in Beijing during 1985–2013 with rural-urban development transformation. Land Use Policy 2018, 74, 20–230. [Google Scholar] [CrossRef]
  6. Oriol, N.L.; Joan, L.; Jordi, M.; Jordi, C. Energy and urban form. The growth of European cities on the basis of night-time brightness. Land Use Policy 2017, 61, 103–112. [Google Scholar]
  7. Tong, L.Y.; Hu, S.G.; Frazier, A.E.; Liu, Y.S. Multi-order urban development model and sprawl patterns: An analysis in China, 2000–2010. Landsc. Urban Plan. 2017, 167, 386–398. [Google Scholar] [CrossRef]
  8. Huang, X.M.; Schneider, A.; Friedl, M.A. Mapping sub-pixel urban expansion in China using MODIS and DMSP/OLS nighttime lights. Remote Sens. Environ. 2017, 175, 92–108. [Google Scholar] [CrossRef]
  9. Zhou, Y.Y.; Steven, S.J.; Elvidge, C.D.; Zhao, K.G.; Thomson, A.; Imhoff, M. A cluster-based method to map urban area from DMSP/OLS nightlights. Remote Sens. Environ. 2014, 147, 173–185. [Google Scholar] [CrossRef]
  10. Zhou, L.J.; Klaus, H.; Mark, R. Analysis of spatial patterns of urban growth across South Asia using DMSP-OLS nighttime lights data. Appl. Geogr. 2015, 63, 292–303. [Google Scholar] [CrossRef]
  11. He, J.H.; Li, C.; Yu, Y.; Liu, Y.L.; Huang, J.L. Measuring urban spatial interaction in Wuhan Urban Agglomeration, Central China: A spatially explicit approach. Sustain. Cities Soc. 2017, 32, 569–583. [Google Scholar] [CrossRef]
  12. Jing, Y.; Liu, Y.L.; Cai, E.X.; Liu, Y.; Zhang, Y. Quantifying the spatiality of urban leisure venues in Wuhan, Central China—GIS-based spatial pattern metrics. Sustain. Cities Soc. 2018, 40, 638–647. [Google Scholar] [CrossRef]
  13. Chao, F.; Soe, M. A comparison of spatial autocorrelation indices and landscape metrics in measuring urban landscape fragmentation. Landsc. Urban Plan. 2014, 121, 117–128. [Google Scholar]
  14. Zhang, D.; Huang, Q.X.; He, C.Y.; Yin, D.; Liu, Z.W. Planning urban landscape to maintain key ecosystem services in a rapidly urbanizing area: A scenario analysis in the Beijing-Tianjin-Hebei urban agglomeration, China. Ecol. Indic. 2019, 96, 559–571. [Google Scholar] [CrossRef]
  15. Li, G.D.; Sun, S.; Fang, C.L. The varying driving forces of urban expansion in China: Insights from a spatial-temporal analysis. Landsc. Urban Plan. 2018, 174, 63–77. [Google Scholar] [CrossRef]
  16. Zhang, Q.S.; Yan, W. Study on the Urban Spatial Structure of Gui-zhou Province Based on Gravity Model. J. Southwest China Normal Univ. 2015, 40, 101–105. (In Chinese) [Google Scholar]
  17. Huang, J.; Zhong, Y.X. Passenger Transport by Urban Rail Transit in the Midstream of the Yangtze River and Its Spatial Pattern Evolution. World Geogr. Study 2016, 25, 72–81. (In Chinese) [Google Scholar]
  18. Tian, G.J.; Wu, J.G.; Yang, Z.F. Spatial pattern of urban functions in the Beijing metropolitan region. Habitat Int. 2010, 34, 249–255. [Google Scholar] [CrossRef]
  19. Tian, Y.; Sun, C.W. Comprehensive carrying capacity, economic growth and the sustainable development of urban areas: A case study of the Yangtze River Economic Belt. J. Clean. Prod. 2018, 195, 486–496. [Google Scholar] [CrossRef]
  20. Sun, C.W.; Chen, L.T.; Tian, Y. Study on the urban state carrying capacity for unbalanced sustainable development regions: Evidence from the Yangtze River Economic Belt. Ecol. Indic. 2018, 89, 150–158. [Google Scholar] [CrossRef]
  21. Gu, Q.W.; Wang, H.Q.; Zheng, Y.M.; Zhu, J.W.; Li, X.K. Ecological footprint analysis for urban agglomeration sustainability in the middle stream of the Yangtze River. Ecol. Model. 2015, 318, 86–99. [Google Scholar] [CrossRef]
  22. Chen, Y.S.; Zhang, S.H.; Huang, D.S.; Li, B.L.; Liu, J.G.; Ma, T.; Wang, F.; Wang, Y.; Wu, S.J.; Wu, Y.G.; et al. The development of China’s Yangtze River Economic Belt: How to make it in a green way? Sci. Bull. 2017, 62, 648–651. [Google Scholar] [CrossRef]
  23. Jin, G.; Deng, X.Z.; Zhao, X.D.; Guo, B.S.; Yang, J. Spatiotemporal patterns in urbanization efficiency within the Yangtze River Economic Belt between 2005 and 2014. J. Geogr. Sci. 2018, 28, 1113–1126. [Google Scholar] [CrossRef]
  24. Liu, Y.L.; Zhang, X.H.; Kong, X.L.; Wang, R.; Chen, L. Identifying the relationship between urban land expansion and human activities in the Yangtze River Economic Belt, China. Appl. Geogr. 2018, 94, 163–177. [Google Scholar] [CrossRef]
  25. Wang, D.G.; Sun, F. Accessibility and urbanization of land transportation in the Yangtze River Economic Belt Spatial coupling coordination. Geogr. Sci. 2018, 38, 1089–1097. (In Chinese) [Google Scholar]
  26. Lu, S.R.; Jiang, H.Y.; Liu, Y.; Huang, S. Regional disparities and influencing factors of Average CO2 Emissions from transportation industry in Yangtze River Economic Belt. Transp. Res. Part D 2017, 57, 112–123. [Google Scholar] [CrossRef]
  27. Li, L.; Liu, Y. Industrial Green Spatial Pattern Evolution of Yangtze River Economic Belt in China. Chin. Geogr. Sci. 2017, 27, 660–672. [Google Scholar] [CrossRef]
  28. Cheng, Y.; Liu, W.; Lu, J. Financing Innovation in the Yangtze River Economic Belt: Rationale and Impact on Firm Growth and Foreign Trade. Can. Public Policy 2017, 43, 122–135. [Google Scholar] [CrossRef]
  29. Croft, T. Nighttime images of the earth from space. Sci. Am. 1978, 239, 68–79. [Google Scholar] [CrossRef]
  30. Yang, Y.; Huang, Q.X.; Zhang, L.L. Study on Temporal and Spatial Measurement of Land Urbanization Based on DMSP/OLS Night Light Data-A Case Study of the Bohai Rim Region. Econ. Geogr. 2015, 35, 141–149. (In Chinese) [Google Scholar]
  31. Small, C.; Pozzi, F.; Elvidge, C.D. Spatial analysis of global urban extent from DMSP-OLS night lights. Remote Sens. Environ. 2005, 24, 277–291. [Google Scholar] [CrossRef]
  32. Small, C.; Elvidge, C.D.; Balk, D. Spatial scaling of stable night lights. Remote Sens. Environ. 2011, 115, 269–280. [Google Scholar] [CrossRef]
  33. Long, F.J.; Zheng, L.F.; Song, Z.D. High-speed rail and urban expansion: An empirical study using a time series of nighttime light satellite data in China. J. Transp. Geogr. 2018, 72, 106–118. [Google Scholar] [CrossRef]
  34. Ting, M.; Zhou, C.H.; Pei, T.; Haynie, S.; Fan, J.F. Quantitative estimation of urbanization dynamics using time series of DMSP/OLS nighttime light data: A comparative case study from China’s cities. Remote Sens. Environ. 2012, 124, 99–107. [Google Scholar]
  35. Cai, D.L.; Fraedrich, K.; Guan, Y.N.; Guo, S.; Zhang, C.Y. Urbanization and the thermal environment of Chinese and US-American cities. Sci. Total Environ. 2017, 589, 200–211. [Google Scholar] [CrossRef] [PubMed]
  36. Tan, M.H.; Li, X.B.; Li, S.J.; Xin, L.J.; Wang, X.; Li, W.; Li, Y.Y.; Xiang, W.L. Modeling population density based on nighttime light images and land use data in China. Appl. Geogr. 2017, 90, 239–247. [Google Scholar] [CrossRef]
  37. Mia, M.B.; Laurence, C.S. Advances in using multitemporal night-time lights satellite imagery to detect, estimate, and monitor socioeconomic dynamics. Remote Sens. Environ. 2017, 192, 176–197. [Google Scholar]
  38. Kumar, P.; Sajjad, H.; Joshi, P.K.; Elvidge, C.D.; Rehman, S.; Chaudhary, B.S.; Tripathy, B.R.; Singh, J.; Pipal, G. Modeling the luminous intensity of Beijing, China using DMSP-OLS nighttime lights series data for estimating population density. Phys. Chem. Earth 2018, 6. [Google Scholar] [CrossRef]
  39. Shi, K.F.; Chen, Y.; Yu, B.L.; Xu, T.B.; Yang, C.S.; Li, L.Y.; Huang, C.; Chen, Z.Q.; Liu, R.; Wu, J.P. Detecting spatiotemporal dynamics of global electric power consumption using DMSP-OLS nighttime stable light data. Appl. Energy 2016, 184, 450–463. [Google Scholar] [CrossRef]
  40. Xie, Y.H.; Weng, Q.H. Detecting urban-scale dynamics of electricity consumption at Chinese cities using time-series DMSP-OLS (Defense Meteorological Satellite Program-Operational Linescan System) nighttime light imageries. Energy 2016, 100, 177–189. [Google Scholar] [CrossRef]
  41. Xiao, H.W.; Ma, Z.Y.; Mi, Z.F.; Kelesey, J.; Zheng, J.L.; Yin, W.H.; Yan, M. Spatio-temporal simulation of energy consumption in China’s provinces based on satellite night-time light data. Appl. Energy 2018, 231, 1070–1078. [Google Scholar] [CrossRef]
  42. Chen, J.D.; Xu, C.; Li, K. A gravity model and exploratory spatial data analysis of prefecture-scale pollutant and CO2 emissions in China. Ecol. Indic. 2018, 90, 554–563. [Google Scholar] [CrossRef]
  43. Liu, X.P.; Ou, J.P.; Wang, S.J.; Li, X.; Yan, Y.C.; Jiao, L.M.; Liu, Y.L. Estimating spatiotemporal variations of city-level energy-related CO2 emissions: An improved disaggregating model based on vegetation adjusted nighttime light data. J. Clean. Prod. 2018, 177, 101–114. [Google Scholar] [CrossRef]
  44. Zhao, J.; Chen, Y.; Ji, G.; Wang, Z. Residential carbon dioxide emissions at the urban scale for countylevel cities in China: A comparative study of nighttime light data. J. Clean. Prod. 2018, 180, 198–209. [Google Scholar] [CrossRef]
  45. Fan, J.P.; Ma, Y.; Zhou, C.H. Analysis of Spatial Pattern Changes of Urban Agglomeration around the Bohai Sea Based on DMSP-OLS Images, 1992–2010. J. Geogr. Inf. Sci. 2013, 15, 280–288. (In Chinese) [Google Scholar]
  46. He, C.Y.; Liu, Z.F.; Tian, J. Urban expansion dynamics and natural habitat loss in China: A multi-scale landscape perspec-tive. Glob. Chang. Biol. 2014, 20, 2886–2902. [Google Scholar] [CrossRef] [PubMed]
  47. Li, H.L.; Peng, J.; Liu, Y.X.; Hu, Y.N. Urbanization impact on landscape patterns in Beijing City, China: A spatial heterogeneity perspective. Ecol. Indic. 2017, 82, 50–60. [Google Scholar] [CrossRef]
  48. Feng, Y.J.; Liu, Y.; Tong, X.H. Spatiotemporal variation of landscape patterns and their spatial determinants in Shanghai, China. Ecol. Indic. 2018, 87, 22–32. [Google Scholar] [CrossRef]
  49. Virginia, H.D.; Keith, L.K. Issues in using landscape indicators to assess land changes. Ecol. Indic. 2013, 28, 91–99. [Google Scholar]
  50. Long, J.; Nelson, T.; Wulder, M. Regionalization of Landscape Pattern Indices Using Multivariate Cluster Analysis. Environ. Manag. 2010, 46, 134–142. [Google Scholar] [CrossRef] [PubMed] [Green Version]
  51. Jiao, L.M.; Liu, J.F.; Xu, G.; Dong, T.; Gu, Y.Y.; Zhang, B.E.; Liu, Y.L.; Liu, X.P. Proximity Expansion Index: An improved approach to characterize evolution process of urban expansion. Comput. Environ. Urban Syst. 2018, 70, 102–112. [Google Scholar] [CrossRef]
  52. Ramachandra, T.V.; Bharath, H.A.; Durgappa, D.S. Insights to urban dynamics through landscape spatial pattern analysis. Int. J. Appl. Earth Obs. Geoinf. 2012, 18, 329–343. [Google Scholar]
Figure 1. Yangtze River Economic Belt Location Map.
Sustainability 10 03782 g001
Figure 2. Yangtze River Economic Zone 1992, 1999, 2006, and 2013 night light data.
Sustainability 10 03782 g002
Figure 3. Change trend of landscape pattern of the Yangtze River Economic Zone in 1992–2003.
Sustainability 10 03782 g003aSustainability 10 03782 g003b
Figure 4. Statistical analysis of the area evolution of urban built-up areas in the four core cities of the Yangtze River Economic Belt.
Sustainability 10 03782 g004
Figure 5. Yangtze River Economic Belt in 1992, 1999, 2006, and 2013, showing an evolution map of four years of urban built areas.
Sustainability 10 03782 g005
Figure 6. Evolution of urban built-up areas in the four major cities of the Yangtze River Economic Belt in 1992, 1999, 2006, and 2013.
Sustainability 10 03782 g006
Table 1. 1995, 2000, and 2005 night light data clustering analysis statistics.
YearClusterBrightness Value (Average Number)ProportionTotal Size
1995110.8168.2%9072
232.4132.8%5125
2000133.8334.9%7126
211.9766.1%11,237
2005114.8166.5%9620
235.7336.5%12,373
Table 2. Calculation results of the landscape pattern of the Yangtze river economic zone from 1992 to 2013.
YearTA (km2)NPPDhLPI (%)TE (km)ED (m/km2)LSIAI
199210,383.253702.1399.44678.643.914.5099.71
19938505.452431.4099.54479.762.774.1399.76
199416,527.104142.3999.15903.925.214.9399.66
199516,805.904102.3699.13900.565.194.9399.66
199614,429.953572.0699.25773.204.464.6899.69
199713,638.653552.0599.29761.924.394.6699.69
199815,623.054152.3999.19881.285.084.8999.67
199916,855.104112.3799.13905.125.224.9399.66
200023,691.854912.8398.81172.406.765.4499.60
200124,417.555012.8998.741191.606.875.4899.59
200236,030.807034.0598.141706.649.846.4699.48
200330,555.255683.2798.411426.168.225.9299.54
200442,523.157204.1597.731870.2410.786.7799.44
200535,583.905433.1398.051464.728.446.0099.53
200647,437.006423.7097.371814.4810.466.6699.45
200758,668.957864.5396.882210.6412.747.4199.36
200859,919.457774.4896.822206.9612.727.4199.36
200952,010.556974.0297.322010.1611.597.0399.41
201094,119.6010956.3195.243240.3218.689.3799.13
201186,120.5010466.0395.633031.7617.488.9799.18
201292,424.2510836.2495.303266.1618.839.4299.12
2013110,915.2512537.2294.43898.1622.4710.6298.98

