Article

OpenZmeter: An Efficient Low-Cost Energy Smart Meter and Power Quality Analyzer

by
Eduardo Viciana
,
Alfredo Alcayde
,
Francisco G. Montoya
*,
Raul Baños
,
Francisco M. Arrabal-Campos
,
Antonio Zapata-Sierra
and
Francisco Manzano-Agugliaro
Department of Engineering, University of Almeria, 04120 Almeria, Spain
*
Author to whom correspondence should be addressed.
Sustainability 2018, 10(11), 4038; https://0-doi-org.brum.beds.ac.uk/10.3390/su10114038
Submission received: 12 October 2018 / Revised: 27 October 2018 / Accepted: 2 November 2018 / Published: 4 November 2018
(This article belongs to the Special Issue Sustainability in Mediterranean Climate)

Abstract

:
Power quality and energy consumption measurements support providers and energy users with solutions for acquiring and reporting information about the energy supply for residential, commercial, and industrial sectors. In particular, since the average number of electronic devices in homes increases year by year and their sensitivity is very high, it is not only important to monitor the total energy consumption, but also the quality of the power supplied. However, in practice, end-users do not have information about the energy consumption in real-time nor about the quality of the power they receive, because electric energy meters are too expensive and complex to be handled. In order to overcome these inconveniences, an innovative, open source, low-cost, precise, and reliable power and electric energy meter is presented that can be easily installed and managed by any inexperienced user at their own home in urban or rural areas. The system was validated in a real house over a period of two weeks, showing interesting results and findings which validate our proposal.

1. Introduction

Electric energy meters are devices that are often installed in buildings and businesses in order to measure the amount of consumed electric energy [1] (i.e. these meters are installed for billing purposes [2]). However, the increasing awareness about energy consumption is not the only concern today [3]. The quality of the supplied energy is also an important feature, so it is necessary to introduce new technologies that provide end-users with up-to-date, online, real-time information about the quantity and quality of the power supply they receive from the utility [4].
There are several commercial and research devices [5,6] that can be used to either measure the electric energy consumption or the power quality (PQ; power quality analyzers). Further, there are devices that integrate both functions, such that they include application software to download, analyze, and report energy consumption and power quality data. For example, some power quality analyzers are used by engineers, electricians, maintenance, and facilities technicians to record power quality, carry out diagnostic work on electrical systems or devices, identify energy waste in facilities (in kilowatt hours, kWh), and detect and prevent power issues before they happen. Unfortunately, they are expensive and difficult to use for unskilled users, being utilized to carry out advanced energy saving audits. We firmly believe that the introduction of new technologies based on the open source paradigm can help users to better understand how to interact with electrical devices. In this sense, the information traditionally provided by utilities has made it difficult to consider efficient energy saving scenarios.
In this paper, openZmeter (oZm), an efficient low-cost single-phase smart electric energy meter and power quality analyzer is presented. oZm is the result of six years of research under the supervision of the research group TIC221 of the University of Almeria. Thanks to a multidisciplinary group of computer and electrical engineers, it has been possible to design and build an advanced device that combines and improves many features of much more expensive commercial devices under the aegis of open source software. This is a low-cost device because it can be assembled for less than 50 USD. It can also be easily installed in buildings to retrieve and process a large amount of information regarding the power supply and energy consumption. The consumption pattern and power quality events are visualized through a user-friendly supervisory control and data acquisition (SCADA) system thanks to the implementation of a simple and intuitive interface that people without technical knowledge can easily understand.
It provides advanced usage statistics that other devices cannot provide in an affordable and structured way. It can help to find energy consumption patterns thanks to its multiple visualizations. The power required and the energy consumed can be analyzed together in such a way that the user can determine, for example, whether they are demanding less power than that which is actually contracted.
The rest of the paper is organized as follows: Section 2 presents a brief overview of electric energy metering. Section 3 presents the designed single-phase smart electric energy meter and power quality analyzer, including the technical specifications and the installation procedure in buildings. Section 4 presents an analysis of its usage in a real environment, while the main conclusions are summarized in Section 5.

2. An Overview of Electric Energy Metering

Since energy consumption is becoming more prevalent in residential, commercial, and industrial installations, the research in this topic has become significant in recent years. In particular, the rising energy prices are promoting higher levels of energy efficiency, which requires an accurate quantification and management of energy consumption. The energy management requirements at both service supplier and consumer sides promoted the evolution of smart grids [7], with the aim of reducing the generation and operation costs in power systems and the hydrocarbon emissions [8]. The smart grid is the evolution of the electrical grid thanks to using new technologies that increase the efficiency of the system and minimize outages. A smart grid is an electrical grid which includes a variety of operational and energy measures including smart meters and efficient energy resources, including renewable energy. These devices allow the electricity supplied to consumers to be controlled via two-way digital communication. Smart cities, smart buildings, and smart homes also play a key role in the new era of smart connected devices.
Smart metering favors the efficient use of energy resources by providing high-resolution data [9], such that this equipment is essential to study electrical installations and energy consumption in industrial [10], commercial [11], and residential [12] environments. In particular, real-time activity recognition for energy efficiency in buildings is a critical issue to design better buildings and automation systems [13]. In addition to the use of electric energy meters to retrieve information about the energy consumption, power quality monitoring is another important issue to be addressed [14]. Power quality analyzers allow the measurement of a wide variety of power quality parameters and events, including harmonic distortion and short-term disturbances such as transients, voltage sag, and swell or power-line flicker.
Many papers have analyzed the use of electric energy meters [15] and power quality analyzers [10] in different environments. Although there are many commercial electric energy meters and power quality analyzers, they are often expensive and difficult to use for the average consumer, being mainly used by engineers and technicians to perform maintenance activities or energy audits [16]. Only a few authors have proposed the use of low-cost devices to perform these tasks. For example, authors in [17] presented a portable battery-powered energy-logger circuit to monitor the energy harvested by different piezoelectric converters. Other researchers have designed devices that include the functionalities of a power quality analyzer, an event logger, a synchronized phasor measurement unit, and an inter-area oscillation identifier [18]. Recently, a metering system that measures the reactive energy component through the Hilbert transform in low-cost measuring devices was presented [19]. A low-cost power quality analyzer based on frequency analysis was described in [20] for monitoring the power supply waveform and to detect some power quality events. The OpenEnergyMonitor is another open source home energy monitoring system for analyzing real-time power use and daily energy consumption [21]. The key role of open source systems is also revealed in [22], where smart meters and an energy management system are integrated in the smart grid context. The increasing trend that open source resources constitute nowadays is evidenced not only for energy measurement, but for a number of scopes as shown in [23,24,25,26].
Being an open source system, you can add interesting features such as non-intrusive load monitoring (NILM), new statistics, etc., which cannot be done in closed and commercial systems. Although there are some other devices on the market, they generally have much lower functionalities. The energy monitors present on the market perform very basic functions and estimate energy with great error. oZm meets several international standards (e.g., IEC 62052 regarding energy metering) and guarantees a very small error in measurement. It is also very versatile and can display information from different sources and scopes. As shown in Table 1, oZm outperforms some very well know smart devices on the market, being the only one to simultaneously measure power, energy, frequency, voltage, current, harmonics, phase, power factor, THD, phasors, and many more. It is also the only open source system with an application programming interface (API) that allows real-time prices to be obtained from national utilities (e.g., REE in Spain) or wide set options for network communication based on Linux reliability.

3. The openZmeter (oZm)

In this section, the physical layout is described and technical specifications of the open-source and open-hardware smart electric energy meter and power quality analyzer are presented, under the name of “openZmeter” (oZm, read as “open zeta meter”).

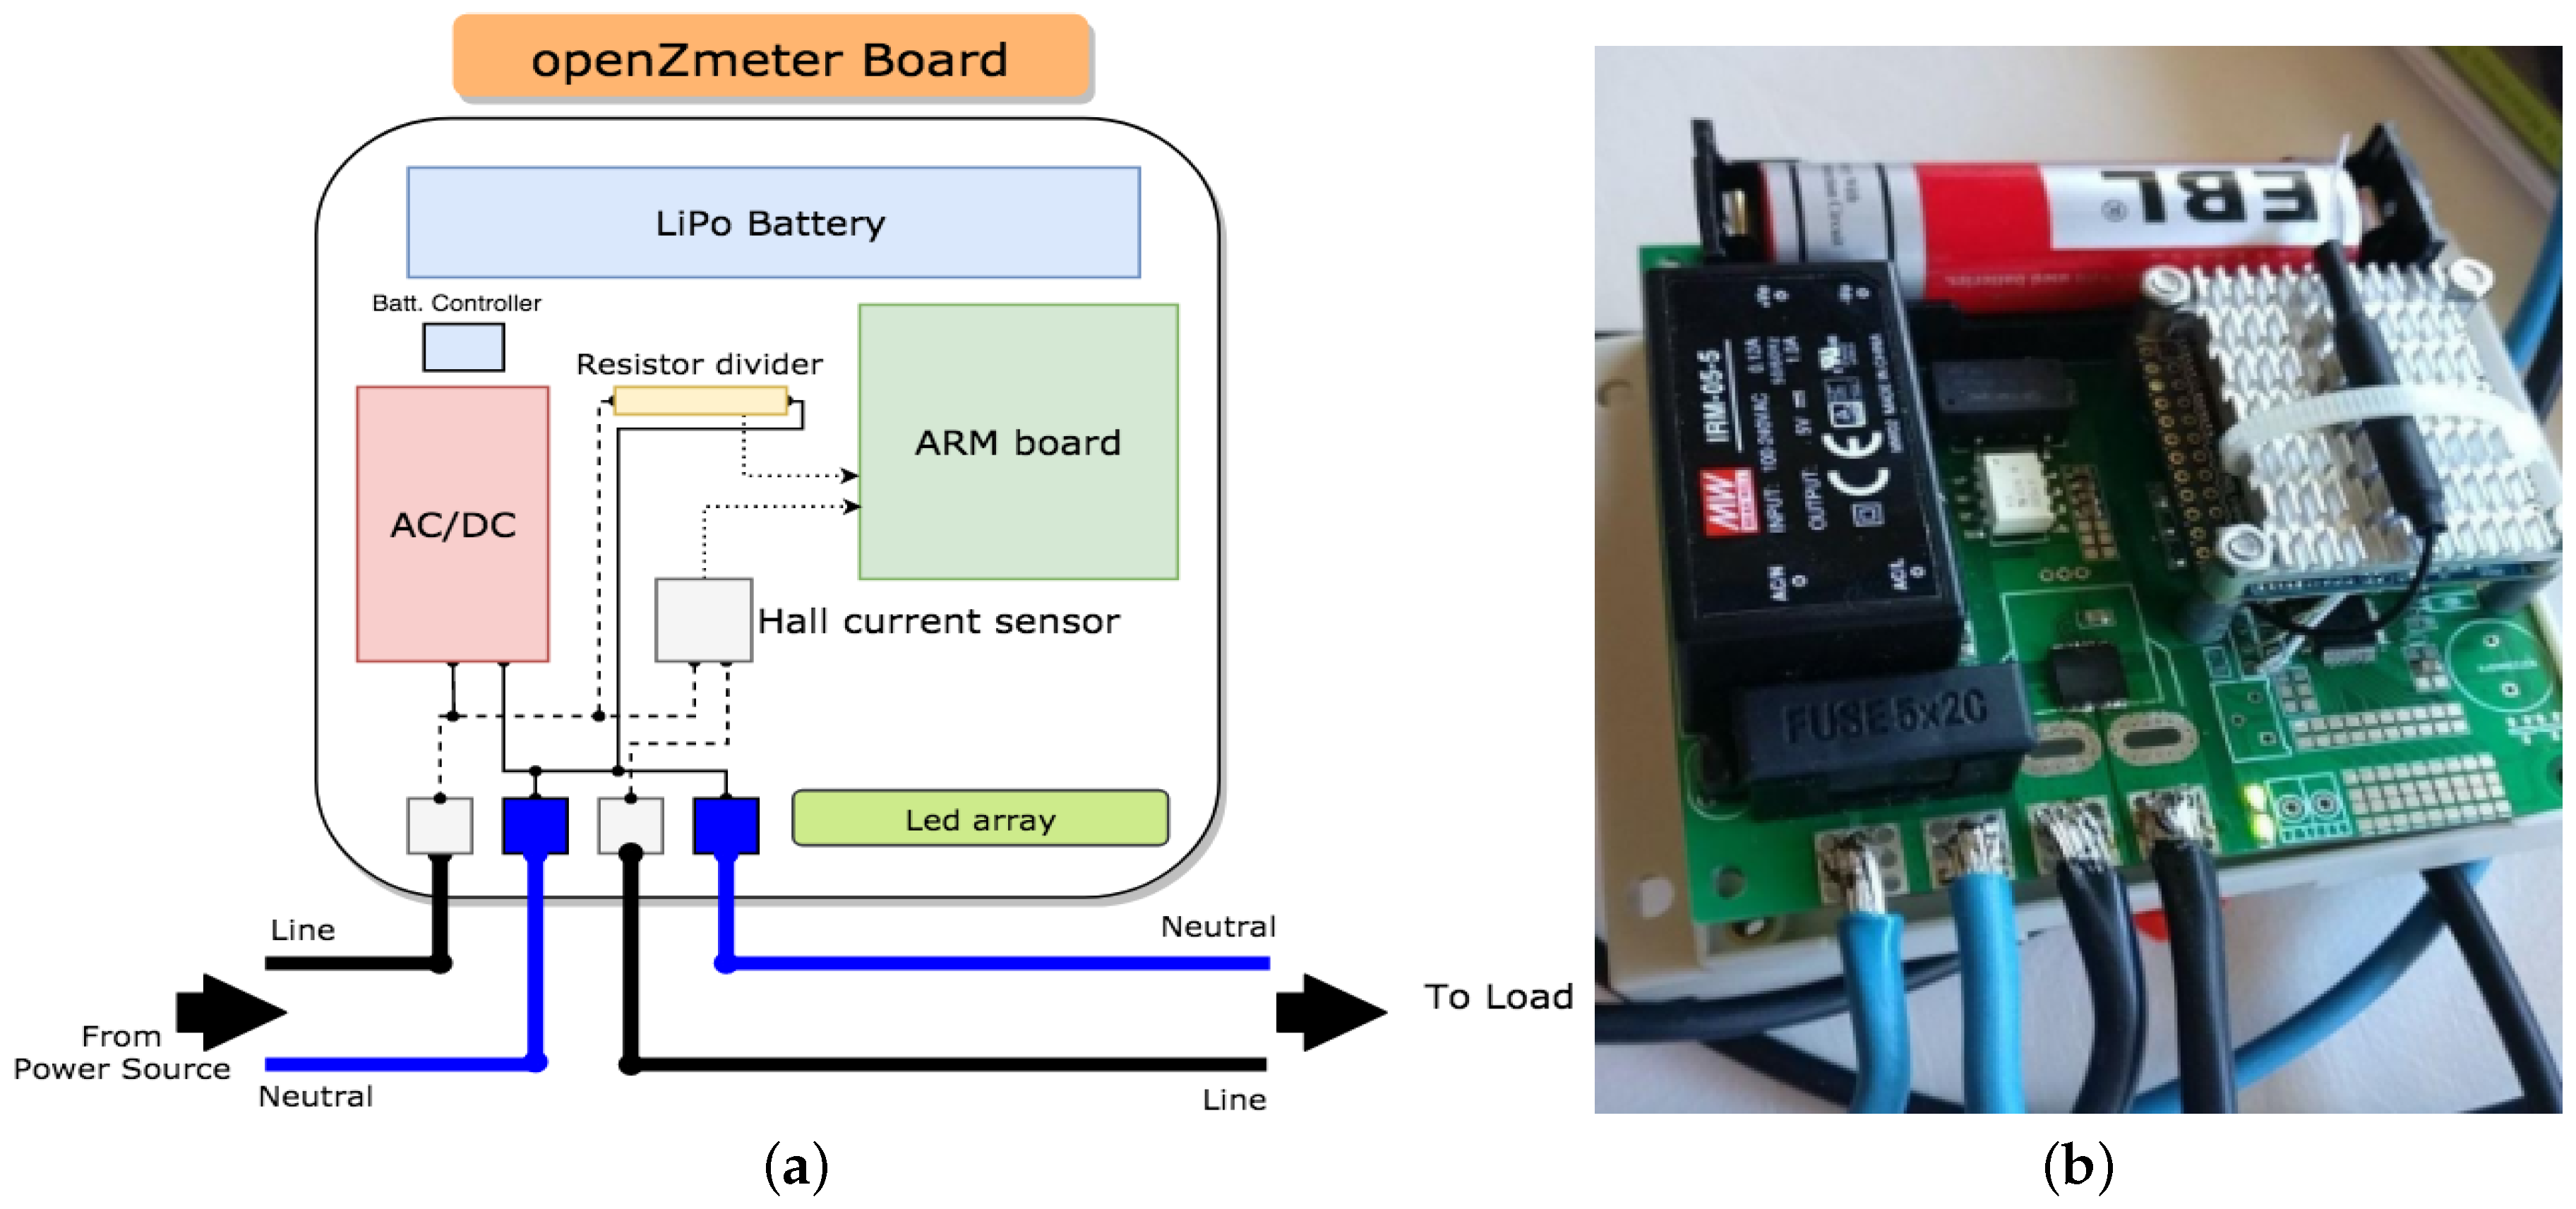
3.1. Physical Layout

Figure 1 shows the general scheme of the single-phase oZm and a picture of the real device. oZm has an analog front end (AFE) that is responsible for capturing the voltage and current waveforms. The voltage is acquired using a simple resistive divider (0.1% and 100 ppm/ºC tolerances) that cut down the 120/230 voltage to a much smaller input value suited for the onboard analog-to-digital converter (ADC). The current is measured by an integrated Hall-effect (Infineon TLI4970) sensor up to 50 A of peak value and 1% precision (factory calibrated). Current clamp sensors or Rogowsky coils can also be used to measure hundreds or thousands of amperes in bigger buildings. Both Hall effect and current clamp/Rogowsky current channels are synchronized with the voltage resistor using software-corrected algorithms (maximum deviation is less than 0.5 μ s) to avoid significant phase errors. The oZm device is powered directly by the grid using an isolated AC/DC source, which provides all the necessary energy for the circuitry. A lithium-ion battery is also used to power the board and keep the system running for hours in under-voltage or interruption conditions. When main power is restored, the system switches automatically (without restarting) and the battery is then recharged. The oZm has galvanic isolation for the voltage and current inputs and the ARM board through optocouplers.
Commonly used approaches for PQ monitoring and smart metering are widely based on the use of microprocessors, data acquisition cards, hybrids, and FPGA hardware. Each approach has its own advantages and drawbacks. In this case, the PQ monitoring and smart metering device is designed by coupling a Linux ARM board and an AFE managed by an STM32 microcontroller. The ARM Linux controller is easy to manage, and it is also low cost. The ARM Linux gives much more flexible software compared to any other device. We use the NanoPi Neo Air ARM board, which is a powerful system equipped with an H3 Allwinner Cortex-A7 quad-core at 1.2 GHz and 512 MB of DDR3 RAM.
Due to space limitations, it is difficult to conveniently detail all the components used as well as their structure and price (though it is worth mentioning that the ARM board is about 20 USD). The interested reader can go to https://gitlab.com/zredalmeria/openZmeter/wikis/home (accessed on 8 May 2012), where there is a detailed list of components and the functionality of each element of the AFE and ARM.

3.2. Technical Specifications

The accuracy of the measurement results depends on the correctness of the measurement algorithms implemented in the meter and the quality of its calibration [27], along with the quality and accuracy of the external probes used. The oZm fulfills these requirements by implementing a voltage divider for the voltage stage and a Hall-effect sensor with less than 1% error (calibrated from factory). The algorithm was implemented from scratch, combining our code with open source libraries. The system runs a Debian Linux operating system where some well-known open source libraries are used, such libmicrohttpd, postgresql, etc. (we refer the reader to our wiki mentioned above). All the data are stored locally thanks to the onboard EMC memory with up to 16 GB capacity. An SD card can also be added to extend the storage. This implies that oZm is completely autonomous and there is no need to use any external cloud. In any case, an API is provided to send data to the cloud. Remote monitoring can also be accomplished in two ways, that is, using a telegram bot specially designed to access the data in a simple and easy way or using a simple web browser (in this case the local router should be configured properly or a VPN should be used) to connect to the local web server which runs on top of the libmicrohttpd library. oZm implements a security feature to access both the web interface (user and password by default), https protocol, and encrypted data for API communication. The main characteristics of oZm are:
  • Free and open system: open source software and hardware;
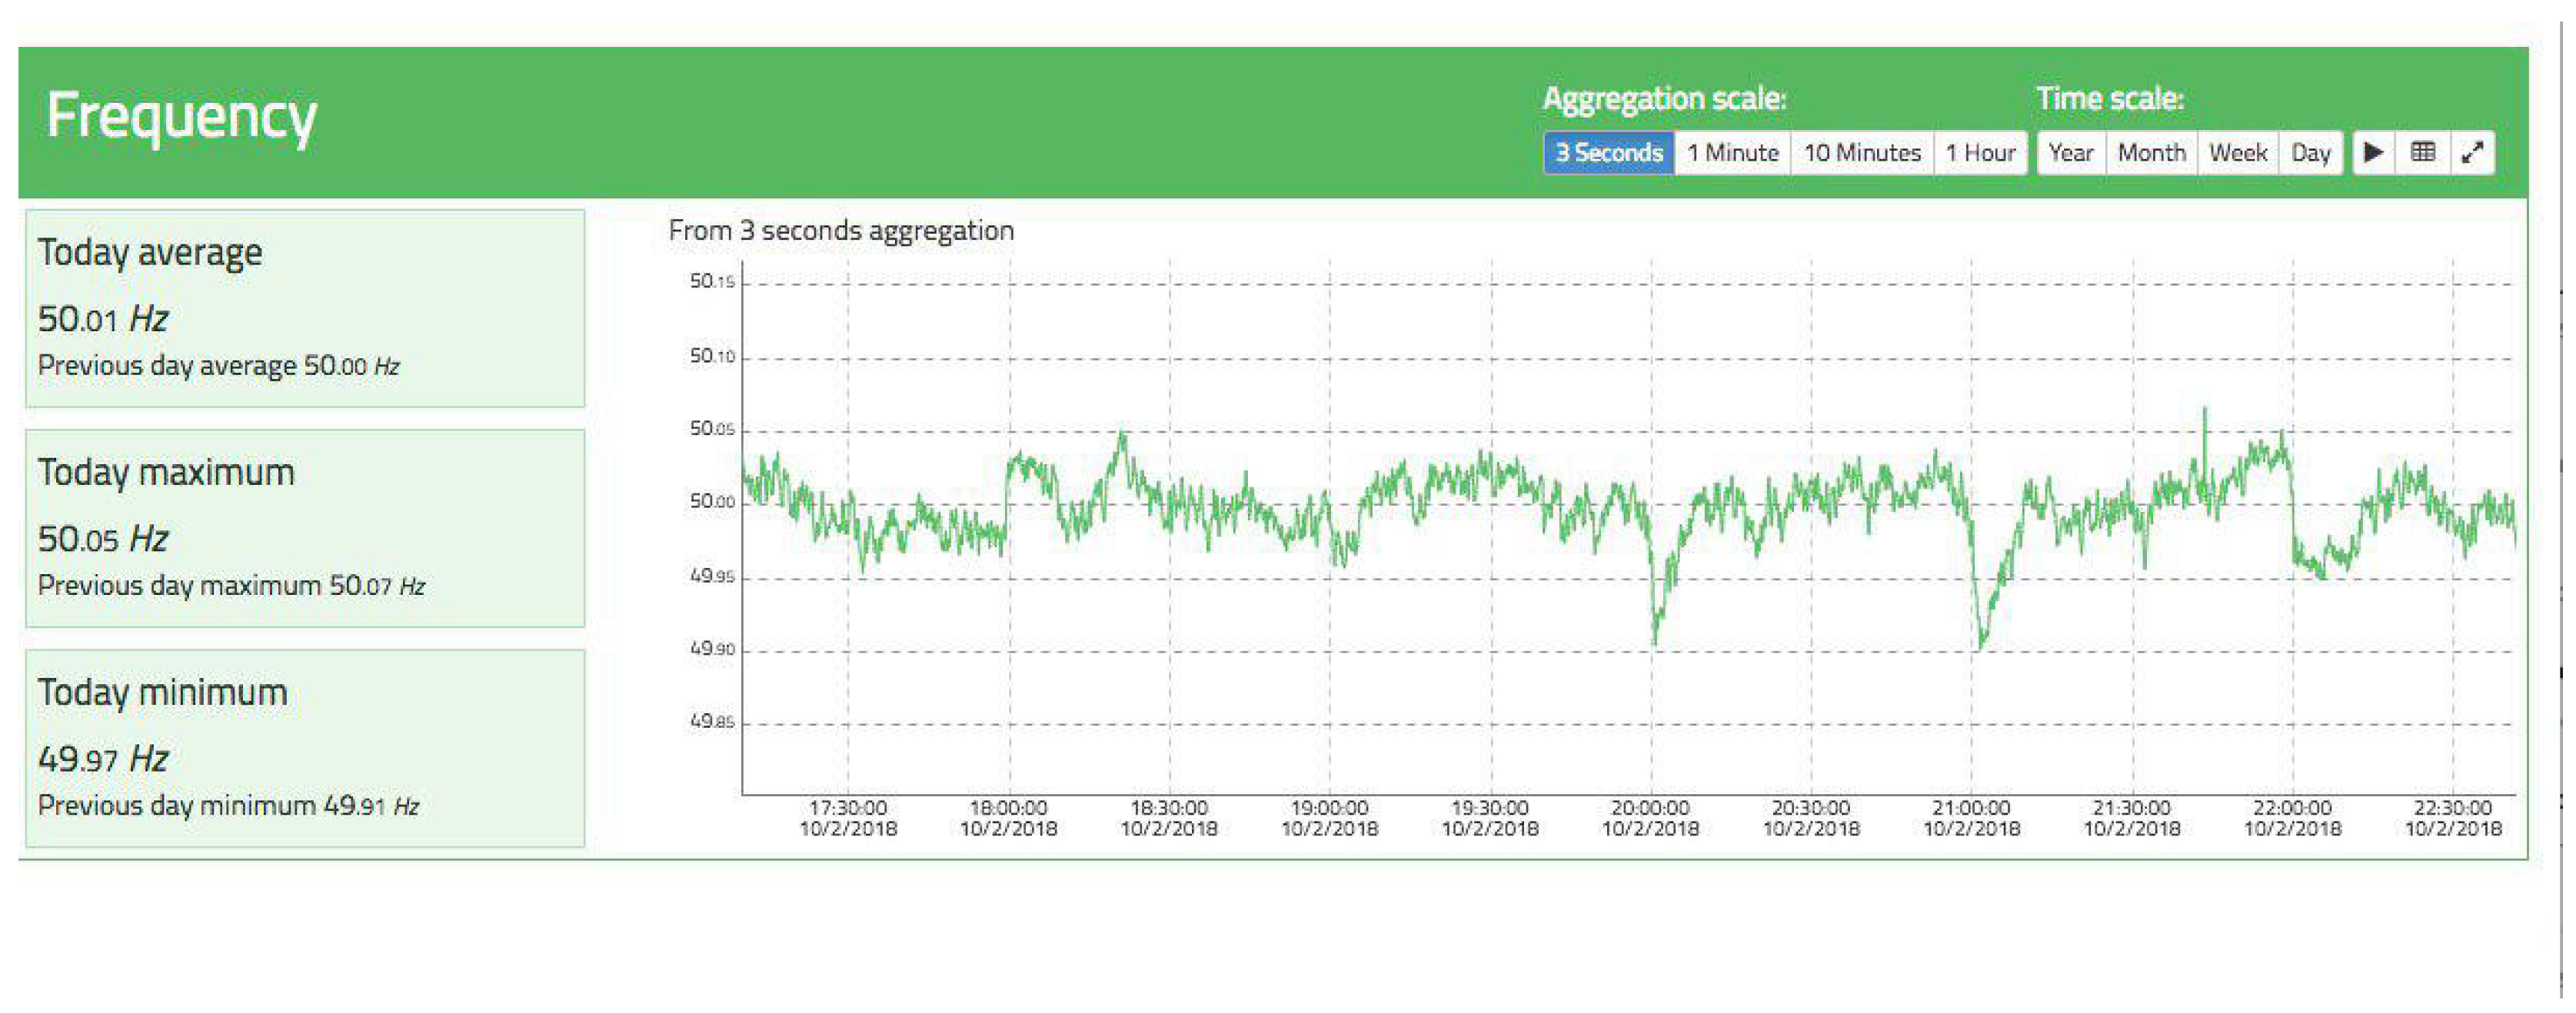
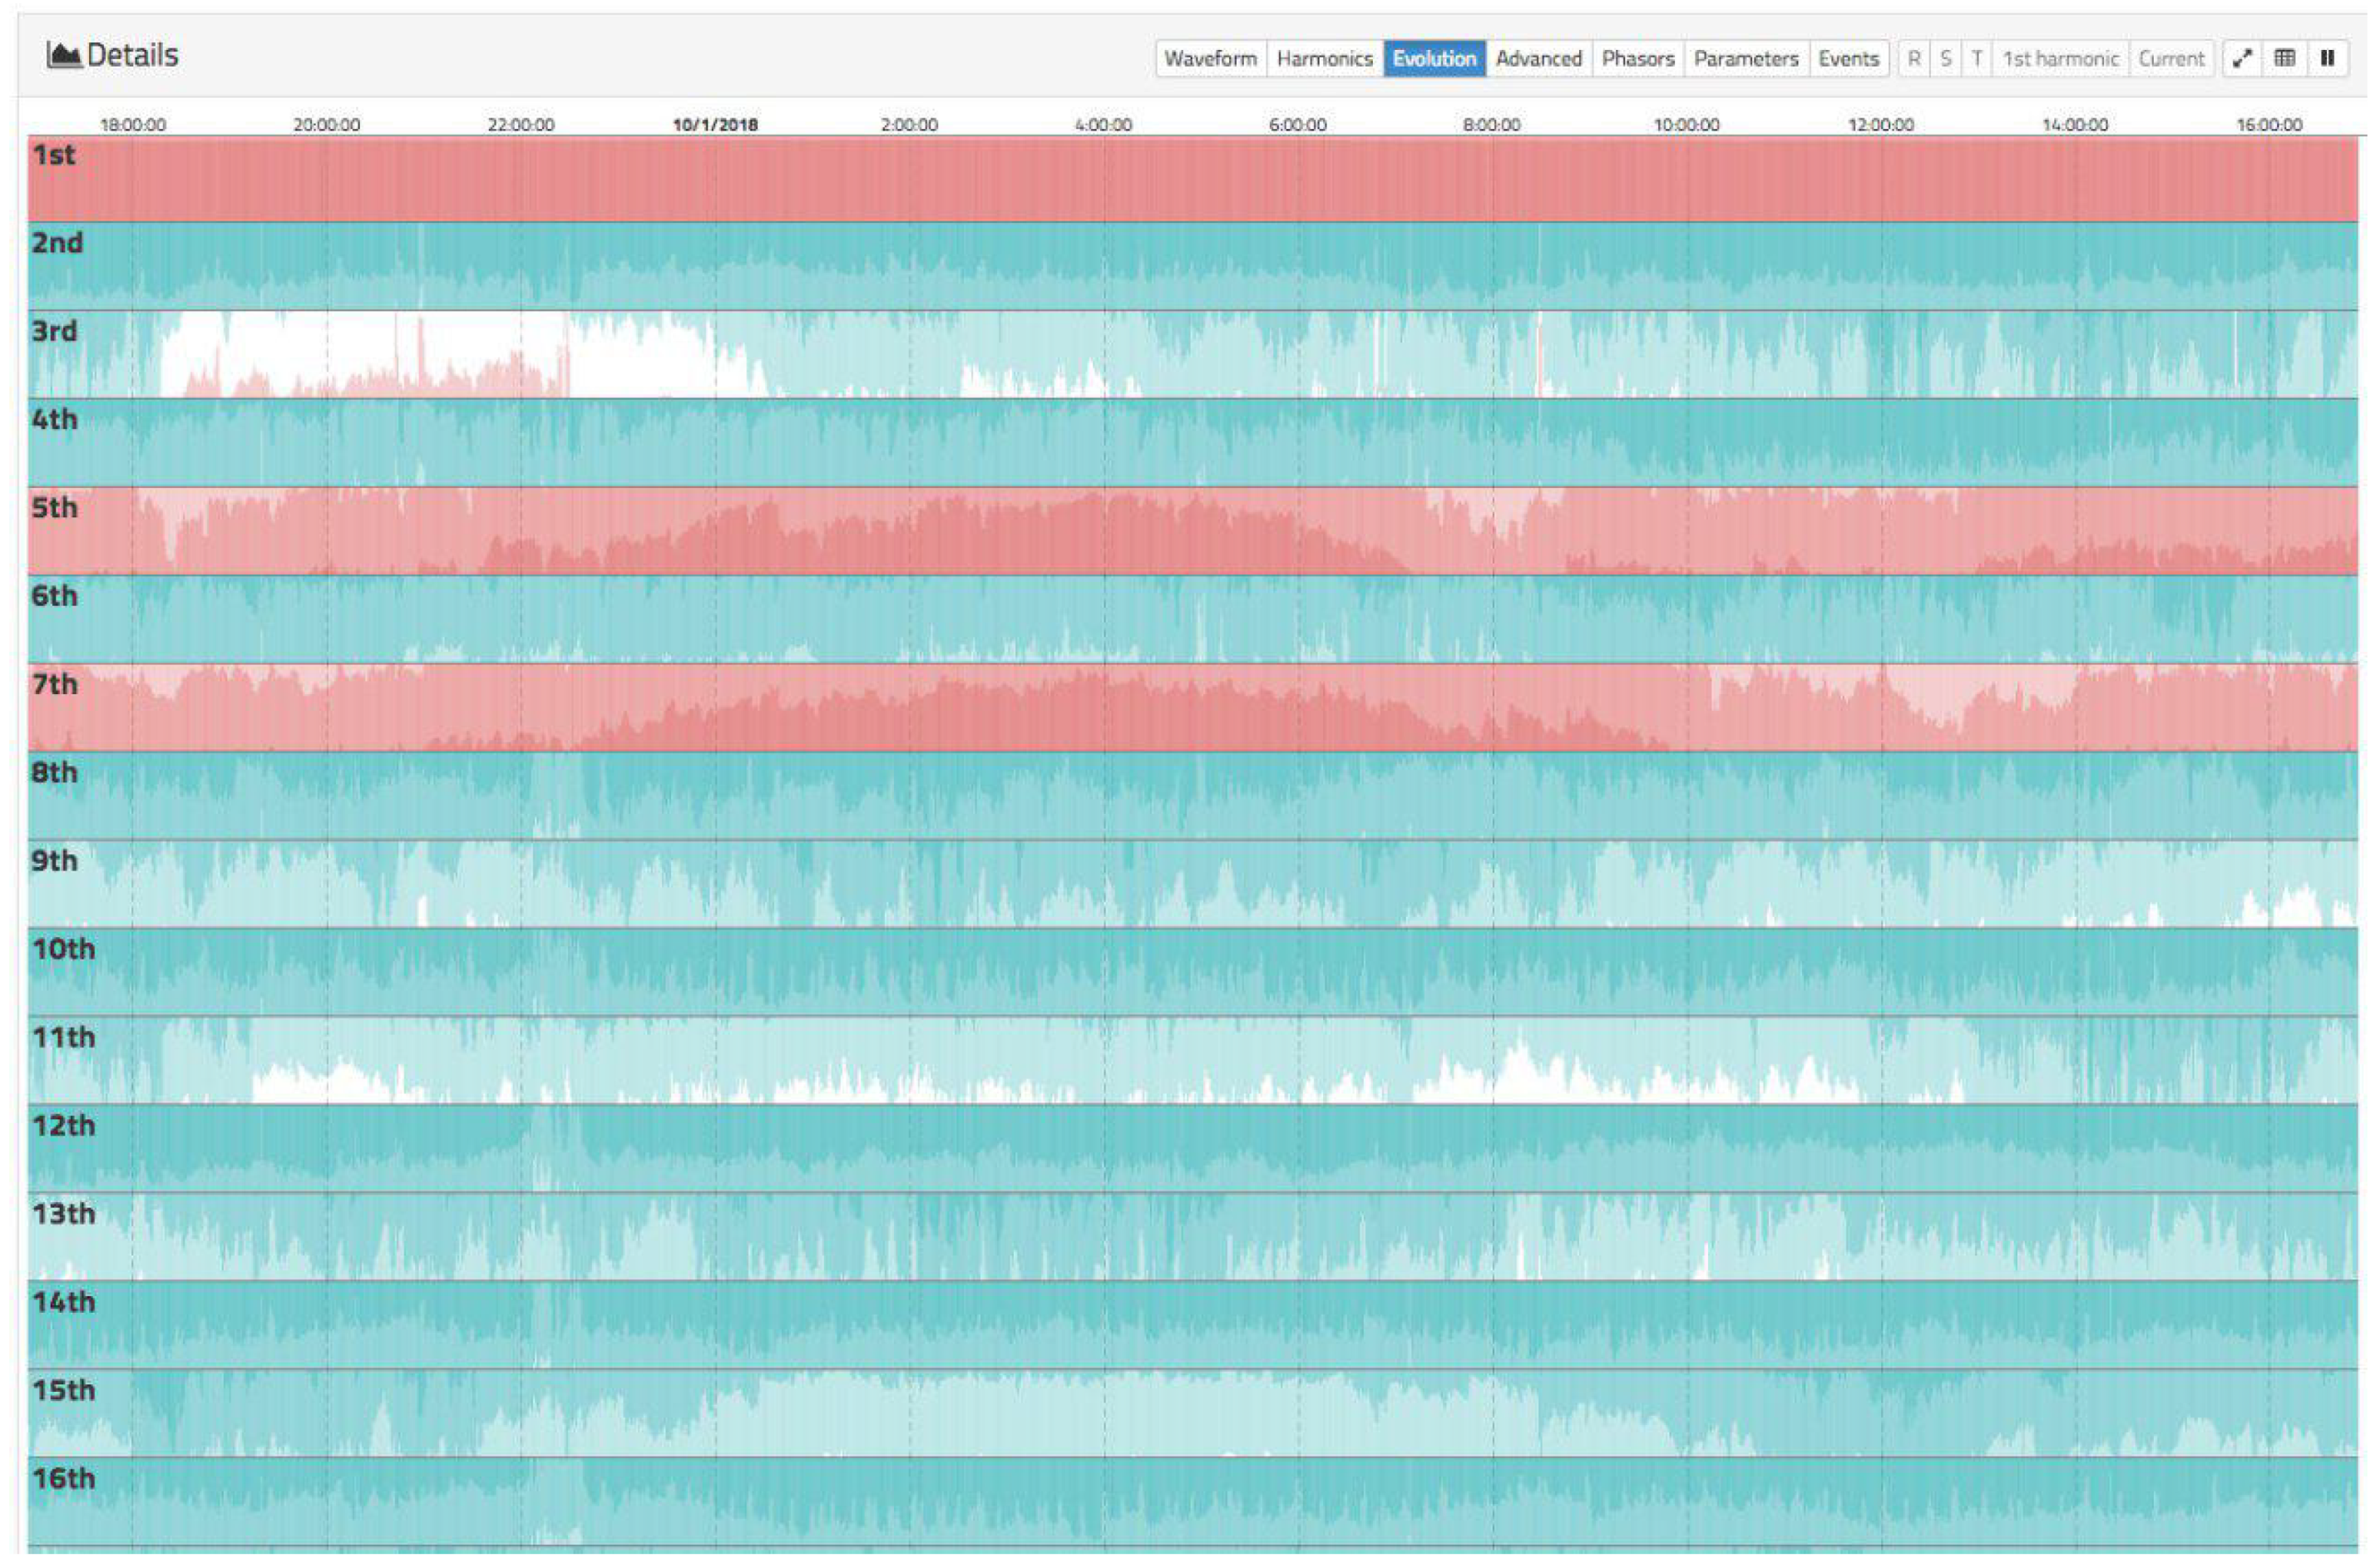
  • Electrical measurements: effective voltage and current values, active, reactive, apparent and distortion power, power factor, harmonics (up to order 50), active and reactive energy, frequency, voltage events (gaps, over-voltages, interruptions) in real-time and stored in database;
  • Measurement in four quadrants to measure consumption and generation of energy. Valid for renewable energy systems (e.g., photovoltaic, wind, etc.);
  • Testing according to the international standards IEC 61000-4-30 and EN 50160. Voltage measurement with precision of 0.1% for raw values. Frequency measurement with precision of 10 mHz (in the range 42.5–57.5 Hz). Current measurement up to 50 A (integrated Hall-effect sensor). Current clamp or Rogowsky coil as an option;
  • Sampling frequency of 15,625 Hz (64 μ s between samples). Frequency measurement is performed using a digital input filter to minimize noise and interharmonic components. According to IEC61000-4-30, 10 s of signal are taken and the zero crossing method is applied;
  • Aggregation in the voltage channel of 10 cycles, 3 s, 10 min according to standard and one hour as extra aggregation for energy;
  • Cutting-edge web based on HTML5, CSS3, and JavaScript for data analysis and SCADA;
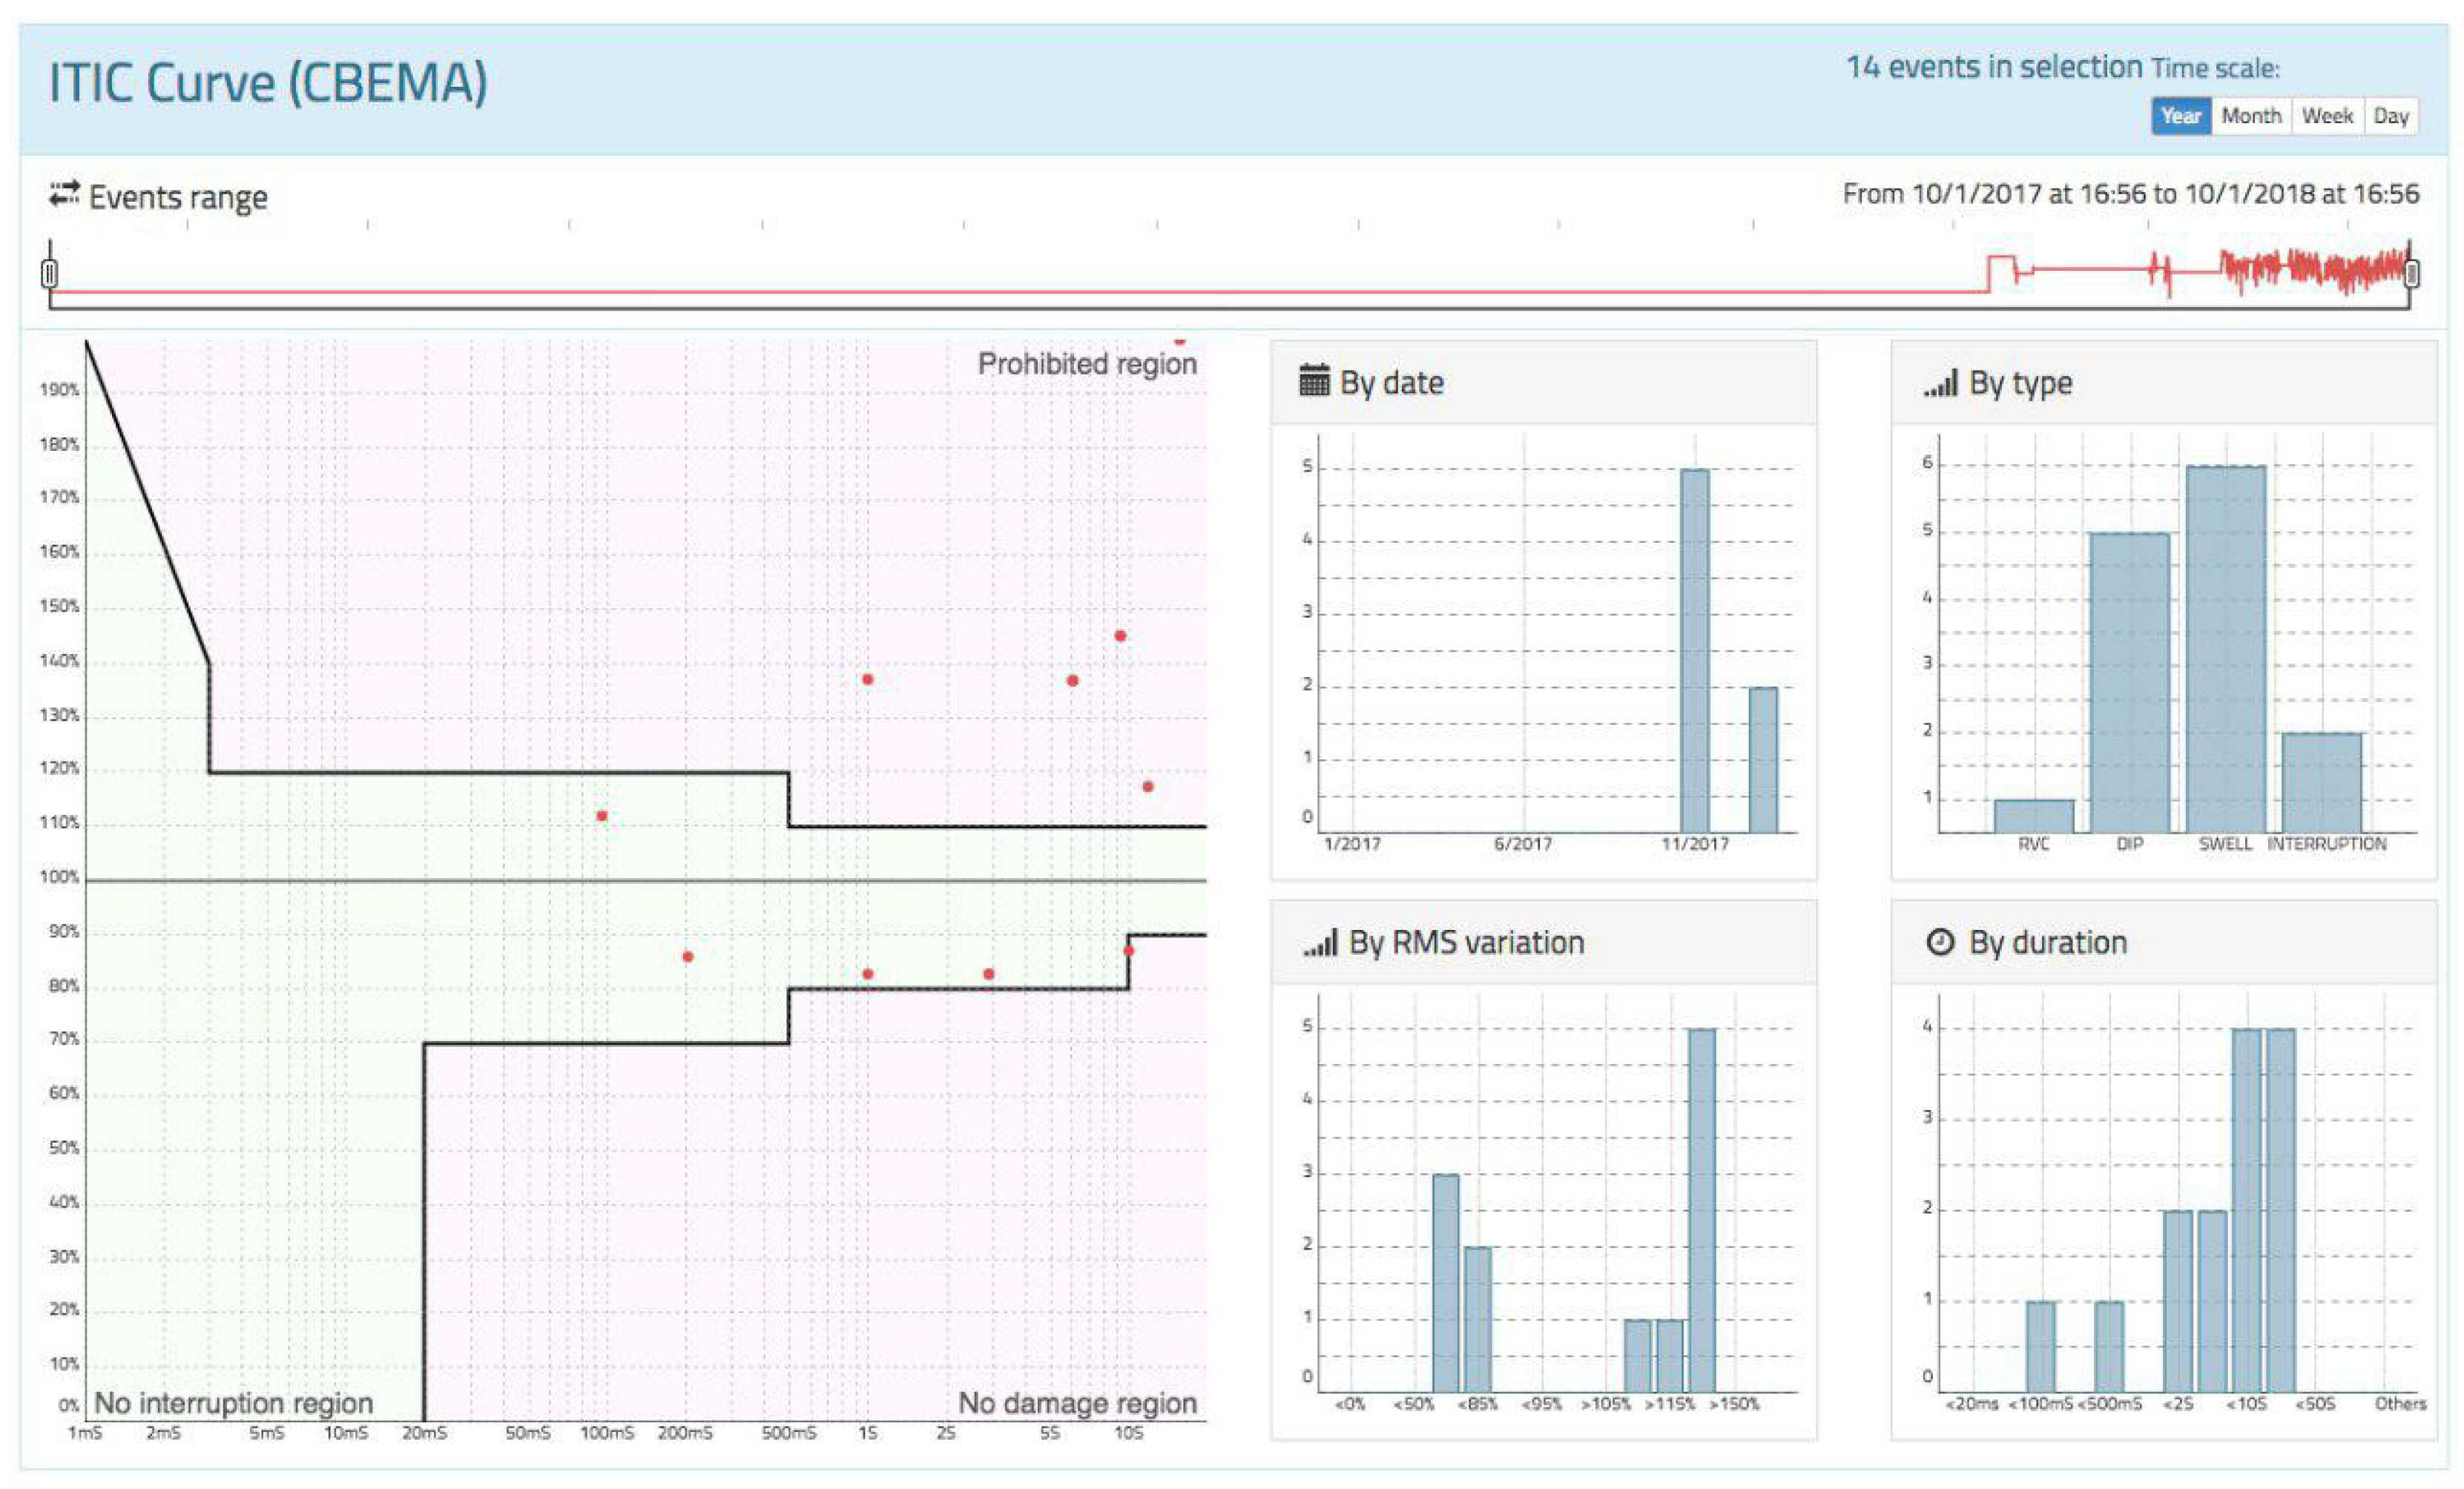
  • Alert system and event management (ITIC/CBEMA, frequency, over/under-voltage, interruptions, etc.);
  • FFT integration, zero crossing, and RVC from scratch (Rapid Voltage Changes according to IEC61000-4-30 with 5% threshold);
  • Time synchronization based on NTP time service. Time error less than 20 ms using Chronyd daemon.
  • User-friendly and powerful interface;
  • Modular, with the possibility of adding new capture modules;
  • Connectivity: USB ports (Wi-Fi dongle, 3G/LTE/4G, etc.), Ethernet port, and Wi-Fi. SPI, I2C, UART and PWM are also available;
  • Connection to the grid operator’s information system (eSios) to get daily energy prices and calculate the cost of energy in real-time;
  • Integration with Telegram applications for the generation of periodic reports and alerts in real time. Remote access to relevant information;
  • Specific API for third-party integration based on JSON.
Despite the long list of features implemented in oZm, it is also necessary to note that there are some limitations that must be taken into account, and that are often present in some open source projects, such as the lack of technical support in hardware certification or the adoption of measures for a centralized mass deployment.

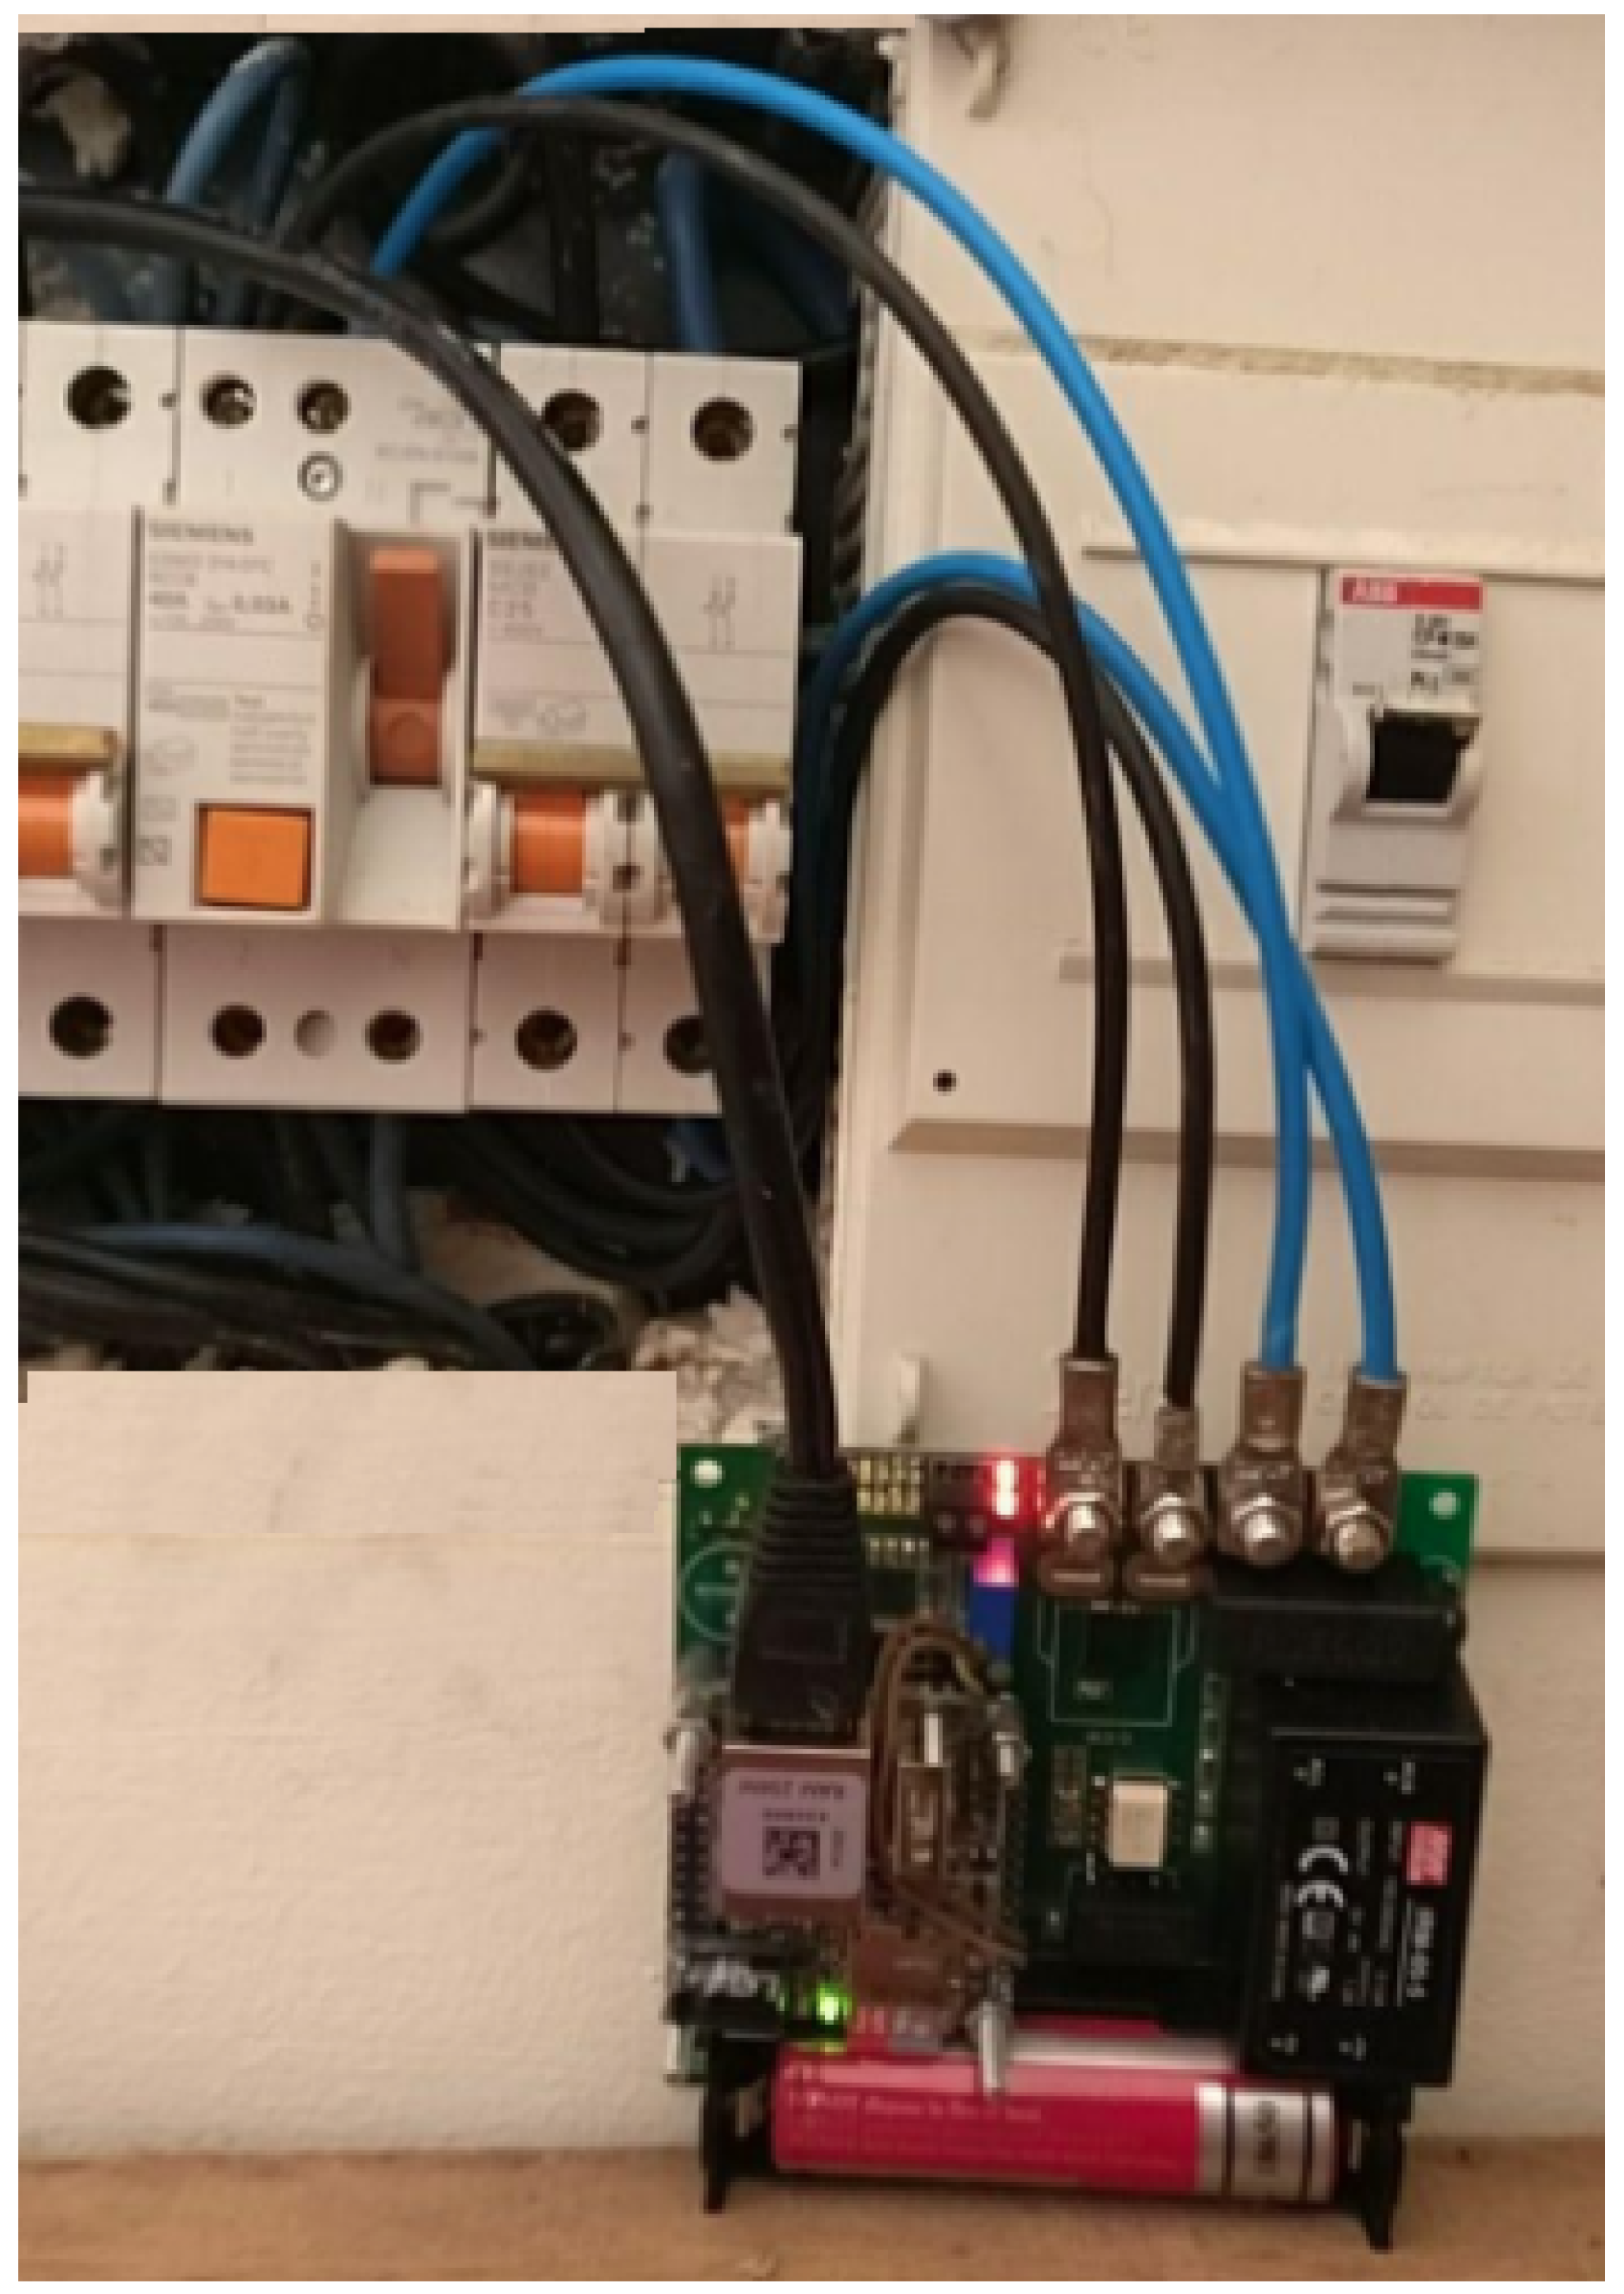
3.3. Building Configuration and Setup

The configuration of oZm can be easily achieved using Ethernet or Wi-Fi. The setup is typically carried out into the low-voltage circuit breaker panel of the building. Its placement and wiring is similar to any traditional or modern electric energy meter, so that nominal voltage is applied to an internal resistive divider that provides a low-voltage output linear to the input voltage for the ADC. The board tracks were precisely calculated for the current flowing through them. The width was calculated to avoid heating caused by Joule effect losses. Figure 2 shows the oZm setup. It is easily installed in any home circuit breaker panel. Moreover, the single-phase oZm can also be used in large buildings, by placing several devices in different locations to optimally and robustly monitor the electrical parameters [28].

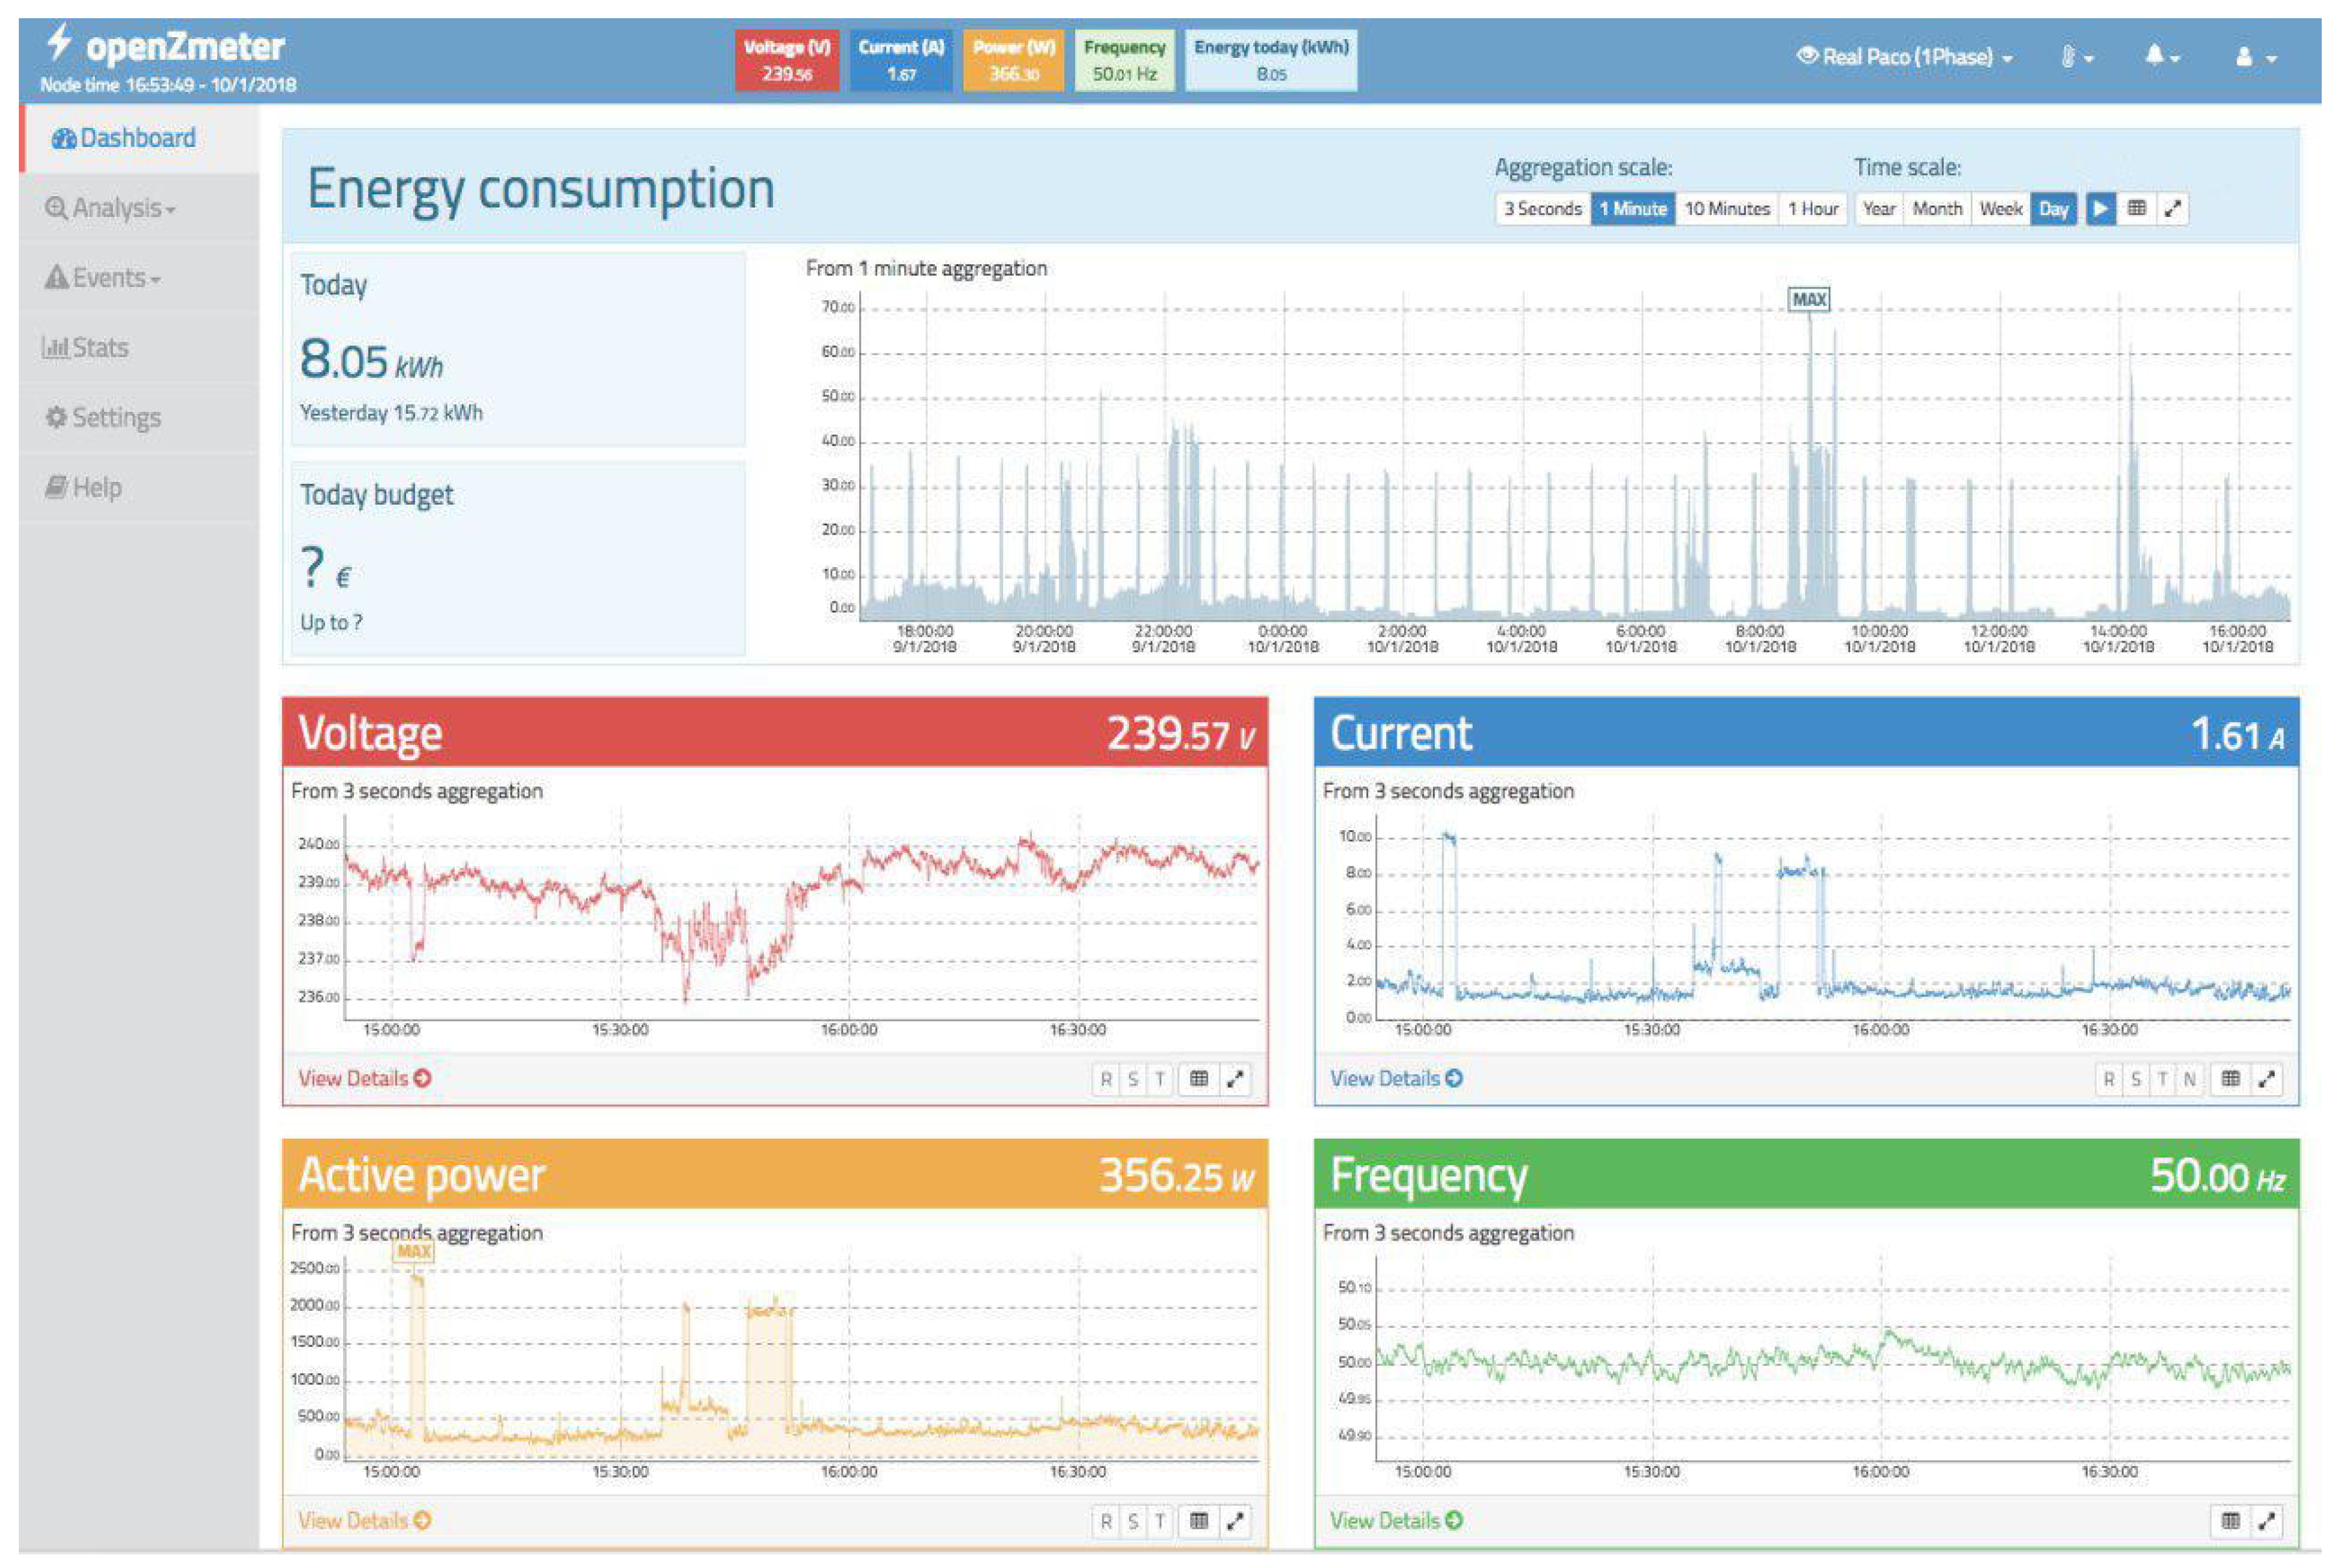
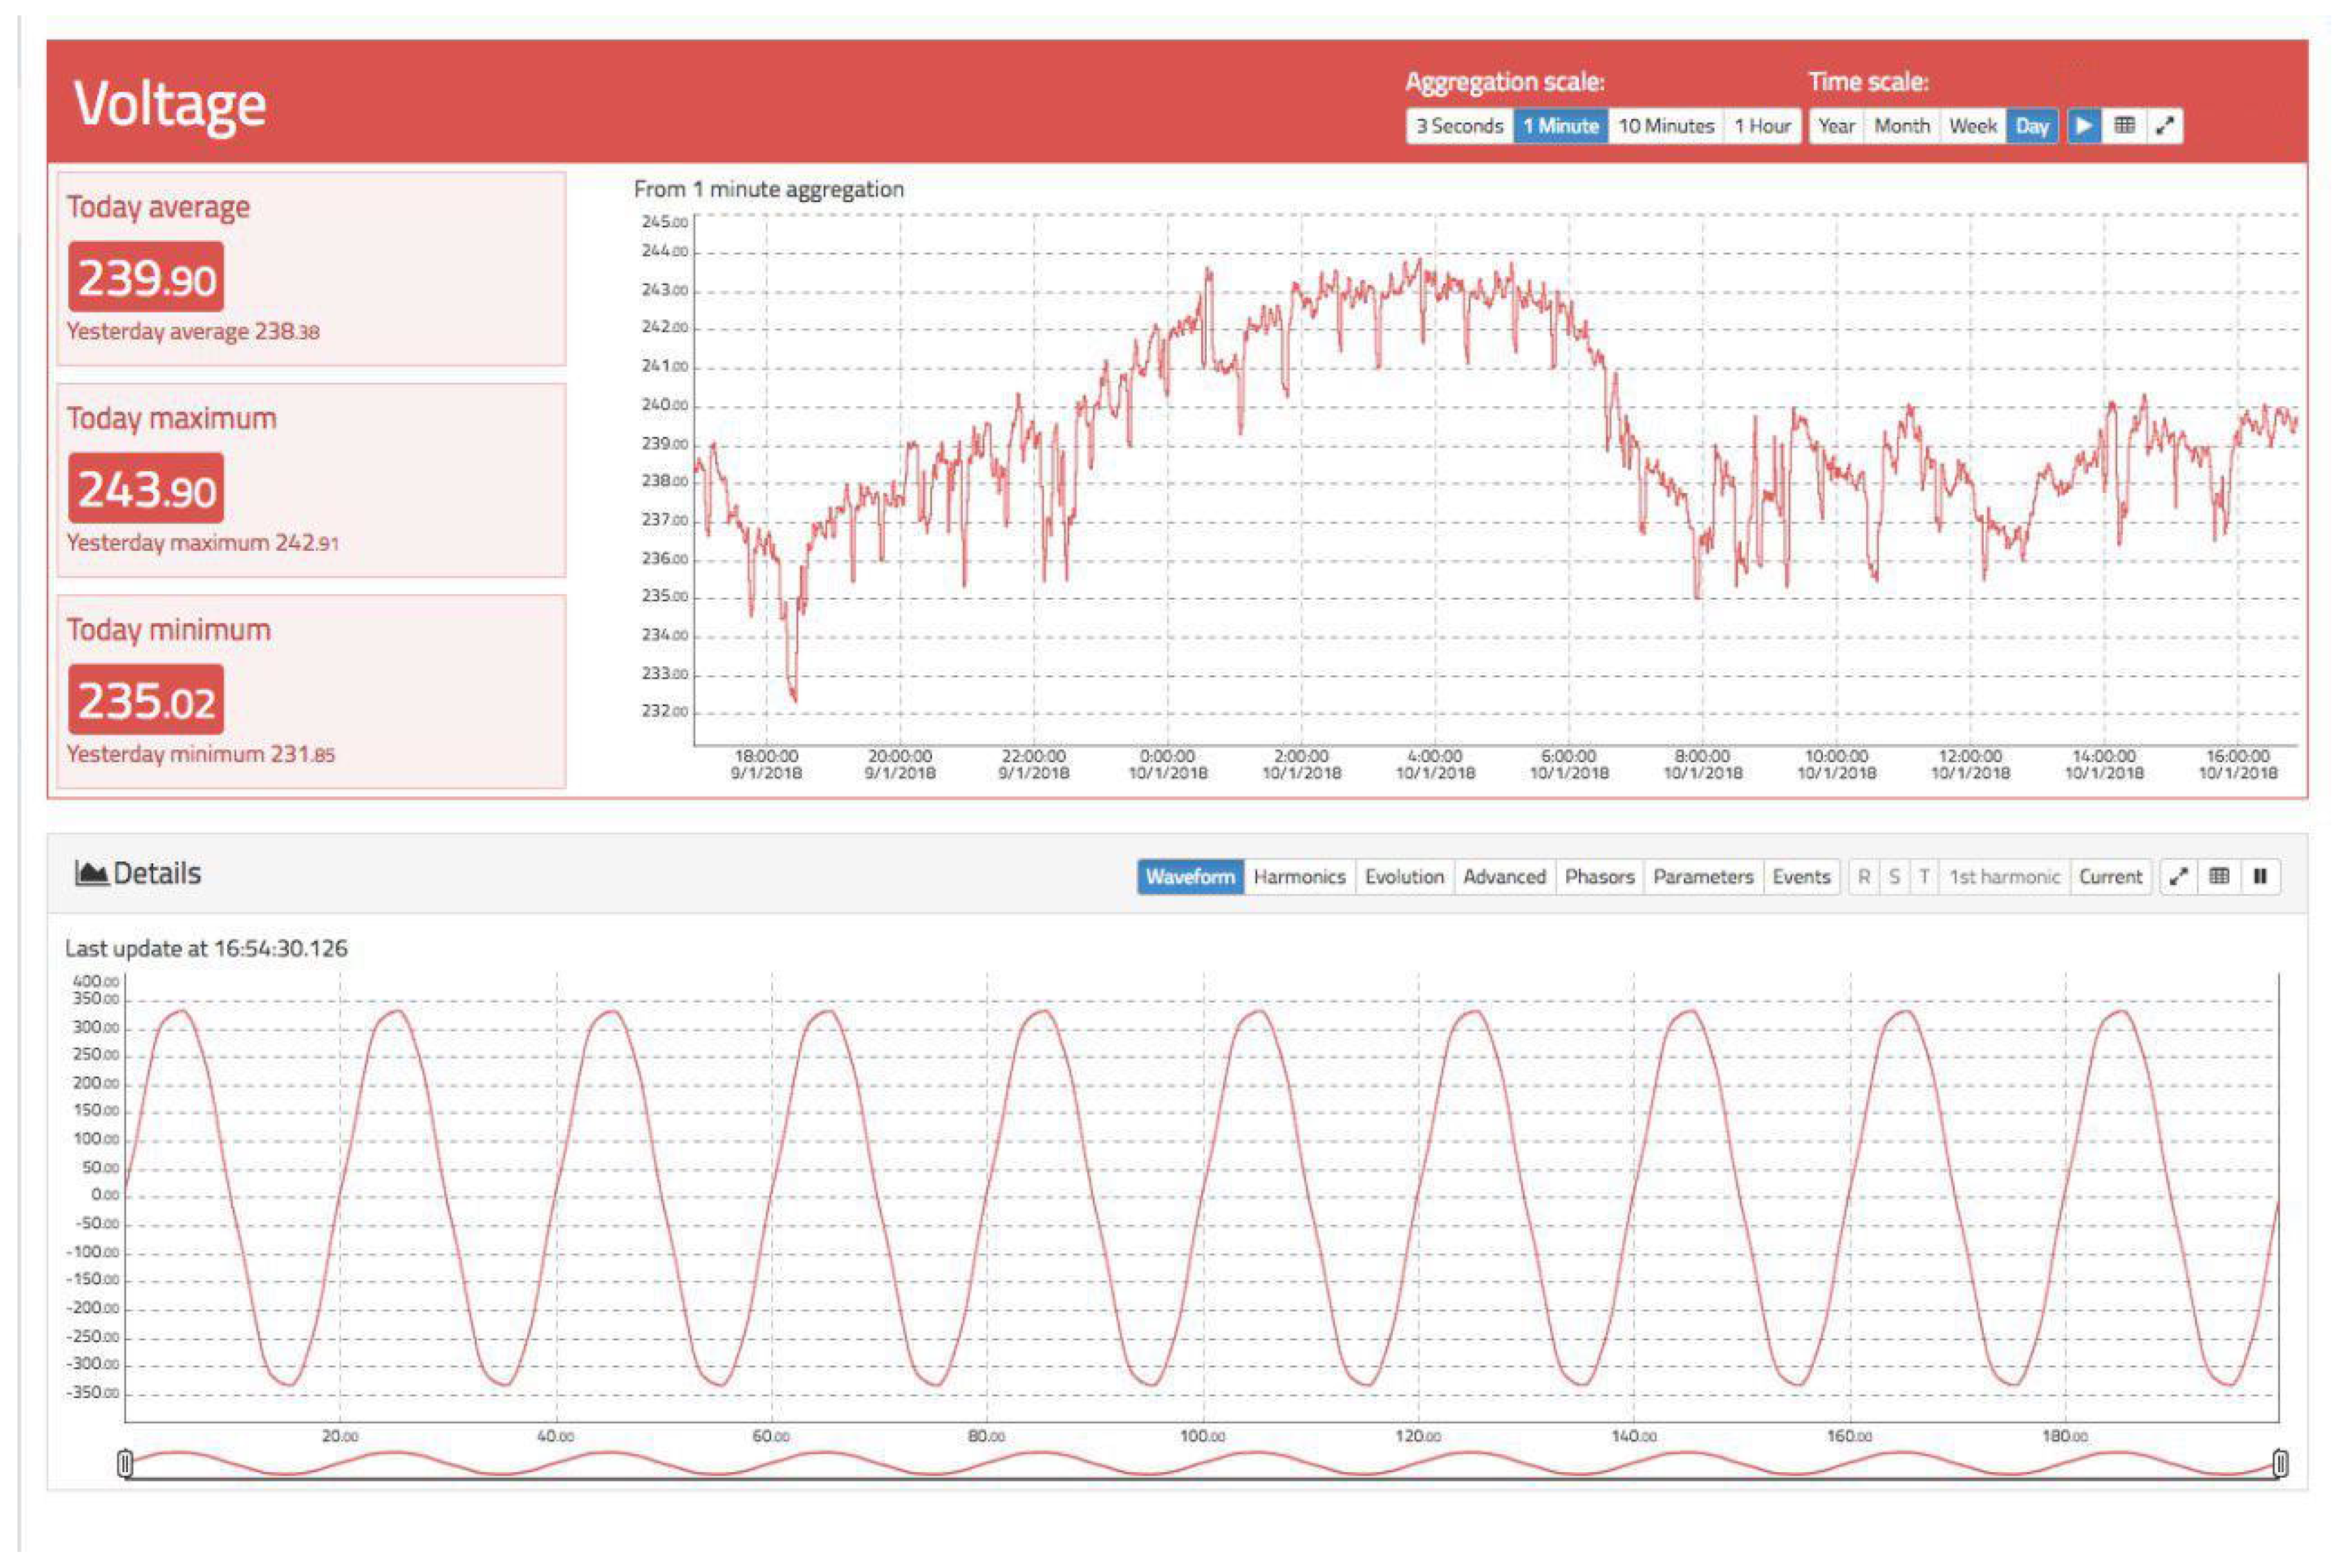
4. Usage Analysis in a Real Environment

4.1. Description of the Environment

The data acquired from an oZm installation in a home were analyzed. Specifically, it was a family home with two adults and three children. The house has 150 square meters in 5 rooms and a list of home appliances including an oven, a dishwasher, a washing machine, television, electric water heater, in addition to other electronic devices, plus 10 energy-saving light bulbs and 20 points of light (plugs) where other electronic devices such as laptops, tablets, or irons are sporadically connected. In order to show the most interesting information obtained by oZm, measurements were taken during two weeks (January–February 2018) every 200 ms (10 cycles of 50 Hz) as described in the following subsection.

4.2. Data Analysis

The data collected allows information to be obtained about both the energy consumption and the power quality. This information is first retrieved and analyzed using statistical tools [29], and the results are then displayed in a powerful graphical interface that was specifically designed for oZm.
Figure 3 shows the main view or dashboard of oZm. It includes the basic magnitudes, including the active energy consumption (kWh) in different periods that can be displayed with different time span aggregation. All the plots shown share a common template based on HTML5, CSS3, JavaScript, and JQuery, thus providing information about the RMS voltage, RMS current, frequency, and active power for a 3 s aggregation interval. The top subplot in Figure 3 shows the active energy consumption for a fixed time span, but these data can be aggregated based on nominal values: 3 s, 1 min, 10 min, and 1 h. The data are stored in an SQL-like database (PostgreSQL) and can be retrieved for a day, week, month, or year. These measures can be analyzed with more detail. For example, Figure 4 shows the average, maximum, and minimum magnitudes of voltage in a time-period using different aggregation scales, and the voltage waveform (oZm can serve as an oscilloscope for waveform diagnosis).
The frequency of the alternating current (AC) in a power grid is mainly defined at 50 (e.g., Europe) and 60 (e.g., North America) Hz. Although the frequency of a power system is strictly regulated, it is not always stable due to the continuous load changes on the power grid, the generator’s response to these changes, and the short-term scheduling of power plants. In this regard, Figure 5 shows how oZm is able to capture these variations in the frequency of the power supply. This graphic shows small variations that are probably due to changes in the loads of the power grid, and large variations due to the hour-by-hour scheduling of the power plant’s generation controlled by Red Eléctrica de España (REE), the system operator in Spain. The accuracy of oZm is much higher than 10 mHz, although only 10 mHz steps are shown on the Y-axis.
oZm also provides detailed information about power quality measurements, and events captured during the normal and abnormal operation. For example, Figure 6 shows the ITIC (CBEMA) [30] tolerance curve, which is often used to visibly represent voltage events that can cause problems or undesired behavior in electronic devices. In particular, detecting harmonics in the electrical power distribution system is an important issue. Harmonics combine with the fundamental frequency (50 Hz in our case) supply to create distortion of the current and/or voltage waveforms. In Figure 7, an advanced time–frequency plot is shown for harmonics visualization. This visualization is suitable for plotting a high number of subgraphs using a reduced vertical space [31], such that every row represents a harmonic component for the last 24 h up to the 50th order. In particular, darker tones mean higher absolute values, while red color refers to values above 0 dB and blue refers to values below 0 dB.

5. Conclusions

Electric energy meters and power quality analyzers are often used by power engineers and technicians to discover the health state of power systems. However, these professional devices are often expensive and difficult to handle for non-expert users. To overcome these drawbacks, this paper presents openZmeter (oZm), an open source, low-cost, and efficient single-phase energy smart meter and power quality analyzer that can be easily installed and used by inexperienced users at their homes in urban or rural areas. This device is able to retrieve a large amount of information related to energy consumption and power quality, satisfying national and international power quality standards. This work demonstrates that the use of open source systems can help sustainability and, more specifically, sustainable energy use by providing valuable information to users so that they can make energy-saving decisions supported by reliable and open data obtained in real environments. The use of open devices that provide relevant information in real time within the framework of intelligent networks is therefore shown to be worthwhile. In order to show the novel features of this device, it was installed in the circuit breaker panel of a house for several weeks. Results obtained were satisfactory, since it was possible to verify how oZm retrieves an important amount of data that is processed and visualized using an advanced graphical interface. The graphs included in this paper (energy consumption, voltage and current waveforms, frequency, and power quality events) can be easily interpreted by expert and non-expert users. As a future work, it is planned to extend the analysis to large buildings by deploying a network of sensors in different locations. Furthermore, the three-phase version of oZm is in an advanced stage of development and should be available in the next months.

Author Contributions

Conceptualization, F.M.A.-C.; Data curation, E.V.; Formal analysis, F.G.M., F.M.A.-C., and F.M.-A; Funding acquisition, A.Z.-S.; Investigation, F.M.A.-C.; Methodology, F.G.M.; Project administration, F.G.M. and R.B.; Software, E.V. and A.A.; Supervision, F.M.-A.; Validation, A.A., R.B., and F.M.-A; Writing—original draft, R.B.; Writing—review & editing, A.Z.-S.

Funding

This research was funded by the Regional Government of Andalusia (ceiA3 project) at the University of Almeria.

Acknowledgments

This research has been supported by the Spanish Ministry of Economy and Competitiveness (project TIN2015-67020-P leaded by the University of Granada), and by the Regional Government of Andalusia (ceiA3 project) at the University of Almeria.

Conflicts of Interest

All authors declare no conflict of interest.

References

  1. Pritoni, M.; Salmon, K.; Sanguinetti, A.; Morejohn, J.; Modera, M. Occupant thermal feedback for improved efficiency in university buildings. Energy Build. 2017, 144, 241–250. [Google Scholar] [CrossRef]
  2. Torrent-Fontbona, F.; Lopez, B. Power re-allocation for reducing contracted electric power costs. Energy Build. 2015, 89, 112–122. [Google Scholar] [CrossRef] [Green Version]
  3. Perez-Lombard, L.; Ortiz, J.; Pout, C. A review on buildings energy consumption information. Energy Build. 2008, 40, 394–398. [Google Scholar] [CrossRef]
  4. Aiad, M.; Lee, P.H. Unsupervised approach for load disaggregation with devices interactions. Energy Build. 2016, 116, 96–103. [Google Scholar] [CrossRef]
  5. Morales-Velazquez, L.; de Jesus Romero-Troncoso, R.; Herrera-Ruiz, G.; Morinigo-Sotelo, D.; Osornio-Rios, R.A. Smart sensor network for power quality monitoring in electrical installations. Measurement 2017, 2017 103, 133–142. [Google Scholar] [CrossRef]
  6. Muñoz, D.R.; Pérez, D.M.; Moreno, J.S.; Berga, S.C.; Montero, E.C. Design and experimental verification of a smart sensor to measure the energy and power consumption in a one-phase AC line. Measurement 2009, 2009 42, 412–419. [Google Scholar] [CrossRef]
  7. Kabalci, Y. A survey on smart metering and smart grid communication. Renew. Sustain. Energy Rev. 2016, 2016 57, 302–318. [Google Scholar] [CrossRef]
  8. Bayram, I.S.; Ustun, T.S. A survey on behind the meter energy management systems in smart grid. Renew. Sustain. Energy Rev. 2017, 72, 1208–1232. [Google Scholar] [CrossRef]
  9. Stephen, B.; Mutanen, A.J.; Galloway, S.; Burt, G.; Järventausta, P. Enhanced Load Profiling for Residential Network Customers. IEEE Trans. Power Deliv. 2014, 29, 88–96. [Google Scholar] [CrossRef] [Green Version]
  10. O’Driscoll, E.; O’Donnell, G.E. Industrial power and energy metering—A state-of-the-art review. J. Clean. Prod. 2013, 41, 53–64. [Google Scholar] [CrossRef]
  11. Lanziser, S.; Dawson-Haggerty, S.; Cheung, H.Y.I.; Taneja, Y.; Culler, D.; Brown, R. Building and Environment Methods for detailed energy data collection of miscellaneous and electronic loads in a commercial office building. Build. Environ. 2013, 65, 170–177. [Google Scholar] [CrossRef]
  12. Seo, Y.-K.; Hong, W.-H. Constructing electricity load profile and formulating load pattern for urban apartment in Korea. Energy Build. 2014, 78, 222–230. [Google Scholar] [CrossRef]
  13. Ahmadi-Karvigh, S.; Ghahramani, A.; Becerik-Gerber, B.; Soibelman, L. Real-time activity recognition for energy efficiency in buildings. Appl. Energy 2018, 211, 146–160. [Google Scholar] [CrossRef]
  14. Montoya, F.G.; García-Cruz, A.; Montoya, M.G.; Manzano-Agugliaro, F. Power quality techniques research worldwide: A review. Renew. Sustain. Energy Rev. 2016, 54, 846–856. [Google Scholar] [CrossRef]
  15. Miller, C.; Meggers, F. Mining electrical meter data to predict principal building use, performance class, and operations strategy for hundreds of non-residential buildings. Energy Build. 2017, 156, 360–373. [Google Scholar] [CrossRef]
  16. Kluczek, A.; Olszewski, P. Energy audits in industrial processes Research article. J. Clean. Prod. 2017, 142, 3437–3453. [Google Scholar] [CrossRef]
  17. Pellegrinelli, G.; Baù, M.; Cerini, F.; Dalola, S.; Ferrari, V. Portable energy-logger circuit for the experimental evaluation of energy harvesting solutions from motion for wearable autonomous sensors. Procedia Eng. 2014, 87, 1230–1233. [Google Scholar] [CrossRef]
  18. Atalik, T.; Čadirci, I.; Demirci, T.; Ermis, M.; Inan, T.; Kalaycioglu, A.S.; Salor, Ö. Multipurpose platform for power system monitoring and analysis with sample grid applications. IEEE Trans. Instrum. Meas. 2014, 63, 566–582. [Google Scholar] [CrossRef]
  19. Rodrigues, E.M.G.; Godina, R.; Shafie-Khah, M.; Catalão, J.P.S. Experimental results on a wireless wattmeter device for the integration in home energy management systems. Energies 2017, 10, 398. [Google Scholar] [CrossRef]
  20. Tomesc, L.; Dobra, P.; Abrudean, M. Low-cost power quality analyzer. IFAC Proc. Vol. 2007, 40, 157–162. [Google Scholar] [CrossRef]
  21. OpenEnergyMonitor. Available online: https://openenergymonitor.org/ (accessed on 26 February 2018).
  22. Pereira, R.; Figueiredo, J.; Melicio, R.; Mendes, V.M.F.; Martins, J.; Quadrado, J.C. Consumer energy management system with integration of smart meters. Energy Rep. 2015, 1, 22–29. [Google Scholar] [CrossRef] [Green Version]
  23. Mumtaz, Z.; Ullah, S.; Ilyas, Z.; Aslam, N.; Iqbal, S.; Liu, S.; Madni, H. An automation system for controlling streetlights and monitoring objects using Arduino. Sensors 2018, 18, 3178. [Google Scholar] [CrossRef] [PubMed]
  24. Martinez, B.; Vilajosana, X.; Kim, I.H.; Zhou, J.; Tuset-Peiró, P.; Xhafa, A.; Lu, X. I3Mote: An open development platform for the intelligent industrial internet. Sensors 2017, 17, 986. [Google Scholar] [CrossRef] [PubMed]
  25. Syafrudin, M.; Fitriyani, N.L.; Li, D.; Alfian, G.; Rhee, J.; Kang, Y.S. An Open Source-Based Real-Time Data Processing Architecture Framework for Manufacturing Sustainability. Sustainability 2017, 9, 2139. [Google Scholar] [CrossRef]
  26. Pocero, L.; Amaxilatis, D.; Mylonas, G.; Chatzigiannakis, I. Open source IoT meter devices for smart and energy-efficient school buildings. HardwareX 2017, 1, 54–67. [Google Scholar] [CrossRef]
  27. Masnicki, R. Measurement characteristics in an instrument for power quality estimation—A Case Study. Energies 2017, 10, 536. [Google Scholar] [CrossRef]
  28. Woolley, N.C.; Avendaño-Mora, J.M.; Milanović, J.V. Methodology for robust monitoring of voltage sags based on equipment trip probabilities. Electr. Power Syst. Res. 2012, 90, 107–116. [Google Scholar] [CrossRef]
  29. Hernandez, W.; Calderón-Córdova, C.; Brito, E.; Campoverde, E.; González-Posada, V.; Zato, J.G. A method of verifying the statistical performance of electronic circuits designed to analyze the power quality. Measurement 2016, 93, 21–28. [Google Scholar] [CrossRef]
  30. Masoum, M.A.S.; Fuchs, E.F. Power Quality in Power Systems and Electrical Machines. In Impact of Poor Power Quality on Reliability, Relaying and Security, 2nd ed.; Masoum, M.A.S., Fuchs, E.F., Eds.; Academic Press/Elsevier: Amsterdam, The Netherlands, 2015; pp. 681–778. [Google Scholar]
  31. Few, S. Time on the Horizon. Visual Business Intelligence Newsletter, June/July 2008. Available online: http://www.perceptualedge.com/articles/visual_business_intelligence/time_on_the_horizon.pdf (accessed on 26 February 2018).
Figure 1. (a) Schematic diagram of the oZm; (b) Physical layout of the oZm.
Sustainability 10 04038 g001
Figure 2. Installation of oZm in the electric panel of a building.
Sustainability 10 04038 g002
Figure 3. Dashboard of oZm. From top to bottom and left to right, active energy, RMS voltage, RMS current, active power, and frequency are shown.
Sustainability 10 04038 g003
Figure 4. Detailed information about the voltage.
Sustainability 10 04038 g004
Figure 5. Frequency of the power supply.
Sustainability 10 04038 g005
Figure 6. The ITIC (CBEMA) curve in the oZm graphical interface.
Sustainability 10 04038 g006
Figure 7. Harmonic amplitude evolution for the first 16 harmonic components.
Sustainability 10 04038 g007
Table 1. Feature comparison between commercial and open source meters.
oZm (openZmeter)FluksoOpenEnergyMonitorOpenPowerQualityGeo MinimCurrent CostEfergyAlertmeWibeeeSense Energy MonitorCURBPQUBE3SmapeeNeurio
Active EnergyYesYesYesNoYesYesYesYesYesYesYesYesYesYes
Reactive EnergyYesNoNoNoNoNoNoNoNoNoNoYesNoNo
Active PowerYesYesYesNoYesNoYesYesYesYesYesYesYesYes
Reactive PowerYesNoNoNoNoNoNoNoNoNoNoYesNoNo
Apparent PowerYesNoYesNoNoNoNoNoNoNoNoYesNoNo
FrequencyYesNoNoYesNoNoNoNoNoNoNoYesNoNo
RMS VoltageYesNoYesYesNoNoNoNoYesNoNoYesYesYes
RMS CurrentYesNoYesNoNoNoNoNoYesYesNoYesYesYes
Power FactorYesNoNoNoNoNoNoNoNoNoNoYesNoNo
AngleYesNoNoNoNoNoNoNoNoNoNoYesNoNo
Voltage EventsYesNoNoYesNoNoNoNoNoNoNoYesNoNo
4 QuadrantYesNoNoNoNoNoNoNoNoYesYesYesNoYes
EN50160YesNoNoNoNoNoNoNoNoNoNoYesNoNo
IEC61000-4-30YesNoNoYesNoNoNoNoNoNoNoYesNoNo
High Samp. RateYesNoYesYesNoNoNoNoNoYesYesYesNoNo
Aggr. Interv.YesNoNoNoNoNoNoNoNoNoNoNoNoNo
HTML5 InterfaceYesYesYesYesNoNoNoYesYesYesYesNoYesYes
Alert SystemYesNoNoYesNoNoNoNoYesYesYesNoYesYes
ITCI/CBEMAYesNoNoYesNoNoNoNoNoNoNoNoNoNo
Zero CrossingYesNoYesYesNoNoNoNoNoNoNoYesNoNo
FFT  YesNoNoYesNoNoNoNoNoYesNoYesNoNo
HarmonicsYesNoNoYesNoNoNoNoNoNoNoYesNoNo
THDYesNoNoYesNoNoNoNoNoNoNoYesNoNo
4GYesYesNoNoNoNoNoNoNoNoNoNoNoNo
Wi-FiYesYesYesNoYesNoNoNoYesYesYesNoYesYes
EthernetYesYesYesYesNoNoNoYesNoNoNoYesNoNo
APIYesYesYesNoNoNoNoNoNoNoNoNoNoNo
Realtime PricingYesNoNoNoYesNoNoYesNoNoNoNoNoNo
PhasorYesNoNoNoNoNoNoNoNoNoNoNoNoNo
TelegramYesNoNoNoNoNoNoNoNoNoNoNoNoNo
Open SourceYesYesYesYesNoNoNoNoNoNoNoNoNoNo

