A Sustainability Analysis on Retailer’s Sales Effort in A Closed-Loop Supply Chain

1
College of Management Science, Chengdu University of Technology, Chengdu 610059, China
2
School of Management and Economics, University of Electronic Science and Technology of China, Chengdu 611731, China
3
Sichuan Province Cyclic Economy Research Center, Mianyang 621010, China
4
Management School, Chongqing University of Science and Technology, Chongqing 401331, China
*
Author to whom correspondence should be addressed.
†
These authors contributed equally to this work.
Sustainability 2019, 11(1), 8; https://0-doi-org.brum.beds.ac.uk/10.3390/su11010008
Submission received: 9 December 2018
/
Revised: 13 December 2018
/
Accepted: 14 December 2018
/
Published: 20 December 2018
(This article belongs to the Special Issue How Retailers Could Contribute to Sustainable Development)
Abstract
:With the development of the Internet, many brand name manufacturers including Apple, Lenovo, and Canon offer remanufactured products through their official website. Confronting the competition from remanufactured products that are available from the manufactured-owned channel, more and more retailers have recognized that customer service level is one of the most important performance metrics and have aggressively attempted to obtain larger market shares by providing high levels of post-sale services. Although numerous researchers have studied various competitive strategies in remanufacturing, to the best of our knowledge, there is little research highlighting whether and how economic performance and sustainability issues related to remanufacturing operations are affected by the retailer’s service levels. In this paper, we fill this gap by developing two models for the closed-loop supply chain where all remanufactured products are available from the manufactured-owned channel, while the equilibrium behavior of the retailer can be characterized under two possible scenarios: (1) Confronting the cannibalization from direct channels where the retailer only responds on prices (i.e., Model P); or (2) on providing competitive prices and high service levels for new products (i.e., Model S). Our analysis suggests that, from managers’ perspective, if the manufacturers care more about economic benefits, encouraging the retailer to provide higher levels of post-sale services is a beneficial strategy. If they are more concerned with environmental performance, Model P is preferred. However, from the angle of environmental groups and agencies, if the level of eco-centrism is too pronounced, though Model S has a greater profitability for both parties, a more significant welfare loss due to environmental hazard is perceived by the society. As a result, besides avoiding indulging in overproducing on new products, environmental groups and agencies should take emissions trading or taxation into consideration to stimulate remanufacturing operations.
1. Introduction
The rapid development of technology tends to shorten the life cycle of many products [1]. This tendency is particular noticeable in the waste electrical and electronic equipment (WEEE). For example, the expected waste of computers, TV-sets, fridges, and phones is expected to grow to more than 12 million tons by 2020. If not properly managed, such large quantities of WEEEs will result in heavy problems for our environment and health. To improve the environmental performance and to increase profit margins, recycling and/or remanufacturing the end-of-life products is essential [2]. For instance, Xerox has succeeded in running its remanufacturing operations in the USA, UK, the Netherlands, Australia, Mexico, Brazil, and Japan. Similar cases can be observed in the Apple Corporation [3], IBM [4], Canon [5], and HP [6], etc.
In contrast to the forward supply chain that involves the raw material and product flows from manufacturers to final consumers, the reverse supply chain usually associates with reverse product streams, in which manufacturers collect used products from consumers. When the forward and reverse supply chains are integrated, they constitute a closed-loop supply chain [7,8,9]. Although the closed-loop supply chain can be given a green environment and resource preservation reputation, incorporating recycling and remanufacturing into existing business processes poses several questions for operational decisions [10,11]. For example, a combination of marketing and remarketing for new and remanufactured products may lead retailers’ irrational behavior in product distribution [11]. For example, in a 17 April 2009 lawsuit filed by Dell in the New York district court, Tiger, an authorized retailer of Dell’s new products until May 2007, was accused of selling remanufactured Dell products including laptops, desktop computers, peripherals, and related computers parts that were purchased from other resellers while claiming they were brand new and shuttled directly from Dell. In this lawsuit, Dell further filed for an injunction on Tiger for using any of its materials and to recover three times the profits Tiger made for their alleged wrongful actions and for unspecified damages to Dell [12]. A similar case has also appeared in the Chinese market, in July 2010, a staff member from Gao Hongheng Chang Technology Co., one of the biggest retailers and authorized after-sales servicers of HP, revealed to the media that the latter hoodwinked its consumers by offering HP’s remanufactured personal computers that were claimed as new [13].
Consequently, rather than distributing both products through a common retailer, the manufacturer usually remarkets the remanufactured products through dedicated channels [11,14]. For example, after undergoing a rigorous refurbishment process to make sure the products are up to Apple’s high standards, the Apple Corporation distributes its remanufactured products on its official website (www.apple.com) and pushes its standard one-year limited warranty [3]. Similarly, Lenovo also provides all of its remanufactured laptops, desktops, tablets, and workstations, through its official website (shop.lenovo.com.cn) in the Chinese market. In particular, with the development of e-commerce, more and more well-known manufacturers such as Dell [15], Canon [16], and Bosch Tools [17], have created dedicated channels to offer remanufactured items through their official websites. Selling remanufactured products through manufacturer-owned channels is becoming more and more prevalent in many industries [14].
Undoubtedly, although the remanufactured products are usually valued much lower by consumers, a combination of marketing and remarketing for new and remanufactured products in a closed-loop supply chain would induce a coexistence of cooperation and competition, i.e., coopetition relationship, between the manufacturer and its retailers. That is, on the one hand, the manufacturer is the supplier for traditional retailers who resell all new products in the market. Thus, they should cooperate with each other to create value on new products marketing. On the other hand, the manufacturer is also a competitor of the traditional retailers, as the substitutes (the remanufactured products) are available from the manufacturer-owned channel. As such, they would compete with each other when different products are distributed through differentiated channels. The latter is particularly true under the circumstances that, compared to the traditional retail channel, the online direct channel has many advantages, including involving fewer middlemen, higher control efficiency, decreased risks of overstock, etc. [18].
As a result, retailers have naturally taken various measures to respond to the competition from remanufactured products that are sold through the manufactured-owned channels. For example, to confront the fierce competition from online channels, in the computer and electronics industry, more and more traditional retailers are aggressively attempting to obtain larger market shares by providing higher levels of post-sale services [19]. Even if most traditional retailers do not yet advertise their service levels, “customer service level” has been recognized by retail executives as one of the most important performance metrics, ahead of traditional key measures such as “sales per selling square foot” [20]. The discussion above raises a question of whether the economic performance and sustainability issues related to remanufacturing operations are affected by the retailer’s service levels.
To answer this fundamental research question, in this paper, we developed two theoretical models where all remanufactured products were available from a manufactured-owned channel, while the equilibrium behavior of traditional retailers was characterized under two possible scenarios. (1) Confronting the cannibalization from the manufacturer-owned channel, the retailer only responds on prices (i.e., Model P); and/or (2) the retailer competes with the remanufactured products by using competitive prices and high service levels (i.e., Model S). Using both models, we aimed to answer the following questions:
- (1)
- From the economic performance perspective, how do the retailer differentiated response strategies affect the profitability of the manufacturer, retailer, and industry?
- (2)
- From the environmental sustainability perspective, how do the retailer differentiated response strategies affect the sustainability issues related to our environment?
- (3)
- From the social welfare perspective, how do the retailer differentiated response strategies affect the welfare issues related to our society?
We found that from the economic performance perspective, both parties benefited more under Model S when the retailer responded to the competition from remanufactured products with a mix of price and service simultaneously. Conversely, from the environmental sustainability and consumer welfare perspectives, our analysis indicated that competing with Model P, the retailer responses with a mix of price and service were always detrimental to environmental sustainability and may also hurt consumer welfare. As a result, our analysis suggests that, from managers’ perspective, if the manufacturers care more about economic benefits, encouraging the retailer to provide higher levels of post-sale services is a beneficial strategy. If they are more concerned with environmental performance and/or consumer welfare, necessary measures should be taken to control retailers’ aggressive promotion service in new products marketing. However, from the environmental groups and agencies angle, if the level of eco-centrism is too pronounced, though Model S has greater profitability for both parties, a more significant welfare loss due to environmental hazard is perceived by the society. As a result, besides avoiding the tendency to indulge in overproducing on new products, environmental groups and agencies should take emissions trading or taxation into consideration when stimulating remanufacturing operations.
Our overall contribution is therefore as follows. On the one hand, although there are numerous researchers (see Yan et al. [11] and references therein) who have studied the coopetition relationship between the manufacturer and its retailers in a closed-loop supply chain, to the best of our knowledge, there has been little research addressing whether and how the economic performance and sustainability issues related to remanufacturing operations are affected by the retailer’s service levels. To fill this gap, the retailer’s sales effort was taken into account in the closed-loop supply chain. On the other hand, despite sales efforts having been well studied in the forward supply chain (see Rubel and Prasad [21] and references therein), little is known about whether and how the influences of a retailer’s service levels on the manufacturer’s remarketing strategies, which impacts the economic and sustainability outcomes related to a closed-loop supply chain.
The remainder of this paper is organized as follows. Section 2 reviews the related literature. Section 3 outlines the problem setting and formulates both models. Section 4 analyzes both models and drives the main results from the economic, environmental sustainability, and social welfare perspectives, respectively. Section 5 concludes our work and provides future research directions.
2. Literature Review
The first related area of literature is on the coopetition relationship in closed-loop supply chains. For example, Turki and Rezg [10] provided an optimal design for a manufacturing/remanufacturing system that differentiates between new and remanufactured products and sorts the used products into three quality levels and determined the optimal storage capacities and production decisions regarding new and remanufactured products while considering carbon emissions. Li et al. [22] examine the influences of vertical and horizontal cooperation models on the optimal decisions and performance of a low-carbon closed-loop supply chain with a manufacturer and two retailers and found that the completely centralized model was best in all optimal decision results among all models. Wang et al. [1] examines the benefit of the reward-penalty mechanism (RPM) in a closed-loop supply chain that composes with a manufacturer and its collector and shows that the manufacturer prefers remanufacturing with RPM if the target collection rate is below a threshold; but the opposite is true if the target collection rate is too high. Turki et al. [8] highlight the optimization of a manufacturing– remanufacturing–transport–warehousing closed-loop supply chain and intend to evaluate the optimal capacities of manufacturing stock, purchasing warehouse and the vehicle, as well as the optimal value of returned used end-of-life products. He and Zhang [9] and Govindan et al. [23] provided comprehensive literature reviews on the coopetition relationship in closed-loop supply chain management. As mentioned earlier, although numerous researchers have studied remanufacturing, to the best of our knowledge, none of the above literature has highlighted whether and how the economic performance and sustainability issues related to remanufacturing operations are affected by the retailer’s service levels.
The second related area of literature is on the retailer’s sales efforts in the forward supply chain. In particular, Rubel and Prasad [21] propose a dynamic model with present selling efforts, drive sales and show that a salesperson with low risk aversion exerts effort to decrease attrition from existing business, whereas a salesperson with high risk aversion does not. Martin-Herran and Sigue [24] then develop a model where, besides pricing decisions, the retailer and manufacturer can set their advertising and cooperative advertising support rates for each period and reveal that the manufacturer may change his advertising support over time depending on the nature of the long-term effects of retailer advertising. Subsequently, Wang et al. [25] focus on the manufacturer’s two main customer satisfaction incentives for the retailer: customer satisfaction index bonus (CSI bonus) and customer satisfaction assistance (CS assistance) and find that, if the manufacturer has weak market pricing power, then she should only offer CS assistance but not CSI bonus to the retailer when the market wholesale price is relatively low. Meanwhile, Lou and Ma [26] study the complexity of sales efforts and carbon emission reduction efforts in a Bertrand household appliance supply chain system and suggest that the adjustments of price would affect the stability and profits much more than the sales effort and carbon emission reduction effort in all three game structures. We refer interested readers to Karray et al. [27] for a complete discussion on the sales efforts in the forward supply chains. As mentioned earlier, although the sales efforts in the retail market have been well studied in the above literature, little is known about whether and how the influences of a retailer’s service levels on the manufacturer’s remarketing strategies, which impacts on economic and sustainability outcomes related to closed-loop supply chain.
In recent years, several researchers have begun to address the promotional efforts that encourage the returns of used cores for remanufacturing. For example, De and Zaccour [28] considered a two-period closed-loop supply chain model where a remanufacturer appropriates the returns’ residual value and decides whether to exclusively manage the end-of-use product collection or to outsource it to either a retailer or a third-service provider. Gao et al. [29] investigated the optimal decisions of a collection effort and pricing under different channel power structures, namely manufacturer Stackelberg, vertical Nash, and retailer Stackelberg and showed that the manufacturer may also benefit when the demand expansion effectiveness of the collection effort is large enough. Das and Dutta [30] developed a market-driven recovery framework for acquiring the used products from consumers and showed that there was a trade-off between manufacturing/remanufacturing cost, penalty cost for not fulfilling the legislation criterion, and collection cost due to the employment of the promotional offer. The above literature analyzed the promotional efforts in product collection, thus ignored the potential roles of sales efforts played by the retailers in the forward channels. In other words, they did not pay any attention to whether the economic performance and sustainability issues related to remanufacturing operations were affected by the retailer’s service levels. This is exactly the issue we seek to address here. More specifically, in contrast to these studies, in our models, rather than highlighting on the collection effort that encourages the return of used cores for remanufacturing, we focused on whether (how) the retailer’s sales efforts affected the economic, environmental, and social performance, respectively.
In particular, our work was closely related to Jena and Sarmah [31], who addressed two manufacturers competing on price and service to sell their substitutable products (new and remanufactured products) through a common retailer, and provided service directly to the end customers. It should be noted that, our study was different to theirs in several important aspects. First, rather than assuming that the remanufacturing operations could be undertaken by another remanufacturer, we let all remanufactured products be produced by the manufacturer. This is consistent with the fact that manufacturers may adopt appropriate remanufacturing patent laws to protect their remanufacturing operations [32]. Second, they assumed that both manufacturers provided service directly to the end customers. However, in reality, intermediaries play an important role in the distribution of products [33], thus, we provided an alternative and somewhat complementary research perspective to address whether and how the retailer’s service levels impacted on the economic performance and sustainability issues related to remanufacturing operations. Third, they assumed that the market demands were undifferentiated between new and remanufactured products. In contrast, we assumed that the consumers’ willingness to pay for remanufactured products was lower than that of new units, which is supported by empirical evidence that remanufactured products are usually valued much lower by consumers [34].
3. The Model
We considered two models where the manufacturer would produce both products (i.e., new and remanufactured products) and sell remanufactured products directly through its owned channels, while the equilibrium behavior of the traditional retailer would be characterized under two possible scenarios. (1) Confronting the competition from direct channels, the retailer only responds on prices (i.e., Model P); and/or (2) the retailer competes with the manufacturer by offering competitive prices and high service levels (i.e., Model S). The notations of all related parameters are listed in Table 1. We then lay out our assumptions as follows.
Assumption 1.
All decisions are considered in a steady state period: the manufacturer announces the wholesale price for new products () to the retailer who responds with the optimal units/levels of products/services () that are available from the retail channel. Subsequently, the manufacturer encroaches into the retail market by offering the remanufactured products with.
Like Yan et al. [35] and Xiong et al. [36], our analysis is on a steady state period, which means both products are introduced to the market repeatedly.
Assumption 2.
Consumers’ valuationabout the new product is heterogeneous. Specifically, it is uniformly distributed in a market with the size normalized to 1, i.e.,.
Assumption 3.
We assumed that the willingness-to-pay ratio of a remanufactured product to a new one was.
We focus on a market in which consumer heterogeneity is uniformly distributed on willingness to pay [11,35]. Following Xiong et al. [36] and Zou et al. [37], we assume all consumers value remanufactured products lower than that of new products; i.e., . More specifically, in both our models, a consumer, who values for the new product, has a valuation of for the remanufactured one. That is, if , a consumer of type for a new product would view the remanufactured one as a product without any substitution for the new one. Conversely, if , all consumers would find that the remanufactured product is a perfect substitute for the new one and pay the same amount for the former.
Assumption 4.
The consumers’ willingness-to-pay for a new product was affected by the retailer’s sales efforts (), which accompanied the sales promotional cost that is convex increasing with the sales efforts,.
Note that in both models, we allowed all consumers to appear as a vertical heterogeneity in the individual consumer’s willingness-to-pay for new and remanufactured products [35,38]. Assumption 4 indicates that the retailer can achieve higher consumer satisfactions by providing higher service efforts (), which accompanied a quadratic function of service levels, , where is the scaling parameter [39,40,41].
Based on Assumption 2–4, we can thus derive the inverse demand functions for new and remanufactured products as follows: (we refer the reader to Yan [35] for the detailed derivation.)
Assumption 5.
The unit cost of making a remanufactured product was less than that of producing a new one (i.e.,).
Assumption 5 reflects the fact that remanufacturing is a low-cost alternative to producing [35,36]. For simplicity, like in Arya et al. [42] and Xiong et al. [43], we set .
Assumption 6.
The cost of selling a new product via the traditional retail channel was, while the unit cost of selling a remanufactured product through the manufacturer-owned direct channel was.
As per prior research in Yan et al. [11], we divide the cost of selling new products into two parts: the unit cost for distributing new products and the cost of sales efforts. A similar division is quite common in the marketing domain (see e.g., Karray and Zaccour [39] and Desai [41]).
3.1. Retailer Only Responses with Prices (Model P)
The consequence of the game theory between both parties is as follows. First, the manufacturer announces the wholesale prices of new products () to the retailer, who maximizes its profits by determining the optimal units of the new products (). Finally, observing the retailer’s response for the optimal wholesale price, the manufacturer chooses the optimal quantities of remanufactured products () sold through its own direct channel. To determine the subgame perfect equilibrium, we solved the problem with backward induction. Then, we could rewrite the manufacturer’s problem as follows.
Given the wholesale prices of new products () and anticipating the optimal quantities of remanufactured products (), the retailer’s problem would optimize
Finally, anticipating the retailer’s response of , the manufacturer’s problem is
All optimal decisions are summarized in Table 2 (for clarity, the proof is provided in Appendix B.1).
3.2. Retailer Responses with Prices and Service (Model S)
In Model S, the manufacturer first sets the wholesale prices of new products () to the retailer, who responds with the optimal units () and the optimal service levels () that are available from the traditional retail channel. Subsequently, the manufacturer maximizes its profitability by choosing the optimal units of remanufactured products ().
Therefore, the manufacturer’s problem would maximize
Given the optimal wholesale price of and anticipating the optimal quantities of , the retailer’s problem is
Like Model P, we can solve the problem with backward induction to determine the subgame perfect equilibrium. More specifically, once the manufacturer maximizes its profit by choosing , the retailer would also do so by determining its optimal quantities of , and levels of , after which the manufacturer would set its optimal wholesale price of . We can therefore obtain all equilibrium decisions in Table 2.
It should be noted that to ensure the retailer may respond with providing adequate service and that both parties would offer certain quantities of both products, like Yan et al. [35] and Liu et al. [38], we impose the following lemma:
Lemma 1.
In both scenarios, the costs for distributing remanufactured products should lie in the interval of.
Lemma 1 indicates that, on the one hand, to ensure the retailer provides sufficient new products (i.e., ), which are obtained for used cores for remanufacturing, we need for . On the other hand, to ensure the manufacturer engages with remanufacturing, we need .
4. Model Analysis
We are now in a position to address the question posed at the beginning of this paper, whether the economic performance and sustainability issues related to remanufacturing operations are affected by the retailer’s service levels. To do so, based on the equilibrium outcomes in Table 2, we first compared the equilibrium decisions of both models. Subsequently, we compared both models from economic, environmental, and social welfare perspectives, respectively.
4.1. Comparing Equilibrium Decisions
Based on the outcomes in Table 2, we first listed the differences in the following proposition (the proof of all propositions is listed in Appendix C).
Proposition 1.
The manufacturer always sets a lower wholesale price for the new products in Model S than that in Model P, i.e.,.
The retailer only responds with price in Model P, however, in Model S, the retailer would respond with providing competitive prices and high service levels when confronting the competition from remanufactured products. Furthermore, the increase in the levels of service is always accompanied with a higher price charge by the retailer. As a result, one might expect an increased marginal revenue per product that accompanies a higher wholesale price charged by the manufacturer. In fact, as Proposition 1 shows, the opposite is true. In particular, the manufacturer is more likely to set a lower wholesale price for the new product in Model S than in Model P. This can be interpreted as an increase in the service levels and the higher consumers’ willingness-to-pay for a new product relative to the remanufactured one. The growth in the difference between both products would mitigate the adverse effects of the competition and increase the manufacturer’s marginal revenue from selling remanufactured units. As a result, the manufacturer sets a lower wholesale price in Model S to provide a strong boost to the retailer’s behavior of providing a higher service in the traditional retail channel.
It should be noted that, Proposition 1 differs from the results of Arya et al. [42], who conclude that, confronting the supplier encroachment, “the manufacturer sets a lower wholesale price in the encroachment setting than in the no-encroachment setting in order to offset the advantage its retail arm secures when it effectively receives the input at cost” (p. 654). Obviously, a significant difference is that, although both models also involve a supplier, who distributes products through a manufacturer-owned direct channel, our models are intended to highlight whether and how the influence of a retailer’s service levels affects the manufacturer’s remarketing strategies, which impacts the economic and sustainability outcomes related to a closed-loop supply chain without focusing on whether and how the influence affects supplier encroachment.
The reduction in the wholesale price implies that the retailer may have a higher incentive to distribute more quantities of new products. The outcomes in Table 2 indicate this is indeed the case, even if the manufacturer sells remanufactured products through the direct channel.
Proposition 2.
There is a higher quantity of new products in Model S than that in Model P, that is,.
Not surprisingly, the reduction in wholesale price leads to a higher quantity of new products, which is quite consistent with traditional wisdom: if the retailer offers a higher level of service to end consumers, the consumers would appear to have a higher willingness-to-pay for a new product relative to the remanufactured one. Such growth in the difference between both products cannot only mitigate the adverse effects of competition between both products, but can also increase the manufacturer’s marginal revenue from selling remanufactured units. As a result, the manufacturer would like to set a lower wholesale price in Model S (see Proposition 1), which would lead to a natural increase in the quantities of new products that are distributed by the retailer.
The above two propositions involve the decision-making between supply chain members who vertically cooperate on a promotion strategy. More specifically, we find that the manufacturer more likely sets a lower wholesale price for the new product (see Proposition 1), which can be a positive response for product promotion to its downstream agent (i.e., the retailer): the retailer would sell more quantities of new products (see Proposition 2), which can maximize their profits (see, Proposition 4). In fact, such vertical cooperation is quite common within a supply chain that considers a promotion strategy (see, e.g., Li et al. [22], and Xu et al. [44]). It should be noted that, our aim is quite different from theirs. For example, they do not pay any attention to the effect of a retailer’s service levels on the manufacturer’s remarketing strategies, which impacts economic and sustainability outcomes related to closed-loop supply chain. This is exactly the issue we seek to address in this paper.
The difference in the equilibrium quantities of remanufactured products between both models is the next issue of discussion, which can be summarized in the following proposition.
Proposition 3.
There is a lower quantity of remanufactured products in Model S than that in Model P, that is.
Proposition 3 reveals that the manufacturer is more likely to provide lower quantities of remanufactured products in Model S. The manufacturer does so for two reasons. On the one hand, in Model S, the retailer sets a higher level of service for new products to the consumer, which leads to a higher willingness-to-pay for a new product. Such growth in the consumers’ willingness-to-pay for a new product would increase the manufacturer’s marginal revenue of selling new units. On the other hand, the increase in the availability of new products means that the potential market for the remanufactured products is lower. As a result, like Proposition 3 shows, the manufacturer is more likely to provide lower quantities of remanufactured products in Model S, i.e., .
The above three propositions indicate that, when both products are distributed through differentiated channels, the coopetition relationship is raised between the manufacturer and its retailer. When all remanufactured products are available from the manufactured-owned direct channel, such a relationship would become much more complex within a supply chain. On the one hand, the manufacturer is the supplier for traditional retailers who resell all new products in the market. Thus, they should cooperate with each other to create value on new product marketing (see, Propositions 1 and 2). On the other hand, the manufacturer is also a competitor of the traditional retailers as the substitutes (the remanufactured products) are available from the manufacturer-owned channel. As such, they would compete with each other when different products are distributed through differentiated channels (see, Proposition 3).
4.2. Comparing Economic Performance
So far, we have focused on the difference in equilibrium decisions between both models. We are now in a position to address the difference in economic performance. More specifically, we tried to answer the question posed at the beginning of this paper: From the economic performance perspective, how do the retailer differentiated response strategies affect the profitability of the manufacturer, retailer, and industry? We answered this question from the manufacturer’s perspective.
Proposition 4.
The strategy of responding with prices and services creates a greater profitability for both parties, that is,,.
Note that the manufacturer’s profit increases with the wholesale price charged to the retailer and the quantity of remanufactured products available from the direct channel. If the lowered wholesale price (see Proposition 1) is not counterbalanced by a higher quantity of new products (see Proposition 2), the manufacturer will suffer a loss in its profitability that is available from new products. Thus, as Proposition 4 shows, although the lower wholesale price decreases the manufacturer’s profit from product wholesaling, it increases the OME’s profits by a larger amount when purchased by the retailer.
Furthermore, from a broader viewpoint, Proposition 4 reveals that, although there is a competition on selling different products, cooperation in selling new products with a retailer, who provides promotion strategy in the tradition channel, can sufficiently coordinate the closed-loop supply chain. That is, the cooperative profit from selling new products is sufficiently high to compensate for the profit loss (see Proposition 3) in competition. As a result, both parties benefited more under Model S when the retailer responded to the competition from remanufactured products with a mix of price and service simultaneously. In particular, the retailer’s higher profits in Model S stems both from the lowered wholesale prices set by the manufacturer and from the growth in the consumers’ willingness-to-pay for a new product relative to the remanufactured one.
4.3. Comparing Environmental Performance
We now pay attention to the difference in environmental performance. More specifically, we attempt to answer the second question posed at the beginning of this paper: From the environmental sustainability perspective, how do the retailer differentiated response strategies affect the sustainability issues related to our environment?
To incorporate environmental performance in our models, consistent with prior studies in [11,35,45], we used the quantities of new and remanufactured products as a proxy for the environmental performance. More specifically, we also recognize the fact that any producing and remanufacturing behavior naturally accompanies undesirable pollutants, such as carbon dioxide etc. In addition, remanufacturing can reduce emissions, since it consumes fewer materials and energy than producing process. Hence, in this subsection, we assume that the unit emission for producing per new product is , while the unit emission for remanufacturing per remanufactured one is , where . Like Maurice D. and Barrie [46] and Yenipazarli [47], for simplification, we normalize the unit emission for producing per new product to 1, i.e., . Let () represent the environmental impact of Model P (Model S).
Based on the outcomes in Table 2, we can summarize the difference in the environmental performance of both models in the following proposition.
Proposition 5.
Compared to Model P, the retailer’s strategy of responding with prices and services is always detrimental to our environment, that is,.
The intuition behind Proposition 5 is as follows. When the retailer offers a high service level to end consumers in Model S, such a strategy can increase the marginal revenue of the new product and lead the manufacturer to set a lower wholesale price in Model S (see Proposition 1) in order to support new product sales in the traditional retail channel (see Proposition 2), which leads to a higher environmental impact from new products. On the other hand, when the retailer offers a higher level of service to end consumers in Model S, this strategy can mitigate the adverse effects of the cannibalization problem between both products and increase the profitability of both parties (see Proposition 4), resulting in providing a boost to the new products sales and the manufacturer likely to remanufacture less used cores (see Proposition 3) in Model S, which leads to lower environmental recovery through product remanufacturing. In sum, as Proposition 5 shows, the retailer’s strategy of responding with prices and services results in higher negative impacts on our environment. Said differently, compared to Model P, the retailer’s strategy of responding with prices and services is always detrimental to our environment.
In the analysis thus far, we have compared both models from economic and environmental performance, respectively. In order to have a more comprehensive understanding on these two important issues, based on Propositions 4 and 5, we offer the following corollary (without proof).
Corollary 1.
If the manufacturers care more about economic benefits, encouraging the retailer to provide higher levels of post-sale services is a more beneficial strategy than Model P; conversely, if they are more concerned with environmental performance, necessary measures should be taken to control retailers’ aggressive promotion service in new products marketing.
It is worth noting that in our both models the manufacturer is in a monopolistic position by choosing that its wholesale prices achieve the Stackelberg leader in both models. Therefore, Corollary 1 is a simple illustration of its tradeoffs in economic performance where more profits can be available in Model S but accompanied with more pollutants. The intuition for Corollary 1 is analyzed in Propositions 4 and 5 and is not repeated here.
4.4. Comparing Social Welfare
In this subsection, we address the final question concerning the difference in the welfare implications of both models: From the social welfare perspective, how do the retailer differentiated response strategies affect the welfare issues related to our society?
To evaluate the social impact of the retailer differentiated response strategies, we should obtain the optimal welfare values including the consumer willingness-to-pay for new products as well as remanufactured ones. This can be calculated as follows:
Like the literature on environmental economics (see, e.g., Maurice and Barrie [46], Yenipazarli [47] and Cachon [48]), we define as an eco-centrism parameter that reflects the degree of the society’s consciousness over the environmental pollutants. That is, the total environmental costs for both models are and , respectively.
Let () represent the total social welfare of Model P (Model S). Then, we can summarize the difference in the social welfare between Model P and Model S as follows.
Proposition 6.
There exists abelow which; otherwise, the opposite is true.
Note that is the eco-centrism parameter that represents the level of eco-centrism. Thus, Proposition 6 reveals that, if the level of eco-centrism is not too pronounced, the retailer’s strategy of responding with prices and services results in increased social welfare. Naturally, based on Proposition 4 and 6, we can we obtain the following corollary (without proof).
Corollary 2.
If the level of eco-centrism is too pronounced (i.e.,), though Model S has a greater profitability for both parties, a more significant welfare loss due to environmental hazard is perceived by society.
It should be noted that, on the one hand, Model S can increase both parties’ profits and the consumer welfare from new and remanufactured products (see, Proposition 4). On the other hand, compared to Model P, the retailer’s strategy of responding with prices and services is always detrimental to our environment. Thus, Corollary 2 can be interpreted as follows. When the level of eco-centrism is not too pronounced, i.e., , the benefits from economic profitability is sufficient to compensate the loss of environmental performance. Conversely, When the level of eco-centrism is not too pronounced, i.e., , the benefits from economic profitability are not sufficient to compensate a more significant welfare loss due to the environmental hazard that is perceived by the society. This argument is partly supported by Yenipazarli [47], who suggests that, besides avoid indulgence in overproducing on new produces, governments should take emissions trading or taxation into consideration to stimulate the remanufacturing operations.
4.5. Numerical Example
To gain deeper insight, in this subsection, we went a step further to reveal all propositions with numerical experiment. Like Subramanian and Subramanyam [49] and Esenduran et al. [50,51], we present an illustrative numerical study with Liquid Crystal Display (LCD) monitors, where the data is obtained from the literature and industry reports. Note that, in all numerical experiments, we need to normalize all parameter values because the potential market size is normalized to 1 in both our models.
Consumers usually value the remanufactured product much lower than that of the new one. This is particularly true for electronic products such as LCD [50]. For example, we argue that the consumer value discount for remanufactured products, , is around 85% [52]. Thus, we round it and pick . In the literature on marketing (see, e.g., Arya et al. [42]), it is generally argued that the range of marketing cost to market size is about 20% to 60%. Therefore, we pick the marketing cost for a new product as . Remanufacturing is a low-cost and greener alternative to producing, like Yenipazarli [47], we study a scenario where remanufacturing could require up to 10% less cost than manufacturing (i.e., ) and assume that remanufacturing reduces 45% of pollutants emissions (i.e., ). In the literature of sales promotion (see, e.g., Rubel and Prasad [21]), the retailer can achieve higher consumer satisfactions by providing higher service efforts. A convex cost function, , is assumed and we let the scaling parameter of collection cost be characterized by . Like Yan et al. [35] and Liu et al. [38], to ensure , we need the costs for distributing remanufactured products to lie in the interval of .
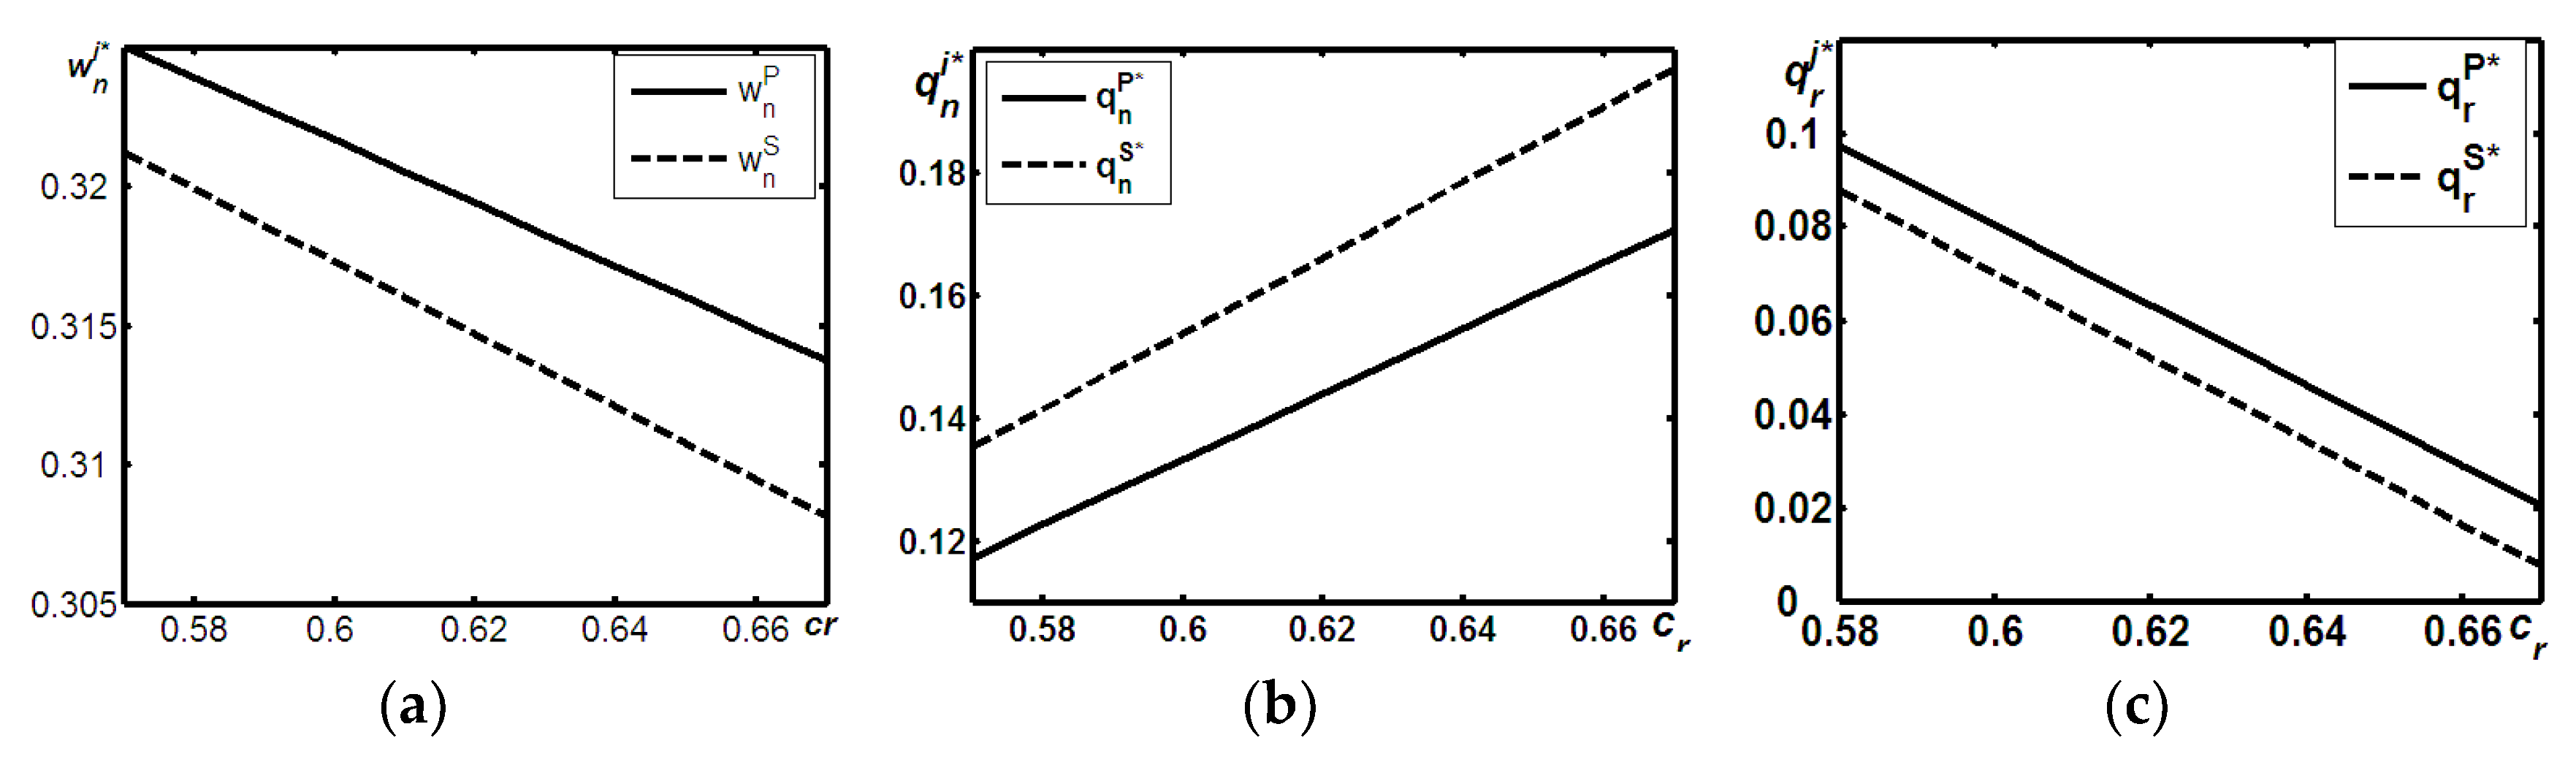
We first highlight the results of equilibrium decisions with numerical example. Based on Figure 1a, we can easily drive the two phenomena. On the one hand, as Proposition 1 shows, we found that for any , the wholesale price in Model P was always higher than that in Model S. On the other hand, as the cost of distributing a remanufactured product () increases, the wholesale prices of both models decrease. Furthermore, the difference between both wholesale prices increases with the cost of .
Using the same parameters as before, we can do the other numerical example on Proposition 2, which illustrated with Figure 1b. In particular, we found that, on the one hand, the optimal units of new products in Model S were always higher than that in Model P. On the other hand, the wholesale prices in both models increased with the cost of . In addition, Figure 2 further reveals that the difference of both wholesale prices increased with the cost of .
Figure 3 reports the optimal quantities of remanufactured products that available from the manufacturer-owned direct channels. Figure 1c illustrates three important phenomena: First, as shown in Proposition 3, the quantity of remanufactured products in Model S is lower than that in Model P, that is . Second, the optimal quantities of remanufactured products in both models decrease with the cost of remarketing. That is, as the unit remarketing cost for remanufactured products increases, the manufacturer would decrease the remanufactured units that are from its own direct channels. Finally, as the unit remarketing cost for remanufactured products increases, the difference between optimal units of remanufactured products increases.
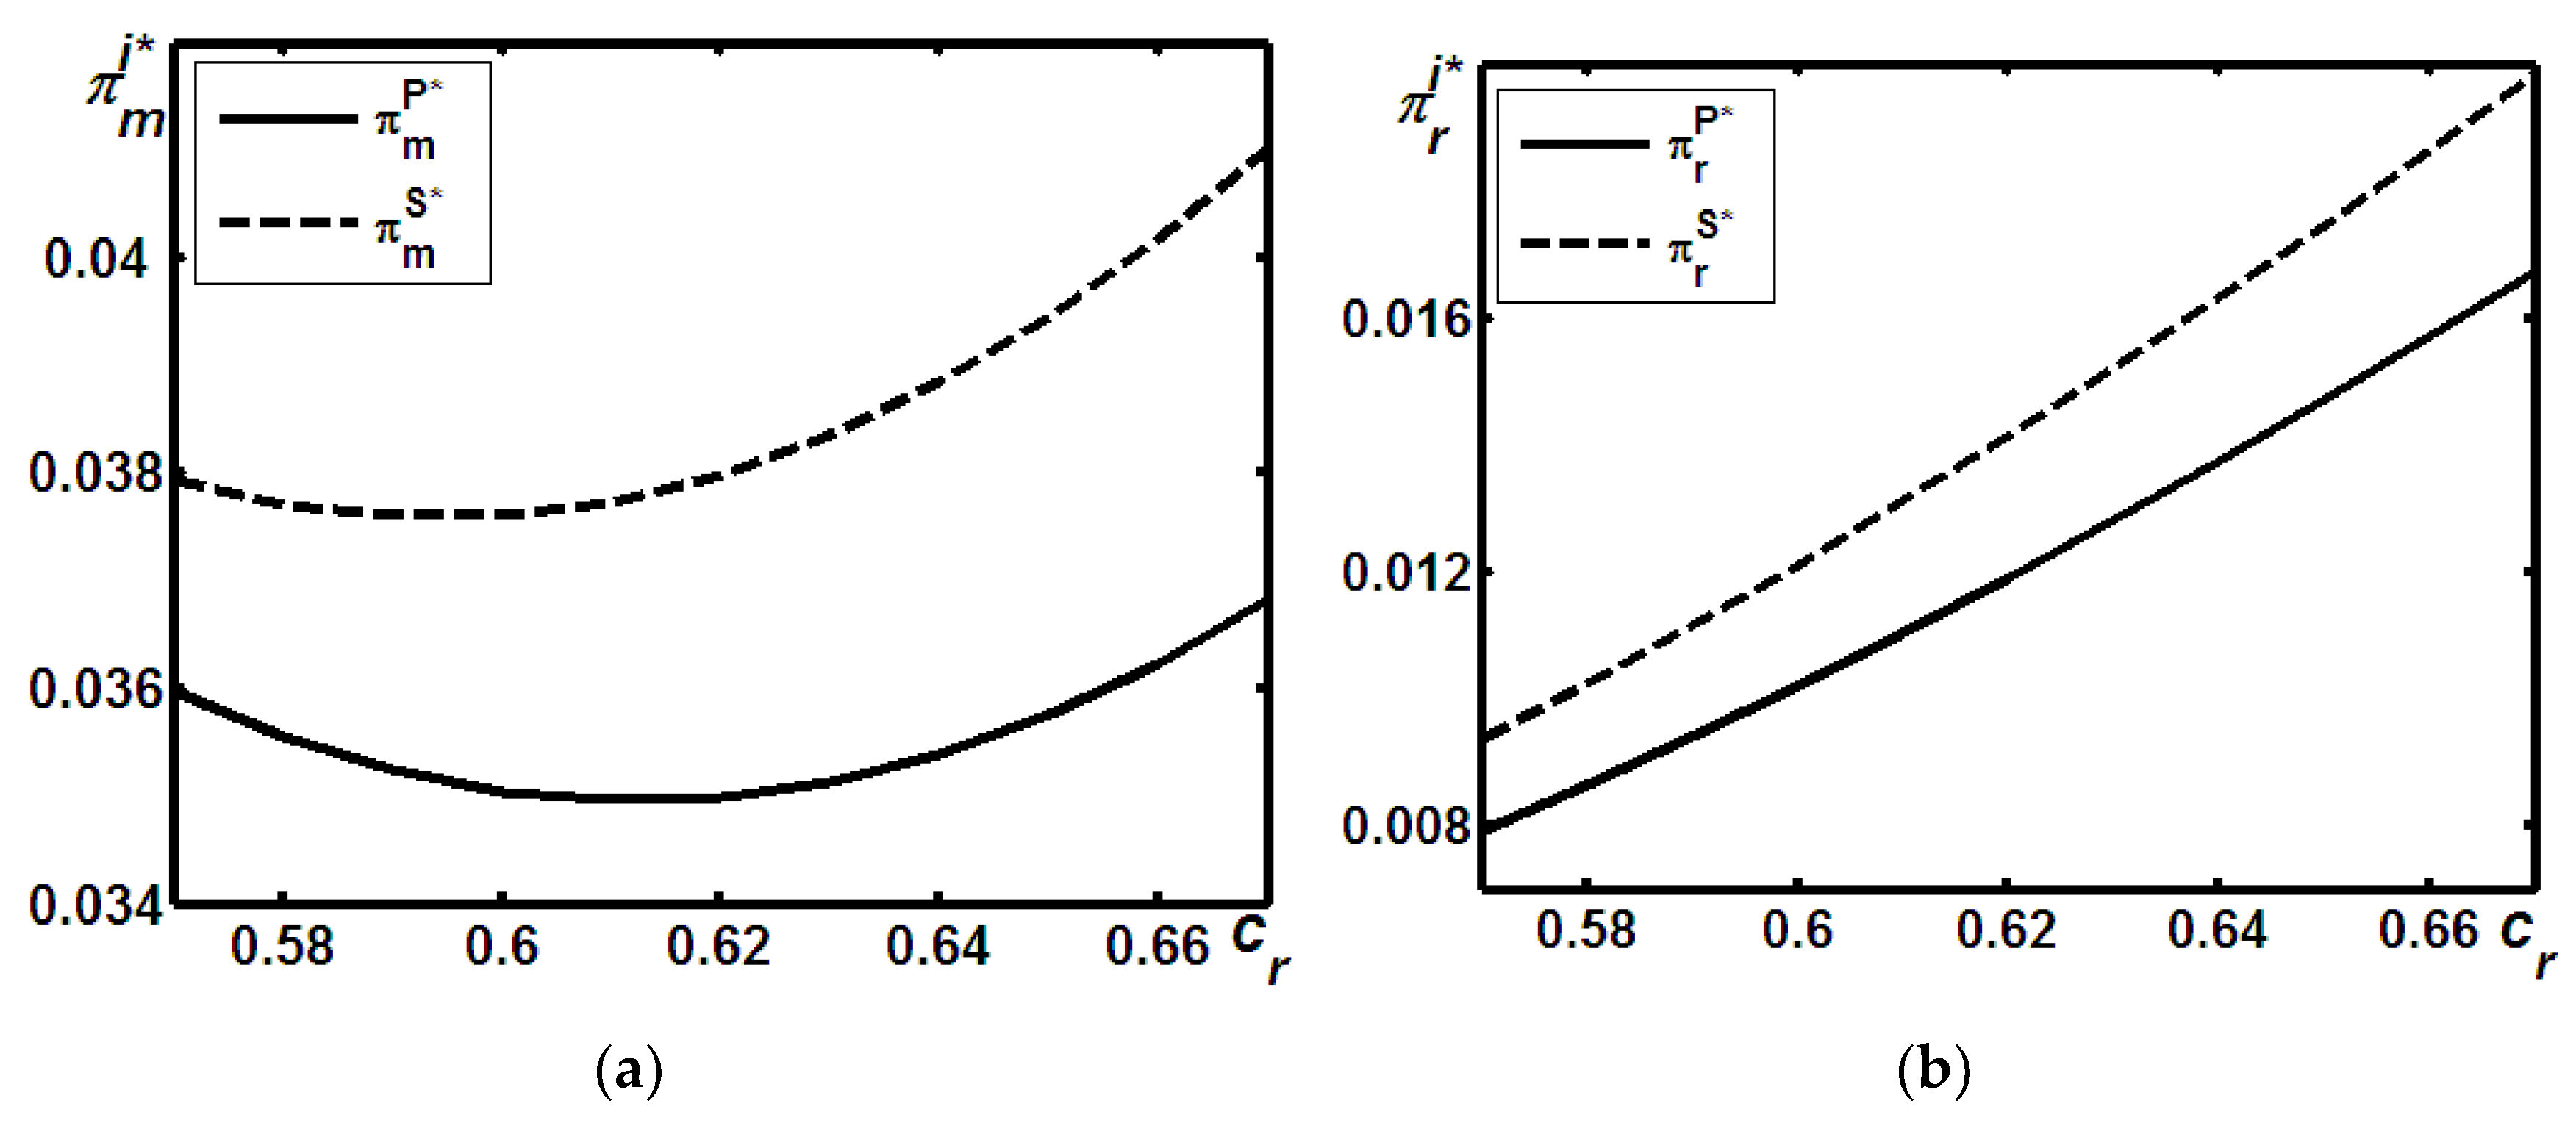
Figure 2 illustrates the results for economic outcomes. More specifically, based on Figure 2a, we can conclude that, as Proposition 4 shows, the optimal profit of the manufacturer in Model S was always higher than that in Model P. In addition, as the optimal profits of the manufacturer in both models was convex with the cost of , the former effect was that they both decreased at the early region and then increased with the cost of distributing remanufactured products. However, from Figure 2b, we found that although the profits of the retailer in both models increased with the cost of , the profits of the retailer in Model S were always higher than that in Model P.
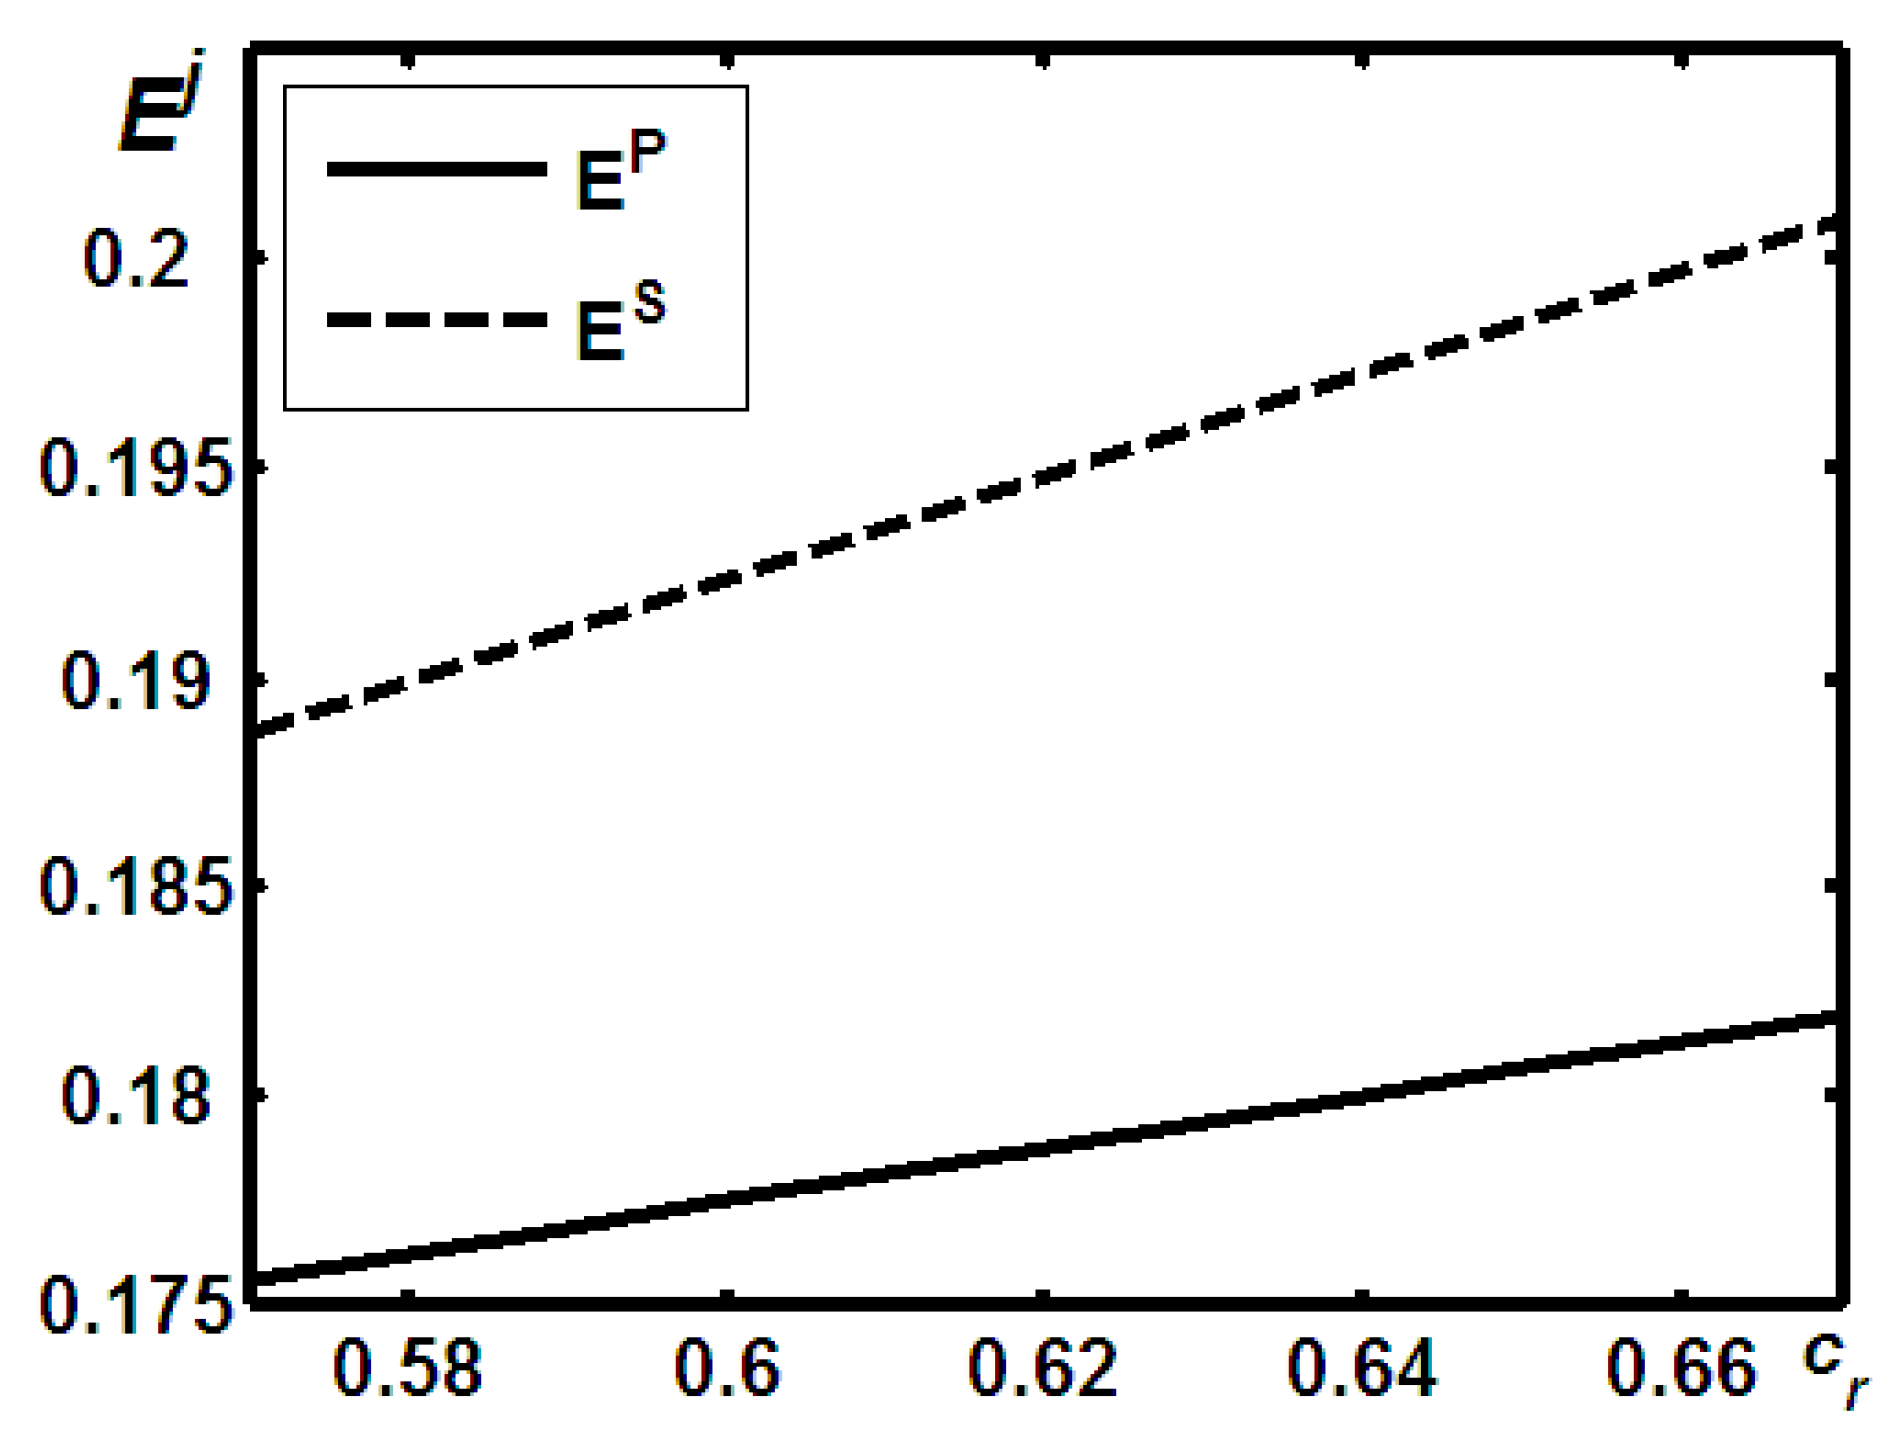
Based on Figure 3, we conclude that, on the one hand, as shown in Proposition 5, the environmental impact of Model S is always higher than that of Model P. In addition, as the cost of increases, both models’ environmental impacts increase due to lower used cores and will be remanufactured, while more new products are produced.
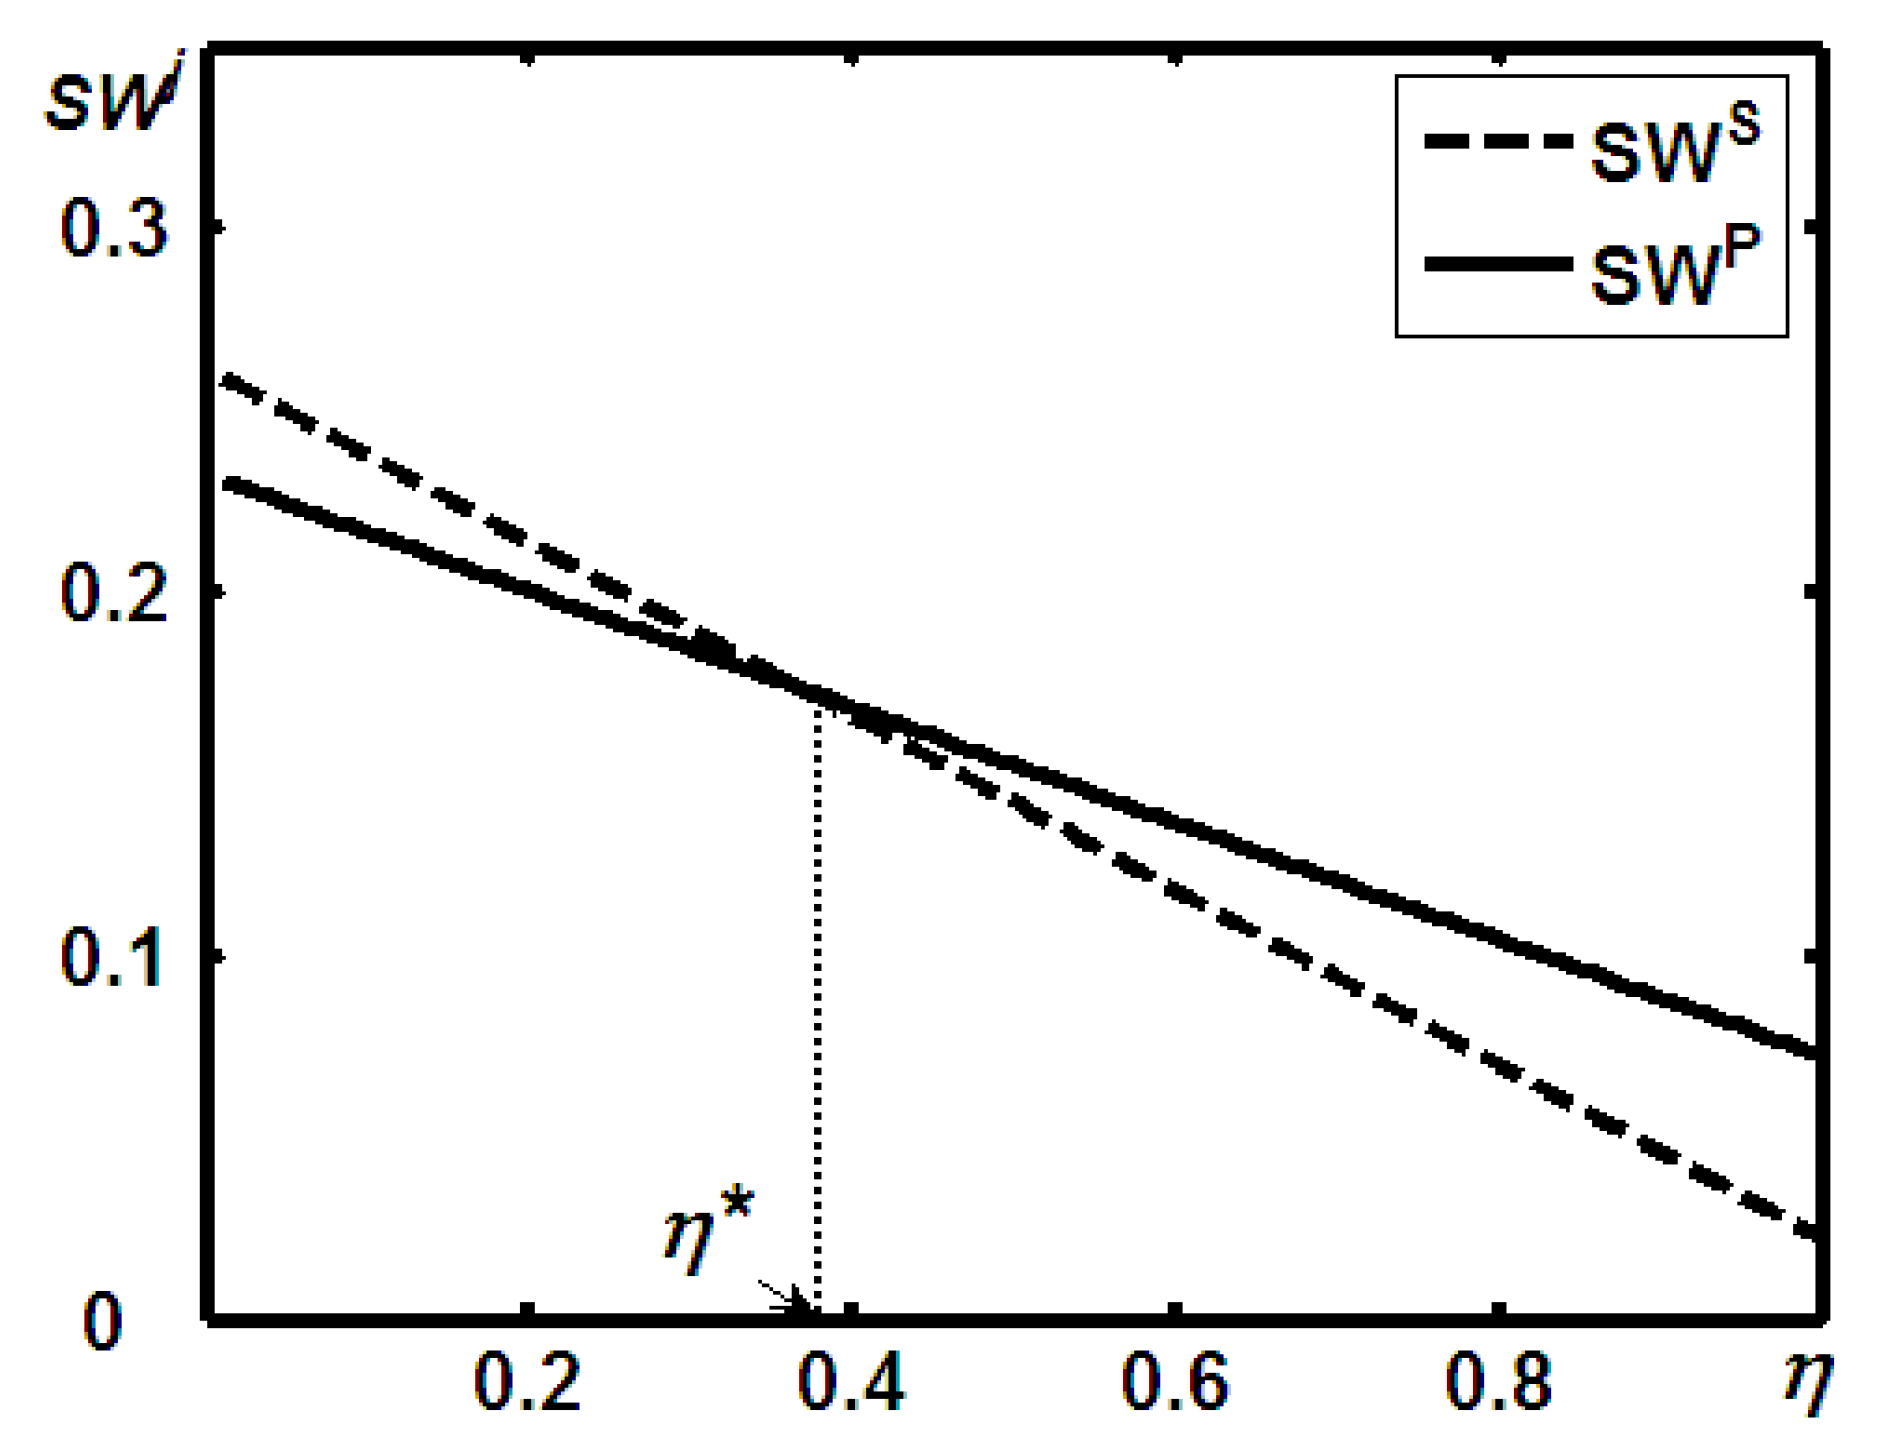
Finally, we pay attention to the difference in social welfare. Based on Figure 4, we can conclude that, when the level of eco-centrism is not too pronounced, i.e., , the benefits from economic profitability is sufficient to compensate the loss of environmental performance. Thus, the social welfare in Model P is lower than that in Model S, i.e., . Conversely, When the level of eco-centrism is not too pronounced, i.e., , the benefits from economic profitability is not sufficient to compensate a more significant welfare loss due to environmental hazard is perceived by the society. As a result, the social welfare in Model P is higher than that in Model S, i.e., .
5. Conclusions
Many manufacturers are usually in a difficult position to incorporate remanufacturing into existing business, as such decisions are accompanied by a cannibalization problem between both products. This problem is particularly acute when the manufacturer distributes remanufactured products in a manufacturer-owned channel, but does not distribute new products in the retail channel. As a result, retailers naturally take various measures to respond to the cannibalization from remanufactured products. For example, to confront the fierce competition from online channels, in the computer and electronics industry, more and more traditional retailers have aggressively attempted to obtain larger market shares by providing higher levels of post-sale services [19]. Even if the most traditional retailers do not yet advertise their service levels, “customer service level” has been recognized by retail executives as one of the most important performance metrics, ahead of traditional key measures such as “sales per selling square foot” [20].
Although numerous researchers have studied various competitive strategies in remanufacturing, to the best of our knowledge, there is little literature highlighting whether and how economic performance and sustainability issues related to remanufacturing operations are affected by the retailer’s service levels. Conversely, although sales efforts have been well studied in the marketing literature, little is known about whether and how the retailer’s service levels affect the equilibrium outcomes of remanufacturing operations. We filled this gap by developing two theoretical models where all remanufactured products were available from the manufactured-owned e-channels, while the equilibrium behavior of the traditional retailer were characterized under two possible scenarios: (1) Confronting the cannibalization from direct-channels, the retailer only responds on prices (i.e., Model P); and/or (2) the retailer competes with the remanufactured products by providing competitive prices and high service levels for new products (i.e., Model S).
Among other results, we found that when compared with Model P, the retailer’s strategy of responding with price and service created greater profitability for both parties. However, from the environmental sustainability perspective, such response was always detrimental to the environment than that of Model P. In addition, we found that under certain conditions, the retailer’s strategy of responding with prices and services may decrease social welfare.
Based on the above results, we provide two important insights for the closed-loop supply chain management. On the one hand, from managers’ perspective, if the manufacturers care more about economic benefits, encouraging the retailer to provide higher levels of post-sale services is a beneficial strategy than that in Model P. Conversely, if they are more concerned with environmental performance and/or consumer welfare, like in Model P, necessary measures should be taken to control retailers’ aggressive promotion service in new products marketing. On the other hand, from an environmental groups and agencies angle, if the level of eco-centrism is too pronounced, though Model S a greater profitability for both parties, a more significant welfare loss due to environmental hazard is perceived by the society. As a result, besides avoiding the indulgence in overproducing new products, environmental groups and agencies should take emissions trading or taxation into consideration when stimulating remanufacturing operations.
This paper can be extended in several directions. First, we assumed that the retailer’s service had a natural effect on consumers’ willingness-to-pay for new products; however, in practice, such services may induce a spillover between differentiated channels and result in free-ride problems [53]. Future researches can address the spillover issues raised between both channels. Second, in both models, we did not pay any attention to the potential possibility of remanufacturing outsourcing, in reality, however, remanufacturing operations may be outsourced to a third-party remanufacturer. Therefore, considering remanufacturing outsourcing between the manufacturer and remanufacturer is a worthy subject for future research. Third, future models can extend our models by addressing information asymmetry, risks with remanufacturing, consumer preferences on distribution channels, etc.
Author Contributions
D.Y. contributed to writing; L.Z. contributed to models development; Y.W. responses for review and editing; S.G. and H.Z. interpret all results’ managerial implications; L.X. collects all motivate examples. All authors read and approved the final manuscript.
Funding
This research was funded by the Humanities and Social Sciences Foundation for Young Scholars of China’s Ministry of Education (13YJC630223); National Natural Science Foundation of China (71872027, 71272130, 71472026, and 71672020), the Fundamental Research Funds for the Central Universities(ZYGX2016J248); China Postdoctoral Science Foundation (2015M58156); the Project of Philosophy and Social Science Research in Colleges and Universities in Jiangsu Province (2015SJB665) and Huaihai Institute of Technology Foundation (S2014007).
Conflicts of Interest
The authors declare no conflict of interest.
Appendix A. Proofs of Statements
- (i)
- To accommodate space constraints, we will only provide a sketch of the proofs for some results. A detailed analysis of these results is available from the authors upon request.
- (ii)
- All parameters and variables in this paper must satisfy non-negativity constraints, that is, we only consider all scenarios under and .
Appendix B. Technical Analysis for Both Models
Appendix B.1. Analysis of Model P
In model P, we first solve the OEM’s profits with first order condition of Equation (2) and yields . Substituting into Equation (3) yields the retailer’s problem is .
Solving the first order condition of the above equation with yields . Plugging and into Equation (2) yields the OEM’s problem is .
Solving the first order condition of the above equation with yields . Substituting into , , and to get the equilibrium outcomes in Table 2.
Appendix B.2. Analysis of Model S
In model S, we first solve the OEM’s profits with first order condition of Equation (5) and yields . Substituting into Equation (6) yields the retailer’s problem is .
Solving the first order condition of the above equation with and yields , . Plugging and into Equation (5) yields the OEM’s problem is .
Solving the first order condition of the above equation with yields . Substituting into , , and to get the equilibrium outcomes in Table 2.
Appendix C. Proofs
Appendix C.1. Proof of Proposition 1
To prove , we have to show that .
This is true for any . That is to say, for any , is always holds. □
Appendix C.2. Proof of Proposition 2
To prove , we have to show that . This is true for any . That is to say, for any , is always holds. □
Appendix C.3. Proof of Proposition 3
To prove , we have to show that . This is true for any . That is to say, for any , is always holds. □
Appendix C.4. Proof of Proposition 4
To prove , we have to show that . This is true for any . That is to say, for any , is always holds.
To prove , we have to show that . This is true for any . That is to say, for any , is always holds. □
Appendix C.5. Proof of Proposition 5
To prove , we have to show that .
Base on Propositions 2–3, we have got , , hence, we can easily obtain that for any , is always holds. □
Appendix C.6. Proof of Proposition 6
Note that, , we can obtain that
From above equation, we can get that if and only of , otherwise, . Where □
References
- Wang, W.B.; Ding, J.F.; Sun, H. Reward-penalty mechanism for a two-period closed-loop supply chain. J. Clean. Prod. 2018, 203, 898–917. [Google Scholar] [CrossRef]
- Waste Electrical & Electronic Equipment (WEEE). Available online: http://ec.europa.eu/environment/waste/weee/index_en.htm (accessed on 1 October 2018).
- Apple. Apple Certified Refurbished. Available online: https://www.apple.com/us-k12/shop/browse/home/specialdeals (accessed on 1 October 2018).
- IBM. Refurbished Equipment and Asset Buyback. Available online: https://www-356.ibm.com/partnerworld/wps/servlet/ContentHandler/igf_com_fin_gars/lc=en_US (accessed on 1 October 2018).
- Cannon. Remanufacturing, Recycling of Used Products. Available online: http://global.canon/en/environment/circulation/recycle.html (accessed on 1 October 2018).
- HP. HPE Renew: Affordable, Remanufactured Products That Are as Good as New. Available online: https://h20195.www2.hpe.com/v2/getpdf.aspx/4AA3-1821EEE.pdf (accessed on 1 October 2018).
- Savaskan, R.C.; Bhattacharya, S.; Wassenhove, L.N.V. Closed-loop supply chain models with product remanufacturing. Manag. Sci. 2004, 50, 239–252. [Google Scholar] [CrossRef]
- Turki, S.; Didukh, S.; Sauvey, C.; Rezg, N. Optimization and analysis of a manufacturing–remanufacturing–transport-warehousing system within a closed-loop supply chain. Sustainability 2017, 9, 561. [Google Scholar] [CrossRef]
- He, X.; Zhang, J. Supplier selection study under the respective of low-carbon supply chain: A hybrid evaluation model based on fa-dea-ahp. Sustainability 2018, 10, 564. [Google Scholar] [CrossRef]
- Turki, S.; Rezg, N. Impact of the quality of returned-used products on the optimal design of a manufacturing/remanufacturing system under carbon emissions constraints. Sustainability 2018, 10, 3197. [Google Scholar] [CrossRef]
- Yan, W.; Xiong, Y.; Xiong, Z.; Guo, N. Bricks vs. Clicks: Which is better for marketing remanufactured products? Eur. J. Oper. Res. 2015, 242, 434–444. [Google Scholar] [CrossRef]
- Modine, A. Dell Sues Tiger for Reselling Old Boxes as New. Available online: https://www.theregister.co.uk/2009/04/23/dell_sues_tigerdirect/ (accessed on 1 October 2018).
- Lin, J. Former employees expose the scandal about gao hongheng chang technology co. Sells HP’s remanufactured pcs as new (in Chinese). Southern Metropolis Daily, 30 July 2010; 1–2. [Google Scholar]
- Wang, Z.B.; Wang, Y.Y.; Wang, J.C. Optimal distribution channel strategy for new and remanufactured products. Electron. Commer. Res. 2016, 16, 269–295. [Google Scholar] [CrossRef]
- Dell. Dell 1U Servers. Available online: http://www.deepdiscountservers.com/servers/dell/1u.html (accessed on 1 October 2018).
- Canon. Canon See Impossible. Available online: https://shop.usa.canon.com/shop/en/catalog/ef-70-300mm-f-4-56-is-usm-refurbished (accessed on 1 October 2018).
- Atasu, A.; Sarvary, M.; Wassenhove, L.N.V. Remanufacturing as a marketing strategy. Manag. Sci. 2008, 54, 1731–1746. [Google Scholar] [CrossRef]
- He, B.; Gan, X.; Yuan, K. Entry of online presale of fresh produce: A competitive analysis. Eur. J. Oper. Res. 2018. [Google Scholar] [CrossRef]
- Xiao, T.; Yang, D. Price and service competition of supply chains with risk-averse retailers under demand uncertainty. Int. J. Prod. Econ. 2008, 114, 187–200. [Google Scholar] [CrossRef]
- Bernstein, F.; Federgruen, A. A general equilibrium model for industries with price and service competition. Oper. Res. 2004, 52, 868–886. [Google Scholar] [CrossRef]
- Rubel, O.; Prasad, A. Dynamic incentives in sales force compensation. Mark. Sci. 2016, 35, 676–689. [Google Scholar] [CrossRef]
- Li, H.; Wang, C.; Shang, M.; Ou, W. Pricing, carbon emission reduction, low-carbon promotion and returning decision in a closed-loop supply chain under vertical and horizontal cooperation. Int. J. Environ. Res. Public Health 2017, 14, 1332. [Google Scholar] [CrossRef] [PubMed]
- Govindan, K.; Soleimani, H.; Kannan, D. Reverse logistics and closed-loop supply chain: A comprehensive review to explore the future. Eur. J. Oper. Res. 2015, 240, 603–626. [Google Scholar] [CrossRef] [Green Version]
- Martin-Herran, G.; Sigue, S.P. An integrative framework of cooperative advertising: Should manufacturers continuously support retailer advertising? J. Bus. Res. 2017, 70, 67–73. [Google Scholar] [CrossRef] [Green Version]
- Wang, C.X.; Qian, Z.; Zhao, Y. Impact of manufacturer and retailer’s market pricing power on customer satisfaction incentives in supply chains. Int. J. Prod. Econ. 2018, 205, 98–112. [Google Scholar] [CrossRef]
- Lou, W.D.; Ma, J.H. Complexity of sales effort and carbon emission reduction effort in a two-parallel household appliance supply chain model. Appl. Math. Model. 2018, 64, 398–425. [Google Scholar] [CrossRef]
- Karray, S.; Martin-Herran, G.; Sigue, S.-P. Cooperative advertising for competing manufacturers: The impact of long-term promotional effects. Int. J. Prod. Econ. 2017, 184, 21–32. [Google Scholar] [CrossRef] [Green Version]
- De Giovanni, P.; Zaccour, G. A two-period game of a closed-loop supply chain. Eur. J. Oper. Res. 2014, 232, 22–40. [Google Scholar] [CrossRef]
- Gao, J.H.; Han, H.S.; Hou, L.T.; Wang, H.Y. Pricing and effort decisions in a closed-loop supply chain under different channel power structures. J. Clean. Prod. 2016, 112, 2043–2057. [Google Scholar] [CrossRef]
- Das, D.; Dutta, P. Design and analysis of a closed-loop supply chain in presence of promotional offer. Int. J. Prod. Res. 2015, 53, 141–165. [Google Scholar] [CrossRef]
- Jena, S.K.; Sarmah, S.P. Price and service co-opetiton under uncertain demand and condition of used items in a remanufacturing system. Int. J. Prod. Econ. 2016, 173, 1–21. [Google Scholar] [CrossRef]
- Hashiguchi, M.S. Recycling efforts and patent rights protection in the united states and Japan. Eur. Heart J. 2003, 24, 396. [Google Scholar]
- Bhaskaran, S.R.; Gilbert, S.M. Implications of channel structure for leasing or selling durable goods. Mark. Sci. 2009, 28, 918–934. [Google Scholar] [CrossRef]
- Daniel Guide, V., Jr.; Li, J. The potential for cannibalization of new products sales by remanufactured products. Decis. Sci. 2010, 41, 547–572. [Google Scholar] [CrossRef]
- Yan, W.; Li, H.; Chai, J.; Qian, Z.; Chen, H. Owning or outsourcing? Strategic choice on take-back operations for third-party remanufacturing. Sustainability 2018, 10, 151. [Google Scholar] [CrossRef]
- Xiong, Y.; Zhou, Y.; Li, G.; Chan, H.-K.; Xiong, Z. Don’t forget your supplier when remanufacturing. Eur. J. Oper. Res. 2013, 230, 15–25. [Google Scholar] [CrossRef]
- Zou, Z.B.; Wang, J.J.; Deng, G.S.; Chen, H. Third-party remanufacturing mode selection: Outsourcing or authorization? Transp. Res. Part E Logist. Transp. Rev. 2016, 87, 1–19. [Google Scholar] [CrossRef]
- Liu, Y.; Cheng, Y.; Chen, H.; Guo, S.; Lu, Y. Selling remanufactured products under one roof or two? A sustainability analysis on channel structures for new and remanufactured products. Sustainability 2018, 10, 2427. [Google Scholar] [CrossRef]
- Karray, S.; Zaccour, G. Effectiveness of coop advertising programs in competitive distribution channels. Int. Game Theory Rev. 2007, 9, 151–167. [Google Scholar] [CrossRef]
- Karray, S. Periodicity of pricing and marketing efforts in a distribution channel. Eur. J. Oper. Res. 2013, 228, 635–647. [Google Scholar] [CrossRef]
- Desai, P.S. Multiple messages to retain retailers: Signaling new product demand. Mark. Sci. 2000, 19, 381–389. [Google Scholar] [CrossRef]
- Arya, A.; Mittendorf, B.; Sappington, D.E.M. The bright side of supplier encroachment. Mark. Sci. 2007, 26, 651–659. [Google Scholar] [CrossRef]
- Xiong, Y.; Yan, W.; Fernandes, K.; Xiong, Z.-K.; Guo, N. “Bricks vs. Clicks”: The impact of manufacturer encroachment with a dealer leasing and selling of durable goods. Eur. J. Oper. Res. 2012, 217, 75–83. [Google Scholar] [CrossRef]
- Xu, X.; Xu, X.; He, P. Joint production and pricing decisions for multiple products with cap-and-trade and carbon tax regulations. J. Clean. Prod. 2016, 112, 4093–4106. [Google Scholar] [CrossRef]
- Agrawal, V.V.; Ferguson, M.; Toktay, L.B.; Thomas, V.M. Is leasing greener than selling? Manag. Sci. 2012, 58, 523–533. [Google Scholar] [CrossRef]
- Levi, M.D.; Nault, B.R. Converting technology to mitigate environmental damage. Manag. Sci. 2004, 50, 1015–1030. [Google Scholar] [CrossRef]
- Yenipazarli, A. Managing new and remanufactured products to mitigate environmental damage under emissions regulation. Eur. J. Oper. Res. 2016, 249, 117–130. [Google Scholar] [CrossRef]
- Cachon, G.P. Retail store density and the cost of greenhouse gas emissions. Manag. Sci. 2014, 60, 1907–1925. [Google Scholar] [CrossRef]
- Subramanian, R.; Subramanyam, R. Key factors in the market for remanufactured products. Manuf. Serv. Oper. Manag. 2012, 14, 315–326. [Google Scholar] [CrossRef]
- Esenduran, G.; Kemahlu-Ziya, E.; Swaminathan, J.M. Take-back legislation: Consequences for remanufacturing and environment. Decis. Sci. 2016, 47, 219–256. [Google Scholar] [CrossRef]
- Esenduran, G.; Kemahlıoglu-Ziya, E.; Swaminathan, J.M. Impact of take-back regulation on the remanufacturing industry. Prod. Oper. Manag. 2017, 26, 924–944. [Google Scholar] [CrossRef]
- Esenduran, G.; Kemahlıoglu-Ziya, E.; Swaminathan, J.M. Increased Remanufacturing through Take-Back Legislation and Competition; Working Paper; The Ohio State University, Fisher College of Business: Columbus, OH, USA, 2012. [Google Scholar]
- Xing, D.; Liu, T. Sales effort free riding and coordination with price match and channel rebate. Eur. J. Oper. Res. 2012, 219, 264–271. [Google Scholar] [CrossRef]
Figure 1.
The effects of on equilibrium decisions. (a) The effects of on ; (b) The effects of on ; (c) The effects of on .
Figure 1.
The effects of on equilibrium decisions. (a) The effects of on ; (b) The effects of on ; (c) The effects of on .

Figure 2.
The effects of on economic outcomes. (a) The effects of on ; (b) The effects of on .

Figure 3.
The effects of on .

Figure 4.
The effects of on .


Table 1.
Notations in both models.
| Notation | Definition |
|---|---|
| The consumer value discount for remanufactured products | |
| The level of service available from the retail channel | |
| The unit cost for distributing product , where subscript refers to the new and remanufactured product, respectively. | |
| The unit cost for marking a new and remanufactured product, respectively. | |
| The quantity of product i under Model j, where superscript refers to Model P and Model S, respectively. | |
| The wholesale price of new product in Model j. | |
| The player k’s profit under Model j, where refer to the manufacturer and retailer, respectively. | |
| The environmental impacts in Model j. |
Table 2.
Optimal decisions and profits of both models.
| Retailer Only Responses with Prices (Model P) |
| Retailer Responses with Prices and Service (Model S) |
© 2018 by the authors. Licensee MDPI, Basel, Switzerland. This article is an open access article distributed under the terms and conditions of the Creative Commons Attribution (CC BY) license (http://creativecommons.org/licenses/by/4.0/).
Share and Cite
MDPI and ACS Style
Yang, D.; Zhang, L.; Wu, Y.; Guo, S.; Zhang, H.; Xiao, L. A Sustainability Analysis on Retailer’s Sales Effort in A Closed-Loop Supply Chain. Sustainability 2019, 11, 8. https://0-doi-org.brum.beds.ac.uk/10.3390/su11010008
AMA Style
Yang D, Zhang L, Wu Y, Guo S, Zhang H, Xiao L. A Sustainability Analysis on Retailer’s Sales Effort in A Closed-Loop Supply Chain. Sustainability. 2019; 11(1):8. https://0-doi-org.brum.beds.ac.uk/10.3390/su11010008
Chicago/Turabian StyleYang, Dexiang, Lei Zhang, Ying Wu, Sidai Guo, Hua Zhang, and Lijian Xiao. 2019. "A Sustainability Analysis on Retailer’s Sales Effort in A Closed-Loop Supply Chain" Sustainability 11, no. 1: 8. https://0-doi-org.brum.beds.ac.uk/10.3390/su11010008
Note that from the first issue of 2016, this journal uses article numbers instead of page numbers. See further details here.